Article

Electrical Characterization and Micro X-ray Computed Tomography Analysis of Next-Generation Silicon Alloy Lithium-Ion Cells

1
MOBI Research Group, core-lab Flanders Make, Department of Electric Engineering and Energy Technology (ETEC), Vrije Universiteit Brussel, Pleinlaan 2, 1050 Brussels, Belgium
2
European Commission, Joint Research Centre (JRC), Directorate for Energy, Transport and Climate, Energy Storage Unit, PO Box 2, 1755 ZG Petten, The Netherlands
3
ZSW, Zentrum für Sonnenenergie- und Wasserstoff-Forschung BW, Helmholtzstraße 8, 89081 Ulm, Germany
*
Author to whom correspondence should be addressed.
World Electr. Veh. J. 2018, 9(3), 43; https://doi.org/10.3390/wevj9030043
Submission received: 30 August 2018 / Revised: 9 October 2018 / Accepted: 17 October 2018 / Published: 19 October 2018

Abstract

:
This study analyzed a prototype of a pouch cell containing silicon alloy anodes with the potential to significantly increase the energy density, resulting in improved autonomy for electric vehicles. An electrical characterization campaign was performed, resulting in three main observations. Firstly, measurements showed a high energy density, although a high lower cutoff voltage (3.0 V) was used due to the prototypical nature of the cells. Further optimization would allow a decrease of the lower cutoff voltage, resulting in an even higher energy density. Secondly, a large open-circuit voltage hysteresis was observed, increasing the complexity for equivalent circuit models. Thirdly, ballooning of the pouch cell was observed, most likely caused by gas formation. This leads to a loss of active surface area, significantly reducing the cell’s capacity. This third observation was more thoroughly investigated by 3D computed tomography, which showed mechanical deformation of the layers. An extensive literature review revealed that the addition of fluoroethylene carbonate (FEC) to the electrolyte enhances the cycling stability of silicon alloy batteries but leads to the production of CO 2 as a side reaction. Furthermore, the usage of external pressure was proposed and validated as a methodology to reduce the production of CO 2 while improving the cells’ performance.

1. Introduction

To minimize the negative effects of climate change, the world strives to reduce the emission of greenhouse gases significantly, as demonstrated by recent global efforts such as the climate agreement at COP21 [1]. Furthermore, direct legislation is forcing the automotive industry to reduce its harmful tailpipe emissions. Therefore, the automotive industry is evolving towards full or hybrid electric vehicles [2,3].
The main drawback of electric vehicles is the energy storage system because of its relatively high cost and low driving range compared to gasoline and diesel vehicles [4]. However, increasing consumer acceptance has been creating a strong push for electric vehicles [5]. Additionally, many research efforts have been ongoing to further improve their overall performance (power, energy, lifetime, etc.) while aiming to also reduce their cost.
One possible method for increasing the batteries’ energy density is the use of electrode materials which have higher specific gravimetric capacities than current state-of-the-art materials. Another approach is to increase the operating voltage limits. The most used negative electrode material is graphite, due to its low cost, good electrochemical performance, and its abundance [6,7,8]. Although its gravimetric capacity (372 mAh/g [9] is quite low compared to other materials, such as silicon (4.2 Ah/g) [10], sulfur (2.6 Ah/g [11], and Li metal (3.8 Ah/g) [12], this mature electrode material is reaching its limits regarding energy density [13], in contrast to the other mentioned candidate materials. Silicon anodes have a vast potential to increase the energy density in battery applications. However, silicon is currently not used in high weight fractions in anodes. Therefore, a study regarding the performance of batteries with a high weight fraction of silicon is proposed in this research.
This paper focuses on using a prototype of a noncommercial, silicon alloy-based anode developed by 3M to increase the batteries’ energy density. The major advantages of using silicon in the electrode are a high gravimetric capacity, good electrochemical stability, its abundant availability, and its low discharge potential (0.2 V vs. Li/Li+) [14]. The factors limiting its usage in battery systems are its large volume change during operation, up to 400%, as well as the formation of an unstable solid electrolyte interface [7,10,15]. This can lead to insufficient cycling stability, a critical aspect for the commercial usage of batteries. To overcome these challenges, 3M has developed a prototype of a silicon alloy active material that limits swelling and increases cyclability. Additionally, this material is blended with graphite to further reduce these negative effects.
As a positive electrode, lithium nickel manganese cobalt oxide (NMC) is often used. Currently, much research is ongoing to use high-nickel NMC cells to further boost the energy content. In this research, carried out in the scope of the FiveVB project [16], a battery consisting of an optimized NMC 5:3:2 cathode developed by Umicore was investigated. This prototypical positive electrode was optimized by using dedicated binders developed by Arkema in order to increase the upper voltage limit from 4.2 V to 4.35 V, increasing the available energy. Both electrodes were combined by using a dedicated electrolyte developed by Arkema.
The combination of both innovative and high energy density electrodes leads to unique battery cells that are beyond the state-of-the-art. In the literature, most research has studied the silicon-based anode in half-cells or in coin cells. There is thus a clear need to study the behavior of silicon-based batteries in pouch cells. The goal of the research described in this paper is to study these pouch cells by performing an extensive testing campaign. An electrochemical study was performed to assess the static and dynamic performance of these cells. After these tests, a clear bulging of the cells combined with a significantly decreased capacity was observed. Since these tests normally have a negligible impact on a battery cell, an extensive root cause analysis was also performed in this study. The root cause analysis included micro X-ray computed tomography imaging combined with a comprehensive literature review. Additionally, the application of external pressure to reduce the bulging due to gassing was proposed and investigated.

2. Experimental

2.1. Investigated Cells

Table 1 shows the composition, loading, and density for the anode and cathode that were used to manufacture the soft pouch cells. A detailed description of the electrodes’ manufacturing processes can be found elsewhere [17]. Briefly, the aqueous anode slurry was composed of Si alloy (3M, Neuss, Germany) and graphite (SMG-A3, Hitachi, Tokyo, Japan) as the active materials, Super PLi (Imerys Graphite & Carbon, Bodio, Switzerland) as the conductive additive, and polyacrylic acid (MW 250k, Aldrich, Germany) as the binder. The slurry was coated onto a Cu current collector foil (Schlenk, 10 μ m thick) using an electrode coating pilot line (LACOM GmbH, Lauchheim, Germany) with a comma bar system and four different drying zones which totaled 8 m in length. The coating speed was set to 1.5 m min - 1 . The coater allows coating one side at a time. Therefore, in order to obtain double-side-coated electrodes, once the roll was entirely coated on the first side, it was reversed and coated on the second side. After coating, the electrodes were calendared in order to increase their density. The positive electrode contained LiNi 0 . 5 Mn 0 . 3 Co 0 . 2 O 2 (Umicore, Brussels, Belgium) as the active material and PVDF (Arkema, Colombes, France) as the binder. The electrodes were manufactured using the same pilot line as for the anode. Also, the cathode tape was double-side coated. Since silicon-based electrodes demonstrate high first-cycle irreversible capacity losses, a large excess of cathode was used. An anode to cathode capacity ratio of 1.28 (N/P) was selected [17].
Stacked pouch cells were assembled using a semi-automated stacking and winding machine. The electrodes measured approximately 24 cm 2 (6.3 × 3.8 cm). Each cell stack comprised 10 double-side-coated anodes, 9 double-side-coated cathodes, and 2 single-side-coated cathodes as the two most external electrodes.
In all cases, the electrolyte was a solution of 0.95 M LiPF 6 + 0.05 M Arkema co-salt in EC:EMC 3:7 + 10 wt.% FEC. After electrolyte-filling, the pouch cells underwent formation. The formation protocol consisted of two full cycles (charge: CC-CV 0.1C–0.025C; discharge: CC 0.1C) within the potential window 3.00–4.35 V. During the formation, the cells were clamped in order to apply pressure. After formation, the pouch cells were degassed and sealed again.

2.2. Electrical Testing

The electrical characterization was performed by using a dedicated battery tester—SBT0550, from the Belgian Project Engineering and Contracting (PEC) company—which measures the voltage with an accuracy of 0.03% full scale deviation [18]. The pouch cells were placed in a climate chamber from CTS Benelux at 25 C, with an accuracy of 0.3 C, during the electrical testing to ensure reproducibility and to avoid any varying temperature during the cell characterization. The electrical characterization tests were performed after the formation cycles, as described in Section 2.1, to investigate the overall cell performance behavior, such as capacity retention, charge-discharge efficiency, and to evaluate the cell’s dynamic behavior by means of internal resistances. To achieve this, several tests were performed sequentially: a preconditioning test, an open-circuit voltage test (OCV), a quasi-open-circuit voltage test (Q-OCV), a capacity test, and a hybrid pulse power characterization test (HPPC). These tests were performed according to the standards ISO 12405 [19] and IEC 62660-1 [20]. The standard charging consists of a constant current charging at C/3 (408 mA), followed by a constant voltage phase that lasts until the current is below 0.01C. The post-processing, including visualization, was performed using the software Matlab®.

2.3. Micro X-ray Computed Tomography

A Nanotom S X-ray computed tomography system (GE Sensing & Inspection Technologies, Phoenix X-ray, Wunstorf, Germany) was used for the investigation of the pouch cells. The system is equipped with an X-ray tube with a maximum output power of 15 W and a maximum voltage of 180 kV, in combination with a 2D detector with a dynamic range of 850:1 which consists of 2300 × 2300 pixels. An X-ray energy of 120 kV was selected. A voxel size of 31 μ m was used for imaging the complete cell (hereafter referred to as ‘low resolution’) and a voxel size of 8.5 μ m for ‘high-resolution’ imaging. For each dataset, 2700 projections were imaged for low resolution and 4000 for high resolution using the full pixel resolution of the detector. For high-resolution purposes, the size of the detector was virtually enlarged by a factor of 3 by moving the detector horizontally (for each projection, three images were subsequently stitched together automatically). Dedicated software—VG Studio MAX (Volume Graphics, Heidelberg, Germany)—was applied for data visualization and analysis. In the presented CT gray-value cross-sections, brighter corresponds to higher X-ray absorption (e.g., a copper foil with its higher density appears the brightest, compared to other materials).

3. Results and Discussion

3.1. Electrical Characterization

3.1.1. Preconditioning

The purpose of this test was to confirm the cell’s electrochemical stability by comparing the discharge capacity of two consecutive cycles. As described in ISO 12405-2 [19], a battery pack or system is correctly preconditioned if the discharge capacity of two consecutive cycles varies less than 3%. The same threshold level was used in this study for the tested battery cells. Figure 1 is a visualization of the voltage, current, and discharge capacity throughout the preconditioning test. Its charging phase consists of a constant current (C/10) step followed by a constant voltage step (until the current decreases to C/100). For constant current discharge a C-rate of C/10 was used. The difference in discharge capacity is 1.3% between the two consecutive cycles, which is lower than the threshold (3%). This decrease in capacity is significant compared to other commercial cells, which suggests that the solid electrolyte interface (SEI) was not completely formed during the formation cycles. Another possibility is that the cell is rapidly aging due to undesired side reactions. Throughout the remaining characterization testing campaign, this aspect was carefully monitored. Furthermore, the cells have a high energy density of 184 Wh/kg compared to current state-of-the-art NMC 5:3:2/graphite cells (169 Wh/kg) using similar manufacturing methods. Additionally, a high lower cutoff voltage of 3.0 V was chosen to increase the testing safety due to the prototypical nature of the cell. Initial measurements show that lowering it to 2.7 V can further increase the energy density to be up to 205 Wh/kg. Considering significant optimization regarding cell packaging, an even higher energy density may potentially be achieved, making this technology very suitable for usage in electric vehicles.

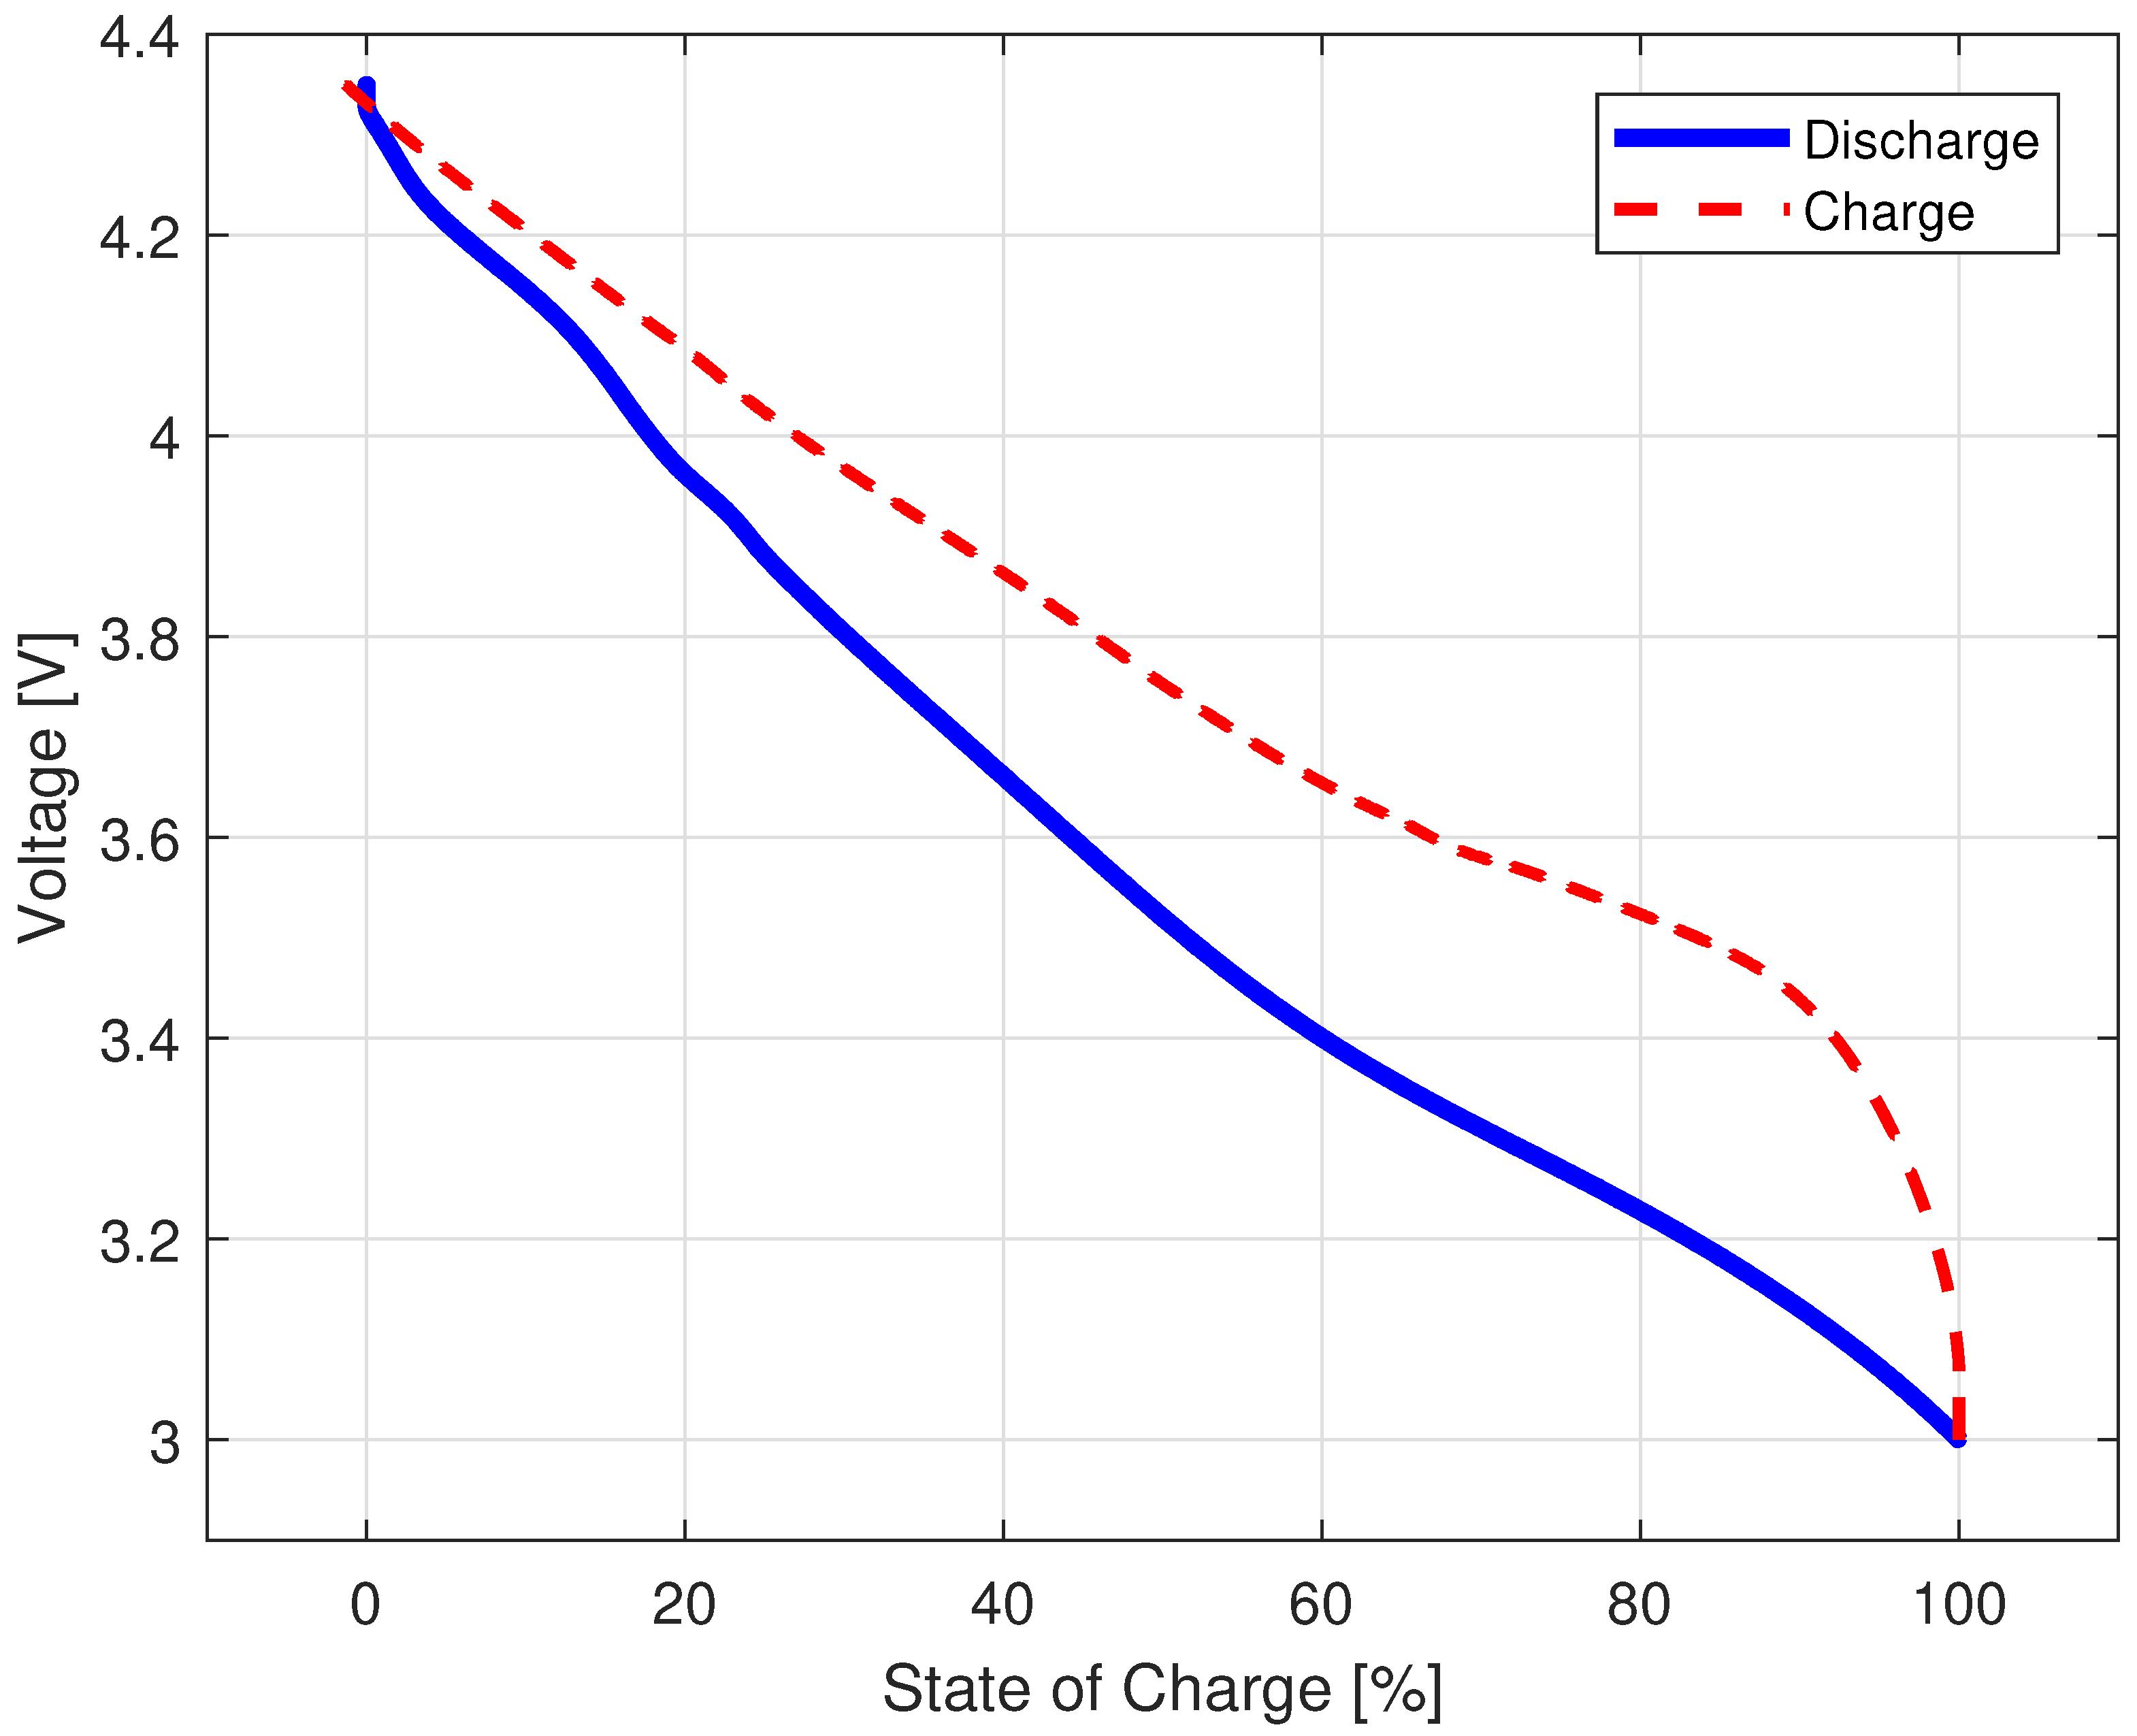
3.1.2. Quasi-Open-Circuit Voltage

The quasi-open-circuit voltage test was used as a time-efficient method to approximate the open-circuit voltage (OCV) over the state of charge (SOC). It consists of a standard charging cycle followed by a discharge and charge step, both with a constant current of C/25. The approximated OCV versus SOC, shown in Figure 2, has an overall coulombic efficiency of 98.73%. There is a significant hysteresis in the voltage behavior during charging and discharging, up to 0.2 V, which is larger than in most commercially used lithium-ion batteries. This voltage hysteresis is mainly due to the inherent properties of the silicon alloy anode. The voltage hysteresis of various other types of lithium-ion batteries is typically smaller: for example, for lithium nickel manganese cobalt oxide (NMC) versus graphite, NMC versus lithium titanium oxide, and lithium manganese oxide versus graphite, it is less than 0.05 V [21,22,23]. The large hysteresis for silicon alloy batteries increases the complexity of developing highly accurate SoC predictive algorithms or equivalent circuit models.

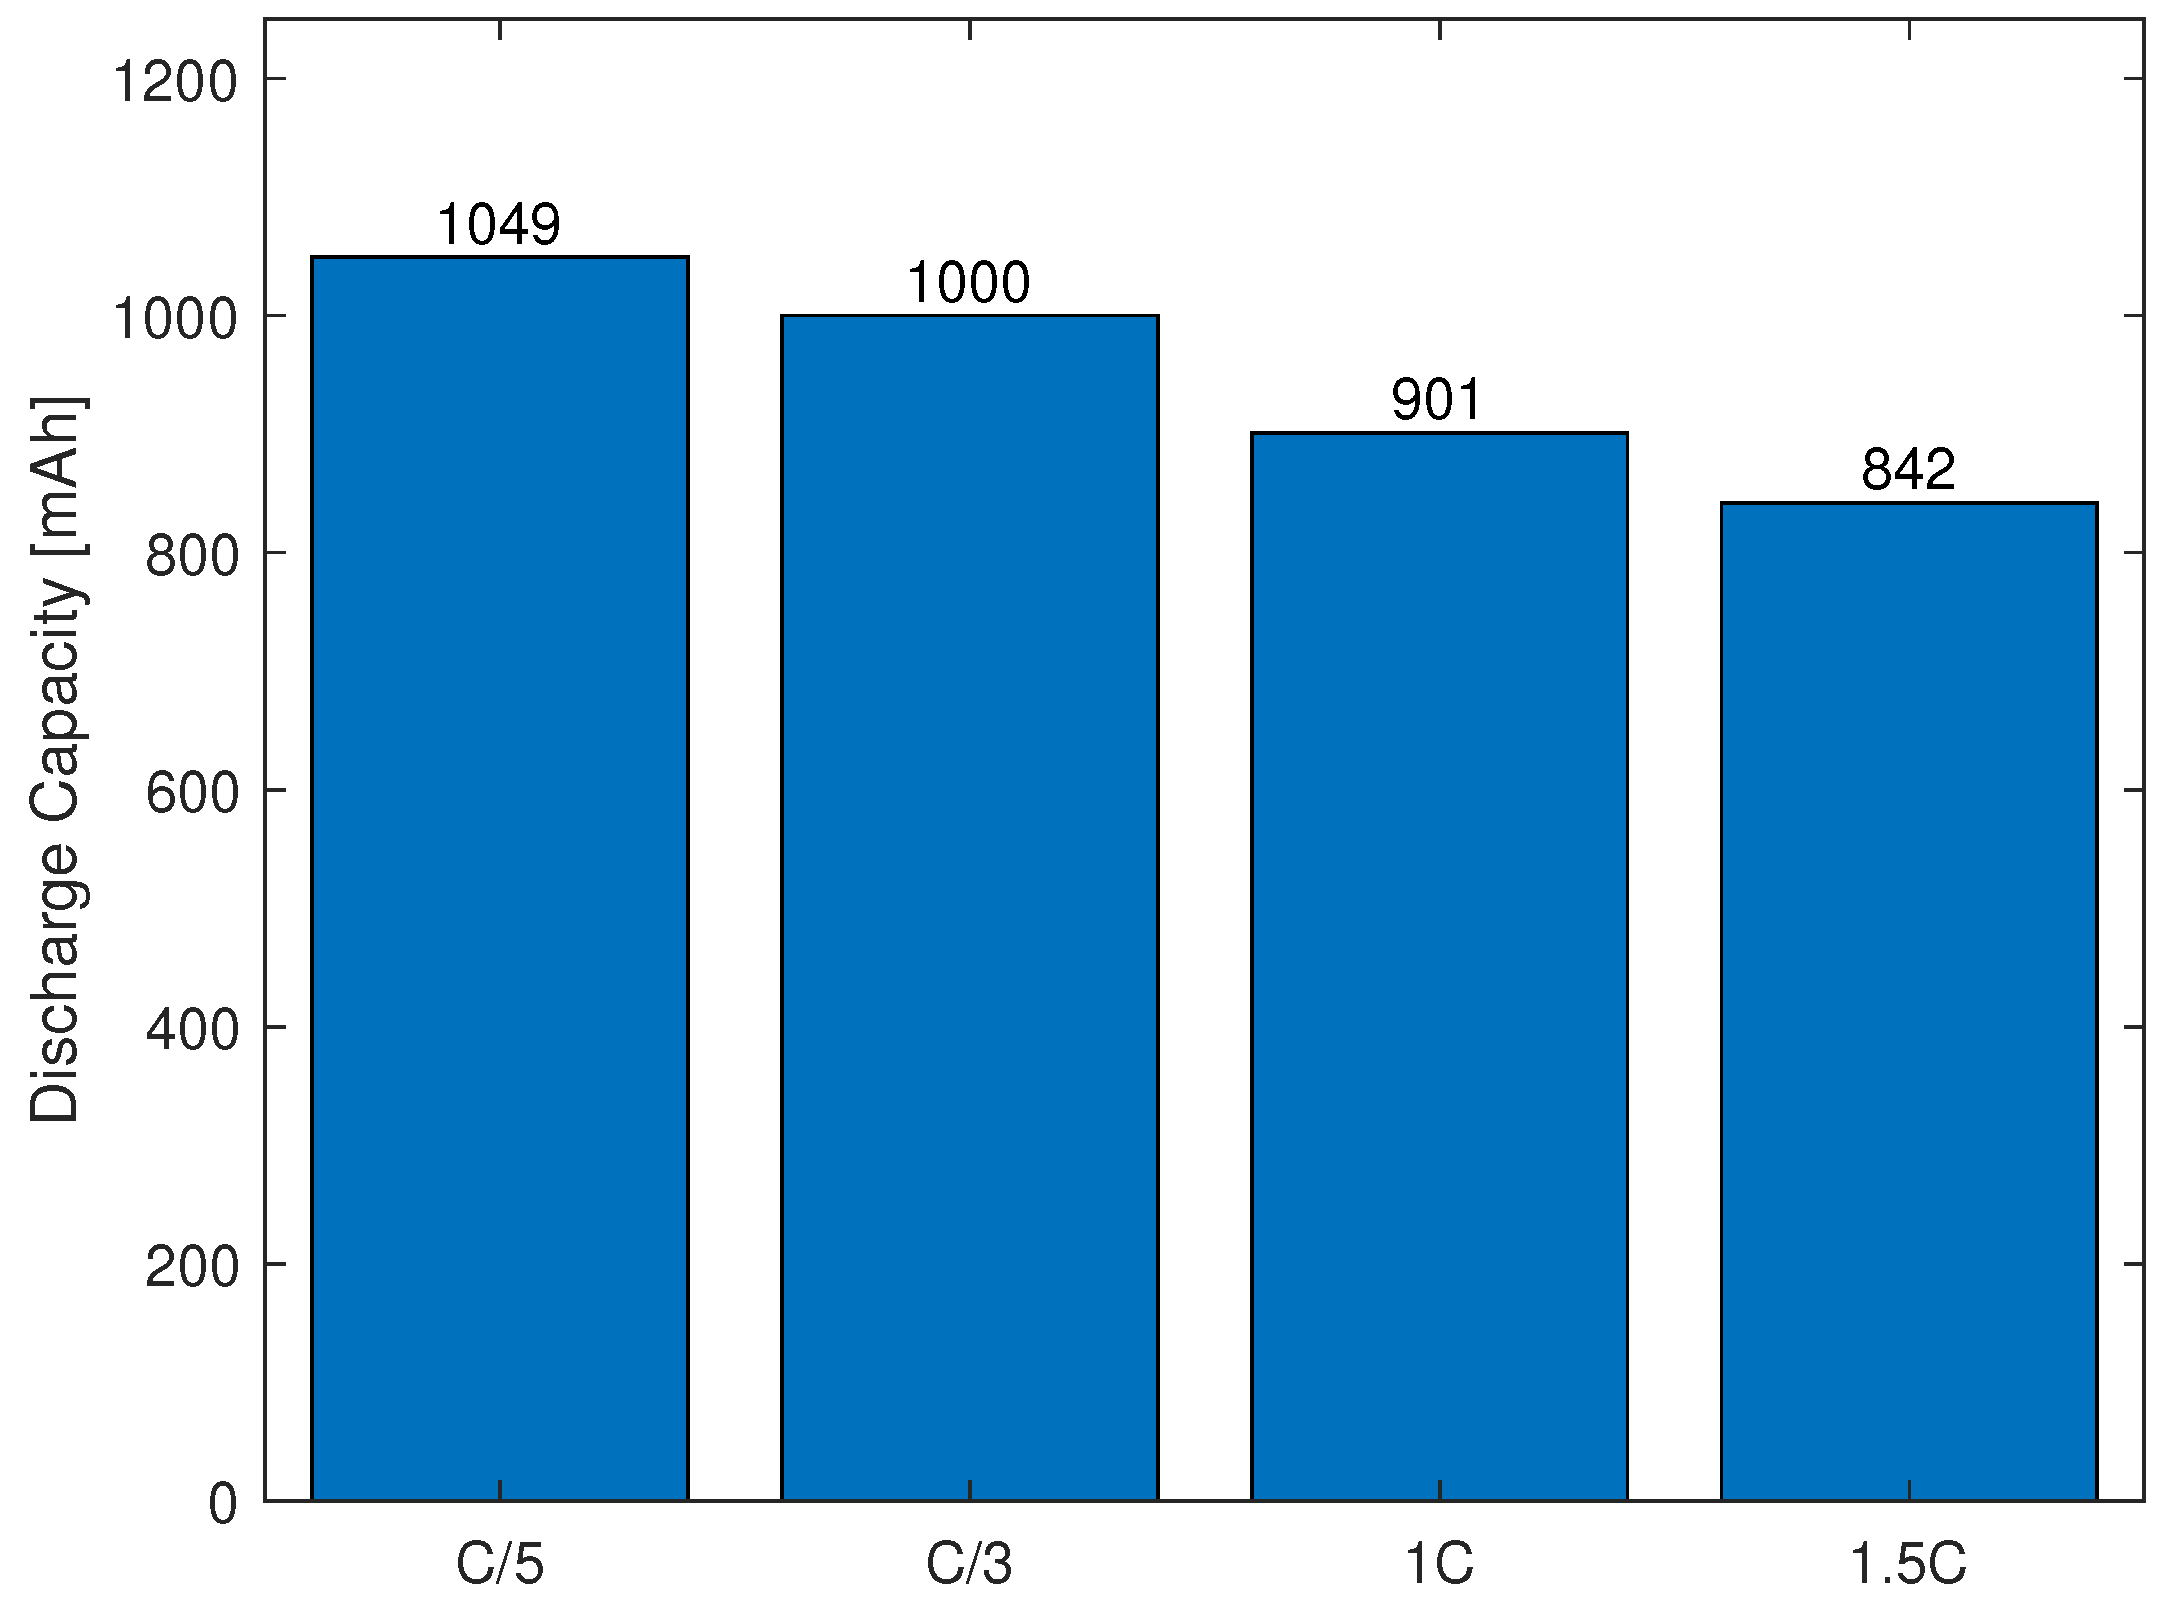
3.1.3. Capacity Test

The discharge capacity at various C-rates was measured by using standard charge cycles followed by constant current discharge at different C-rates (C/5, C/3, 1C, and 1.5C), as shown in Figure 3. Low C-rates were selected since this concerns a newly developed prototype of a cell for battery electric vehicles, which rarely use higher C-rates. When comparing these with the discharge capacity from the preconditioning cycles, a 12% difference was observed between the C/10 and C/5 cycling. As indicated in Section 3.1.1, a degradation of the cell is confirmed. After a visual inspection of the cell, a slight ballooning of the pouch was observed. The ballooning can be assumed to be gas formation, which could result in a smaller available surface area of the active particles, explaining the observed capacity decrease. This is discussed more thoroughly in Section 3.2, Section 3.3 and Section 3.4.

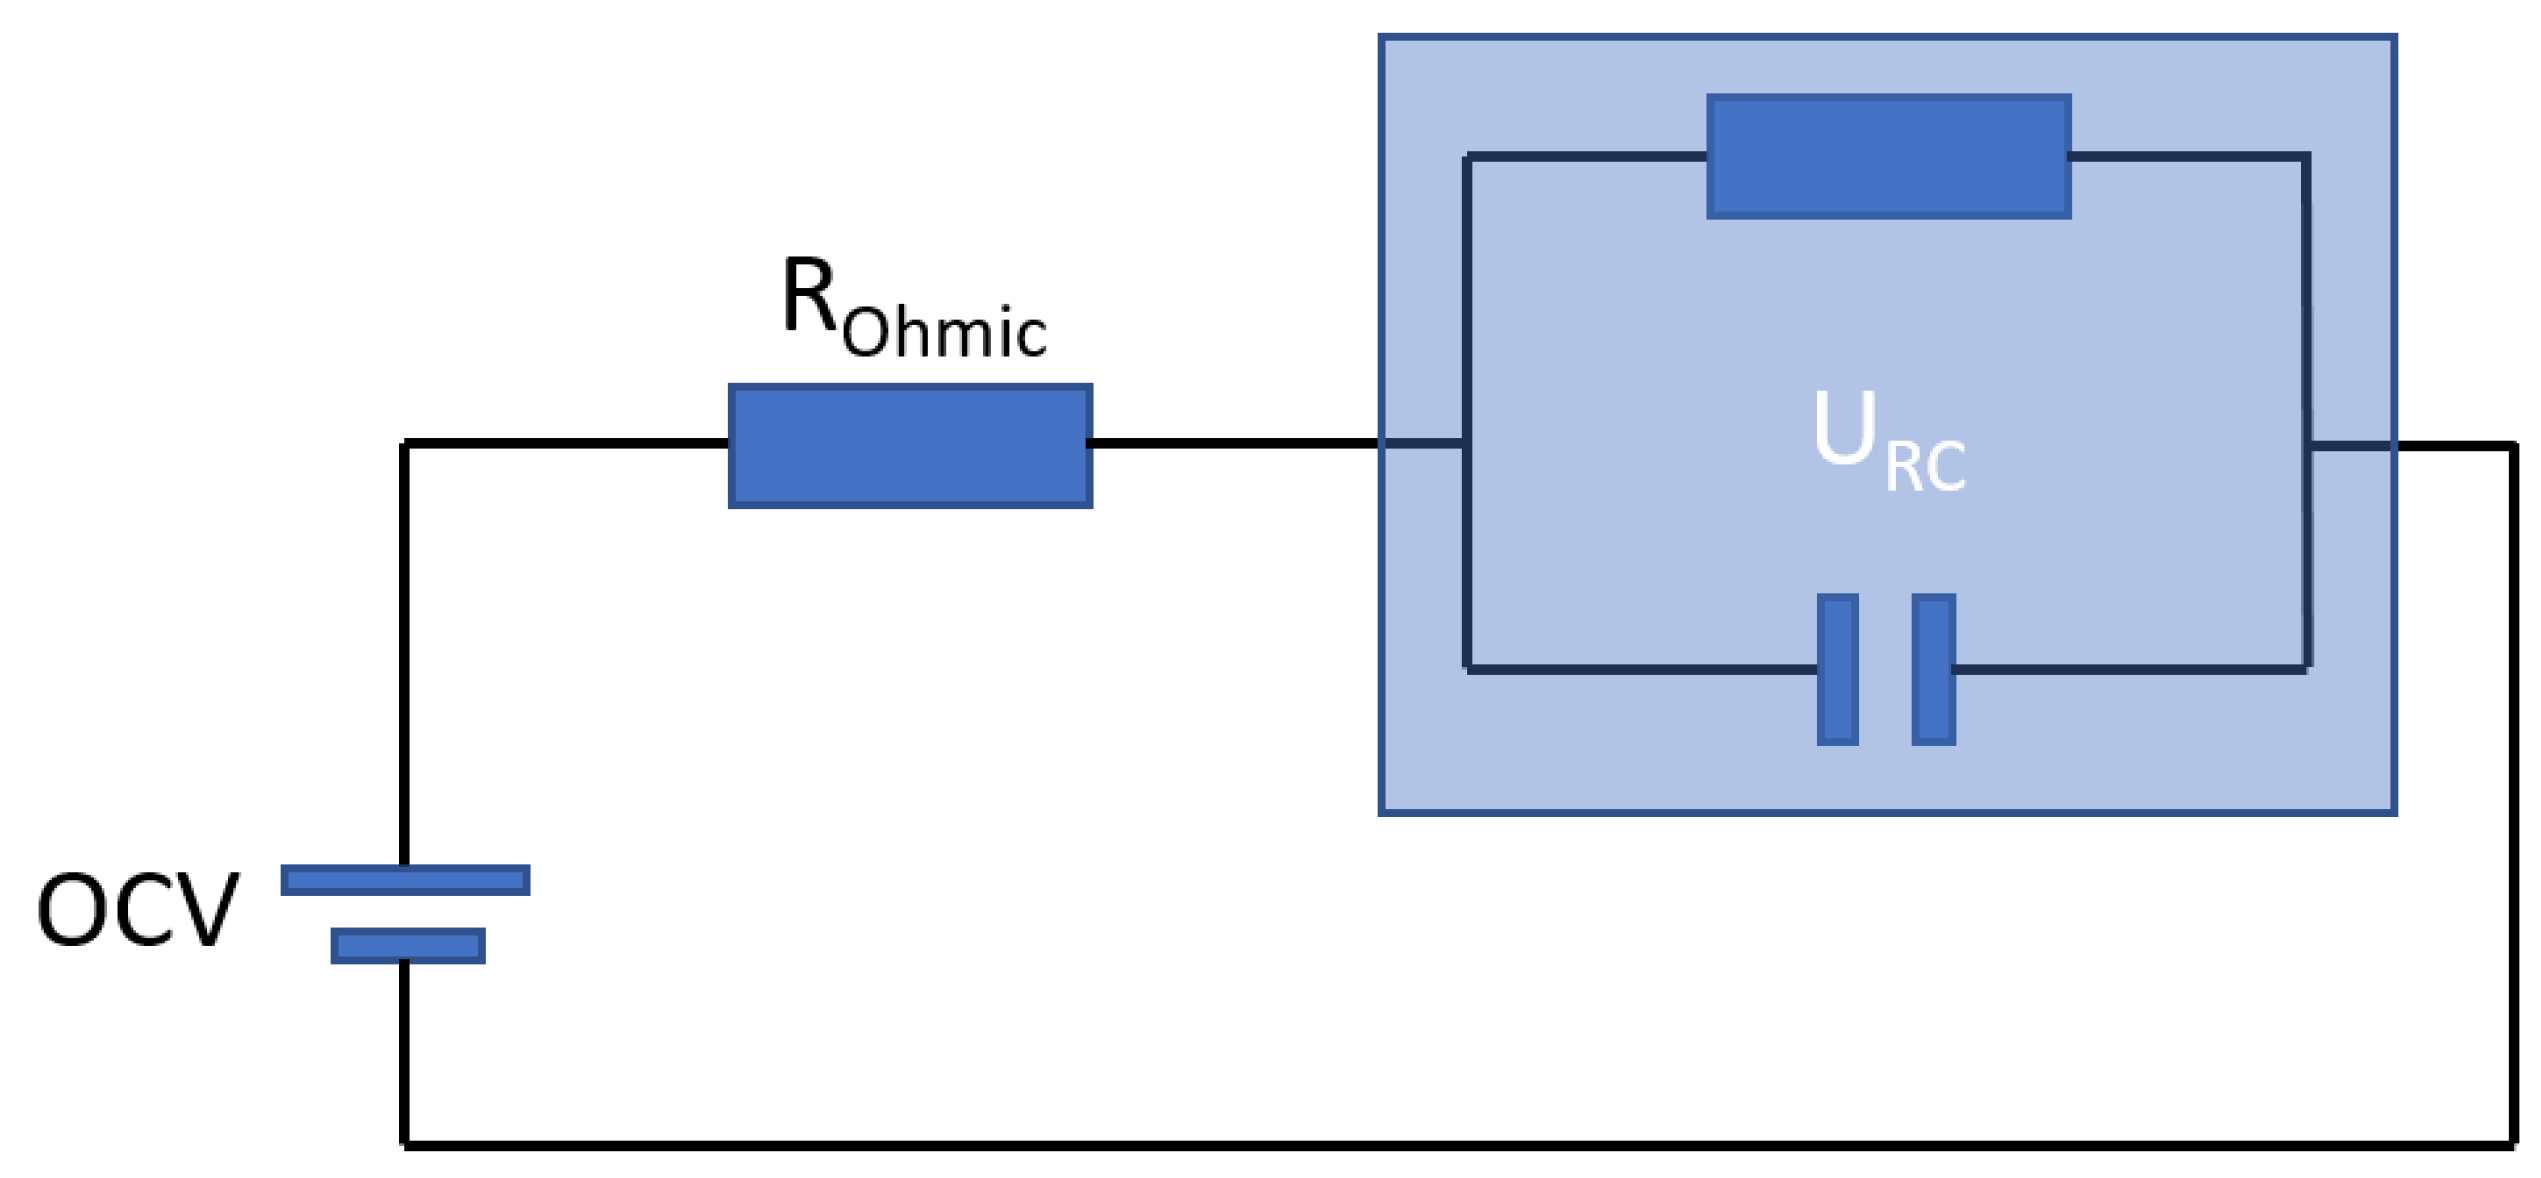
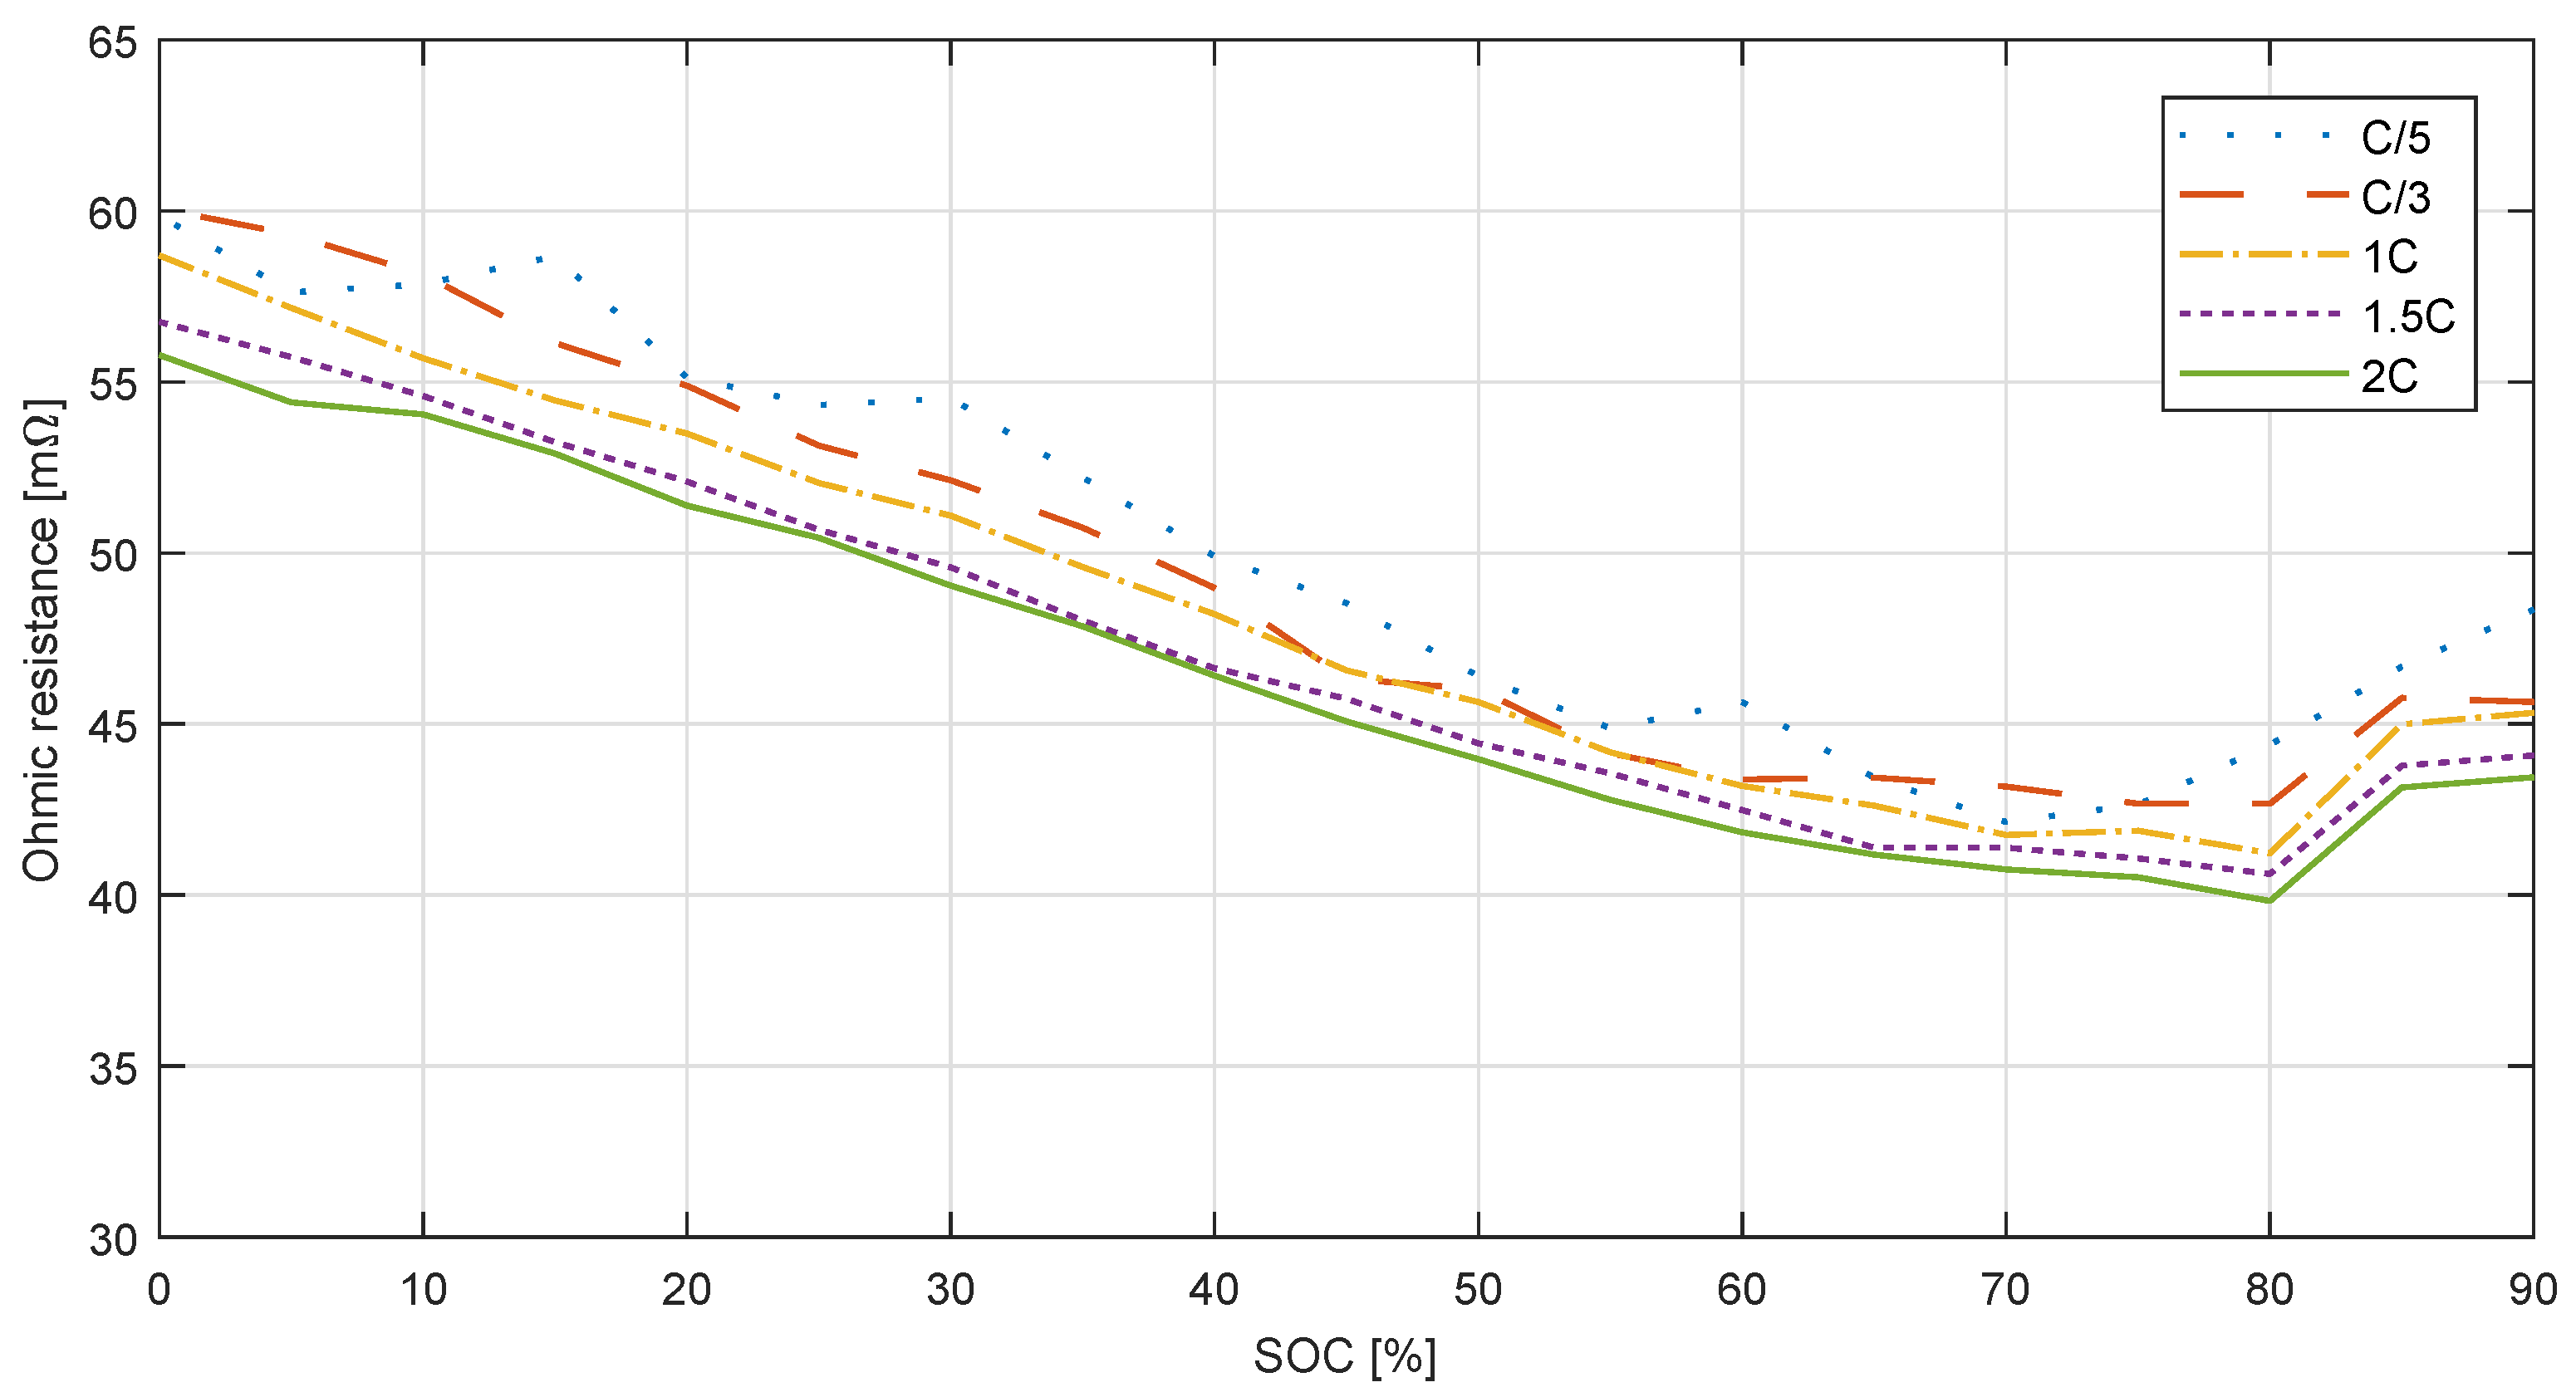
3.1.4. Hybrid Pulse Power Characterization Test

To evaluate the cell’s dynamic behavior, a hybrid pulse power characterization test (HPPC) was performed. It consisted of a constant current charge at C/3, followed by a constant voltage charge at 4.35 V to ensure the cell was fully charged. Thereafter, a series of alternating charge and discharge current pulses were imposed on the cell at C/5, C/3, 1C, 1.5C, and 2C. The C-rates of the current pulses were smaller than in the existing standards because of the prototypical nature of this battery. This sequence of current pulses was repeated at every 5% SoC step, except for the 100% and 95% SoC levels, where only the two smallest current pulses are demanded to prevent exceedance of the upper voltage limit. This testing procedure allows the identification of key electrical behaviors of the tested cell—predominantly, the ohmic resistance—under varying current rates and at different SoC levels. The measured data were processed using a dedicated script developed in Matlab® using gradient-based least squares (LS) curve fitting, which identifies the electrical parameters by minimizing the error between the measured voltage and the simulated voltage, obtained by V t = O C V - R o h m i c I - U R C . In this first-order RC model equation, which is commonly used to model the electrical behavior of Li-ion batteries [24,25], V t represents the simulated terminal voltage, R o h m i c is the ohmic resistance, I is the current, and U R C is the voltage drop across the parallel RC circuit. The equivalent circuit scheme is visualized in Figure 4. The identified ohmic resistance, which is determined by the instantaneous voltage response, is shown in Figure 5. Furthermore, the ohmic resistance does not only depend on temperature, but also on the C-rate: a higher current results in a lower resistance. Finally, comparing the cell to a state-of-the-art NMC cell of comparable specifications reveals that the ohmic resistance is up to 5 m Ω higher, which reduces the power capabilities and increases the high heat generation of the Si alloy cell. It also confirms that undesired side reactions have caused the battery to degrade significantly throughout this characterization campaign, leading to low capacities.

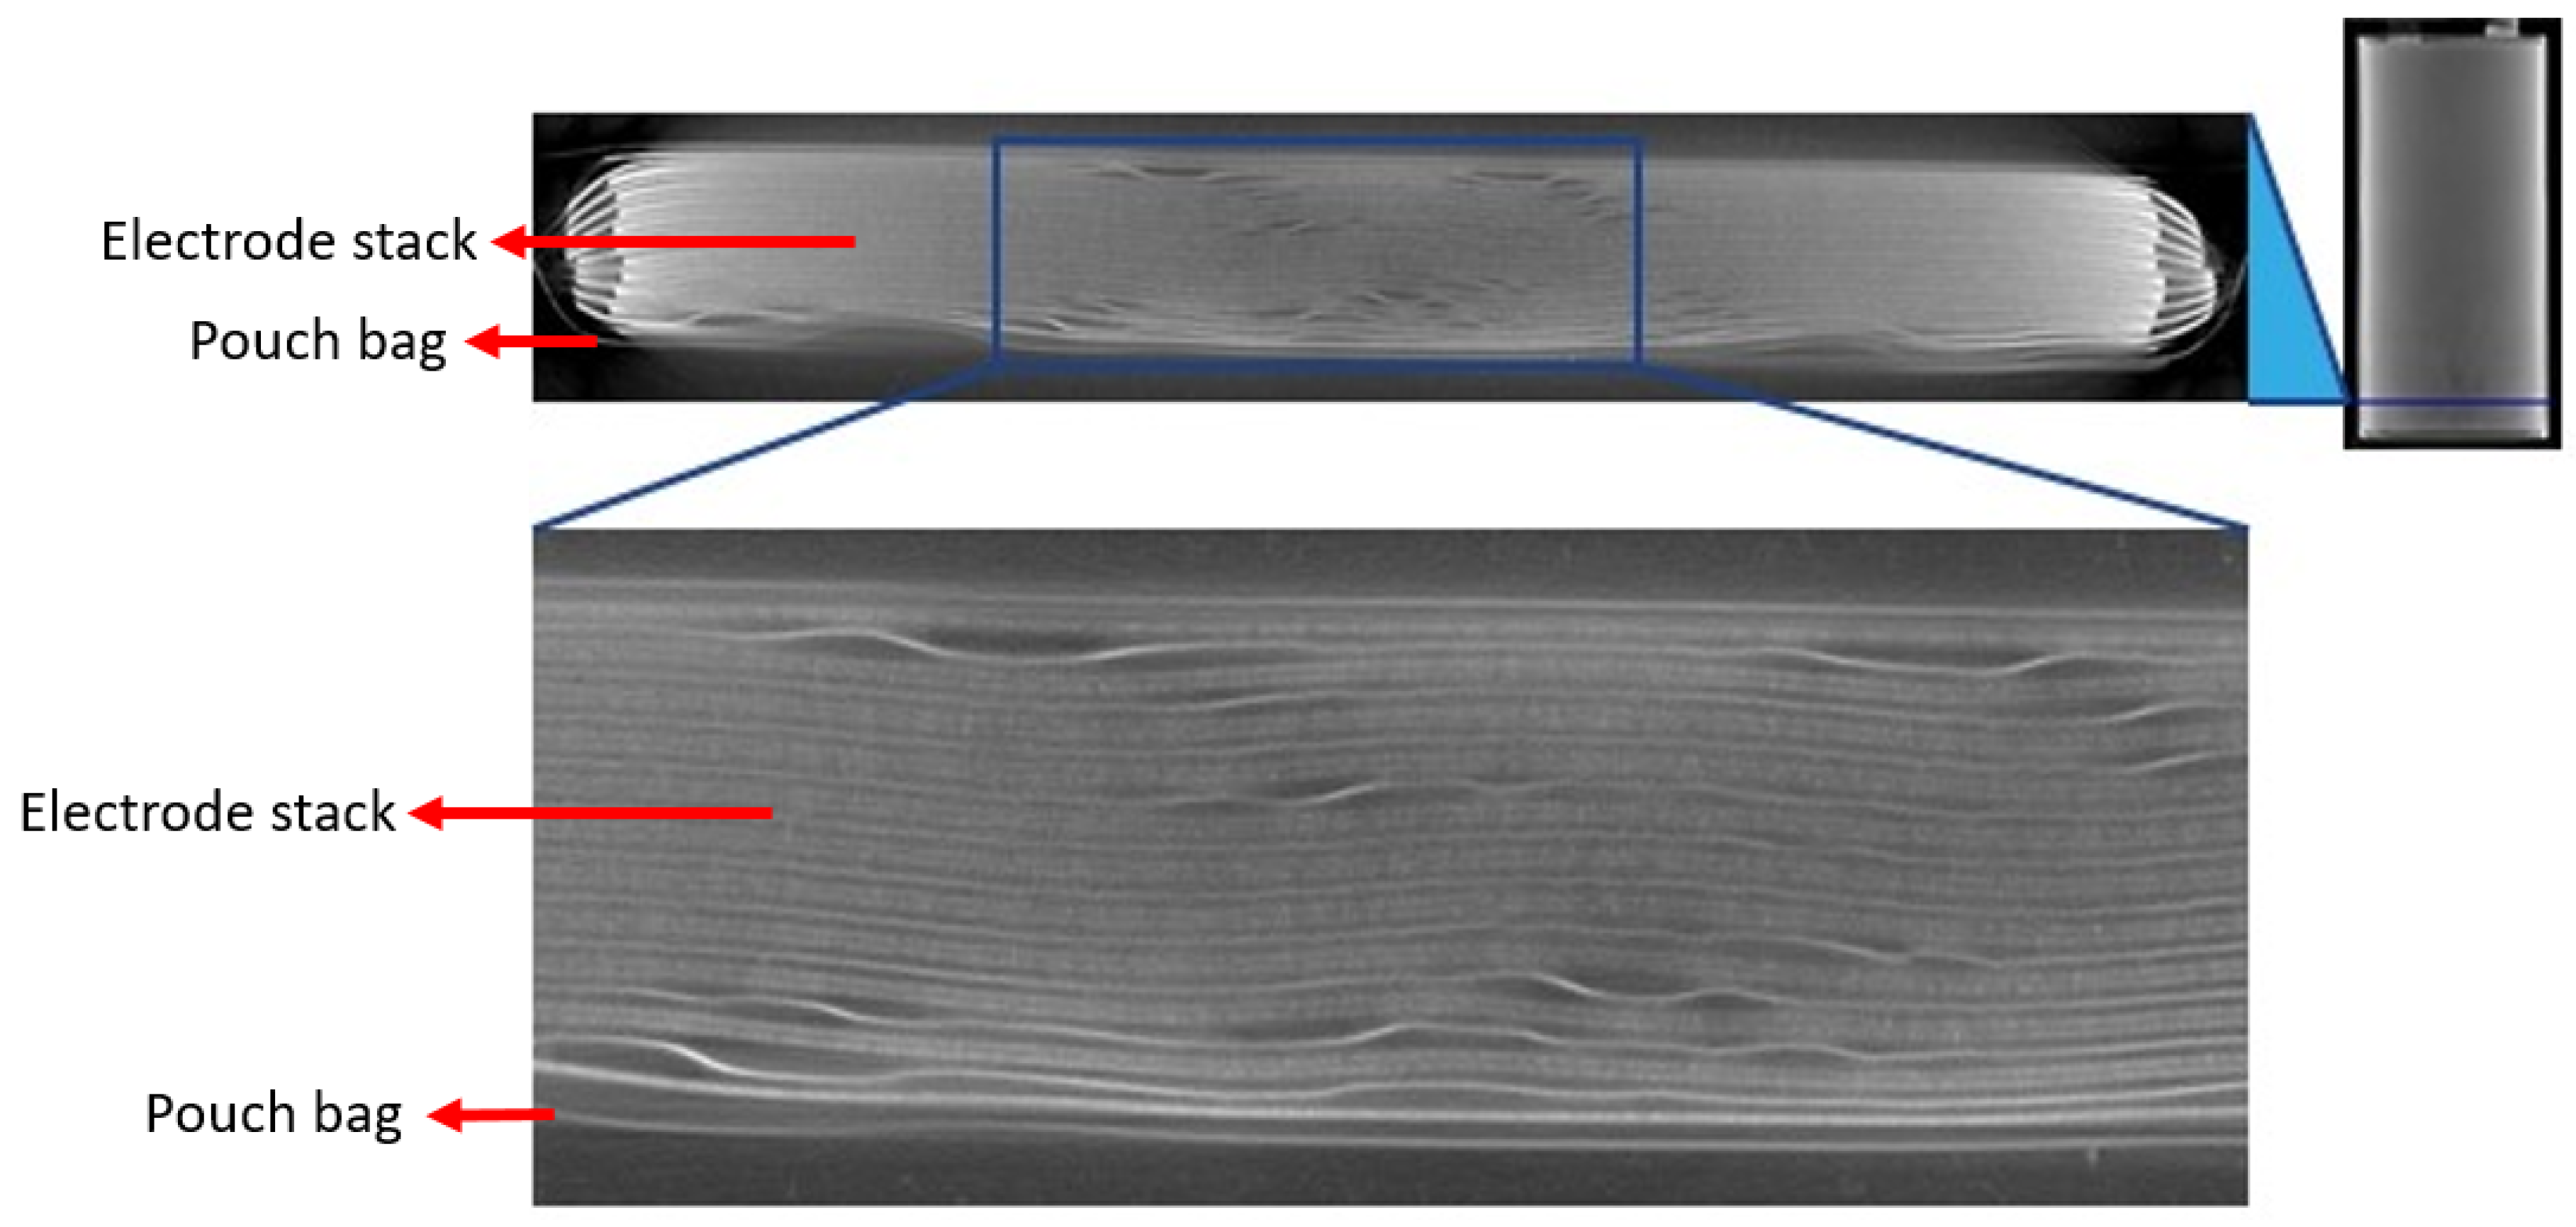
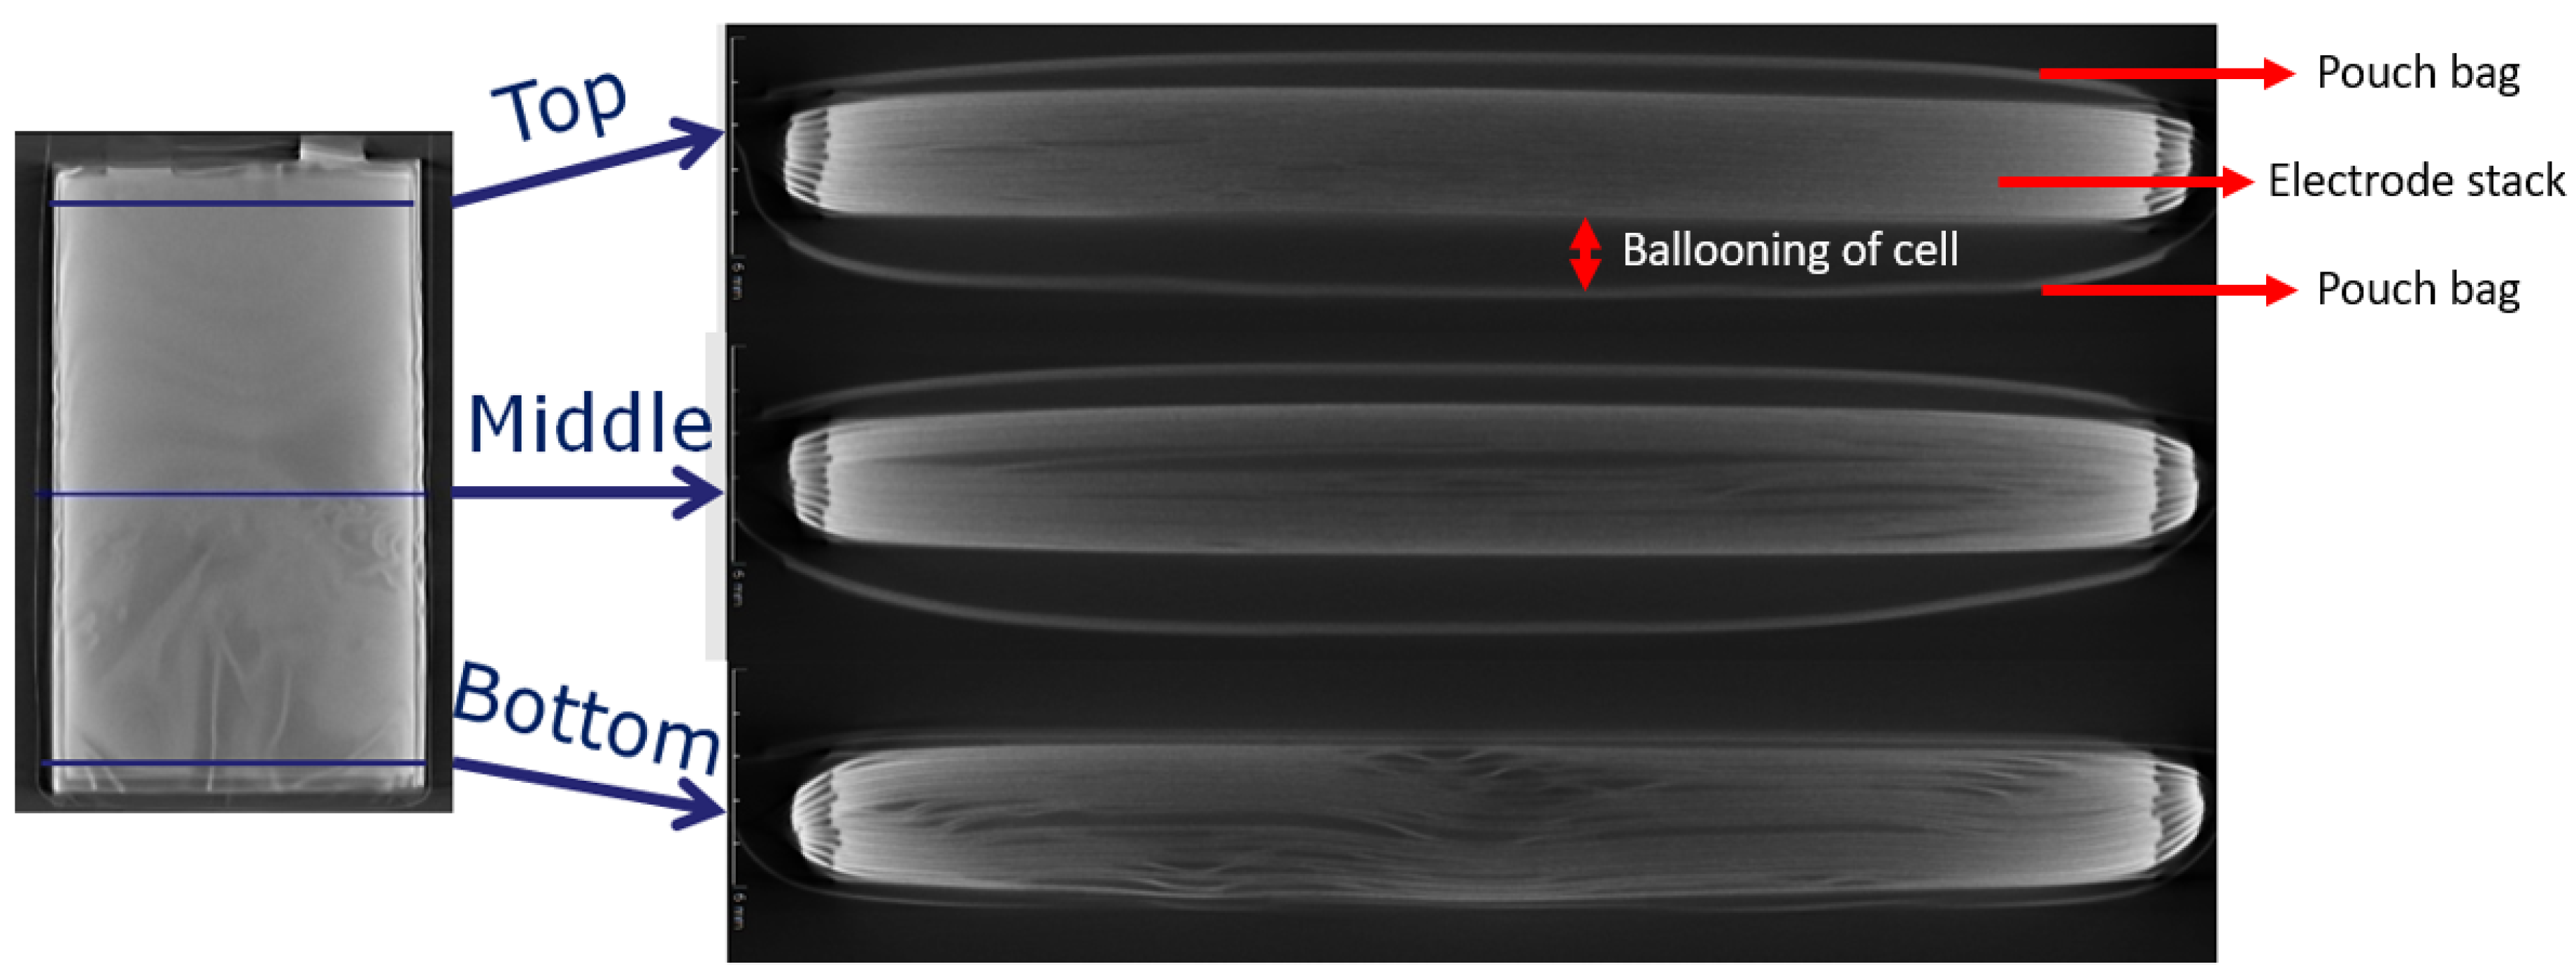
3.2. 3D X-ray Computed Tomography Analysis

3.2.1. Investigation of Pouch Cells Directly after Cell Formation

CT was performed on three pouch cells after formation, and consistent CT results were found for all three cells. Figure 6 shows a representative high-resolution CT cross-section at the bottom of one of these three pouch cells directly after formation. The top image shows the complete cross-section through the cell, while the bottom image shows a zoom-in (as indicated by the blue box).
The bright contrast in the CT cross-section corresponds to high X-ray absorption, and, in Figure 6, the Cu layers show the brightest gray values. Even though the cell was imaged by CT directly after formation, the Cu layers show clear waviness, and the electrode stack’s geometry is far from perfect. Dark irregular areas are visible, which can represent gas bubbles or the delamination of layers [26,27,28,29]. As similar results were observed for three cells, it can be assumed that such irregularities are present after formation in all the pouch cells manufactured in the scope of this research. Nevertheless, stable electrochemical performance was initially observed (see Section 3.1).

3.2.2. Investigation of Pouch Cells after BoL Tests
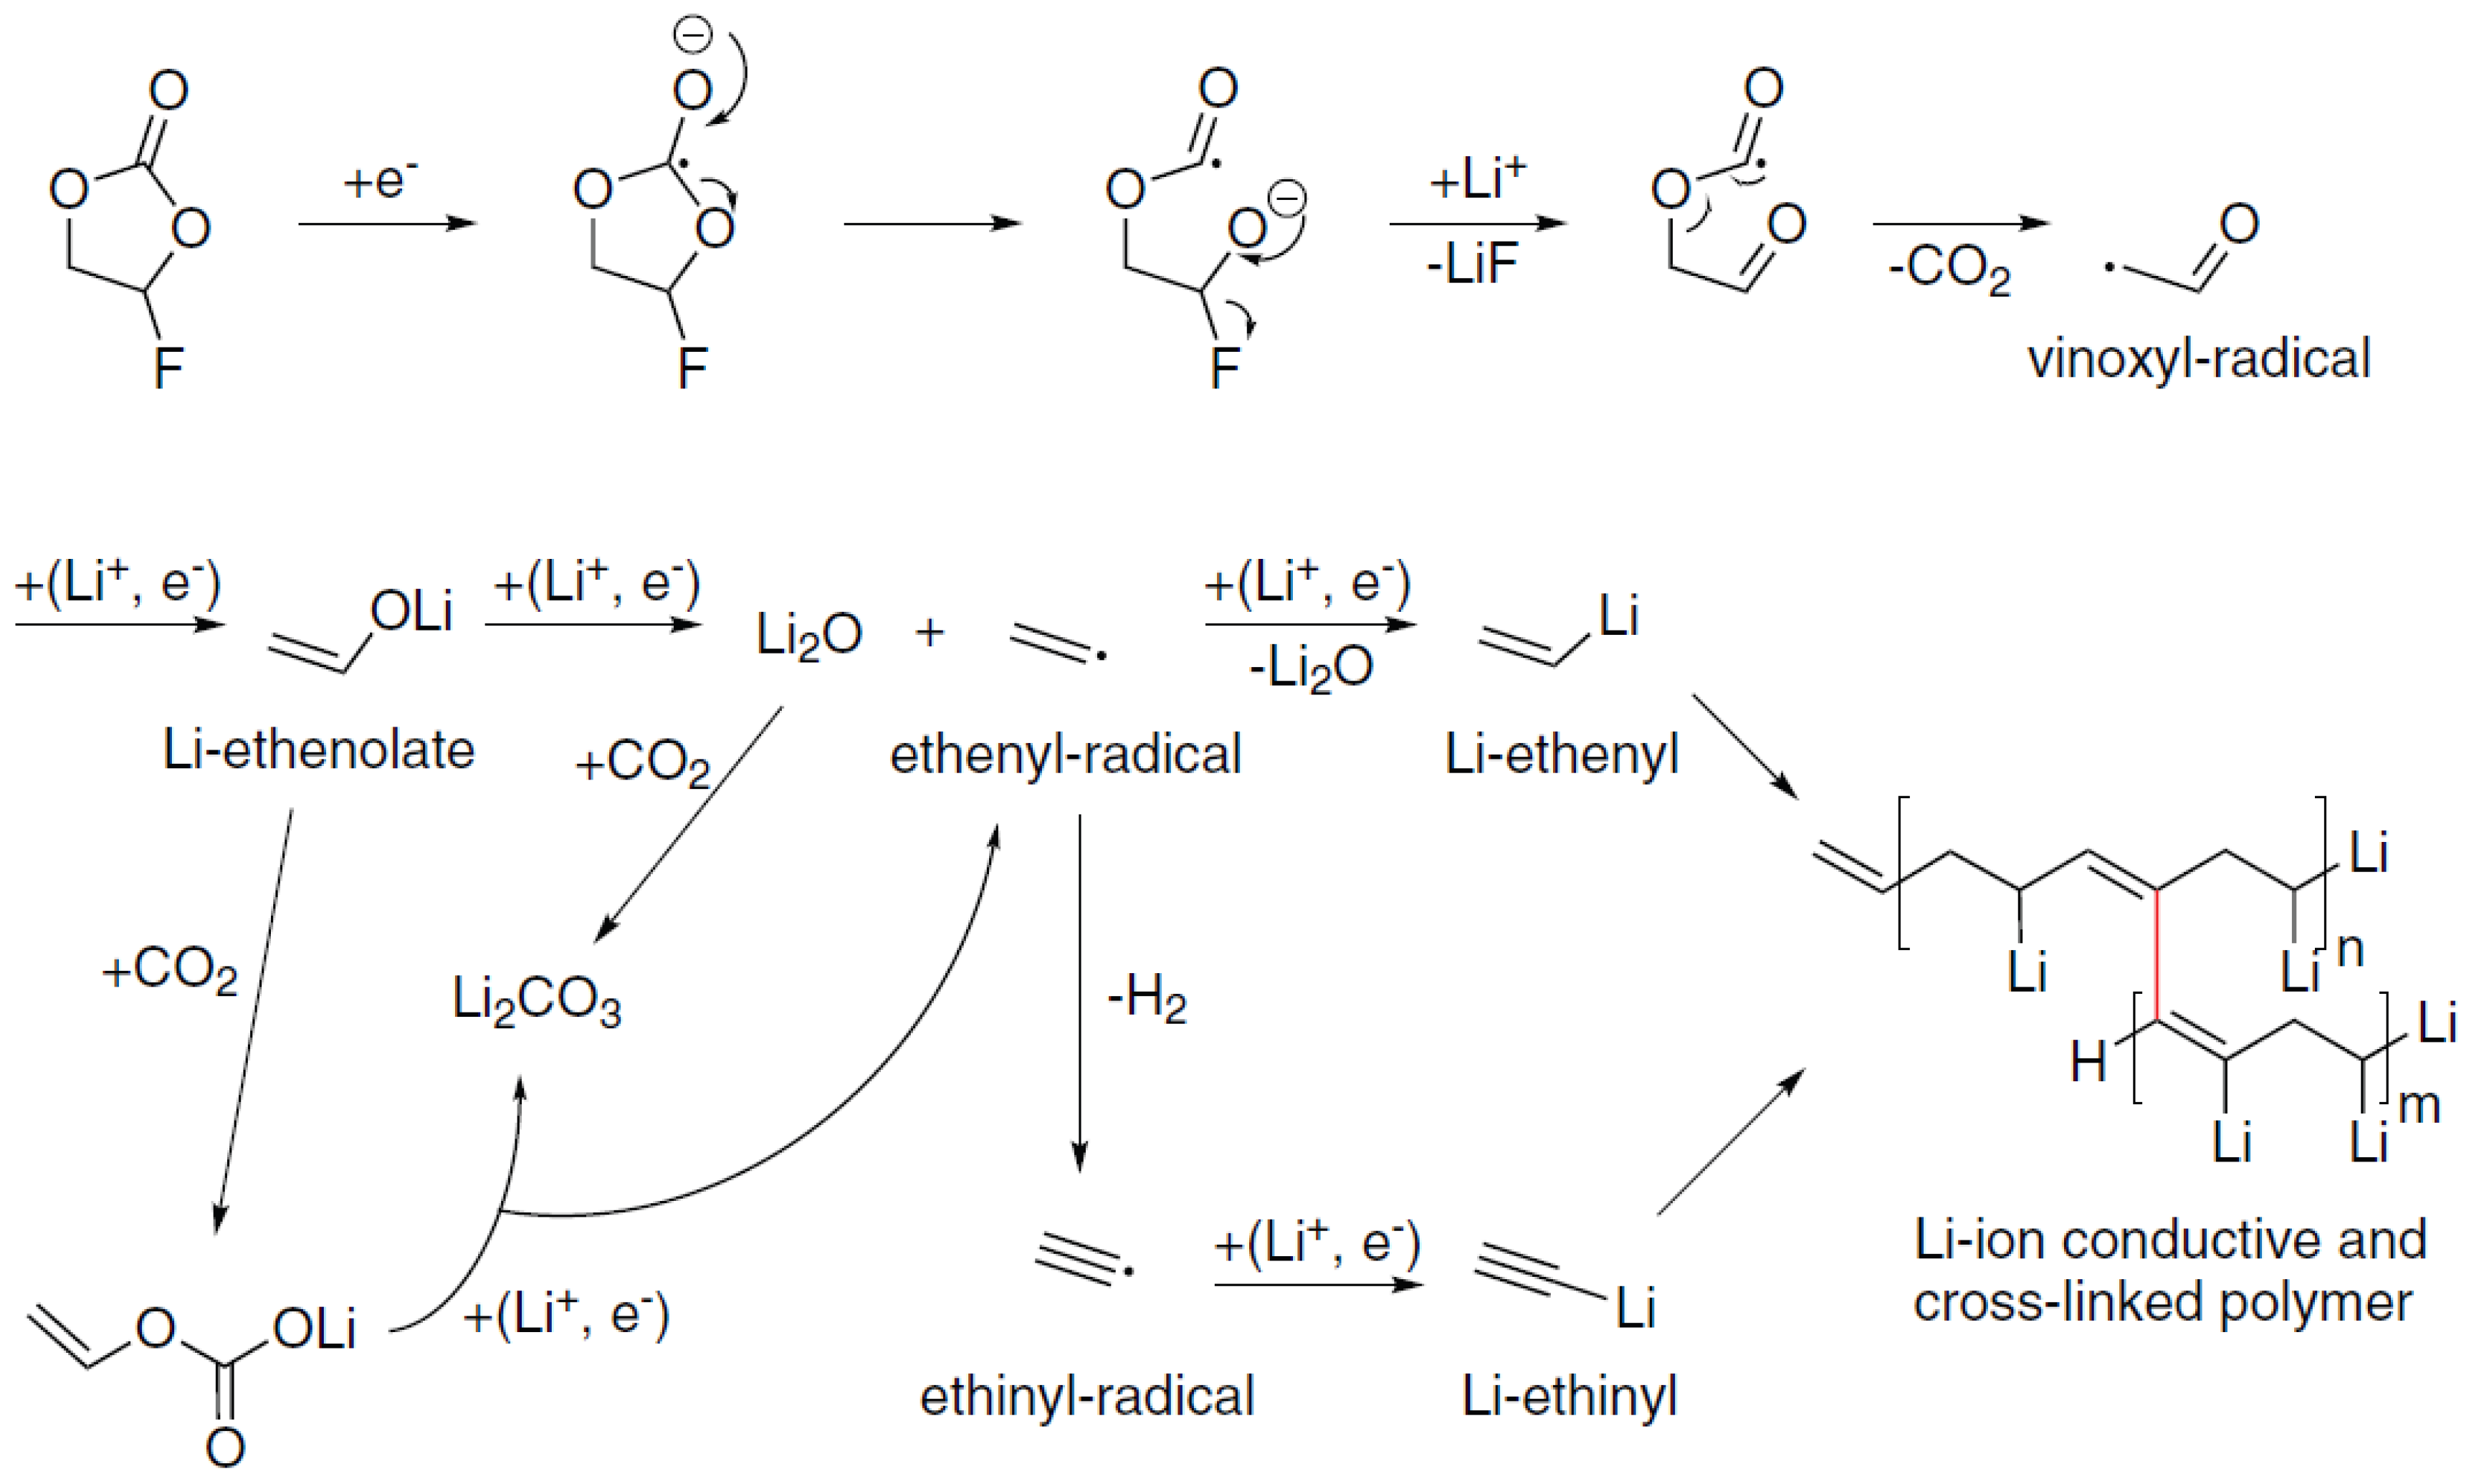
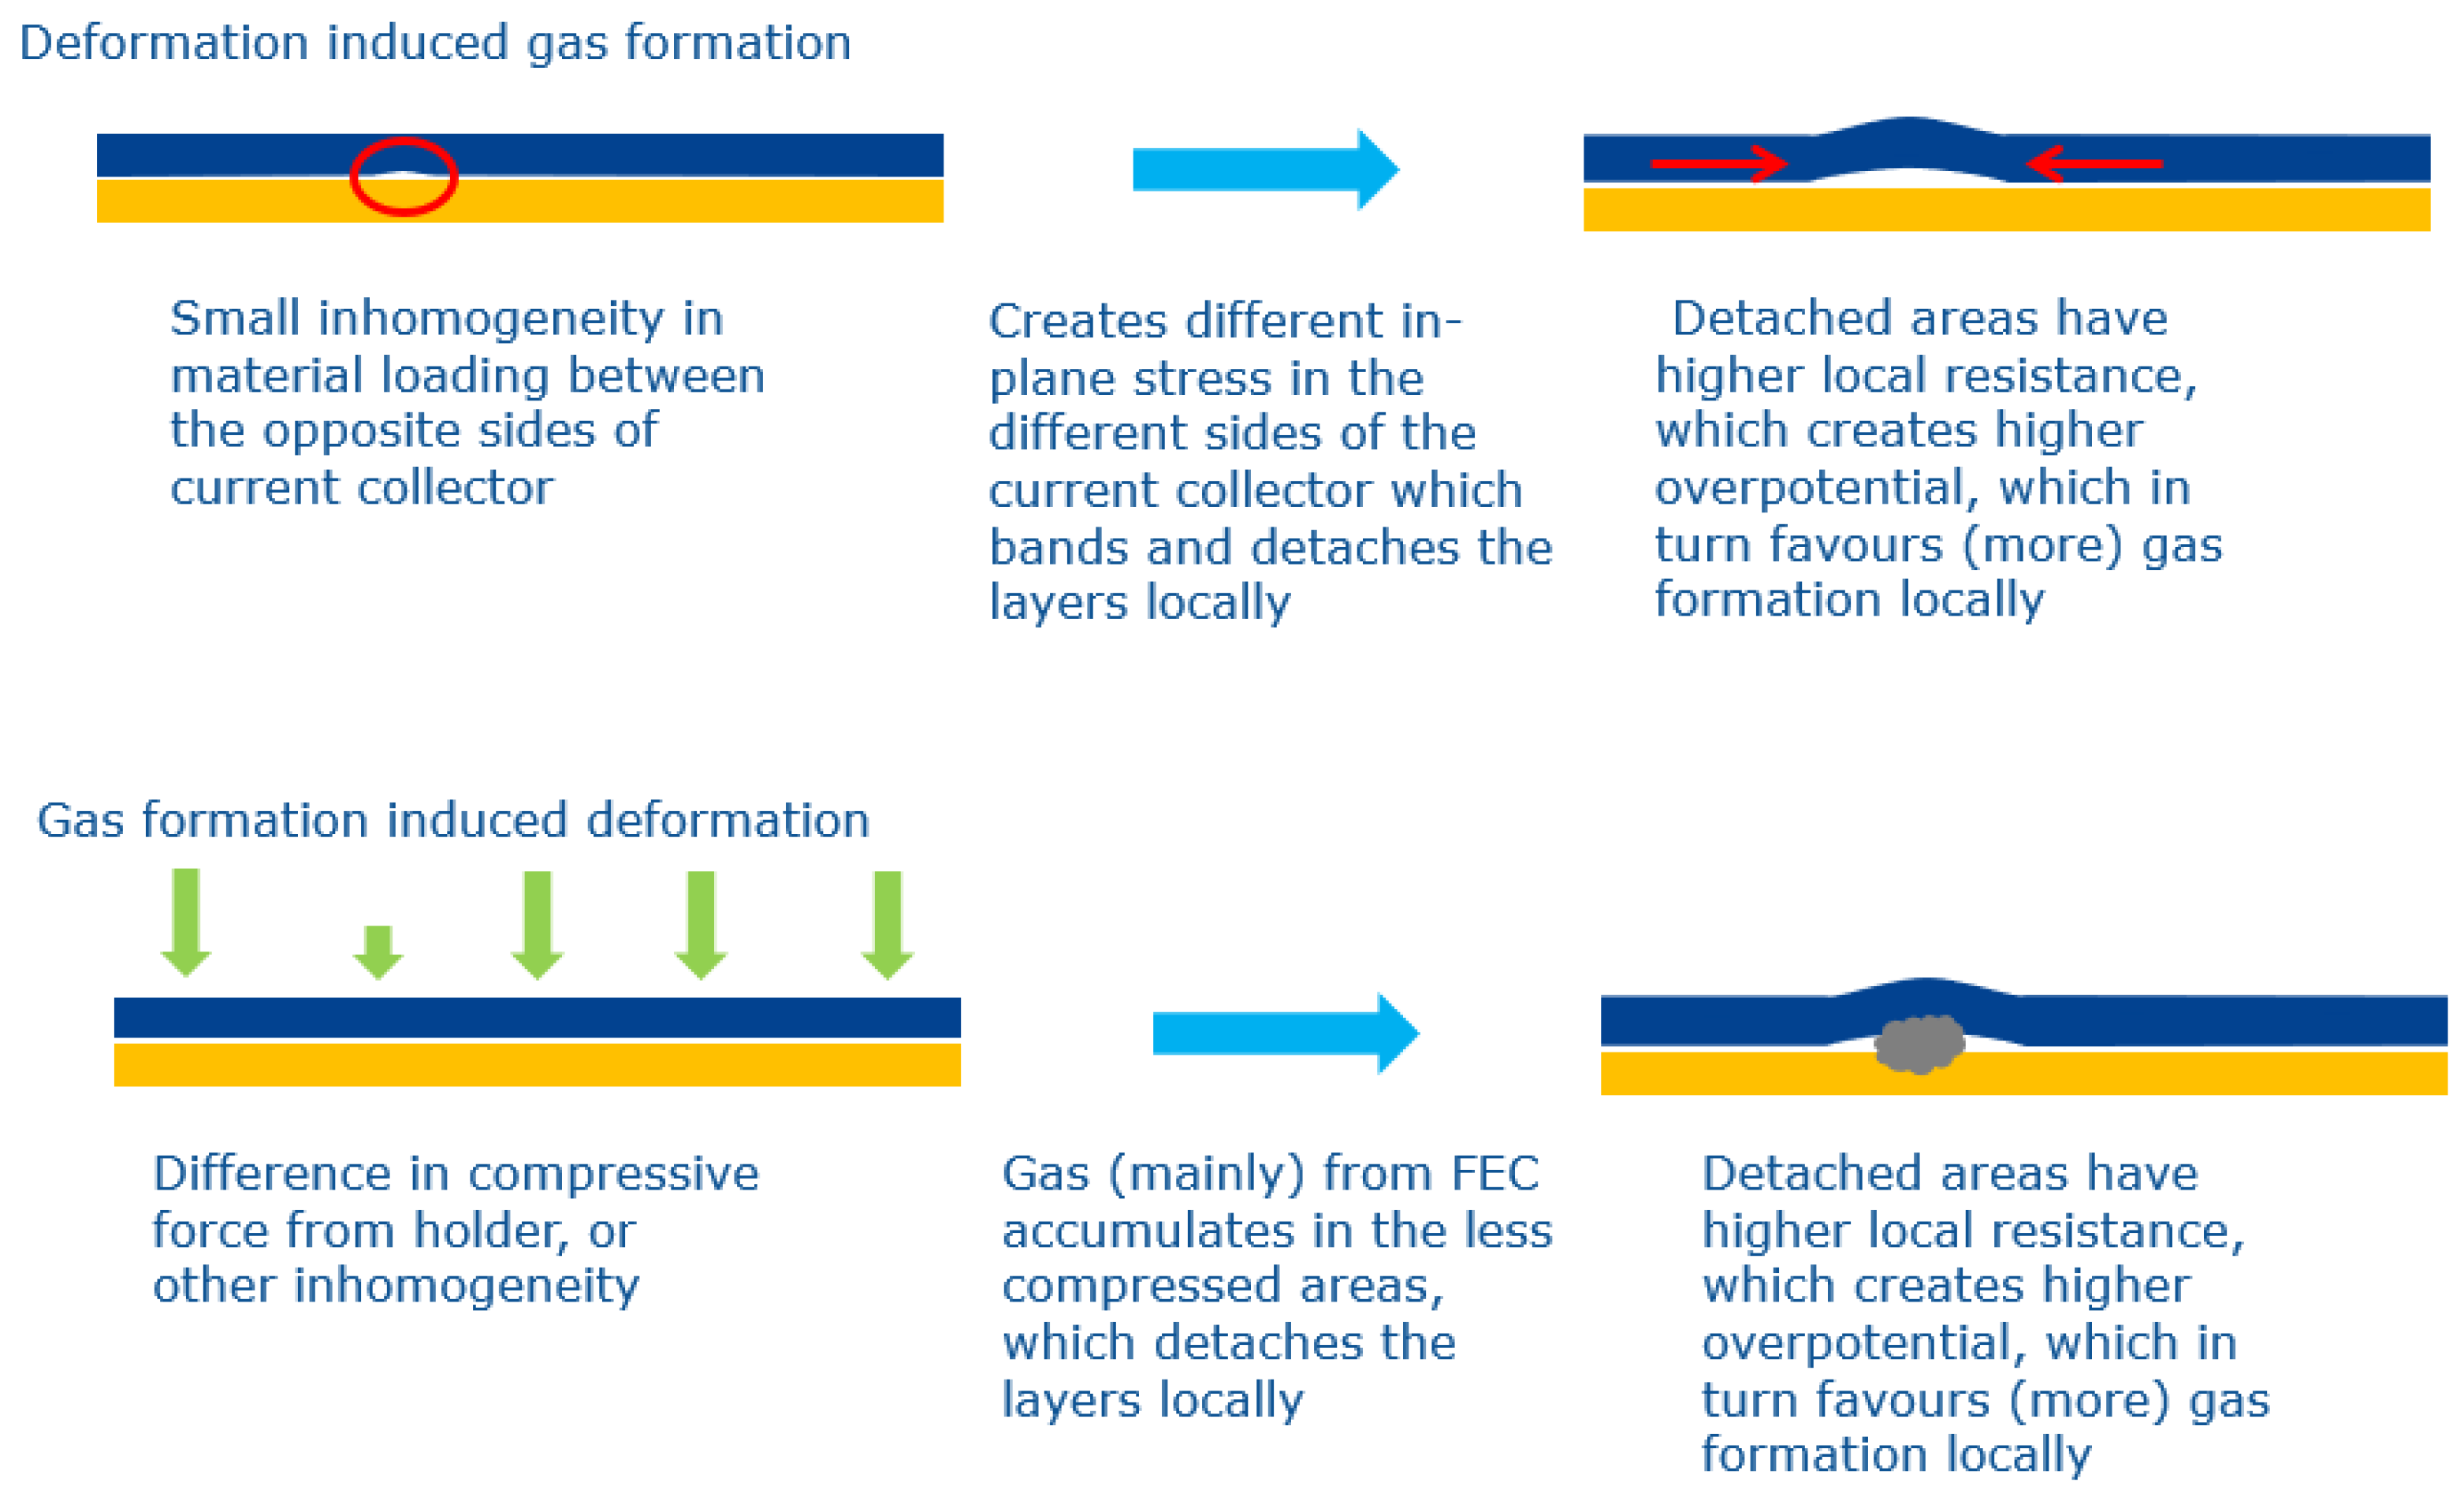
It was observed that several cells after beginning of life (BoL) testing showed ballooning. One of those cells was investigated by CT. This ballooning is clearly visible in the top and middle cross-sections shown in Figure 7 (see dark areas between the pouch and electrode layer stack). Further, the geometry of the electrode layer stack deviates significantly from the original shape, which is especially visible in the middle and bottom cross-sections: the layers are no longer parallel, and dark areas are visible, which might represent gas bubbles.

3.3. Discussion

The 3D computed tomography analysis combined with the visual inspection during the characterization tests indicates significant gas formation. This gas formation causes a loss of active surface area, since these gas bubbles hinder the transport of lithium ions. This results in a significant decrease of the capacity and increase of internal resistance, as observed during extensive electrical testing (see Section 3.1). This section discusses the possible root cause of this gassing phenomenon. Side reactions of the electrolyte most likely cause this gas formation. The electrolyte consists of 0.9 M LiPF6, 0.1 M Lifetime Electrolyte Arkema (LEA), and 10% fluoroethylene carbonate (FEC).
The LEA is a high-purity salt based upon lithium 4,5-dicyano-2-(trifluoromethyl) imidazolide (LiTDI) developed by Arkema to increase the cell’s performance. The usage of this salt has three main advantages. Firstly, it was demonstrated that adding LiTDI improves the cycling performance of silicon-based electrodes [29]. Secondly, less LiPF 6 is necessary, which is beneficial for the stability and overall safety of the battery [30,31,32,33]. The reason is that LiPF 6 forms HF, which negatively affects the stability of silicon-based electrodes and causes safety risks in the case of battery failure. Thirdly, according to a study by Lindgren et al. [29], LiTDI undergoes only minor decomposition during cycling, making this salt unlikely to be the cause of the gas formation.
Fluoroethylene carbonate (FEC) is considered a standard additive when using silicon-based electrodes [14]. It improves the solid electrolyte interface layer (SEI) by creating a more homogeneous and flexible SEI layer. This results in an improved cycling stability combined with an overall higher coulombic efficiency [10]. Additionally, it reduces the cracking of the SEI layer [34] caused by the volumetric changes of the silicon particles during charging and discharging. However, it should be noted that the working principle and FEC’s exact decomposition during battery cycling are not yet fully understood. Research by Leung et al. [35] simulated the excess electron-induced decomposition of FEC by using density functional theory (DFT), ab initio molecular dynamics (AIMD), and quantum chemistry techniques. Only one- and two-electron reactions were considered. Leung concluded that the most probable decomposition products of FEC are LiF, CO 2 , and CHOCH 2 radicals. Jung [36] proposed a four-electron-induced decomposition of FEC, as illustrated in Figure 8. The decomposition products are CO 2 , LiF, Li 2 O, Li 2 CO 3 , H 2 , and a partially cross-linked polymer. Additionally, Jung et al. [36] showed by online electrochemical mass spectrometry that one molecule of CO 2 is produced for every molecule of FEC that is reduced. Furthermore, experiments have shown a significant increase in the production of CO 2 gas when using FEC when compared to non-FEC-containing electrolytes.
In conclusion, the two main decomposition products from FEC, confirmed by both modeling and experiments, are LiF and CO 2 . LiF is identified as the component leading to an improved SEI layer, making it more homogeneous and more resistant to cracking due to volumetric changes in the silicon particles. This results in an improved cycling stability [37].
The detached areas, as seen in Figure 7, combined with the presence of gas, could be caused by two possible mechanisms, as demonstrated in Figure 9. More specifically, by deformation-induced gas formation and by gas formation-induced deformation. In the first case, small inhomogeneities between the opposites sides of the current collector are present due to manufacturing. This creates different in-plane stresses leading to small detachments of the layers locally [38]. Detached areas have higher local resistances and thus create locally higher overpotentials, which is a more favorable condition for gas formation. In the second case, due to homogeneities or, for example, a difference in compressive force, gas formation occurs locally, leading to the detachment of the layers.
The observed rapid decreasing capacity is clearly linked to the rapid consumption of FEC. This is also confirmed by the significant amounts of gas produced. Due to this large consumption of FEC, the negative effects of the produced gas dominate the positive effects of the produced LiF. Therefore, this reaction rate should be reduced. The reaction rate is influenced by several parameters, the most important being temperature, concentration, and pressure. The temperature effect is less relevant since batteries need to be used within a range of temperatures given by the application itself. The concentration, in this case, is already optimized to achieve the highest energy density. However, external pressure can still be applied to the cell. Applying external pressure to the cell would probably reduce the reaction rate since it will be more difficult to form CO 2 gas.

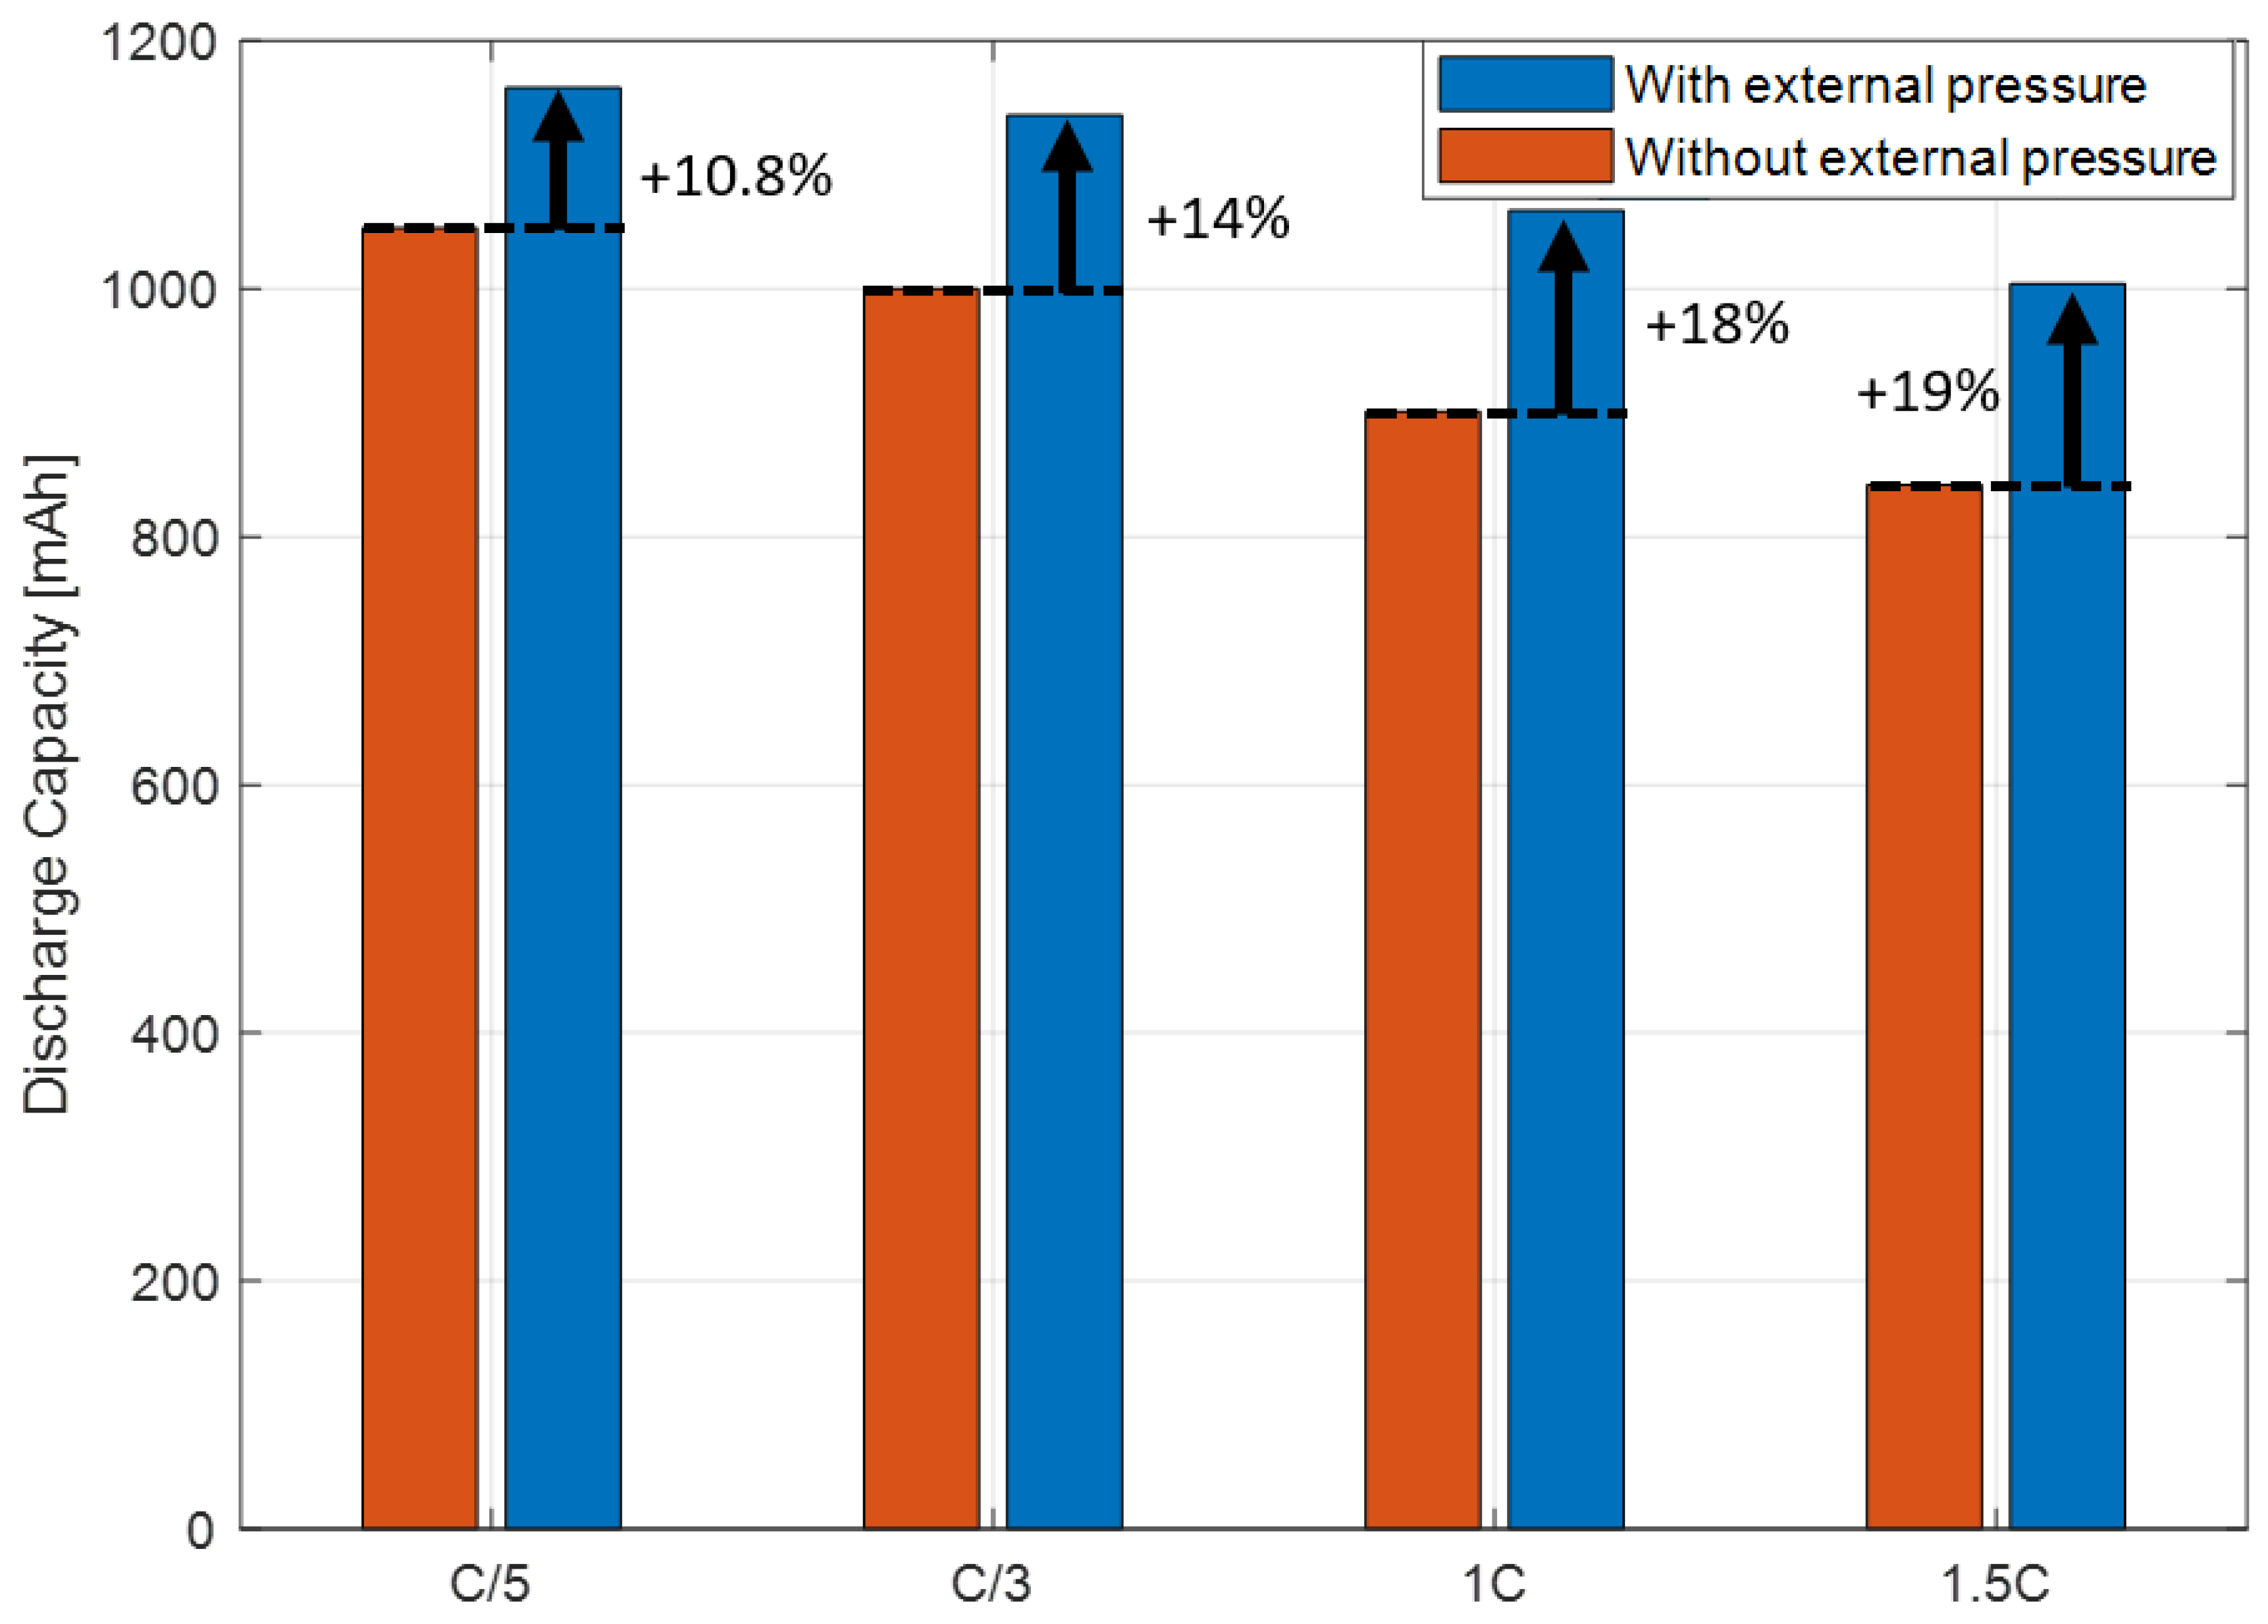
3.4. Investigation of the Effect of External Pressure

This section presents the investigation of whether the application of external pressure to the pouch cell reduces gassing and accordingly improves its electrical performance. This was achieved by clamping a fresh pouch cell between two parallel plates, applying homogeneous pressure onto the pouch cell. A capacity test, as defined previously in Section 3.1.3, was performed in order to evaluate if ballooning occurs and, additionally, to evaluate the cell’s performance by means of discharge capacity and rate retention. After this test, when releasing the pressure, no ballooning of the cell could be seen. The comparison between the capacity of the clamped and unclamped pouch cell is visualized in Figure 10. Significant increases in discharge capacity ranged between 10.8% and 19% at C/5 and 1.5C, respectively. A significant improvement of the cells’ performance, in terms of available discharge capacity and rate capability, can be observed. Taking into account these two observations—no ballooning and improved electrical performance—it can be concluded that no gas or only a small amount of gas is present in the cell. Taking into account the two possible mechanisms described in Figure 9, it is assumed that external pressure leads to a better connection between the electrodes and thus less detached areas, and thus less favorable conditions for gas formation. Therefore, it can be concluded that the application of external pressure to the pouch cell indirectly reduces the consumption of FEC, leading to a superior performance of the cell. The application of external pressure is concluded to be a critical parameter when designing battery packs containing weight quantities of silicon. More research on this topic is needed to quantify the impact of pressure on the aging of the cell.

4. Conclusions

The developed prototype of silicon alloy lithium-ion batteries has an increased energy density compared to current state-of-the-art NMC (5:3:2) graphite batteries. This demonstrates their potential for increasing the energy density of batteries, making them very suitable for usage in electric vehicles.
From the electrical performance tests, two main conclusions can be drawn. Firstly, there is a significant hysteresis behavior of the approximated OCV. This aspect must be considered when developing equivalent circuit models, especially when estimating the state of charge (SoC). Secondly, the rapidly decreasing capacity was investigated thoroughly by micro X-ray computed tomography (CT) scans, which showed clear mechanical deformation of the electrode layers.
After a thorough root cause analysis, it can be concluded that gas is being produced, most likely CO 2 gas originating from the consumption of fluoroethylene carbonate (FEC). FEC is added to the electrolyte to create a more stable solid electrolyte interface (SEI) layer, thereby increasing the cycling stability by forming LiF. Its major drawback is the formation of CO 2 gas as a side reaction. This CO 2 gas hinders the transport of lithium ions, causing a loss of active surface area and leading to a decrease in capacity. Since high amounts of gas are formed, the negative effects outweigh the gained benefits of using FEC. Therefore, if this reaction rate were to be reduced, the capacity retention could be improved.
This research was concluded with the study on the effect of applying external pressure to reduce the decomposition reaction rate of FEC, resulting in less production of gas. Results showed a significant increase in the discharge capacity of up to 19% when applying external pressure. Additionally, no ballooning of the cell was visible after the testing, meaning that no gas or only a small quantity of gas was present. Therefore, it is concluded that the application of external pressure to the pouch cell reduces the consumption of FEC, leading to a superior performance of the cell. The application of external pressure is concluded to be a critical parameter when designing battery packs containing weight quantities of silicon.

5. Future Work

The electrical performance of the cell under external pressure, including its effect on the aging of the battery, should be investigated. Additionally, a dedicated test setup needs to be developed that allows for the measurement of pressure during testing to get a more thorough insight into the ongoing physical processes.

Author Contributions

Conceptualization and Methodology, G.B., L.D.S., J.S., A.K. (Akos Kriston), M.M., P.A., M.W.-M., A.P., J.J., J.V.M. and N.O.; Software, Formal Analysis, Investigation, Data Curation and Validation, B.D.S., M.K., A.K. (Akos Kriston), A.K. (Algirdas Kersys) and A.P.; Resources, G.B., M.M., P.A., M.W.-M., J.V.M., A.P. and N.O.

Funding

This project has received funding from the European Union’s Horizon 2020 research and innovation programme under grant agreement No. 653531.

Acknowledgments

We acknowledge the support this project has received from the European Union’s Horizon 2020 research and innovation programme under grant agreement No. 653531. We acknowledge Flanders Make for the support to our research group.

Conflicts of Interest

The authors declare no conflict of interest.

References

  1. COP21. The 21st Annual Conference of Parties (COP21). Available online: http://www.cop21paris.org/about/cop21/ (accessed on 20 July 2018).
  2. Electric Vehicles. European Automobile Manufacturers Association. Available online: https://www.acea.be/industry-topics/tag/category/electric-vehicles (accessed on 2 July 2018).
  3. van Mierlo, J. The World Vehicle Journal, The Open Access for Electric the e-Mobility Scene Journal for the e-Mobility Scene. World Electr. Veh. J. 2018, 9, 1. [Google Scholar] [CrossRef]
  4. Berckmans, G.; Messagie, M.; Smekens, J.; Omar, N.; Vanhaverbeke, L.; van Mierlo, J. Cost projection of state of the art lithium-ion batteries for electric vehicles up to 2030. Energies 2017, 10, 1314. [Google Scholar] [CrossRef]
  5. Gao, P.; Kaas, H.W.; Mohr, D.; Wee, D. Disruptive Trends That Will Transform the Auto Industry; Technical Report; McKinsey & Company: New York, NY, USA, 2016. [Google Scholar]
  6. Smekens, J.; Gopalakrishnan, R.; Van den Steen, N.; Omar, N.; Hegazy, O.; Hubin, A.; Van Mierlo, J. Influence of electrode density on the performance of Li-ion batteries: Experimental and simulation results. Energies 2016, 9, 104. [Google Scholar] [CrossRef]
  7. Mekonnen, Y.; Sundararajan, A.; Sarwat, A.I. A Review of Cathode and Anode Materials for Lithium-Ion Batteries. In Proceedings of the SoutheastCon 2016, Norfolk, VA, USA, 30 March–3 April 2016; pp. 2–7. [Google Scholar] [CrossRef]
  8. Nitta, N.; Wu, F.; Lee, J.T.; Yushin, G. Li-ion battery materials: Present and future. Mater. Today 2015, 18, 252–264. [Google Scholar] [CrossRef]
  9. Kheirabadi, N.; Shafiekhani, A. Graphene/Li-ion battery. J. Appl. Phys. 2012, 112. [Google Scholar] [CrossRef] [Green Version]
  10. Su, X.; Wu, Q.; Li, J.; Xiao, X. Silicon-based nanomaterials for lithium-ion batteries. Chin. Sci. Bull. 2012, 57, 4104–4110. [Google Scholar] [CrossRef]
  11. Yin, Y.X.; Xin, S.; Guo, Y.G.; Wan, L.J. Lithium-sulfur batteries: Electrochemistry, materials, and prospects. Angew. Chem. Int. Ed. 2013, 52, 13186–13200. [Google Scholar] [CrossRef] [PubMed]
  12. Xu, W.; Wang, J.; Ding, F.; Chen, X.; Nasybulin, E.; Zhang, Y.; Zhang, J.G. Lithium metal anodes for rechargeable batteries. Energy Environ. Sci. 2014, 7, 513–537. [Google Scholar] [CrossRef]
  13. Sealy, C. Lithium-ion batteries charge to the next level. Mater. Today 2018, 21, 231–240. [Google Scholar] [CrossRef]
  14. Ma, D.; Cao, Z.; Hu, A. Si-based anode materials for li-ion batteries: A mini review. Nano-Micro Lett. 2014, 6, 347–358. [Google Scholar] [CrossRef]
  15. Zuo, X.; Zhu, J.; Müller-Buschbaum, P.; Cheng, Y.J. Silicon based lithium-ion battery anodes: A chronicle perspective review. Nano Energy 2017, 31, 113–143. [Google Scholar] [CrossRef] [Green Version]
  16. FiveVB. FiveVB. 2015. Available online: http://www.fivevb.eu (accessed on 20 July 2018).
  17. Marinaro, M.; Yoon, D.; Gabrielli, G.; Stegmaier, P.; Figgemeier, E.; Spurk, P.C.; Nelis, D.; Schmidt, G.; Chauveau, J.; Axmann, P.; et al. High performance 1.2 Ah Si-alloy/Graphite|LiNi0.5Mn0.3Co0.2O2prototype Li-ion battery. J. Power Sources 2017, 357, 188–197. [Google Scholar] [CrossRef]
  18. Mobi. Battery Innovation Centre Infrastructure. 2 Battery Testers at Cell Level (PEC—SBT 0550). Available online: http://mobi.vub.ac.be/mobi/research-infra/battery-innovation-centre-infrastructure (accessed on 15 July 2018).
  19. International Organization for Standardization. ISO 12405-2: Lectrically Propelled Road Vehicles—Test Specification for Lithium-Ion Traction Battery Packs and Systems—Part 2: High-Energy Applications. Available online: https://www.iso.org/standard/55854.html (accessed on 2 August 2018).
  20. International Electrotechnical Commission. IEC 62660-1: Secondary Lithium-Ion Cells for the Propulsion of Electric Road Vehicles—Part 1: Performance Testing. Available online: https://webstore.iec.ch/publication/7331 (accessed on 2 August 2018).
  21. Baccouche, I.; Jemmali, S.; Manai, B.; Omar, N.; Essoukri Ben Amara, N. Improved OCV model of a Li-ion NMC battery for online SOC estimation using the extended Kalman filter. Energies 2017, 10, 764. [Google Scholar] [CrossRef]
  22. Somakettarin, N.; Funaki, T. Study on Factors for Accurate Open Circuit Voltage Characterizations in Mn-Type Li-Ion Batteries. Batteries 2017, 3, 8. [Google Scholar] [CrossRef]
  23. Farmann, A.; Sauer, D.U. A study on the dependency of the open-circuit voltage on temperature and actual aging state of lithium-ion batteries. J. Power Sources 2017, 347, 1–13. [Google Scholar] [CrossRef]
  24. Nikolian, A.; Firouz, Y.; Gopalakrishnan, R.; Timmermans, J.M.; Omar, N.; van den Bossche, P.; van Mierlo, J. Lithium ion batteries-development of advanced electrical equivalent circuit models for nickel manganese cobalt lithium-ion. Energies 2016, 9, 360. [Google Scholar] [CrossRef]
  25. He, H.; Xiong, R.; Fan, J. Evaluation of lithium-ion battery equivalent circuit models for state of charge estimation by an experimental approach. Energies 2011, 4, 582–598. [Google Scholar] [CrossRef]
  26. Pfrang, A.; Kersy, A.; Kriston, A.; Sauer, D.U.; Rahe, C.; Käbitz, S.; Figgemeier, E. Long-Term Cycling Induced Jelly Roll Deformation in Commercial 18650 Cells. J. Power Sources 2018, 392, 168–175. [Google Scholar] [CrossRef]
  27. Waldmann, T.; Gorse, S.; Samtleben, T.; Schneider, G.; Knoblauch, V.; Wohlfahrt-Mehrens, M. A Mechanical Aging Mechanism in Lithium-Ion Batteries. J. Electrochem. Soc. 2014, 161, A1742–A1747. [Google Scholar] [CrossRef]
  28. Bach, T.C.; Schuster, S.F.; Fleder, E.; Müller, J.; Brand, M.J.; Lorrmann, H.; Jossen, A.; Sextl, G. Nonlinear aging of cylindrical lithium-ion cells linked to heterogeneous compression. J. Energy Storage 2016, 5, 212–223. [Google Scholar] [CrossRef]
  29. Lindgren, F.; Xu, C.; Niedzicki, L.; Marcinek, M.; Gustafsson, T.; Björefors, F.; Edström, K.; Younesi, R. SEI Formation and Interfacial Stability of a Si Electrode in a LiTDI-Salt Based Electrolyte with FEC and VC Additives for Li-Ion Batteries. ACS Appl. Mater. Interfaces 2016, 8, 15758–15766. [Google Scholar] [CrossRef] [PubMed]
  30. Lux, S.F.; Chevalier, J.; Lucas, I.T.; Kostecki, R. HF Formation in LiPF6-Based Organic Carbonate Electrolytes. ECS Electrochem. Lett. 2013, 2, A121–A123. [Google Scholar] [CrossRef]
  31. Hammami, A.; Raymond, N.; Armand, M. Runaway risk of forming toxic compounds. Nature 2003, 301, 1063–1063. [Google Scholar] [CrossRef] [PubMed]
  32. Lux, S.F.; Lucas, I.T.; Pollak, E.; Passerini, S.; Winter, M.; Kostecki, R. The mechanism of HF formation in LiPF6 based organic carbonate electrolytes. Electrochem. Commun. 2012, 14, 47–50. [Google Scholar] [CrossRef] [Green Version]
  33. Schroder, K.W.; Dylla, A.G.; Harris, S.J.; Webb, L.J.; Stevenson, K.J. Role of surface oxides in the formation of solid-electrolyte interphases at silicon electrodes for lithium-ion batteries. ACS Appl. Mater. Interfaces 2014, 6, 21510–21524. [Google Scholar] [CrossRef] [PubMed]
  34. Xu, C.; Lindgren, F.; Philippe, B.; Gorgoi, M.; Björefors, F.; Edström, K.; Gustafsson, T. Improved performance of the silicon anode for li-ion batteries: Understanding the surface modification mechanism of fluoroethylene carbonate as an effective electrolyte additive. Chem. Mater. 2015, 27, 2591–2599. [Google Scholar] [CrossRef]
  35. Leung, K.; Rempe, S.B.; Foster, M.E.; Ma, Y.; Martinez del la Hoz, J.M.; Sai, N.; Balbuena, P.B. Modeling Electrochemical Decomposition of Fluoroethylene Carbonate on Silicon Anode Surfaces in Lithium Ion Batteries. J. Electrochem. Soc. 2013, 161, A213–A221. [Google Scholar] [CrossRef] [Green Version]
  36. Jung, R.; Metzger, M.; Haering, D.; Solchenbach, S.; Marino, C.; Tsiouvaras, N.; Stinner, C.; Gasteiger, H.A. Consumption of fluoroethylene Carbonate (FEC) on Si-C Composite Electrodes for Li-Ion Batteries. J. Electrochem. Soc. 2016, 163, A1705–A1716. [Google Scholar] [CrossRef]
  37. Zhang, X.Q.; Cheng, X.B.; Chen, X.; Yan, C.; Zhang, Q. Fluoroethylene Carbonate Additives to Render Uniform Li Deposits in Lithium Metal Batteries. Adv. Funct. Mater. 2017, 27, 1605989. [Google Scholar] [CrossRef]
  38. Sethuraman, V.A.; Chon, M.J.; Shimshak, M.; Srinivasan, V.; Guduru, P.R. In situ measurements of stress evolution in silicon thin films during electrochemical litiation and delithiation. J. Power Sources 2010, 195, 5062–5066. [Google Scholar] [CrossRef]
Figure 1. Preconditioning test: voltage, current, and discharge capacity evolution at 25 C.
Wevj 09 00043 g001
Figure 2. Quasi-open-circuit voltage test: description of the approximated voltage behavior over the state of charge at 25 C.
Wevj 09 00043 g002
Figure 3. Capacity test: Discharge capacity at various C-rates (C/5, C/3, 1C, and 1.5C) at 25 C.
Wevj 09 00043 g003
Figure 4. Hybrid pulse power characterization equivalent circuit scheme.
Wevj 09 00043 g004
Figure 5. Hybrid pulse power characterization: Ohmic resistance over state of charge, measured at various C-rates (C/5, C/3, 1C, 1.5C, and 2C) at 25 C.
Wevj 09 00043 g005
Figure 6. X-ray computed tomography cross-section of a G1C pouch cell after formation but before cycling. The magnified view was taken at high resolution (voxel size of 8.5 μ m). The image on the right indicates the height of the cross-section (bottom of the cell).
Wevj 09 00043 g006
Figure 7. X-ray computed tomography cross-sections at the top, middle, and bottom of the pouch cell after beginning of life tests, which were performed without compression.
Wevj 09 00043 g007
Figure 8. Proposed decomposition mechanism of fluoroethylene carbonate (FEC) adapted from [36].
Wevj 09 00043 g008
Figure 9. Possible mechanisms of gas formation and deformation.
Wevj 09 00043 g009
Figure 10. Comparison of the discharge capacity of the cell with and without the application of external pressure. The discharge capacity at various C-rates (C/5, C/3, 1C, and 1.5C) at 25 C is shown.
Wevj 09 00043 g010
Table 1. Electrode composition, loading, and density.
AnodeCathode
Electrode composition55% Si alloy (3M)93% NMC 5:3:2
33% SMG-A34% Carbon
10% LiPAA3% HSV 900+ ADX 161 (Arkema)
2% Super PLi
Loading (mg/cm 2 )6.517.5
Electrode density (g/cc)1.73.0

