Project Report

Factors Influencing Energy Consumption and Cost-Competiveness of Plug-in Electric Vehicles

1
Argonne National Laboratory, 9700 Cass Avenue, Lemont, IL 60439, USA
2
Institute of Vehicle Concepts, DLR, Pfaffenwaldring 38-40, 70569 Stuttgart, Germany
*
Author to whom correspondence should be addressed.
World Electr. Veh. J. 2018, 9(2), 23; https://doi.org/10.3390/wevj9020023
Submission received: 24 May 2018 / Revised: 27 June 2018 / Accepted: 29 June 2018 / Published: 11 July 2018

Abstract

:
The widespread adoption of plug-in electric vehicles (PEVs) will depend on public appreciation of the potential savings in ownership costs that PEVs offer over conventional, internal combustion energy vehicles (ICEVs) and hybrid electric vehicles (HEVs), including fuel savings. This study compares the energy consumption and estimated ownership costs of various technologies for multiple drive cycles in the United States and the European Union; identifies and quantifies the impacts of the main parameters influencing the ownership costs of PEVs in comparison with other powertrains for different timeframes, vehicle classes, and technologies; and assesses under what combinations of parameters the cost of PEVs can be competitive with other powertrains.

1. Introduction

The cost competitiveness of different drivetrains depends on relative costs of vehicles, fuel, and other cost components. Here, we consider costs from the perspective of a consumer with sufficient foresight to consider relevant costs over the ownership period of the vehicle, or relevant cost of ownership (RCO), as suggested by Mock [1] and used by Redelbach et al. [2] and Rousseau et al. [3]. We examine how the RCO of PEVs (plug-in electric vehicles) compares to competing powertrains under various combinations of fuel consumption, annual driving distance, battery costs, and other factors that can vary significantly between different drivers in different countries. We examine ranges of these factors relevant to drivers in the United States and Germany using estimated future costs of vehicles and fuels.
To the extent that consumers choose vehicles on the basis of ownership costs, how fuel consumption is measured and reported are important. European and U.S. regulators have made or proposed updated fuel economy certification procedures to provide fuel economy estimates that are more representative of real world driving [4,5]. Fuel economy values reported by U.S. drivers vary over a wide range [6]. Of potentially greater significance to the consumer considering a PEV purchase are vehicle prices and energy costs over the vehicle ownership period. PEV prices are driven by component costs, in particular the cost of the battery pack, but energy costs depend on fuel price and annual driving distance. For plug-in hybrid electric vehicles (PHEVs) and extended range electric vehicles (EREVs), fuel costs also depend on the utility factor (UF)—the fraction of distance driven in charge-depleting (CD) mode—which can differ widely between drivers owing to different charging frequencies and driving distances.

2. Materials and Methods

2.1. Vehicle Attributes

To evaluate the fuel efficiency benefits of advanced vehicles, each vehicle was simulated using Autonomie [7]. Each vehicle is sized to meet the same vehicle technical specifications such as performance and grade-ability [8].
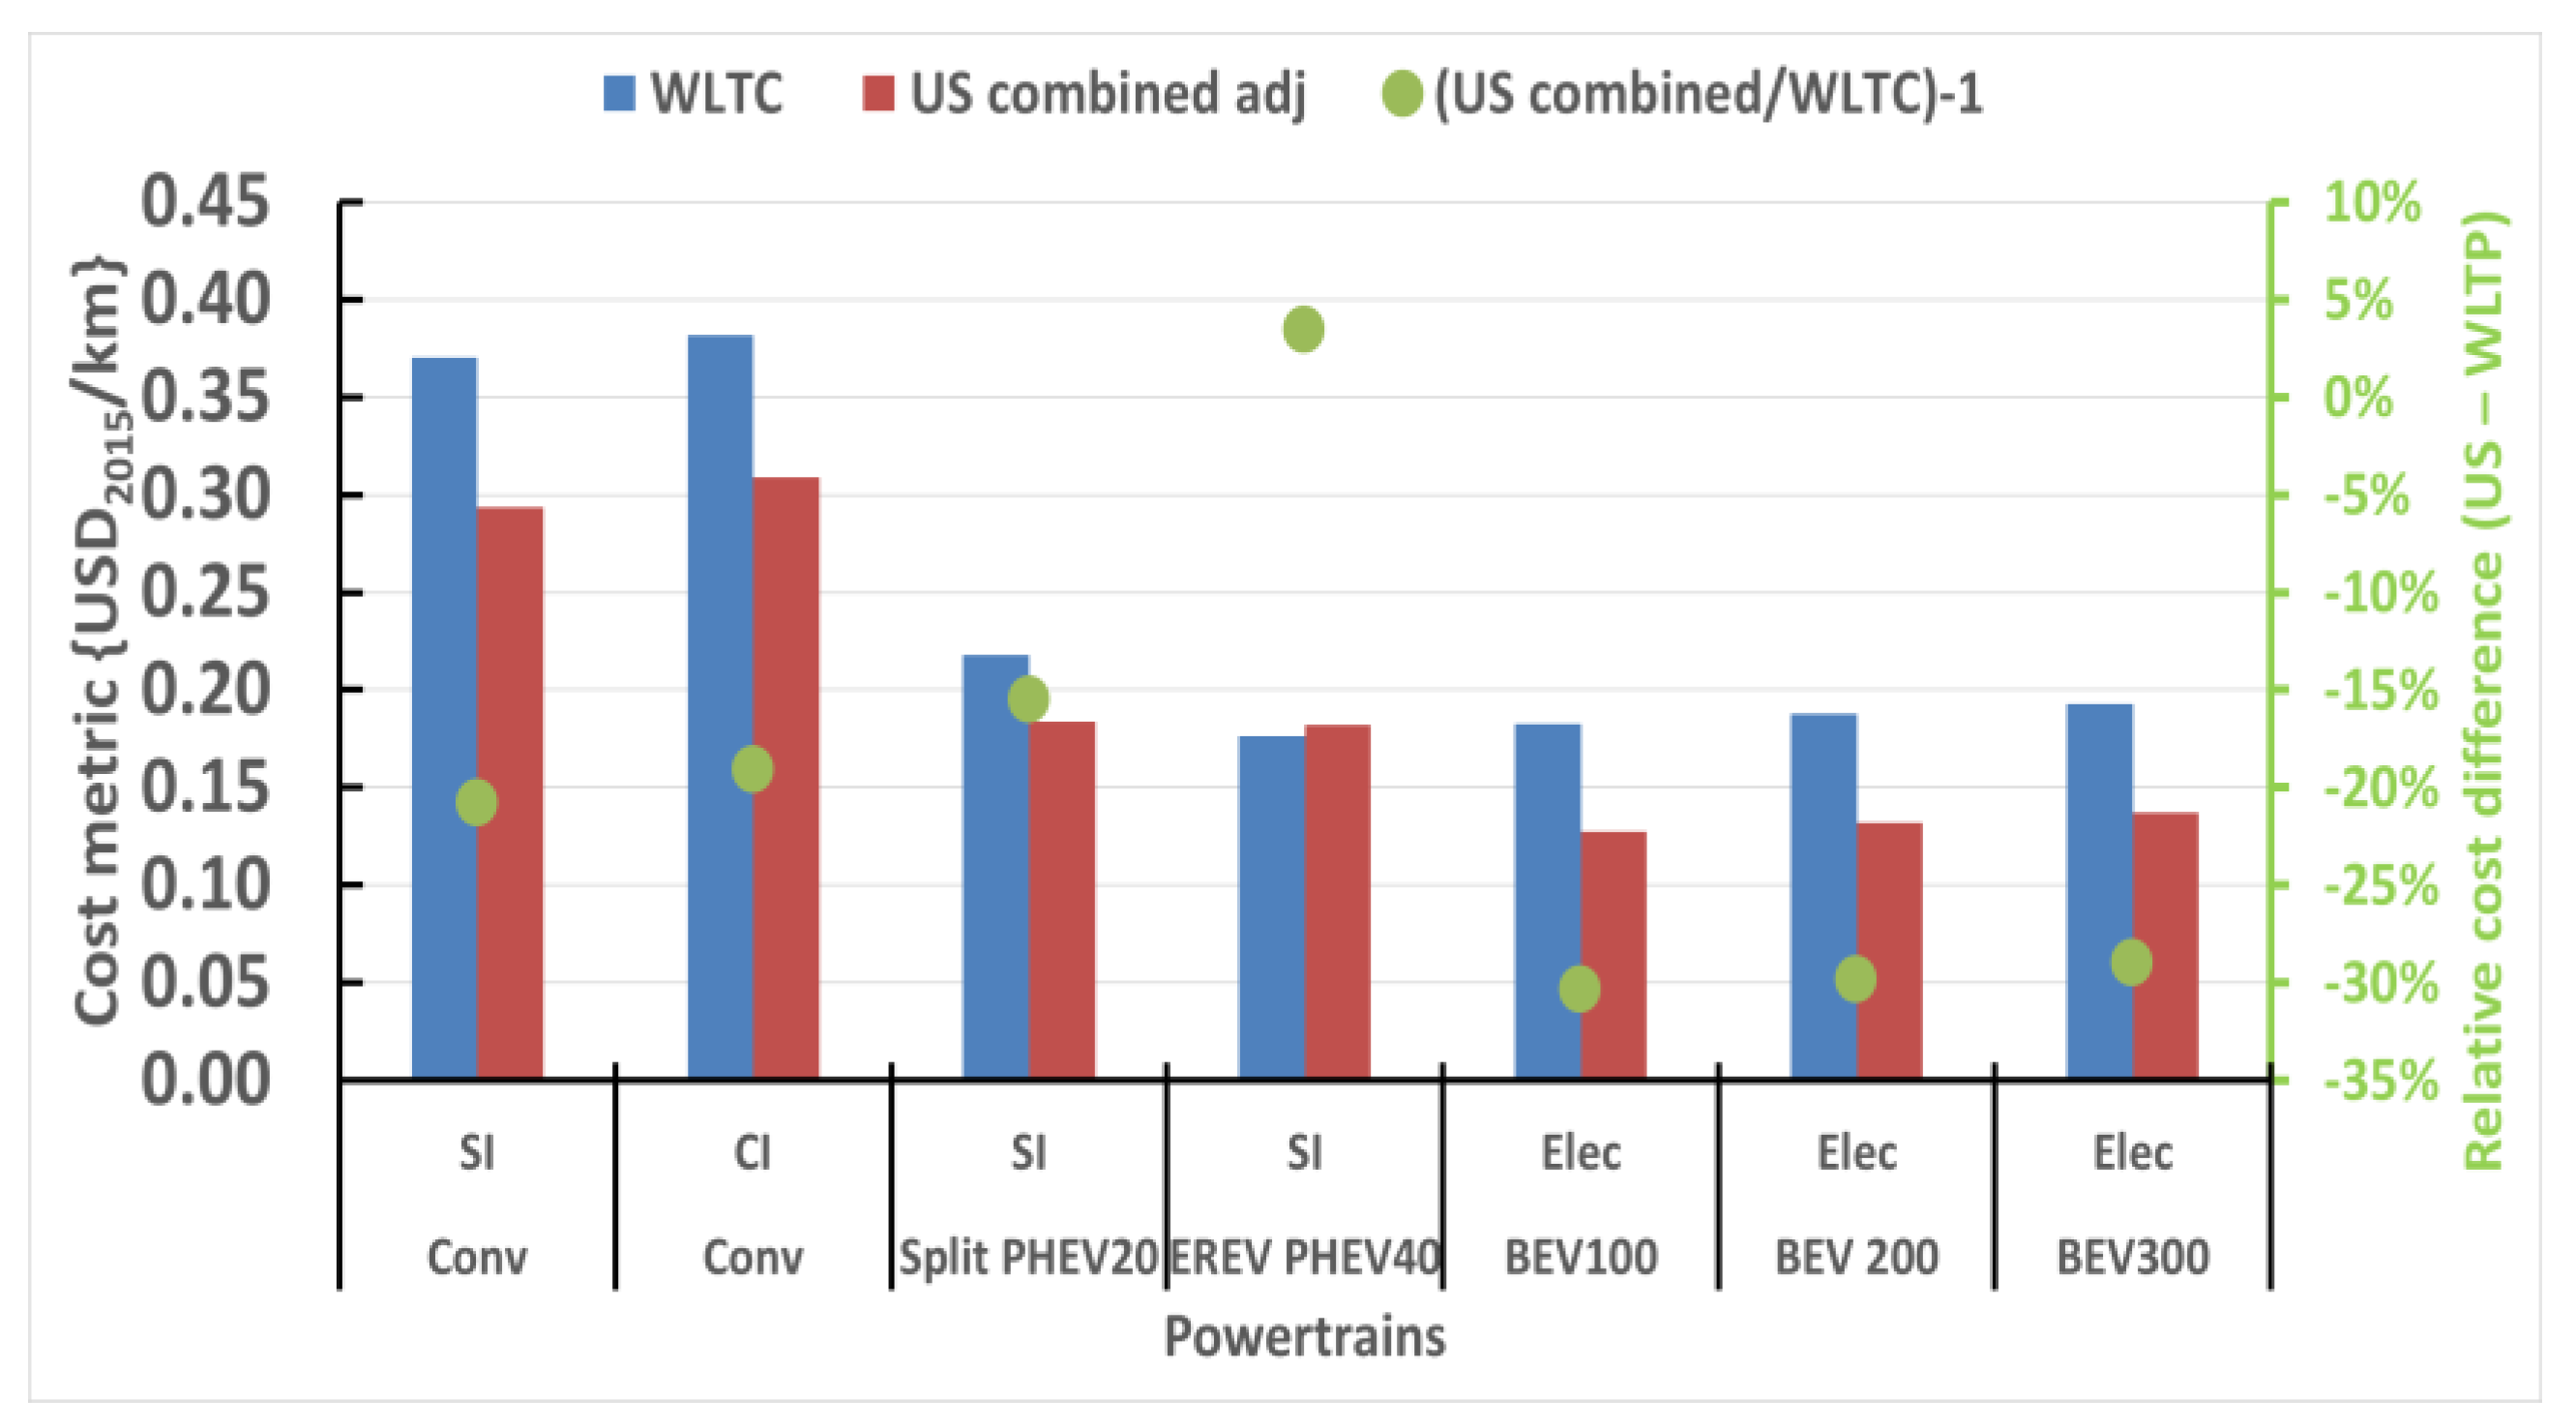
The energy efficiency was then estimated for the different vehicles over the Worldwide harmonized Light vehicles Test Cycle (WLTC) and the U.S. combined cycle. Conventional and plug-in midsize vehicles were simulated through six different timeframes (2020–2050) for gasoline and diesel fuels. The attributes of future vehicles were taken from Moawad et al. [8]. We focus in this paper only on four different powertrains (conventional; split PHEV (PHEV20); EREV (PHEV40); and battery electric vehicles (BEV100, BEV200 and BEV300)). The split PHEV was modelled with one electric motor and a power-split design, and the EREV was modelled with two electric motors and a powertrain similar to the Voltec design [9].
We assumed technology advancement based on the U.S. Department of Energy (DOE) Vehicle Technology Office research and development goals. Further details on the simulations can be found in Moawad et al. [8].
The above vehicles were simulated in Autonomie under the Worldwide harmonized Light vehicles Test Procedure (WLTP), U.S. Urban Dynamometer Driving Schedule (UDDS), and U.S. Highway Fuel Economy test (HWFET) drive cycles, using the same road load coefficients for all cycles. Adjustments were applied to the UDDS and HWEFT drive cycle fuel consumption values in accordance with the U.S. current fuel economy label procedures [4].
To estimate the UF (the fraction of distance driven in CD mode), the daily driving distance was assumed to follow a gamma distribution, which was found to fit detailed driving records from Seattle by Lin et al. [10]. A mean of 61.8 km/day and a mode of 20.6 km/day were assumed for U.S. drivers, based on an analysis of the U.S. 2009 National Household Travel Survey by Krumm [11]. This distribution gave a dependence of UF on the PHEV CD range that approximated the CD range dependence used in the standard practice recommended by SAE International for PHEVs that are charged once per day [12]. This distribution may not be accurate for other populations [13], but it captures the qualitative shape of realistic driving distributions and provides a convenient way to approximate how PHEV UF depends on daily average driving distance [14]. The mean distance was varied to account for different annual driving distances, and the mode was assumed to vary in proportion to the mean. A constant value of 300 driving days per year was assumed. PHEV drivers were assumed to charge once per day.
We estimated the ownership costs under different assumptions to represent U.S. and German consumers. Combinations of the following parameters were evaluated that make PEVs cost-competitive with competing (conventionally powered) vehicles:
  • The fuel and electricity consumption as estimated by WLTP and U.S. adjusted drive cycles,
  • The future vehicle prices, estimated for year 2025,
  • A range of potential future battery cost estimates,
  • The fuel prices (reflecting ranges of possible prices in the U.S. and Germany),
  • The annual driving distance (ranges representative of U.S. and German drivers).

2.2. Cost Calculations

The vehicle costs are calculated from the characteristics of the components (power, energy, weight, etc.) [8]. Both the vehicle and fuel cost, based on the energy efficiency values, are then used to calculate ownership cost. Maintenance costs for year 2025 were assumed to be 0.05 (U.S. 2015 dollars per kilometer (USD 2015/km) for all powertrain types. This value was in the middle of the range suggested by Rousseau et al. [3].
The assumptions shown in Table 1 are used to represent the near-term (year 2025) average prices of energy in Europe (Germany) and the United States and were assumed to be constant in future years. Constant electricity prices were assumed, neglecting alternative rate structures such as time-of-use, tiered rates, or special rates for PEVs.
Energy prices and average annual distance driven in the United States were based on the U.S. Energy Information Agency’s Annual Energy Outlook (AEO) for 2017 reference case. Energy prices for Germany were estimated for the year 2025 based on the projected price of crude oil (Brent Spot price of 85.03 USD 2015/barrel). High and low energy prices were based on AEO 2017 High Oil Price and Low Oil Price cases. Annual distance driven in new light duty vehicles (LDVs) by U.S. drivers was taken from AEO 2016 reference case. The mileage for German drivers is taken from the latest national transport survey [15].
Cost models were used to estimate manufacturing costs for major vehicle components and subassemblies, which were then summed to give the total manufacturing cost of each vehicle in year 2025 [8]. These manufacturing cost estimates were assumed to be the same for both American and European automakers (Table 2). Cost model parameters were assigned values based on input from U.S. DOE vehicle technology managers and industry experts who provided a range of values from highly optimistic (high case) to pessimistic (low case).
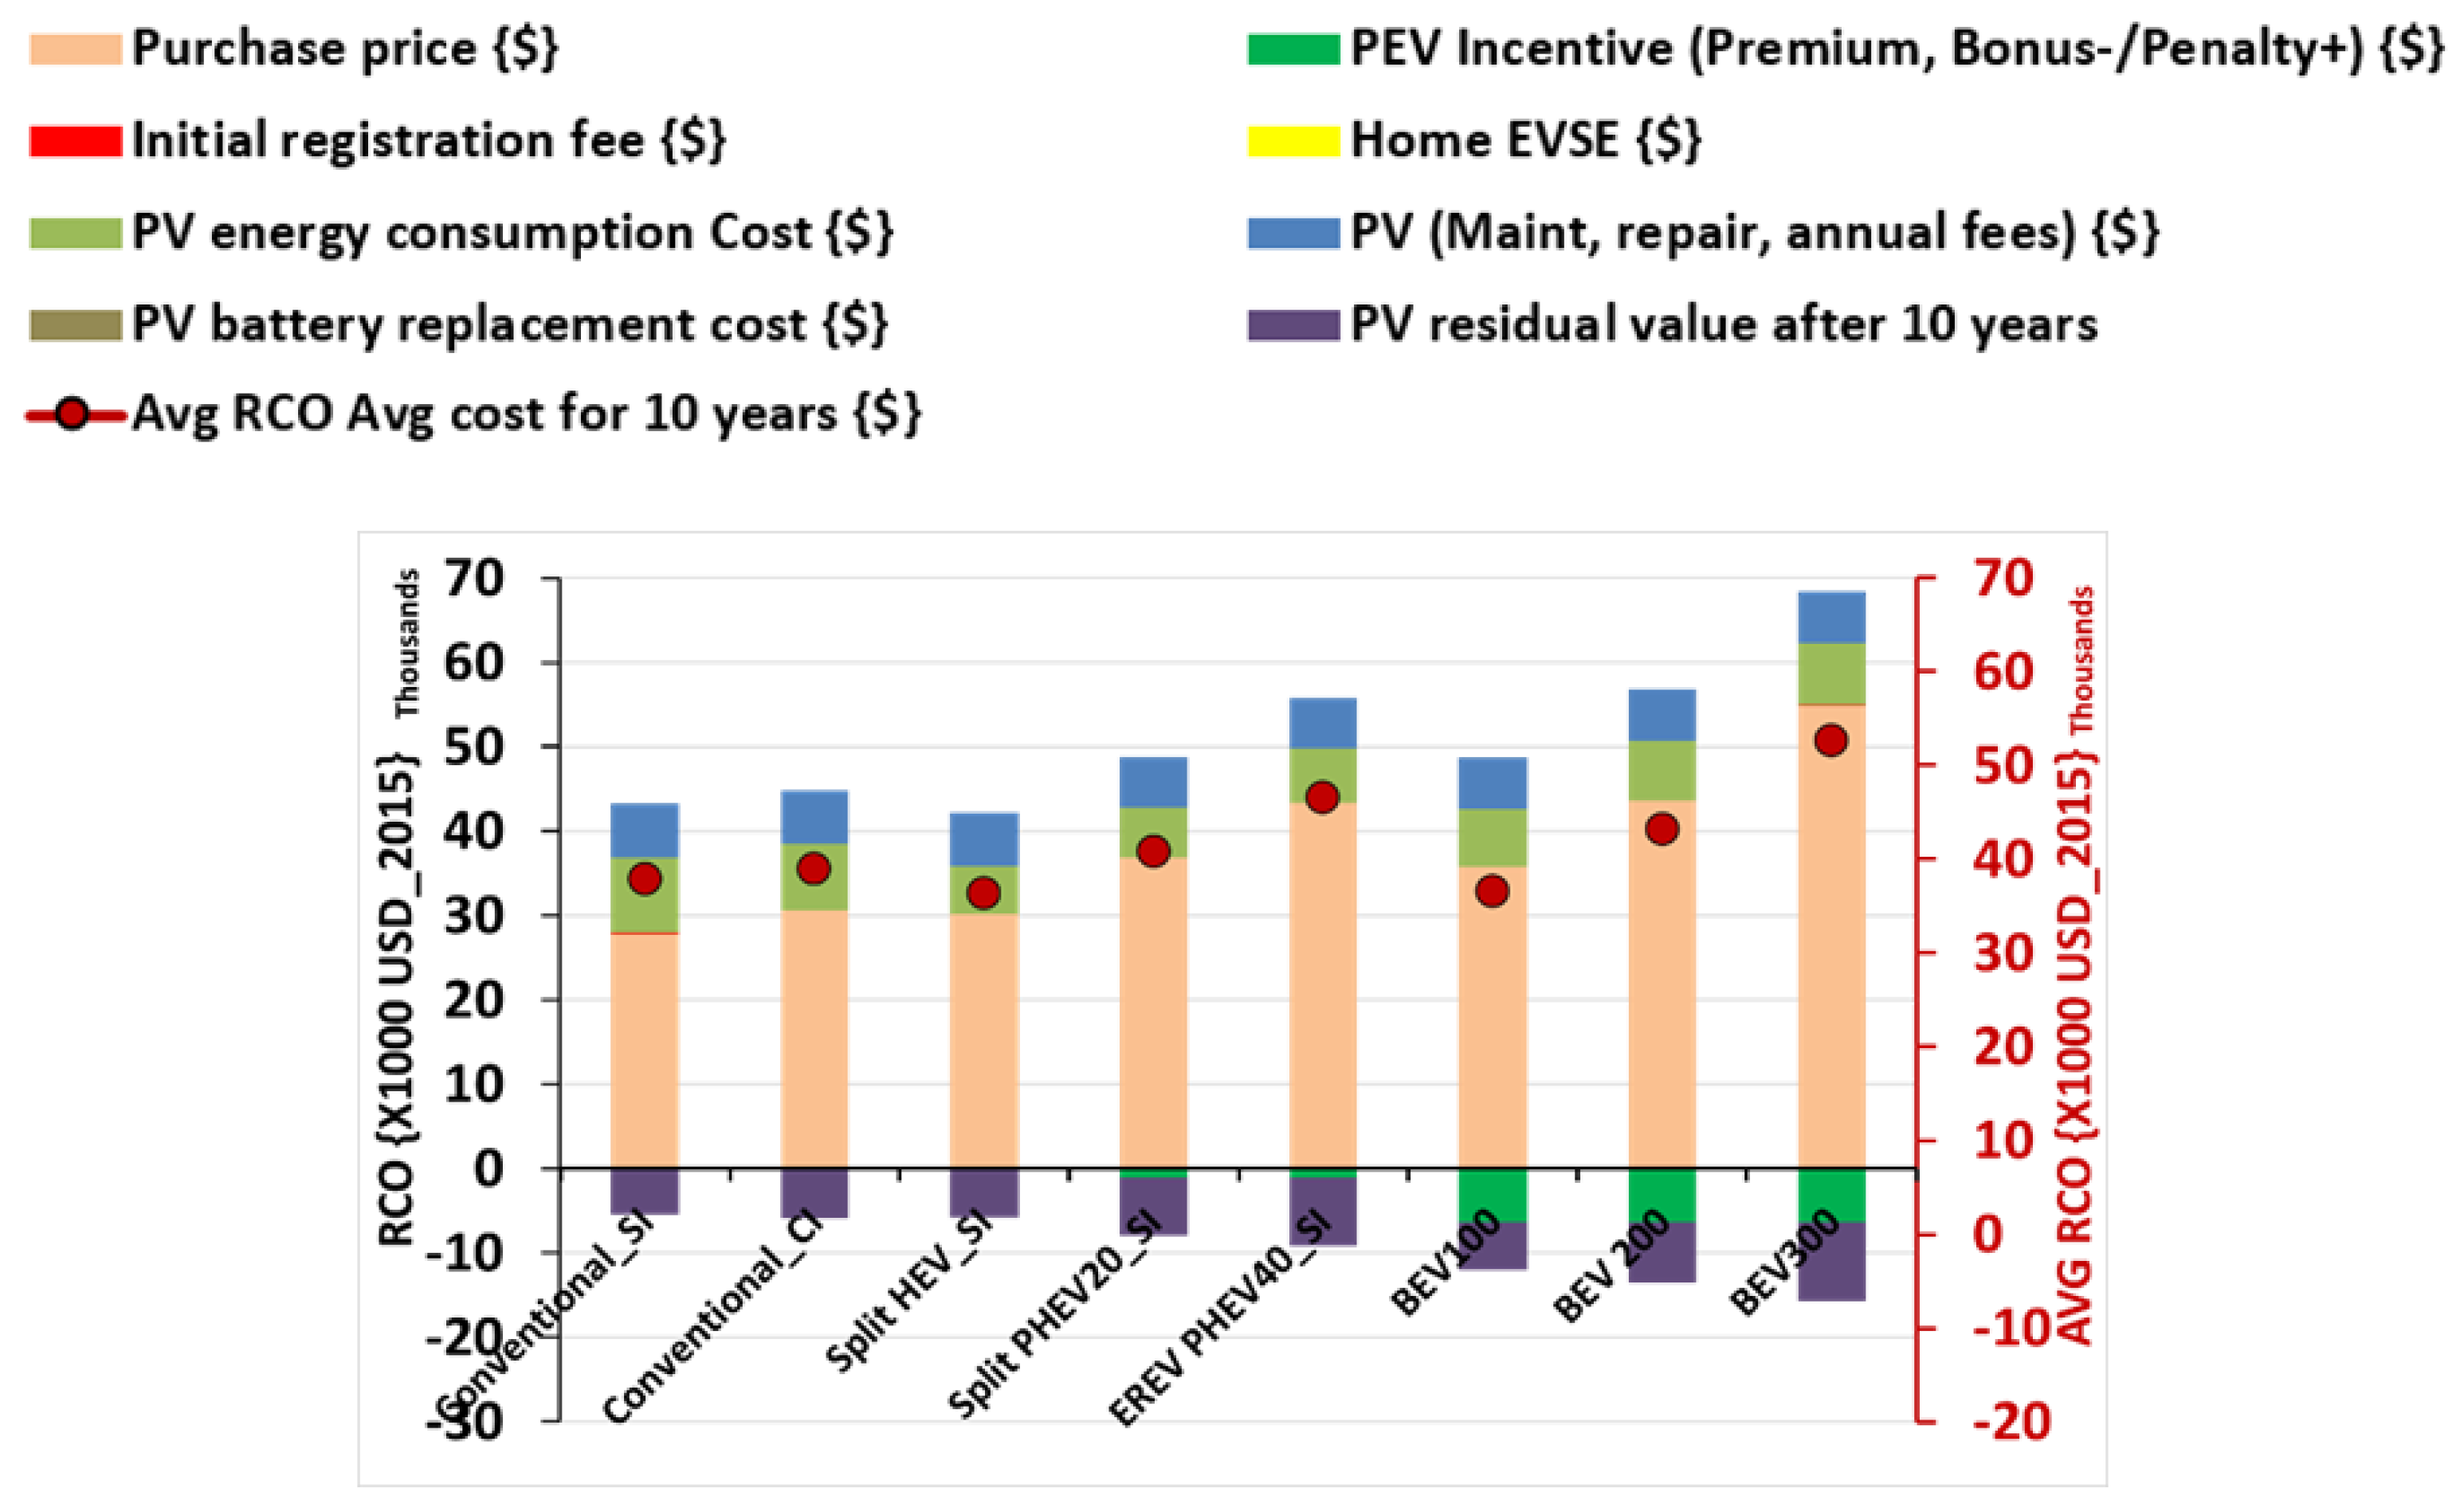
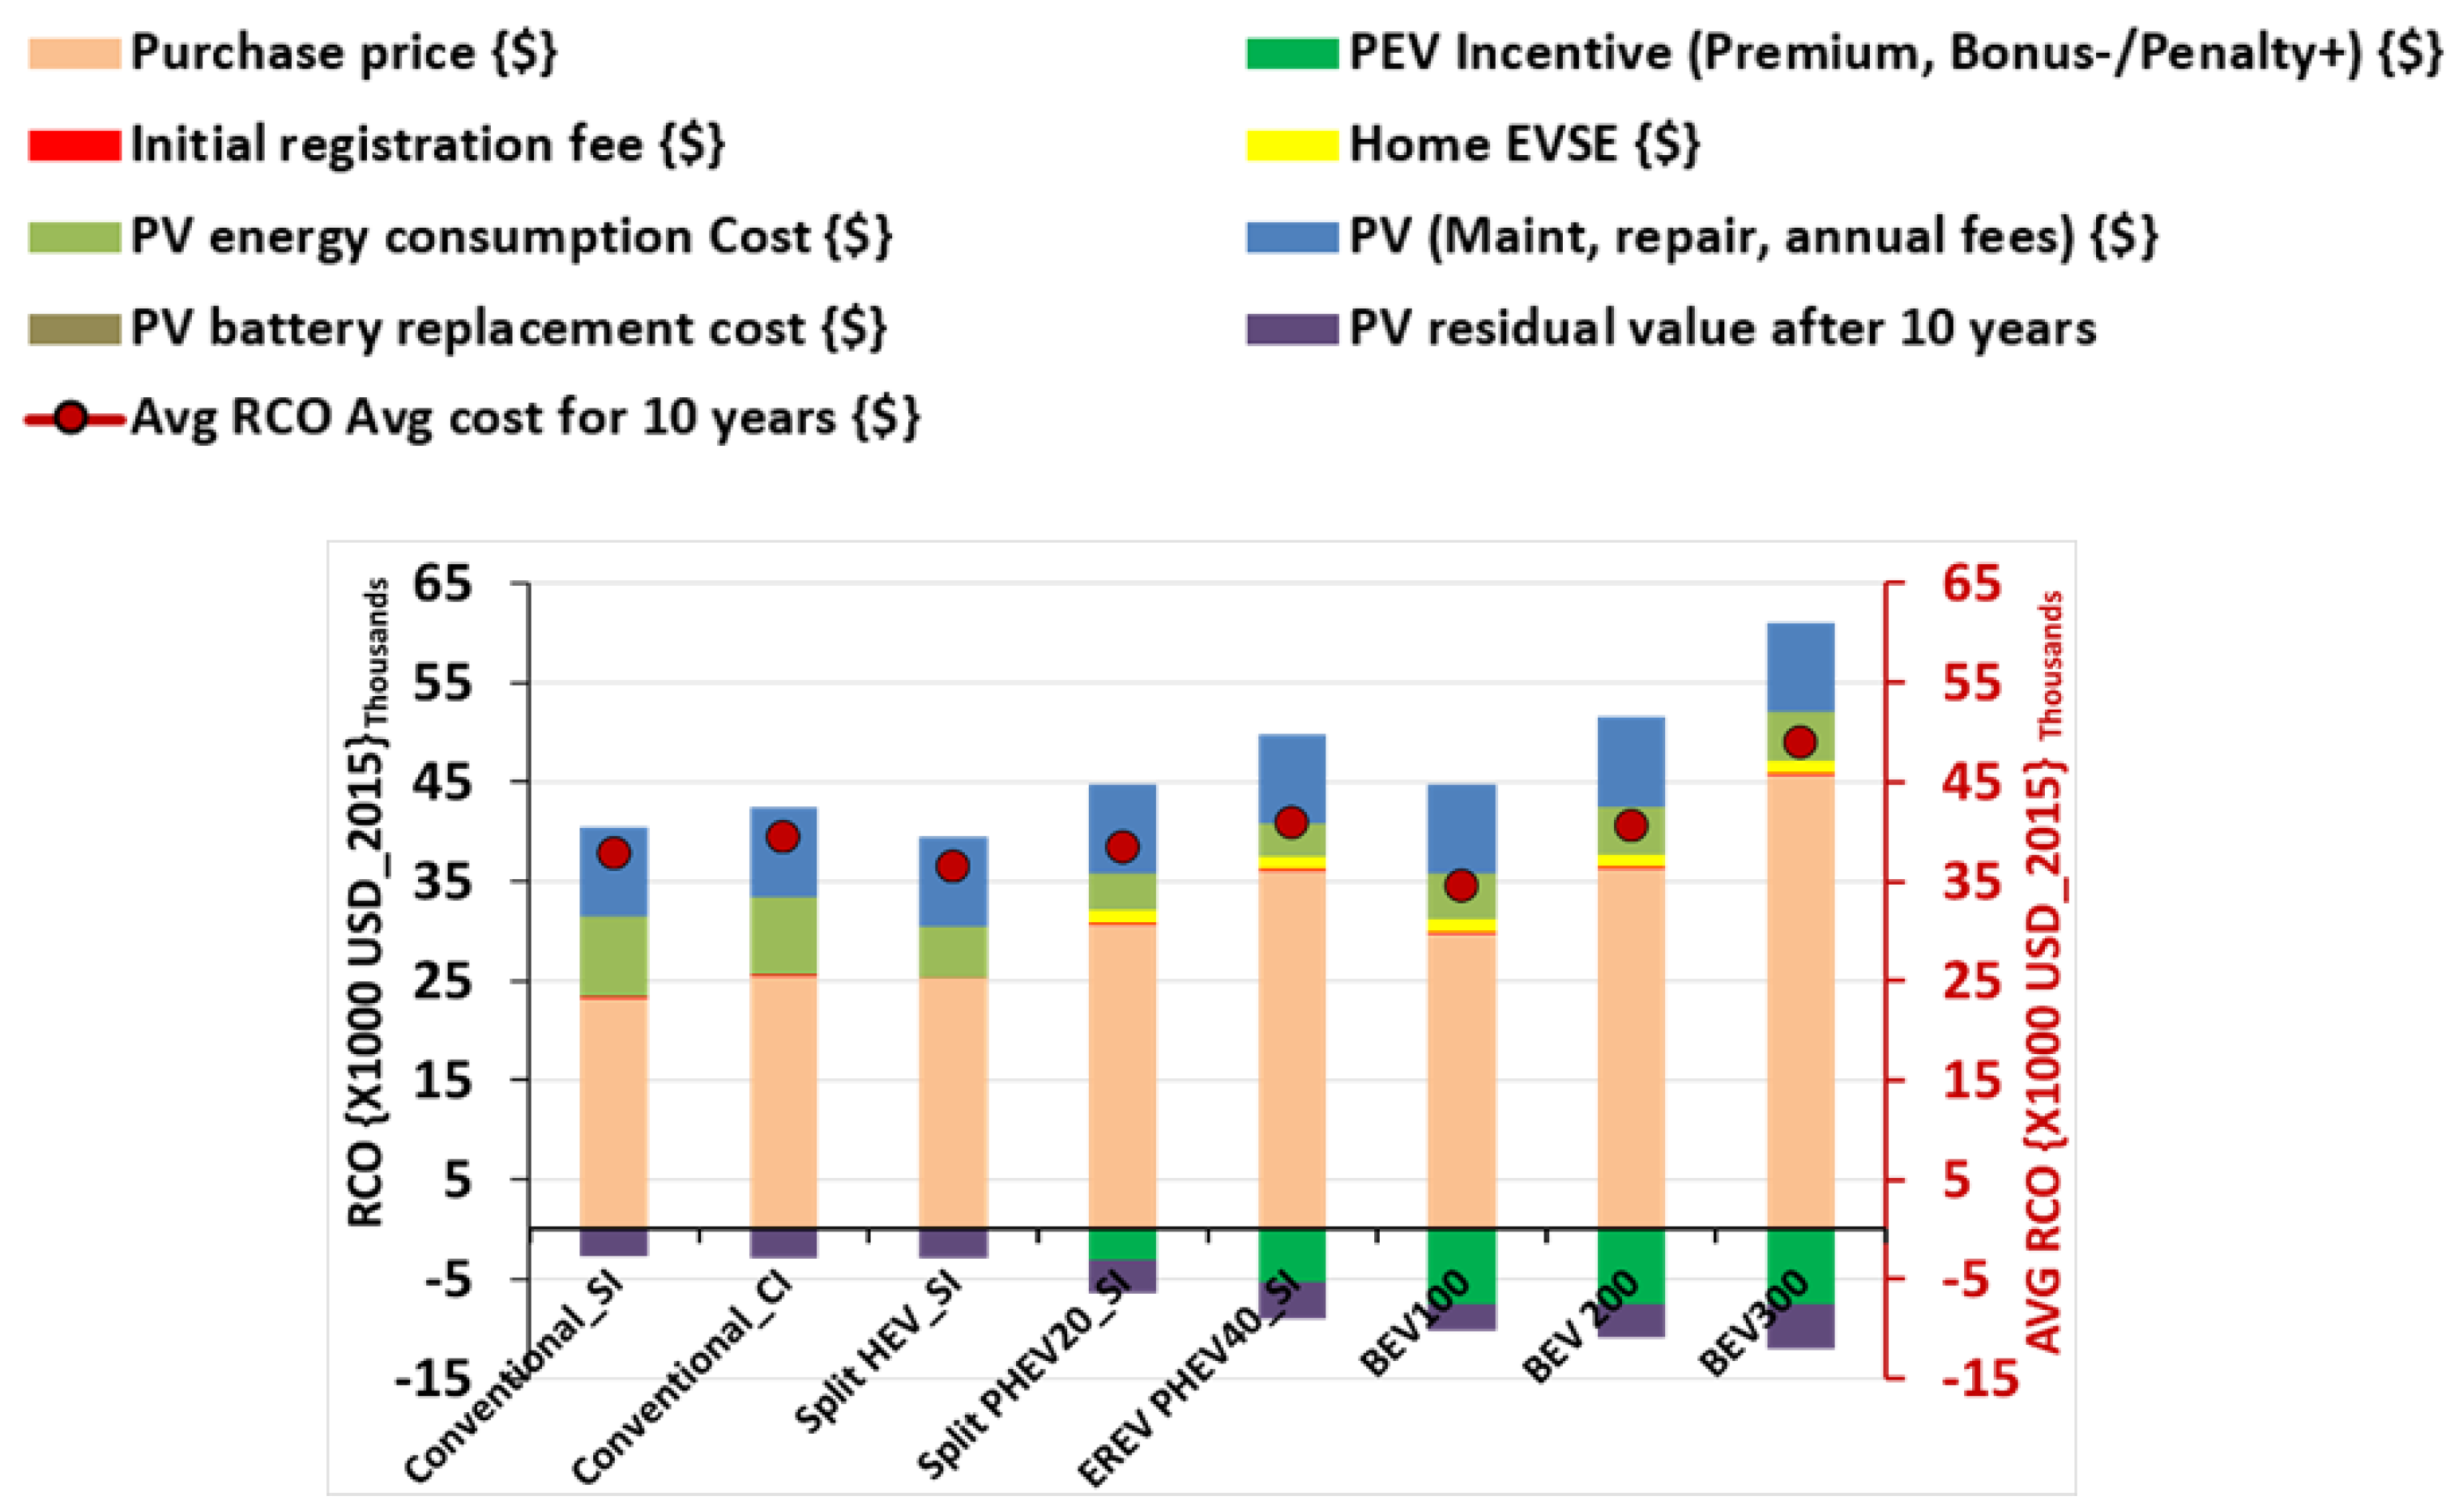
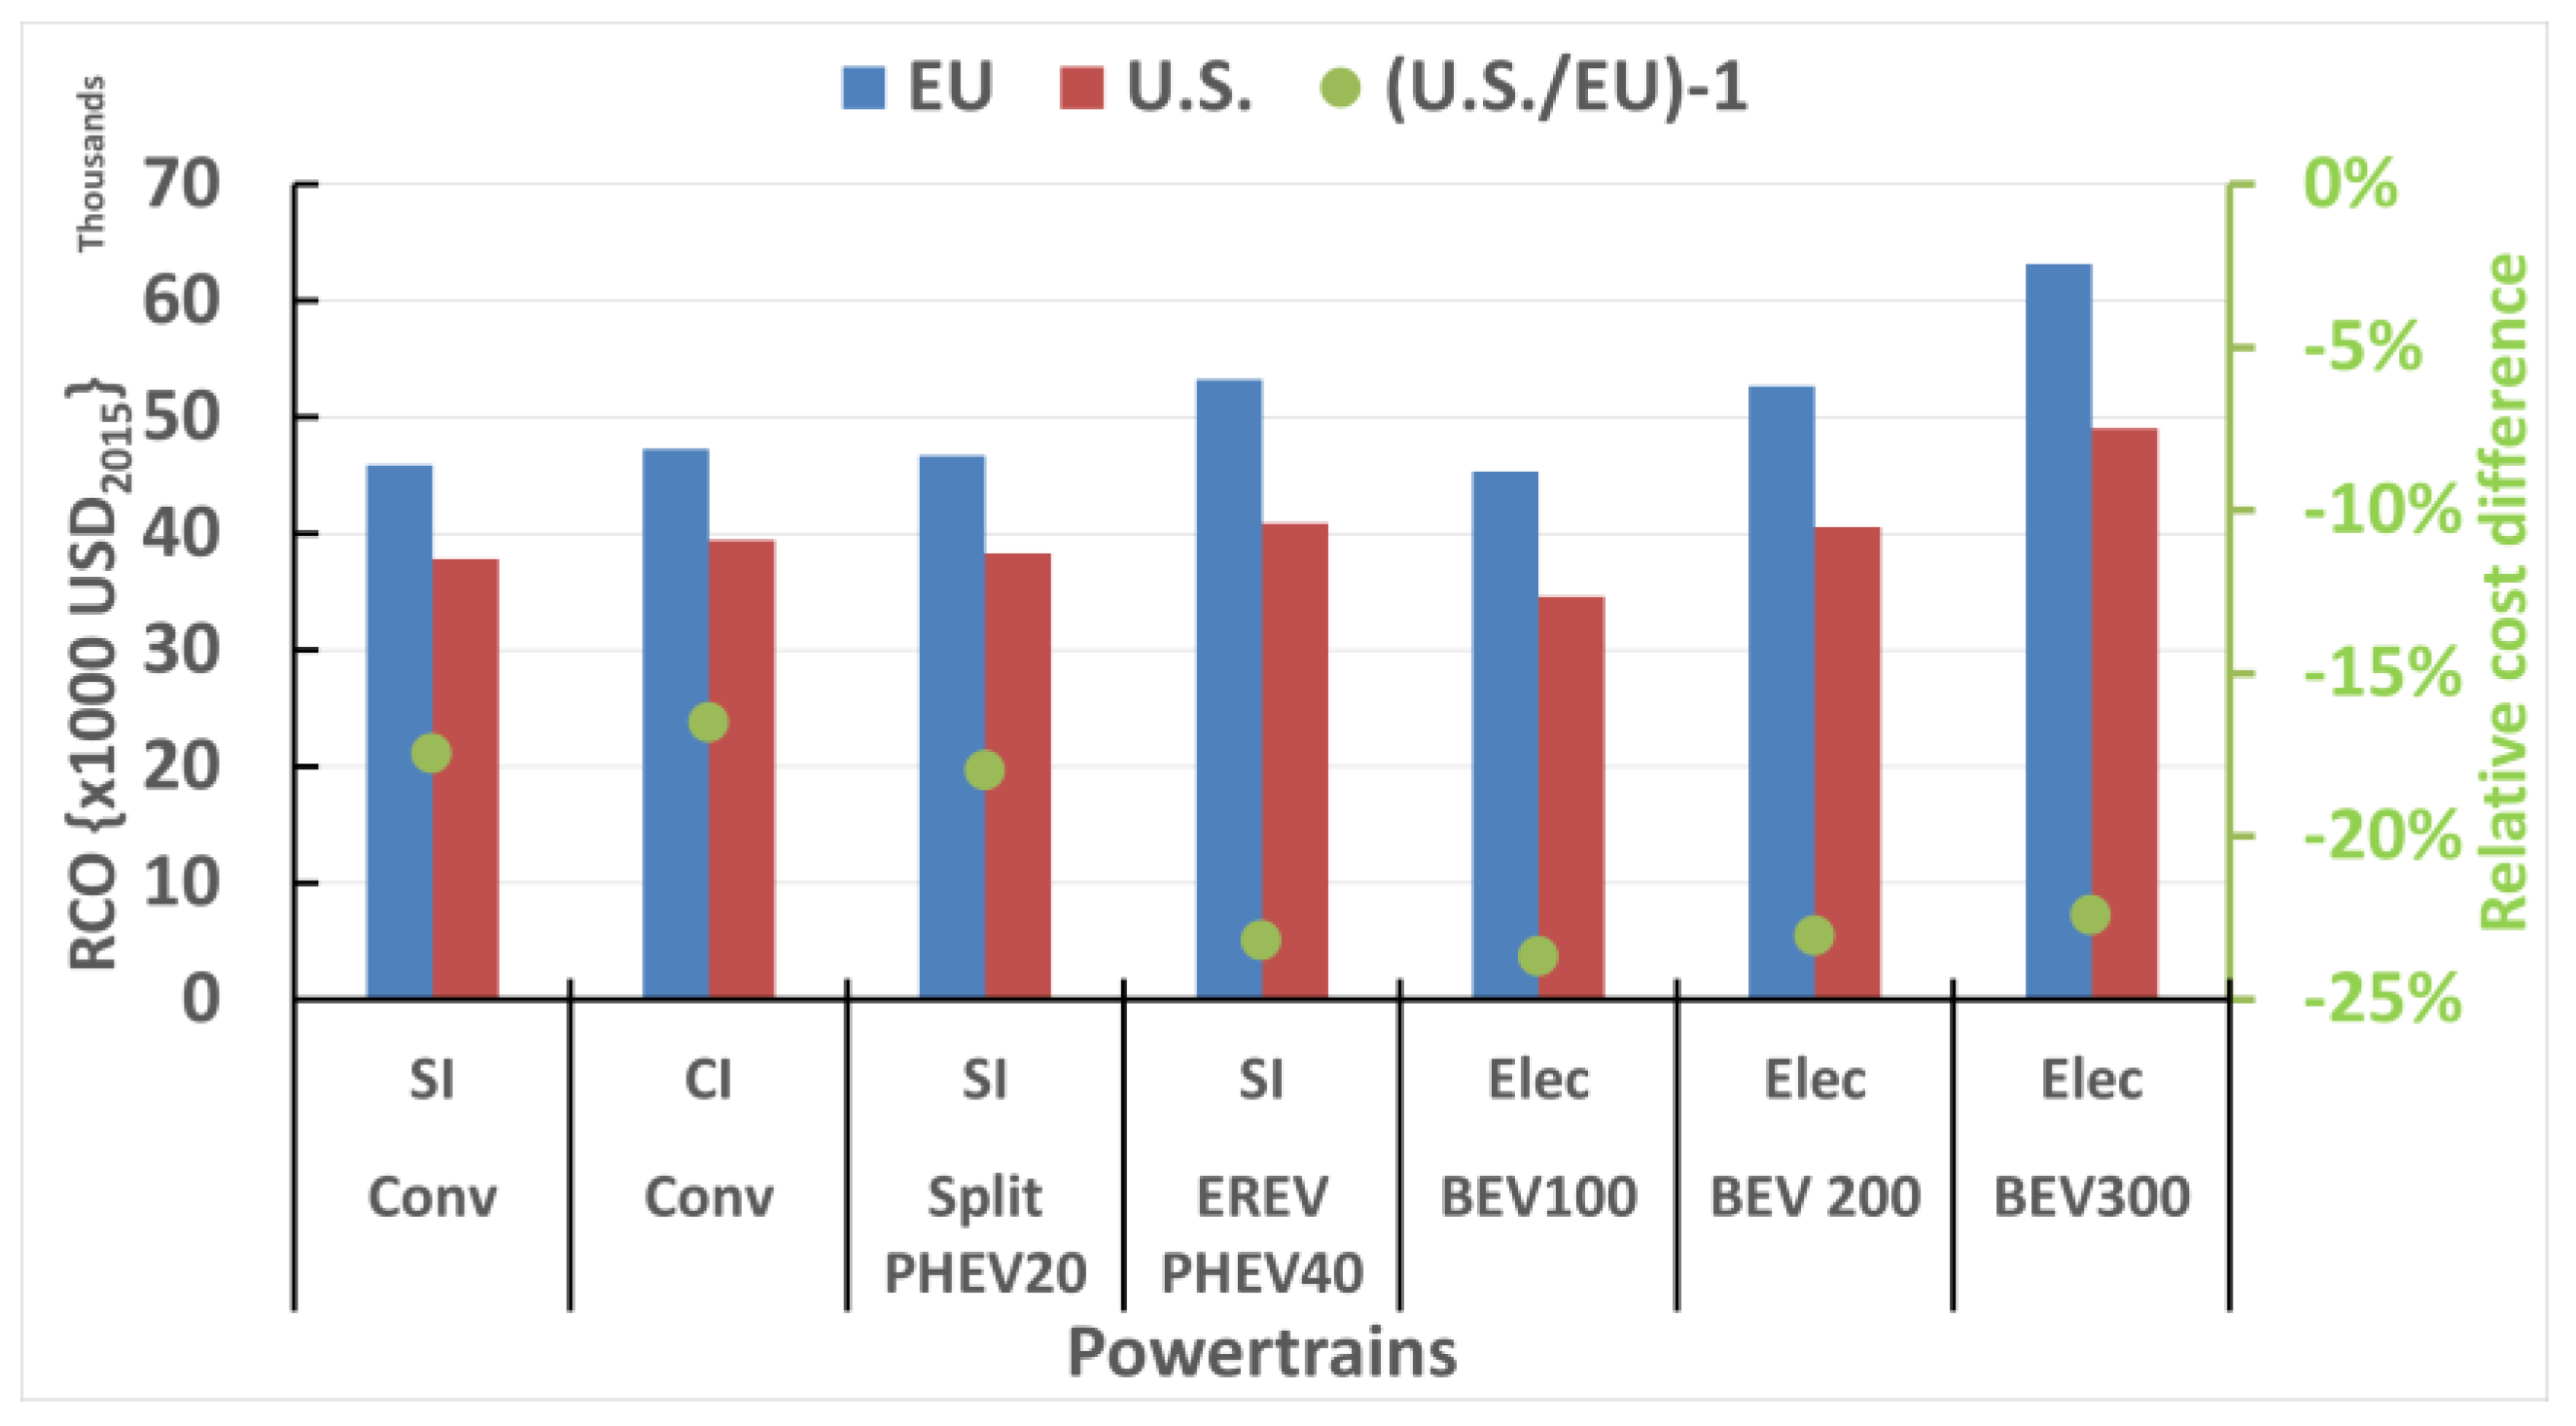
The RCO was calculated from vehicle prices and other costs [3]:
C R C O = C I n v e s t + t N ( ( C E n e r g y , t + C M a i n , t + C F e e s , t ( 1 + r ) t ) V R e s ( 1 + r ) N ,
V r e s = C I n v e s t ( 1 15 × 10 7 × N × V K T 0.476 ) ,
where
  • N = ownership period (years),
  • r = discount rate (%),
  • VKT = annual vehicle kilometers travelled.
Investment costs include the vehicle manufacturing direct costs, manufacturer mark-up (accounted for by a retail price equivalent (RPE) factor), sales tax or value-added tax, both applied to the retail price, incentive (or bonus/malus premium/charge), and initial registration/licensing fees or taxes. For the BEV in the United States, the cost of home electric vehicle service equipment (EVSE) is also included in the investment cost. Given the capacity of BEVs, charging times using only a Level 1 charger do not meet the requirements of most consumers: a recent survey of California drivers found that only 12% of Nissan Leaf owners did not have Level 2 EVSE at home [16]. Because of the higher voltage level (240 V) in Europe, EVSE costs are not considered for Germany.
Residual values after a service time of 10 years were calculated using regression equations developed by Pröpfe et al. [17] for each powertrain type. These equations were developed from European vehicle sales data and may not accurately model resale values in the United States. Resale values are uncertain, particularly for PEVs, since the used PEV market is very immature. Residual values were estimated as a fraction of the total investment cost rather than purchase price, since the investment cost was assumed to approximate more closely the transaction cost as it includes incentives and fees, and since evidence suggests that incentives decrease residual values [18]. A residual value of zero was assumed after a service time of twelve years or a total distance travelled higher than 338,000 km:
C I n v e s t = ( C M a n u f ) ( F R P E ) ( 1 + T a x S a l e s ) ( C I n c e n t i v e s + C F e e ,   i n i t + C B a t t   r e p l + C H o m e   E V S E ) ,
where
  • CInvest = Total investment (upfront) cost,
  • CManuf = Manufacturing cost,
  • FRPE = Retail price equivalent or mark-up factor = 1.5 [19],
  • CIncentives = Feebate (bonus/penalties) or incentive, see Table 3. Incentives are shown as positive if they decrease the cost and negative if they increase the cost;
  • CFee, init = Fees payable upon vehicle purchase see Table 3,
  • TaxSales = State sales tax,
  • CBatt repl = Battery replacement (PHEV and BEV); we assumed no battery replacement in this paper,
  • CHome EVSE = Average cost of installing Level 2 EVSE [20].
The incentives have a high impact on the RCO and are geographically dependent. In the United States, we considered only the federal subsidies (tax credits) for plug-ins, which depend on the battery total rated capacity in kWh as follows: 2500 U.S. dollars (USD) for each PEV with at least 5 kWh total battery capacity, plus 417 USD for each kWh in excess of 5 kWh, up to a maximum of 7500 USD. We treat these values as 2015 USD. In reality, the subsidy decreases for each automaker after the automaker sells more than 200,000 PEVs, which was neglected in this study. In Germany, the subsidies are 3000 euros (EUR) for each PHEV and 4000 EUR for each BEV [21]. Using a conversion factor of one EUR to 1.0598 USD results in 3179 USD for each PHEV and 4239 USD for each BEV. These values are also treated as 2015 USD.
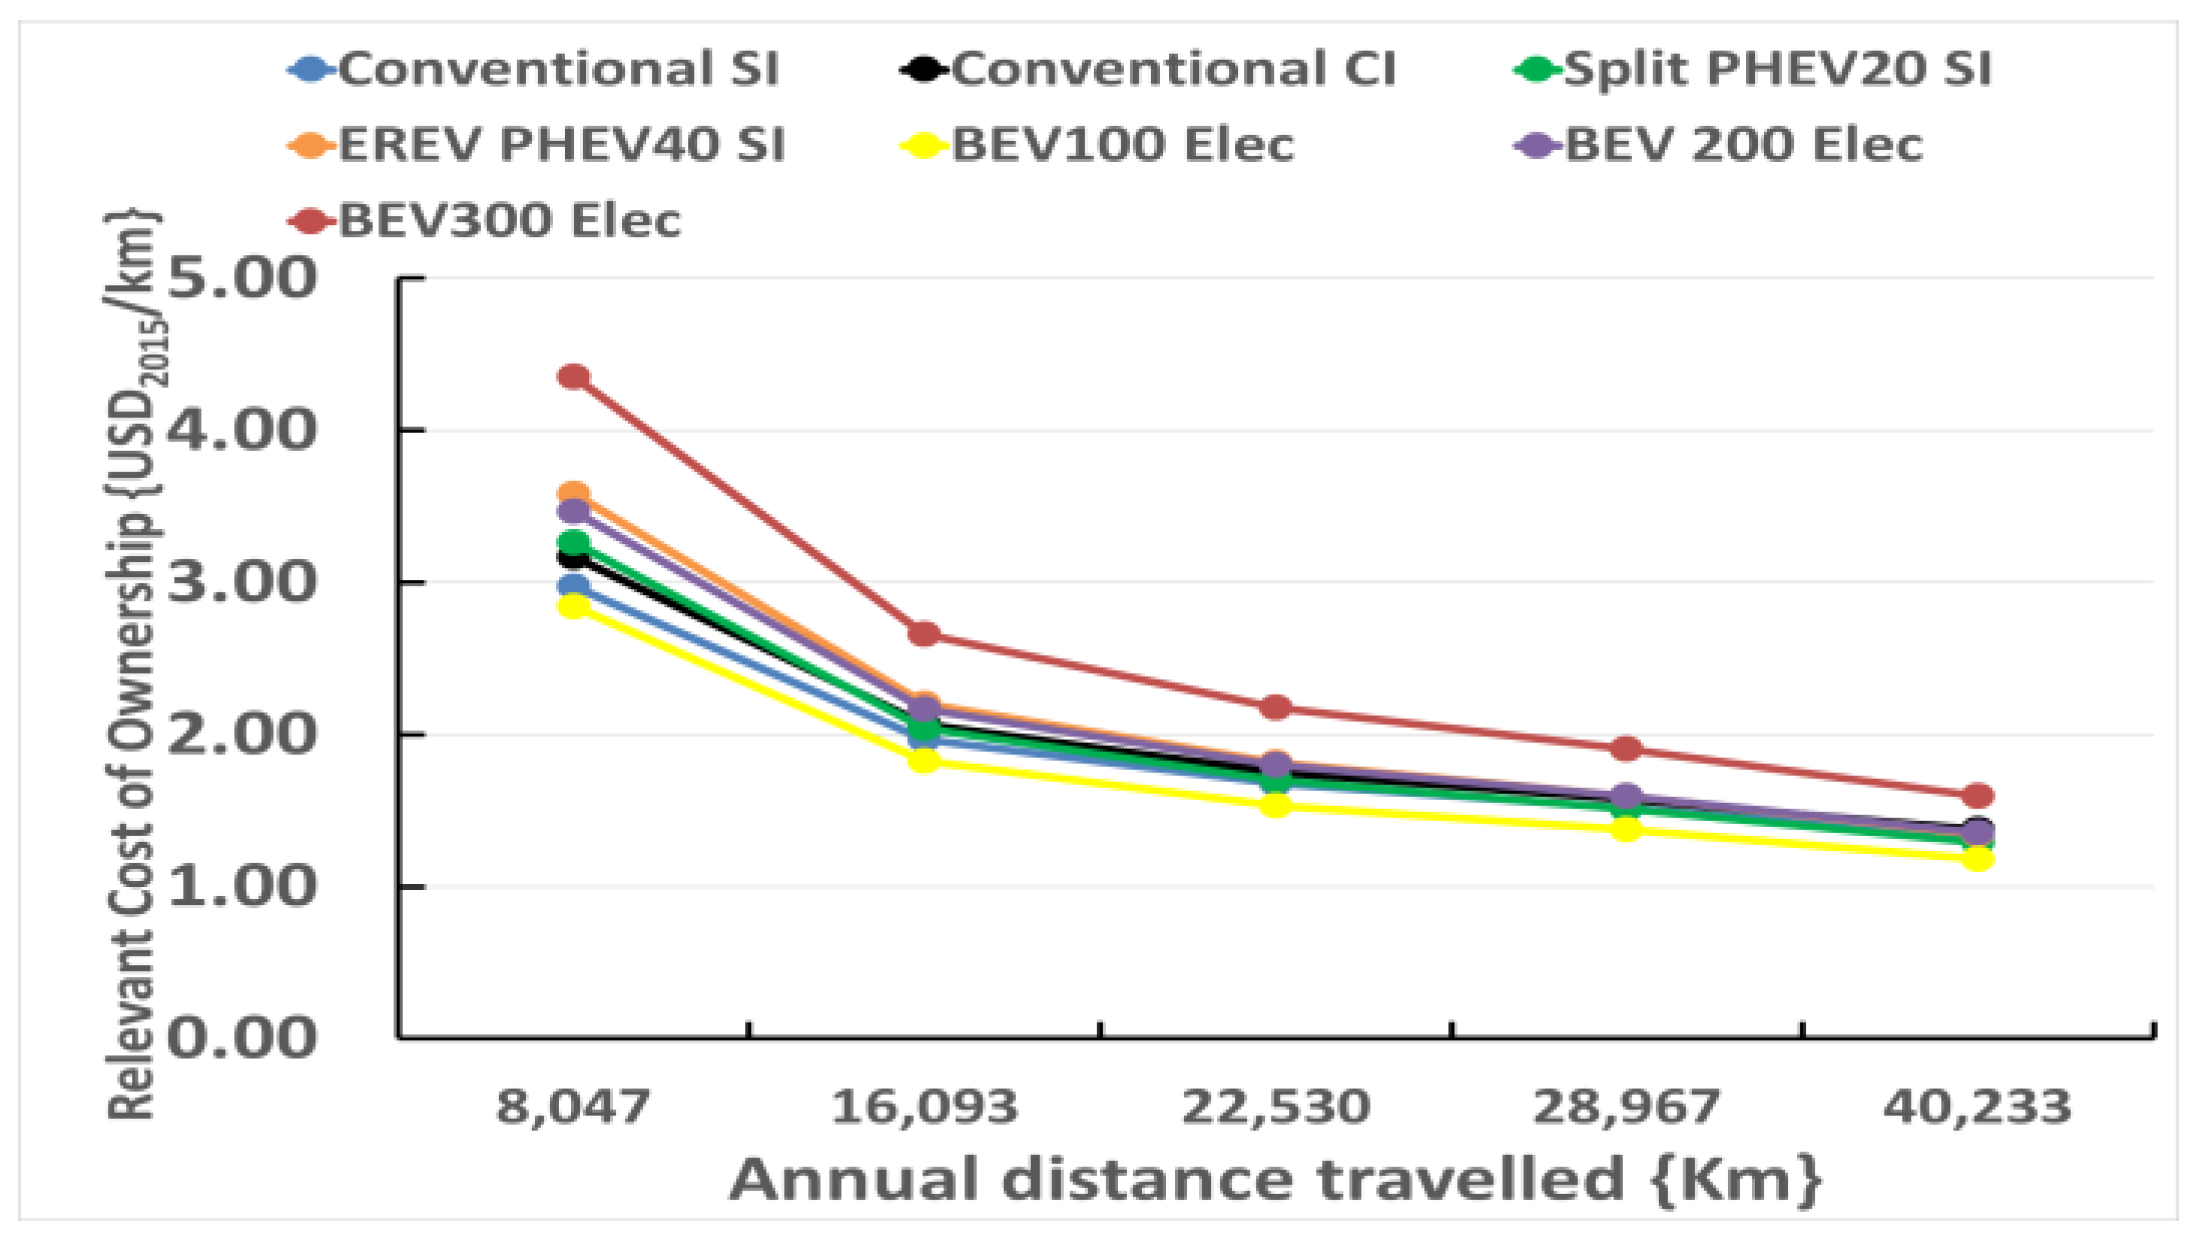
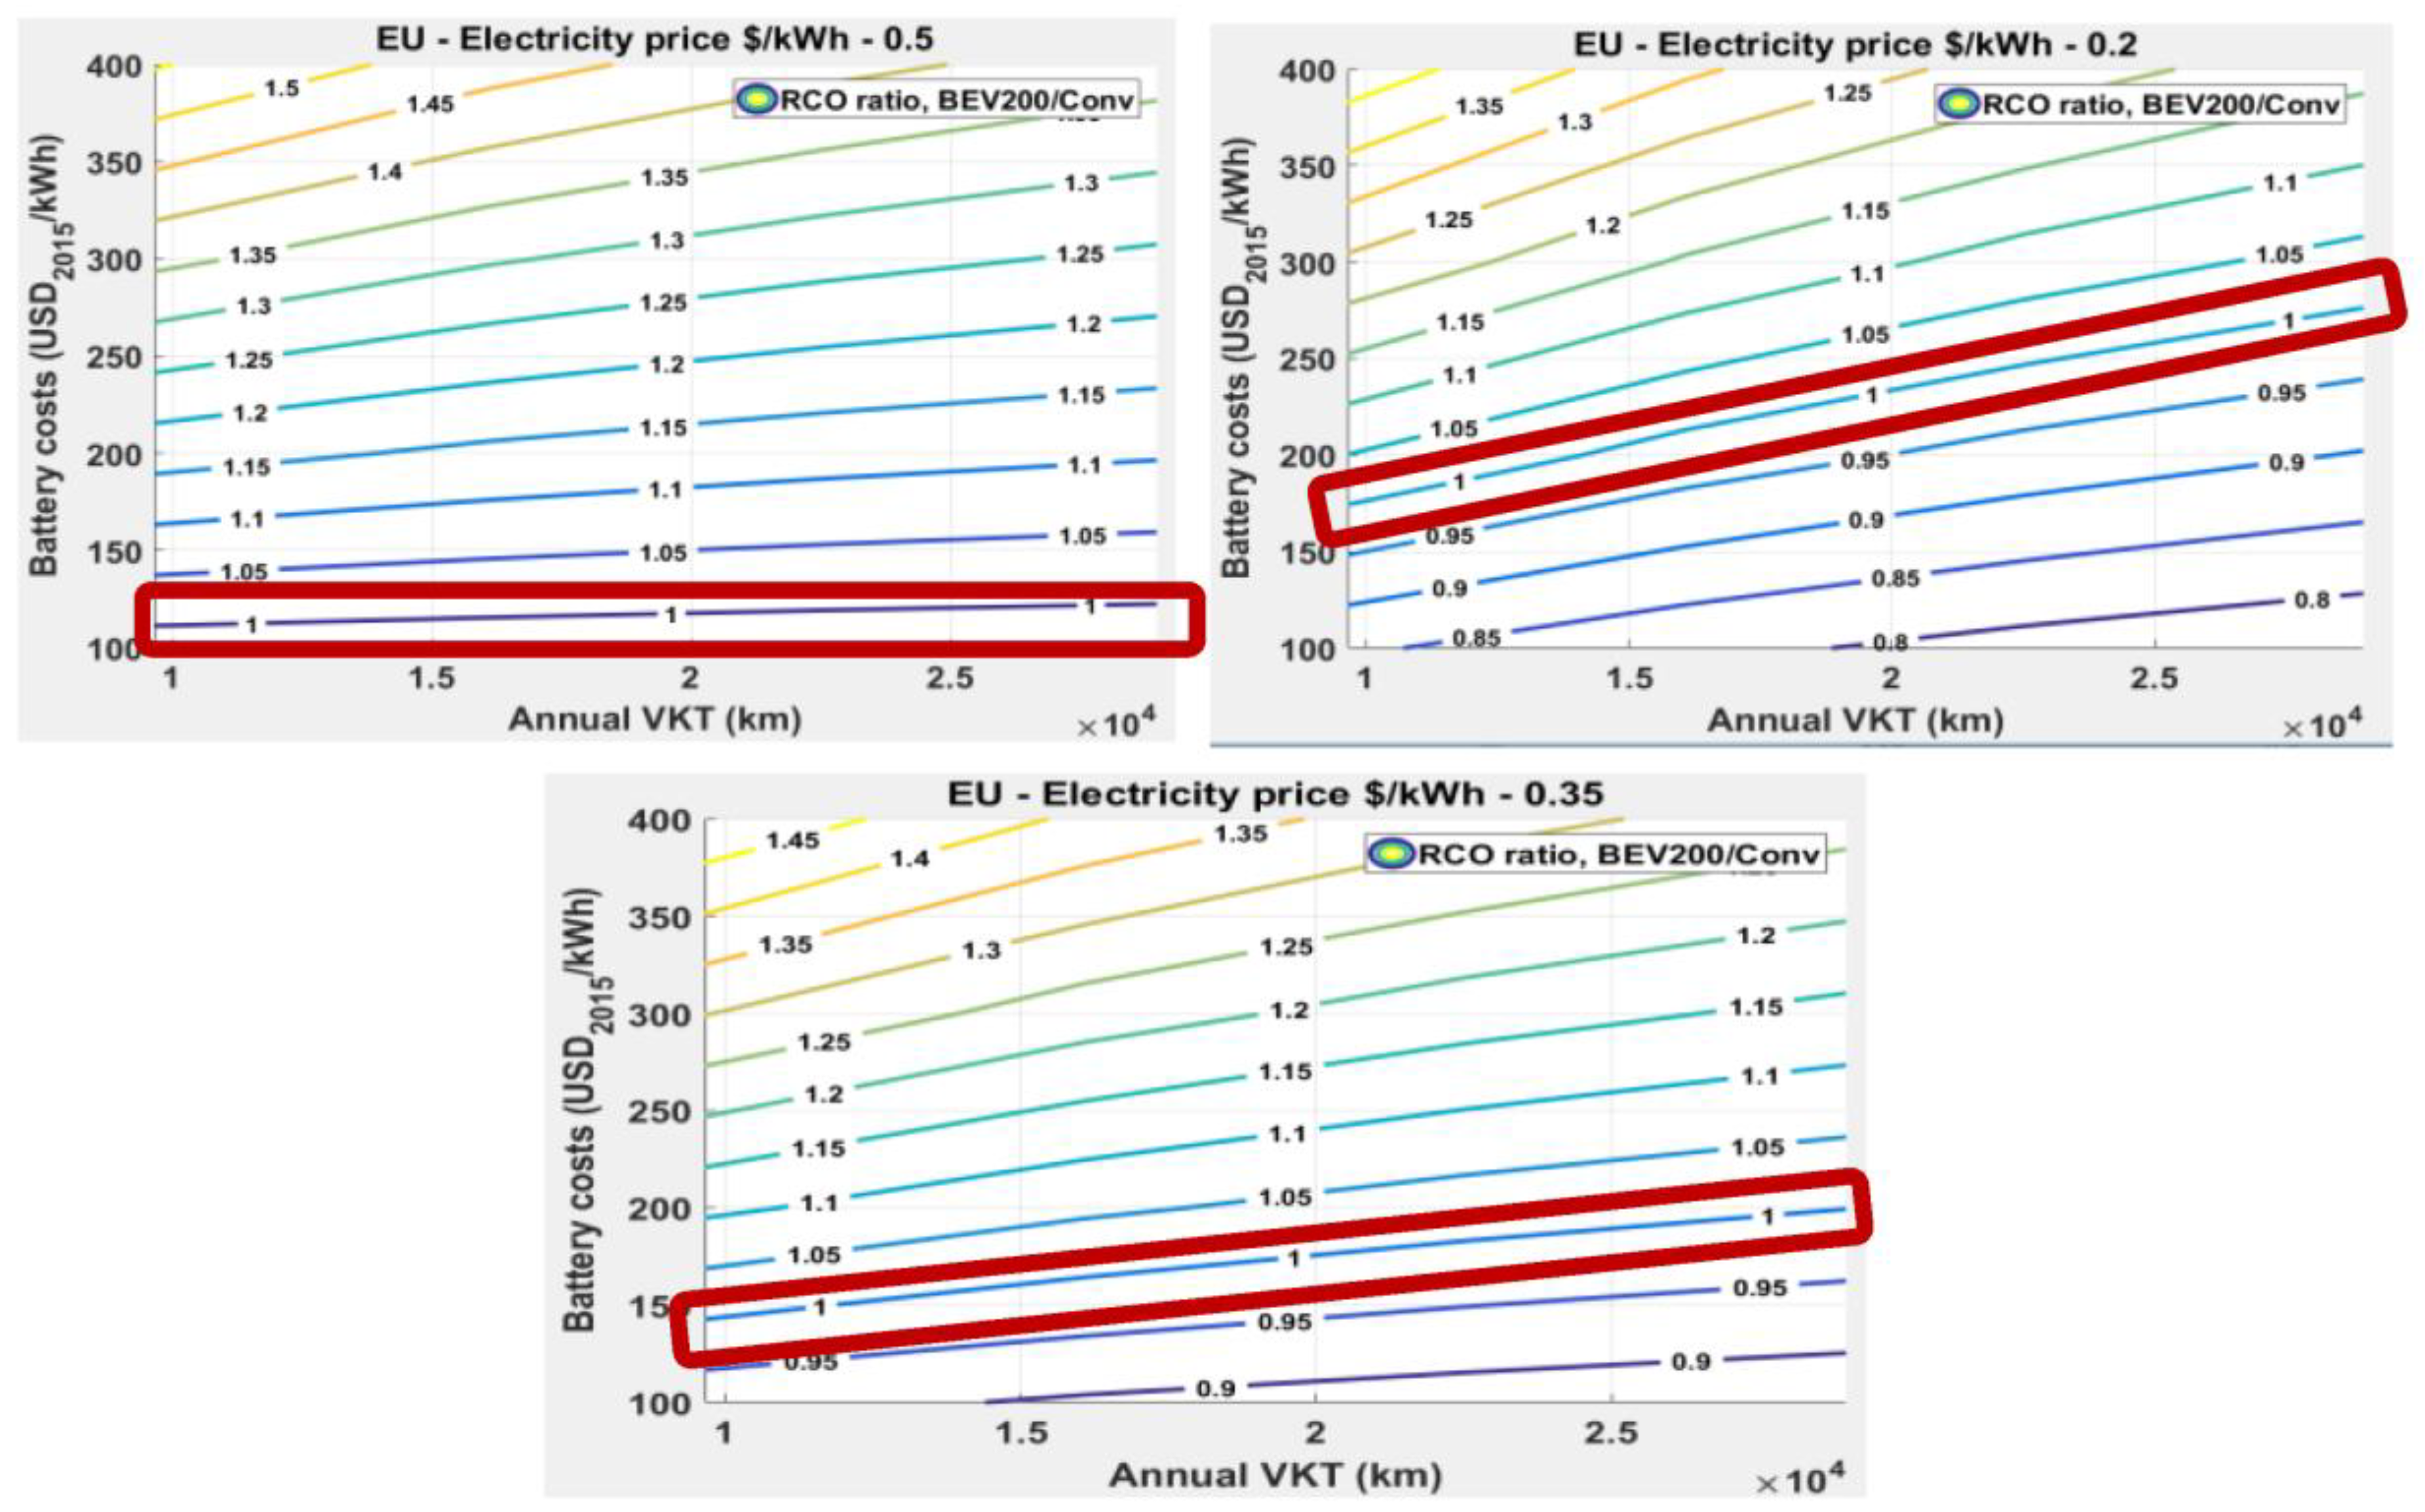
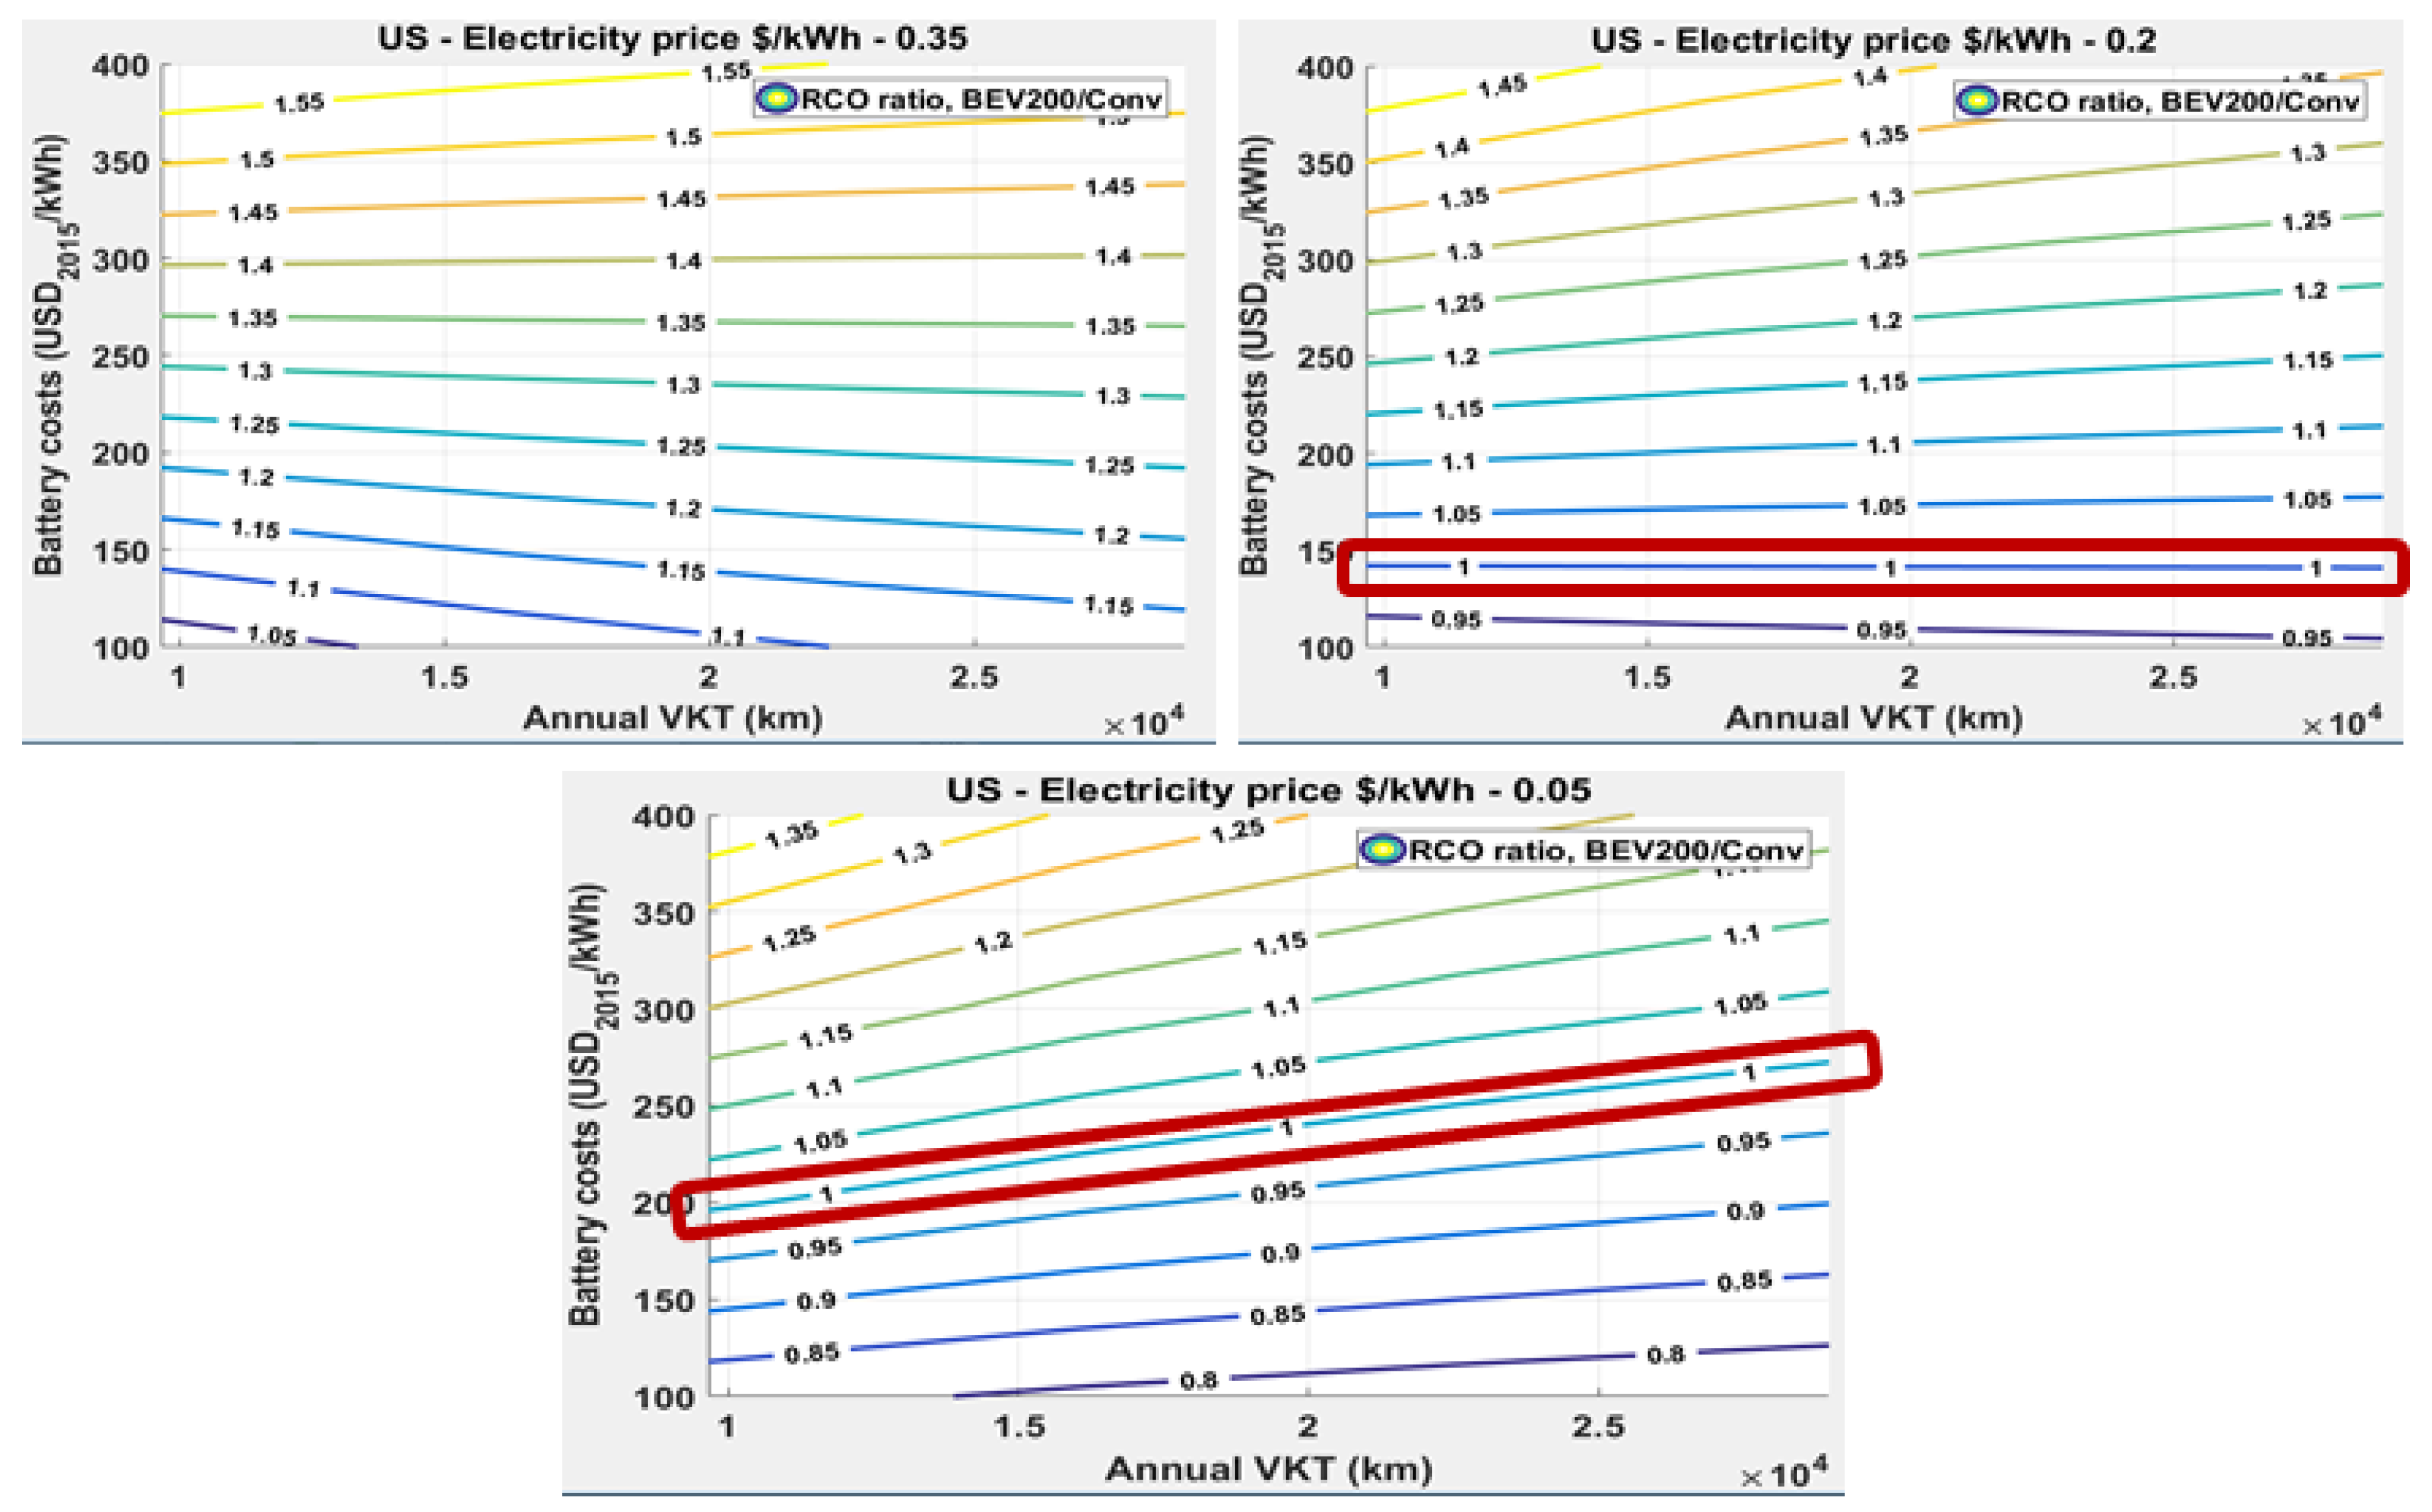
We evaluated sensitivities to assumptions by examining ranges of fuel prices, battery costs, and annual distance travelled. From these results, we examined which factors are most important in the United States and Germany for cost of ownership of PHEVs and BEVs, and under what combination of conditions PHEVs and BEVs are cost-competitive with other drivetrains.

3. Results and Discussion

To be concise, this paper primarily focuses on ownership costs of a 2025 midsize car for average advanced technology and medium optimism cost estimates (cf. Table 2). In addition, we assumed a period of 10 years of ownership and that the customer is not going to change the battery pack during this period. The energy prices applied are displayed in Table 1. The incentives applied, EVSE installation cost, and other ownership fees are displayed in Table 1 according to the geographic area. Glider costs were assumed to be the same for the United States and Europe but vary by year (cf. Table 2). We also assumed that after the battery guaranty period (eight years or 160,000 km travelled), the total energy capacity of the battery pack decreases by 4% each year.

3.1. Energy Consumption

Fuel and electricity (energy) consumption by different powertrains (conventional, PHEV, and BEV) are compared in Figure 1. One can notice that the U.S. cycle, even though it is less aggressive than the WLTC, leads to higher vehicle energy consumption, especially for electrified vehicles, because of its real-world adjustment factor. The right-hand axis of Figure 1 shows the relative difference in energy consumption in the U.S. combined cycle vs. the WLTC by each vehicle type.

3.2. Energy Costs

Figure 2 shows the cost metric in Europe (using the WLTC as reference) and in the United States (with the U.S. combined adjusted cycle as reference). Mainly because of higher European energy prices (cf. Table 1), the cost of the energy per kilometer travelled is higher in Europe than in the United States.
To properly compare the overall cost of ownership between the United States and Germany, we need to include the manufacturing cost, the maintenance cost over the years, taxes, and fees. These are shown in Figure 3 for Germany and Figure 4 for the United States. Negative costs (incentives) are shown below the axis and the total resulting RCO is shown as a filled, red circle.
For an ownership period of 10 years, only the BEV100 in both Germany and the United States seems to be cost competitive with conventionally powered cars when using the current market price as reference (cf. Figure 3 and Figure 4). However, as shown in Figure 5, even though the U.S. driving cycle leads to higher energy consumption for electrified vehicles compared to the WLTC, fuel savings by PEVs are higher in Germany than in the United States because of the high price of fuel.

3.3. Impacts of Other Factors

We evaluated the effect of different factors on the competitiveness of PEVs on the U.S. and German markets.

3.3.1. Manufacturing Cost

The battery manufacturing cost has a direct impact on the selling price of the vehicle and hence on the customer purchase decision. The heat maps below (Table 4 and Table 5) display the RCO by powertrain for a range of manufacturing battery costs. The color of each cell in the table indicates whether the RCO is higher (red) or lower (green) in comparison to the others. Values in Table 4 and Table 5 are based on the annual distance, discount rate, and fuel prices shown in Table 1. Table 4 and Table 5 show that the PEVs become more competitive as the battery cost decreases. For instance, the BEV300 becomes even more economical in the United States than conventional vehicles at battery cost of 100 USD 2015/kWh or less, for an ownership period of 10 years.

3.3.2. Annual Distance Travelled

As expected, the annual distance travelled by the customer will have a direct impact on the cost competiveness between different powertrains (cf. Figure 6); higher annual distance travel plays in favor of the PEVs. For instance, in the United States, at around 24,000 km/year for 10 years of ownership, the PHEV20 and BEV100 become more economical than the conventional spark ignition (SI) vehicle (Table 6). In Germany, largely owing to the higher fuel and electricity prices, the PHEV20 becomes competitive at higher distances travelled than in the United States (cf. Table 6 and Table 7).

3.3.3. Energy Price

The impact of fuel price is far more important in Europe. Table 8 shows the impact of a potential fuel price evolution in Germany. At a gasoline price of 2.38 USD 2015/L (9.01 USD 2015/gallon), the PHEV20 and the BEV100 will become more economical than conventional cars. The electricity price also plays a role in the overall cost for the owner of a PEV, as shown in Table 9. At electricity prices as low as 0.08 USD 2015/kWh, the PHEV20 and the BEV200 become cost competitive over an ownership period of 10 years. However, the RCO of the PHEV40 or the BEV300 are higher than for conventional cars even at an electricity rate as low as 0.08 USD 2015/kWh. If carbon emissions are priced, and the cost is reflected in higher fuel prices, this will tend to favour lower-carbon emitting PEVs, especially BEVs.
For the combination of factors considered here (Table 1), the U.S. gasoline price must reach 1.32 USD2015/L (5.0 USD2015/gallon) for most PEVs to become cost competitive (cf. Table 10).

3.3.4. Influence of the Incentives

As stated before, incentives have a significant impact on the relevant cost of ownership. Therefore, we applied hypothetical variations on the initial value to enhance their impact on the RCO. Four different cases were applied in this study:
  • Suppression of the incentive (0% of the current incentive’s values applied),
  • Reduction of 50% of the current value of the incentives,
  • No change in the incentive (100% of the current values applied),
  • A hypothetical case of an increase of 50% of the incentive (150% of the current incentive’s values applied).
Table 11 and Table 12 bellow display the new RCO according the incentive variation and the geographical area.
Table 11 and Table 12 show how much the incentive influences the RCO of electrified vehicles. Indeed, if the incentive is suppressed in the U.S., the RCO for the BEV 100 will decrease by almost 10% and by 7% for the Split PHEV20. If PEV incentives are decreased or eliminated, this can be expected to reduce PEV market share.

3.3.5. Combination of Factors

We examined ranges of factors to determine what combinations enable BEVs to be cost-competitive with conventional SI vehicles. The ratio of the RCO of a BEV200 to that of a conventional SI vehicle under different assumptions is shown in Figure 7 and Figure 8. Those figures display the contours of a constant RCOBEV200/RCOConvSI ratio for ranges of battery costs and annual distance travelled for three different electricity prices. All others parameters remain constant (as given in Table 1, Table 2 and Table 3). Higher RCO of the BEV200 in comparison to the RCO of the conventional SI vehicle are shown as lighter contour lines, and the red boxes outline the contour where the RCOBEV200/RCOConvSI ratio is equal to one.
In Germany, mainly due to the high fuel cost for conventional vehicles, at high annual distance travelled, the BEV200 can be competitive with conventional vehicles (Figure 7). Furthermore, the electricity price will also have an impact on both the cost ratio between BEV200 and conventional SI, and on the way the annual VKT and battery cost will affect this ratio. Indeed (cf. contours outlined in red in Figure 7 and Figure 8), the slope of the RCOBEV200/RCOConvSI lines increases as electricity price decreases and the difference in the energy cost per kilometer increases. As shown in Figure 8, at high electricity prices (0.35 USD2015/kWh in the United States), while other parameters remain constant, the slope of contours become negative, since the energy cost per kilometer for the BEV is higher than that of the conventional vehicle, and the RCO ratio increases with annual distance travelled.

4. Conclusions

PEVs can be cost-competitive with other powertrains under favourable conditions. These include various combinations of high fuel prices, low battery costs, and high annual driving distances. Energy savings from PEVs, especially BEVs, are somewhat sensitive to the fuel and electricity consumption estimates. The differences in fuel costs between the WLTP and adjusted U.S. cycles indicate the importance of fuel consumption values. These differences become more important under high fuel prices. When energy costs per kilometer for PEVs and conventional vehicles differ widely (high gasoline price and low electricity price), annual distance travelled becomes an important factor and PEVs can be cost competitive at high annual VKT. When energy cost per kilometer is similar, purchase price differences are more important, and PEV cost competitiveness is more sensitive to assumptions about battery costs. Since future fuel prices are uncertain, and driving distances differ between drivers, it is difficult to predict how competitive PEVs will be, but it is important to consider the interactions of multiple factors. However, there are factors that we did not consider that influence BEV adoption, such as the difference between the acceleration performance of PEVs and conventional vehicles, the limited range of the BEV100 and BEV200, and also availability of public charging stations.

Author Contributions

Conceptualization, S.K.S. and T.S.; Methodology, S.K.S.; Validation, A.R.; Formal Analysis, S.K.S. and T.S.; Investigation, S.K.S., J.B. and T.S.; Writing—Original Draft Preparation, S.K.S.; Writing—Review and Editing, S.K.S. and T.S.; Supervision, A.R.; and all authors discussed the results and contributed to the final manuscript.

Funding

This research was funded by Argonne, a U.S. Department of Energy Office of Science laboratory under Contract No. DE-AC02-06CH11357.

Acknowledgments

The authors would like to acknowledge the financial support of the U.S. Department of Energy Vehicle Technologies Office. The UChicago Argonne, LLC, operator of Argonne National Laboratory (Argonne), has created the submitted manuscript. Argonne, a U.S. Department of Energy Office of Science laboratory, is operated under Contract No. DE-AC02-06CH11357. The U.S. Government retains for itself, and others acting on its behalf, a paid-up nonexclusive, irrevocable worldwide license in said article to reproduce, prepare derivative works, distribute copies to the public, and perform publicly and display publicly, by or on behalf of the Government.

Conflicts of Interest

The authors declare no conflict of interest. The views and opinions of the authors expressed herein do not necessarily state or reflect those of the United States Government or any agency thereof. Neither the United States Government nor any agency thereof, nor any of their employees, makes any warranty, expressed or implied, or assumes any legal liability or responsibility for the accuracy, completeness, or usefulness of any information, apparatus, product, or process disclosed, or represents that its use would not infringe privately owned rights.

Nomenclature

AEOAnnual Energy Outlook
BEVBattery Electrical Vehicle
CDCharge-Depleting
DOEDepartment of Energy
EREVExtended Range Electric Vehicles
EVSEElectric Vehicle Service Equipment
HEVHybrid Electric Vehicle
HWFETHighway Federal Emissions Test
ICEVInternal Combustion Engine Vehicle
LDVLight Duty Vehicle
PEVPlug-in Electrical Vehicle
PHEVPlug-in Hybrid Electrical Vehicle
RCORelevant Cost of Ownership
RPERetail Price Equivalent
UDDSUrban Dynamometer Driving Schedule
UFUtility Factor
USDU.S. Dollars
VTOVehicle Technology Office
WLTC/PWorldwide harmonized Light vehicles Test Cycle/Procedure

References

  1. Mock, P. Entwicklung eines Szenariomodells zur Simulation der zukünftigen Marktanteile und CO2 Emissionen von Kraftfahrzeugen (VECTOR21); Universität Stuttgart: Stuttgart, Germany, 2010. [Google Scholar]
  2. Redelbach, M.; Özdemir, E.D.; Friedrich, H.E. Optimizing battery sizes of plug-in hybrid and extended range electric vehicles for different user types. Energy Policy 2014, 73, 158–168. [Google Scholar] [CrossRef] [Green Version]
  3. Rousseau, A.; Stephens, T.; Brokate, J.; Oezdemir, E.D.; Kloetzke, M.; Schmid, S.A.; Ploetz, P.; Badin, F.; Ward, J.; Lim, O.T. Comparison of Energy Consumption and Costs of Different Plug-in Vehicles in European and American Context. In Proceedings of the EVS28, Kintex, Korea, 3–6 May 2015. [Google Scholar]
  4. Protection of Environment, 40 C.F.R. Vol. 32, Part 600, Fuel Economy and Greenhouse Gas Exhaust Emissions of Motor Vehicles. Available online: https://www.gpo.gov/fdsys/pkg/CFR-2012-title40-vol31/pdf/CFR-2012-title40-vol31-part600.pdf (accessed on 5 July 2017).
  5. European Union Regulation (EU) No 333/2014 of the European Parliament and of the Council of 11 March 2014 Amending Regulation (EC) No 443/2009 to Define the Modalities for Reaching the 2020 Target to Reduce CO2 Emissions from New Passenger Cars; EU: Brussels, Belgium, 2014.
  6. Lin, Z.; Greene, D. Predicting individual fuel economy. SAE Int. J. Fuels Lubr. 2011, 4, 84–95. [Google Scholar] [CrossRef]
  7. Argonne National Laboratory. Autonomie Toolkit. Available online: http://www.autonomie.net/index.html (accessed on 5 July 2017).
  8. Moawad, A.; Kim, N.; Shidore, N.; Rousseau, A. Assessment of Vehicle Sizing, Energy Consumption and Cost through Large Scale Simulation of Advanced Vehicle Technologies. Argonne National Laboratory Report ANL/ESD-15/28. 2016. Available online: http://www.autonomie.net/publications/fuel_economy_report.html (accessed on 4 July 2018).
  9. Kim, N.; Choi, S.; Jeong, J.; Vijayagopal, R.; Stutenberg, K.; Rousseau, A. Vehicle Level Control Analysis for Voltec Powertrain. In Proceedings of the EVS30 Symposium, Stuttgart, Germany, 9–11 October 2017. [Google Scholar]
  10. Lin, Z.; Dong, J.; Liu, C.; Greene, D. PHEV energy use estimation: Validating the Gamma Distribution for representing the random daily driving distance. Transp. Res. Rec. 2012. [Google Scholar] [CrossRef]
  11. Krumm, J. How People Use Their Vehicles: Statistics from the 2009 National Household Travel Survey; SAE Technical Paper 2012-10-0489; SAE: Warrendale, PA, USA, 2012. [Google Scholar]
  12. SAE International. Utility Factor Definitions for Plug-in Hybrid Electric Vehicles Using Travel Survey Data. Available online: http://standards.sae.org/j2841_201009/ (accessed on 4 July 2018).
  13. Plötz, P.; Jakobsson, N.; Sprei, F. On the distribution of individual daily driving distances. Transp. Res. Part B Methodol. 2017, 101, 213–227. [Google Scholar] [CrossRef]
  14. Lin, Z.; Greene, D.L. Significance of daily VMT variation over time and among drivers on assessment of PHEV energy impact. In Proceedings of the 90th Annual Meeting of the Transportation Research Board, Washington, DC, USA, 23–27 January 2011. [Google Scholar]
  15. Follmer, R.; Gruschwitz, D.; Jesske, B.; Quandt, S.; Lenz, B.; Nobis, C.; Köhler, K.; Mehlin, M. Mobilität in Deutschland 2008: Ergebnisbericht Struktur–Aufkommen–Emissionen–Trends; Federal Ministry for Transport, Building and Urban Development: Berlin, Germany, 2010. [Google Scholar]
  16. Tal, G.; Nicholas, M.S.; Davies, J.; Woodjack, J. Charging behavior impacts on electric VMT: Evidence from a 2013 California drivers survey. In Proceedings of the Transportation Research Board Annual Meeting, Washington, DC, USA, 12–16 January 2014. [Google Scholar]
  17. Pröpfe, B.; Redelbach, M.; Santini, D.; Friedrich, H.E. Cost analysis of plug-in hybrid electric vehicles including maintenance and repair costs and resale values. In Proceedings of the Electric Vehicle Symposium, Los Angeles, CA, USA, 6–9 May 2012. [Google Scholar]
  18. Holweg, P.; Kattuman, P.A. The incentive Whiplash: Sales Discounts and the Dynamics of Residual Value in the Automobile Industry. Unpublished. 2006. [Google Scholar]
  19. Vyas, A.; Santini, D.; Cuenca, R. Comparison of Indirect Cost Multipliers for Vehicle Manufacturing: Technical Memorandum in Support of Electric and Hybrid Vehicle Cost Estimation Studies; Technical Memorandum, Argonne National Laboratory: Argonne, IL, USA, 2000. [Google Scholar]
  20. Electric Power Research Institute (EPRI). Total Cost of Ownership Model for Current Plug-in Electric Vehicles; EPRI Technical Report No. 3002001728; EPRI: Palo Alto, CA, USA, 2013; Available online: https://www.epri.com/#/pages/product/000000003002001728/ (accessed on 7 July 2017).
  21. Federal Ministry for Economic Affairs and Energy 2017. Electric Mobility in Germany. Available online: http://www.bmwi.de/Redaktion/EN/Dossier/electric-mobility.html (accessed on 7 July 2017).
Figure 1. Energy consumption comparison by powertrain and driving cycle.
Wevj 09 00023 g001
Figure 2. Cost metric comparison by powertrain and driving cycle.
Wevj 09 00023 g002
Figure 3. Relevant cost of ownership (RCO) comparison between powertrains for 10 years of ownership in Germany using the Worldwide harmonized Light vehicles Test Cycles (WLTC) as reference.
Wevj 09 00023 g003
Figure 4. RCO comparison between powertrains for 10 years of ownership in the United States using the U.S. combined adjusted driving cycle as reference.
Wevj 09 00023 g004
Figure 5. RCO comparison between the United States and Germany for 10 years of ownership.
Wevj 09 00023 g005
Figure 6. RCO by annual distance travelled and powertrain for 10 years of ownership in the United States using the U.S. combined adjusted driving cycle as reference.
Wevj 09 00023 g006
Figure 7. RCO ratio between BEV200 and conventional SI by annual distance travelled, battery cost, and electricity price, for 10 years of ownership in Germany using WLTC as reference.
Wevj 09 00023 g007
Figure 8. RCO ratio between BEV200 and conventional SI by annual distance travelled, battery cost, and electricity price, for 10 years of ownership in the United States using the U.S. combined adjusted driving cycle as reference.
Wevj 09 00023 g008
Table 1. Energy cost assumptions for 2025.
ZoneDistance Travelled (km/year)Annual Discount Rate (%)Vehicle Life (years)Gasoline Price (USD2015/L)Diesel Price (USD2015/L)Electricity Price (USD2015/kWh)
Germany14,0005121.5221.4820.397
United States22,5305120.6770.7270.116
Table 2. Estimated future manufacturing cost.
YearOptimism of Cost EstimateGlider Cost (USD 2015)Battery Pack Cost (USD2015/kWh)
PHEV 20 (Plug-In Hybrid Electric Vehicle 20)PHEV 30BEV100 (Battery Electric Vehicle)BEV200 and BEV300
2025Low10,509500450325325
Medium11,319400375250250
High11,631315290170170
Table 3. Values for initial fees, incentives, and cost of home electric vehicle service equipment (EVSE) for year 2025 in 2015 U.S. dollars (USD2015).
AreaIncentives, Costs, and FeesConventional Spark IgnitionConventional Compression IgnitionPHEVBEV
GermanyIncentives0031794239
Initial fee22222222
Motor tax (USD2015, period average)2912100
EVSE cost0000
Maintenance (USD2015/km)0.060.060.060.05
U.S. federalIncentives00>2500>2500
Initial fee186186186186
EVSE cost0001204
Maintenance (USD2015/km)0.050.050.050.05
Table 4. Relevant cost of ownership (RCO) by battery cost and powertrain for 10 years of ownership in the United States using the U.S. combined adjusted driving cycle as reference.
ConventionalConventionalSplit PHEV20EREV PHEV40BEV100BEV 200BEV300
Variable SICISISIElecElecElec
Battery costs {USD_2015/kWh}40037,84139,46738,27941,52339,64349,00262,414
30037,84139,46736,87638,94936,27043,35553,472
20037,84139,46735,47436,37632,89637,70844,530
10037,84139,46734,87334,37829,52332,06135,588
5037,84139,46734,87334,37827,83629,23831,117
Table 5. RCO by battery cost and powertrain for 10 years of ownership in Germany using the Worldwide harmonized Light vehicles Test Cycles (WLTC) as reference.
ConventionalConventionalSplit PHEV20EREV PHEV40BEV100BEV 200BEV300
Variable SICISISIElecElecElec
Battery costs {USD_2015/kWh}40035,73437,58237,06443,54341,20751,54166,357
30035,73437,58235,53140,72837,51845,36656,578
20035,73437,58233,99737,91433,82939,19146,799
10035,73437,58233,34035,72930,14033,01537,021
5035,73437,58233,34035,72928,29529,92832,131
Table 6. RCO by annual distance travelled and powertrain for 10 years of ownership in the United States using the U.S. combined adjusted driving cycle as reference.
ConventionalConventionalSplit PHEV20EREV PHEV40BEV100BEV 200BEV300
Variable SICISISIElecElecElec
Annual VKT {Km}40,23353,69555,28552,05954,12947,54754,52264,172
32,18647,11248,77946,50348,95642,37948,96858,331
24,14039,38541,01939,64842,22635,88241,93750,556
16,09331,66033,26032,84235,50229,38634,90842,781
8,04723,93625,50226,24328,82222,89127,87935,007
Table 7. RCO by annual distance travelled and powertrain for 10 years of ownership in Germany using the WLTC as reference.
ConventionalConventionalSplit PHEV20EREV PHEV40BEV100BEV 200BEV300
Variable SICISISIElecElecElec
Annual VKT {Km}40,23365,51465,91662,09869,96858,99169,49481,625
32,18657,32358,26055,55963,00254,23562,48074,159
24,14047,76949,10947,37554,08246,02153,54164,216
16,09338,21739,96039,19245,16137,80844,60254,274
8,04728,66730,81331,00936,22329,59735,66544,333
Table 8. RCO by fuel price and powertrain for 10 years of ownership in Germany using the WLTC as reference.
ConventionalConventionalSplit PHEV20EREV PHEV40BEV100BEV 200BEV300
Variable SICISISIElecElecElec Variable
Gasoline price {USD_2015/Liter}2.3840,79342,38338,93844,24335,67342,27851,6892.38Diesel price {USD_2015/Liter}
1.9838,45040,25838,07043,59235,67342,27851,6891.98
1.3234,54436,71636,62442,50935,67342,27851,6891.32
0.9232,20134,59135,75641,85935,67342,27851,6890.92
0.2628,29631,04934,30940,77535,67342,27851,6890.26
Table 9. RCO by fuel price and powertrain for 10 years of ownership in Germany using the WLTC as reference.
ConventionalConventionalSplit PHEV20EREV PHEV40BEV100BEV 200BEV300
Variable SICISISIElecElecElec
Electricity price {$/kWh}0.435,73437,58237,08342,86835,72542,33251,745
0.3235,73437,58236,57242,08634,34140,89950,253
0.2435,73437,58236,06041,30332,95739,46548,761
0.1635,73437,58235,54840,52031,57338,03147,269
0.0835,73437,58235,03739,73730,19036,59845,777
Table 10. RCO by fuel price and powertrain for 10 years of ownership in the United States using the U.S. combined adjusted driving cycle as reference.
ConventionalConventionalSplit PHEV20EREV PHEV40BEV100BEV 200BEV300
Variable SICISISIElecElecElec
Gasoline price {USD_2015/Liter}2.3858,27939,46744,62344,76434,58340,53249,001
1.9853,51739,46743,14543,85934,58340,53249,001
1.3245,58139,46740,68142,35134,58340,53249,001
0.9240,81939,46739,20341,44534,58340,53249,001
0.2632,88239,46736,73939,93734,58340,53249,001
Table 11. RCO by incentives variation and powertrain for 10 years of ownership in the United States using the U.S. combined adjusted driving cycle as reference.
ConventionalConventionalSplit PHEV20EREV PHEV40BEV100BEV 200BEV300
Variable SICISISIElecElecElec
Incentive
(% of current value)
0%37,84139,46740,98645,53941,22647,17555,644
50%37,84139,46739,63243,20937,90543,85352,323
100%37,84139,46738,27940,87934,58340,53249,001
150%37,84139,46736,92538,54931,26137,21045,679
Table 12. RCO by incentives variation and powertrain for 10 years of ownership in Germany using the WLTC as reference.
ConventionalConventionalSplit PHEV20EREV PHEV40BEV100BEV 200BEV300
Variable SICISISIElecElecElec
Incentive
(% of current value)
0%35,73437,58239,63045,40539,09545,70055,111
50%35,73437,58238,34744,12237,38443,98953,400
100%35,73437,58237,06442,83935,67342,27851,689
150%35,73437,58235,78141,55633,96240,56749,978

