Case Report

Load Shifting Potentials of Plug-In Electric Vehicles—A Case Study for Germany

Fraunhofer Institute for Systems and Innovation Research ISI, Breslauer Str. 48, 76139 Karlsruhe, Germany
*
Author to whom correspondence should be addressed.
World Electr. Veh. J. 2018, 9(2), 21; https://doi.org/10.3390/wevj9020021
Submission received: 15 May 2018 / Revised: 22 June 2018 / Accepted: 25 June 2018 / Published: 30 June 2018

Abstract

:
Plug-in electric vehicles are the currently favoured option to decarbonize the passenger car sector. However, a decarbonisation is only possible with electricity from renewable energies and plug-in electric vehicles might cause peak loads if they started to charge at the same time. Both of these issues could be solved with coordinated load shifting (demand response). Previous studies analysed this research question by focusing on private vehicles with domestic and work charging infrastructure. This study additionally includes the important early adopter group of commercial fleet vehicles and reflects the impact of domestic, commercial, work, and public charging. For this purpose, two models are combined that capture the market diffusion of electric vehicles and their charging behaviour (ALADIN), as well as the load shifting potential of several new energy technologies (eLOAD). In a comparison of three different scenarios, we find that the charging of commercial vehicles does not inflict evening load peaks in the same magnitude as purely domestic charging of private cars does. Also, for private cars, charging at work occurs during the day and may reduce the necessity of load shifting while public charging plays a less important role in total charging demand as well as load shifting potential. Nonetheless, demand response reduces the system load by about 2.2 GW or 2.8% when domestic and work charging are considered when compared to a scenario with only domestic charging where a new peak might be created in the winter hours due to load shifting into the night.

1. Motivation

To attain the climate targets, it is necessary to transform the energy system. Renewable energy sources (RES) can help to decrease greenhouse gas emissions in the electricity sector. In the transport sector, plug-in electric vehicles (PEVs) can be a means to reduce greenhouse gas emissions if powered by electricity from RES. However, in a significant number, they risk causing additional load peaks that have to be balanced to ensure a stable electricity system. Ideally, electricity demand of PEVs and electricity generation of RES are coordinated e.g., by demand response. However, for this purpose, a sufficient charging infrastructure is needed. While most studies focus on domestic charging facilities [1] or include additional charging at work of private passenger cars [2], this paper also considers commercial plug-in electric vehicles (PEV) and the use of public charging stations. The aim of this paper is to assess the extent to which additional charging facilities contribute to PEV market penetration in Germany and the shaving of peaks in the residual load (system load minus generation of fluctuating renewable energies).
For this purpose, we combine two models that have been developed and described earlier: The model ALADIN (Alternative Automobiles Diffusion and Infrastructure) is used to determine the market diffusion of plug-in electric vehicles and their charging infrastructure. Also, the use of several types of charging infrastructure (domestic, work, and public), as well as different vehicle user groups (private, commercial fleet vehicles, and company cars) can be analysed. Structure and results of the model have been described in several publications [3,4,5]. The results can be taken as an input into the eLOAD (energy LOad curve ADjustment) model, which aims to analyse the load shift potential of several (new) technologies of which electric vehicles are one important technology [6]. This combination permits to provide a new contribution in this field since the potential of public charge shifting as well as the inclusion of commercial fleet vehicles has, to the best of the authors’ knowledge, not been analysed. In a case study, we apply the model to Germany and make projections for 2030.
The paper is structured as follows: First, we introduce the methods in Section 2 and data sources in Section 3. Thereafter, assumptions for a case study for Germany in 2030 are presented in Section 4. The results are shown in Section 5 before we summarize and draw conclusions for electricity suppliers and policy makers in Section 6.

2. Methods and Model Descriptions

2.1. PEV Market Diffusion: The ALADIN Model

The market diffusion model ALADIN (Alternative Automobiles Diffusion and Infrastructure, Figure 1) is an agent-based simulation model that is based on a large number of vehicle driving profiles of conventional vehicles. The model was introduced in [5] and PEV market diffusion results were published in [4]. When considering the individual driving behaviour, the replaceability by a battery electric vehicle (BEV) is analysed and what share of electric driving (often called utility factor) could be obtained by a plug-in hybrid electric vehicle (PHEV). Based on this technical feasibility, the utility of four drive trains (Gasoline, Diesel, BEV, and PHEV) is calculated and compared. This utility consists of the total cost of ownership for the vehicle, but also contains the cost for individual charging points (at home or a designated charging point at work) as an obstructing factor and a willingness to pay more for a plug-in electric vehicle as a favouring factor. The share of driving profiles with PEVs as utility maximizing option is considered as their market share for vehicle sales, which diffuse into the vehicle stock.
An enhancement for the integration of public charging infrastructure was introduced in [3]. After the PEV diffusion, the charging behaviour of the vehicle stock at public charging points is simulated and used to determine the energy that is charged in public. Based on this figure, the number of profitable public charging points is calculated and constructed in the most frequented areas. This might also lead to a reduction of public charging points if the amount of public energy charged is not sufficient to cover their cost. The new public charging stock is considered in the individual simulation and may lead to a higher utility of PEVs. For an illustration of the model, refer to Figure 1.
The second part of the model is necessary if public charging infrastructure is considered, since PEVs can only be charged in public if these charging points are free at the time a PEV arrives. Thus, they interact at public charging points, which makes a joint simulation necessary. This requires that geographic vehicle movements are included in the analysis.
ALADIN’s modelling quality has been validated by forecasting market shares of diesel vehicles for commercial passenger cars and comparing the results to statistical data. More detailed information on the model validation can be found in [3,5].

2.2. Optimal Vehicle Charging: The eLOAD Model

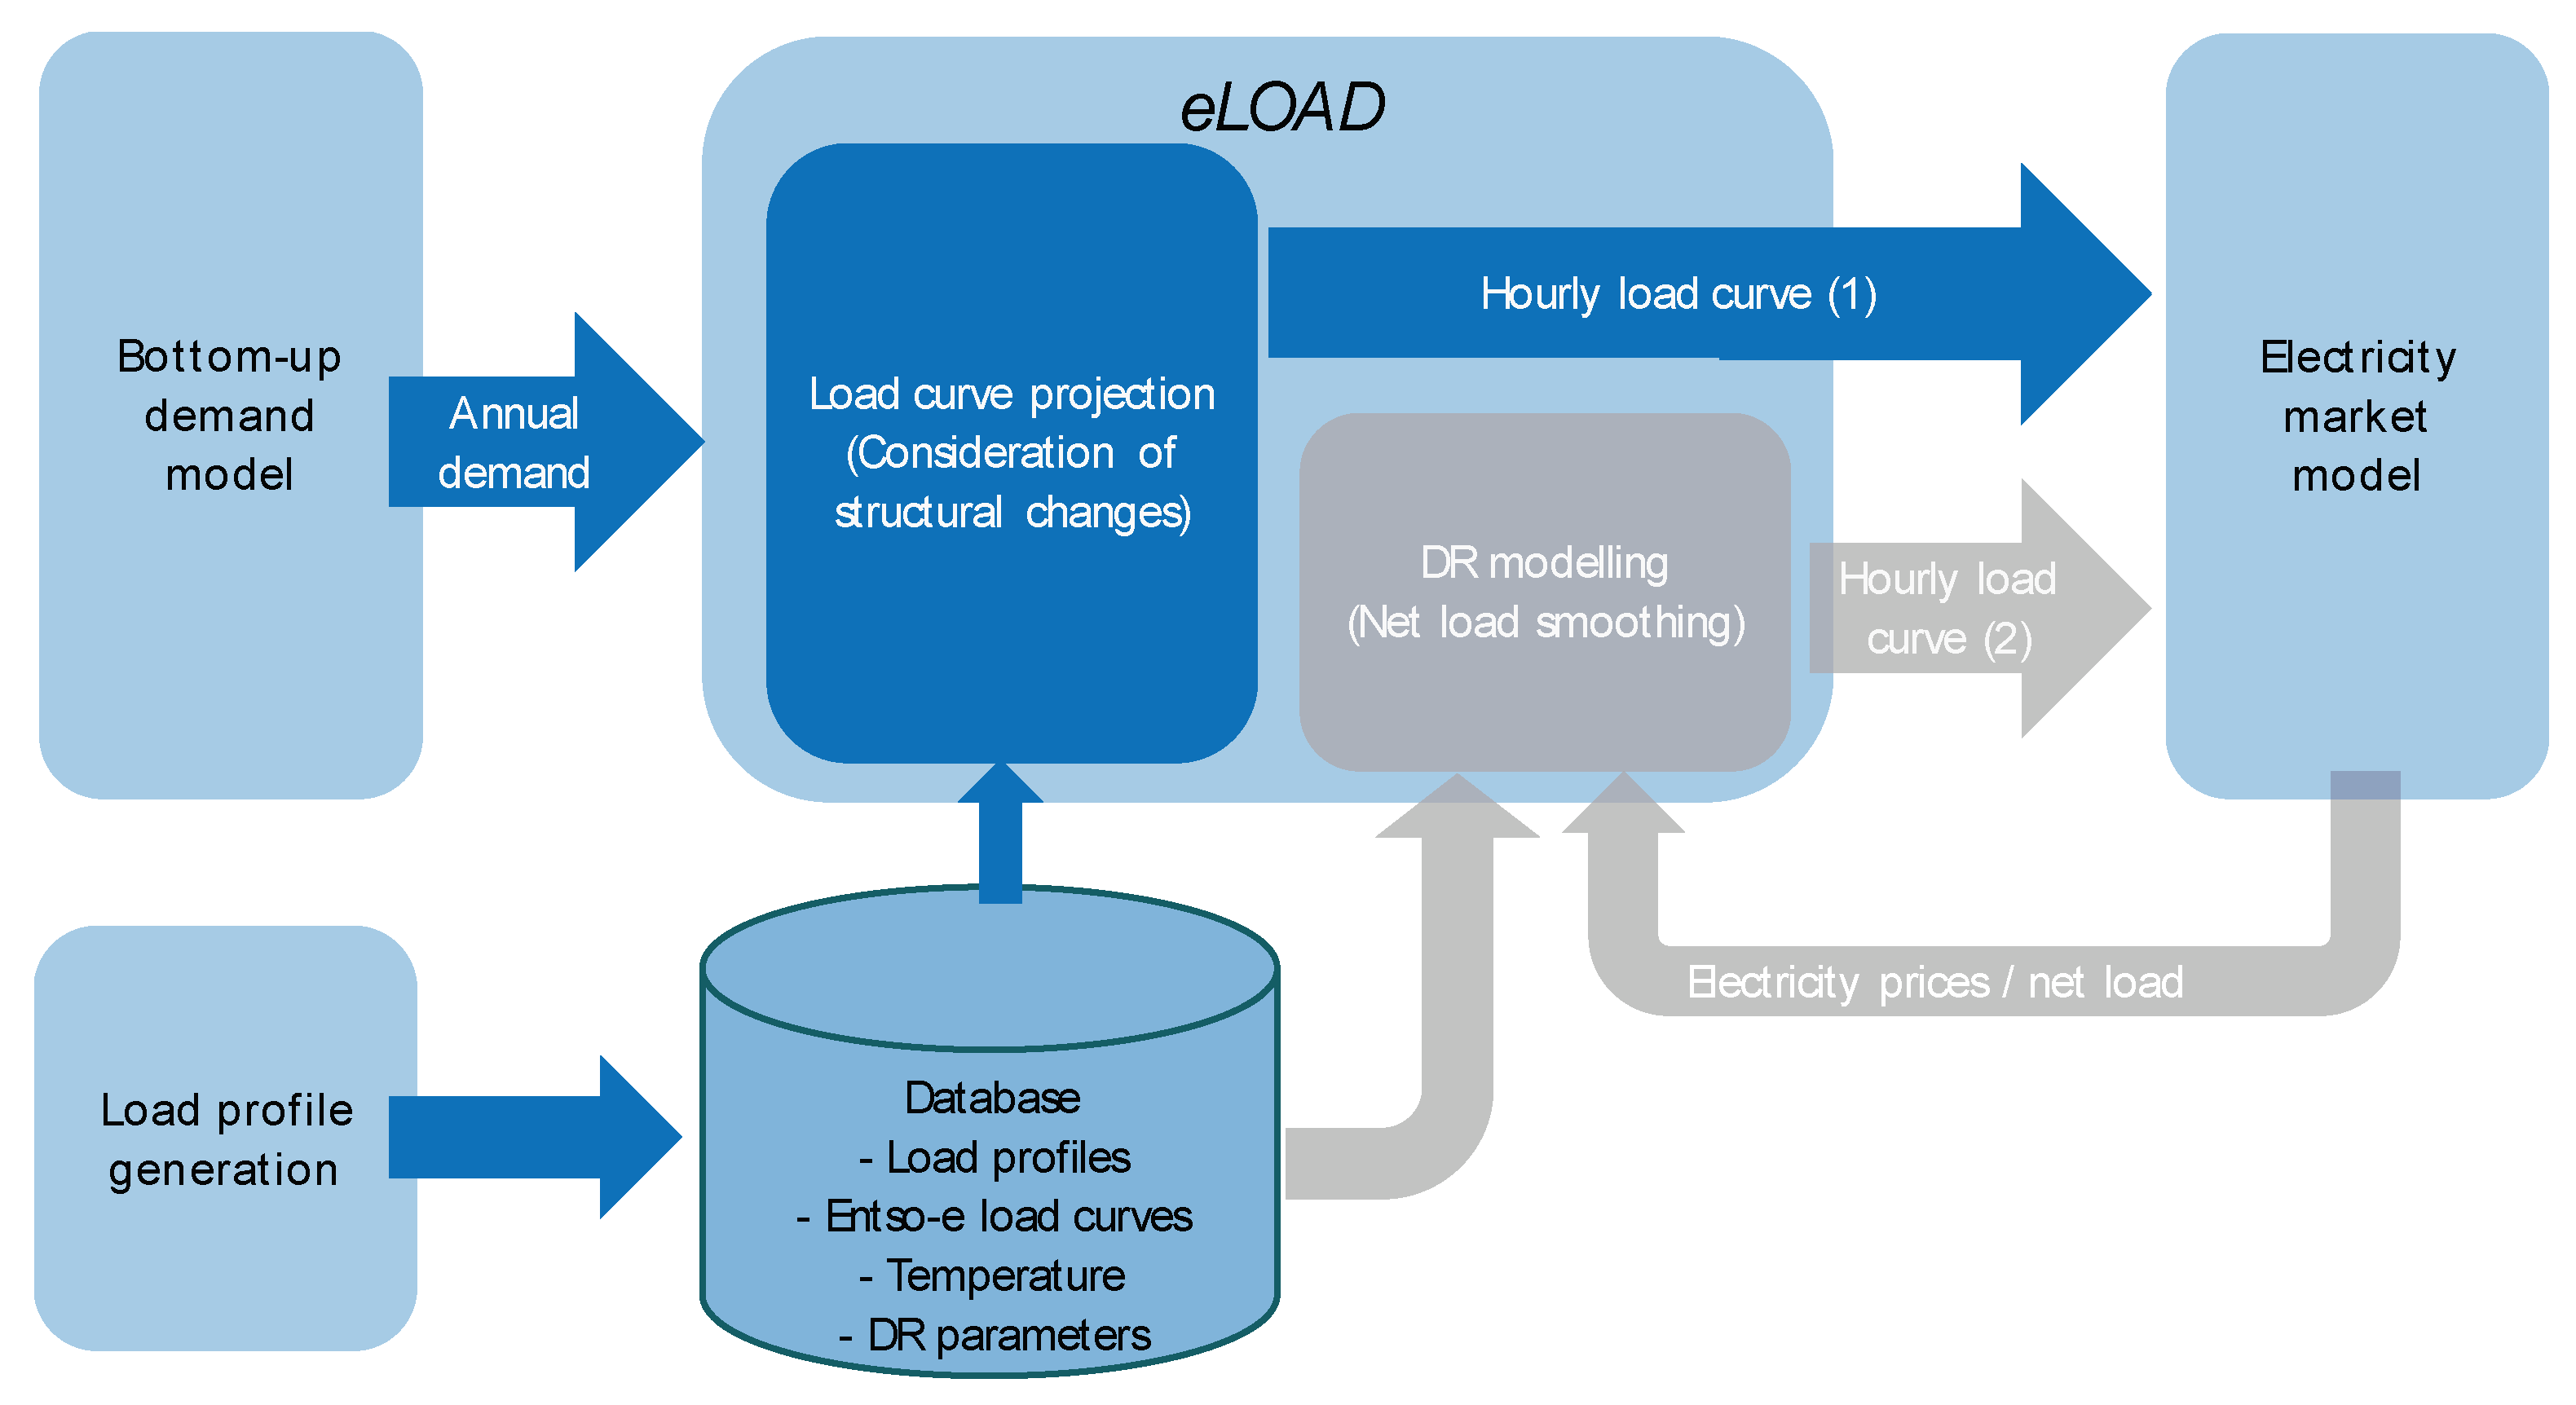
The driving, charging, and different parking profiles (domestic, work, public), as well as the total number of PEVs and their electricity demand from ALADIN serve as an input for the eLOAD (energy LOad curve ADjustment) model [6]. In this study, eLOAD is used to determine the least-cost scheduling of PEV-charging depending on an hourly price signal. It thereby simulates the potential contribution of demand side technologies residual load smoothing (also known as demand response, DR).
eLOAD consists of two modules, see the dark blue and grey areas in Figure 2. The first module addresses the long term evolution of the national system load curve, which is driven by structural changes on the demand side and the introduction of new appliances (such as PEVs). By using appliance specific load profiles, such as typical day profiles, regression based load profiles etc., a yearlong load curve can be generated for all of the considered appliances for the base year. The load curve is then scaled according to the respective annual demand in the base year. These load curves are deduced from the system load curve of the base year. The resulting remaining load curve and the appliance specific load curves are then scaled for all of the projection years, according to the yearly demand evolution. Reassembling the scaled remaining load and the scaled load curves gives the load curve of the projection year.
The main advantage of this approach is its ability to properly take structural changes in the load curve into consideration by explicitly modelling the main drivers for load deformation while preserving stochastic outliers and characteristic irregularities from historic load curves.
The second module of eLOAD addresses the active adjustment of the load curve by means of DR. In this study, eLOAD optimizes the national DR deployment to the objective of smoothing the net load. Net load smoothing enables an efficient operation of existing electricity generation assets and grid infrastructure, as well as a reduced need for investment in new capacities [6,7].
eLOAD is an established model that has frequently been used in German and European studies for policy makers and industrial customers [8]. Regarding the validation of the eLOAD model, a benchmark with real world data is not yet possible, since the implementation of DR programmes is carried out only to a very limited extent. However, the importance of considering structural changes in the load curve is discussed in [9], and a demonstration of the plausibility of the results can be found in [6].
For this study, the methodology to represent mobile storages in the model was improved to better reflect the particular characteristics.
With respect to PEVs, eLOAD now considers technical (battery storage size) and organizational constraints (driving and parking cycles, charging capacity), that are characteristic for mobile storages, when determining the least-cost scheduling of PEV charging. When it comes to organizational constraints, PEVs are characterized by the fact that their storages are not connected continuously to the electric grid. Thus, a storage capacity with a reduced availability and load corridor has to be considered when not all PEVs are connected to charging points. The connection to a charging point depends on the location of the vehicle, as well as on the availability of charging infrastructure.
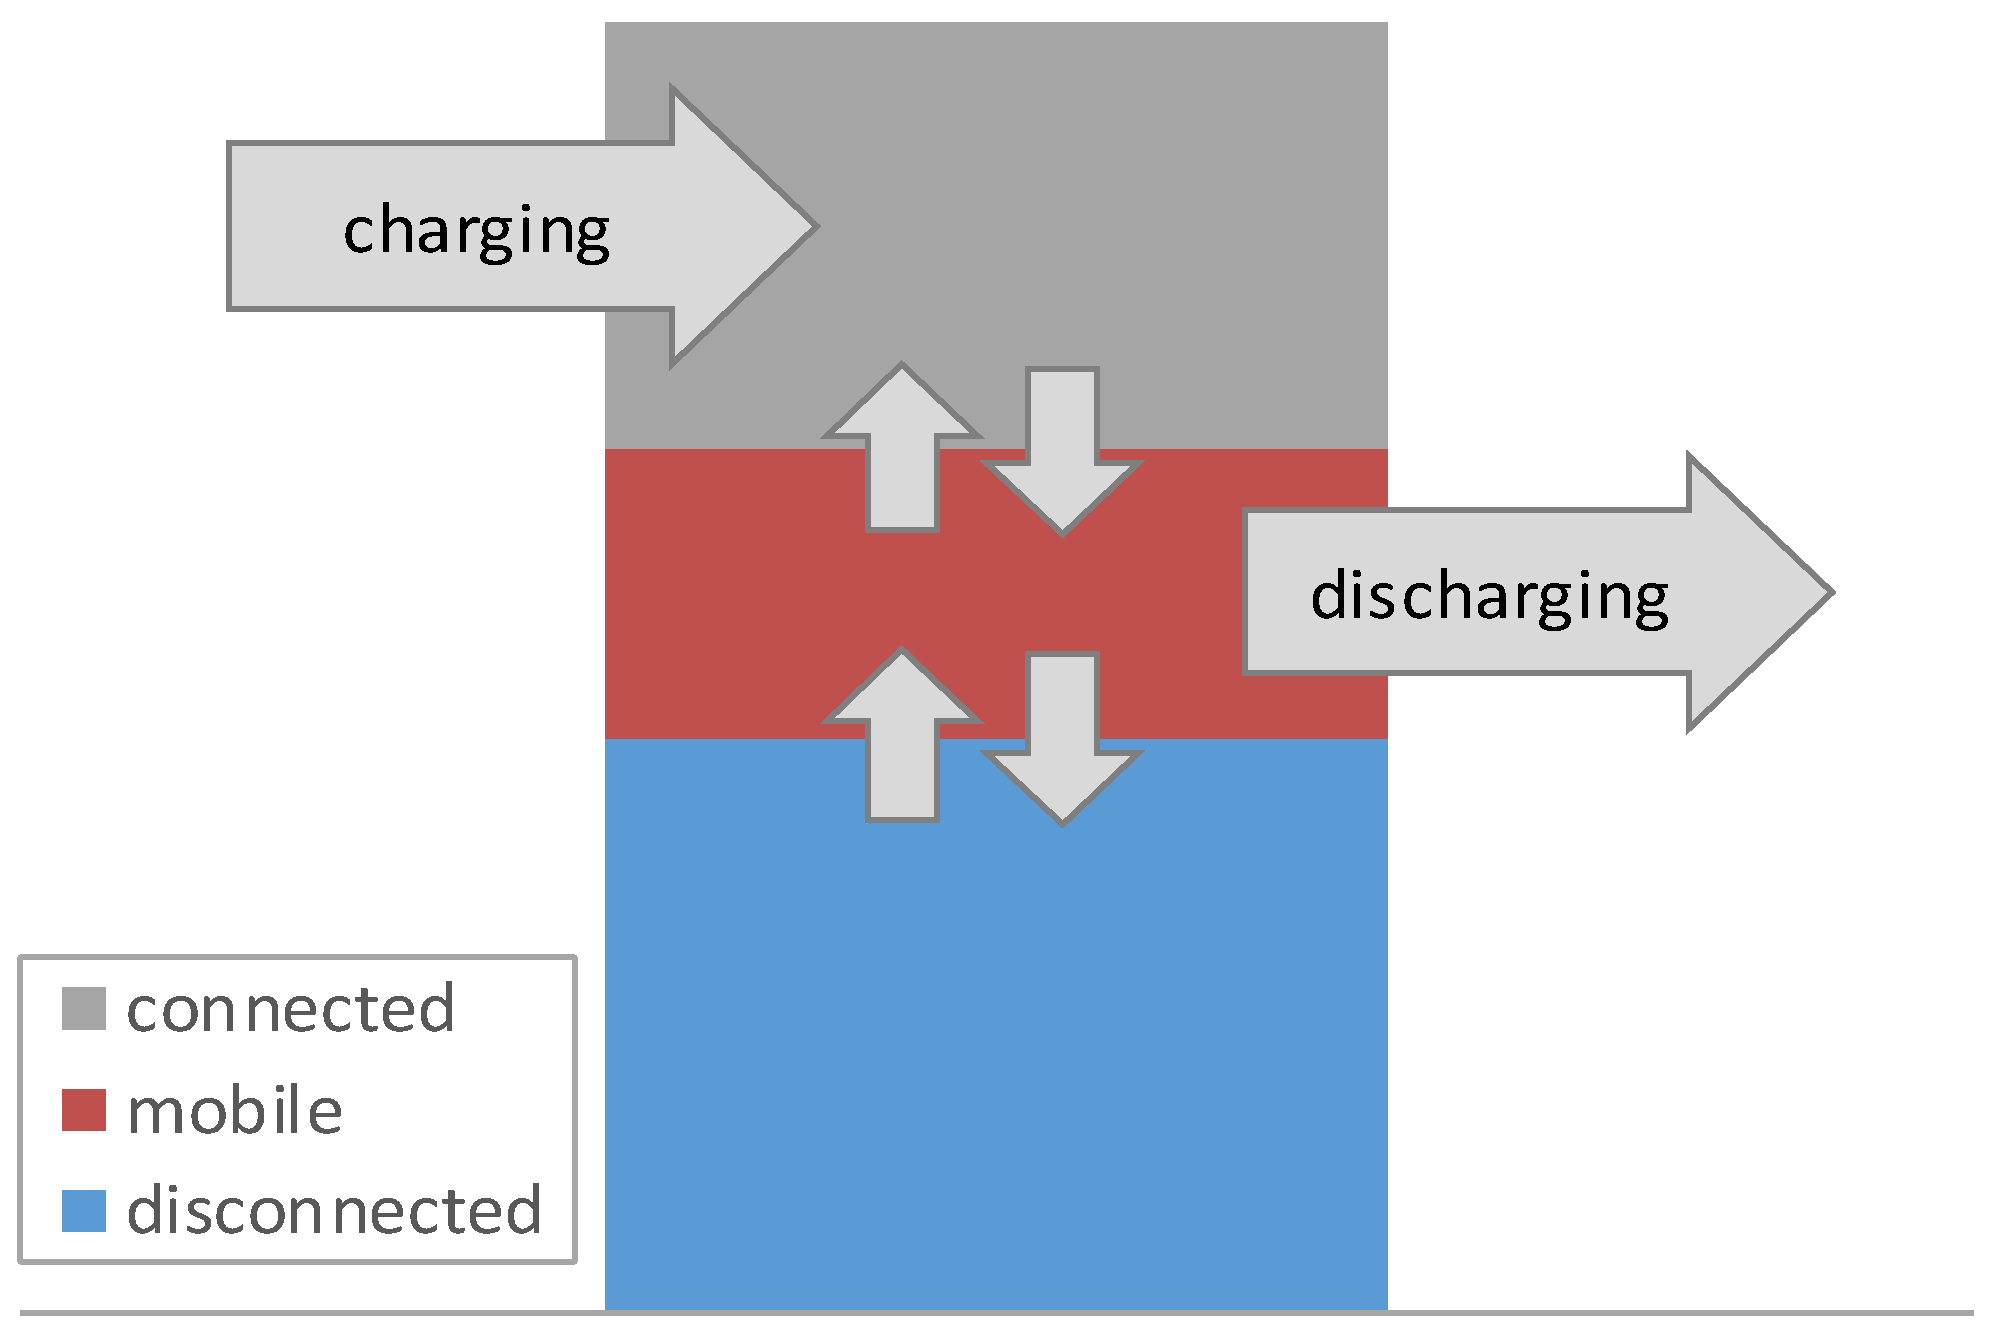
To implement these availability constraints, PEVs are differentiated into three storage groups in eLOAD:
  • connected: parked vehicles that are connected to a charging point and can be charged;
  • mobile: all vehicles that are currently driving and therefore discharge; and,
  • disconnected: parked vehicles that are not connected to a charging point, e.g., located on a parking lot without charging infrastructure, that are not available for load shifting.
If each of the storage groups is regarded as its own sub-system, the following energy exchange between the groups is possible:
  • connected: Energy can be supplied via battery charging; additionally, a bidirectional energy exchange with the mobile group: the connected vehicle can switch into the mobile group (drive off) or mobile vehicles can enter the connected group (arriving vehicles);
  • mobile: Energy is extracted from the system through driving and thereby discharging the battery; mobile vehicles can switch into the connected or disconnected groups depending on whether they arrive at a parking location with or without a charging point; and,
  • disconnected: Only the bidirectional energy exchange with the mobile group is possible. The battery cannot be charged or discharged.
Figure 3 illustrates the energy flows in the different storage sub-systems.
The storage capacities and charging loads of the different storage groups are calculated as the product of the overall PEV storage and the time dependent share of connected, mobile, and disconnected vehicles. For a deeper insight into the model, in the following, we provide a formal description of the objective function and the relevant constraints for the least-cost scheduling of PEV charging:
The objective function of the linear optimization problem minimizes the costs of the load shifting activity:
M i n   i = h m i n h m a x j = h m i n   i P l s , i j · ( p j p i )
With the shifted load from hour i to hour j Pls,ij, the hourly electricity price p and the consumption increase factor cifls, where i ≠ j and i, j є [hmin; hmax]. Here, we only analyse the load shifting potential of PEVs, thus no consumption increase is considered for load shifting (cf. consumption increase factor in [6]). In the absence of a market model, the prices are equal to the net load, which is the case in this study.
The ability of a process to adjust its load is first and foremost restricted by the load bounds, i.e., the minimal and the maximal load Pmin and Pmax, respectively:
  P m i n P h +   P h , l s P m a x
With the original charging load in each hour Ph, the shifted load to and from each hour Pls,h.
Additionally, the load shifting ability is restricted by the storage capacity. In the case of mobile storages, the storage constraints are formulated for the above-described groups of connected, mobile, and disconnected vehicles. The capacities of the individual groups are calculated from the total storage capacity in PEVs and the time-dependent share (vsh, vehicle share) of connected, mobile, or disconnected vehicles. The capacity of connected vehicles is restricted by
  S F L m i n · v s h c o n n , h [ h = h m i n i P h   h = h m i n i P l s ,   h ]   h = h m i n i v e x c o n n m o b ,   h S F L m a x · v s h c o n n ,   h
With the minimal and maximal storage fill levels SFLmin and SFLmax, respectively. The share of connected vehicles in each hour is referred to as vshconn,h, and the energy that is taken out of the system with bidirectional exchange of energy via the transfer of vehicles (vex, vehicle exchange) form the connected to the mobile state in each hour vexconn-mob,h.
While mobile storages are subject to
  S F L m i n   · v s h m o b ,   h h = h m i n i v e x c o n n m o b , h   h = h m i n i v e x m o b d i s c o n n ,   h   h = h m i n i P d i s ,   h S F L m a x · v s h m o b ,   h
Further, the amount of energy in the mobile storages in the beginning and at the end of each optimization interval must be equal:
  h = h m i n h m a x v e x c o n n m o b ,   h h = h m i n h m a x v e x m o b d i s c o n n ,   h     h = h m i n h m a x P d i s , h   =   0
With the share of mobile (driving) vehicles in each hour vshmob,h and the discharge load in each hour Pdis,h. The electricity exchange via vehicle transfer from the connected to the mobile state in each hour is denoted as vexconnmob,h and the transfer from the mobile to disconnected state is referred to as vexmob-disconn,h.
Disconnected storages are subject to
  S F L m i n ( 1 v s h c o n n ,   h v s h m o b , h ) h = h m i n i v e x m o b d i s c o n n , h S F L m a x ( 1 v s h c o n n ,   h v s h m o b , h )
Again, the amount of energy in the disconnected storages in the beginning and end of each optimization interval must be equal. Since only a bilateral exchange via vehicle transfer is possible in the case of disconnected storages, the vehicle transfer is constrained by
  h = h m i n h m a x v e x m o b d i s c o n n , h = 0
In addition to the storage constraints, also the bilateral energy exchange via vehicle transfer is restricted. The following constraints for the exchange between the individual storage groups ensures that the exchanged energy between the groups does not exceed the available storage capacities:
    S F L m a x · v s h c o n n ,   h v e x c o n n m o b , h S F L m a x · v s h c o n n , h
    S F L m a x · v s h m o b , h v e x m o b d i s c o n n , h S F L m a x · v s h m o b , h
    S F L m a x   ( 1 v s h c o n n , h v s h m o b , h ) v e x m o b d i s c o n n , h
The above described modelling approach results in a quantitative load shifting potential, providing detailed information about the seasonal, weekly, as well as hourly load shifting availability of the individual appliances. It generates a smoothed net load curve that may be used in an electricity market model to quantify the impacts of DR on the electricity system. We may now determine the load shift potential of electric vehicles from different user groups (private, commercial fleet, and company cars) at different charging facilities (domestic, work, and public).

3. Data Sources

3.1. Data Used in the ALADIN Model

The main data source used in the model ALADIN is vehicle driving profiles, i.e., all trips of vehicles in a certain time period (here: at least one week). These profiles also contain socio-demographic information of the driver, the household and vehicle in the case of private vehicles, as well as information about the vehicle and the company owning it for commercial fleet vehicles. Since geographical information is necessary, we use the mobility panel for Stuttgart (MOPS) and driving profiles of REM2030 in the same area for commercial driving profiles [10,11] Unlike in [12], we do not use MOP [13], which contains data representative for Germany, since we need the geographical information in MOPS. Results were tested for representativeness for the German car sales in [8] and were suitable for this purpose. Profiles for company cars were selected and information on garages and the willingness to pay more for PEVs was added and tested in [8], and will be used here. As the joint simulation of several thousand vehicles profiles is quite computation intensive, only a share of profiles is considered in the simulation. An overview of the full sample and the used share are presented in Table 1.
Since results for Stuttgart have to be extrapolated to Germany, the registrations are multiplied by 20.54, which is equal to the inverse of the share of the regions’ registrations in Germany.

3.2. Data Used in the eLOAD Model

The database of the eLOAD model includes four types of data: hourly load profiles, historic load curves, and a temperature time series, as well as appliance specific demand response parameters. The load profile data base comprises more than 500 hourly load profiles from various types of industrial, commercial, and residential appliances or processes. The load profiles are available either for the length of an entire year (8760 h) or as average profiles for typical days (distinguished by weekday, season, and in the case of heating and cooling technologies by temperature). The data originate from various national and international surveys and field tests; see [6,8] for further details. Some national profiles are transferred to other countries by means of time use surveys. Historic load curves are provided by the Europe power network association Entso-e [15], temperature time series come from the MERRA data base of the NASA [16].
The demand response parameters, required for the optimization part of eLOAD, include information on the availability and restrictions of appliances that are suitable for demand response activities, as well as system information e.g., on the tarification scheme, see [6].

4. Scenarios and Further Assumptions for Case Study

4.1. Scenario Set Up

For our case study, we define three scenarios with different availabilities of charging infrastructure: In scenario S1, charging is possible when vehicles are parked at home at 3.7 kW and private vehicle users pay for their private charging point. Commercial fleet vehicles charge only commercially at 3.7 kW and pay for this charging point. We increase the availability of charging infrastructure for private users by allowing charging at work at 3.7 kW in scenario S2, while users have to pay for the private charging point and the one at work. Commercial fleet vehicles are charged as in the first scenario. In scenario S3 also public charging at 3.7 kW is possible for private and commercial fleet vehicles (cf. Table 2).
In all scenarios, the individual charging infrastructure (domestic, commercial, and at work) is paid by the vehicle holder and hence used whenever possible. Thus, all of the vehicles are charged whenever they are at domestic, commercial charging spots, and, if available, at work. All users pay for public charging through the public charging price, which contains the costs for public charging infrastructure, including a subsidy from public authorities. For this reason, vehicles are assumed to only be charged in public if the battery is half depleted (to return home), and, in case of PHEVs, driving with electricity from public charging stations is cheaper than driving with conventional fuel.

4.2. Assumptions for PEV Market Diffusion

For the simulation of the PEV market diffusion, we need a variety of technical and economic assumptions. For BEVs, we consider battery sizes of 40 kWh and a depth of discharge of 90%, which results in an average electric driving range of 180 km (2015) to 210 km (2030). The PHEV contains a battery with 10 kWh capacity allowing 42 km (2015) to 50 km (2030) electric driving distance at 80% depth of discharge. All other vehicle parameters are found in [3], while battery and energy prices are shown in Table 3.
Here, we consider an average scenario with a conservative exponential decrease of battery prices and a slight increase of fuel prices based on the New Policies scenario of the World Energy Outlook [17]. Electricity prices increase until 2025 due to the EEG-supplement, but profit from economies of scale for renewable energies in 2030 [13,19,20,21]. The investment horizon as well as holding time for first vehicles is 3.8 years for commercial vehicles and 6.2 years for private vehicles [22,23]. An interest rate of 5% is assumed [12].
Furthermore, we assume infrastructure costs to be very low in the beginning—decreasing 5% per year until 2030 (see [3], Table 4.2). We distinguish charging infrastructure according to the four types of accessibility (at home, at work, commercial, and public) and also consider for private users if they own a garage. The investment horizon is assumed to be 15 years [24]. Previous simulations showed that charging points always need to be subsidized [3]. Thus, we use a subsidy, as suggested in Scenario “home, work & public” in ([3], p. 116), which assumes that public charging points receive a subsidy of 85% of its annual cost in 2015 linearly decreasing to 0% in 2030.

4.3. Assumptions for Optimal Vehicle Charging

The simulation of optimal vehicle charging is subject to technical restrictions. To be consistent with the assumptions in the ALADIN model, the average storage capacity in each year is assumed for the individual PEVs.
We assume that the electricity demand has to be supplied on each day, i.e., loads cannot be shifted from one day to the next. As long as the vehicles electricity demand is supplied on time for the next trip, it is assumed that the charging load of each vehicle can be controlled for the entire time interval in which the PEV is connected to the grid. Possible user interferences or user preferences are not considered here, which results in the technical potential of optimal load-scheduling.

4.4. Development of the Electricity Sector

For the eLOAD model, assumptions are needed that describe the future development of the electricity sector in Germany. As written above, the first module of eLOAD addresses the long-term evolution of the national system load curve. Therefore, information is needed on the total electricity demand. In this case study, we refer to the scenario framework of the “Leitstudie” [25]. According to this source, the total electricity demand will decrease by 9% in 2020 and by 15% in 2030 in Germany when compared to the electricity demand of 523 TWh that occurred in 2010. This decline is due to efficiency improvements that are expected for applications in the electricity sector. Furthermore, the renewable energy sources shall be expanded in Germany in order to reduce CO2 emissions. For calculating the residual load, the electricity that is produced by renewable energy sources is also taken from the study “Leitstudie” [25]. Thus, it is assumed that 35% of the electricity will be provided by renewable energy sources in 2020, which will increase to 50% in 2050.

5. Results of Case Study

5.1. PEV Market Diffusion

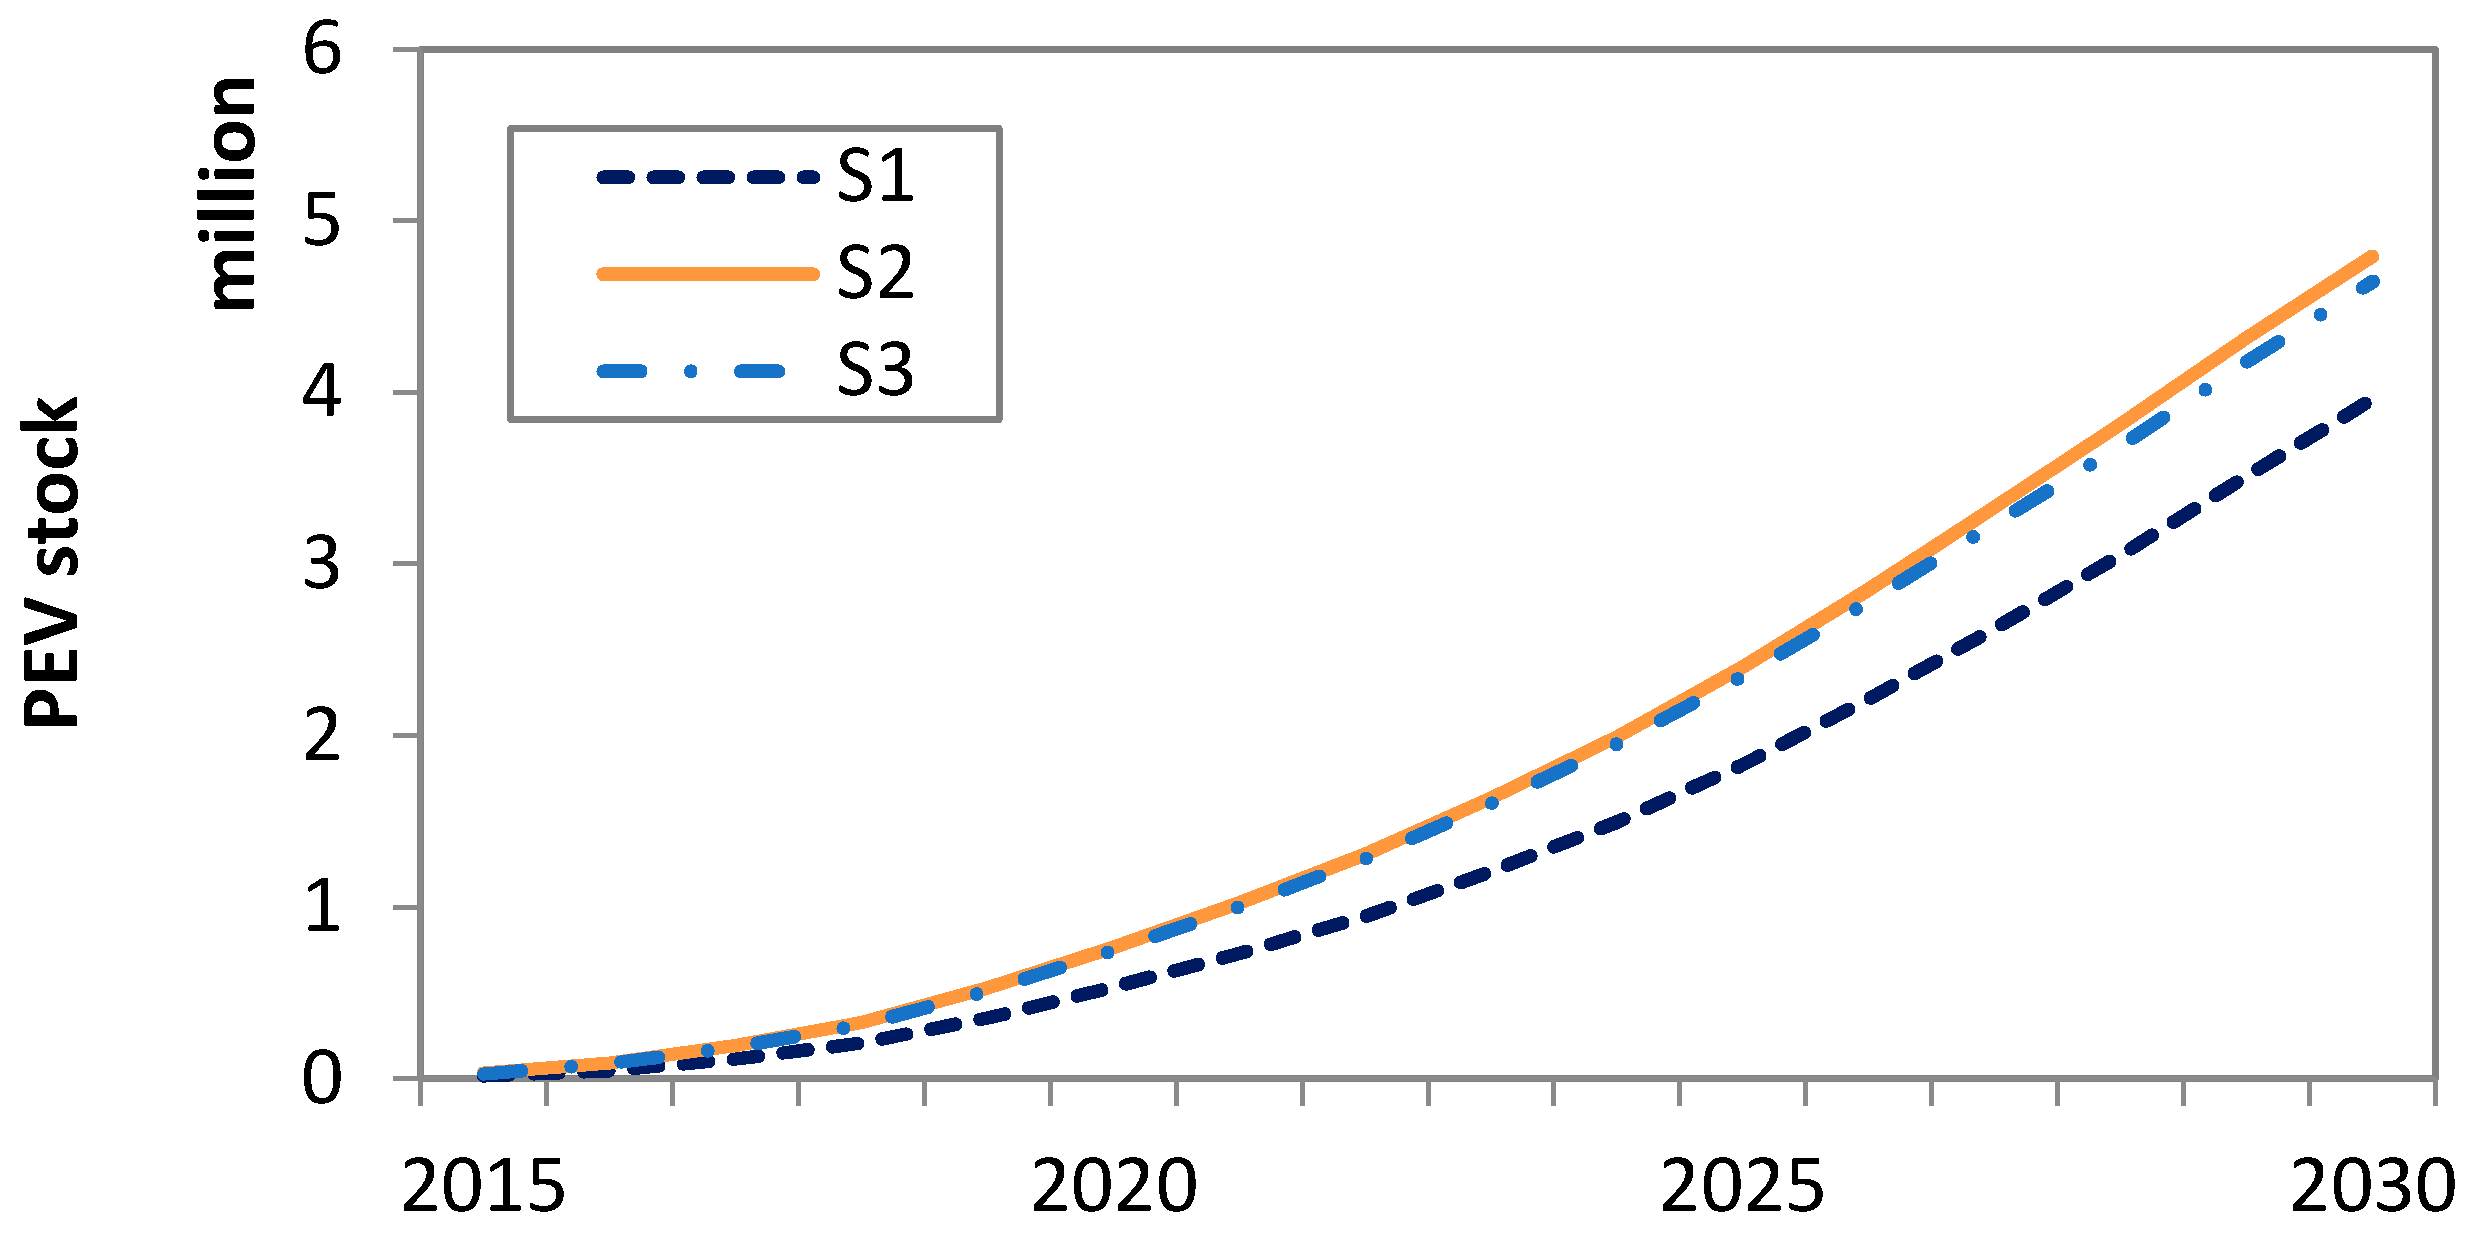
Let us now turn to the simulation results for the PEV stock. Figure 4 illustrates the results of the simulations for PEVs in the three scenarios from 2015 to 2030.
We can observe the following: The PEV stock rises to four million vehicles in the home charging scenario (S1), 4.7 million when home and work charging are allowed (S2), and to 4.7 million PEVs in the home, work, and public charging scenario (S3). Thus, with the availability of additional work charging infrastructure, the PEV stock may increase by about 700,000 vehicles. However, additional charging infrastructure in public has no effect on the PEV stock. This is a surprising result, which has been intensively discussed in [3].
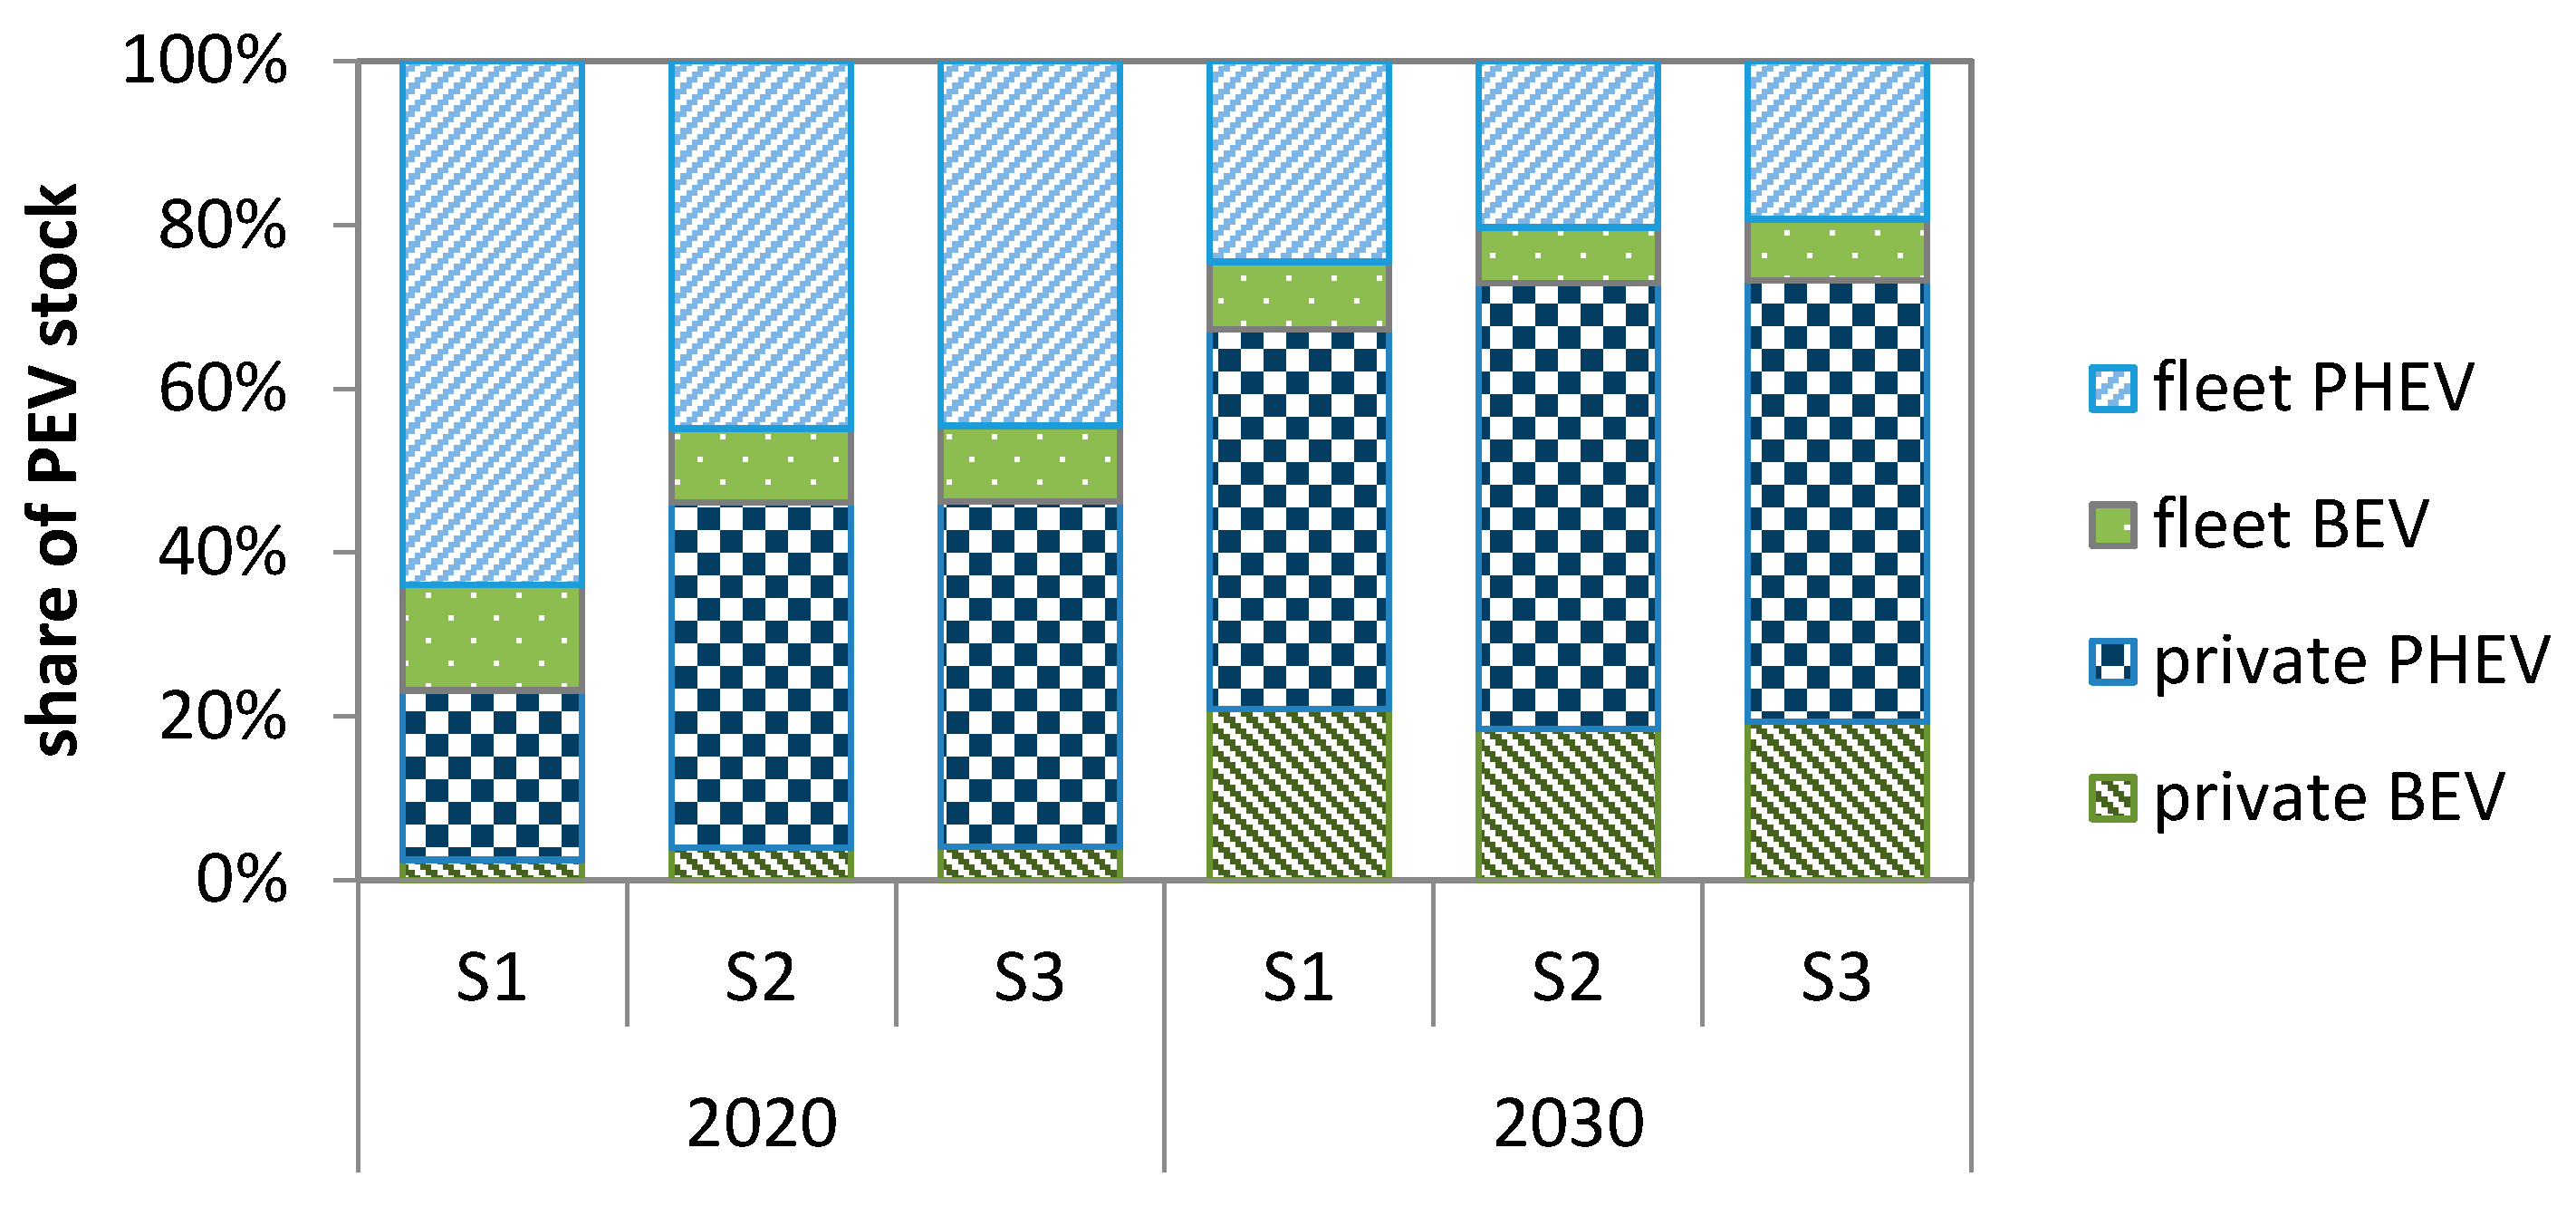
Interesting for the load shift potential is also the share of private and commercial fleet vehicles, as well as company cars and the number of BEVs and PHEVs. These shares are shown in Figure 5 and Table 4.
Here, the PEV stock in 2020 and 2030 is decomposed into six vehicle user groups: private BEVs (green dashed), private PHEVs (blue squared), fleet BEVs (green dotted), and fleet PHEVs (blue dashed), and company BEVs and PHEVs, which have a share below 1% and are thus not shown at all. We can observe that the PEV stock is dominated by PHEVs (80% in 2020 and 70% in 2030), which is important since their battery sizes decrease the load shift potential. Further, it is clearly visible that fleet vehicles are important to consider in 2020 (about 80% with private charging only (S1) and about 55% if charging at work is also possible (S2)), but also in 2030 when their stock shares are still around 25–30%. This is also an important finding as fleet vehicles drive significantly more and more regularly than private cars [3]. Hence, the shape of their load curve could be different. This will be analyzed in the next section.

5.2. Optimal Vehicle Charging

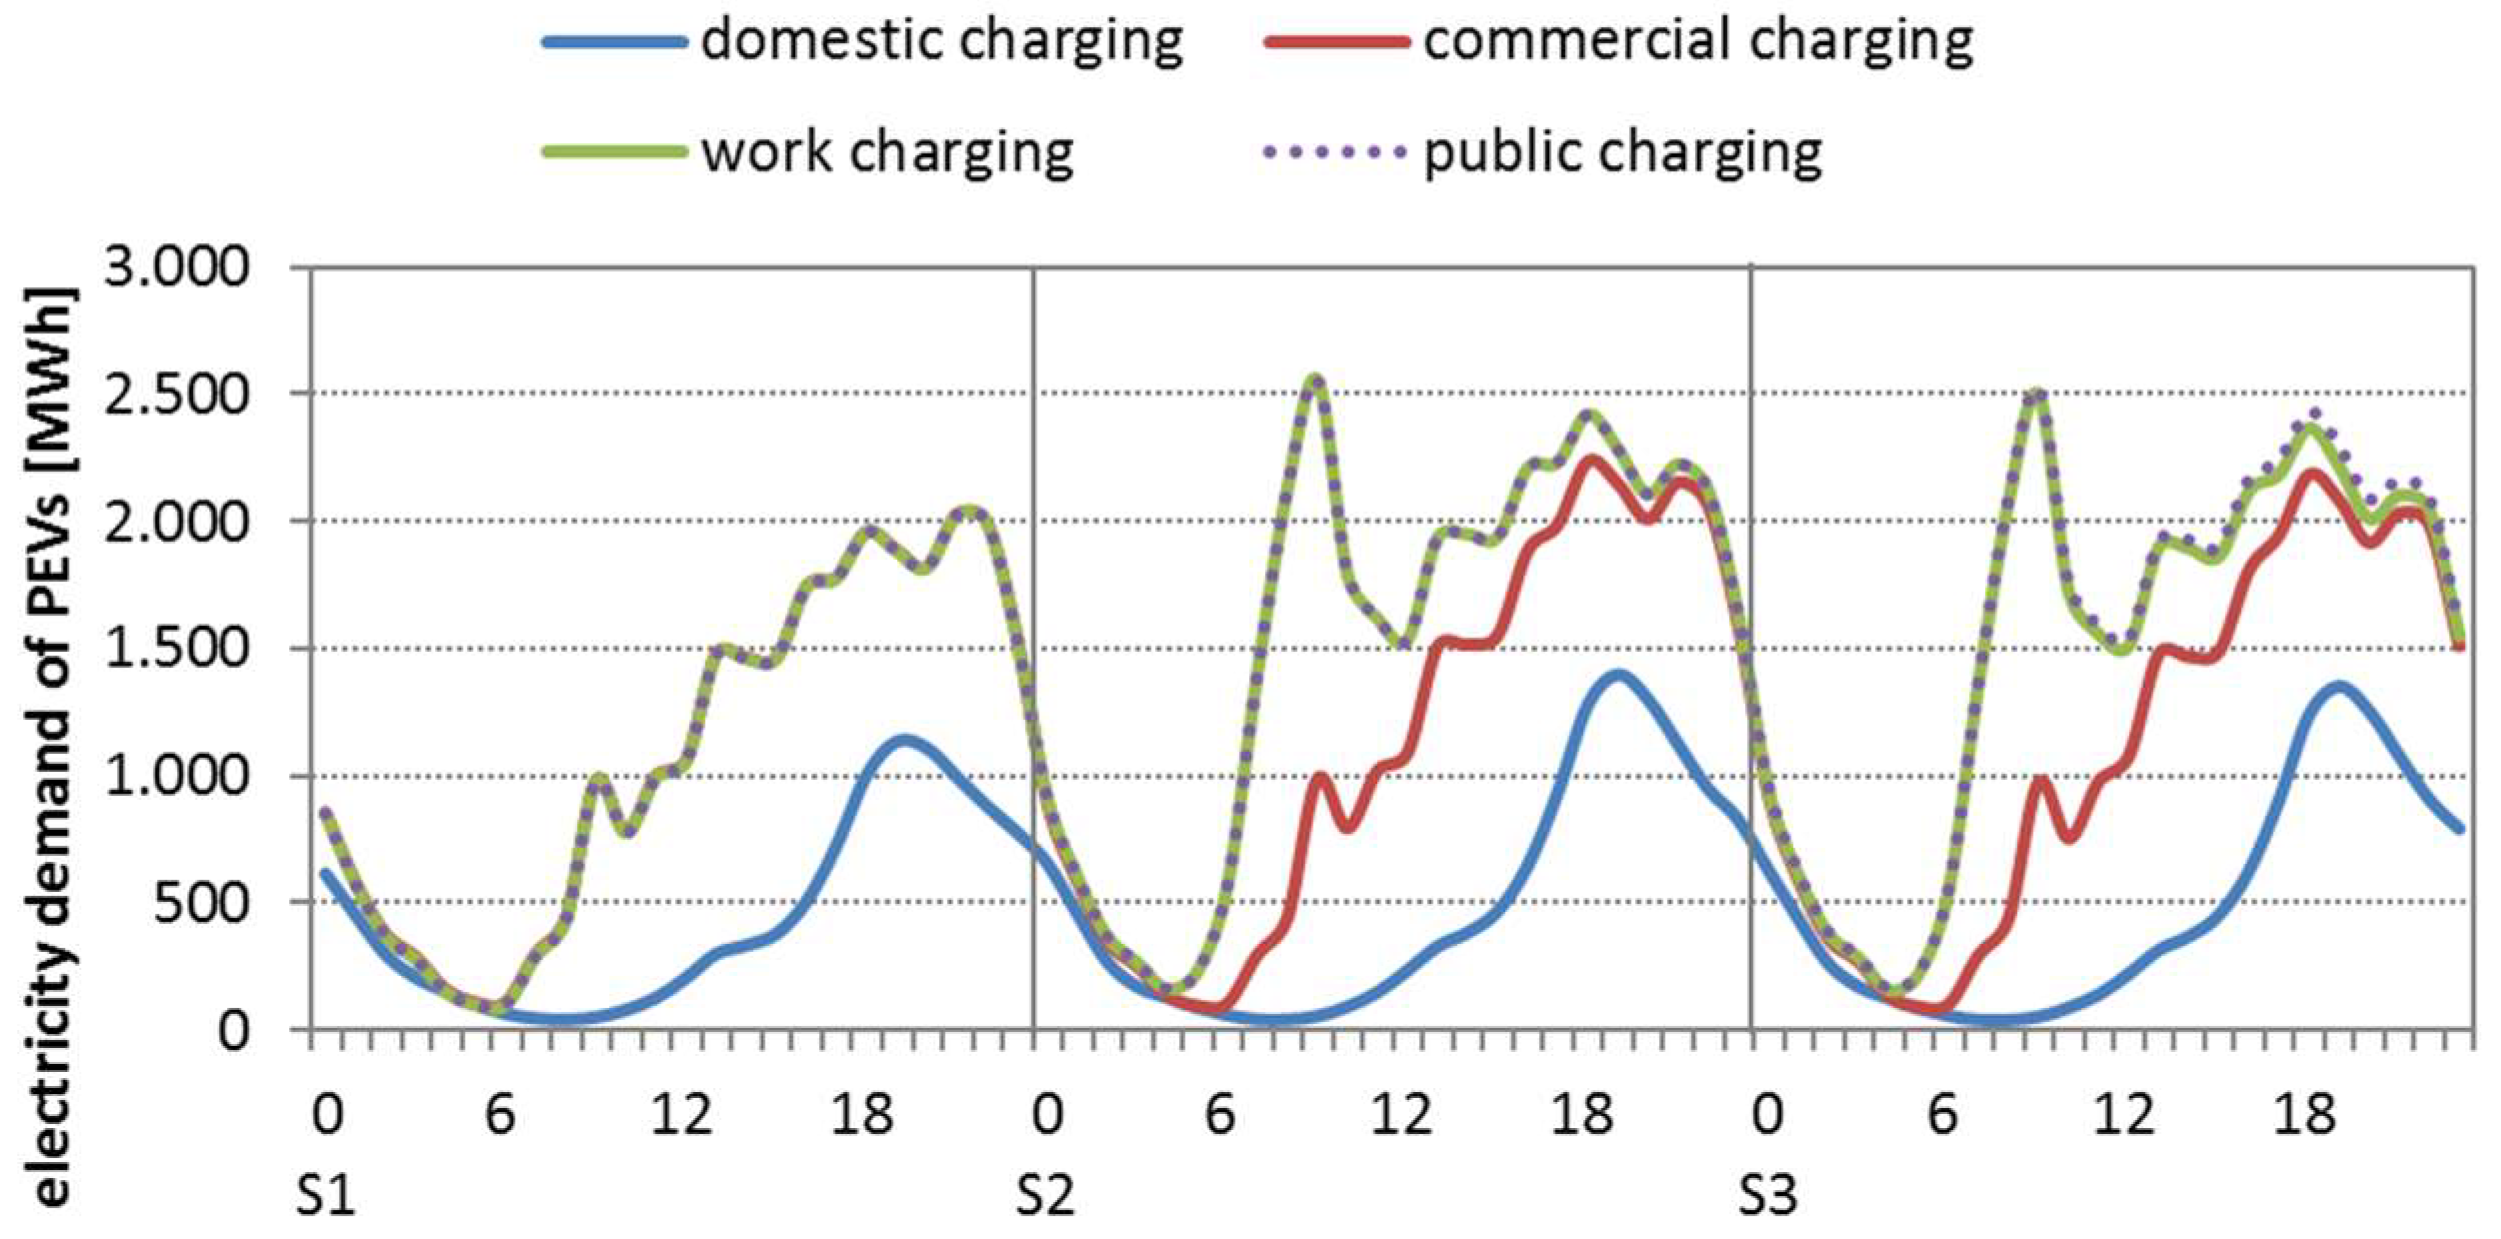
We first take a look at the load curves of a regular Tuesday for all three scenarios that are shown in Figure 6. We chose a Tuesday for comparison since most vehicle profiles start on Monday and we thus may see some untypical effects. As the PEV stock and the charging options differ, especially in scenario S1 when compared to S2 and S3, their load curves vary too. In scenario S1, we find the typical load curve of private electric vehicles with a lot of charging overnight when vehicles are parked at home. Commercial charging, however, more often occurs during the day when commercial fleet vehicles are often parked at the company. Their charging also increases the evening peaks, yet a lot of charging is performed during the day when a substantial amount of electricity from RES is available. Turning to the possibility of additionally charging at work in S2, we find that an additional load peak occurs in the morning hours when people arrive at their workplace (green coloured area). Again, this may be favourable to match the demand and supply of RES electricity even without load shifting (see also [2]). If public charging points are added in S3, only a small part of the electricity demand is covered by these additional charging options (purple coloured area), which also occurs in the evening (peak) hours.
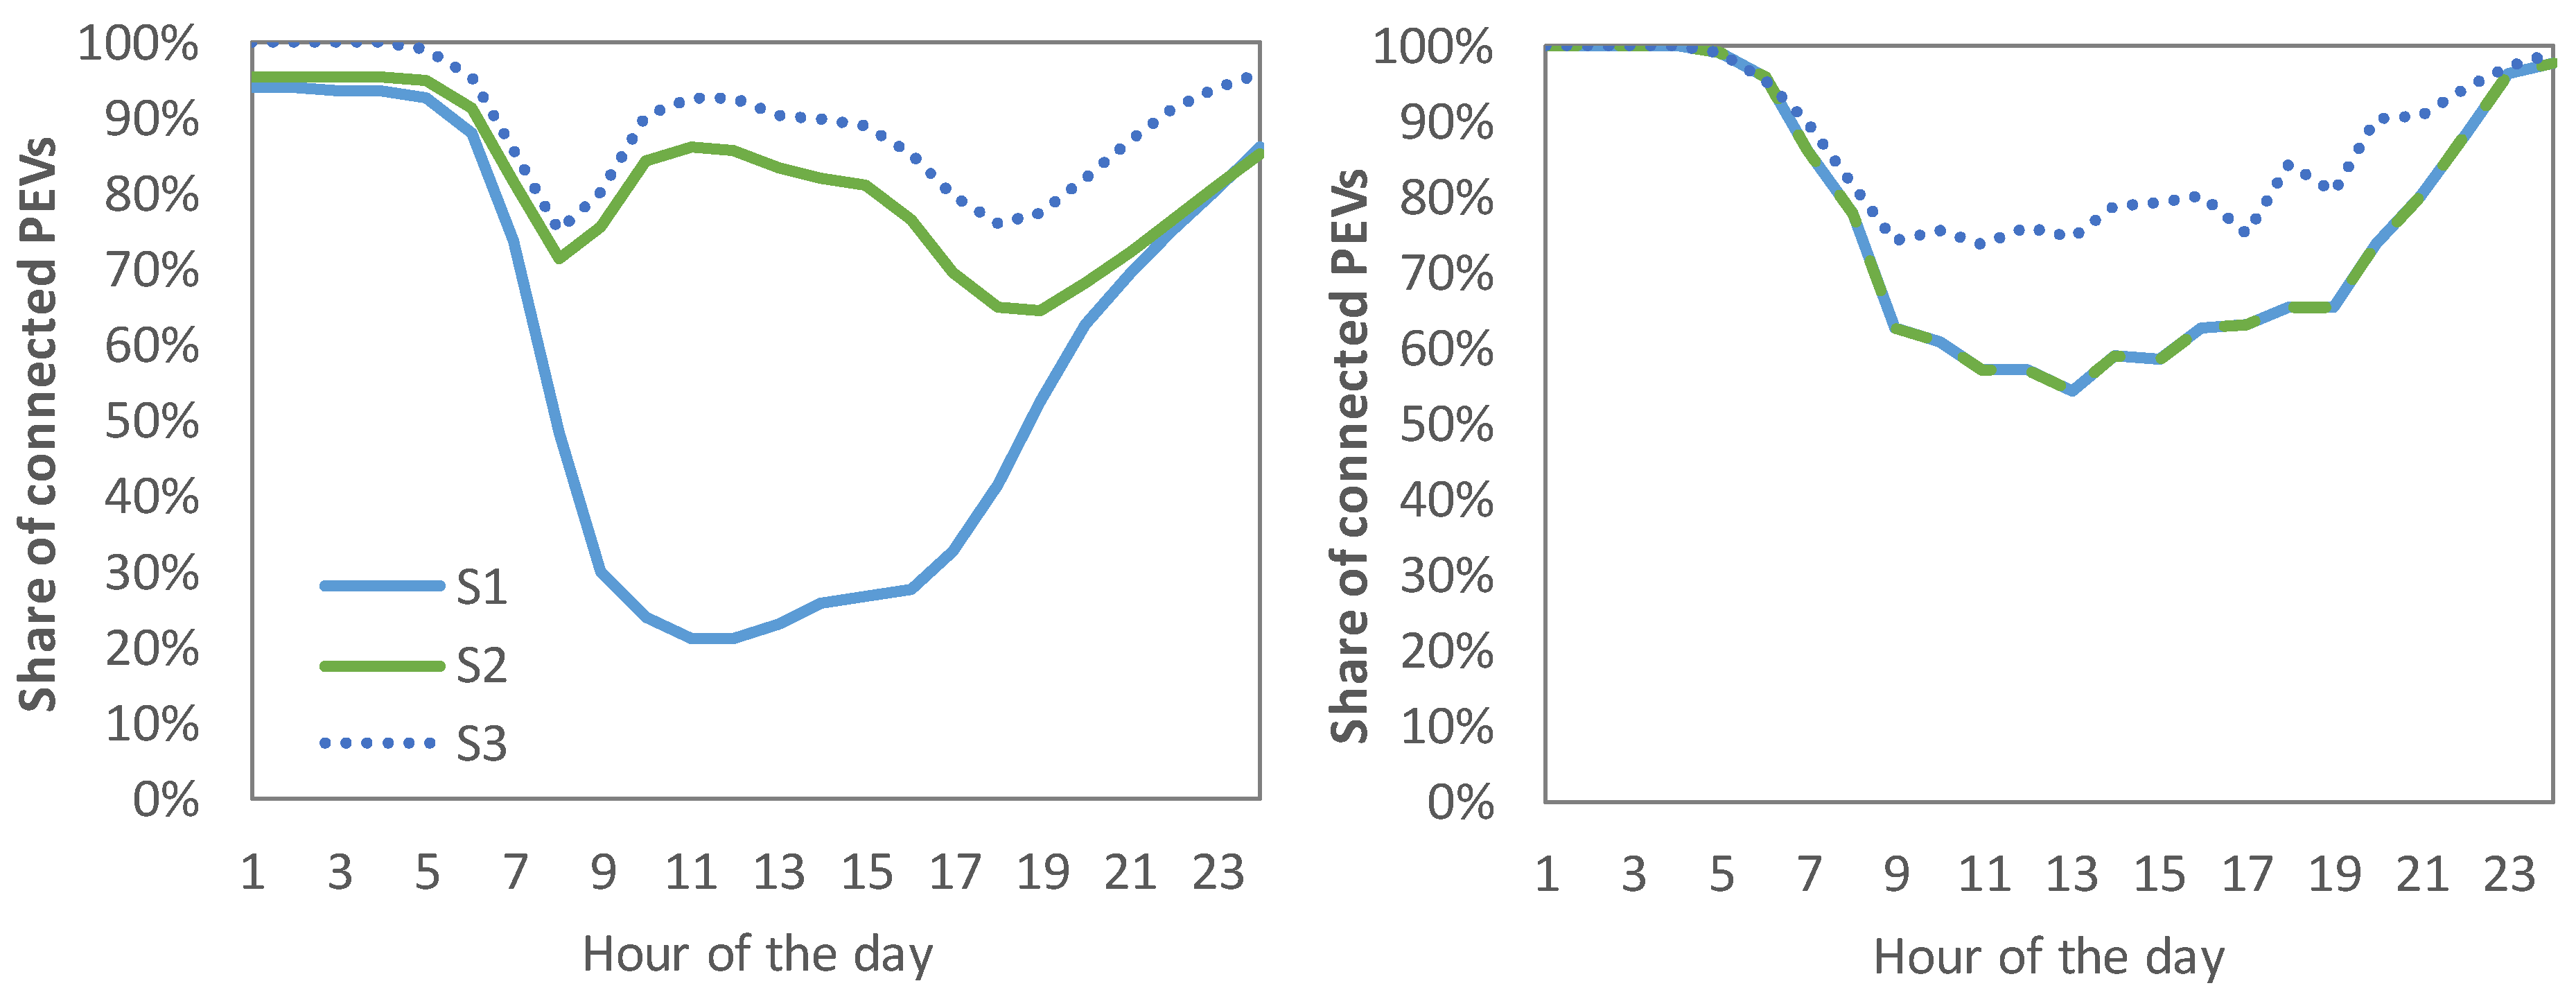
When considering demand response, the charging of electric vehicles in summer time is primarily shifted into midday hours due to substantial PV-based power generation and a correspondingly low level of the net load. In the winter season, vehicle charging is partially shifted into night time hours, especially at days with low solar generation. As described in the methodology section, the ALADIN model provides time-dependent shares of PEVs in the three storage groups connected, mobile and disconnected, which serve as organizational constraints within the eLOAD model. The hourly shares in each group are calculated from individual driving profiles and the vehicle stock in each year. Figure 7 depicts the hourly share of PEVs in the connected state for Tuesdays for private cars (left panel) and commercial vehicles (right panel) in the different scenarios. Since PEVs can only be charged in the connected state, the figure illustrates that the possibility to shift charging loads to the middle of the day is greatly enhanced in the scenarios S2 and S3. The reason is the possibility to charge private passenger cars at the workplace, where they are parked during the day. In the scenario S3, the option of charging in public places enhances the availability of private cars further, and additionally allows for a higher share of connected commercial PEVs during the day.
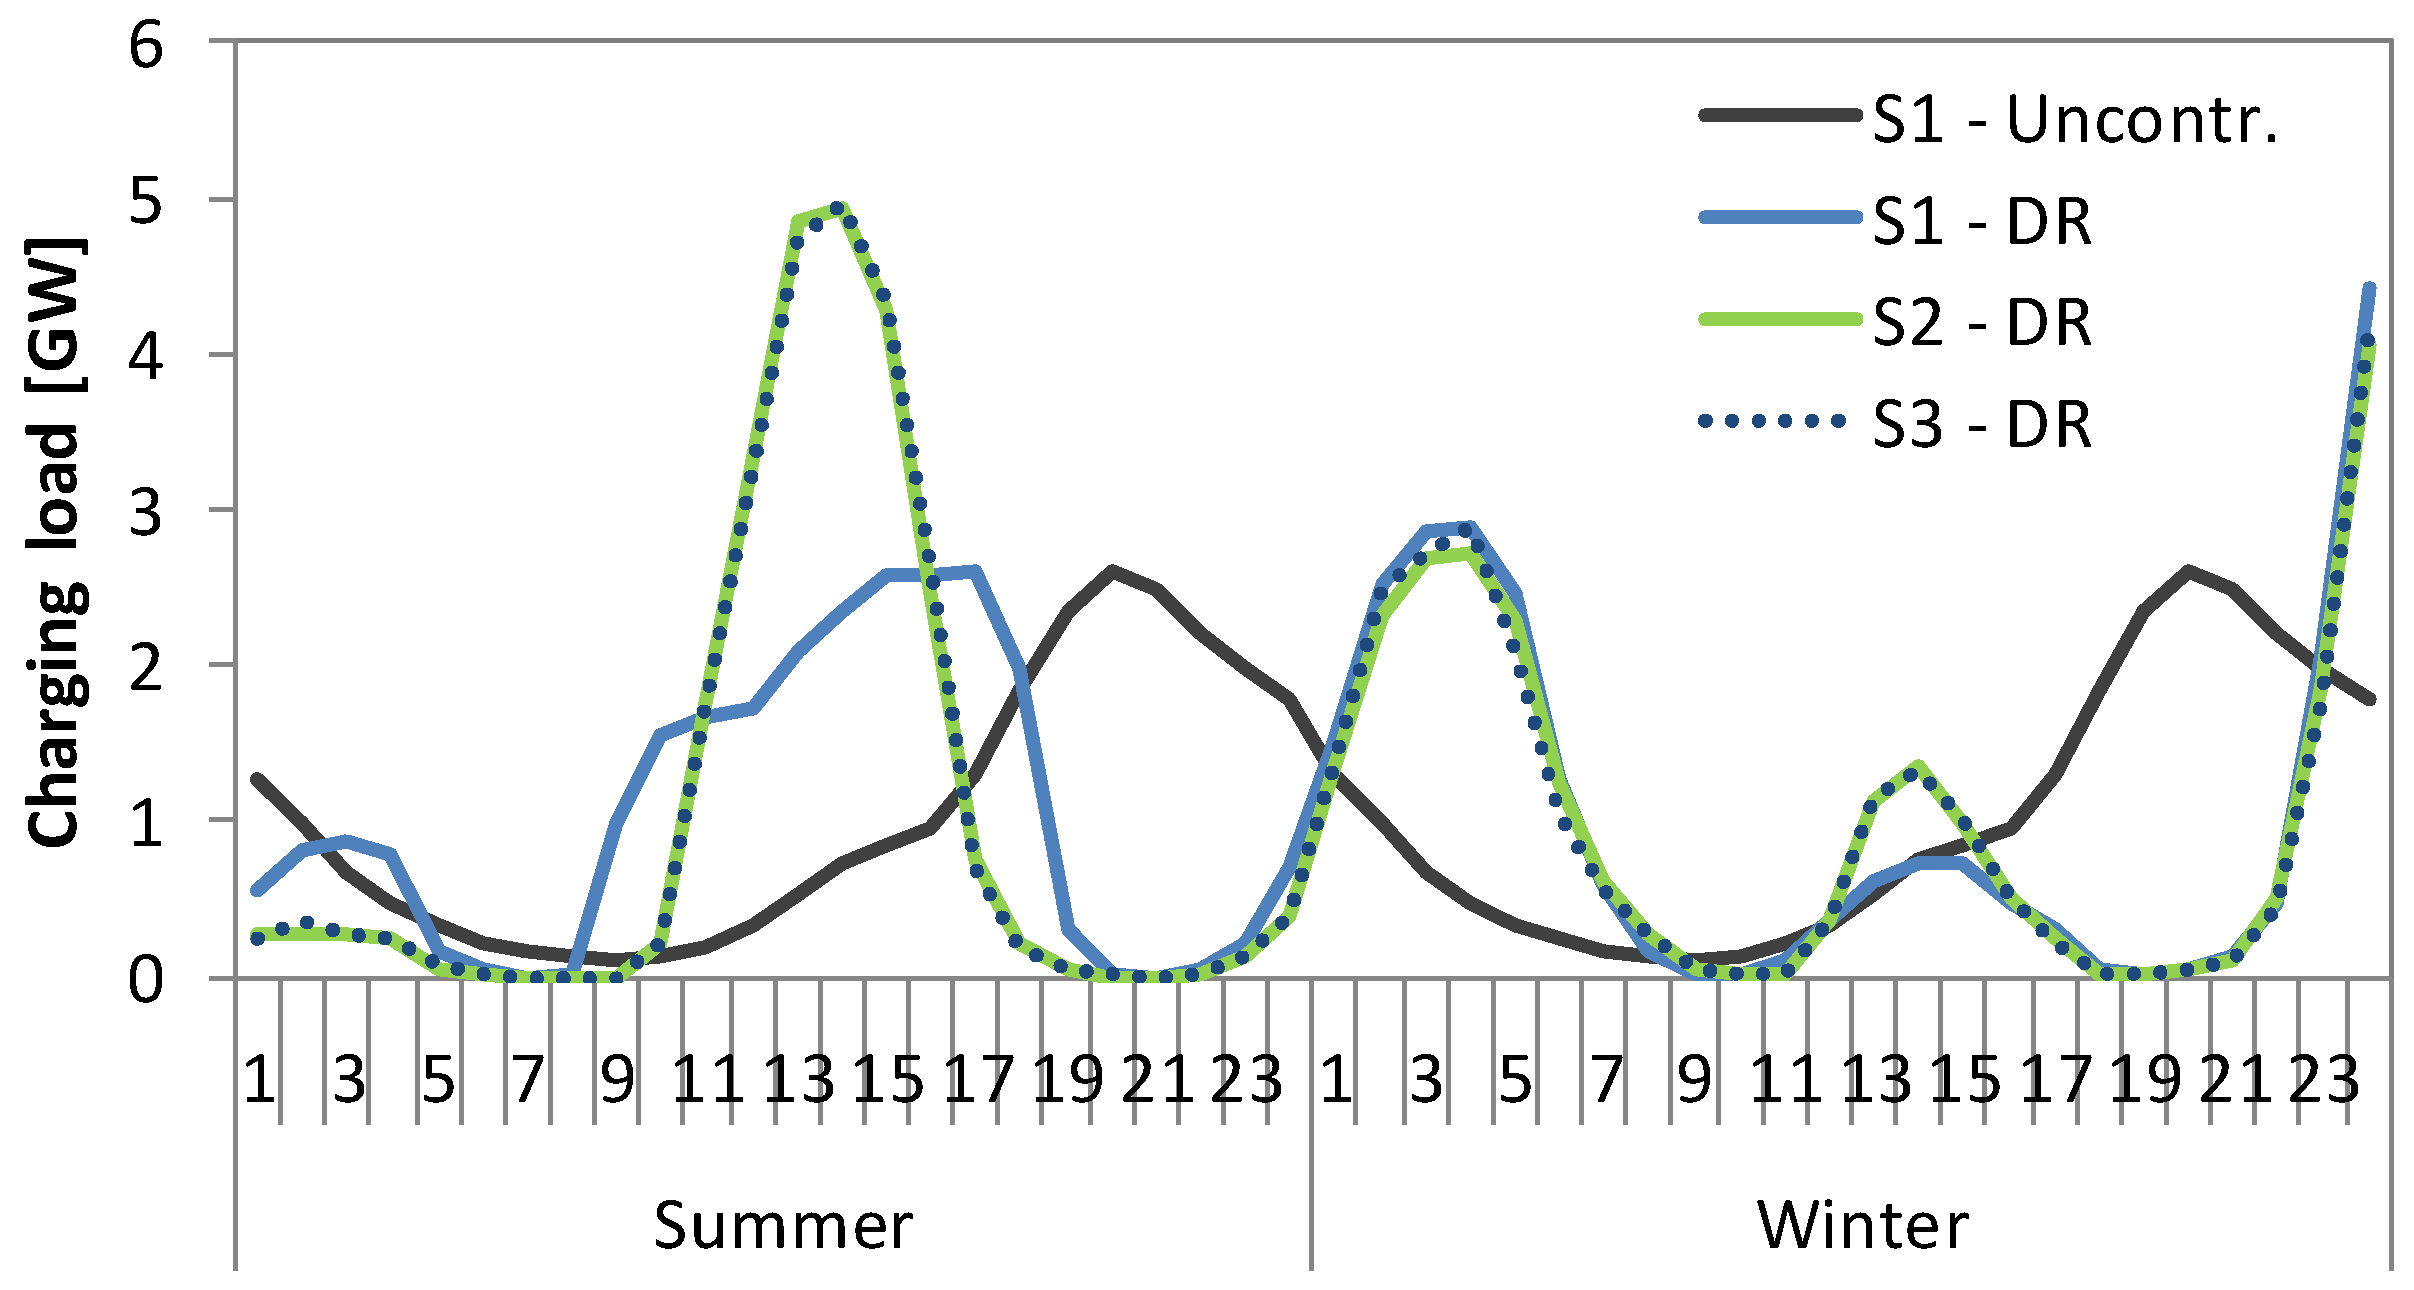
The different charging options between the scenarios lead to significant differences in the electricity consumption when the demand response option is considered. Figure 8 compares the load profiles of uncontrolled charging (black line) and optimized charging (demand response (DR)) in scenario S1 (blue line), S2 (green line), and S3 (dotted line). The figure illustrates that the additional charging option at work leads to a new load peak in summer at midday, when load is shifted towards hours with substantial PV-based power generation and a correspondingly low net load. In the winter season the load is shifted primarily into night hours, and the effect of the charging option at work is considerably smaller. If public charging points are added in scenario S3, the electricity consumption remains almost the same. Hence, the availability of electric vehicles during hours with a low net load is already sufficient when charging at home and at work is possible.
To address the effect of the demand response option on the net load, optimal vehicle charging is compared to uncontrolled charging for the scenario S3 in Figure 9 (left panel-uncontrolled charging, right panel-demand response). The net load curve is characterised by a valley during midday hours with substantial PV power production, especially in the summer months. In Winter, the midday valley is less pronounced, and the lowest net load occurs in the night hours. Consequently, the optimal charging of electric vehicles is generally scheduled at midday, and additionally, during the night hours in winter. Both private and commercial vehicles are able to shift substantial amounts of their charging load, due to overall high shares of vehicles in the connected state in the scenario S3 (for the availability, see Figure 7).
In scenario S3, the described deployment of load shifting can facilitate peak shaving of the system load by about 2.2 GW or 2.8% when compared with a scenario without load shifting. Thus, the surplus of electricity by RES can be reduced by 1.8 TWh or 30% (see also Table ) resulting in 1.8 TWh of RES surplus used for charging of PEVs. In contrast, uncontrolled charging of electric vehicles at work, at home, and in public raises electric load by more than 2 GW, in particular, at current peak hours (at 10:00 a.m. and 7:00 p.m., see left part of Figure 9).
Table 5 lists the reduction of RES surplus electricity and the peak load reduction for all three scenarios. The reduction of RES surplus is significantly lower, when only charging at home is possible for the private PEVs (0.2 TWh less than in scenarios S2 and S3). Additionally, the peak load increases in the scenario S1. This stems from the limited possibility of load scheduling, which results in large amounts of charging load being shifted towards the night hours in winter, and thus creating a new load peak.
The additional public charging points in scenario S3 only have a small effect on the RES surplus reduction, as well as on the peak load reduction. Nevertheless, the results of scenarios S1 in comparison to S2/S3 show that additional charging infrastructure at work does not only promote the diffusion of private PEVs, but also enables vehicle charging during midday hours when solar electricity generation is highest.

6. Summary, Discussion, and Conclusions

The aim of this study was to analyse the load shifting potential of plug-in electric vehicles when taking different accessibility types of charging infrastructure (domestic, work, and public charging options), as well as different types of vehicle user groups into consideration. We found that the market projections for plug-in electric vehicles are dominated by commercial fleet vehicles (at least in 2020) and plug-in hybrid electric vehicles (also until 2030). This largely influences the load curve of electric vehicle charging, since commercial fleet vehicles charge more often during the day when electricity from RES is available. Apart from that, an additional charging option at work also shifts charging of private cars into the day creating an additional morning peak. Additional charging options in public neither have meaningful effect on the electricity demand of PEVs nor on the load shifting potentials. Demand response can reduce the total amount of RES surplus electricity by 1.6 TWh (26%) if only domestic charging options are available and by 1.8 TWh (30%) with additional charging at work.
We have to remind the reader that both results are based on simulation models that cannot provide perfect projections of the future. Charging of users may be different, e.g., higher in public, yet large research projects, and reports support the high importance of domestic charging, meaningful importance of charging at work, and unsure relevance of public charging [26,27,28]. Furthermore, the here presented approach decomposes the load for different electric vehicles to groups, but nevertheless represents the PEVs within each group on an aggregated level. This aggregation may be criticized since it can possibly overestimate the potential of demand response. Modelling PEVs individually provides higher accuracy though comes along with higher computation times. This trade-off between accuracy and complexity is also mentioned by Kaschub (2017) [29] who qualitatively discusses the differences of modelling the PEV fleet as a whole, a representative set of vehicles and all individual PEVs. In his point of view, the tendency to overestimate the load shift potentials is often the case. In Bossmann (2015) [6], an earlier version of eLOAD was used that was only based on one profile for driving and parking. In a case study for 2050, Bossmann (2015) [6] found 42% of RES that could be integrated through load shifting. This result is not directly comparable since the share of PEV and RES is lower in 2030, but it indicates a higher load shifting potential. Thus, we can consider the approach in this paper as an improvement when compared to the aggregated use of driving and charging profiles, knowing that it might still overestimate the load shift potentials in reality. It enables the consideration of availability and electricity consumption with a high time resolution, and therefore provides an added value to the discussion of the load shifting potential provided by mobile storages.
In our point of view, an interesting finding for electricity suppliers is the high share of commercial charging during the day and the possibility to shift loads by additional charging options at work. Since providing additional charging options at work might be less costly than equipping a lot of charging points with technology for demand response, selling this equipment could be an interesting business model with additional gains for electricity suppliers as well. For policy makers, this underlines the necessity to facilitate charging at work. Support programs for setting up charging infrastructure at work could support the current legislative simplification for companies to provide charging facilities for their employees.
Further research could include public fast charging options that have been neglected in this study. Also, optimizing on based on price signals may be another interesting option in new modelling attempts. Moreover, the comparison of the DR potential of PEVs could be compared to the potential of other flexible technologies, such as heat pumps or stationary storage battery that are currently installed by households to store their self-generated PV power. Also, an optimization on price signals instead of peak shaving could be interesting for further research as well.

Author Contributions

All authors were involved in equal shares in modeling and writing this paper. T.G. performed the simulations with the ALADIN model and A.-L.K. and J.M. are responsible for the simulations with the eLOAD model.

Funding

Parts of the analysis were executed within the project ”Bewertung des Lastverschiebepotenzials von Elektrofahrzeugen in Deutschland unter Berücksichtigung differenzierter Haltergruppen und Ladeinfrastruktur im Vergleich zu anderen flexiblen Verbrauchern“ (funding code A 321 16) which receives funding from the Stiftung Energieforschung Baden-Württemberg. For further information see: www.sef-bw.de. We also performed a part of this work within the framework of the Profilregion Mobilitätssysteme Karlsruhe which is funded by the Ministry of Economic Affairs, Labour and Housing in Baden-Württemberg and as a national High Performance Center by the Fraunhofer-Gesellschaft.

Conflicts of Interest

The authors declare no conflict of interest.

References

  1. Dallinger, D.; Schubert, G.; Wietschel, M. Integration of intermittent renewable power supply using grid-connected vehicles—A 2030 case study for California and Germany. Appl. Energy 2013, 104, 666–682. [Google Scholar] [CrossRef]
  2. Babrowski, S.; Heinrichs, H.; Jochem, P.; Fichtner, W. Load shift potential of electric vehicles in Europe. J. Power Sources 2014, 255, 283–293. [Google Scholar] [CrossRef]
  3. Gnann, T. Market Diffusion of Plug-in Electric Vehicles and Their Charging Infrastructure. Thesis, KIT Karlsruhe, Karlsruhe, Germany, 2015. [Google Scholar]
  4. Gnann, T.; Plötz, P.; Kühn, A.; Wietschel, M. Modelling Market Diffusion of Electric Vehicles with Real World Driving Data—German market and Policy options. Transp. Res. Part A 2015, 77, 95–112. [Google Scholar] [CrossRef]
  5. Plötz, P.; Gnann, T.; Wietschel, M. Modelling market diffusion of electric vehicles with real world driving data—Part i: Model structure and validation. Ecol. Econ. 2014, 107, 411–421. [Google Scholar] [CrossRef]
  6. Boßmann, T. The Contribution of Electricity Consumers to Peak Shaving and the Integration of Renewable Energy Sources by Means of Demand Response. Ph.D. Thesis, KIT Karlsruhe, Karlsruhe, Germany, 2015. [Google Scholar]
  7. Boßmann, T.; Elsland, R.; Klingler, A.-L.; Catenazzi, G.; Jakob, M. Assessing the Optimal Use of Electric Heating Systems for Integrating Renewable Energy Sources. Energy Procedia 2015, 83, 130–139. [Google Scholar] [CrossRef]
  8. Fraunhofer ISI, IREES, TEP Energy: FORECAST/eLOAD Website. Available online: https://forecast-model.eu (accessed on 29 June 2017).
  9. Boßmann, T.; Elsland, R.; Lickert, F.; Wietschel, M. The German load curve in 2050: Structural changes through energy efficiency measures and their impacts on the electricity supply side. In Proceedings of the Summer Study on Energy Efficiency (ECEEE 2013), Hyères, France, 3–8 June 2013. [Google Scholar]
  10. Hautzinger, H.; Kagerbauer, M.; Mallig, N.; Pfeiffer, M.; Zumkeller, D. Mikromodellierung für die Region Stuttgart—Schlussbericht—INOVAPLAN GmbH; Institute for Transport Studies at the Karlsruhe Institute of Technology (KIT), Institut für angewandte Verkehrs- und Tourismusforschung e.V.: Karlsruhe, Germany; Heilbronn, Germany, 2013. [Google Scholar]
  11. Fraunhofer ISI. REM2030 Driving Profiles Database V2014-07; Fraunhofer Institute of Systems and Innovation Research ISI: Karlsruhe, Germany, 2014. [Google Scholar]
  12. Pfahl, S. Alternative Antriebskonzepte: Stand der Technik und Perspektiven-Die Sicht der Automobilindustrie. In Alternative Antriebskonzepte Bei Sich Wandelnden Mobilitätsstilen: Tagungsbeiträge Vom 08. und 09. März 2012 am KIT; Jochem, P., Poganietz, W.-R., Grunwald, A., Fichtner, W., Eds.; KIT Scientific Publishing: Karlsruhe, Germany, 2013; pp. 81–108. [Google Scholar]
  13. McKinsey. Die Energiewende in Deutschland—Anspruch, Wirklichkeit und Perspektiven; McKinsey & Company: New York, NY, USA, 2012. [Google Scholar]
  14. KBA. German Motor Transport Authority. Vehicle Registrations 2013 and Vehicle Stock (01/01/2014) Distinguished by Vehicle Registrations Areas (FZ1, FZ5); KBA: Würzburg, Germany, 2014. [Google Scholar]
  15. Entso-E. Entso-E Transparency Platform. 2017. Available online: https://www.entsoe.eu/data/ (accessed on 8 June 2018).
  16. NASA GES DISC Data Collections. 2017. Available online: https://disc.gsfc.nasa.gov/datasets?page=1&keywords=merra (accessed on 8 June 2018).
  17. International Energy Agency (IEA). World Energy Outlook; IEA: Paris, France, 2012. [Google Scholar]
  18. Association of the German Petroleum Industry (MWV). Entwicklungen des Tankstellenbestandes in Deutschland; Association of the German Petroleum Industry (MWV): Berlin, Germany, 2013. [Google Scholar]
  19. BCG. Trendstudie 2030+ Kompetenzinitiative Energie des BDI; Studie der Boston Consulting Group im Auftrag des Bundesverbandes der Deutschen Industrie (BDI) BCG: München, Germany, 2013. [Google Scholar]
  20. Leipziger Institut für Energie GmbH. Entwicklung der Preise für Strom und Erdgas in Baden-Württemberg Bis 2020; Endbericht: Leipzig, Germany, 2012. [Google Scholar]
  21. Schlesinger, M.; Lindenberger, D.; Lutz, C. Energieszenarien 2011; Prognos AG, Energiewirtschaftliches Institut an der Universität zu Köln (EWI), Gesellschaft für wirtschaftliche Strukturforschung (GWS): Basel, Switzerland; Köln, Germany; Osnabrück, Germany, 2011. [Google Scholar]
  22. DAT. DAT Report Ostfildern: Deutsche Automobil Treuhand (DAT); DAT: Beaverton, OR, USA, 2011. [Google Scholar]
  23. Verkehrsclub Deutschland (VCD). CO2-Basierte Dienstwagenbesteuerung; Verkehrsclub Deutschland (VCD): Berlin, Germany, 2008. [Google Scholar]
  24. Plötz, P.; Gnann, T.; Wietschel, M.; Kühn, A. Market Evolution Scenarios for Electric Vehicles—Detailed Version; Commissioned by Acatech—German National Academy of Science and Engineering and Working Group 7 of the German National Platform for Electric Mobility (NPE); Fraunhofer ISI: Karlsruhe, Germany, 2013. [Google Scholar]
  25. Fraunhofer, ISI, Consentec, Ifeu, R2b, EEG TU Wien, and TEP Energy. Langfristszenarien und Strategien für den Ausbau der Erneuerbaren Energien in Deutschland unter Besonderer Berücksichtigung der Nachhaltigen Entwicklung Sowie Regionaler Aspekte—Leitstudie; 2017. Available online: https://www.bmwi.de/Redaktion/DE/Artikel/Energie/langfrist-und-klimaszenarien.html (accessed on 29 June 2018).
  26. Bruce, I.; Butcher, N.; Fell, C. Lessons and Insights from Experience of Electric Vehicles in the Community. In Proceedings of the Electric Vehicle Symposium 26 (EVS 26), Los Angeles, CA, USA, 6–9 May 2012. [Google Scholar]
  27. Ecotality and INL. The EV Project Q1 2012 Report; Ecotality Inc. and Idaho National Lab: San Francisco, CA, USA, 2011. [Google Scholar]
  28. International Energy Agency (IEA). Energy Technology Perspectives 2017—Catalysing Energy Technology Transformations; IEA/OECD 2017; IEA: Paris, France, 2017. [Google Scholar]
  29. Kaschub, T. Batteriespeicher in Haushalten unter Berücksichtigung von Photovoltaik, Elektrofahrzeugen und Nachfragesteuerung; KIT Scientific Publishing: Karlsruhe, Germany, 2017. [Google Scholar]
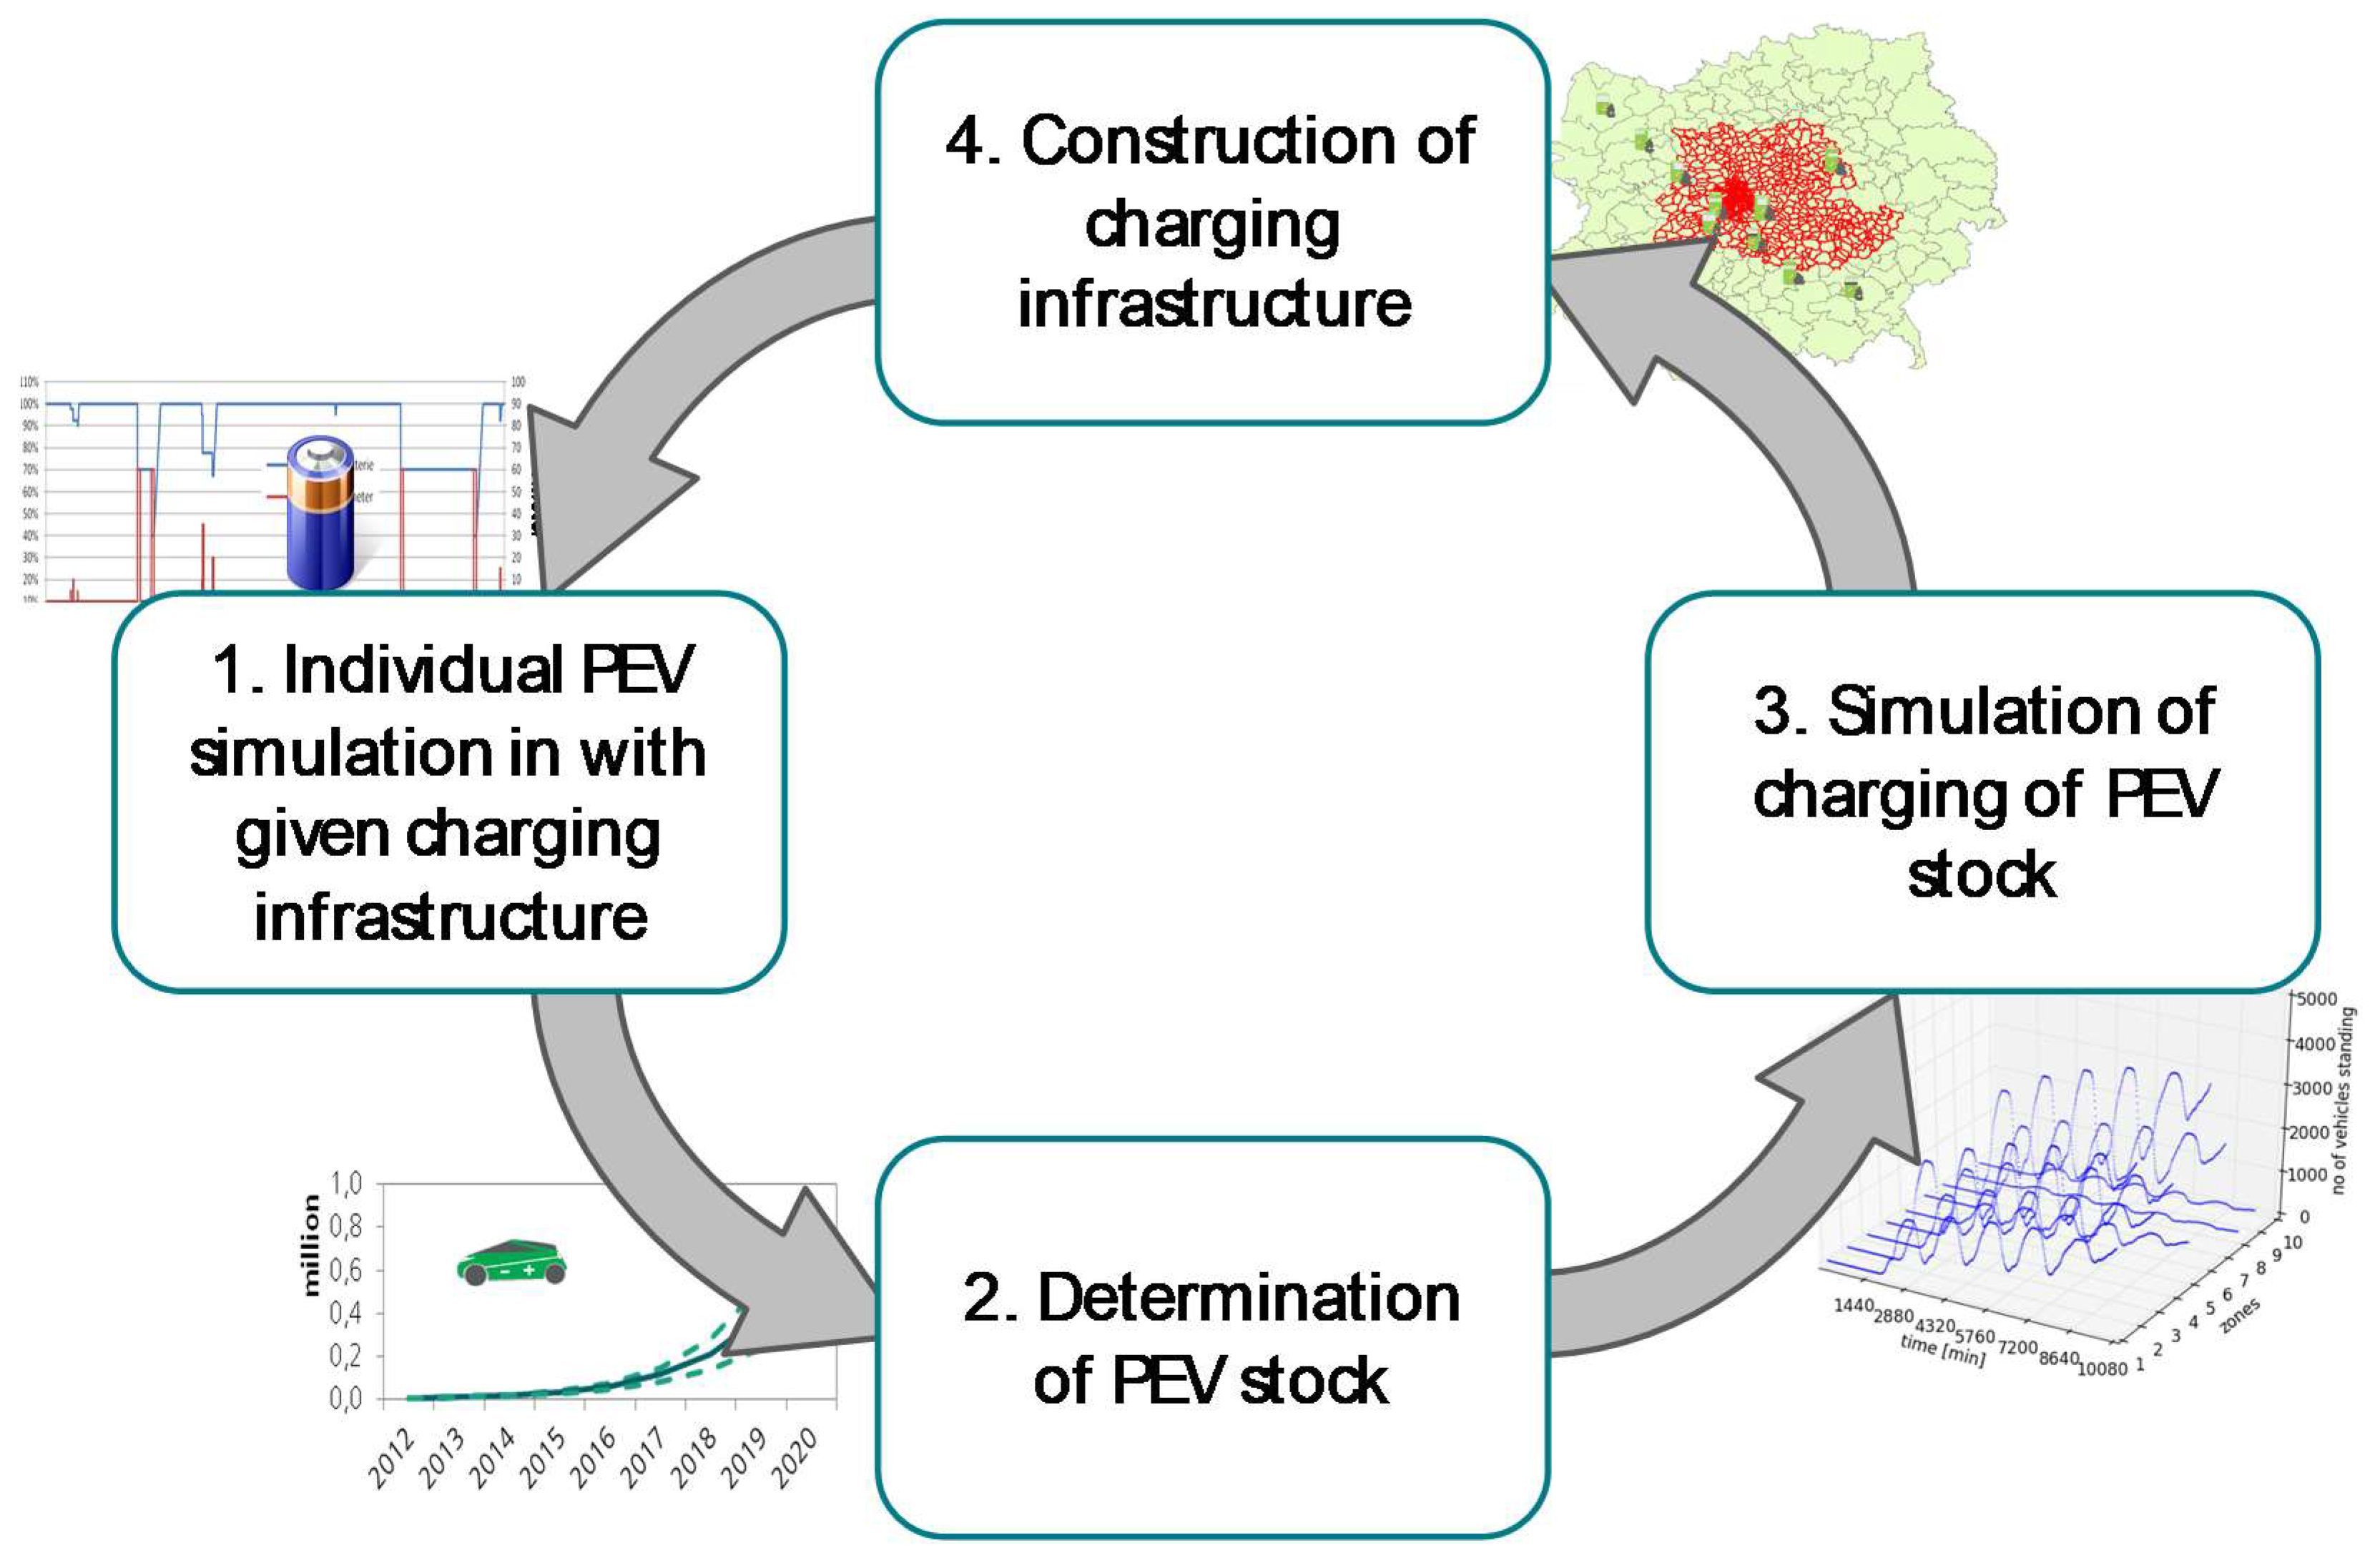
Figure 1. Overview of the Alternative Automobiles Diffusion and Infrastructure (ALADIN) model.
Wevj 09 00021 g001
Figure 2. Overview of the energy LOad curve ADjustment (eLOAD) model.
Wevj 09 00021 g002
Figure 3. Energy flows between connected, mobile and disconnected plug-in electric vehicles (PEV) storages.
Wevj 09 00021 g003
Figure 4. Total stock of plug-in electric vehicles in three scenarios.
Wevj 09 00021 g004
Figure 5. PEV stock in the three charging scenarios distinguished by user group and PEV type.
Wevj 09 00021 g005
Figure 6. Electricity demand of PEVs without demand response (DR) on a Tuesday depending on the available charging infrastructure in the scenarios.
Wevj 09 00021 g006
Figure 7. Average share of connected PEVs on Tuesdays in the three scenarios over the course of the day; private passenger cars (left) and commercial fleet (right).
Wevj 09 00021 g007
Figure 8. Electricity consumption of PEVs on Tuesdays in summer and winter, with uncontrolled charging (uncontr.) and with demand response (DR).
Wevj 09 00021 g008
Figure 9. Average vehicle charging and net load in 2030 with charging options at home, at work and in public (Scenario S3).
Wevj 09 00021 g009
Table 1. Description of data sets used in the model ALADIN.
User GroupPrivate CarsCompany CarsFleet Vehicles
Data setMOPS [10]REM2030 [11]
Total no of vehicles 11,273,42639,391164
Total no of trips 118,909,380191,04913,374
Total vehicle registrations in observation area (2014) ²63,77239,391 *39,391 *
Total vehicle stock in observation area (1 January 2014) ²1,343,01639,391128,297
Subsample sizes15,9439847164
1 Reduced sample after assignment of personal trips to vehicles and clustering to 15 min-intervals; ² registrations from [14]; * distribution between fleet and company cars is an assumption based on [12].
Table 2. Scenarios with available power rates.
Power Rates (kW)Domestic/CommercialWorkPublic
S13.7--
S23.73.7-
S33.73.73.7
Table 3. Battery and energy prices (all prices without VAT in €2015).
Battery and Energy PricesUnit2015202020252030Ref.
Battery price€/kWh359282246224[12]
Gasoline price€/L1.2741.3391.4081.471[17,18]
Diesel price€/L1.2011.2621.3271.403[17,18]
Electricity price private€/kWh0.2490.2690.2730.269[13,19,20,21]
Electricity price commercial€/kWh0.1790.1850.1890.185[13,19,20,21]
Table 4. PEV stock in the three different charging scenarios distinguished by user group and PEV type.
PEV STOCKS1 2020S2 2020S3 2020S1 2030S2 2030S3 2030
Private PHEV111,000321,000315,0001,838,0002,606,0002,501,000
Private BEV13,00030,00031,000828,000883,000898,000
Commercial PHEV342,000342,000333,000971,000971,000896,000
Commercial BEV69,00069,00069,000326,000326,000346,000
Table 5. Summary of load shifting potential in the three different charging scenarios.
TypeS1S2S3
Reduction of RES surplus electricity1.6 TWh1.8 TWh1.8 TWh
Reduction of peak load (System load curve)−0.76 GW2.2 GW2.2 GW