The overall goal of the methodology is to find well-suited battery system solutions for defined vehicle requirements, such as speed, range, acceleration, load capacity, and life time. This requires evaluating how a certain battery system covers these requirements when used in the vehicle. The requirements of the car are thus not translated to battery requirements, which are very complex in some cases, since there is a circular dependency of battery parameters and vehicle requirements: The weight of the battery influences acceleration of the vehicle, which sets the requirement for electrical power of the battery. To analyze and compare different battery systems quantitatively, a detailed vehicle model was created and implemented in Matlab-Simulink in the frame of the research project “HV-ModAL”. It is explained in
Section 2.1. The specification and modularization of the battery is enabled by an external scaling possibility and the choice amongst a certain cell portfolio, which is described in
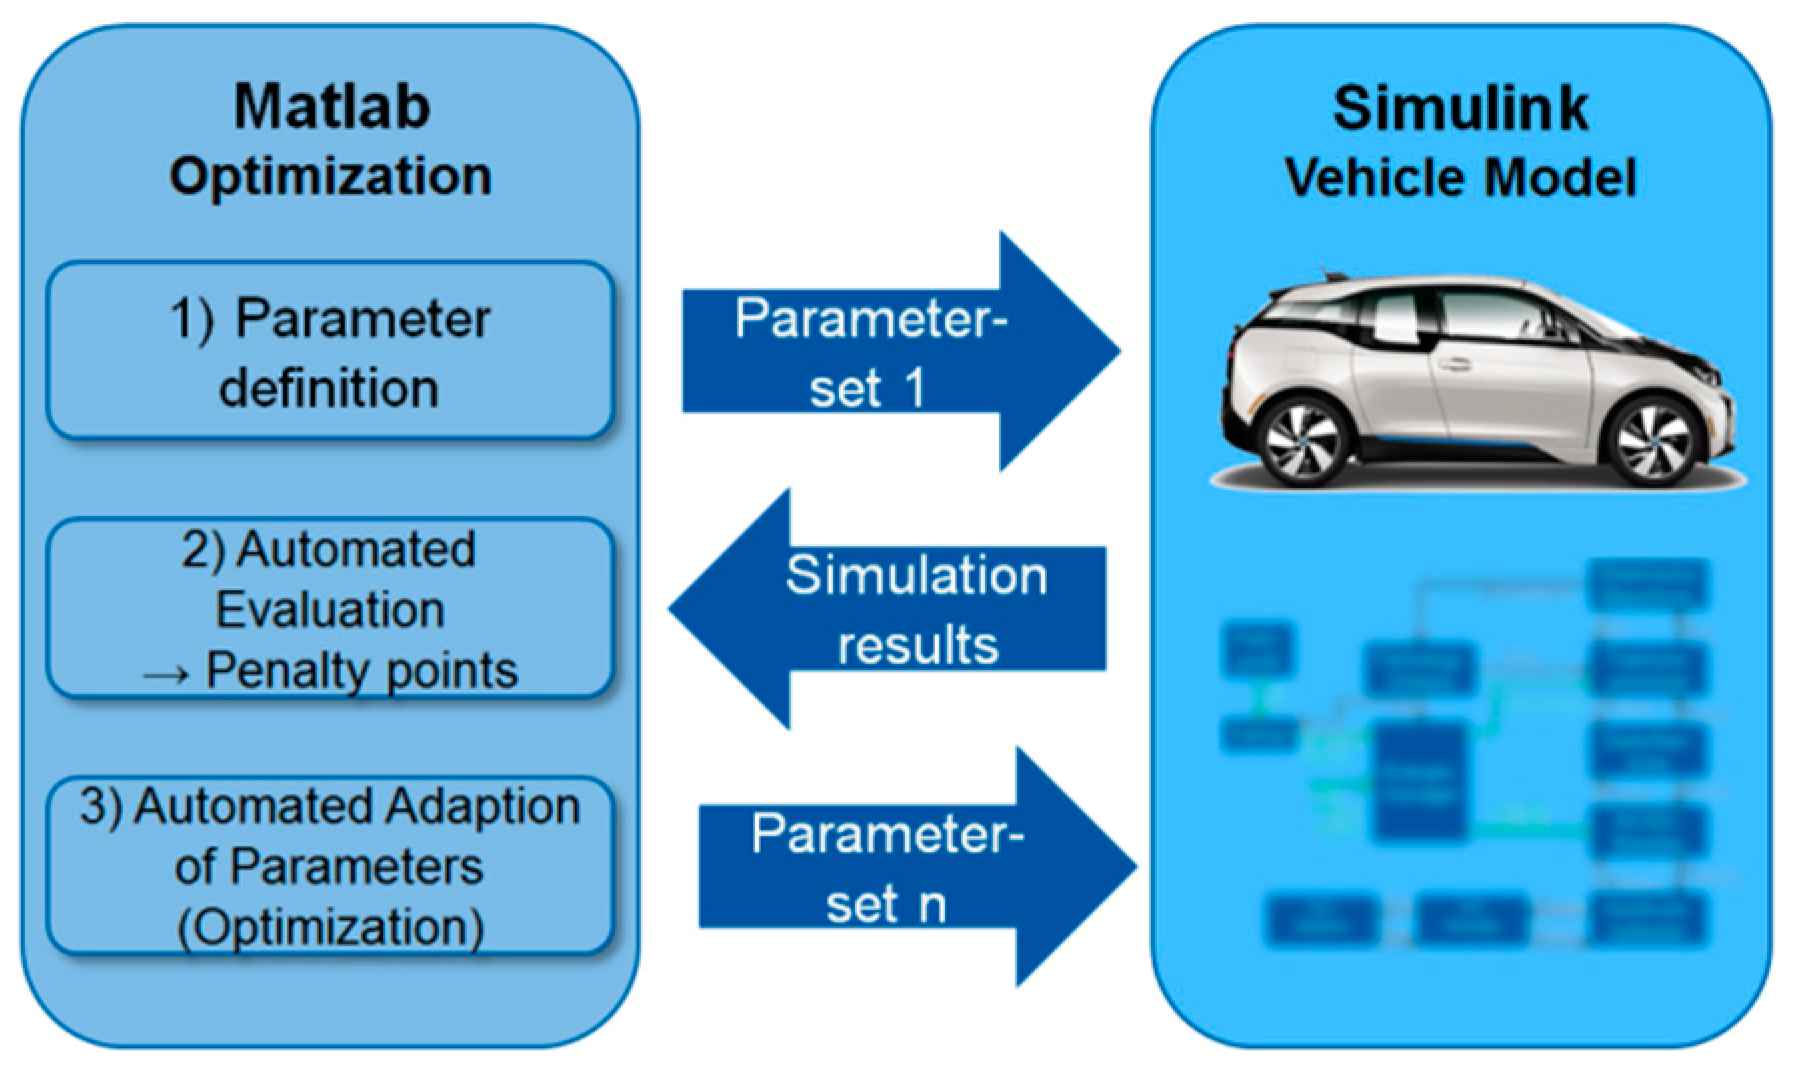
Section 2.2. The optimization tool itself is shown schematically in
Figure 3 in the right column. It has functional interfaces to the vehicle model to feed in parameter sets—most of all, the specification of the battery systems which are evaluated. The interface is further used to receive the simulation results. The optimization tool itself (left in
Figure 3) is implemented in Matlab and makes use of an evolutionary optimization algorithm. This main part of the tool is explained in
Section 2.4.
The optimization process is initiated by setting battery parameters, which are then fed into the vehicle model. The vehicle model is then executed in certain driving cycles to analyze the battery’s performance under real-life conditions. The optimization tool receives the results of these scenarios and automatically assesses the battery system currently under investigation. The steps of evaluating the simulation results and feeding new, optimized battery specifications (parameters) into the vehicle model is repeated several (thousand) times, depending on the optimization performance, until a solution is found which fulfills the requirements and a stopping condition of the optimization is reached. The vehicle model, as well as the actual battery optimization tool, are described in the following sections.
2.2. Battery Model
The majority of the battery model is part of the vehicle model. However, some parts of the model do not influence the driving behavior—e.g., the cost or environmental model. The implemented battery model is described in the following.
The chosen battery cells for this exemplary portfolio were characterized on the test benches of the Institute for Power Electronics and Electrical Drives (ISEA) of RWTH Aachen University. Their characteristics are summarized in
Table 1.
There are no explicit favors towards any of the cell manufacturers or products. Amongst the cells, all three major cell formats are present: prismatic cells (like in BMW i3), pouch bag cells (like in Smart electric drive [
10]), and cylindrical cells (like in Tesla Model S [
11]). The portfolio contains very high energy cells as well as very high power cells, as can be seen from the gravimetric energy and power densities. This also motivates the differing anode and cathode combinations ranging from common NMC (nickel manganese cobalt oxide) cathodes to NCA (nickel cobalt aluminum oxide) and LFP on the cathode side and common graphite to silicon-doped graphite and LTO on the anode side. The different cell characteristics significantly influence the cell costs relative to their nominal energy content. These were determined using a bottom-up cost model, based on the “BatPac” approach by Argonne National Laboratory [
12,
13,
14,
15] and the Tesla Battery Report [
16]. This approach theoretically designs each cell with its specific parameters: the electrodes are defined by their material, the thickness of their active and passive material, and by the length of the electrodes (in the case of cylindrical cells or folded electrodes) or the number of layers (in the case of stacked electrodes). The separator is specified by its thickness, which leads to a certain amount on the cell level, where all anode and cathode layers are separated. Furthermore, there are parameters for the housing material. The material amounts were extracted from measured data from a post-mortem analysis carried out at the institute, as well as from adapted assumptions from the “BatPac” tool. Based on the material amounts and assumptions for producing the cells in high volumes, the individual cell costs have been determined. The electrical parameters are not based on the theoretical model but measured in real experiments and then fed into models. The measurements cover the determination of the voltage-state-of-charge curve and pulse measurements to determine the internal resistance at different temperatures and different states of charge. The results are stored in 3D lookup tables.
The total costs of ownership (TCO) of an EV are significantly influenced by the aging of the battery system. If the aging effect exceeds a certain limit, the battery system has to be over-dimensioned initially to compensate for the decrease in capacity and power capability. Key figures in this context often are 70% remaining capacity after 8 years or 100,000 km [
17,
18,
19]. To evaluate the aging effect of dedicated battery packs in each vehicle, a straightforward battery-aging model was included. The used data was adapted from a battery-aging study and model by Ecker et al. [
20] and Schmalstieg et al. [
21] and transferred to the cells in this portfolio. The relative aging factors shown in
Table 1 do not all reflect measured data, as battery-aging characterization is very time consuming. An aging rate of 1.4 (assumed for the Kokam cell by the South Korean manufacturer Kokam Co., Ltd.) means that the capacity fade after one equivalent full cycle is 1.4 times the capacity decrease after one equivalent full cycle of the reference (SB LiMotive cell in this cell portfolio). LTO anodes are assumed to have a very good cyclic stability, since volumetric expansion and contraction seen in graphite anodes does not occur in this material. Furthermore, these battery cells do not suffer from Li plating [
22], which, in addition to posing safety issues, also leads to capacity fade in cells with graphite anodes. Thus, the Toshiba cell’s aging rate is assumed to be 20% of the automotive grade SB LiMotive cell.
The aging model itself analyses the cyclic-aging stress on the batteries through the car usage in the specified aging driving cycles (micro- and macrocycles), as well as the stress through calendric aging. The latter mainly depends on the average voltage and temperature of the battery system. Note that, due to performance reasons of the tool chain, the complete vehicle life of eight years is not simulated. Instead, the aging driving cycles are simulated once for each battery system under investigation to determine the above-mentioned stress factors. Furthermore, it is assumed that both aging factors (cyclic and calendric) can be expressed with a linear behavior in the relevant time frame (eight years and approximately 100,000 km) [
23]. Using that extrapolation approach, the capacity decrease and resistance increase can be approximated for the cycle life so that the battery system can also be evaluated at the point in time where the battery has been used for 100,000 km of driving and eight years. The complete aging model was implemented in Matlab with an interface to the Simulink vehicle and battery model to feed in the “aged” battery parameters.
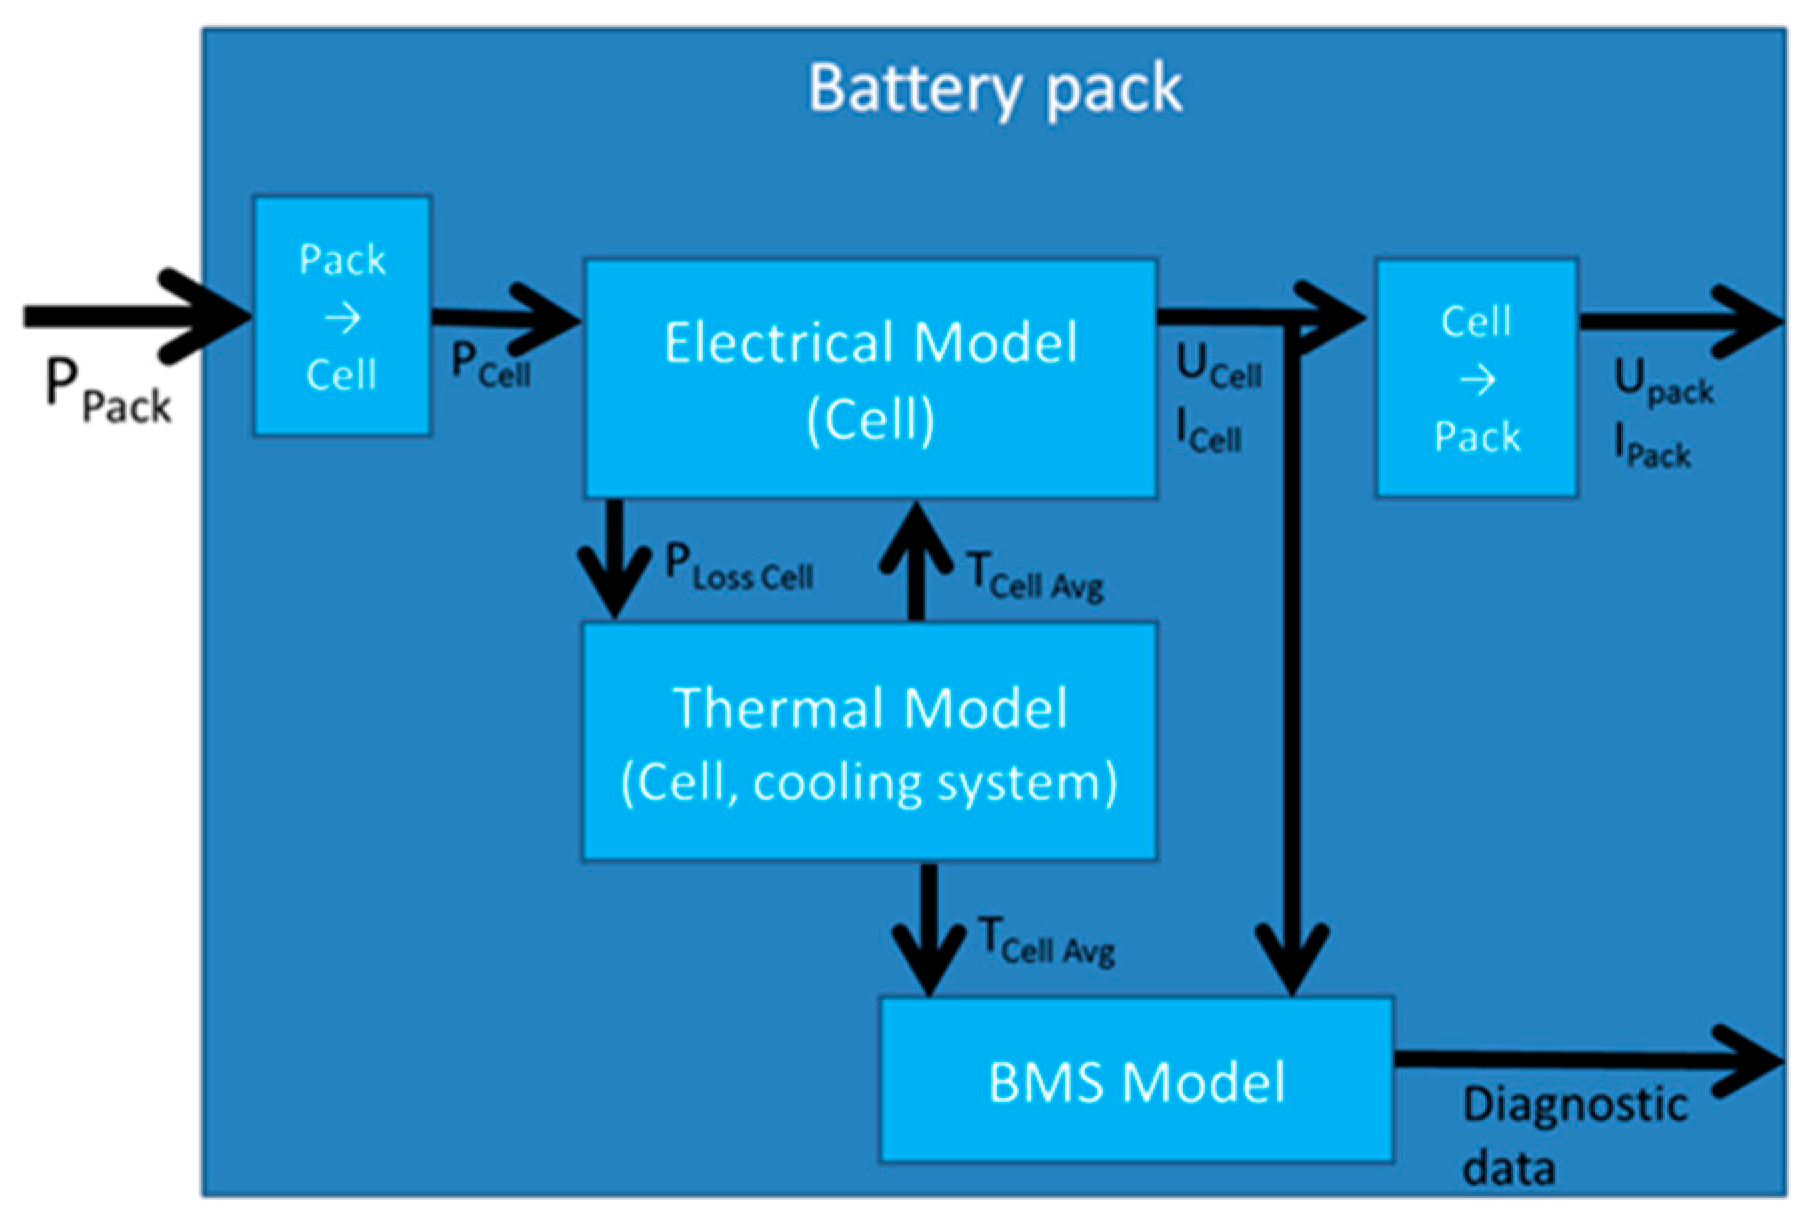
The generic battery model, as part of the Matlab Simulink vehicle model, internally consists of an electrical model interacting with a thermal model and a battery management model. The structure of this “online” model is shown in
Figure 4 and explained in the following. Note that the vehicle model has five instances of this library to simulate a maximum number of five completely different battery pack types. An instantaneous power (
PPack) is input to each pack at every time step. This is the power extracted from the individual pack or fed back into the pack during recuperation. This power is scaled down to one cell and then further processed in the electrical model. The electrical model consists of an open circuit voltage part, a serial resistor, and an RC element (parallel connection of a resistor and a capacitor), and is parameterized by electrical cell tests at different temperatures, as mentioned above. Differences in cell behavior in one string, which do occur in real battery systems, were neglected in order to maximize computing efficiency. A cell voltage balancing system was thus not modeled. The electrical model calculates the voltage response to a certain power, which is fed into the battery pack, or vice versa. It further computes the thermal loss power according to the electrical power and the measured and modeled internal resistances, which is then fed into the thermal model.
The thermal model can represent a battery pack with pure passive cooling, with active air cooling, or with active liquid cooling. The type of cooling system is chosen before the simulation is started. Each component of the battery system is assumed to have a homogenous temperature distribution within. Temperature gradients inside the system model can thus only exist between components, e.g., between cell and cooling channel or surrounding air. The temperature of the individual components is calculated based on the heat transfers into (
and out of the component (
), the component’s initial temperature (
, its mass (
, and thermal capacity (
according to Equation (1). This leads to an efficient simulation with limited computational errors.
The battery model further consists of a battery management model. Besides other values, it outputs the battery’s state-dependent maximum available power and also controls the cooling system of the pack, depending on the actual temperature and the individual temperature boundary conditions of each cell type.
At least one instance of the above-described combination of electrical-thermal and battery management model has to be available and active in the vehicle model. In the case of hybrid battery systems, there can be up to five instances of battery models, each one parameterized individually prior to simulation. This approach enables the tool chain to automatically find the most suitable combination of cell types and dimension of the individual packs, as described in
Section 2.4.
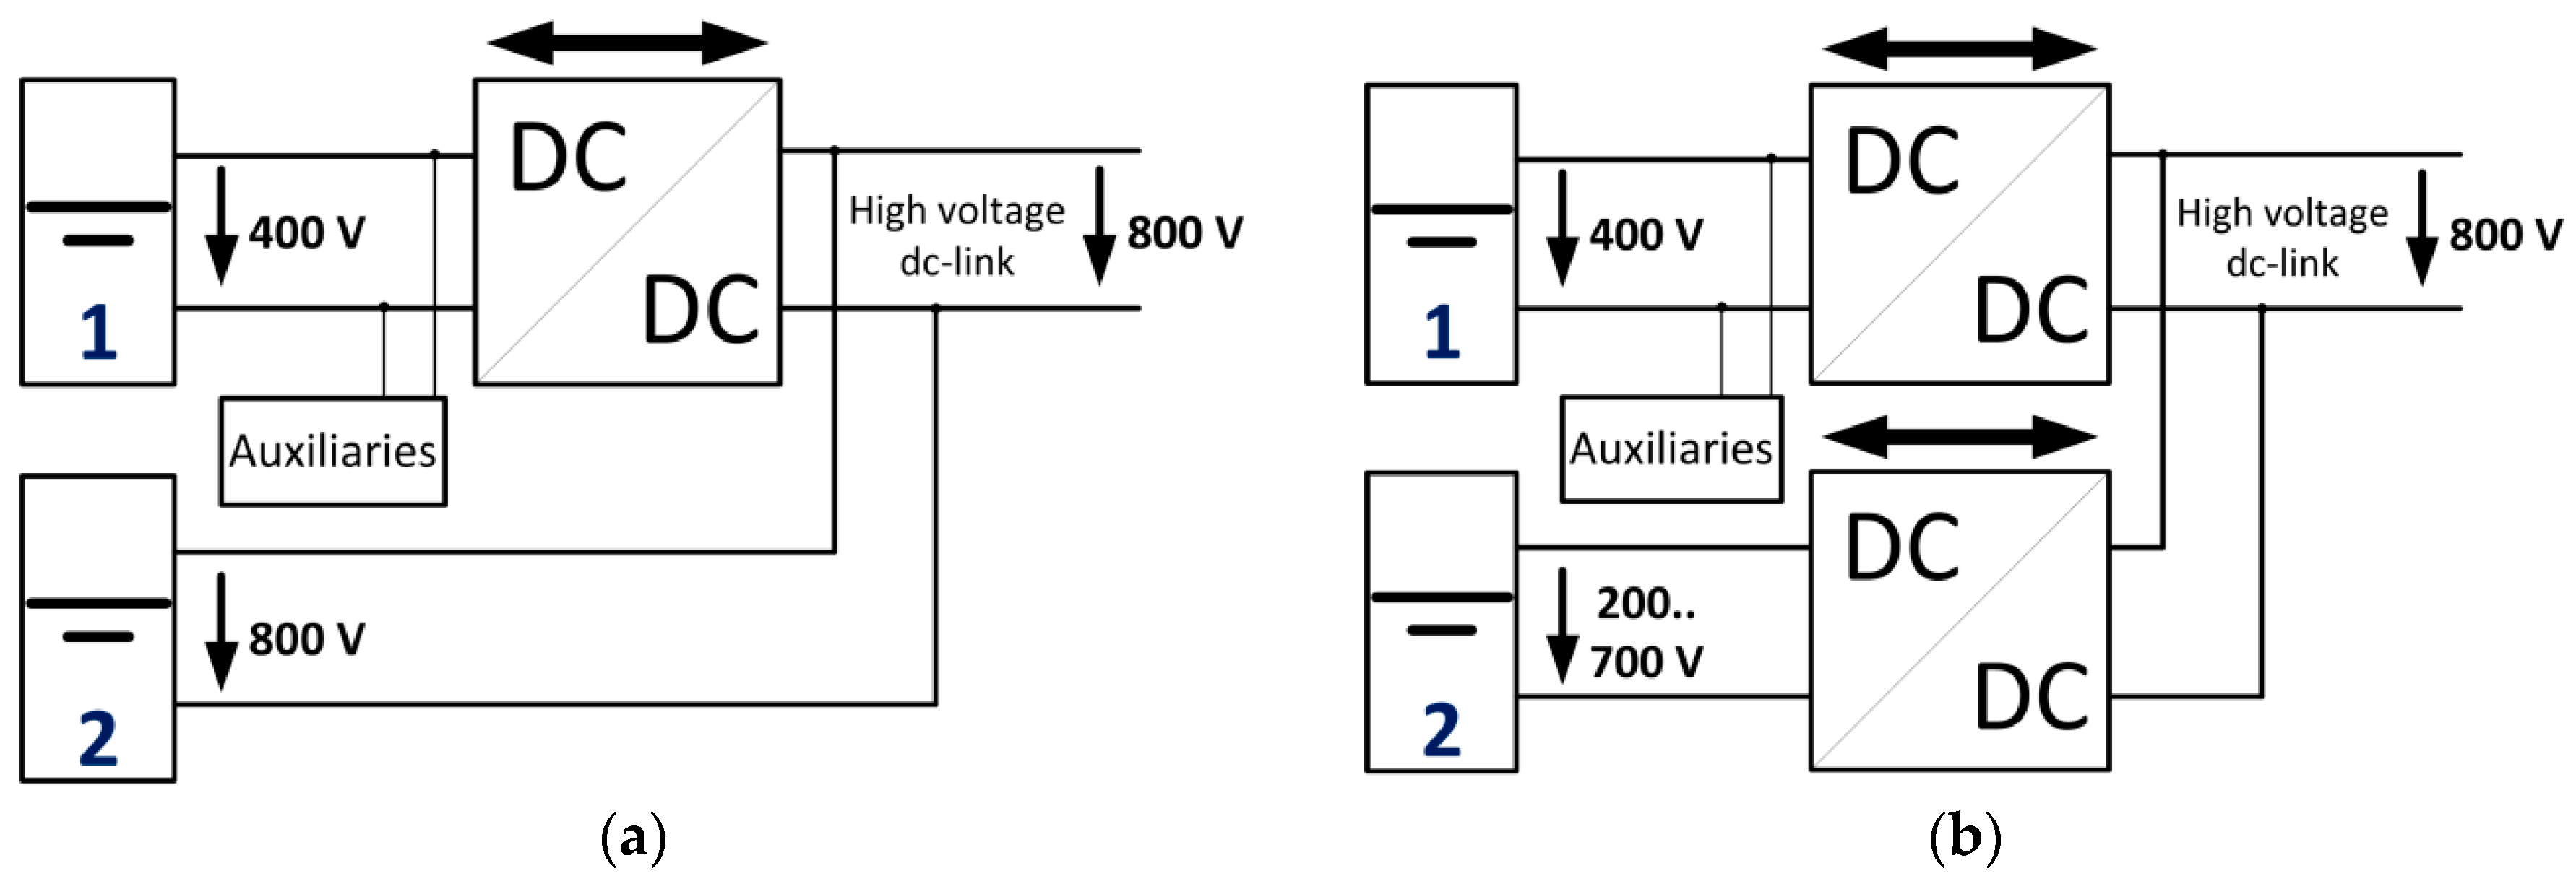
As mentioned above, the tool assumes that in the case of a hybrid battery system, each pack is connected via one suitable dc/dc converter to the dc link. The dc/dc converter was chosen according to the maximum power of the individual pack. The investment costs for the dc/dc converters in the near future were assumed to be 6 $/kW in this work.
2.3. Power Distribution in Hybrid Battery Systems
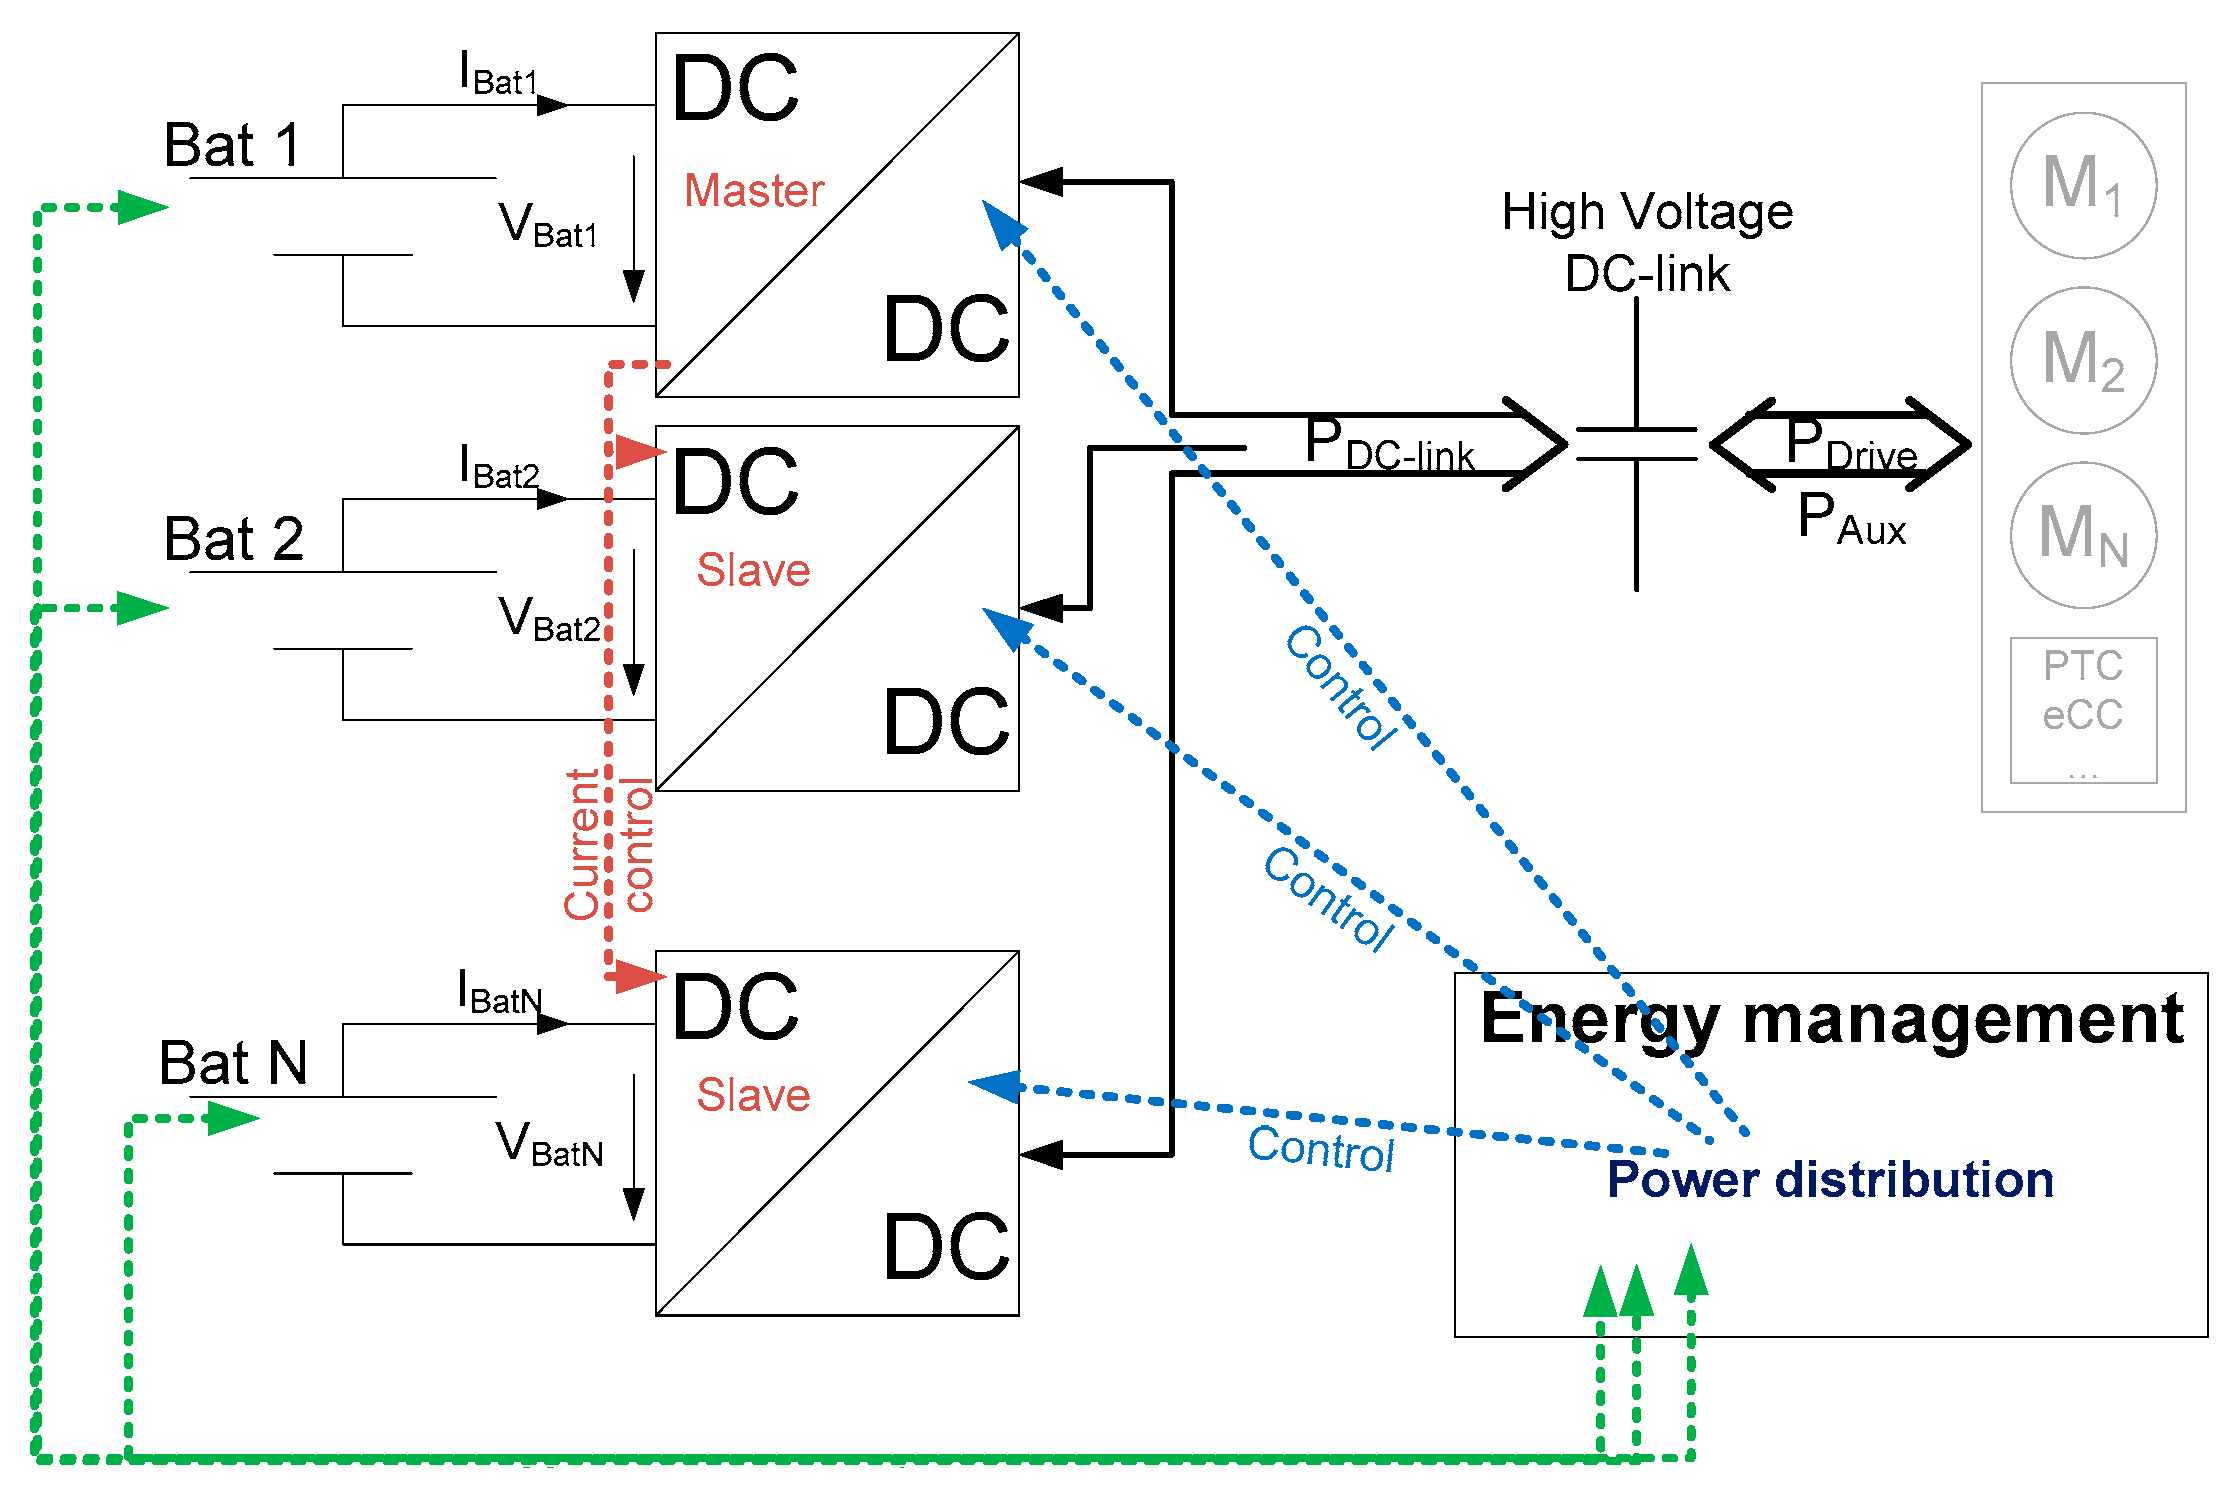
In the case of just one battery pack, the complete power for the drivetrain and auxiliaries is extracted from this pack. Hybrid battery systems, on the other hand, require a sophisticated power distribution logic, continuously determining which portion of traction power is taken out of which pack, respectively, and fed into which pack during recuperation. In the model, this task is done by a central control software called “energy management”, as shown in
Figure 5.
The energy management has a communication link to the batteries to determine each battery pack’s state, as well as a communication link to each dc/dc converter to actually control the power flow. In the literature, one can find many solutions for distributing power amongst different energy sources, ranging from rule based [
24,
25,
26], through stochastic methods [
27], up to complex methods, all of which try to predict future traction power profiles based on navigational data [
28].
However, none of the described methods suits the power distribution for five batteries required here, which are only distinguished and characterized based on the communication link between battery and energy management.
2.3.1. Implemented Power Distribution Algorithm for a Generic Hybrid Battery System
Due to the above-mentioned reasons, a straightforward power distribution algorithm was implemented in this work: it primarily seeks to equalize the state of charge (SoC) of all packs and simultaneously maintains each pack’s individual power limitations.
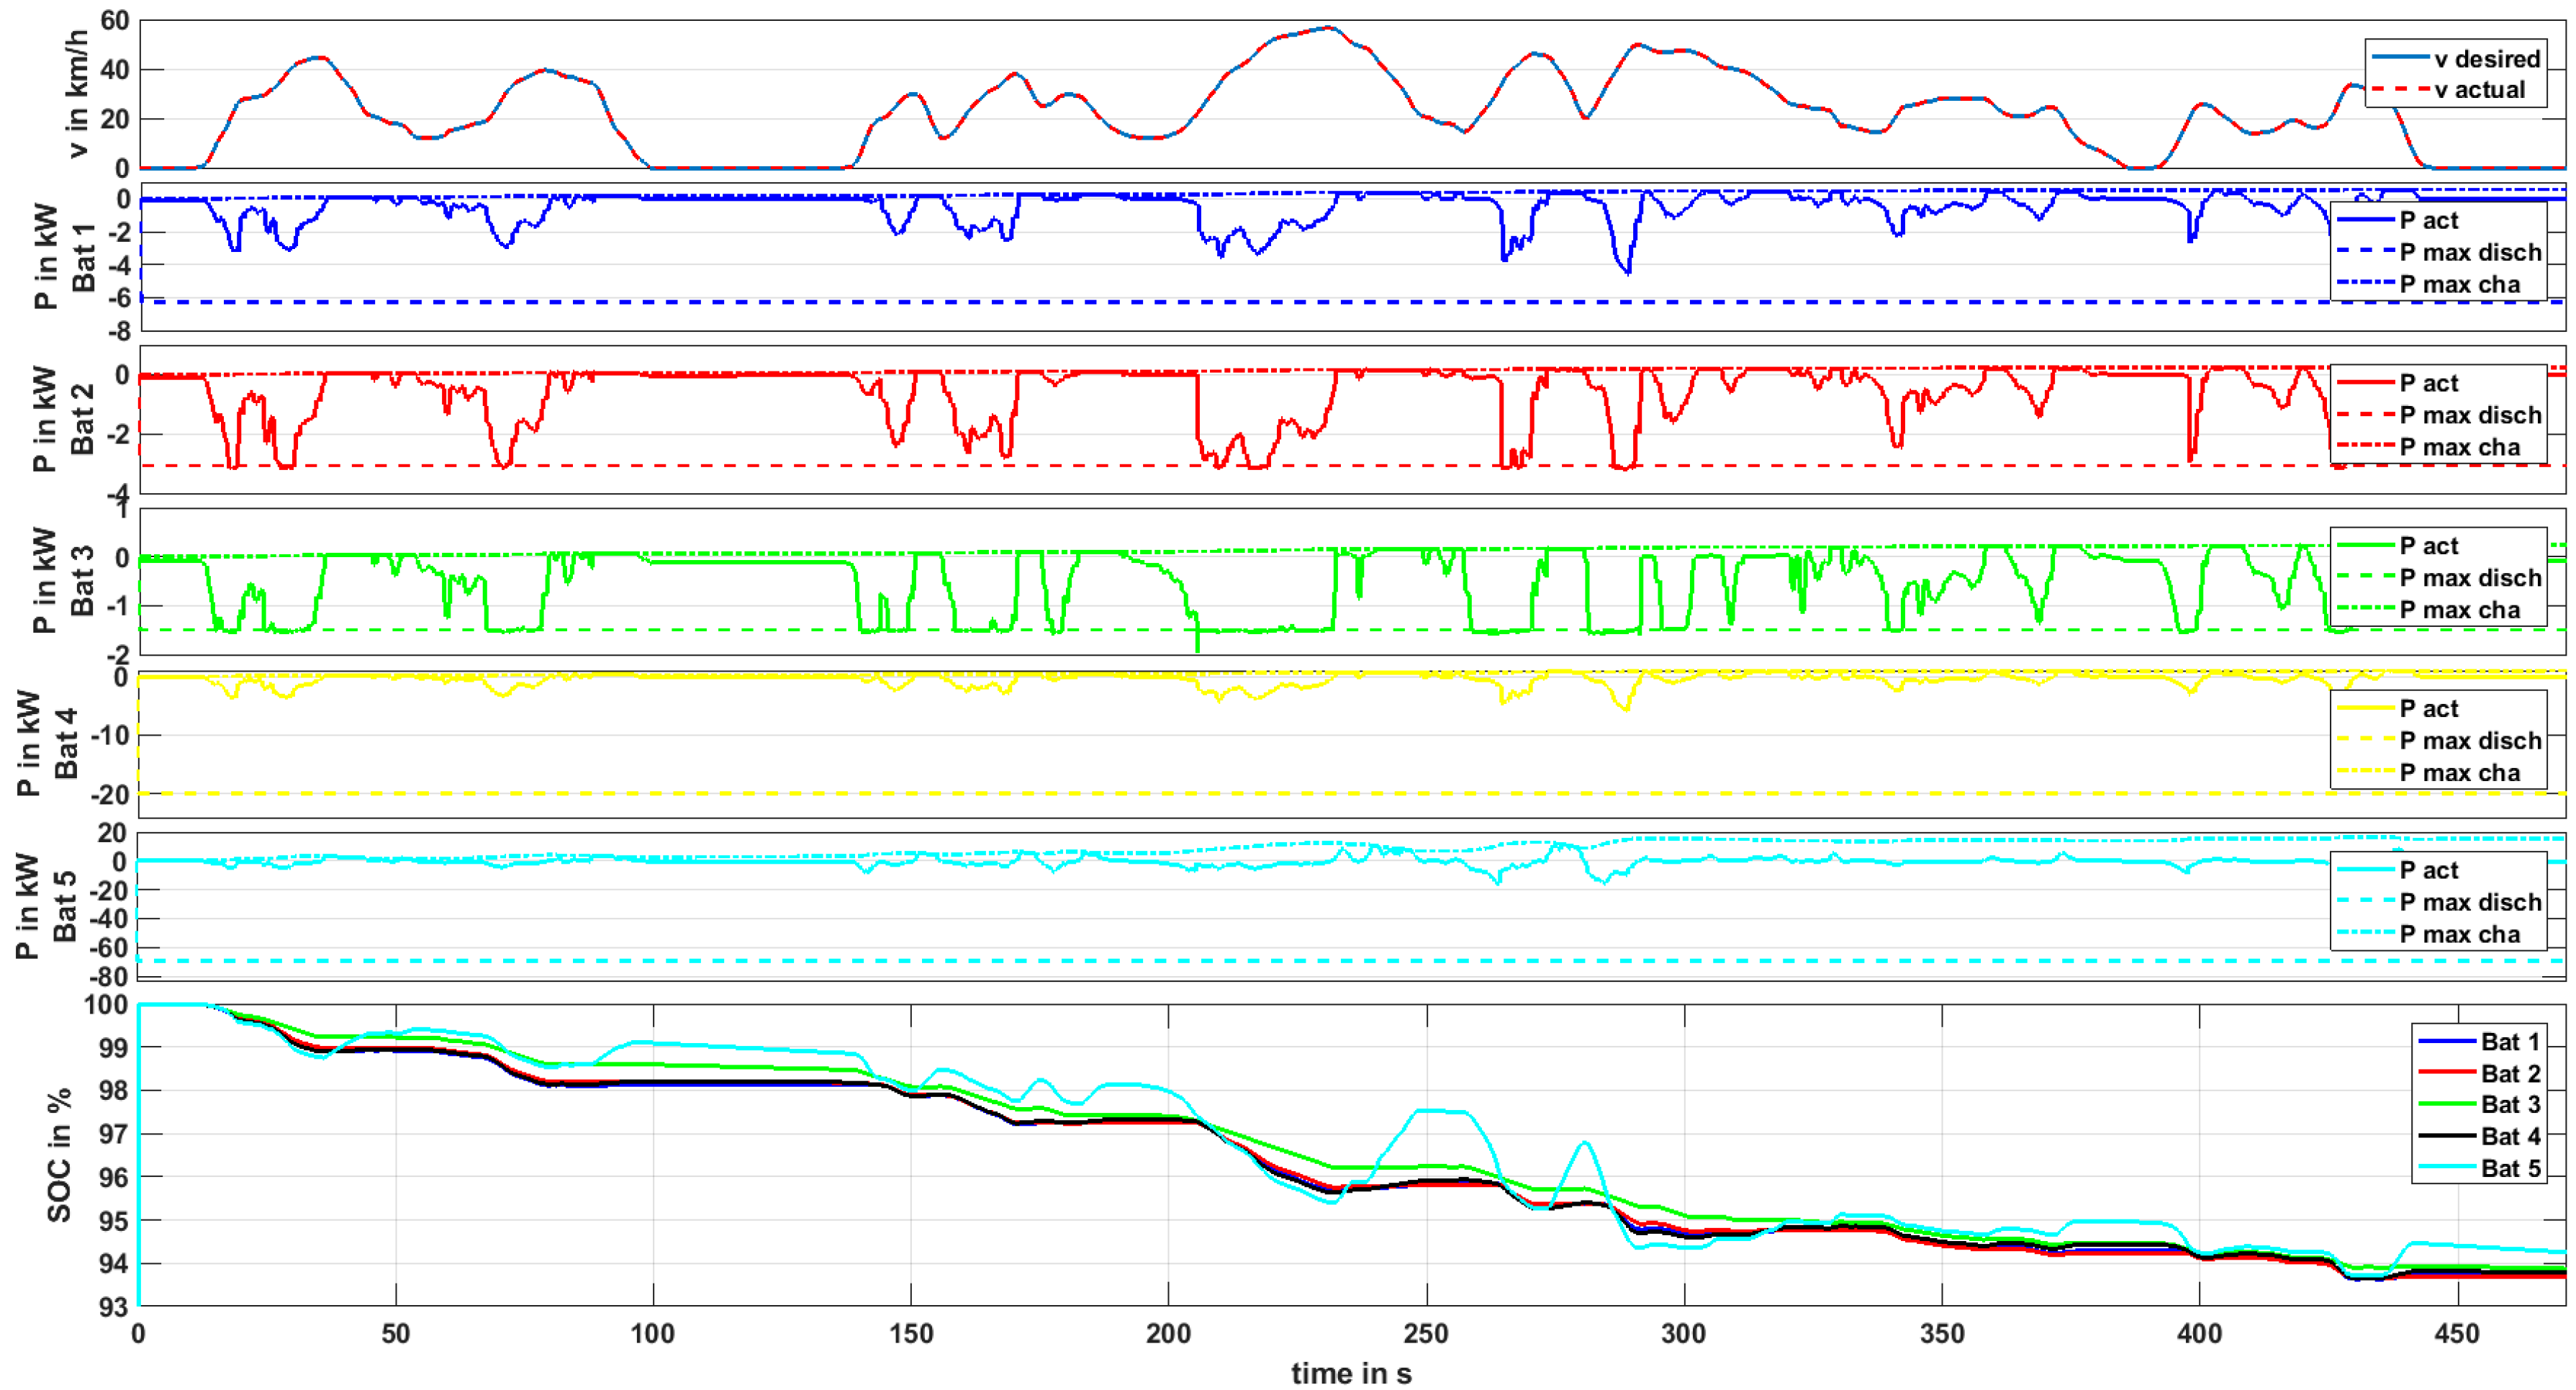
Figure 6 shows an exemplary result using the implemented power distribution logic for five different battery packs in a driving scenario. The power distribution is explained using this excerpt of the scenario.
The uppermost graph in
Figure 6 shows the reference speed and the actual vehicle speed controlled by the driver. One can see that the reference speed is met in this example. It is reached by applying a certain drivetrain power, depending on the vehicle’s properties (e.g., front area, chassis mass, tire friction, etc.) and the actual mass of the drivetrain—in many cases, dominated by the battery system. The latter is the reason why, in this tool chain, every new battery system has to be evaluated in the vehicle model, as the battery mass directly influences the vehicle’s traction power requirements.
The very theoretical example in
Figure 6 makes use of five equally dimensioned battery packs, each containing cells with a nominal pack energy of approximately 1 kWh. The first pack contains SB LiMotive cells, the second pack contains Kokam cells, the third contains Panasonic cells, the fourth contains A123 cells, and the fifth contains Toshiba cells—all described in
Table 1. The different cell characteristics can be clearly seen by the output maximum discharge and charge power limits, indicated by the dashed lines in plots 2–6 in
Figure 6. These values are predicted in real time by the modeled battery management systems’ power predictions and thus are cell type and state dependent. High states of charge, for example, lead to a reduction of maximum charging power, in most cases, to prevent overcharging or lithium-plating. The power distribution algorithm works in a way that these limits are never exceeded, while distributing the power to each battery so that the states of charge of all batteries are equalized as much as possible. This strategy can be recognized in the instances of long and powerful recuperation, e.g., at
t = 250 s in
Figure 6. Battery 5, containing the Toshiba cells (providing a very high charging capability), is charged with a higher current rate than the other packs in this instance. Consequently, the SoC of this pack rises more than the SoC of the other packs. To compensate this mismatch, the power distribution strategy tries to assign relatively more discharge power to this pack in the next acceleration phases. One can see in the bottom plot in
Figure 6 that this strategy works well in this scenario, although the packs have such different characteristics—the states of charge can diverge temporarily but are leveled out afterwards. The power distribution algorithm was implemented in Simulink Stateflow and is part of the energy management software. It is used for the tool chain described in this paper. The algorithm is fully generic in a way that up to five batteries can be handled. If fewer batteries are available, the algorithm adapts itself automatically based on missing availability signal of the unavailable packs. If just one pack is in the vehicle, the complete power distribution algorithm is bypassed to save computational effort.
2.3.2. Alternative Power Distribution Algorithms for Defined Hybrid Battery Systems
The implemented power distribution logic is not necessarily the most suitable if the battery system is defined. This means that if one has dimensioned a certain hybrid battery system, the power distribution may be optimized towards a specified objective, knowing the used battery cells and the application in detail. The objective might address an optimization of overall system efficiency. The latter was, for example, investigated for fuel-cell/high power storage hybrids in [
29]. Then, a model predictive control-based strategy, which optimizes the system efficiency, was developed for a plug-in EV with a hybrid battery system in [
30]. In [
31,
32], power distribution strategies for hybrid storages were developed utilizing basic filter approaches. Another optimization objective might address the minimization of battery aging. In [
31,
33,
34,
35], high-energy storage/supercapacitor hybrids were analyzed for automotive applications. The authors showed that current peaks and, moreover, the root-mean-square current load on the high-energy storage can be reduced. Thereof, they concluded that battery aging can be reduced. Nevertheless, the latter conclusion was not validated by aging measurements utilizing realistic driving-related load profiles.
The optimized power distribution for hybrid battery systems comprising two battery parts was subject to complementary work described in detail in [
27,
36]. In addition, beneficial aspects of hybrid battery systems comprising a high-energy solid-state lithium metal polymer battery were discussed in [
37]. Mainly two types of energy management strategies were introduced in [
27]: firstly, a reference solution was calculated offline, gaining the global optimal power distribution for a given driving mission and EV hybrid battery system. The procedure is based on a deterministic dynamic programming algorithm [
38]. Secondly, two online energy management strategies were established that allow for an optimized power distribution, though there is no exact knowledge of the future driving mission. One of these strategies considers a stochastic model of the vehicle’s drive mission. The other strategy is based on an instantaneous minimization of battery system energy losses. An equivalence term was added, taking into account a charge-sustaining operation of the high-power battery part. Overall, it was shown that the online energy management approaches allow for a near-optimal power distribution, which is comparable to the offline reference solutions. For example, the stochastic online strategy only shows a maximum of around 8.5% higher battery system energy losses (including dc/dc converters) when comparing it to the offline reference solution.
Moreover, in [
36], it was particularly analyzed whether a hybrid battery system can be utilized in order to reduce battery aging. Results were gained from elaborate cycle aging measurements and analysis on the battery cell level. The underlying hybrid battery system comprises the Li-ion cells in presented this work; i.e., the Panasonic high-energy and the Toshiba high-power cells. In comparison to the Panasonic cell, the Toshiba high-power LTO cell showed subordinate aging. Hence, aging investigations were focused on the Panasonic high-energy cell. For real world driving cycle profiles, it was found that the distance-related aging effects on the high-energy cell are largely independent of the level of energy throughput and short duration load profile power peaks for the given test conditions (Panasonic cell, constant 60% depth of discharged energy range, charge protocol, 23 °C cell surface temperature, load profile sequences). Nevertheless, it was then found that increasing recuperation pulse durations caused an acceleration of aging. This result leads to hybrid battery system operation recommendations addressing aging minimization: long time recuperation on the HE battery part should be avoided. In other words, recuperation phases exceeding a charging current rate of 1 C on the cell level and exceeding a duration of 30 s shall be avoided. In fact, these recuperation loads can be shifted to the less sensitive high-power battery part. On the other hand, discharging currents within the high-energy battery’s specifications can be applied on the HE battery without varying its aging behavior.
2.4. Battery Optimization Framework
The design process of a battery system is complex because the dependencies of characteristics spread across the complete development chain: the choice of cell type(s) influences the necessary number of cells for given application requirements, which influences the weight and volume of the pack. The resulting weight and loss power of the cells directly influence acceleration and range characteristics of the vehicle. The cooling system has to be well adapted to the chosen cells and application requirements to maintain the battery cells in their valid temperature range in worst case conditions, while not over-dimensioning the cooling system. Thus, the design process for an EV battery system shows circular dependencies. For a hybrid battery system, the design is even more complex. Assuming that an OEM may choose amongst five different cell technologies or types and also combines them to hybrid systems, the solution space for possible battery systems becomes huge. However, finding the best solution is a complex task. An evolutionary optimization approach (“Covariance Matrix Adaption Evolution Strategy” (CMAES), developed by Hansen et al. [
39]) was chosen in this work to solve this multidimensional and nonlinear optimization problem. Evolutionary optimization algorithms work similar to biological evolution: the best individuals of each generation are chosen to create new generations of individuals based on genetic operators. From generation to generation, the best individuals better fit the searched optimum. A major advantage of the chosen optimization approach by Hansen et al. compared to, e.g., genetic algorithms, is the significantly reduced number of parameters that have to be set in order to use the optimization algorithm for a specific problem, since the optimization algorithm adapts itself to the optimization problem. The migration towards the optimum solution is reached by mathematical methods, i.e., adapting the covariance matrix.
In the following, one specific hybrid battery configuration can be, for example, the combination of a pack made of 20 kWh of Panasonic cells and a second pack made of 3 kWh of Toshiba cells. Such a battery configuration is called an individual in the context of evolutionary optimization. In this work, the individual is coded by the energy of each cell type in the five packs:
[ESB LiMotive; EKokam; EPanasonic; EA123; EToshiba]—each given in Wh.
The above-mentioned individual would thus be coded as [0; 0; 20,000; 0; 3000]. The optimizer evaluates a certain number of such individuals in the very first step, called the first generation. The best individuals are then chosen for the next generation of individuals, i.e., the covariance matrix is adapted. Similar to evolutionary theory, the new generations contain individuals which are closer to the problem’s optimum. The key and major task in this process is the individuals’ evaluation. This is done inside the cost function. Besides what the name suggests, it not only calculates the direct costs of the particular individual (i.e., the battery costs) but also assigns penalty points or “costs” if certain requirements of the vehicle are not fulfilled with the chosen battery configuration. Inside the cost function, the vehicle model is used to determine the vehicle’s acceleration, maximum speed, and range for the specified individual under different conditions (warm, cold, beginning of life, after eight years). Simulink’s Rapid-Accelerator mode was used in order to maximize simulation speed. In this mode, an executable is built which contains all components of the model itself, as well as the equation solver. Thus, the model is not interpreted as it is in the case in the Simulink “Normal Mode”. In order to use the executable without modification, the particular settings for each individual—i.e., the battery specifications—are fed into the model using the concept of tunable parameters. This enables very fast simulations and furthermore parallelization of evaluations on multicore CPUs using the same executable with different parameters. If the specified vehicle requirements cannot be reached with the particular battery configuration (e.g., vehicle acceleration too low due to insufficient battery power), then penalty “costs” are assigned (e.g., X $ for every second (s) of acceleration time from standstill to 100 km/h, which is higher than the required acceleration time).
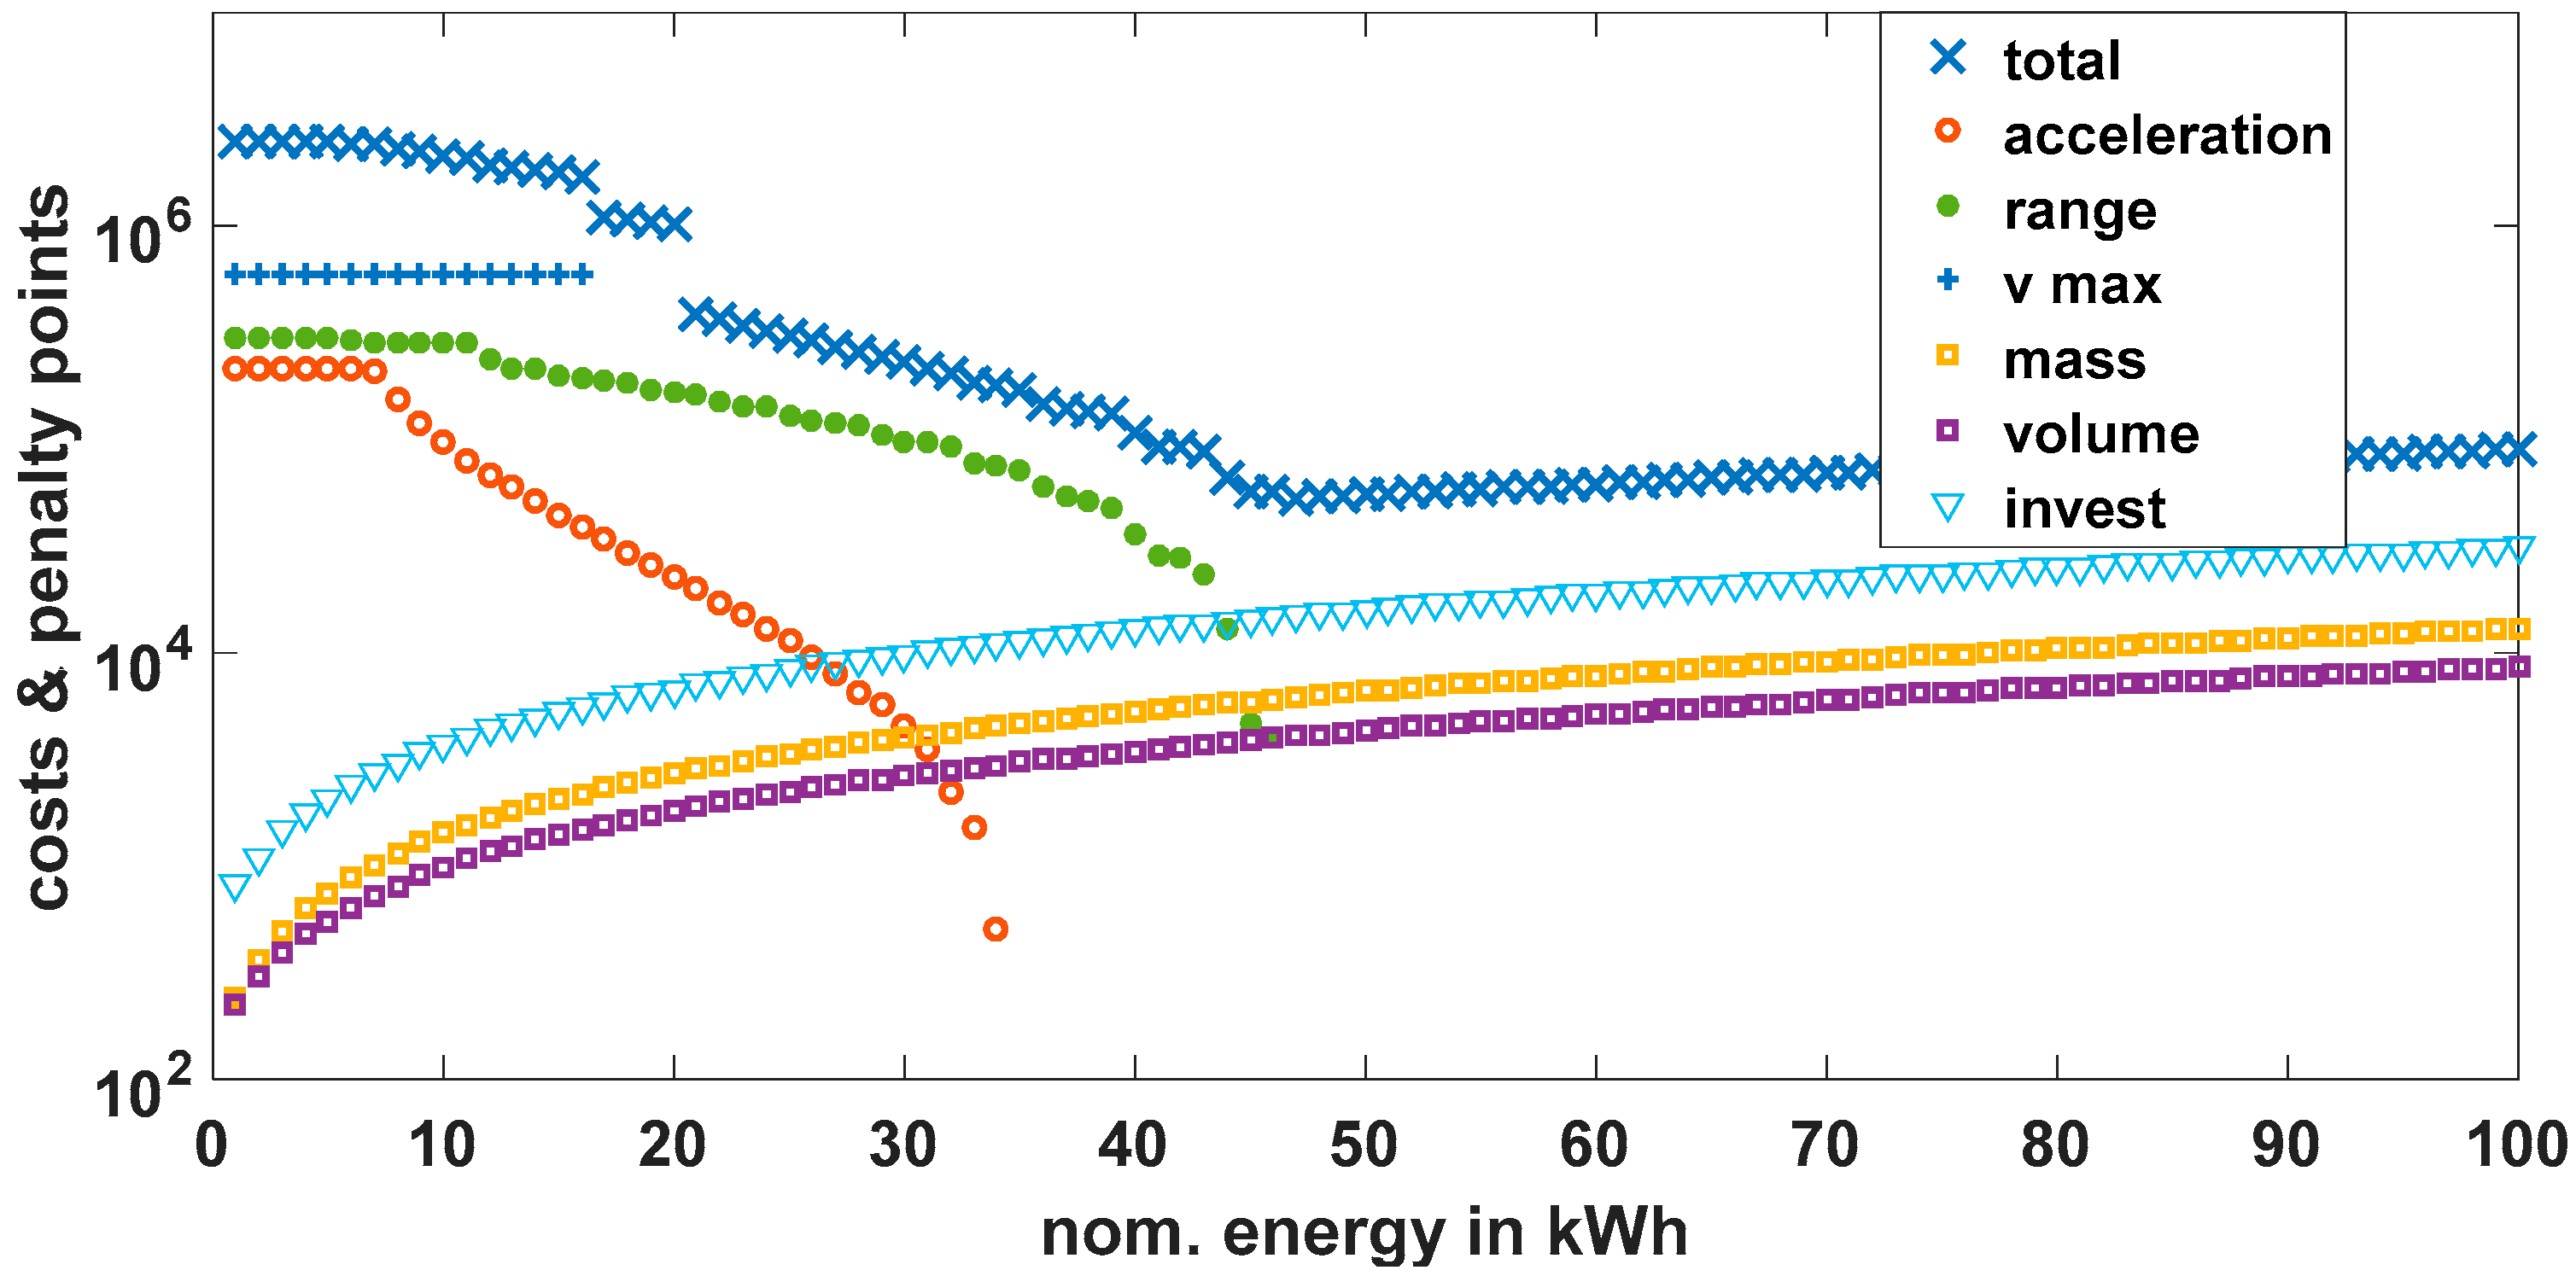
Weight, volume, and investment “costs” can be directly calculated in the cost function without simulation in the vehicle model. While investment costs are calculated in a currency, weight and volume are also converted using a linear penalty “cost” approach. All penalty “cost” factors can be parameterized in accordance to their particular relevance. If, for certain applications, the weight is of higher importance than the volume, the weight penalty “cost” factor can be increased relative to the volume “cost” factor and thus has higher influence on the individual’s evaluation.
The components of the cost function which are summed to the total costs are visualized in
Figure 7 for an example of a single-pack battery system which is iteratively increased in its nominal energy size by 1 kWh steps (
x-axis).
Note that the y-axis is logarithmic. Very small battery systems generate very high penalty points, since they cannot fulfill the performance requirements in the vehicle. One can see that from 35 kWh nominal energy upwards, the penalty points for acceleration vanish, meaning that these battery configurations enable the vehicle to accelerate fast enough. Also, from 45 kWh onwards, the penalty points for the range criterion are zero. The total costs thus have a minimum in this range of energy for this particular cell type and vehicle. For even higher energy capacity, the mass and volume increase, which generates higher penalty points again—additional to higher investment costs.
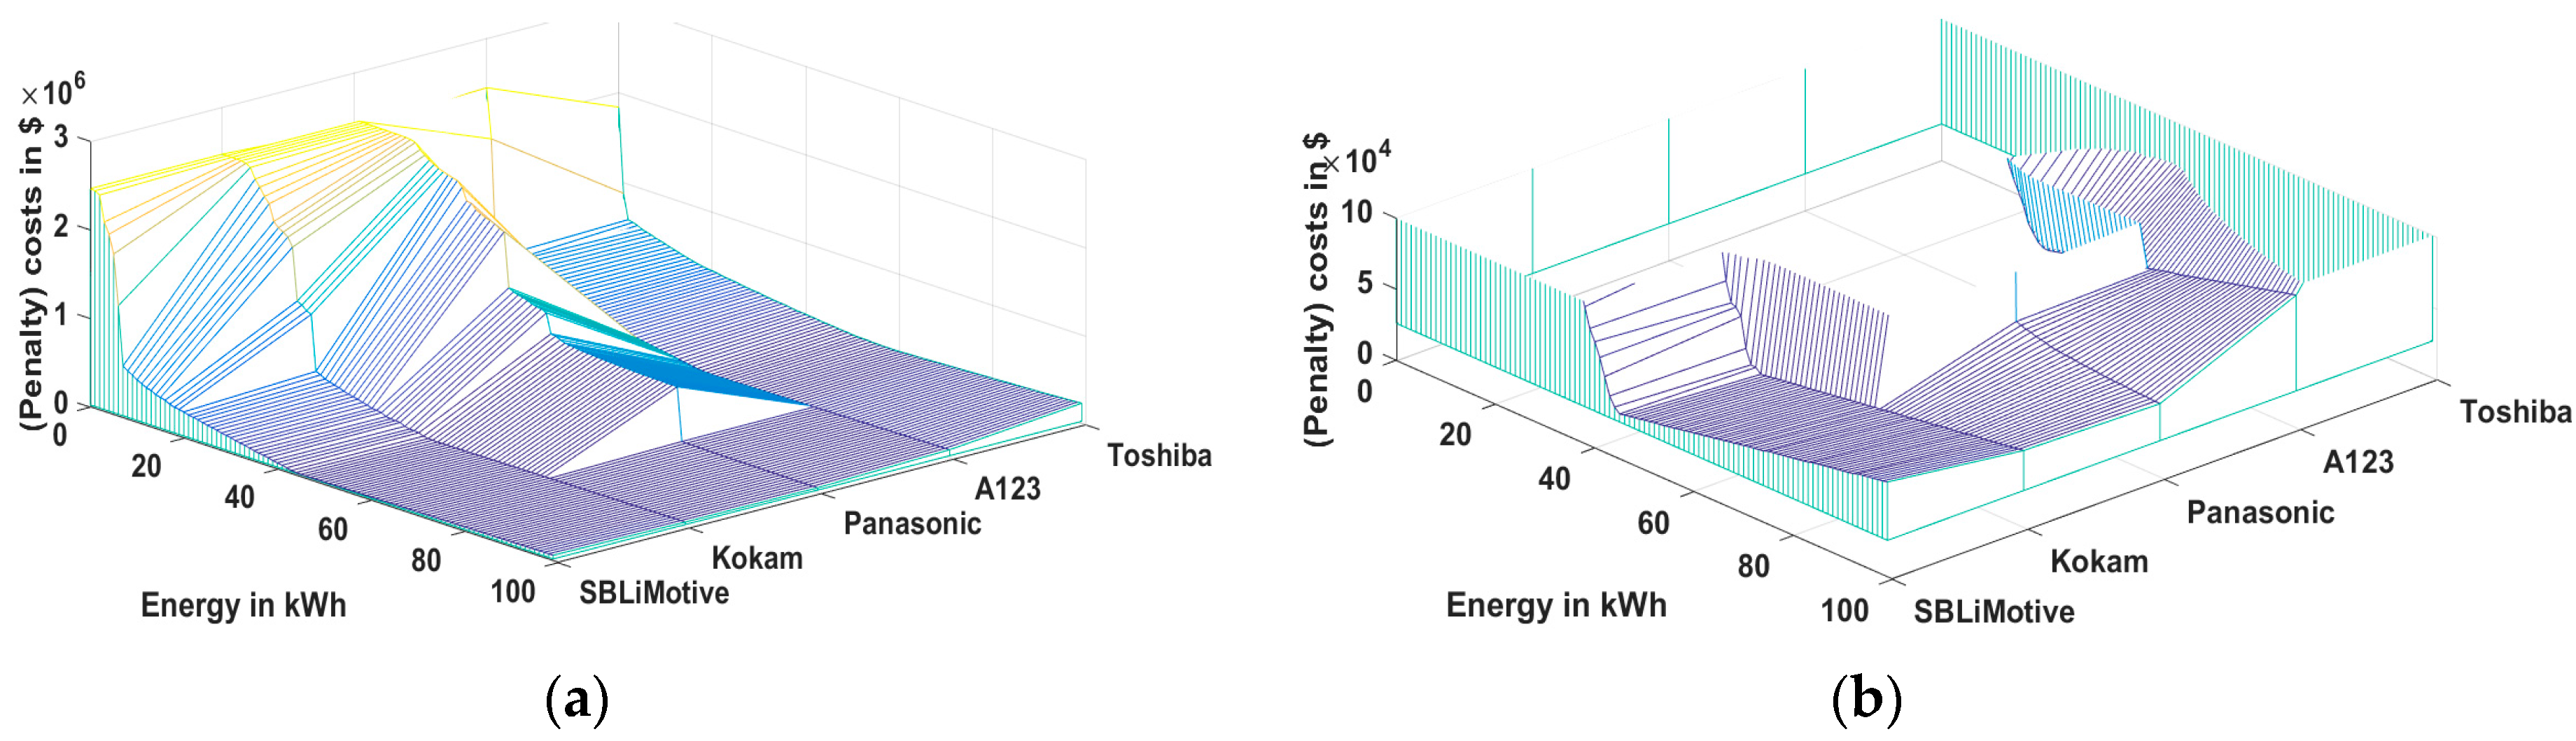
Figure 8 shows the result of the cost evaluation for the five different cell types with different sizing of the packs. The particular cost components (as shown in
Figure 7) are not visualized but only the total costs. Similar to
Figure 7, one can see a global cost minimum in the range of 50 kWh for packs with SB LiMotive, Kokam, and A123 cells. Due to the limited power of the Panasonic cell, significantly higher energy content is required with this cell type in order to fulfill the acceleration requirement, which is mainly influenced by the cells’ maximum electrical power. Battery systems only containing the Toshiba cell show comparatively high mass and volume figures, which leads to high costs over the complete energy range. A visualization of the cost function’s results for differently sized battery packs, as shown in
Figure 8, is only possible for single-pack battery systems, since a combination of cell types leads to a more dimensional solution space. Furthermore, the computational effort to analyze all cell combinations with all sizes (brute force optimization) increases significantly in a hybrid battery approach. This is why a systematic optimization approach was developed in this work and used for different vehicles.


