1. Introduction
Modern society depends heavily on transportation and logistics. However, conventional methods create a series of urgent concerns, including traffic congestion and environmental issues. In light of these pressures, major objectives to reduce global warming tend to emphasize the promotion of more eco-friendly transportation options [
1]. The International Energy Agency (IEA) has reported that global electric vehicle (EV) sales will exceed 30 million in 2025 and reach 70 million by 2030, which will represent 60% of total car sales [
2]. This transformation is driven by rapid advances in EV traction systems, power electronics and energy storage systems [
3,
4]. Nevertheless, thanks to the rapid prototyping components of the simulation frameworks, it is possible to evaluate reliability, efficiency and performance before actual hardware deployment [
5]. An electric motor is the main part of an electric vehicle’s powertrain. Among all existing topologies, several previous studies have affirmed that the permanent-magnet synchronous motor (PMSM) represents an attractive choice, due to its high torque density and high efficiency [
6,
7,
8]. A PMSM can offer lower rotor losses than an induction motor (IM), along with better torque control, particularly when operating under field-oriented control (FOC), which provides fast response dynamics and optimized overall parameters [
9]. The FOC algorithm transforms the three-phase current into a rotating d-q reference frame, offering a decoupled control of the flux and torque components. This control scheme, together with space vector pulse width modulation (SVPWM), produces a very low torque ripple, very low noise and fast dynamic response. FOC remains effective provided that the machine parameters, inverter switching dynamics, and current feedback are well modeled [
10]. Indeed, power electronics technologies have also made significant advancements with wide-bandgap semiconductors such as silicon carbide (SiC) MOSFETs [
11]. Unlike traditional IGBTs, SiC components switch with significantly lower switching losses, operate at lower temperatures under high-load conditions, and tolerate higher temperatures. As a result, inverters can operate at much higher frequencies and can be made smaller and lighter without compromising efficiency or reliability [
12]. However, operation at high frequency requires a filtering process to reduce harmonics and maintain signal waveform quality at motor terminals. LC and LCL circuit filters are widely used for this purpose and need to be designed along with the inverter to prevent resonance and EMI problems [
13,
14]. Beyond their effect on the motor-terminal waveform, these filters interact with the transient electrical behavior of the traction motor current and the inverter input power caused by fast variations in electromagnetic torque. While PWM switching introduces high-frequency power components, some of these fluctuations can impact the demanded current from the energy storage sources through the common DC bus.
Moreover, energy is exchanged between the inductive and capacitive elements of the LC filter, affecting the transient power flow between the inverter, PMSM, DC bus and energy-storage system. Consequently, the battery and supercapacitor currents are influenced not only by the low-frequency vehicle power demand, but also by the electrical dynamics of the inverter and its output filter. Therefore, the inverter-side LC filter and the hybrid energy storage system should be evaluated within the same dynamic framework rather than as independent subsystems.
To complete the electric-vehicle topology, a storage system is implemented to supply the necessary power to all equipment and ensure vehicle operation. Li-ion batteries remain an attractive choice for electric-vehicle design because of their high energy density and proven track record, as reported in several recent studies [
15,
16]. Moreover, during rapid acceleration or regenerative braking events to recover energy, their internal resistance, heat buildup, and gradual aging can become serious obstacles. For this reason, hybrid energy-storage systems (HESS) have been rising in popularity by pairing a Li-ion pack with a supercapacitor (SC) pack, to access the benefits of both [
17,
18]. The supercapacitor can charge and discharge rapidly, provide high-power transient support, and perform hundreds of thousands of cycles with virtually no signs of wear [
19]. In a HESS configuration, the battery system provides a steady energy supply, and the supercapacitor pack helps release or absorb power surges during acceleration/braking phases, which leads to the prolongation of battery life and to the enhancement of the system efficiency [
20,
21,
22]. To implement the hybrid energy-storage unit, a bidirectional dc/dc boost converter is required that supplies power to and from the battery, the supercapacitor, and the common dc bus [
23,
24]. These power converters need to be sized correctly to ensure efficient energy transfer, to limit voltage ripple, and not operate at unsafe temperatures [
25,
26]. To control the power flow in a HESS, a rule-based control is frequently applied due to its simplicity and real-time feasibility. This method can be easily implemented on a low-cost micro-controller and does not require high computational resources; therefore, it is practical for automotive applications [
27]. The rule-based controller receives the battery state of charge (SOC), the supercapacitor voltage, and issues suitable control commands to two bidirectional DC/DC converters of the storage units. The system thus guarantees continuous power from the battery during long operating periods and enables the supercapacitor to compensate for rapid transient load requirements, which can reduce the high-current stress applied to the battery and support stable power sharing.
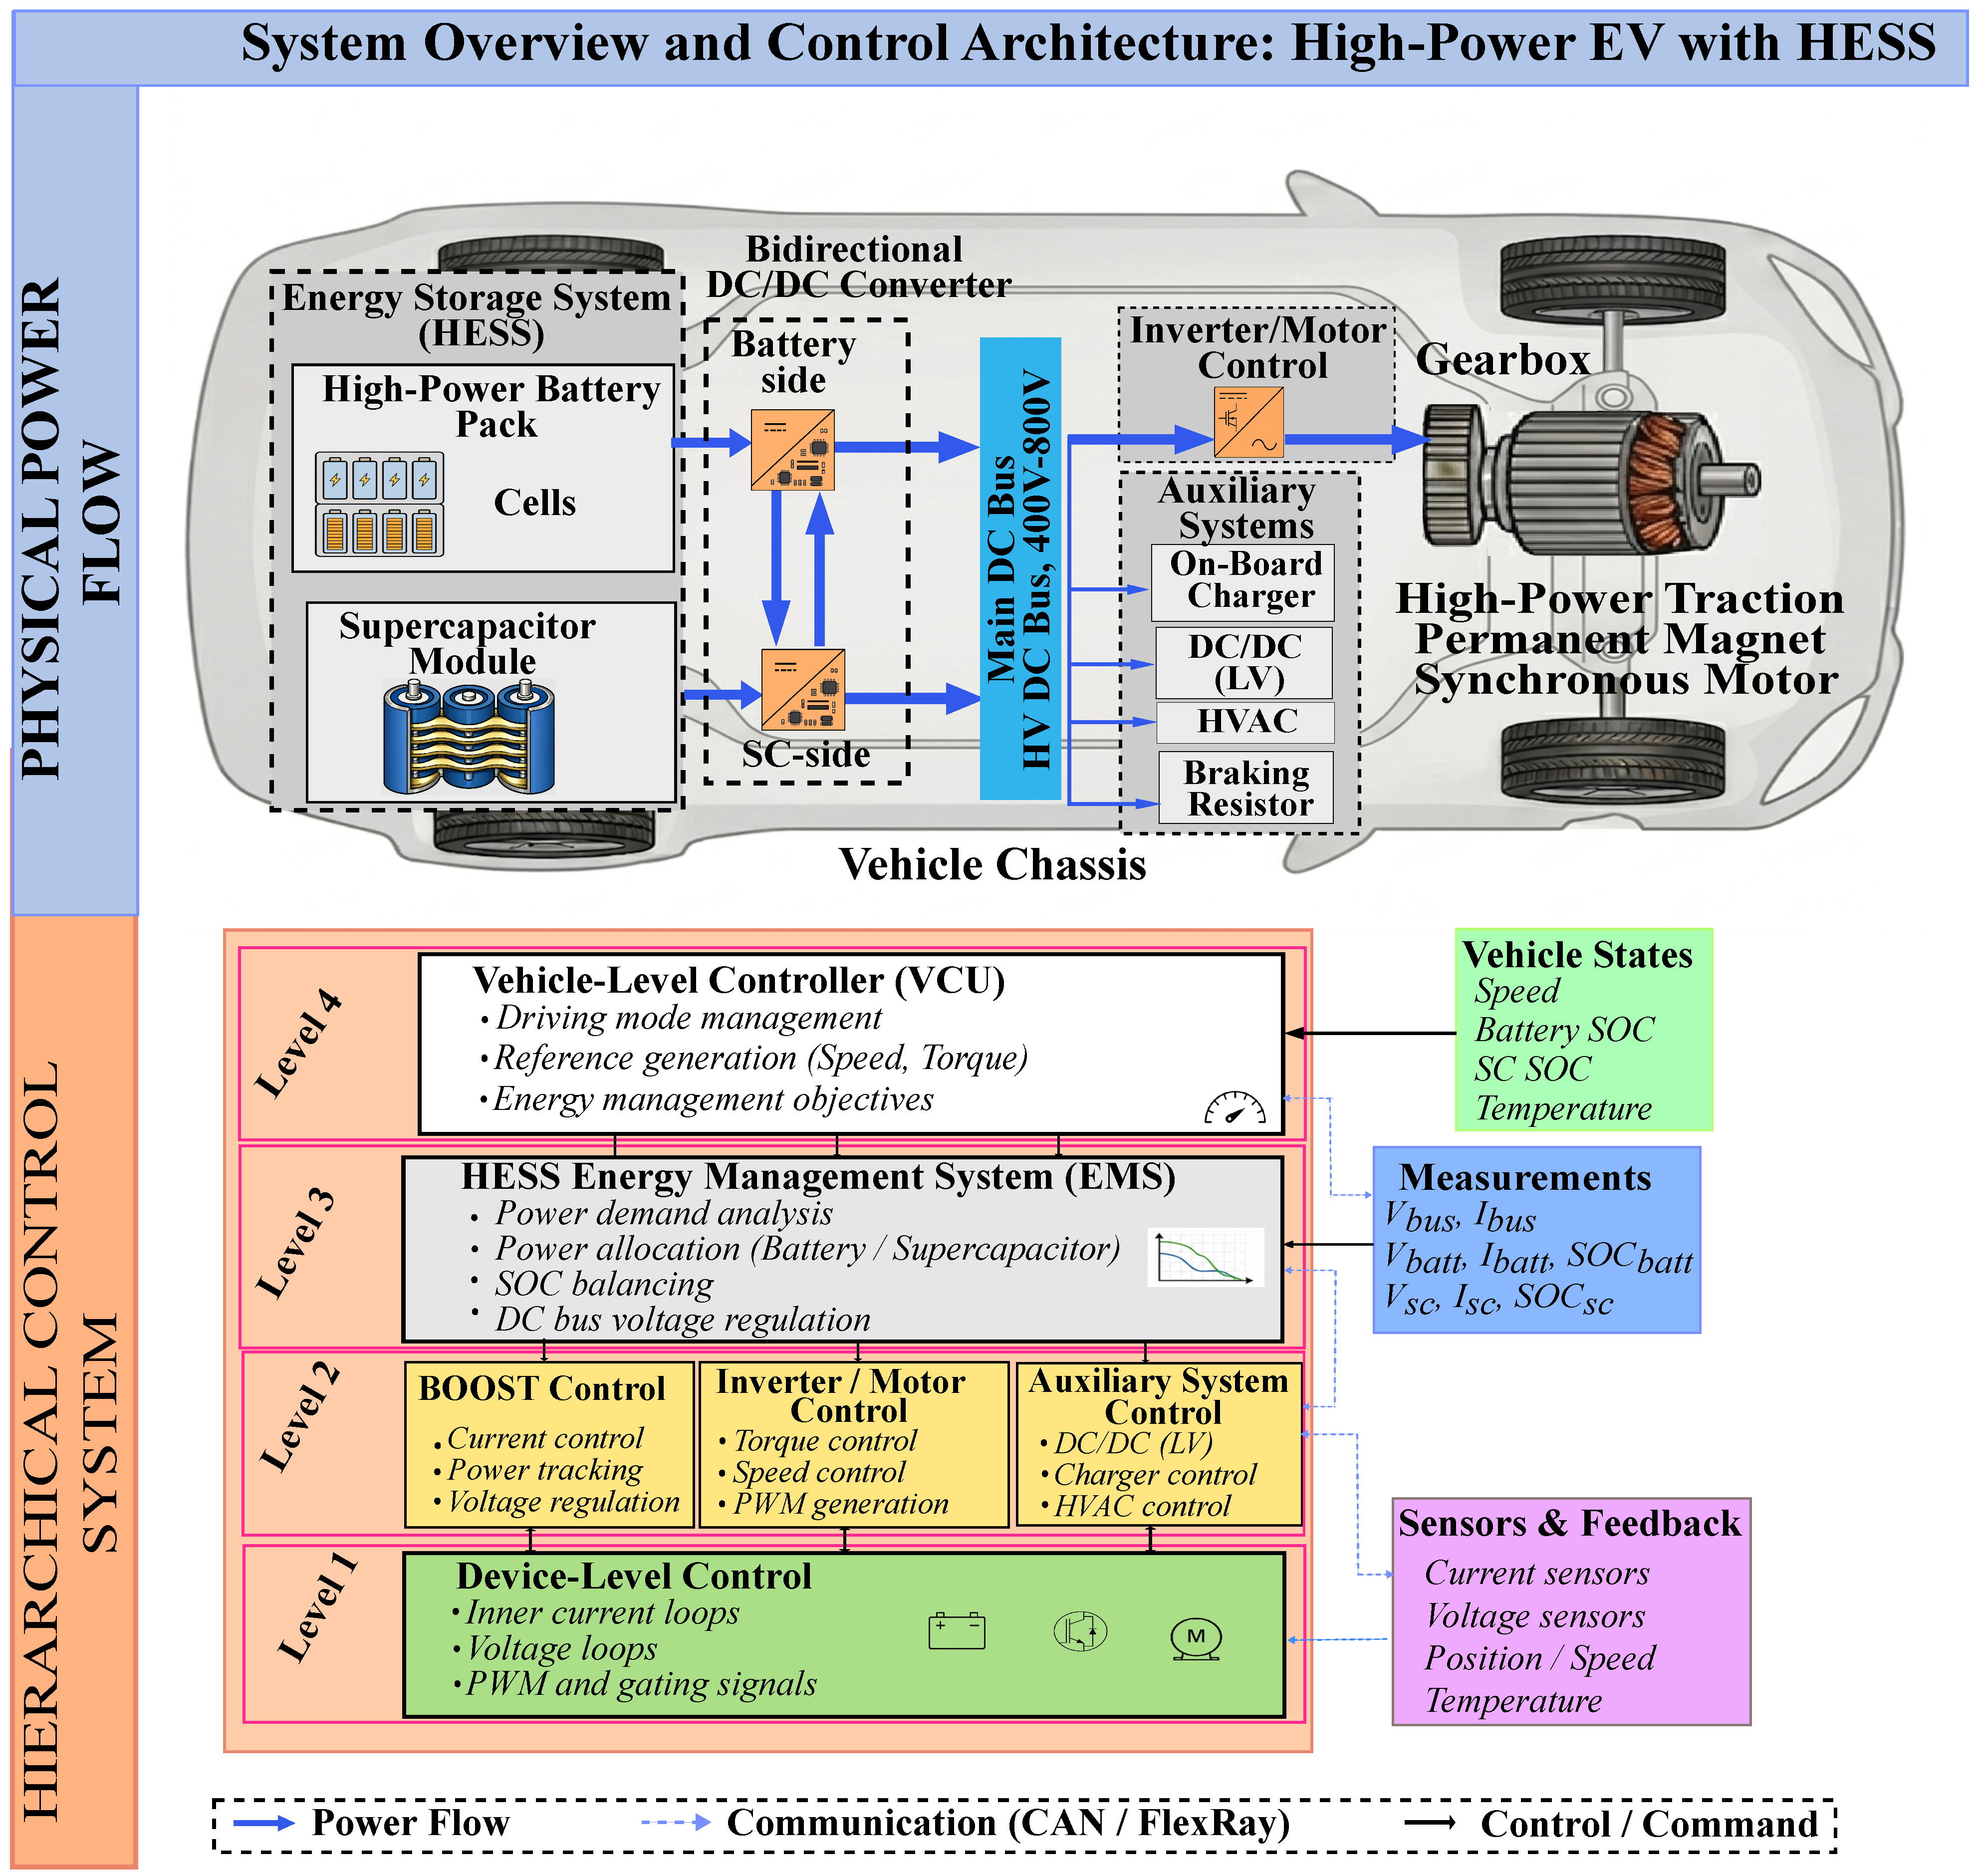
Figure 1 presents the powertrain configuration of the electric vehicle studied with a hybrid storage system (HESS).
1.1. Related Work
Numerous configurations have been suggested, ranging from component modeling to traction chain simulation, to solve the challenges of electric vehicle (EV) propulsion, such as vehicle dynamics, high-performance motor control, switching effects, and integration of hybrid storage systems under high load demands. This section reviews several contributions in the literature, emphasizing the objectives, methodologies and results that support the modeling choices adopted in this paper.
A methodology that jointly addresses energy source sizing and optimal energy management in hybrid electric powertrains is presented in [
28]. The proposed solution combines genetic algorithm-based sizing with dynamic programming to compute the optimal power split over a known driving cycle. This gives the minimum required size, no matter how the final real-time EMS is set up. The results show that co-optimizing design and control can greatly improve energy use and serve as a standard for less-than-ideal real-time strategies.
A rule-based energy management for a battery–supercapacitor HESS aims to improve efficiency and extend battery life. The method produces a current reference for a PI controller to maintain the supercapacitor SOC within the limits. The method has been tested and validated on an experimental platform, showing good load sharing and reduced battery stress under several load demands [
29].
In this work [
30], the authors suggest an adaptive fuzzy logic energy management strategy for a battery/ultra-capacitor storage system in electric vehicles (EVs). It focuses on splitting real-time power without needing to know the driving cycle. The goal of the strategy is to make the system efficient while keeping the battery current and ultracapacitor SOC deviation as low as possible. The performance is evaluated using simulation tools, showing improved adaptability compared with static fuzzy-rule methods.
The study in [
31] investigates a semi-active battery-supercapacitor HESS and suggests a real-time energy management system that uses filtering and fuzzy logic to split low-frequency/ average power to the battery and fast transients to the supercapacitor. The method is backed up by experimental validation, showing a reduction in battery current peaks and improved transient handling during acceleration and regenerative braking.
The work in [
32] presents a method for controlling the C-rate of a battery/supercapacitor storage system in order to enhance battery cycle life in electric-vehicle applications. The main objective consists of using a simplified current-sensing scheme in which battery current is considered the controlled variable. The method is validated by simulation and experiments on a motor-drive system (battery + SC + boost + inverter + PMSM), showing reduced battery current during stress levels and better use of recovered energy.
The article [
33] proposes a new energy management system (EMS) for EVs based on a fuzzy controller to balance energy between the lithium battery and the supercapacitor. An improved NSGA-III is used to tune the fuzzy rule base. The work targets multi-criteria objectives such as energy consumption, battery current, and SOC constraints.
Reference [
34] proposes an EV-oriented energy-management strategy based on driving-pattern recognition and an adaptive wavelet–adaptive fuzzy logic (AWT-AFL) framework for battery–supercapacitor power sharing. The method was validated on a real-time experimental test bench and showed reductions in RMS battery current and peak-current events compared with the baseline strategies.
This article [
35] reviews the impact of rotor-position error on the FOC algorithm for PMSM drives in electric-vehicle applications, with a focus on torque ripple reduction during operating trajectories. The work provides a rigorous interpretation of torque/iq behavior and tracking errors in simulation, especially when estimation/sensing inaccuracies are present.
In this work [
36], the authors present a design analysis of an inverter LC filter coupled with motor drives, with the objective of reducing common-mode and terminal over-voltage. The work outlines a practical design and illustrates how the filter structure can reduce stress at motor terminals, supporting the inclusion of a second-order filter to reduce switching effects in traction chains.
Finally, a recent review describes the state of the art in battery–supercapacitor storage systems for EV applications, covering several architectures, control strategies, and their impact on vehicle performance, such as acceleration, driving range, and durability [
37]. This discussion supports the objective of combining high energy density batteries with high power-density supercapacitors and raises challenges for modeling and energy management evaluation. The relevant cited related works are summarized and compared in
Table 1, with respect to their main methods and key contributions in terms of EV traction control.
1.2. Paper Contribution
Several recent studies treat EV subsystems in isolation: most energy management papers tend to focus on a storage system coupled to a DC bus without covering drive signal effects in detail, whereas drive studies cover control performance and switching consequences without treating the storage system. This work uses an integrated simulation framework in which vehicle dynamics, traction control, power electronics, output filtering, and hybrid energy-storage management are individually modeled and dynamically coupled to evaluate their interactions under identical operating conditions. Individual techniques are well established and are not presented as separate contributions; the contribution lies in studying their interactions at the complete powertrain level. The advantage of this framework is that it allows for the simultaneous evaluation of the speed-control performance, the DC-bus regulation, the battery-current stress, the supercapacitor contribution, the regenerative-energy flow, and the motor-terminal voltage quality within the same framework.
Physically grounded traction load generation for powertrain assessment: Most previous works apply an artificial torque for drive control; the demanded traction load is derived from a longitudinal vehicle model (aerodynamic drag, rolling resistance, inertia, slope). This makes the electrical charge (current peaks, DC-bus ripple) physically meaningful and offers realistic driving conditions.
Coupled evaluation of PMSM–FOC performance through the powertrain: The PMSM drive is modeled and controlled by the FOC algorithm in the d-q frame, but the analysis goes beyond the tracking plots by explicitly relating d-q current behavior and torque ripple to practical drive phenomena. This is aligned with traction-drive studies that quantify how control and position errors translate into ripple along operating trajectories.
Assessment of inverter-filter interactions with DC-link and storage-source dynamics: While LC output filters are often used to reduce high-frequency components at drive terminals, they are rarely treated together with HESS energy management in EV works. In this paper, a second-order LC filter is evaluated not only for waveform quality (voltage smoothing), but also for its indirect effect on DC-side power ripple and storage currents.
Dual-converter HESS architecture for constrained battery–supercapacitor power sharing: A double-path HESS interface allows power to be shared in flexible and constrained ways: there are DC/DC converter paths connecting the battery pack and the supercapacitor bank. This configuration allows the supercapacitor to handle quick changes while the battery provides average energy. This is in line with HESS’s main goal for EVs (peak shaving and reduced battery current stress), but this is achieved within a powertrain system that exhibits stable electrical and mechanical dynamics.
A rule-based EMS designed for real-time feasibility, yet evaluated with research-grade metrics: Rule-based EMS strategies are mostly used because of their easy implementation and robust performance. Previous research shows that a battery current reference can be effectively generated to extend battery life. Building on this principle, this work establishes a clear dispatch logic (battery slow component, SC = transients), enforces state of charge and current limitations, and assesses performance using stress indicators (peak/RMS battery current) and dynamic drive indicators (speed tracking, dq currents).
A coordinated evaluation of control and energy performance: The traction drive, HESS, DC bus, and the filtering stage are evaluated within the same composite transient operating profile. This allows the electrical and mechanical responses of the different subsystems to be examined under the same sequence of operating conditions.
The remainder of this paper is organized as follows.
Section 2 presents the vehicle dynamic model and the PMSM traction system.
Section 3 describes the field-oriented control strategy.
Section 4 details the hybrid energy storage system, including battery and supercapacitor modeling, the bidirectional DC/DC converter, as well as the proposed energy management strategy.
Section 5 presents and discusses the simulation results. Finally,
Section 6 concludes the paper and outlines future research directions.
The main symbols, variables, and performance indices used in this study are summarized in
Table 2.
2. Vehicle Dynamics Modeling
An EV is not a single entity; rather, it is composed of several subsystems that must work cooperatively to ensure that the vehicle operates effectively. As illustrated in
Figure 1, the whole EV model can usually be decomposed into several key sub-models: the vehicle dynamic model (VDM), the electric machine, the power electronic converters, the energy storage system (batteries or hybrid storage), the hierarchical control system and auxiliary units. In this work, the traction system is modeled using a surface-mounted permanent-magnet synchronous motor.
The main vehicle parameters used in the longitudinal dynamic model are summarized in
Table 3. The selected values are representative of a mid-size passenger electric vehicle and are consistent with parameter ranges commonly adopted in longitudinal EV models reported in the literature [
38,
39].
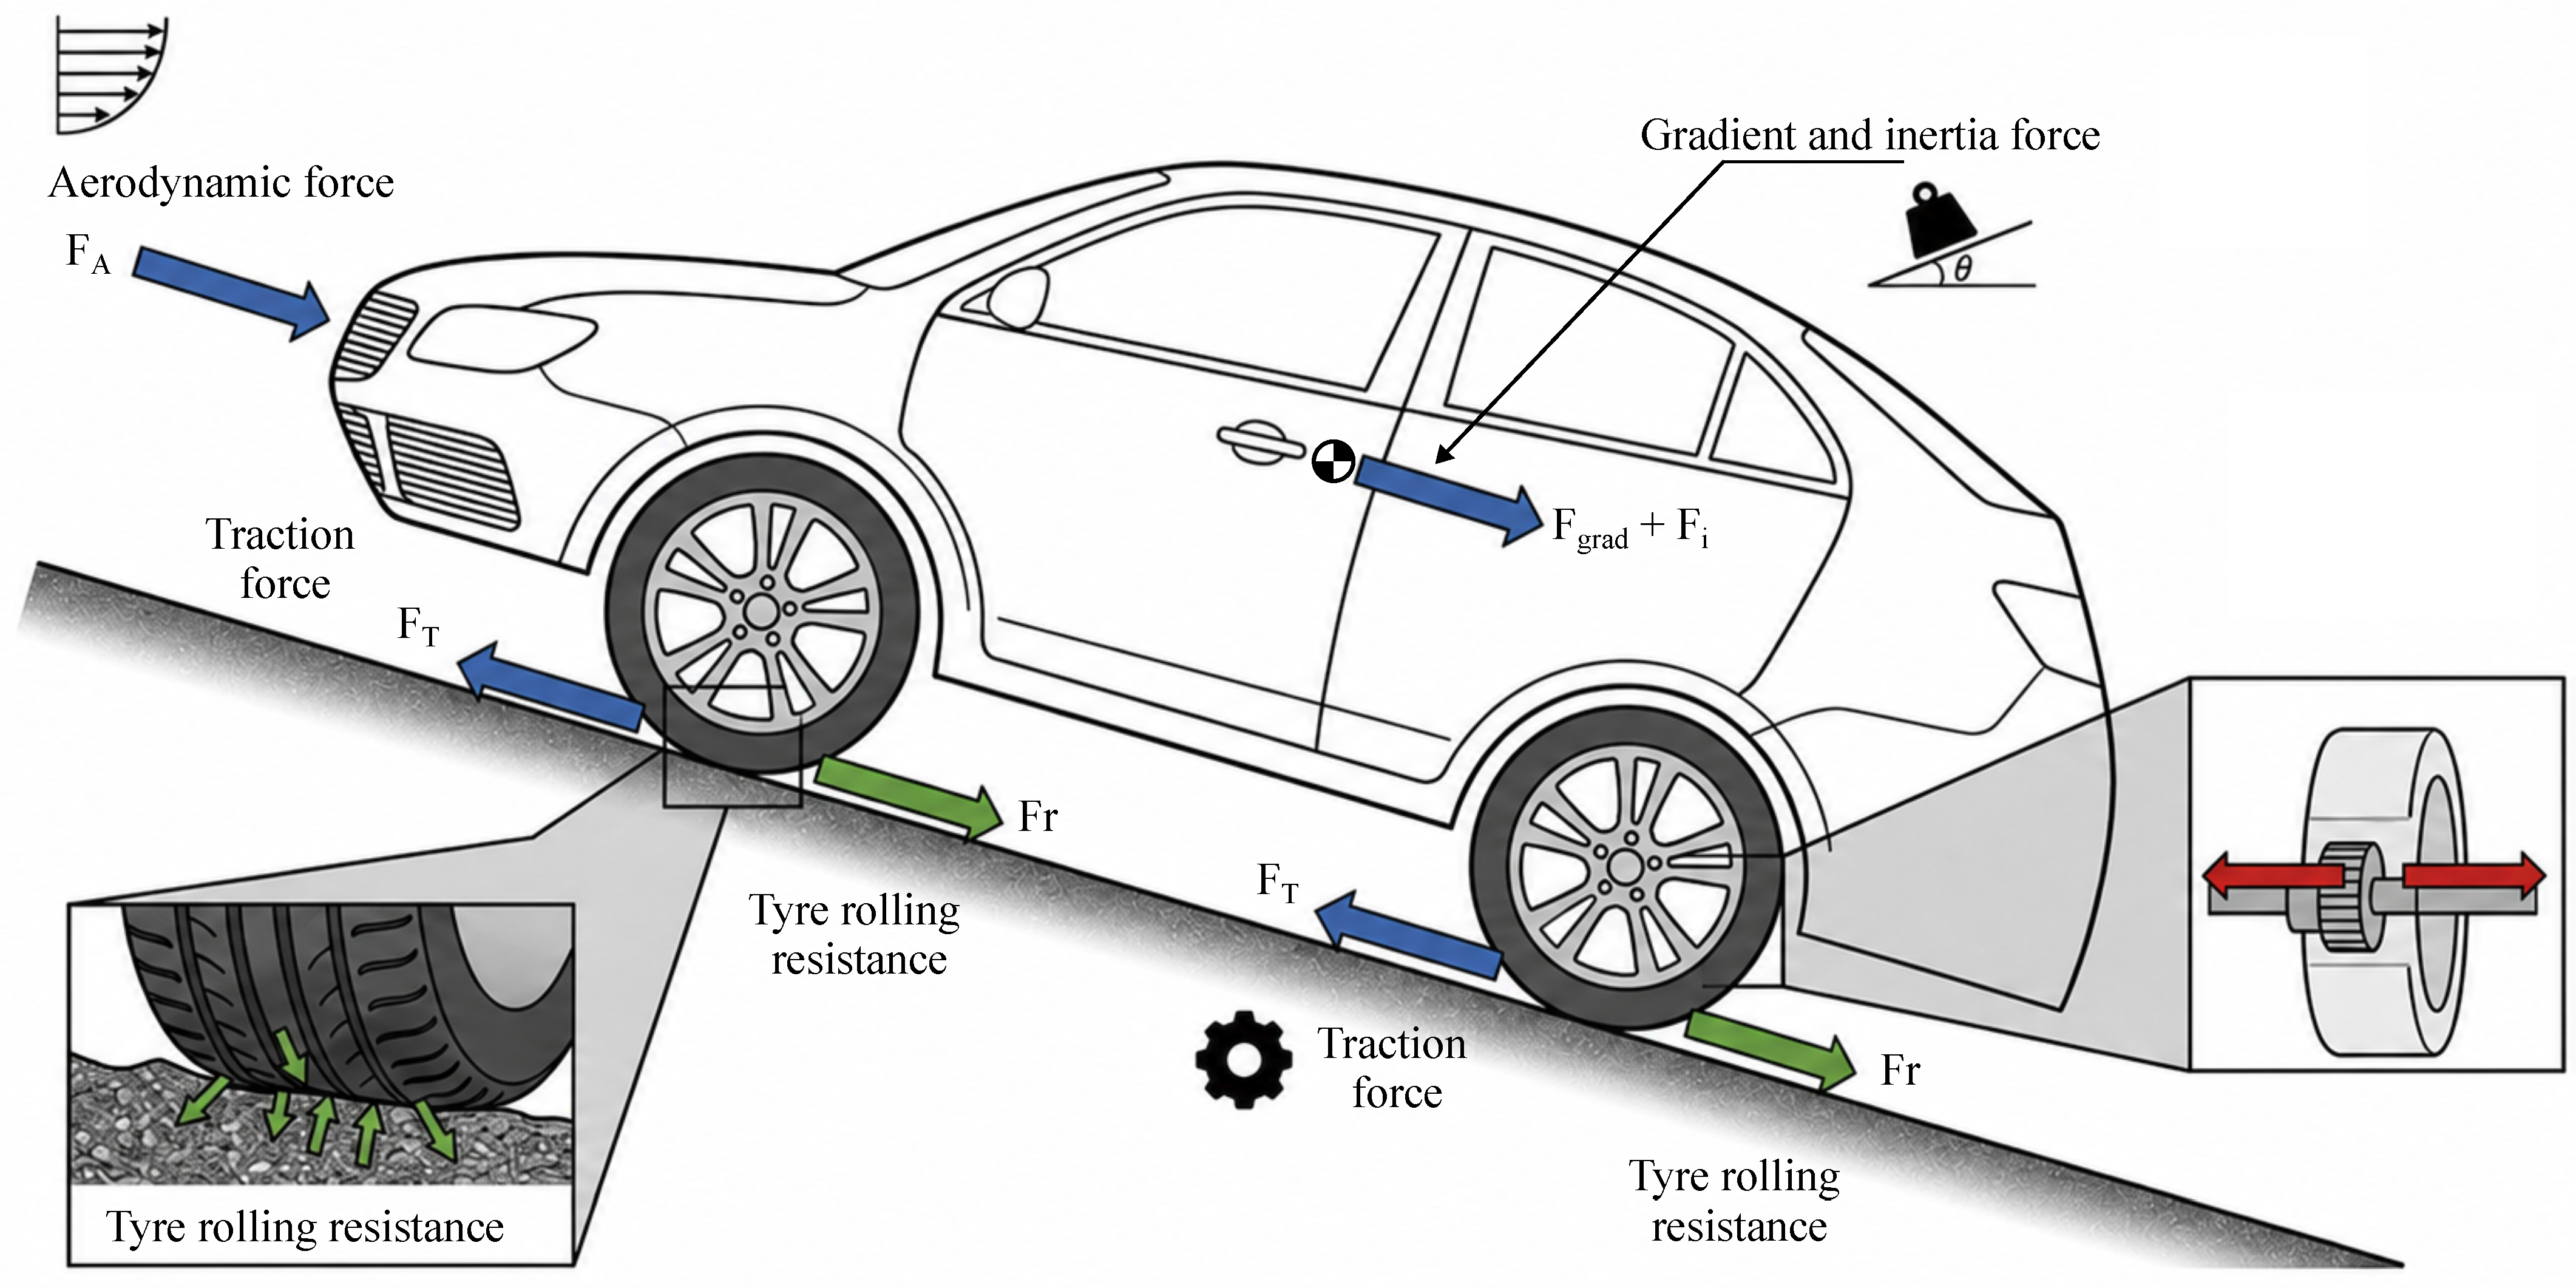
The method considers that the electric vehicle is subjected to the total resistive forces over a driving-cycle velocity profile. Using these forces, the model calculates the necessary torque and power to be produced by the traction machine. As illustrated in
Figure 2, overall forces influencing the vehicle motion can be categorized as:
2.1. Aerodynamic Drag Force
When a body travels through a medium, for example air, a force resists its motion and the opposing force is known as aerodynamic drag. The aerodynamic drag force
is modeled as:
where
For longitudinal studies with wind aligned to the road, the relative air speed is
where
is the vehicle speed in direction of travel (the longitudinal speed) and
is the local wind speed.
During the simulation, the longitudinal headwind speed is varied with time to reproduce changing aerodynamic conditions. Lateral wind components and vehicle yaw effects are not considered in the present aerodynamic model.
By convention:
Headwind makes the relative velocity higher, so . This increases the drag force because the wind opposes the vehicle motion.
If there is a tailwind relative to the velocity, the speed decreases, so . This reduces the drag force because the wind assists the vehicle motion.
2.2. Tire Rolling Resistance Force
Rolling resistance comes from the energy dissipated through tire deformation, road irregularities, and hysteresis in the tire and road contact patch. It is almost proportional to the normal load of the vehicle and is slightly speed dependent:
where
is the rolling resistance coefficient (usually 0.005–0.015 for a passenger car).
m is the mass of the vehicle [kg].
g is gravitational acceleration [m/s2].
is the road-grade angle.
2.3. Gradient Resistance Force
On hilly roads, gravity adds a longitudinal effect which can increase or decrease the required traction:
When driving uphill, this force is added directly to the resistive load, so the gradient is one of the most important parameters influencing EV range [
5]. On the other hand, downhill driving produces a negative component that may be recovered through regenerative braking to recover energy and extend the driving range [
6].
In the applied profile, the maximum effective uphill grade is approximately 23.5% (). This value represents a severe road condition and is intentionally used to evaluate the traction system under demanding operating conditions rather than typical road operation. The grade is continuously varied between the different operating regions, without abrupt step changes. Consequently, the gravitational load and the corresponding motor resisting torque also vary progressively, avoiding artificial torque discontinuities caused by sudden grade changes.
2.4. Inertial Force
The inertial force shows the vehicle’s resistance to acceleration or deceleration under the action of Newton’s second law:
with
the longitudinal acceleration. This parameter is critical during transient events such as sudden acceleration, urban stop-and-go operation, or regenerative braking events [
5]. These power peaks should be reduced to improve drivetrain efficiency; in this context, effective control strategies such as predictive power management are required [
6].
2.5. Total Resistive Force
The combined resistance to the vehicle
is the sum of aerodynamic, rolling, gradient and inertia resistive forces:
3. PMSM Modeling and Control
3.1. PMSM Modeling and Parameterization
The PMSM is modeled using the classical d–q axis equations by applying the transformation of the three-phase voltages and currents into the synchronous rotating reference frame. The dynamic model includes the stator resistance Rs, the d- and the q-axis inductances Ld, Lq and the permanent-magnet flux linkage
. The stator voltage equations in the d-q reference frame are given by:
where vd and vq are the voltages, id and iq are the currents, Rs is the resistance, Ld and Lq are the direct- and quadrature-axis inductances,
is the electrical speed, and
is the permanent-magnet flux linkage. From these voltage equations, the differential equations governing the current dynamics can be explicitly derived as:
The appearance of the dependent terms in these equations emphasizes the intertwining between the d and q axes. The d-axis controls the magnetic flux, whereas the q-axis governs torque production.
Te is the torque generated by the PMSM.
where p is the number of pole pairs.
Since the considered machine is a surface-mounted PMSM with
, the reluctance torque term is zero. Therefore, the electromagnetic torque equation reduces to
It is this mathematical model that is used as the basis for control techniques like the FOC, which attempt to decouple the flux and torque available for high-performance drive operation. The mechanical behavior of the rotor can be described using Newton’s law:
where
J is the moment of inertia of the motor and load (kg·m2),
B is the viscous friction constant (N·m·s).
is the mechanical angular velocity (rad/s).
is the load torque (N·m).
The electrical angular velocity is related to the mechanical angular velocity by: = p
This is a useful model to develop control and simulation design, particularly for Field-Oriented Control (FOC) strategies, where the decoupling between flux and torque winding components is realized by independently regulating id and iq.
3.2. Field-Oriented Control Strategies
FOC is regarded as a fundamental control principle for PMSMs in electric vehicles because it enables independent control of flux and torque. The idea behind the method is to map the three-phase currents (ia, ib, ic) to the orthogonal axes to simplify the control problem. The Clarke transformation converts the three-phase currents into a stationary two-axis reference frame:
This reduces the system to two orthogonal components without losing the information content of the original three-phase currents. Then, these components are rotated into the rotor-synchronous frame using the Park transformation:
Here,
and
denote the flux- and torque-producing current components, respectively. The adopted FOC structure consists of an outer speed-control loop and two inner current-control loops. The speed PI controller generates the quadrature-axis current reference according to
For the considered surface-mounted PMSM, the direct-axis current reference is set to
The current errors are defined as
The
d- and
q-axis current PI controllers directly generate the voltage references:
The resulting -axis voltage references are transformed into three-phase quantities through the inverse Park transformation and then applied to the inverter.
In the present implementation, the speed and current loops use conventional PI controllers. No explicit motor-current limitation, -voltage saturation, or anti-windup function is included. The direct-axis current reference is kept at over the investigated speed range, and field-weakening operation is therefore not considered. The voltage references generated by the current controllers are applied to the inverter through the inverse Park transformation and SVPWM.
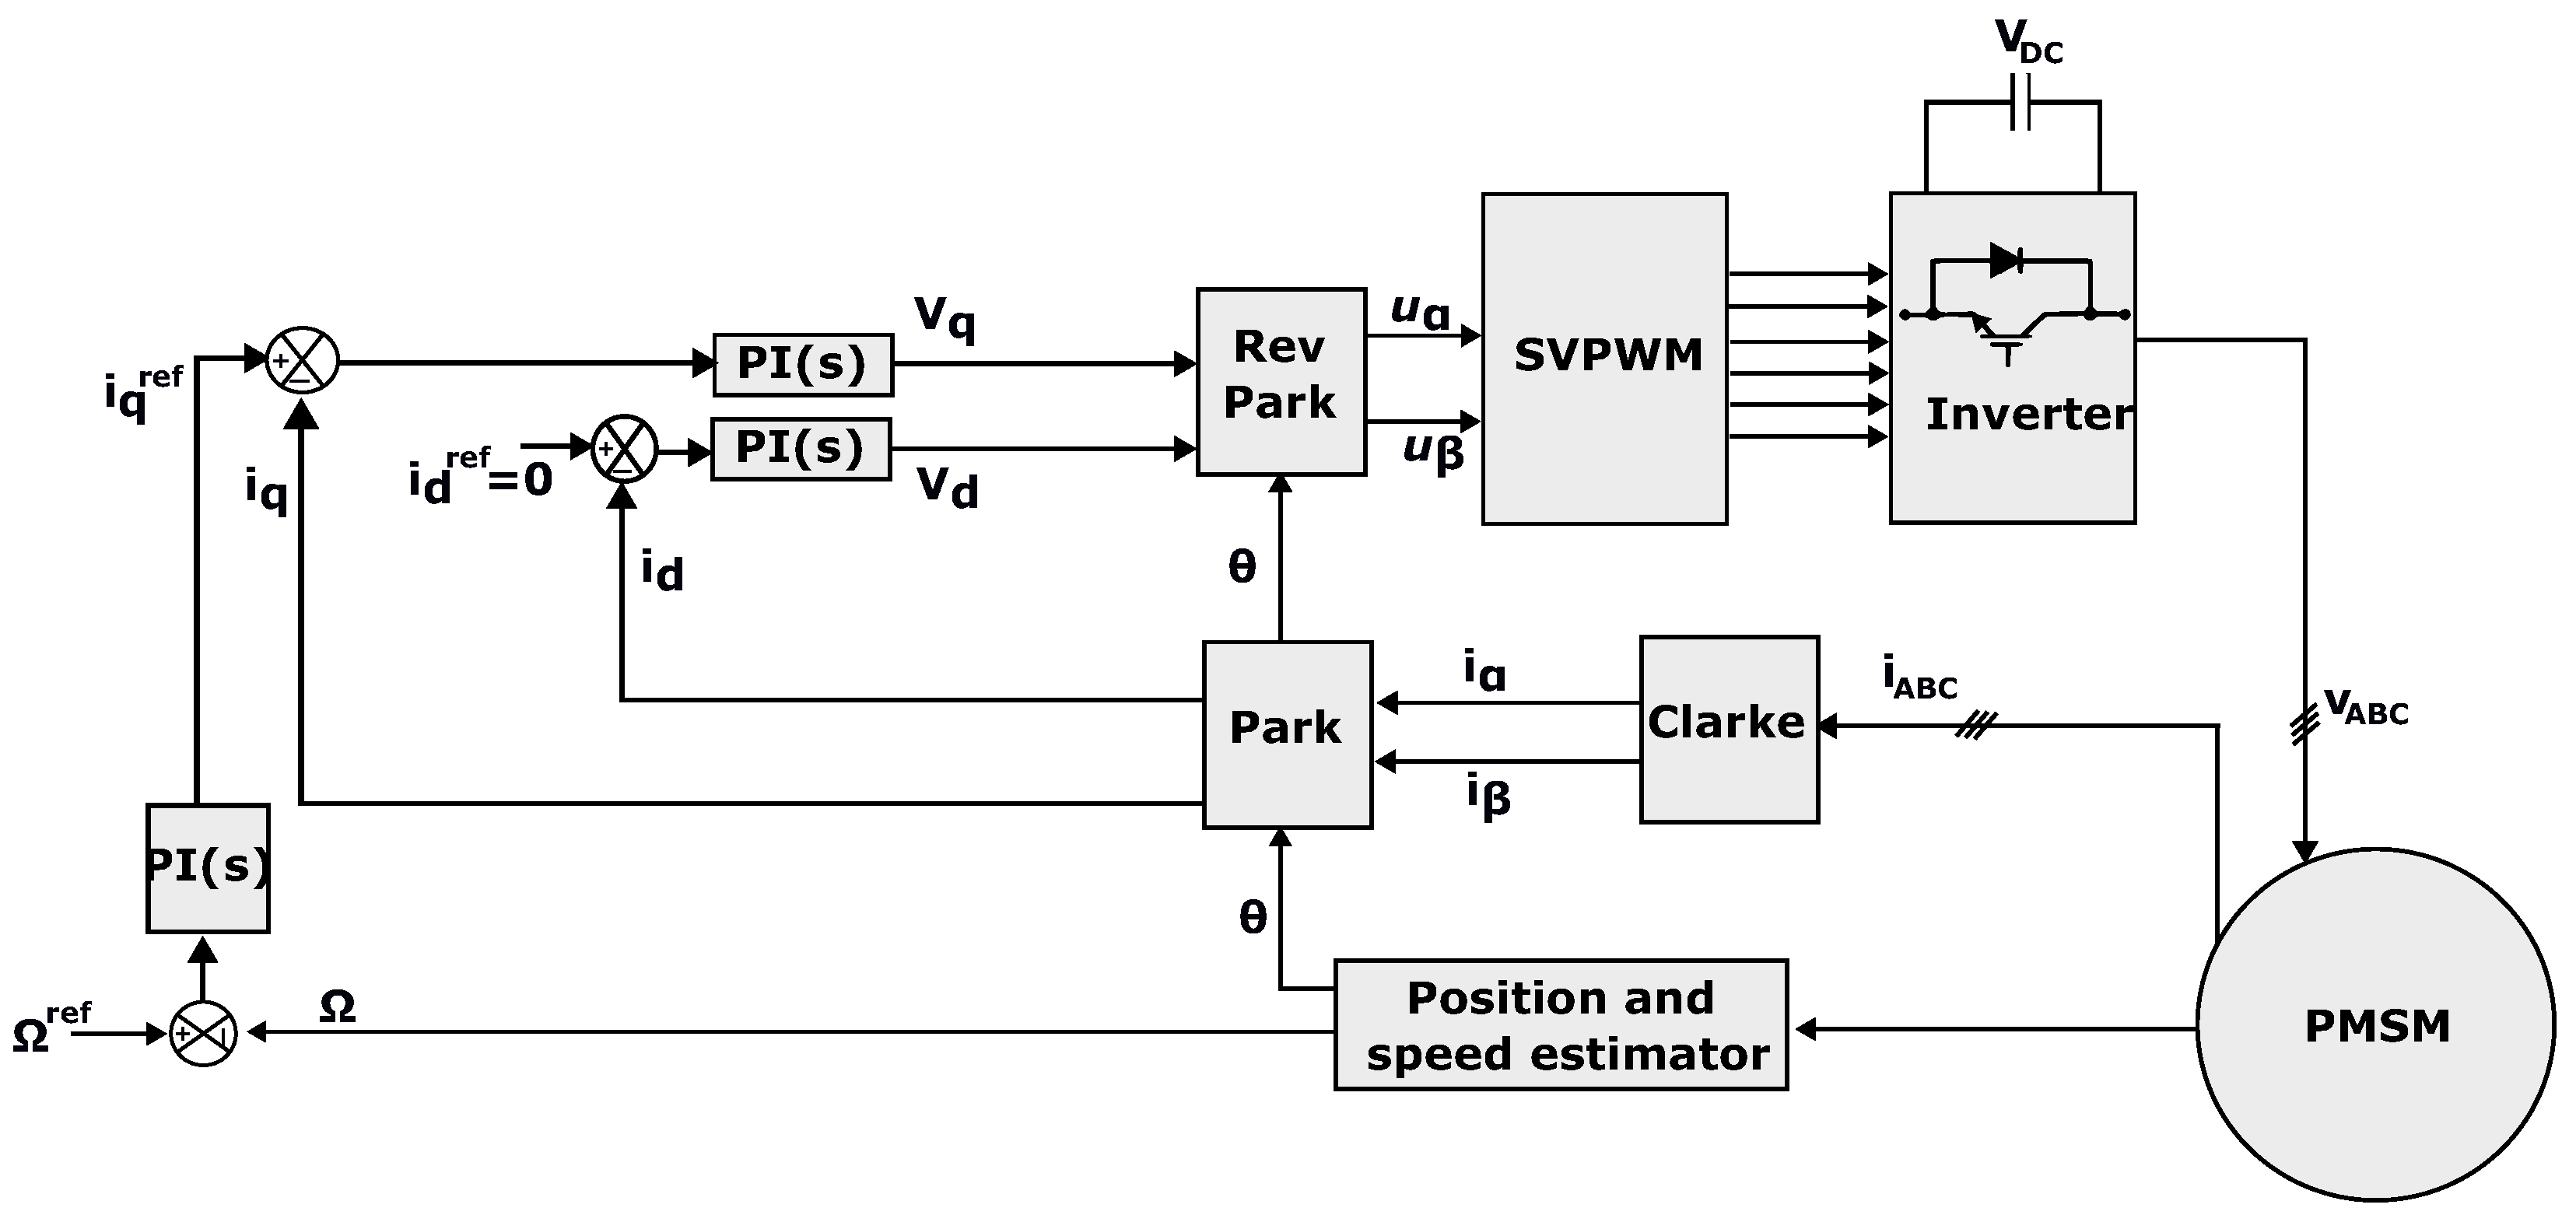
In
Figure 3, the basic idea of the FOC is illustrated schematically to improve the overall understanding of the sequence of transformations, controllers, and the inverter interface.
3.3. VSI and LC Output-Filter Design
The two-level voltage-source inverter is controlled using space-vector pulse-width modulation (SVPWM) with a switching frequency of . A second-order LC low-pass filter is inserted between the inverter and the PMSM terminals to attenuate the high-frequency switching components generated by the inverter.
The selected filter parameters are
For frequency-domain characterization, a damped second-order low-pass representation is adopted. The natural frequency is determined from the selected LC parameters, while an equivalent analytical damping ratio of
is selected to obtain a well-damped response without a pronounced resonance peak. The corresponding transfer function is expressed as
Equation (
20) is an analytical reference representation and should not be interpreted as the physical transfer function of the implemented undamped LC network.
The resonance frequency calculated from the LC parameters is
By comparing Equation (
20) with the standard second-order transfer function
the selected analytical damping ratio can be verified as
The value is used in the analytical second-order representation to obtain a nearly flat low-pass response without a pronounced resonance peak. The first-order term in this transfer function is therefore an analytical damping term and is not derived from an external damping resistor, the PMSM stator resistance, or the converter dynamics. No external damping resistor is included in the implemented LC network. In the complete traction-drive simulation, the PMSM stator impedance is modeled separately and contributes to the overall electrical response. Therefore, should be interpreted as an analytical damping parameter rather than the physical damping ratio of the LC circuit.
At the maximum investigated mechanical speed of
and with
pole pairs, the maximum electrical fundamental frequency is
The selected filter therefore satisfies the frequency-separation condition
which gives numerically
The ratio between the resonance frequency and the maximum electrical fundamental frequency is
whereas the ratio between the switching frequency and the filter resonance frequency is
This frequency separation places the filter resonance well above the maximum useful electrical fundamental frequency and well below the inverter switching frequency. Consequently, the useful motor-voltage fundamental is preserved, while the high-frequency PWM components are strongly attenuated.
The PMSM impedance is retained in the complete closed-loop simulation through and . Thus, the PMSM stator impedance acts as the electrical load at the filter output and influences the motor-terminal voltage and current dynamics. However, it is not used to determine the equivalent damping ratio of the analytical filter model.
Furthermore, the simulated d- and q-axis currents remain bounded and do not exhibit sustained oscillations associated with the filter resonance. This confirms that the selected resonance frequency and equivalent damping do not introduce an observable instability under the investigated operating conditions.
4. Hybrid Energy Storage System
In modern electric vehicles, no single energy storage device can simultaneously satisfy the requirements of high energy capacity, long driving range, and fast power response. Hybrid energy storage systems (HESS) address this limitation by combining lithium-ion batteries and supercapacitors in a complementary way. The battery provides the bulk of the energy needed for propulsion and cruising, while the supercapacitor is responsible for handling short-term power peaks during rapid acceleration or regenerative braking. When properly coordinated through power electronic converters and energy management strategies, this combination allows the supercapacitor to handle short power peaks and therefore reduces high-current stress on the battery.
4.1. Lithium-Ion Batteries in a Hybrid Energy Storage System
In a hybrid energy storage system, the lithium-ion battery forms the backbone of the energy supply. It ensures that the vehicle has sufficient driving range and provides the continuous power required for traction. Supercapacitors then act as a complementary source, managing short-term power fluctuations. The choice of lithium-ion technology is justified by its clear advantages over legacy chemistries such as lead-acid or nickel-based systems: higher energy density, longer cycle life, higher efficiency, and better environmental performance.
4.1.1. Choice of Chemistry and Cell Configuration
Among the many lithium-ion chemistries, Nickel Manganese Cobalt (NMC) and Nickel Cobalt Aluminum (NCA) cells are widely used in passenger EVs because they strike a balance between high energy density and good power capability. On the other hand, Lithium Iron Phosphate (LFP) is selected in applications where safety, thermal stability, and cost are prioritized.
For the present study, a 21700-format cell with a nominal voltage of 3.7 V and a capacity of 4.8 Ah is considered for the sizing of the battery pack. To reach the required pack voltage for the traction inverter, 96 cells are connected in series (Ns = 96), giving a nominal voltage of about 355 V. To increase capacity and reduce current stress, 46 parallel branches (Np = 46) are added, resulting in an effective capacity of about 220.8 Ah. This configuration ensures a good compromise between energy content, current capability, and pack efficiency. Battery Modeling with a Thevenin Equivalent Model. To simulate the dynamic behavior of the battery in the vehicle powertrain, the Thevenin equivalent model is used. This model captures both steady-state and transient voltage responses with relatively low computational cost, which makes it suitable for real-time simulations. It consists of three main components:
An open-circuit voltage source , which depends on the state of charge (SOC),
A series resistance R0, modeling the instantaneous ohmic drop,
A parallel RC branch (Rp,Cp), accounting for polarization and relaxation effects.
The terminal voltage can be written as:
and the RC voltage dynamics are given by:
For higher accuracy, additional RC branches can be introduced to capture slow diffusion processes inside the electrodes.
4.1.2. Numerical Parameters of the Battery Pack
A first-order Thevenin model is used to represent the lithium-ion battery. The model parameters are set to
m
,
m
, and
F. These values were selected based on the range of parameters reported in previous studies using similar battery equivalent circuit models [
40,
41,
42]. Since these parameters depend on the battery chemistry, SOC, temperature, and operating conditions, they are considered nominal values in the present model rather than experimentally identified parameters of a specific commercial cell.
Table 4 summarizes the main electrical parameters of the representative 21700-format lithium-ion cell considered in the simulation.
The open-circuit voltage is approximated as a linear function of the state of charge:
This relation provides a practical trade-off between model simplicity and accuracy, making it well-suited for energy management strategies and control-oriented simulation. At the pack level, series and parallel connections are applied to reach the target nominal voltage and capacity for the electric vehicle drivetrain, as detailed in the system configuration.
4.2. Supercapacitor Modeling and Cell Selection
Supercapacitors (SCs), also known as electric double-layer capacitors (EDLCs), are increasingly used in hybrid energy storage systems to complement lithium-ion batteries. Unlike batteries, which are optimized for energy density, supercapacitors provide very high power density (up to 10 kW/kg) and can endure hundreds of thousands of charge–discharge cycles without significant degradation. This makes them ideal for handling rapid load transients such as acceleration peaks and regenerative braking events.
4.2.1. Equivalent Circuit Modeling
The electrical behavior of a supercapacitor can be accurately captured using a simple RC network composed of:
A capacitance Csc, which determines the energy storage capability,
An equivalent series resistance (ESR) Rsc, which represents internal losses and voltage drops,
Optionally, a leakage resistance to represent self-discharge over longer timescales.
The terminal voltage dynamics are described as:
The stored energy is given by:
This formulation is computationally efficient and sufficient for integration into EV-level energy management simulations.
4.2.2. Cell Selection and Pack Configuration
Commercial electric double-layer capacitor (EDLC) cells typically have a rated voltage of 2.7–3.0 V and capacitances on the order of a few thousand farads (e.g., 3000 F). For example, considering cells rated at 2.7 V and 3000 F, with an equivalent series resistance (ESR) Rsc ≈ 0.3 m, a series connection of about 110 cells is required to reach a nominal voltage close to 300 V. Parallel strings can then be added to increase the total capacitance and reduce the equivalent ESR.
This modular assembly ensures that the SC bank can supply high peak currents during acceleration and effectively absorb regenerative energy during braking, reducing stress on the lithium-ion battery. The main parameters of the selected EDLC cell used in this work are summarized in
Table 5.
4.2.3. HESS Pack Sizing and Operating Limits
The cell-level battery and supercapacitor parameters were presented in the previous subsections. The following analysis relates the selected series–parallel configurations to the voltage, current, power, and energy requirements of the traction system.
The battery pack contains
cells in series and
parallel branches. Considering a nominal cell voltage of
and a cell capacity of
, the main pack characteristics are
The battery current is limited to
. This limit corresponds to a cell current of approximately
in each parallel branch and to a discharge rate of approximately
. The corresponding nominal battery power is
Since the nominal battery voltage is lower than the
DC-link reference, the bidirectional DC/DC converter provides the required voltage adaptation. Under ideal nominal conditions, the corresponding boost duty ratio is
The cell-level equivalent-circuit parameters are converted to pack-level values according to the series–parallel configuration:
These scaling relations follow from the series-parallel equivalence of identical cell equivalent circuits, assuming uniform current sharing among the parallel branches. Their consistency is also verified by the preservation of the polarization-branch time constant:
The parameters , , and are kept constant in the present battery model. Their variation with SOC, temperature, C-rate, and aging is not considered. The model is therefore intended to reproduce the main electrical response of the battery required for the HESS analysis rather than the detailed behavior of a specific commercial cell. Battery SOC is calculated by coulomb counting during traction and regenerative operation.
The supercapacitor bank consists of one string of
series-connected cells. Each cell is rated at
and
, with an ESR of
. The resulting bank characteristics are
The maximum energy stored in the supercapacitor bank is
The supercapacitor SOC is defined from the stored energy. Since the stored energy depends on the square of the voltage,
is calculated as
For the selected SC bank, a SOC of 70% corresponds to approximately 248.5 V, while the 20% lower SOC limit corresponds to approximately 132.8 V. The initial
is set to 70%, which is also used as the recharge threshold by the EMS.
Starting from the initial 70% SOC, the energy available before reaching the 20% lower discharge limit is
This energy is used for short-duration power support, while the battery remains the main source of traction energy. For a transient power
lasting
, the required energy is
The corresponding SC current is
The selected bank must satisfy the following energy condition:
In addition, the SC current must remain within the rated limits of the bidirectional converter.
The battery supplies the main traction energy, while the supercapacitor supports short-duration power peaks. Its charging and discharging operation is controlled according to the traction demand and the SOC limits defined above.
4.2.4. Bidirectional DC/DC Converter Model and Control
The battery and supercapacitor supply the DC bus through two bidirectional boost converters. For each converter,
denotes the storage-source voltage, while
is the converter output voltage applied to the DC bus and the traction inverter. Since the DC-link capacitor is directly connected across the converter output, its voltage satisfies
When the main switch is turned ON, the inductor is charged by the input source, and its voltage is
When the switch is turned OFF, the inductor transfers energy to the DC-link capacitor and the DC bus:
By averaging the two switching states over one switching period, the inductor current dynamics is expressed as
where
d is the converter duty ratio.
The DC-link capacitor voltage is governed by
where
is the current demanded by the traction inverter.
Under ideal steady-state boost operation, the average inductor voltage is zero.
Therefore, the input and output voltages are related by:
The voltage error is defined as
and is processed by a PI controller:
The PI-controller output determines the PWM duty ratio applied to the complementary converter switches. Both converters operate at , with an inductance of and a DC-link capacitance of .
4.3. Energy Management and Dual Boost Converter Strategy
To ensure effective power sharing between the battery and the supercapacitor in the HESS, a dual boost-converter architecture is implemented. Each source is connected to the common DC bus through an independent bidirectional boost stage, allowing both energy flows to be controlled separately. This independent interfacing also accommodates the different voltage levels and operating constraints of the two storage sources. However, the use of two converter stages requires additional power-electronic components, resulting in increased cost, mass, volume, and control complexity compared with a simpler storage interface.
The main objectives of the energy management system (EMS) are to:
Maintain the DC-bus voltage around its reference value.
Protect the battery by limiting its current to a maximum of 200 A.
Use the fast dynamics of the supercapacitor for peak power support.
The battery supplies the demanded current under normal operating conditions:
When the traction current demand exceeds the safe battery current limit,
the battery current is limited to
while the supercapacitor supplies the remaining current:
In the proposed strategy, the maximum battery discharge current is fixed at
and supercapacitor discharge is allowed only when
During low-current operation, when the supercapacitor state of charge is below its recharge threshold,
Each of the three EMS thresholds has a specific role. As determined in the HESS sizing analysis, the battery pack has parallel branches. Hence, the 200 A battery-current limit corresponds to about 4.35 A per parallel branch, or approximately 0.91 C for the considered 4.8 Ah cell. The 20% SOC limit prevents further supercapacitor discharge when the available energy becomes low, thereby maintaining a minimum energy reserve. The 70% recharge threshold is used to restore sufficient energy for subsequent high-power transients without continuously maintaining the supercapacitor at its maximum SOC. This also leaves 30 percentage points of SOC headroom for further energy absorption during low-demand or regenerative conditions. Therefore, the selected SOC values are used as practical supervisory margins between energy availability and charging headroom rather than as optimized operating points.
The available battery-current margin is used to recharge the supercapacitor. The supercapacitor charging-current reference is defined as
The corresponding battery-current reference becomes
When
no traction current is required. If
, the battery may recharge the supercapacitor using the available current margin. Otherwise, both current references are set to zero:
During regenerative braking,
the recovered current is directed to the supercapacitor and the battery according to their charging-current and state-of-charge limits. The current balance is expressed as
Under the investigated operating profile, the regenerative current mainly reduces the battery power contribution, while the supercapacitor can absorb transient energy when its SOC allows. The battery does not enter a sustained charging condition during the investigated regenerative interval.
The EMS enforces the following state-of-charge constraints:
According to the energy-based SOC definition given in
Section 4.2.3, the 20% lower SOC limit corresponds to a supercapacitor voltage of approximately 132.8 V.
The maximum battery discharge-current reference is limited to
whereas the supercapacitor-current reference satisfies
The powers exchanged by the two storage sources are calculated as
Because the battery and supercapacitor are interfaced through separate bidirectional converters, each source operates at its own terminal voltage. Each converter adapts the corresponding source voltage to the common DC-bus voltage through its duty ratio, allowing the two sources to contribute independently to the DC-bus power despite their different voltage levels. Accordingly, the power balance is enforced through the battery and supercapacitor current references defined above.
These powers are limited by the rated power capabilities of the battery and supercapacitor bidirectional converters.
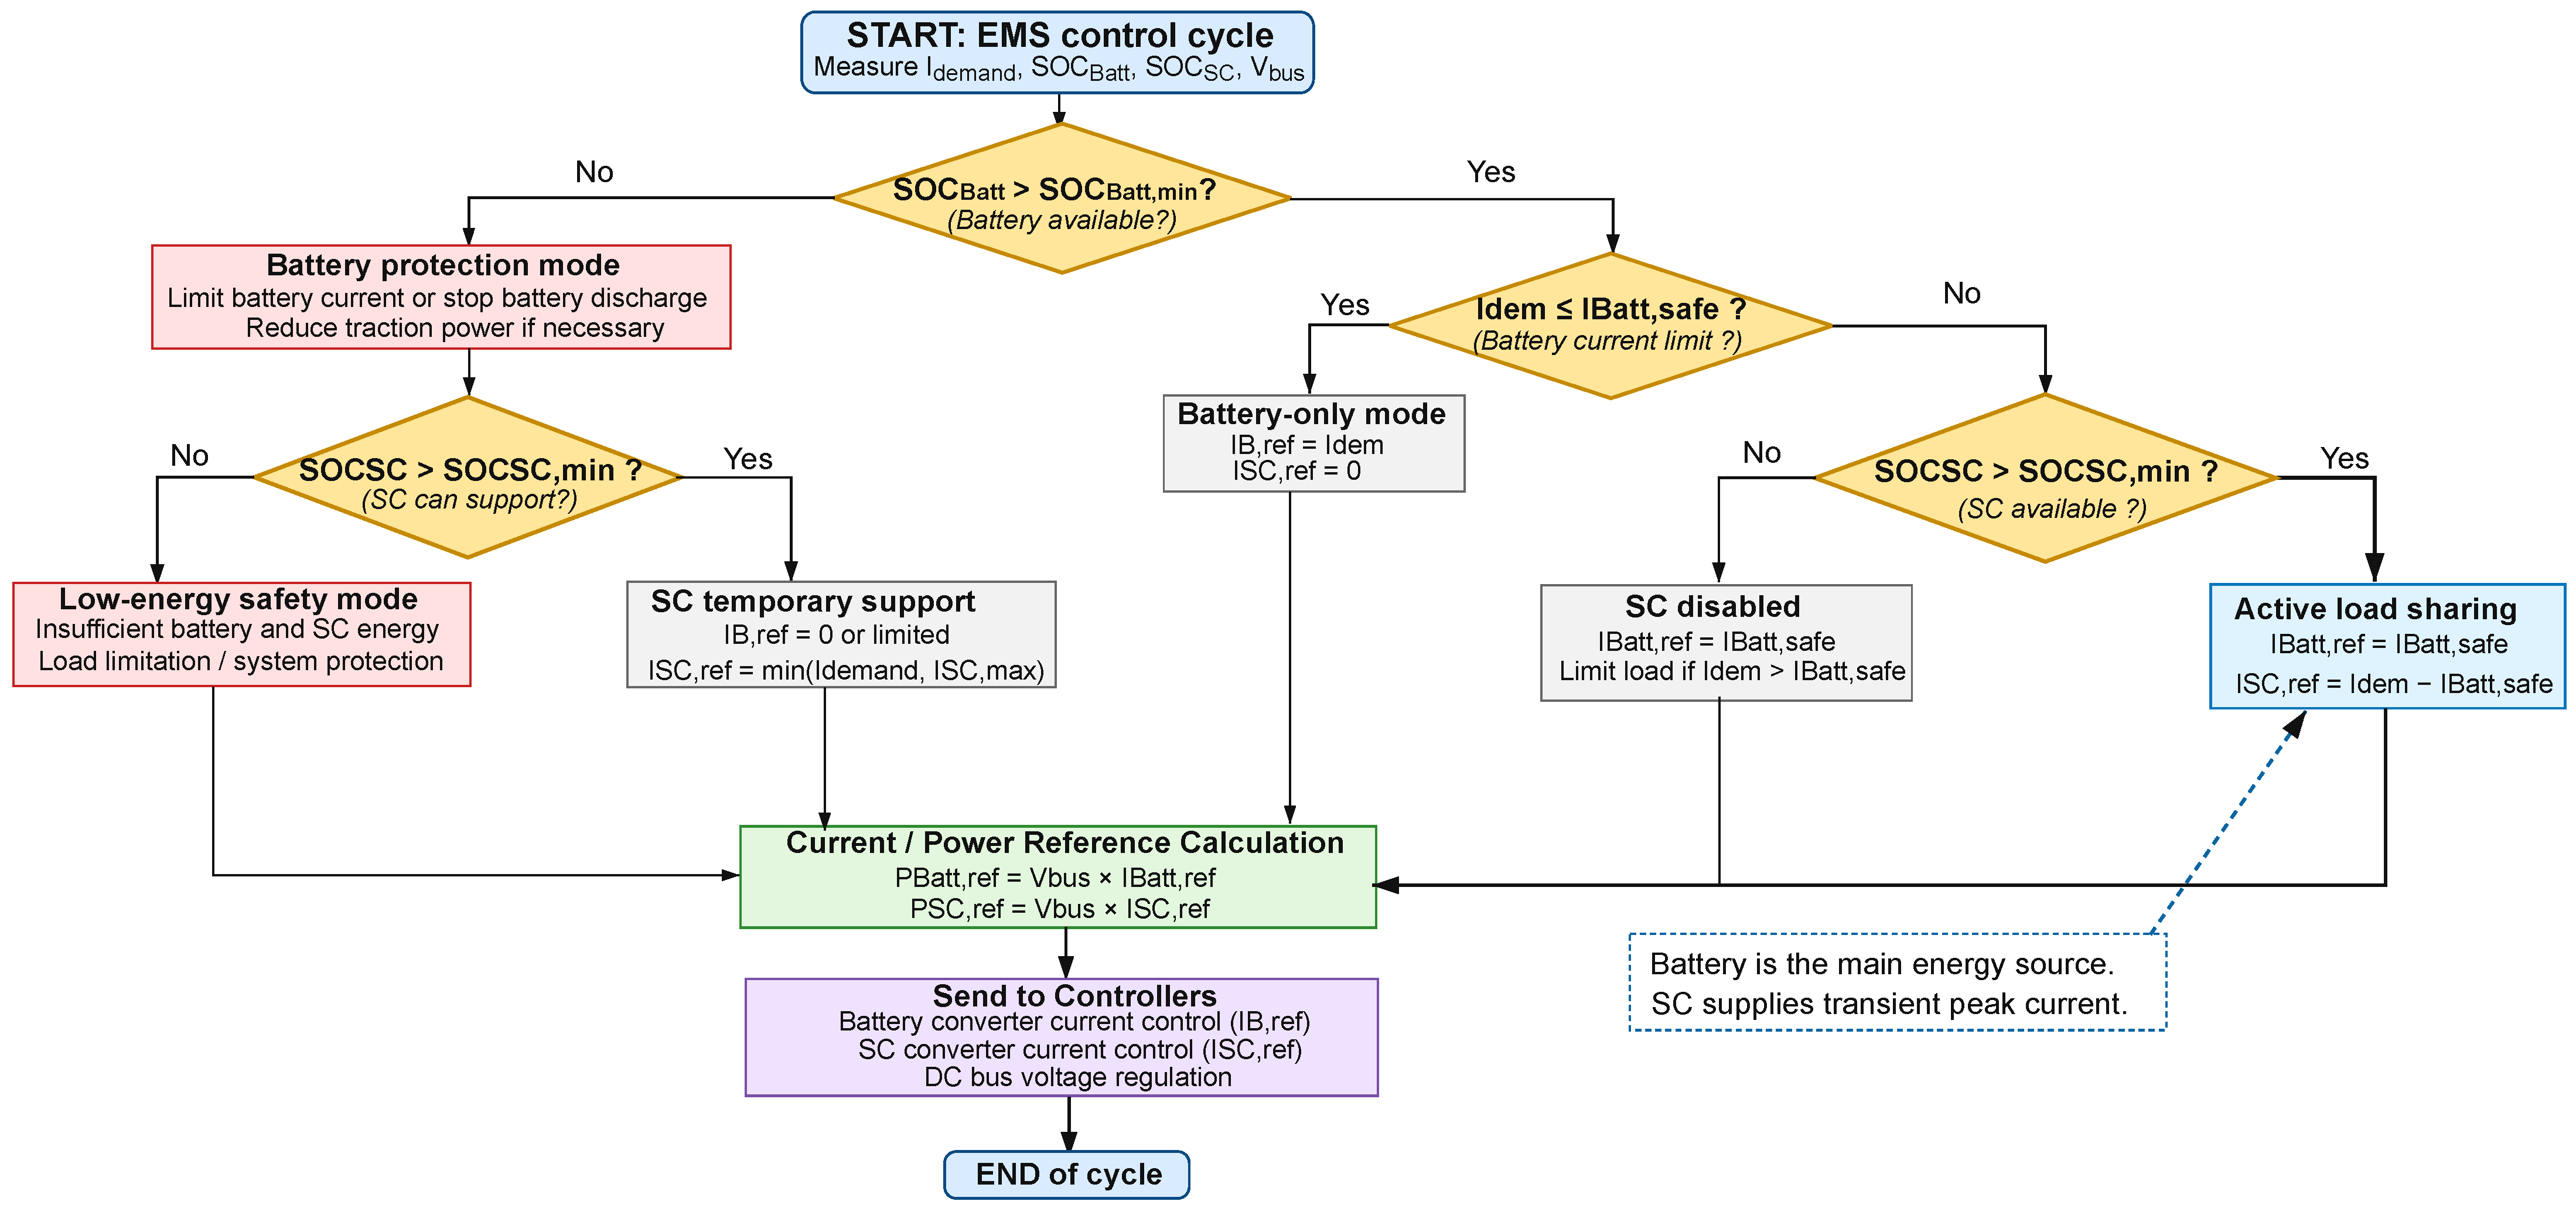
Figure 4 summarizes the operating modes and protection logic of the proposed rule-based EMS.
4.4. Model and Simulation Parameters
For reproducibility, the main PMSM, LC-filter, and simulation parameters used in the proposed model are summarized in
Table 6. The PMSM parameter set is based on the representative EV traction PMSM model reported in [
43]. The selected reference model corresponds to a surface-mounted PMSM developed for electric-vehicle traction applications and provides the electrical and mechanical characteristics required for the present simulation study.
5. Simulation and Results
This section presents the dynamic behavior of the PMSM drive under FOC, together with the response of the hybrid energy storage system and the inverter output filtering stage. The analysis considers the speed response, currents, resisting torque, battery and supercapacitor SOC, and the filtered three-phase voltages.
All these results are obtained from the same 30 s transient operating profile. During this single simulation, the speed reference and resisting torque are varied successively to reproduce different driving conditions. The results therefore represent one continuous operating scenario rather than separate independent test cases. This profile is intended as a transient stress-test scenario and does not represent a standardized driving cycle such as WLTP or UDDS. The 30 s duration is sufficient for evaluating the short-term dynamic behavior of the EMS and HESS, but it is not intended to assess long-term battery SOC evolution or vehicle range.
5.1. Speed Control Performance
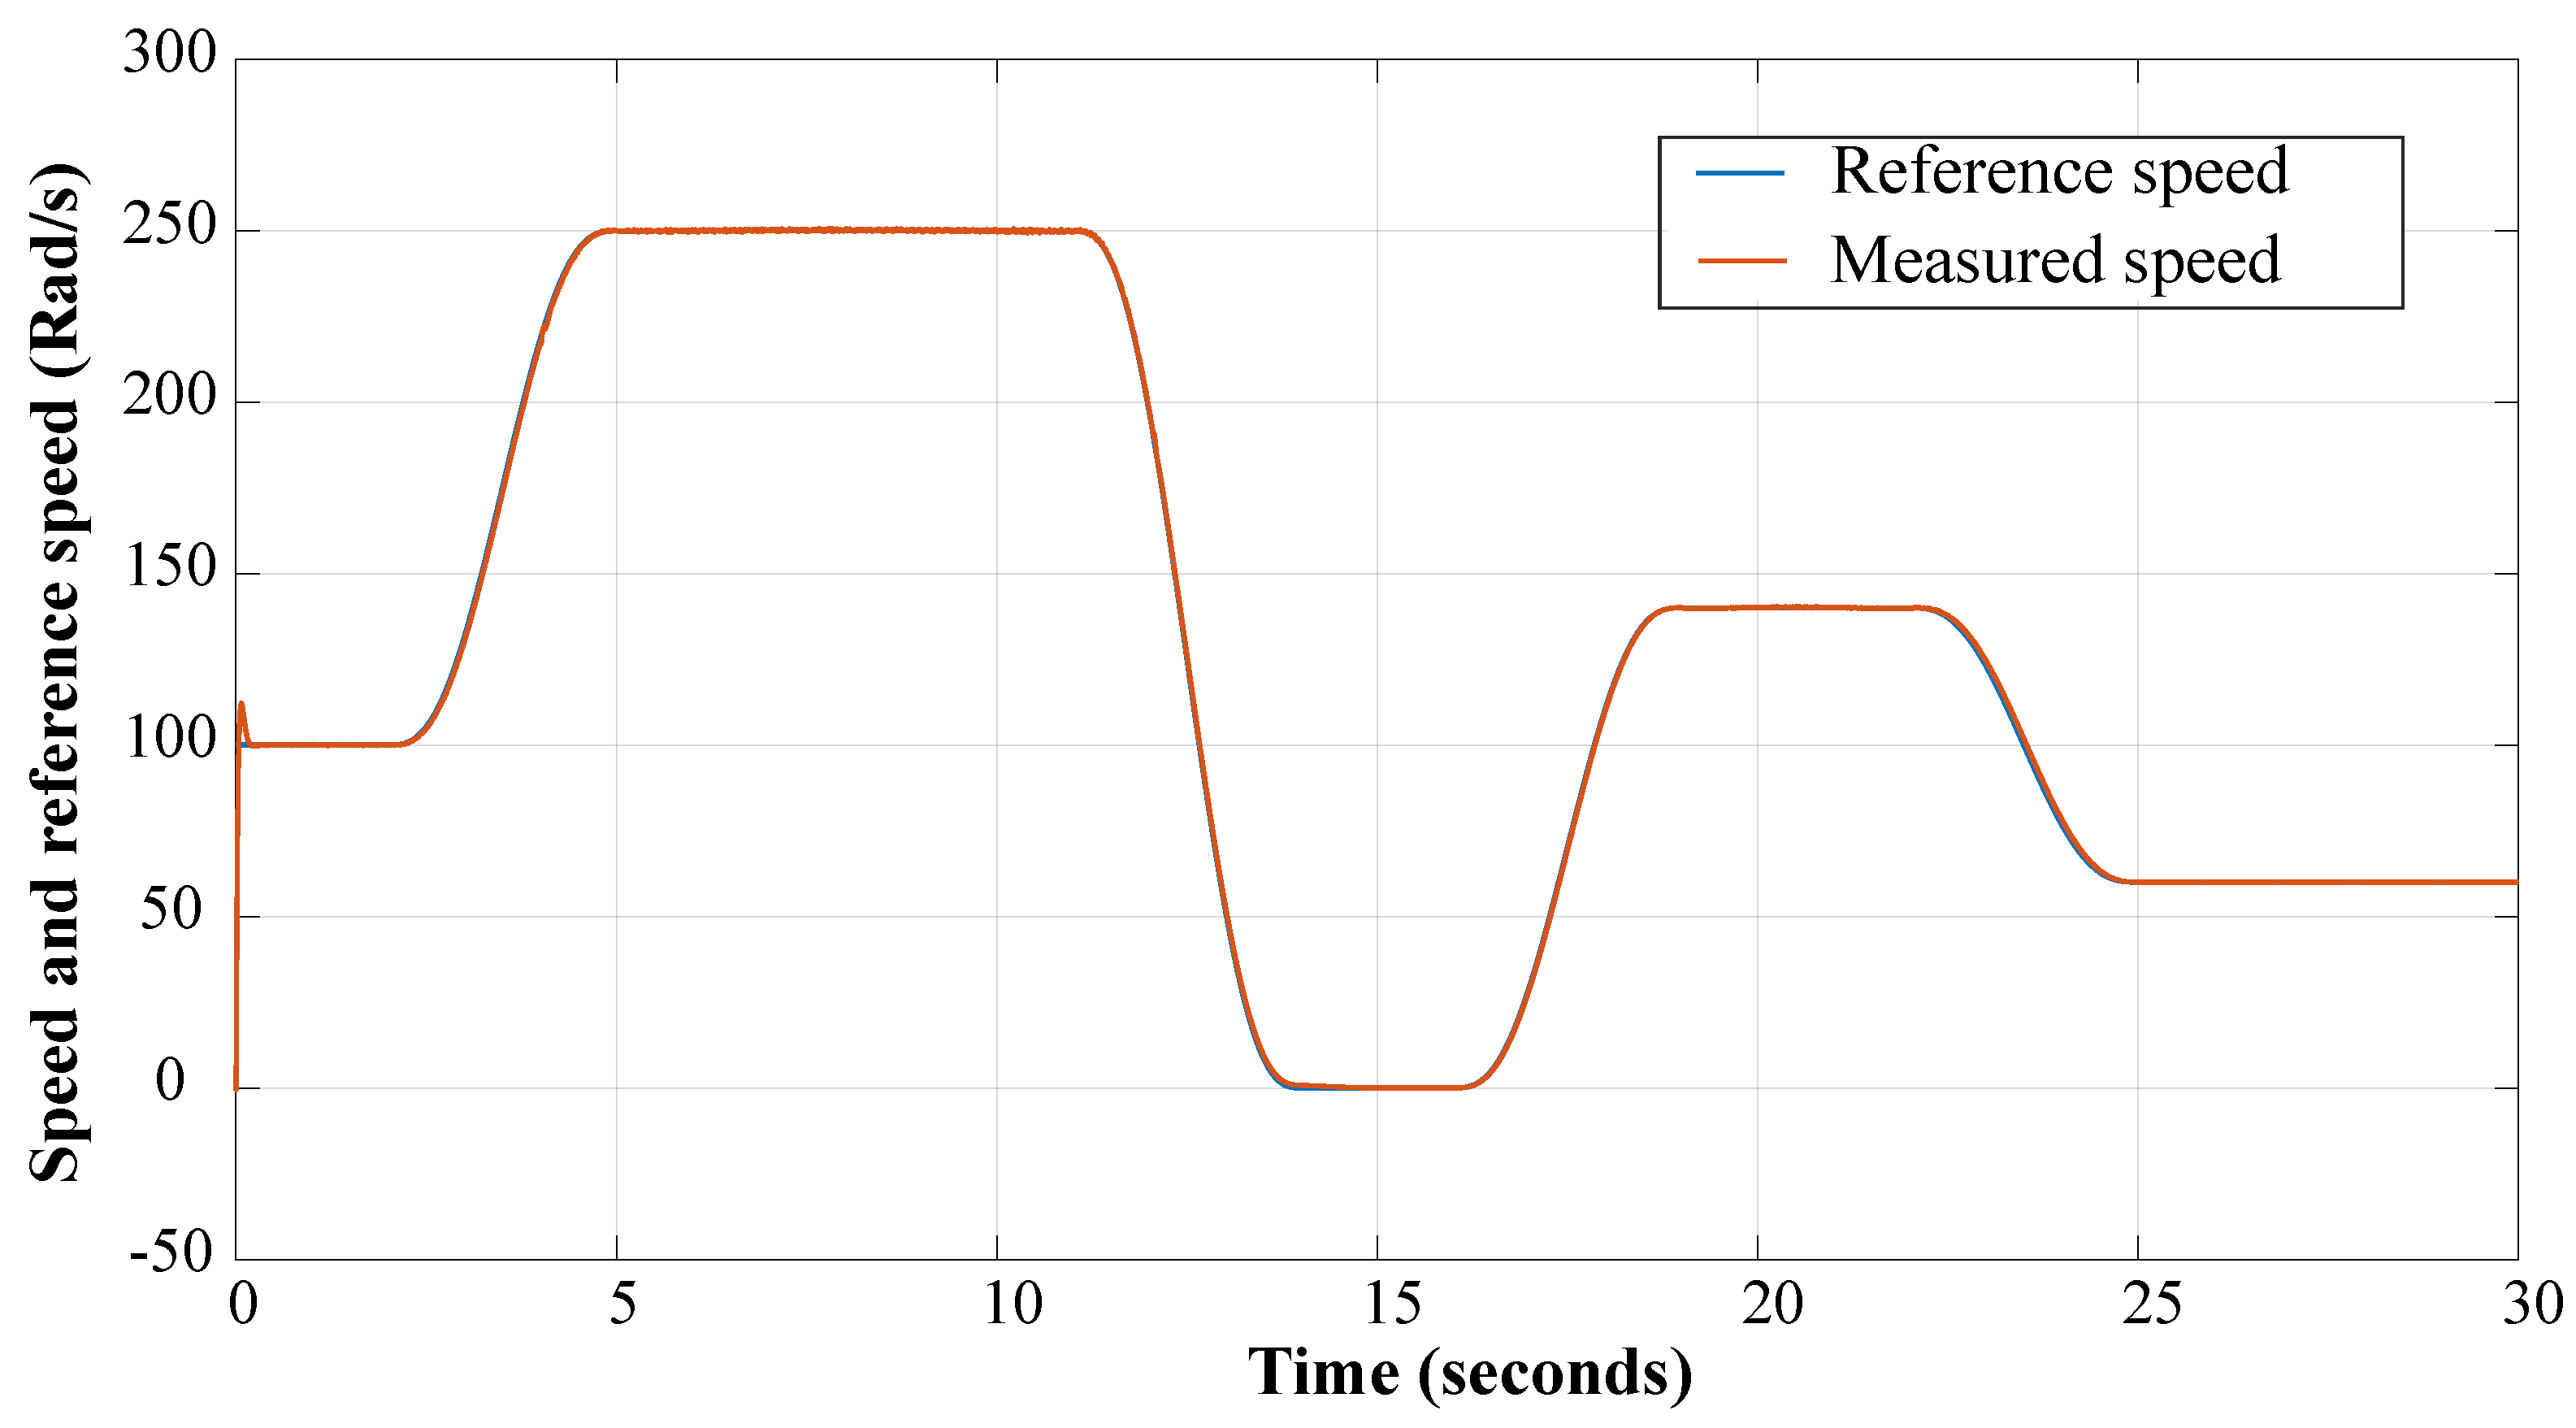
The reference and measured speeds are shown in
Figure 5. The measured speed closely follows the reference speed throughout the entire operating cycle, indicating tight outer-loop regulation and a stable cascade control structure. When the motor rapidly accelerates from rest towards the initial reference speed of 100 rad/s, an overshoot of 11.95% is noted at startup. This transient is frequently observed in the first acceleration phase when a relatively high torque is required to overcome the inertia of the motor and the load. The response at the next operating points is further damped with an overshoot of 0.4667% at 250 rad/s.
The reference is then reached rapidly with no overshoot, providing a well-damped response. During the acceleration phase, the speed follows the reference with a small delay and a smooth rise. At steady state, the speed exhibits stable behavior with no oscillations, while the torque remains stable and no saturation is observed in the inner loops. When the reference decelerates, speed falls and reaches the target without hunting. After the stopping interval, the drive responds correctly to the new acceleration command. Overall, the controller maintains close speed tracking during acceleration, deceleration, stopping, restart, and various applied loads.
5.2. Resisting Torque Profile and Disturbance Rejection
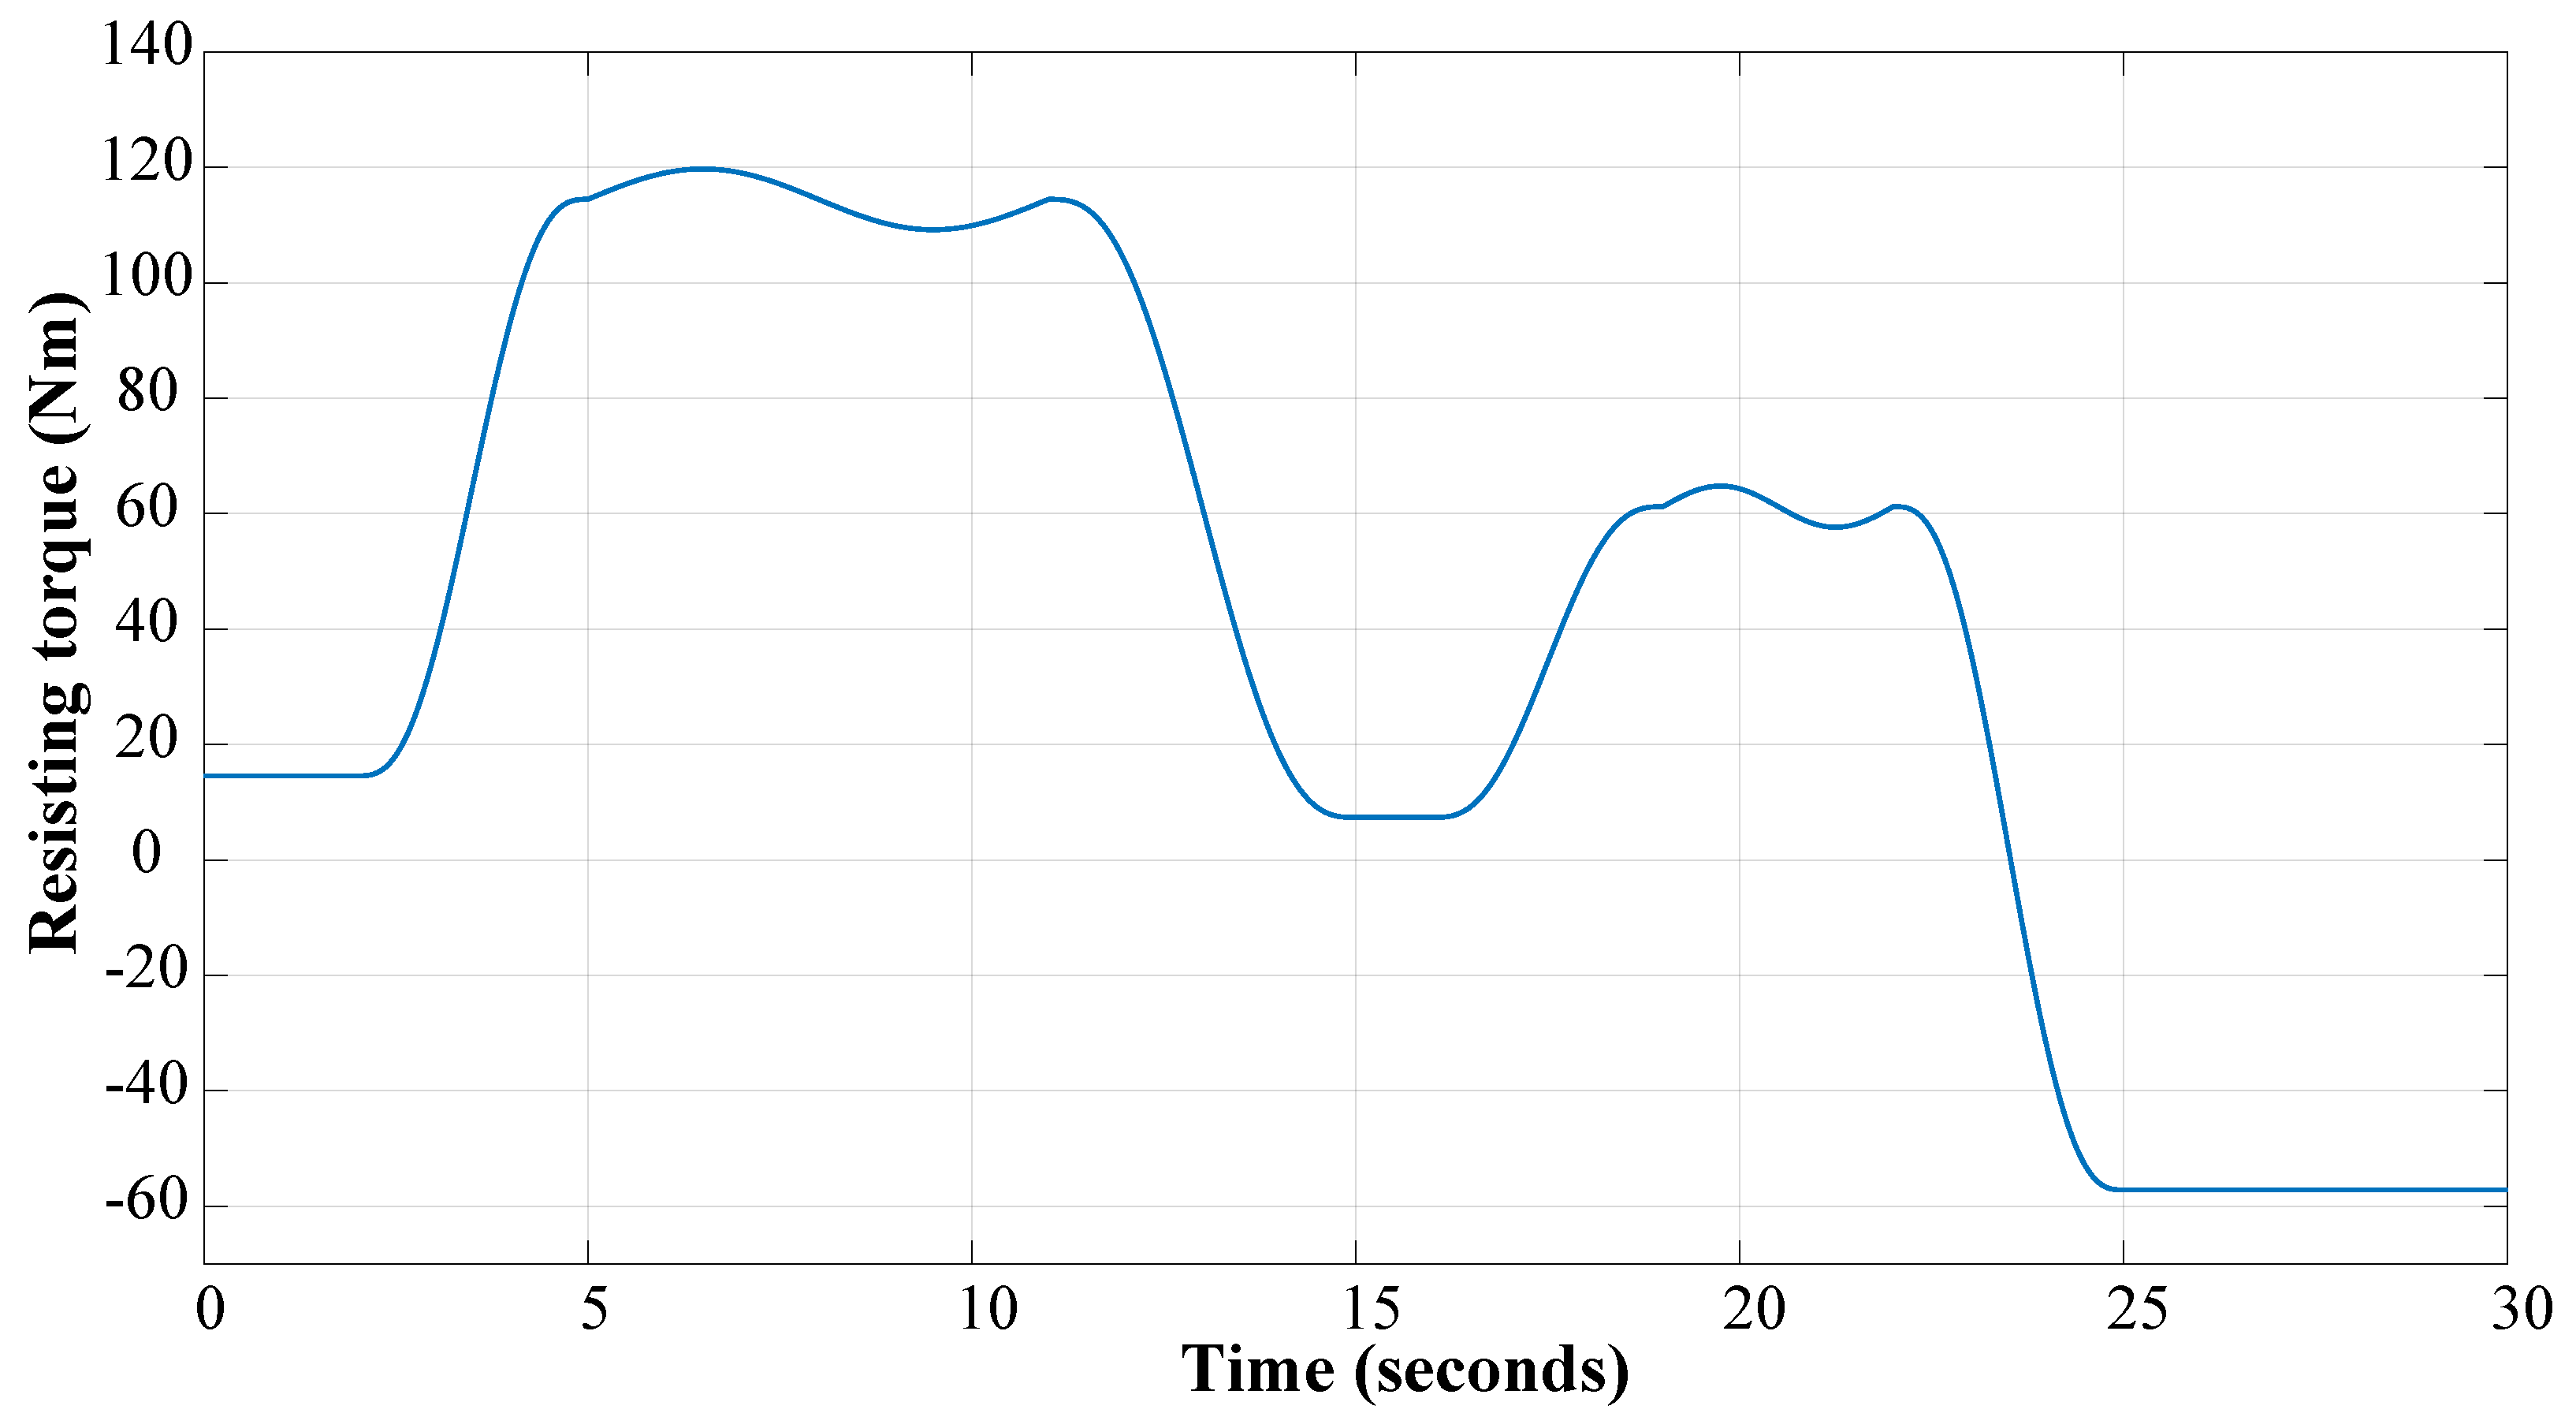
Figure 6 shows the resisting-torque profile associated with the different driving conditions. The resisting torque is not imposed as an independent fixed external input. It is generated from the longitudinal vehicle dynamics according to the instantaneous aerodynamic, rolling-resistance, road-grade, and inertial forces. The load profile consists of various distinct operating regions: at the start, the torque corresponds to driving on a flat road and limited external perturbation. During the acceleration intervals, the load becomes a strong resisting load due to a steep road slope and additional aerodynamic effects such as wind variations in front of the vehicle. The final stage corresponds to a reduction in the road load and can be interpreted as a downhill segment, where the gravitational force assists the vehicle motion and therefore reduces the resisting torque. For a sufficiently steep downhill condition, the resisting torque may become negative, allowing regenerative operation. In principle, if the generated current exceeds the current consumed by the auxiliary systems and other vehicle components, the surplus energy can be directed to the storage system according to the EMS charging constraints. Under the investigated operating conditions, however, the final negative-torque phase reduces the battery contribution without producing a net increase in battery SOC. Despite these load variations, the measured speed continues to follow the time-varying reference closely, indicating good disturbance rejection against changes in the resisting torque. If the required resisting torque exceeds the available electromagnetic torque of the motor, the commanded speed can no longer be maintained and the motor speed will decrease until a new torque balance is reached. This overload condition is not reached in the investigated operating profile.
5.3. Id- iq Currents Under FOC Algorithm
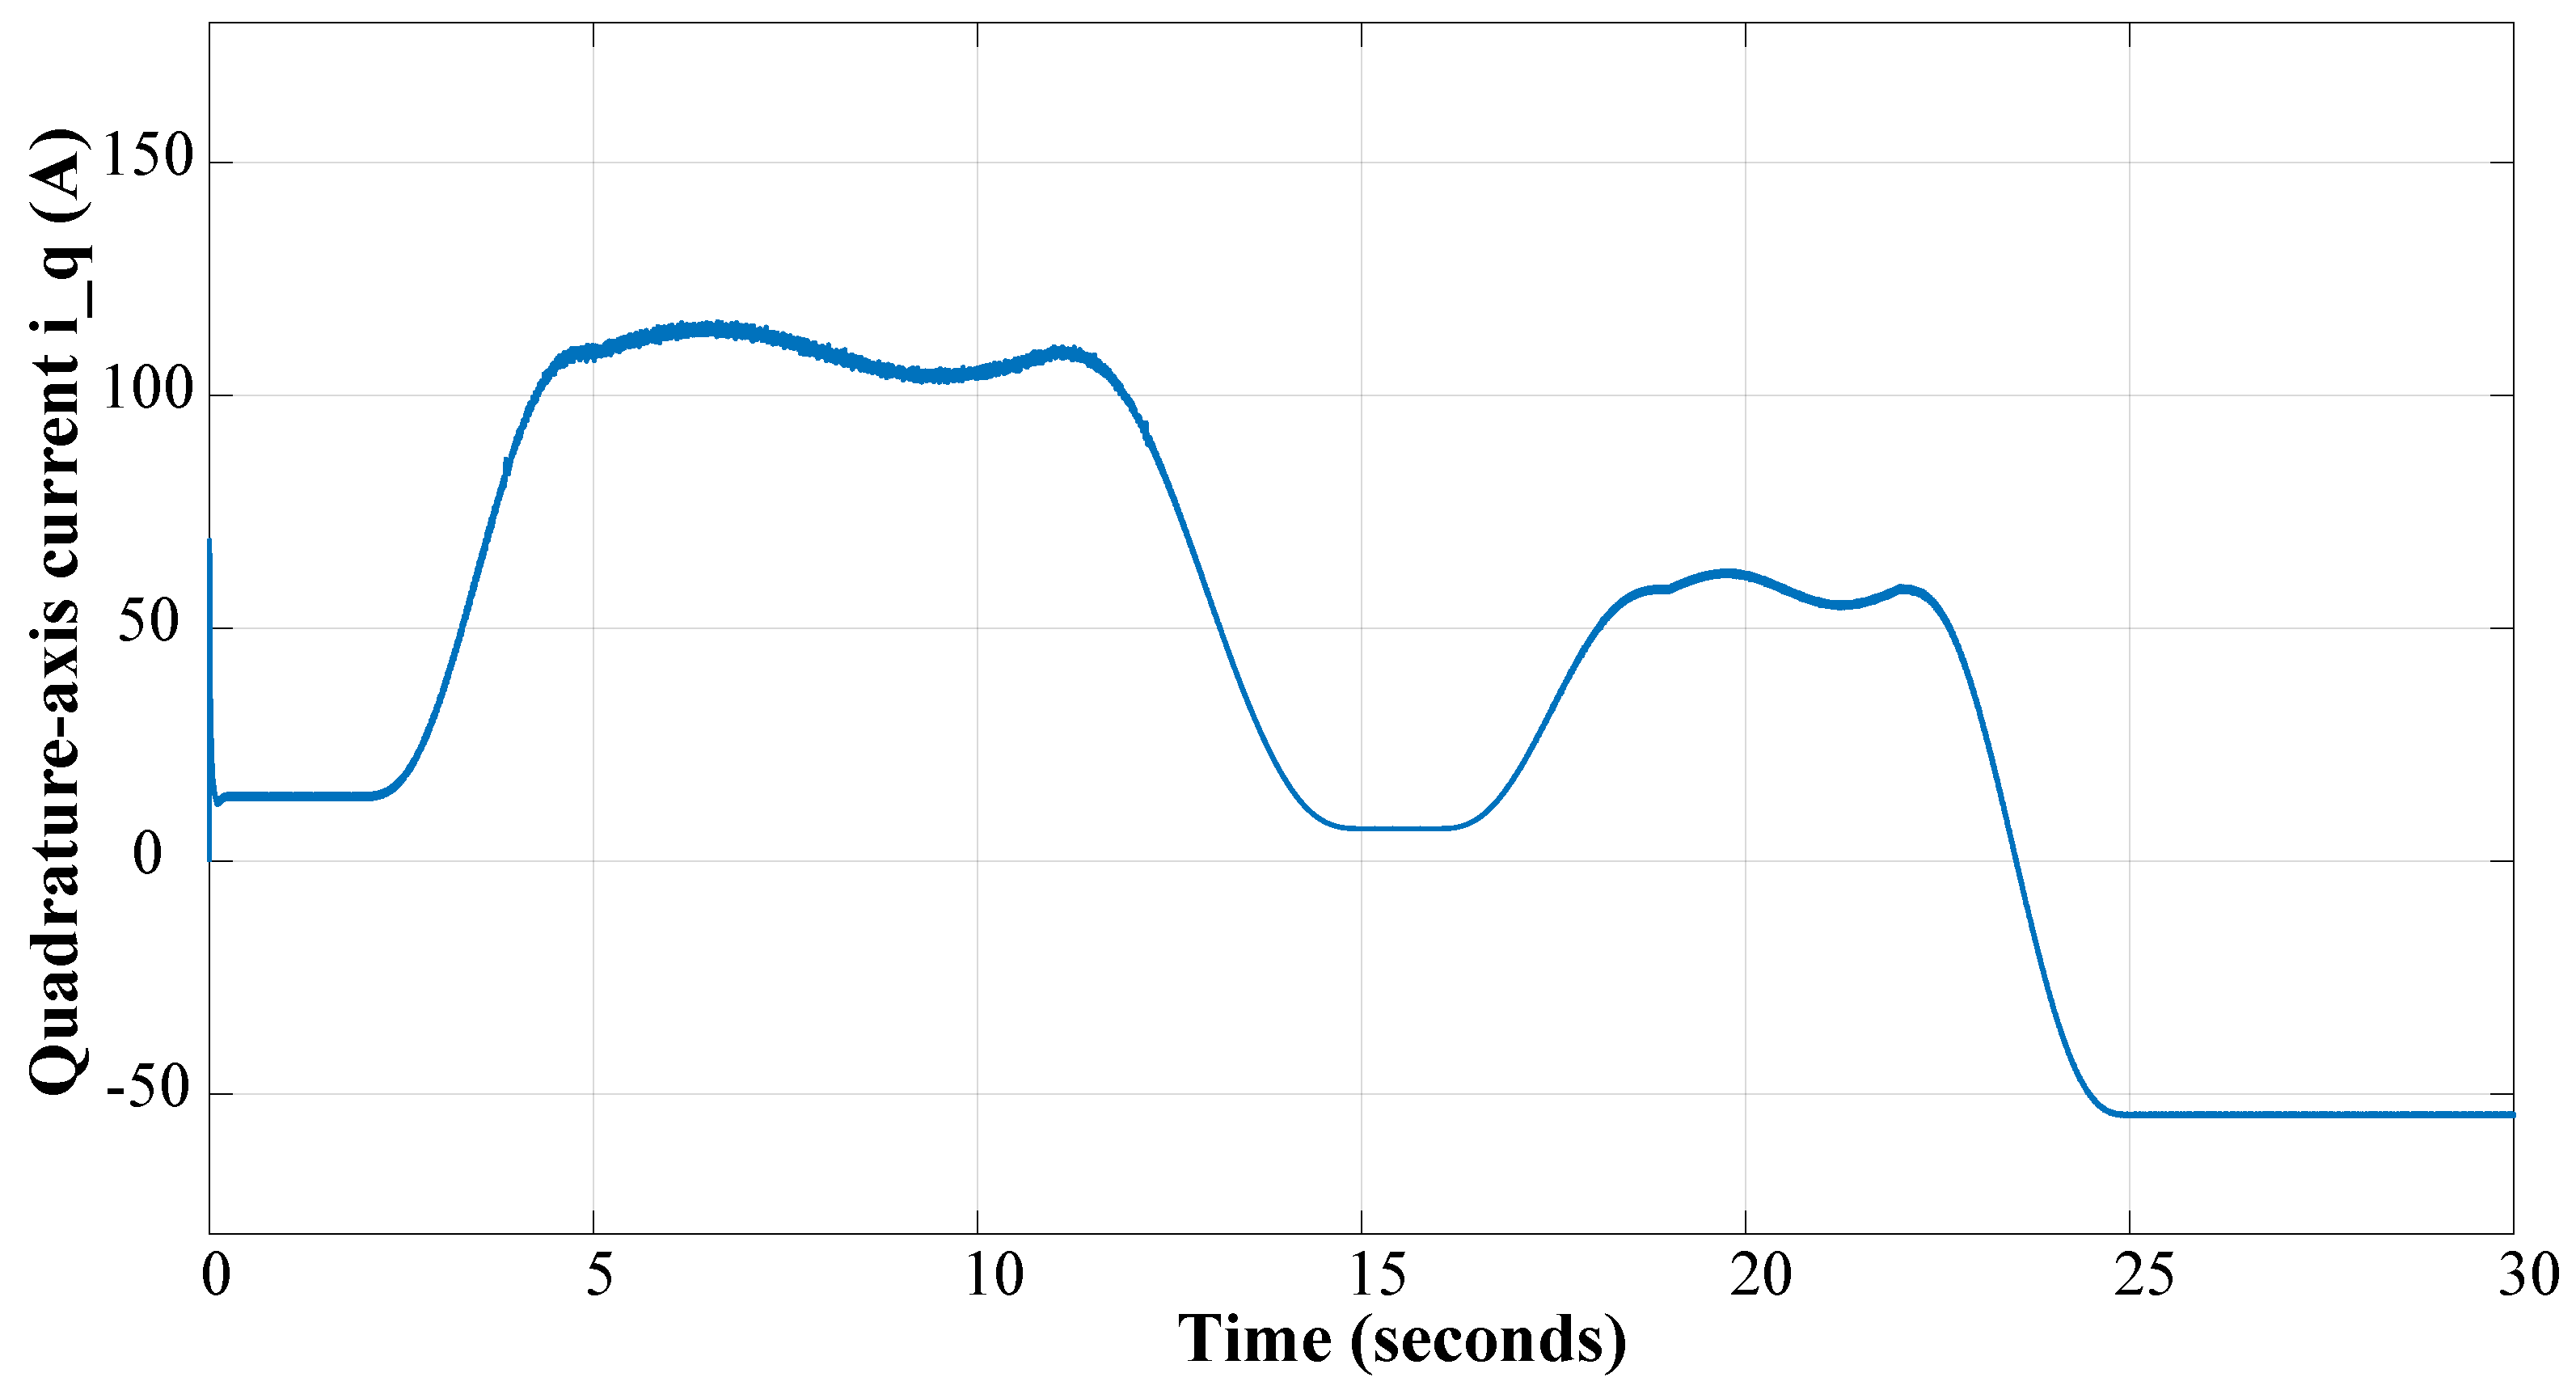
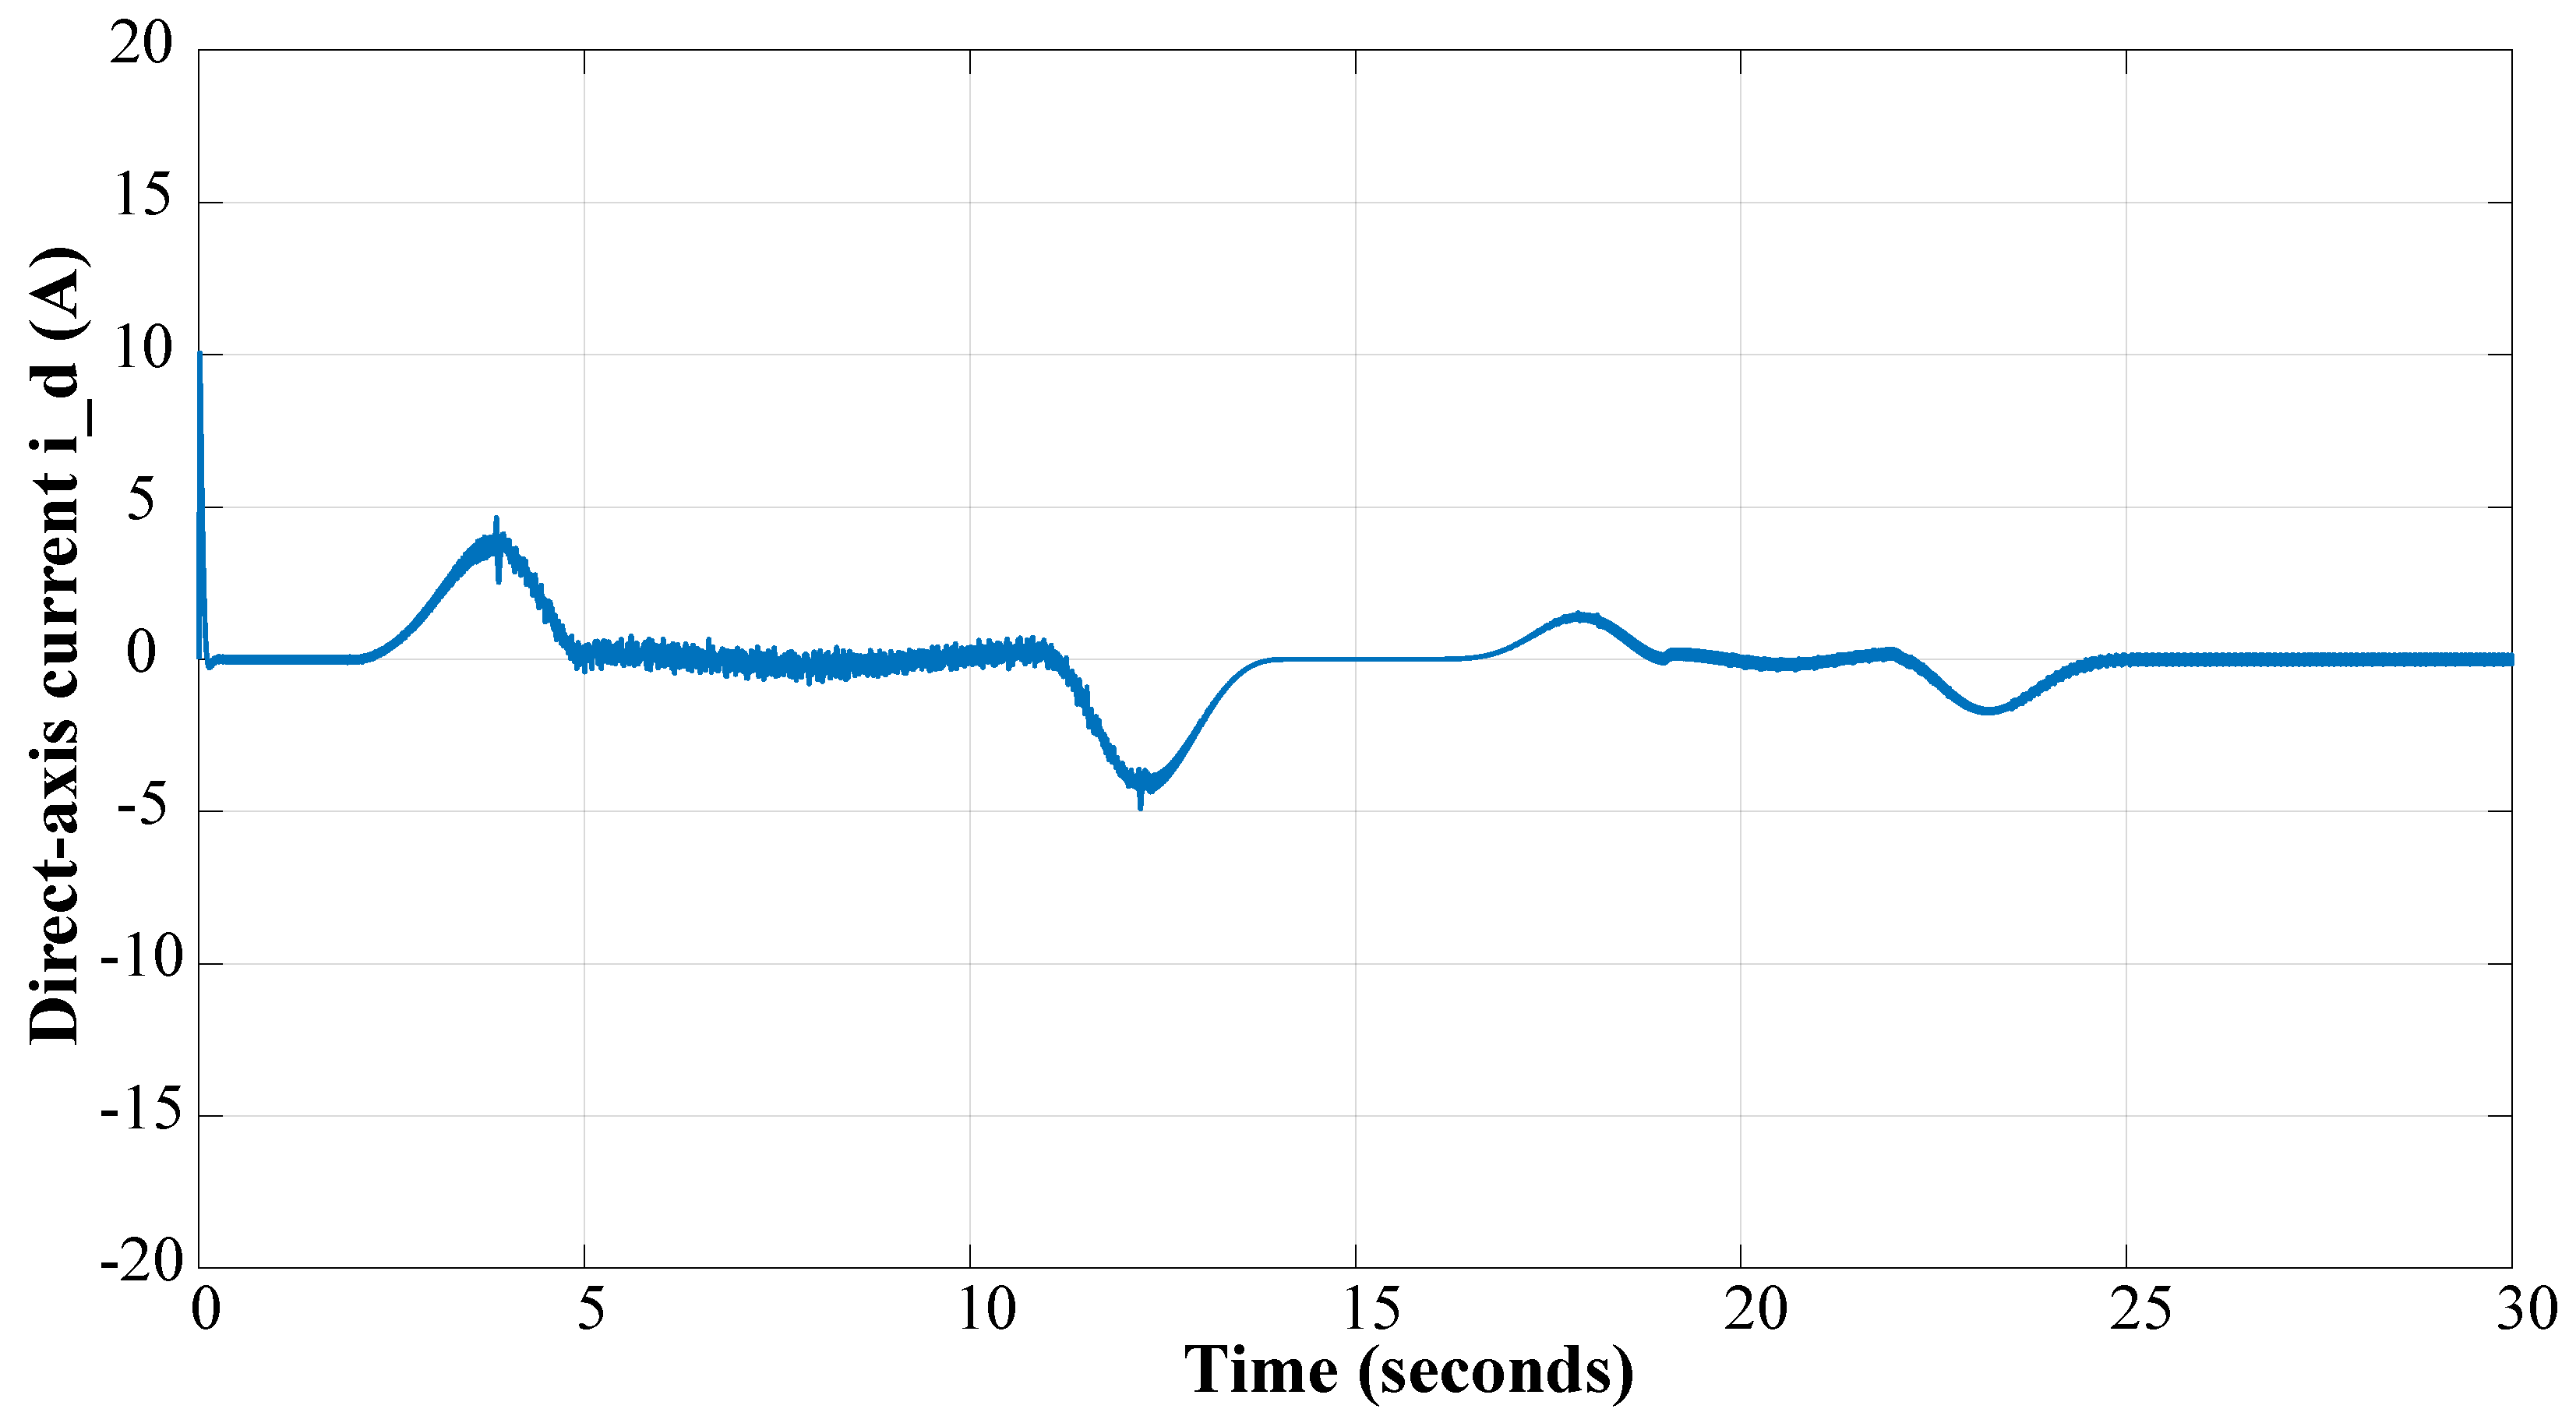
Figure 7 and
Figure 8 show the d- and q-axis stator currents obtained under the FOC method. Overall, the waveforms show the expected decoupled behavior of the vector control, where iq is primarily responsible for torque production, while id regulates the flux component. The iq current follows the traction demand. It increases during the acceleration phase and decreases when the required torque is reduced. This indicates a stable torque-control system and reproduces the conventional behavior of a DC drive, where torque is directly proportional to the controlled armature current (assuming approximately constant flux). On the other hand, the id current remains close to the zero reference for most of the simulation time, indicating good flux-axis regulation. As shown in
Figure 7, short deviations are visible during dynamic intervals, especially when the reference speed changes or a variable load TL is applied. These deviations are, however, bounded and the id current returns to its reference (id ref = 0).
5.4. Hybrid Storage System
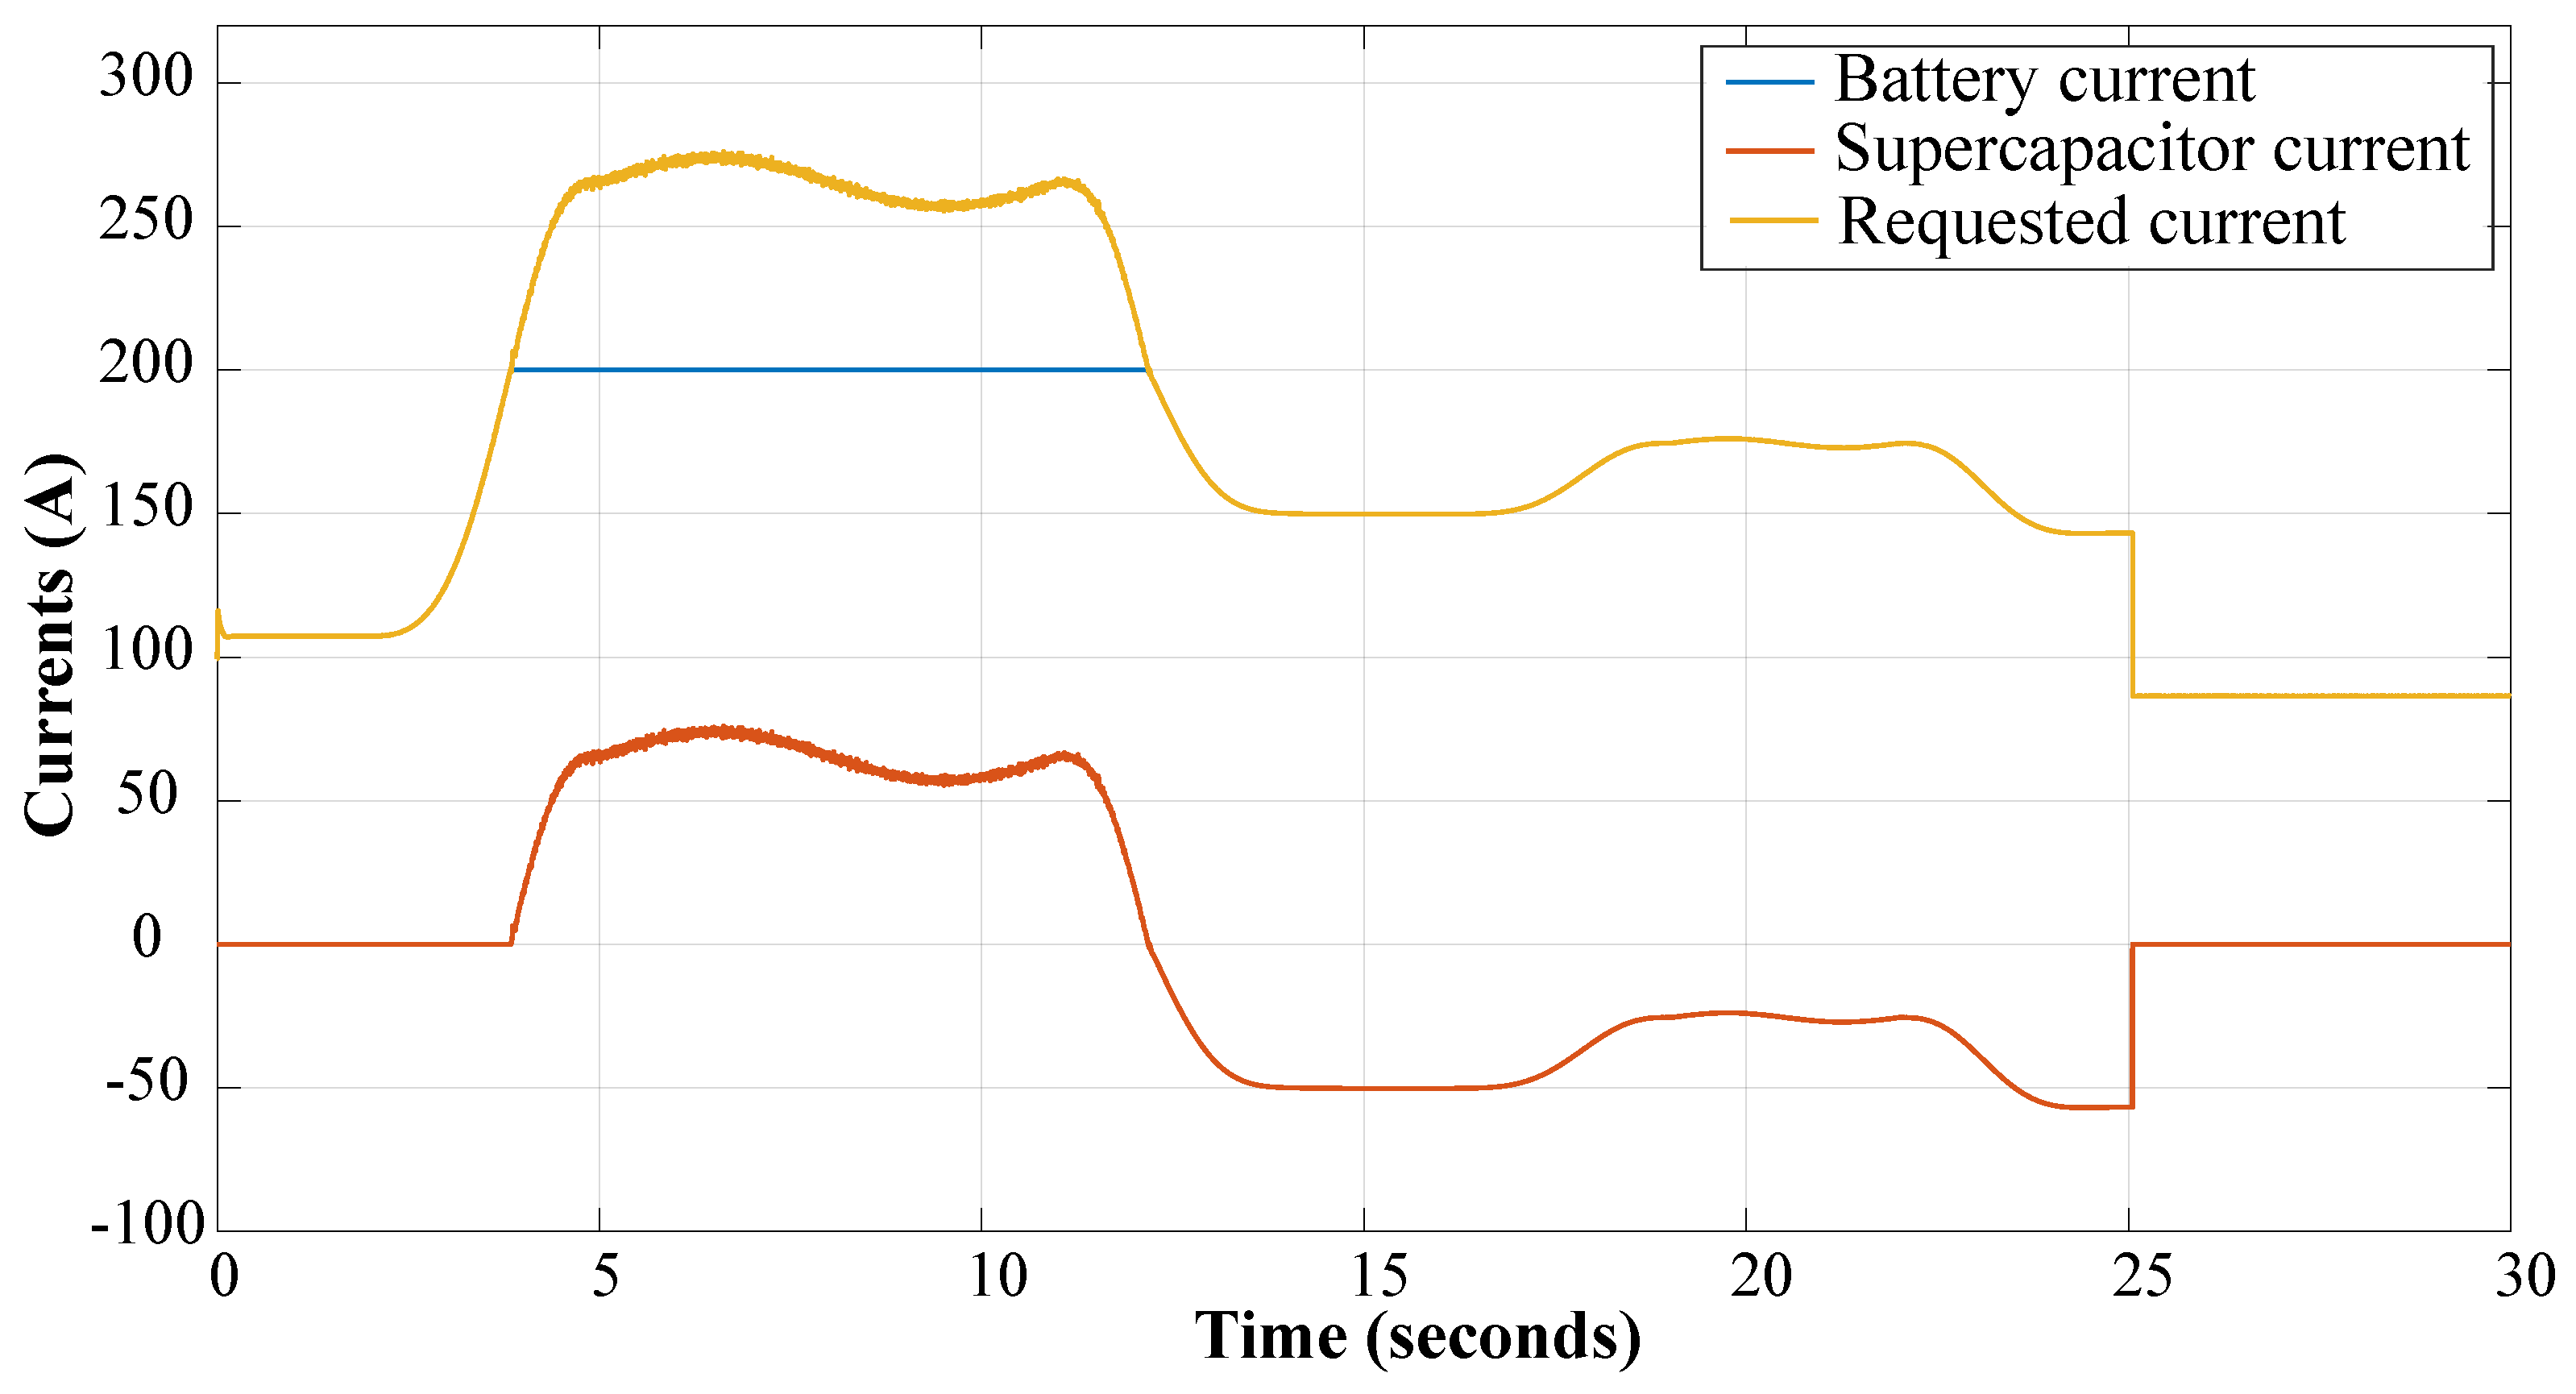
Figure 9 summarizes the behavior of the HESS and demonstrates the main objective of the EMS algorithm. This objective can be reached in two stages: (i) keep the DC-bus voltage close to its reference despite different conditions, and (ii) limit battery stress by allowing the supercapacitor pack to help during high-current peaks.
5.4.1. Current Demand and SC Contribution
The current profiles clearly illustrate the proposed energy-sharing mechanism. When the demanded current exceeds 200 A, the EMS activates the supercapacitor branch, allowing the supercapacitor to supply the additional transient current while the battery current is maintained at its limit. This operating mode reduces the high-current stress applied to the battery. When the demanded current falls below 200 A, the battery becomes the main traction-energy source. If the supercapacitor SOC is below 70%, part of the available current margin is used to recharge it, keeping the supercapacitor available for subsequent high-power demands, as illustrated in
Figure 9.
To quantify the contribution of the hybrid storage system, the same 30 s operating profile was simulated with the battery as the only energy-storage source. The comparison is summarized in
Table 7. With the HESS, the peak battery current decreases from 274.90 A to 200.00 A, corresponding to a reduction of 27.25%. The RMS battery current decreases by 6.02%, while the estimated ohmic losses are reduced by 11.08%. The battery energy supplied over the complete profile remains nearly unchanged, showing that the main contribution of the supercapacitor is to redistribute transient power and reduce battery-current stress rather than reduce the total traction-energy demand. The DC-bus voltage remains well regulated in both configurations, although the HESS case exhibits a slightly higher normalized RMSE due to the additional transient power exchanges between the two storage branches. The quantitative differences between the battery-only and HESS configurations are summarized in
Table 7.
During the HESS operation, the supercapacitor exchanges 22.46 Wh and 22.79 Wh in opposite power-flow directions over the 30 s profile, resulting in a small net energy variation of approximately Wh.
5.4.2. SOC Trends: Battery and Supercapacitor
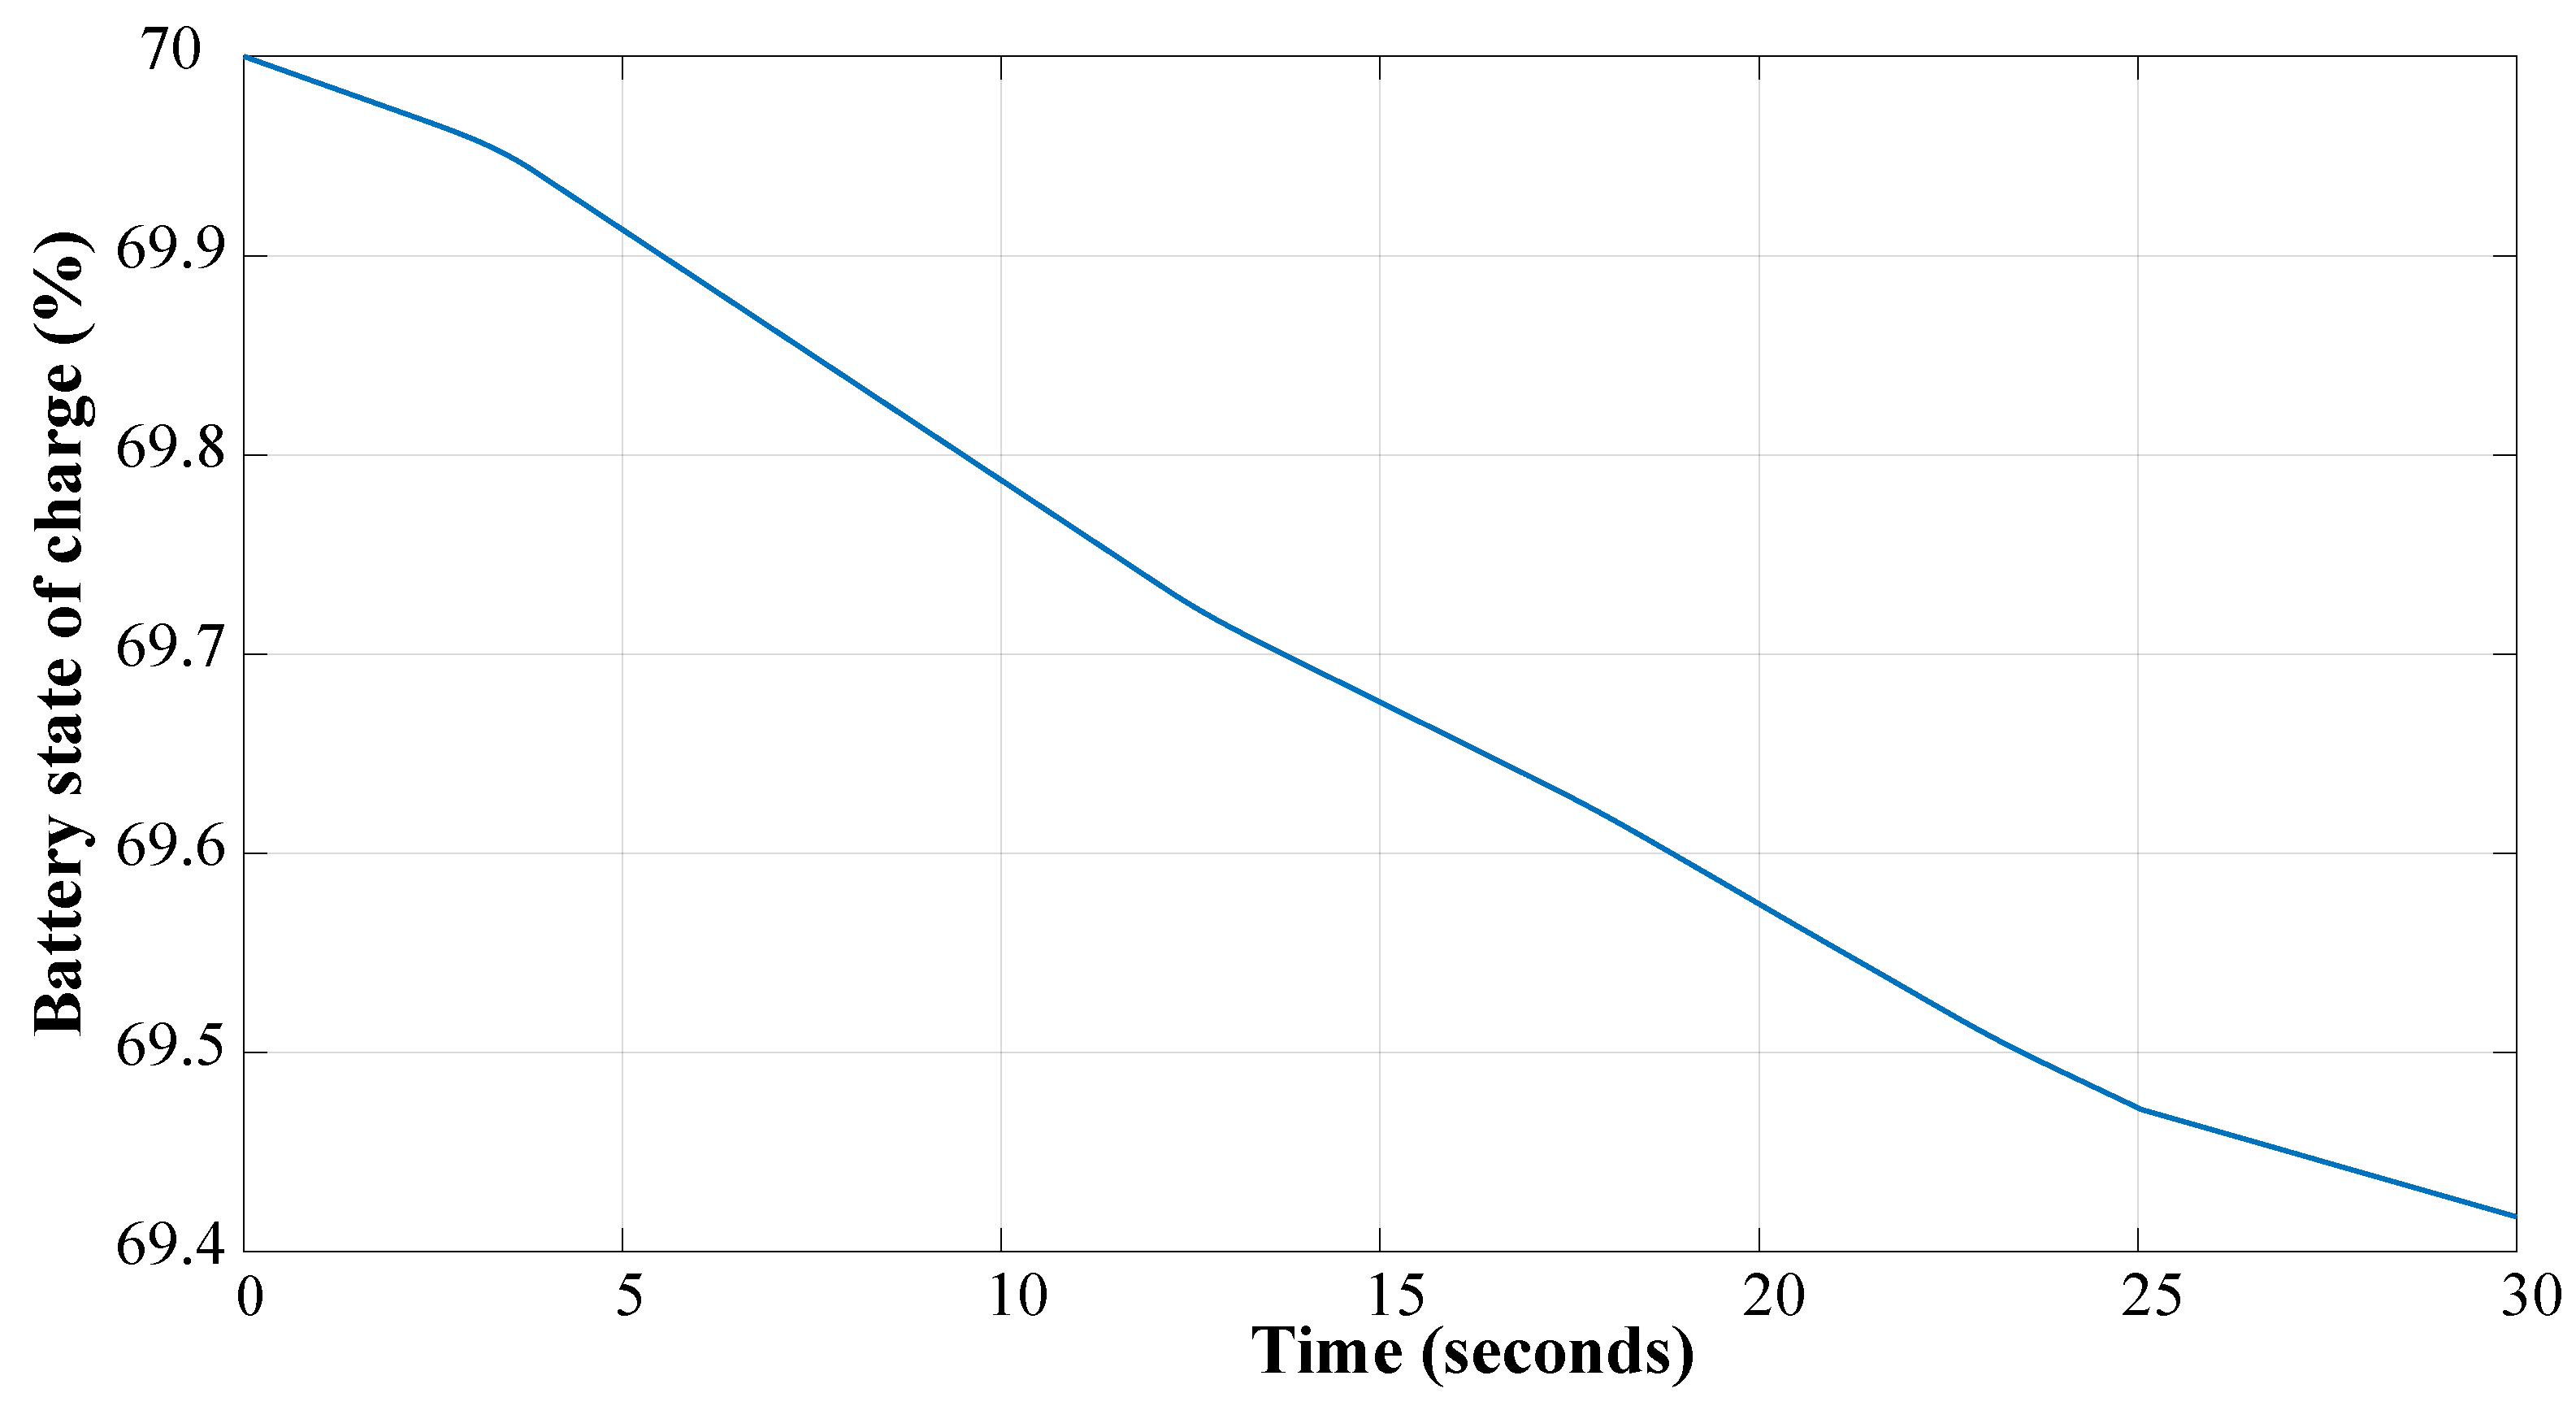
The battery
is shown in
Figure 10. It starts from 70% and decreases only slightly during the investigated operating profile. A charge-balance verification was performed to check the consistency of the SOC calculation. The integrated battery current gives a net discharged charge of 1.2863 Ah. Considering the battery-pack capacity of 220.8 Ah, this corresponds to an expected SOC decrease of 0.5826 percentage points. The simulated battery SOC decreases from 70.0000% to 69.4174%, giving the same variation. The difference between the two calculations is approximately 0.000019 percentage points, confirming the consistency of the coulomb-counting implementation.
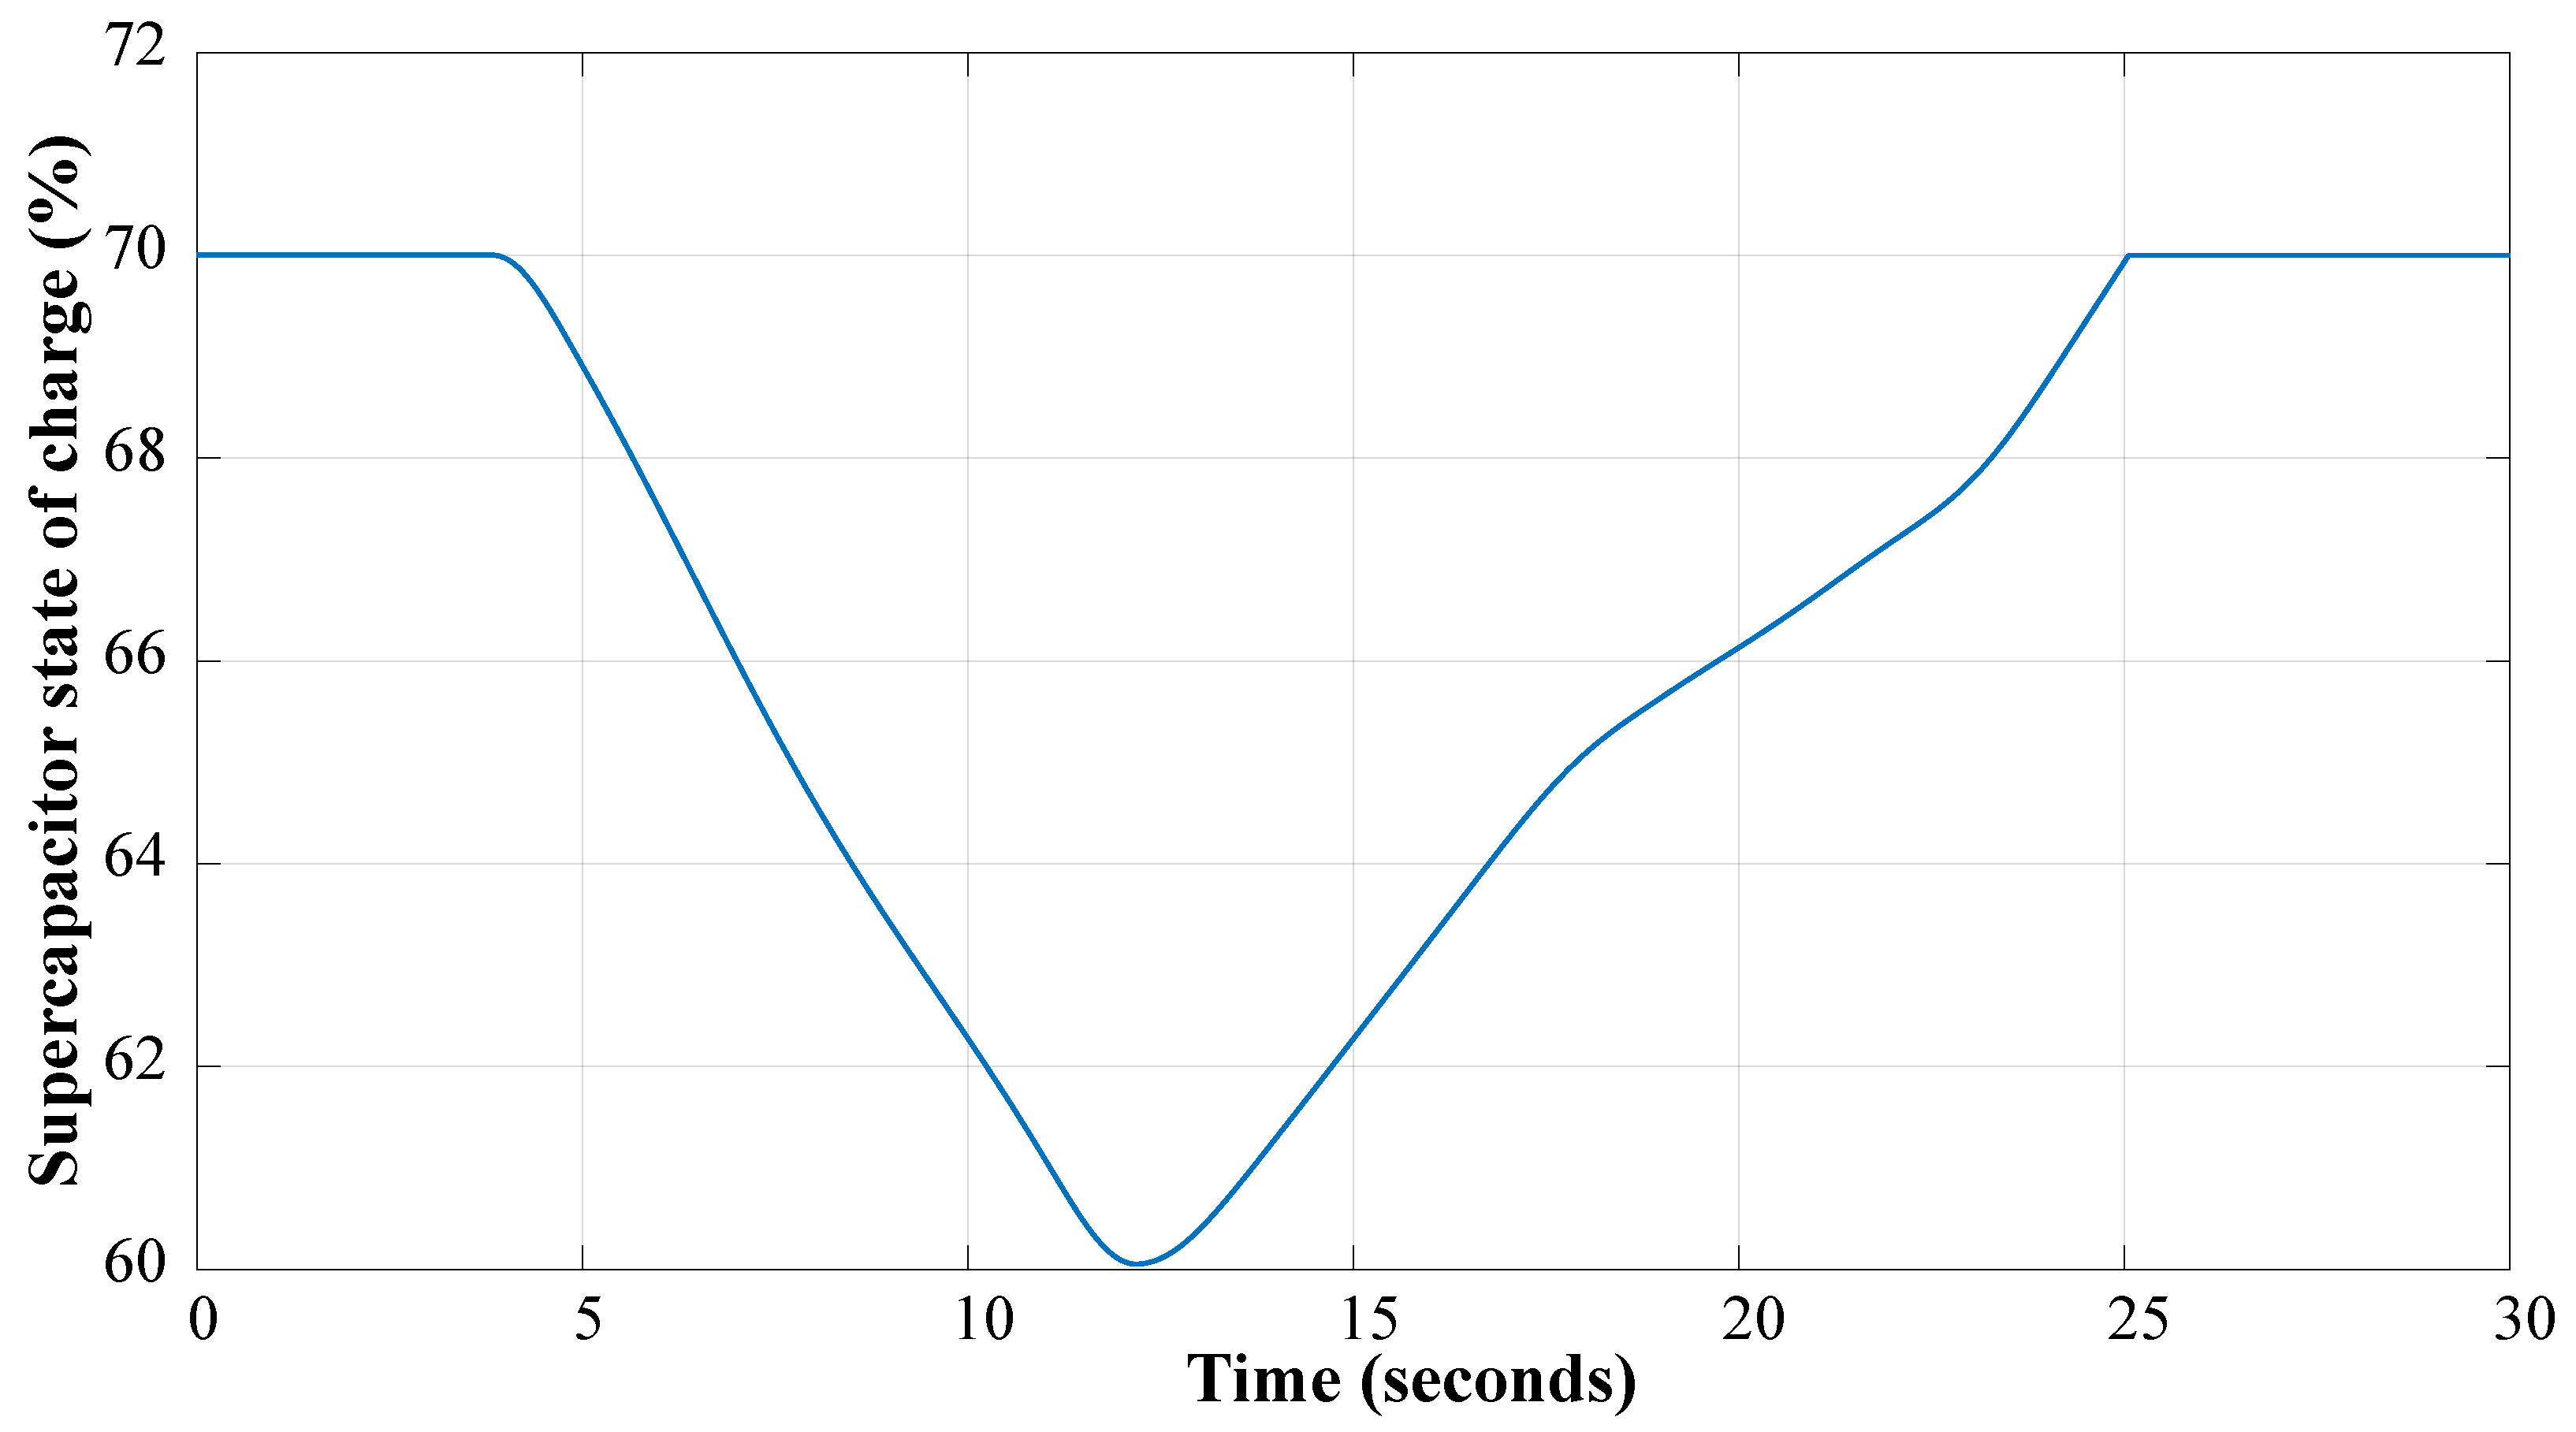
The
shown in
Figure 11 decreases during high-power demand and recovers during the following low- and medium-demand intervals, when the EMS activates the charging mode. In the nominal case, the SC returns to the 70% recharge level, confirming its role as a short-term power buffer while the battery provides the main traction energy.
A quantitative evaluation of the final regenerative interval, from approximately 23.52 s to 30 s, gives a braking energy of 5.85 Wh. During this interval, 4.02 Wh is absorbed by the supercapacitor, corresponding to an energy-recovery ratio of 68.71%. The supercapacitor current reaches approximately A, whereas the battery current remains positive. Thus, no direct battery charging is observed during this regenerative phase.
To examine the influence of the initial storage conditions, two additional simulations were performed while keeping the same operating profile and control parameters. The current-sharing pattern remained practically unchanged over the investigated cases; therefore, the comparison focuses on the SOC evolution and recovery behavior, as summarized in
Table 8.
Reducing the initial battery SOC from 70% to 50% produces only a moderate change in the SC energy evolution. Its minimum SOC decreases from 60.05% to 58.82%, while the recovery time increases from 12.79 s to 14.01 s. A stronger effect is observed when the SC starts from a lower SOC. With , the minimum value reaches 25.50% and the 70% recharge level is not recovered within the 30 s interval. However, the SOC remains above the 20% lower limit throughout the test, allowing the SC to remain available for transient power support. These results show that the initial battery SOC has a limited influence under the investigated conditions, whereas the initial SC SOC mainly affects the available energy reserve and its recovery capability.
5.5. Inverter and LC Output-Filter Performance
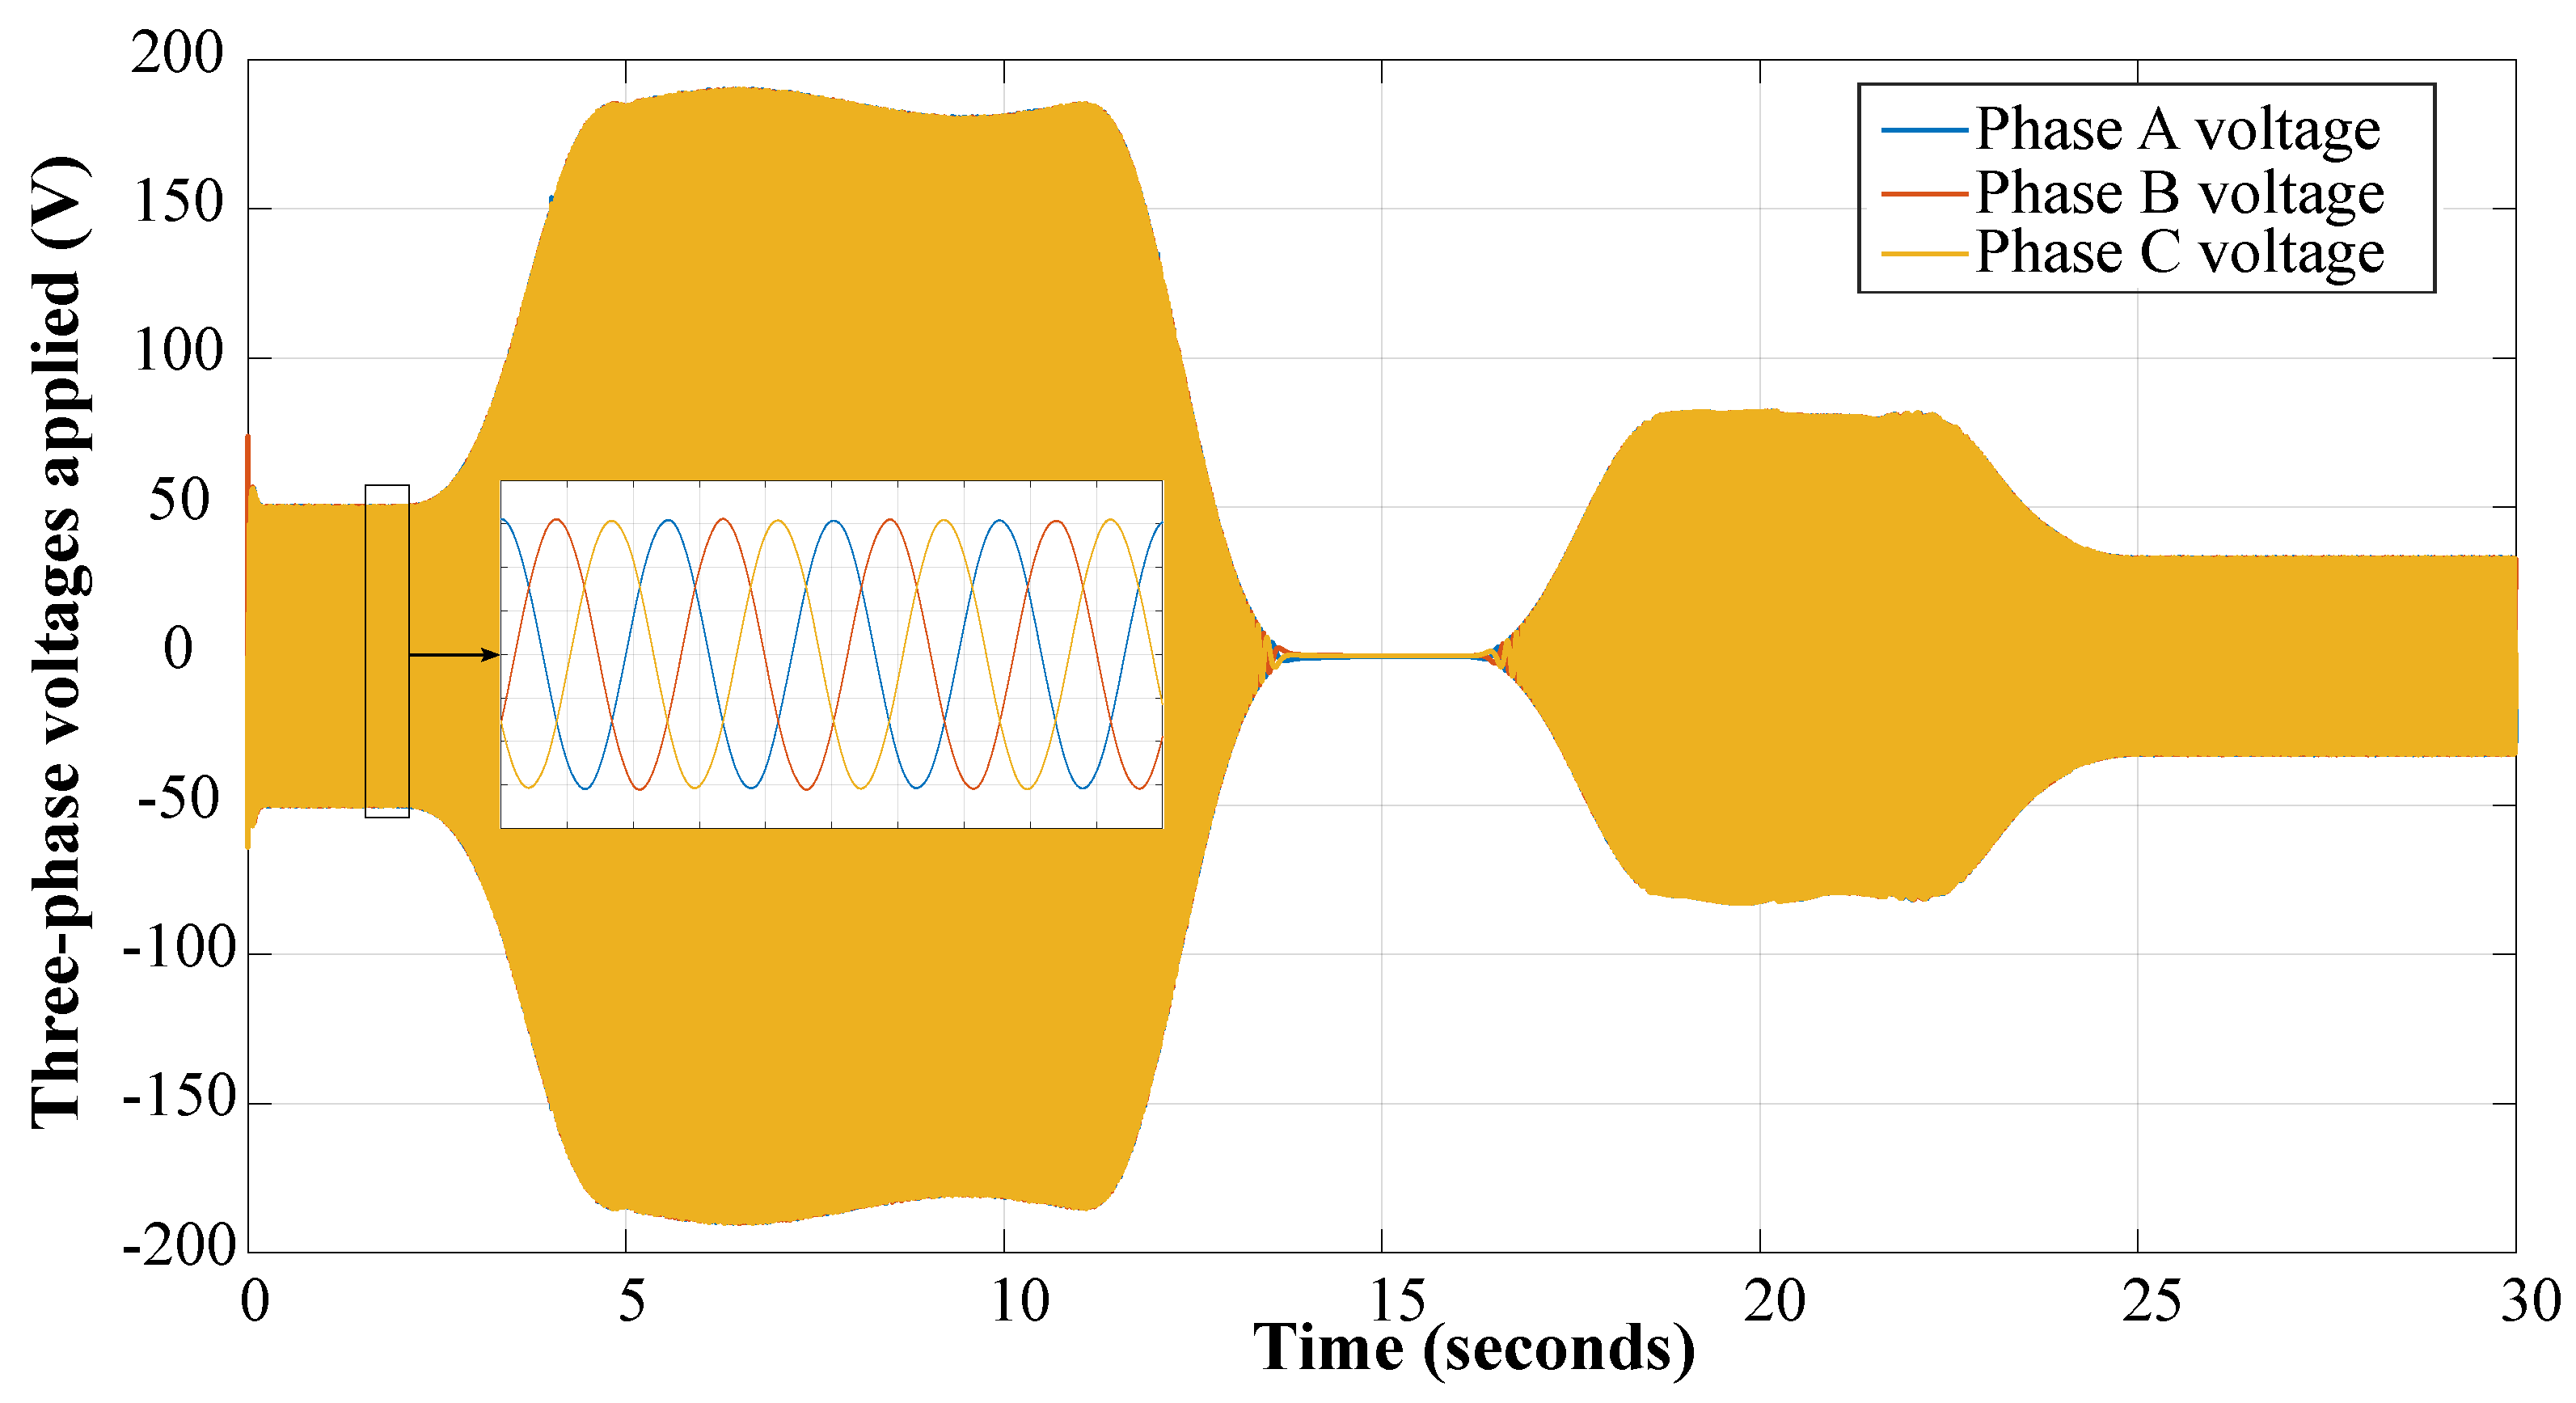
Figure 12 presents the three-phase voltages obtained at the PMSM terminals after LC filtering. The two-level voltage-source inverter is controlled through SVPWM at a switching frequency of
. Although the inverter output contains high-frequency switching components, the LC filter produces approximately sinusoidal phase voltages displaced by
.
The short oscillatory behavior observed during rapid operating transitions results from the exchange of stored energy between the filter inductance and capacitance. Nevertheless, this transient remains bounded and does not lead to sustained oscillations in the motor currents.
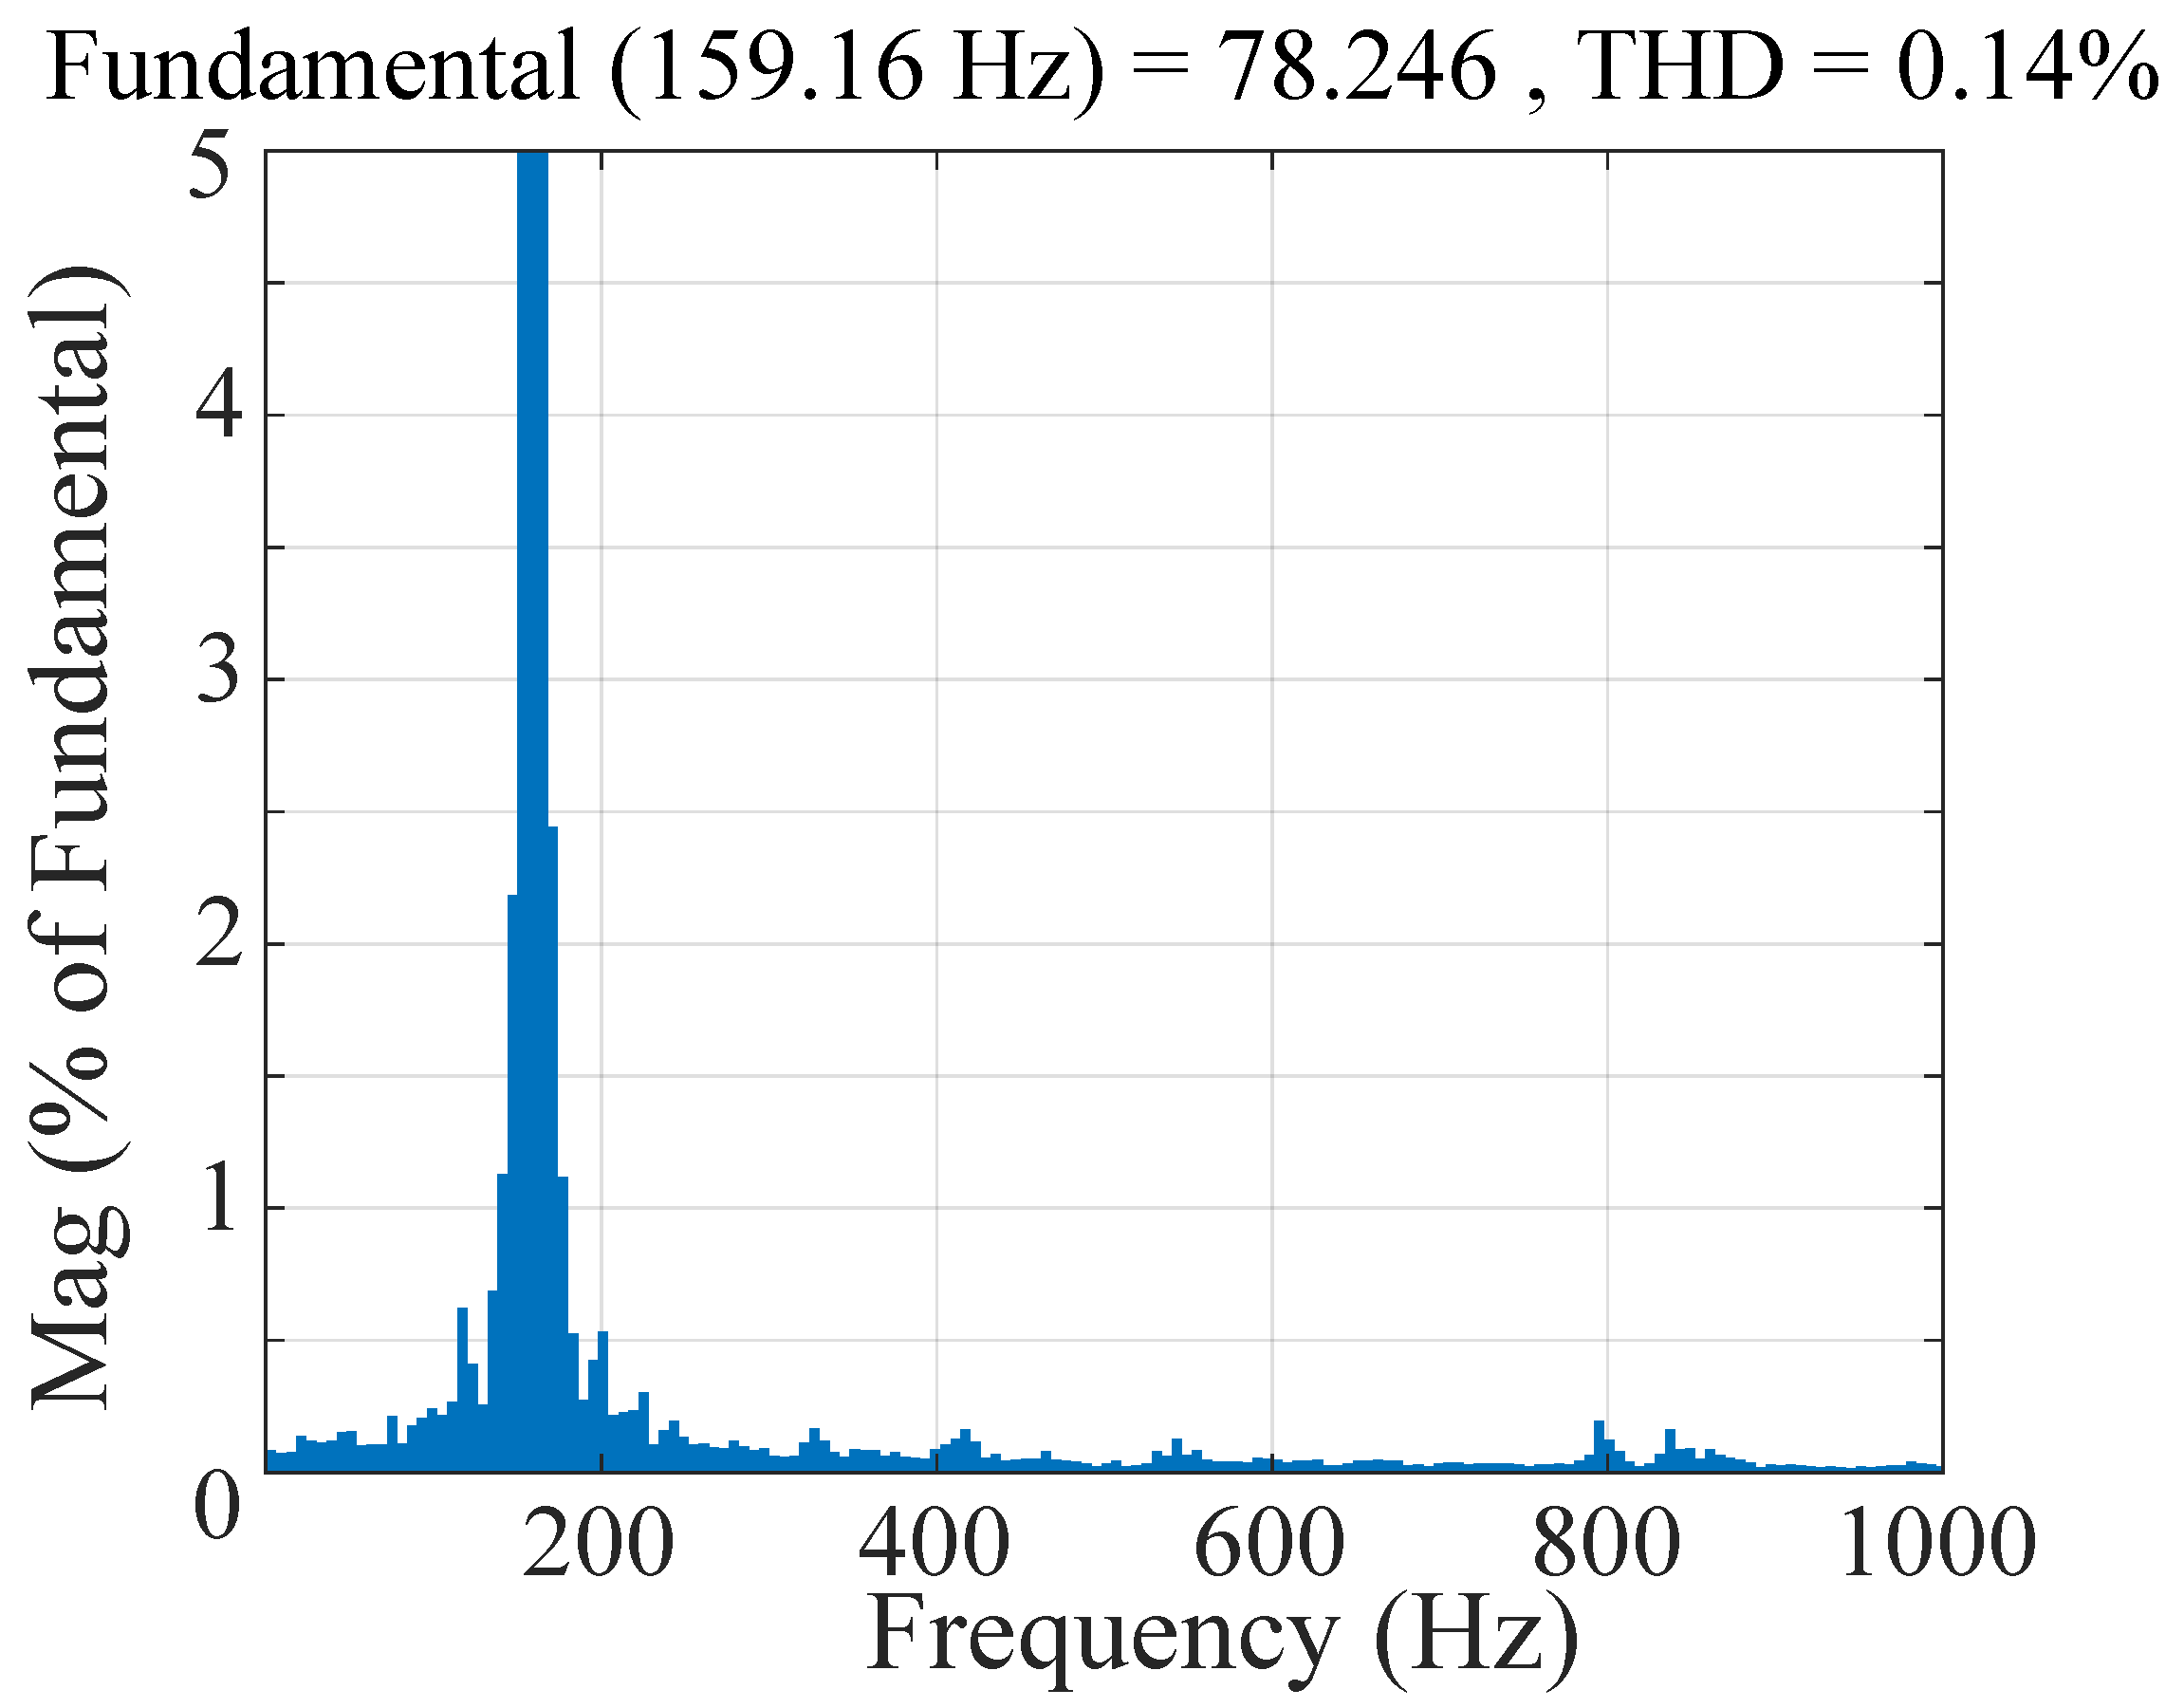
Figure 13 shows the low-frequency spectrum of the filtered phase voltage at the maximum-speed operating point. At
and with
pole pairs, the electrical fundamental frequency is
The voltage THD evaluated up to is approximately , indicating that the low-order harmonic content of the filtered voltage remains very limited.
To complement the result shown in
Figure 13, the three-phase voltages were evaluated at two measurement points of the traction drive. The voltages before filtering were measured directly at the VSI output terminals, corresponding to the input of the LC filter, whereas the voltages after filtering were measured at the filter output, corresponding to the PMSM stator terminals. Therefore, the comparison includes the voltage variation across the series filter inductance and represents the actual voltage delivered to the motor terminals. Both measurement points were analyzed at
, corresponding to
, using the same time interval, a switching frequency of 15 kHz, and a sampling frequency of 1 MHz.
The conventional low-frequency THD was calculated from the integer harmonics of the electrical fundamental frequency up to
as
where
is the RMS value of the fundamental component,
is the RMS value of the harmonic of order
h, and
H is the highest harmonic order located below
.
Since the principal inverter switching components are concentrated around the PWM carrier and its sidebands, a complementary wideband distortion index was also considered. For a selected frequency band
, it is defined as
where
is the combined RMS value of the residual spectral components contained in the selected band after removal of the fundamental component.
Table 9 confirms that the LC filter preserves the useful voltage component, since the fundamental RMS voltage decreases by only
. The relatively small improvement in the low-frequency THD is explained by the fact that the harmonics below
are already weak before filtering.
The most significant improvement is observed at high frequencies. The wideband distortion index decreases by
, while the distortion in the 12–
band surrounding the PWM carrier is reduced by
. The corresponding attenuation is calculated as
This attenuation means that the RMS magnitude of the switching-related components is approximately 228 times lower after filtering. Thus, the selected LC filter mainly acts on the switching-frequency components while producing a negligible influence on the fundamental voltage supplied to the PMSM.
Furthermore, the simulated d- and q-axis currents remain bounded and do not exhibit sustained oscillations associated with the LC-filter resonance. This observation indicates that the adopted resonance frequency and equivalent damping do not introduce an observable current-control instability under the investigated operating conditions.
5.6. Qualitative and Quantitative Validation Results
Table 10 confirms the accurate dynamic response of the PMSM drive. After excluding the initial-condition transient (
s), the low RMSE and MAE values indicate that the measured speed closely follows its reference over the complete operating profile.
Since the reference-speed profile contains several operating levels, the tracking performance is also evaluated using the normalized root-mean-square error (NRMSE), defined as
where
is the RMS value of the reference-speed profile over the same evaluation interval. The obtained
is
, which shows that the RMS tracking error remains below
of the RMS reference speed. The maximum tracking error occurs during a speed transition, while the overshoot at high speed remains limited to 0.4667% and the final speed error is negligible.
The torque and q-axis current increase consistently with the traction demand, confirming the expected relationship between and the electromagnetic torque. Meanwhile, the d-axis current remains close to its zero reference, apart from a short transient deviation. These results demonstrate effective speed regulation and satisfactory flux–torque decoupling under the investigated operating conditions.
6. Conclusions
This work presented an integrated simulation framework for an electric-vehicle traction system combining a permanent-magnet synchronous motor, field-oriented control, a battery–supercapacitor hybrid energy storage system, two bidirectional DC/DC converters, a regulated DC bus, a voltage-source inverter, and an LC output filter. The main system-level contribution lies in the coordinated evaluation of these subsystems under the same transient operating profile, enabling the interactions between traction control, battery–supercapacitor power sharing, DC-bus regulation, regenerative-energy flow, and motor-terminal voltage quality to be assessed within a unified model.
The traction drive achieved accurate speed tracking under variations in reference speed and resisting torque, with an RMSE of 0.5788 rad/s and a normalized RMSE of 0.3793%. The HESS effectively redistributed transient power between the battery and supercapacitor. Compared with the battery-only configuration under the same operating profile, the HESS reduced the peak battery current from 274.90 A to 200 A, corresponding to a 27.25% reduction, while the RMS battery current decreased from 169.84 A to 159.61 A. The estimated battery ohmic losses were also reduced from 4.98 Wh to 4.43 Wh, corresponding to an 11.08% reduction. This confirms that the main role of the supercapacitor is to redistribute transient power and reduce peak and RMS battery current rather than reduce the overall traction-energy demand.
The consistency of the battery SOC calculation was independently confirmed through a charge-balance verification based on the integrated battery current. The DC bus remained closely regulated around its 700 V reference, with a normalized RMSE of 1.38%, while the voltage remained within ±5% of the reference for 99.80% of the evaluated interval. During the regenerative interval, the supercapacitor absorbed 4.02 Wh from 5.85 Wh of braking energy, corresponding to a recovery ratio of 68.71%, while no net battery charging occurred under the investigated conditions.
The LC output filter effectively attenuated the inverter switching components while preserving the useful motor-terminal voltage waveform. The wideband distortion index was reduced by 98.45%, while the distortion within the 12–18 kHz switching-frequency range was reduced by 99.56%, corresponding to an attenuation of 47.16 dB. Overall, the results show that the integrated framework provides accurate traction control, effective transient power sharing, satisfactory DC-bus regulation, and improved motor-terminal voltage quality under the investigated transient operating conditions.
The present results provide a simulation-based assessment of the complete architecture and should therefore be interpreted within the investigated operating conditions. Hardware-in-the-loop and experimental validation remain necessary to evaluate practical effects such as switching delays, sensor noise, parameter variations, converter losses, and other hardware-related nonidealities. Future work will also investigate adaptive, predictive, or optimization-based energy-management strategies over a wider range of driving conditions to further improve battery–supercapacitor power sharing and assess the proposed architecture under more representative vehicle operating scenarios.