1. Introduction
Lithium-ion (Li-ion) batteries are widely employed in electric vehicles, portable electronic devices, and stationary energy storage systems because of their high energy density, extended cycle life, and favorable electrochemical characteristics [
1,
2,
3]. Their increasing deployment across diverse applications has made BMSs indispensable for maintaining battery safety, operational reliability, and efficient energy utilization under varying operating conditions [
4,
5].
State-of-charge (SOC) estimation is a key function of BMSs, providing critical information for battery supervision, charge control, and energy management. Therefore, achieving accurate SOC estimation is essential for ensuring reliable battery operation, mitigating overcharge and over-discharge, and prolonging battery service life [
6].
SOC represents the remaining charge stored inside a battery relative to its nominal capacity [
2,
7,
8]. However, SOC cannot be measured directly using physical sensors and must instead be estimated from measurable quantities such as terminal voltage and current [
9]. Accurate SOC estimation remains challenging because Li-ion batteries exhibit highly nonlinear dynamics and time-varying characteristics influenced by temperature variations, aging, and operating conditions [
10,
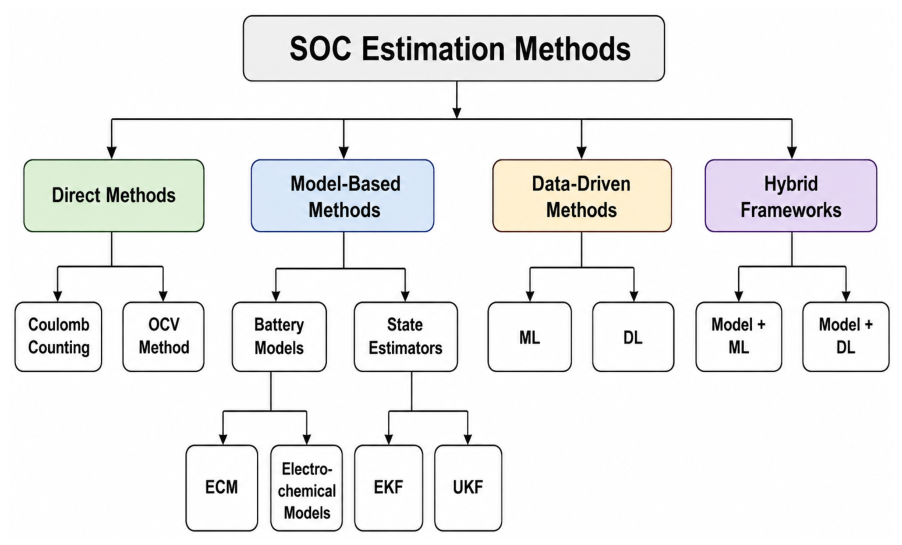
11]. To overcome these challenges, a wide range of SOC estimation frameworks has been developed [
7,
8], which can generally be classified into several categories: direct, model-based, data-driven, and hybrid frameworks [
12].
Figure 1 illustrates the taxonomy of these frameworks.
Conventional direct techniques, such as Coulomb counting and open-circuit voltage methods, are computationally efficient but suffer from error accumulation and limited against sensor noise [
2,
13,
14]. To overcome these limitations, model-based methods employing equivalent circuit models (ECMs) have attracted considerable attention in recent years [
6,
9,
15].
Among the model-based approaches, Kalman-filter-based methods have been extensively investigated for battery SOC estimation [
16] owing to their recursive structure, physical interpretability, and relatively low computational cost [
6,
9]. Various filtering frameworks, including the Extended Kalman Filter (EKF), Unscented Kalman Filter (UKF), and particle filters have been proposed for battery state estimation [
11,
17]. The EKF has demonstrated satisfactory estimation performance under moderate operating conditions by combining equivalent circuit models with real-time battery measurements [
6]. However, the estimation accuracy of EKF-based approaches remains strongly dependent on the appropriate selection of the process-noise covariance matrix
and the measurement-noise covariance matrix
[
15,
18]. In practical applications, the covariance matrices are commonly selected manually to remain constant throughout the battery lifetime. Consequently, inaccurate covariance selection may lead to estimation bias, slow convergence, and performance degradation under varying operating conditions [
19]. To overcome the limitations associated with the manual tuning of the process and measurement-noise covariance matrices, several adaptive Kalman filtering techniques have been developed to improve the adaptability of conventional Kalman filters [
13,
14]. Representative approaches include dual-estimation frameworks, multi-innovation filtering strategies, Sage–Husa adaptive filtering, and maximum-likelihood-based covariance adaptation [
9,
11,
20,
21]. Although these methods improve estimation performance and robustness under varying operating conditions, they remain limited by the structural modeling errors introduced by reduced-order equivalent circuit models [
10,
20].
Data-driven approaches have also emerged as an effective alternative for battery SOC estimation [
3,
22]. Deep learning architectures, including artificial neural networks (ANNs), recurrent neural networks (RNNs), and long short-term memory (LSTM) networks, have demonstrated strong capability in learning the nonlinear relationship between battery measurements and SOC [
23,
24].These methods estimate SOC directly from measured data without requiring explicit electrochemical models. However, their performance often degrades under unseen operating conditions, limiting their generalization capability. In addition, they lack the physical interpretability and recursive state-estimation capability inherent to Kalman-filter-based methods.
Consequently, recent research has increasingly focused on hybrid SOC estimation frameworks that combine physical battery models with data-driven learning algorithms. Xing et al. [
25] integrated a dual-EKF with a neural-network-based compensation model to reduce the residual estimation error. Hybrid frameworks combining data-driven models with Kalman-filter-based correction have also been reported in [
26,
27], while Yun et al. [
28] developed a hybrid model-based and data-driven framework for electric-vehicle batteries.
More recently, Sun et al. [
29] proposed an LSTM-EKF framework enhanced by feature engineering and physics-based output constraints, achieving average RMSE values below
under different operating temperatures. Similarly, Peng et al. [
30] developed a hybrid PID-AEKF framework for LiFePO
4 batteries with estimation errors below
, while Jiang et al. [
31] integrated an adaptive UKF with deep learning models to improve estimation robustness under different operating conditions. Besides, Transformer-based architectures have also been investigated for capturing long-range temporal dependencies in battery SOC estimation [
32].
From another perspective, hybrid frameworks that combine recursive Kalman filtering with deep learning have recently demonstrated improved estimation accuracy by exploiting the strengths of model-based and data-driven approaches [
33,
34,
35,
36].
Overall, the literature demonstrates a clear evolution from conventional model-based estimation methods toward adaptive and hybrid learning-based frameworks [
12]. Nevertheless, several challenges remain unresolved. Conventional filtering methods preserve physical interpretability but remain sensitive to parameter uncertainties, modeling errors, and nonlinear disturbances, whereas hybrid frameworks improve estimation accuracy at the expense of increased model complexity and limited generalization capability. Furthermore, most adaptive and hybrid approaches continue to rely on manually tuned or heuristically determined measurement covariance matrices, while the residual modeling errors introduced by reduced-order equivalent circuit models are rarely addressed within the same estimation framework. In addition, most validation studies are performed using data collected from the same battery cells under different operating cycles, providing limited evidence of cross-cell generalization. These limitations motivate the development of more adaptive and generalizable SOC estimation frameworks.
Motivated by these challenges, this study proposes a hybrid DO-EKFRes framework for lithium-ion battery SOC estimation. The proposed method first identifies the process and measurement-noise covariance matrices offline through data-driven optimization, resulting in a Data-Optimized Extended Kalman Filter (DO-EKF). A Bidirectional Long Short-Term Memory (BiLSTM) network with an attention mechanism is then employed to learn and compensate for the structured residual estimation error remaining after DO-EKF correction, rather than relearning the complete nonlinear SOC mapping. The main novelty lies in the sequential integration of covariance-optimized model-based filtering with residual deep learning, where the DO-EKF provides a physically informed baseline and the BiLSTM selectively learns the remaining estimation error. This design aims to improve estimation accuracy and generalization while retaining the computationally efficient recursive structure of the underlying filter. The proposed framework is evaluated using both a controlled synthetic Monte Carlo experiment and the NASA PCoE dataset under a Leave-One-Battery-Out (LOBO) validation protocol to assess its estimation accuracy and generalization capability across different battery cells and degradation conditions.
2. Materials and Methods
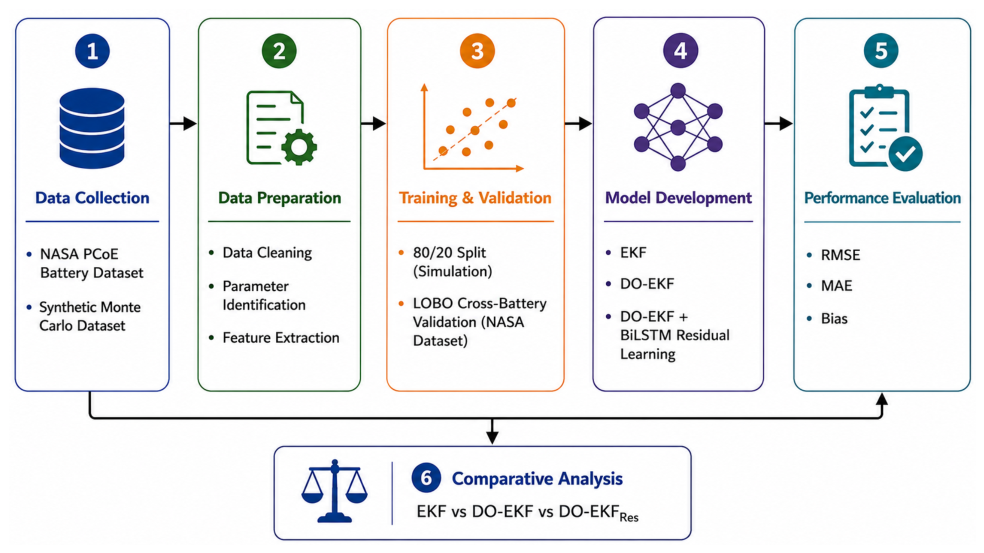
Figure 2 presents the workflow of the proposed framework, consisting of four main stages: data preparation, model development, validation, and performance evaluation. Initially, the battery datasets are preprocessed through parameter identification and feature extraction. Subsequently, a Data-Optimized Extended Kalman Filter (DO-EKF) is employed to estimate the battery SOC using offline optimized process and measurement-noise covariance matrices. The remaining estimation error is then learned by BiLSTM network to compensate for the residual modeling error and improve the final SOC estimate. The proposed framework is evaluated using two validation protocols. A controlled Monte Carlo synthetic dataset and Leave-One-Battery-Out (LOBO) cross-validation protocol is employed on the NASA PCoE battery dataset [
37]. The estimation performance is finally quantified using RMSE and compared with EKF and DO-EKF-based frameworks.
2.1. Battery Model
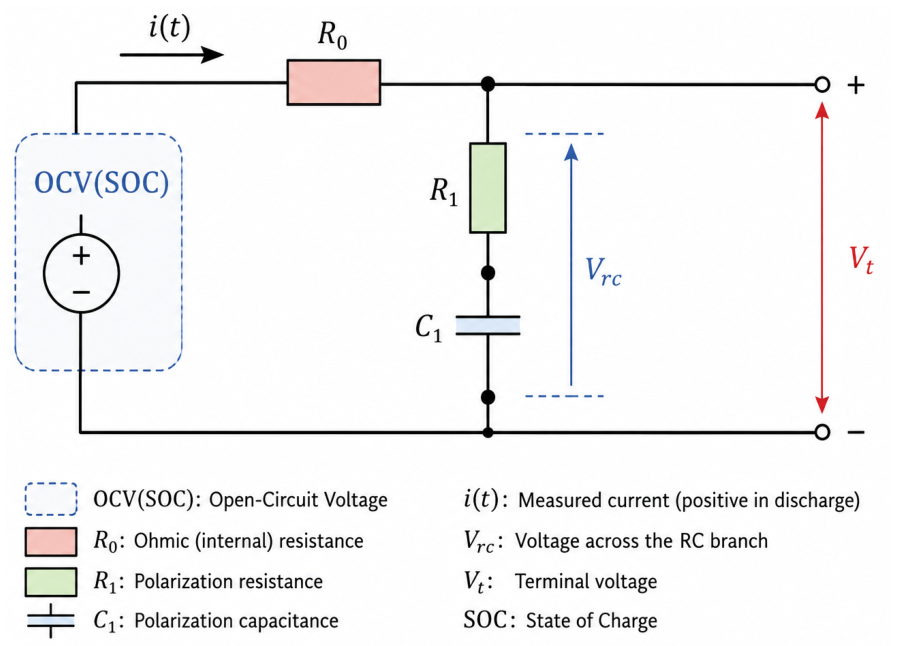
The electrical behavior of the Li-ion battery is modeled using a first-order ECM, which offers an effective balance between computational efficiency and real-time state estimation performance. As illustrated in
Figure 3, the first-order ECM comprises an open-circuit voltage (OCV) source, an ohmic resistance
, and an RC polarization branch consisting of the resistor
and capacitor
. To account for temperature variations, a linear compensation term is incorporated into the OCV–SOC relationship. The battery state vector is defined as
where
denotes the battery state of charge and
represents the polarization voltage across the RC branch. The discrete-time state equations are expressed as
is the effective battery capacity, and denotes the process-noise vector.
The corresponding terminal voltage is modeled as
where
denotes the temperature compensation coefficient,
is the reference temperature, and
represents the measurement noise.
Figure 3.
First-order equivalent circuit model adopted for battery state estimation.
Figure 3.
First-order equivalent circuit model adopted for battery state estimation.
For the controlled synthetic benchmark, the battery model was defined using a set of nominal reference parameters rather than identified from the generated signals. The nominal battery capacity was set to Ah, with , , and F. The reference temperature was set to °C, and the temperature coefficient of the OCV was V/°C. The OCV–SOC relationship was defined using a predefined lookup table.
The effective ECM parameters were subsequently determined as functions of battery SOH and temperature. Specifically, and were adjusted according to temperature deviation from and SOH-dependent aging factors, whereas and were adjusted according to SOH and low-temperature conditions. The resulting parameters were constrained within predefined physical ranges during the synthetic data generation.
To evaluate the robustness of the estimator against modeling uncertainty, a deliberately perturbed ECM was used by the EKF and DO-EKF. The estimator parameters were obtained from the reference model using predefined scaling factors of , , and for , , and , respectively. In addition, the temperature coefficient was scaled by , and a smooth bias was introduced into the OCV–SOC relationship. These controlled discrepancies were intentionally introduced to generate structured model mismatch between the reference battery and the estimator.
More specifically, the estimator OCV–SOC relationship was perturbed using the smooth bias function
such that
The nominal reference parameters and dependent coefficients used in the synthetic battery model are summarized in
Appendix A.
2.2. Dataset and Experimental Setup
To comprehensively evaluate the proposed DO-EKF
Res framework, two datasets are employed. A synthetic dataset is first generated under controlled operating conditions to assess the estimation performance in the presence of parameter variations and measurement uncertainties. Subsequently, the NASA Prognostics Center of Excellence (PCoE) battery dataset is used to evaluate the proposed framework under realistic battery aging conditions. The overall experimental protocol is summarized in
Figure 2.
2.2.1. Synthetic Data Generation
A synthetic battery dataset is generated using the first-order ECM described in
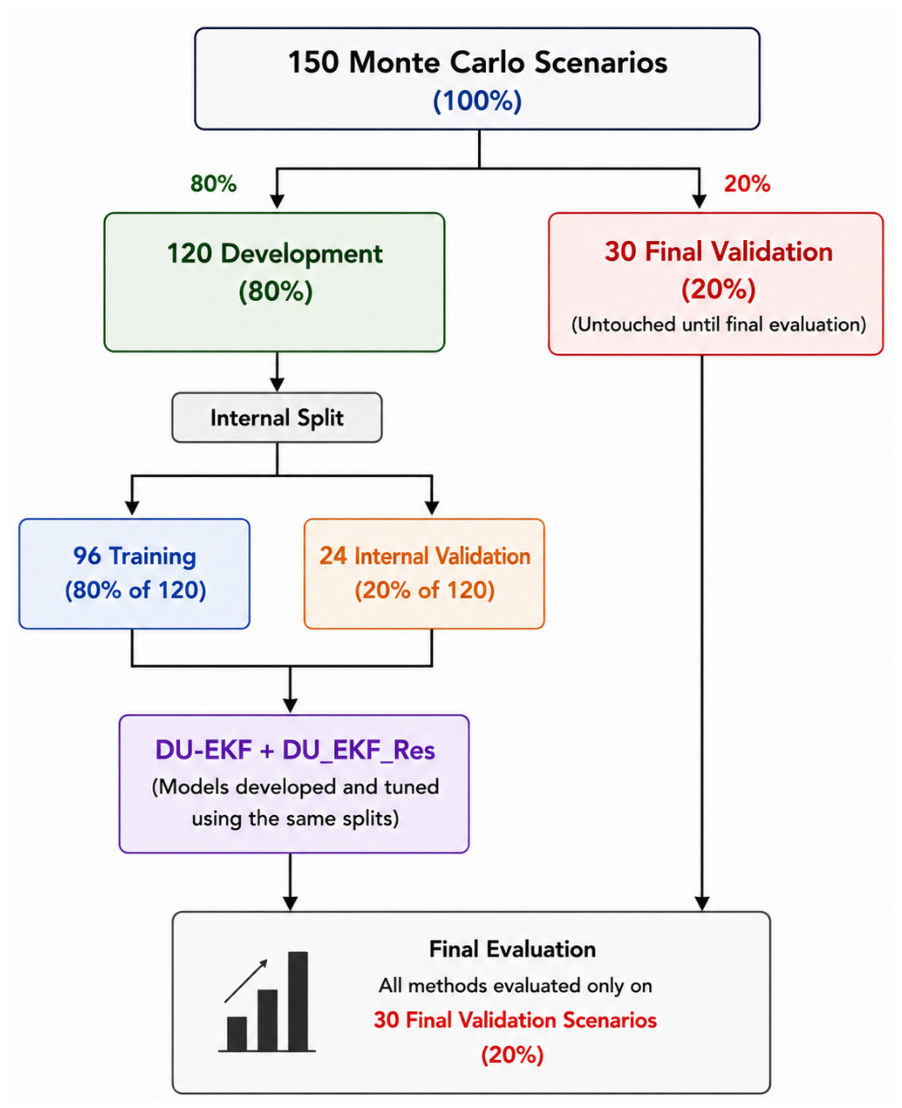
Section 2.1. The synthetic data generation procedure is summarized in Algorithm 1. For each Monte Carlo scenario, the ECM is used to generate the battery states and terminal voltage, producing synchronized time-series measurements of current, voltage, temperature, SOC, and SOH. The resulting synthetic dataset is randomly divided into 80% and 20% subsets for model development and final validation, respectively. Specifically, the 150 Monte Carlo scenarios are divided into 120 development scenarios (80%) and 30 independent final-validation scenarios (20%). The 120 development scenarios are further divided into 96 training scenarios and 24 internal-validation scenarios. The dataset generation and splitting protocol is illustrated in
Figure 4.
| Algorithm 1 Synthetic dataset generation and dataset splitting. |
- Require:
Number of Monte Carlo scenarios , simulation length - Ensure:
Development dataset and final validation dataset - 1:
for to do - 2:
Randomly initialize the battery conditions . - 3:
Generate a dynamic current profile of length . - 4:
Simulate the battery states and terminal voltage using the first-order ECM. - 5:
Add measurement noise and sensor bias to the simulated signals. - 6:
Store the generated time-series data . - 7:
end for - 8:
Randomly shuffle the 150 generated scenarios using a fixed random seed. - 9:
Assign 80% (120 scenarios) to . - 10:
Assign 20% (30 scenarios) to the independent final validation set . - 11:
Use only for model development and internal validation. - 12:
Keep completely unseen during model development. - 13:
return
|
2.2.2. NASA Prognostics Center of Excellence (PCoE) Dataset
To evaluate the proposed framework under realistic battery degradation conditions, experiments are conducted using the NASA PCoE lithium-ion battery dataset [
37]. The dataset contains accelerated aging experiments performed on commercial 18650 lithium-ion cells under repeated charge-discharge cycles.
Four battery cells (B0005, B0006, B0007, and B0018) are selected in this study, comprising a total of 636 charge-discharge cycles and 185,721 preprocessed time-series samples. The battery measurements include terminal voltage, current, temperature providing a comprehensive benchmark for validating battery state estimation algorithms. For the reference SOC was constructed offline from the measured discharge current using Coulomb counting. Further details of the reference SOC construction are provided in
Appendix D.
2.2.3. LOBO Cross-Validation
The generalization capability of the proposed framework is evaluated using a LOBO cross-validation protocol. During each validation fold, one battery cell is completely excluded from the model development process and used exclusively for testing, while the remaining three battery cells are used for training and validation.
To optimize the model parameters, the available training batteries are chronologically divided according to the charge-discharge cycles, where 80% of the cycles are used for model fitting and the remaining 20% are reserved for validation and hyperparameter selection. This evaluation protocol ensures that the testing battery remains entirely unseen during model training, providing a rigorous assessment of the estimation accuracy and cross-cell generalization capability under different degradation conditions.
2.3. Data-Optimized Extended Kalman Filter (DO-EKF)
The proposed DO-EKF extends the conventional EKF by employing offline data-driven optimization of the process-noise covariance matrix and the measurement-noise covariance . Accordingly, the proposed framework identifies the optimal process and measurement-noise covariance matrices using the training data and subsequently employs the optimized matrices during online inference.
2.3.1. Extended Kalman Filter
The EKF recursively estimates the battery state by combining the first-order ECM with the measured battery voltage and current. The nonlinear state-space model is expressed as
where
denotes the battery state vector,
is the measured battery current, and
is the measured terminal voltage. The nonlinear functions
and
represent the state-transition and measurement models, respectively.
Where and denote the process and measurement noise, respectively. Here, and denote the process-noise covariance matrix and measurement-noise covariance matrix, respectively.
The prediction step is given by
where
is the predicted state estimate and
is the predicted state-error covariance matrix.
Here, denotes the Jacobian matrix of the state-transition function.
The correction step is performed according to
where
is the measurement Jacobian matrix and
is the Kalman gain.
where
represents the measurement innovation (residual).
Here, denotes the updated state-error covariance matrix, and is the identity matrix.
The definitions of the main variables and parameters used in the EKF formulation are provided in
Appendix C.
2.3.2. Process- and Measurement-Noise Covariance Optimization
The estimation accuracy of the EKF depends on the appropriate selection of the process-noise covariance matrix
and the measurement-noise covariance matrix
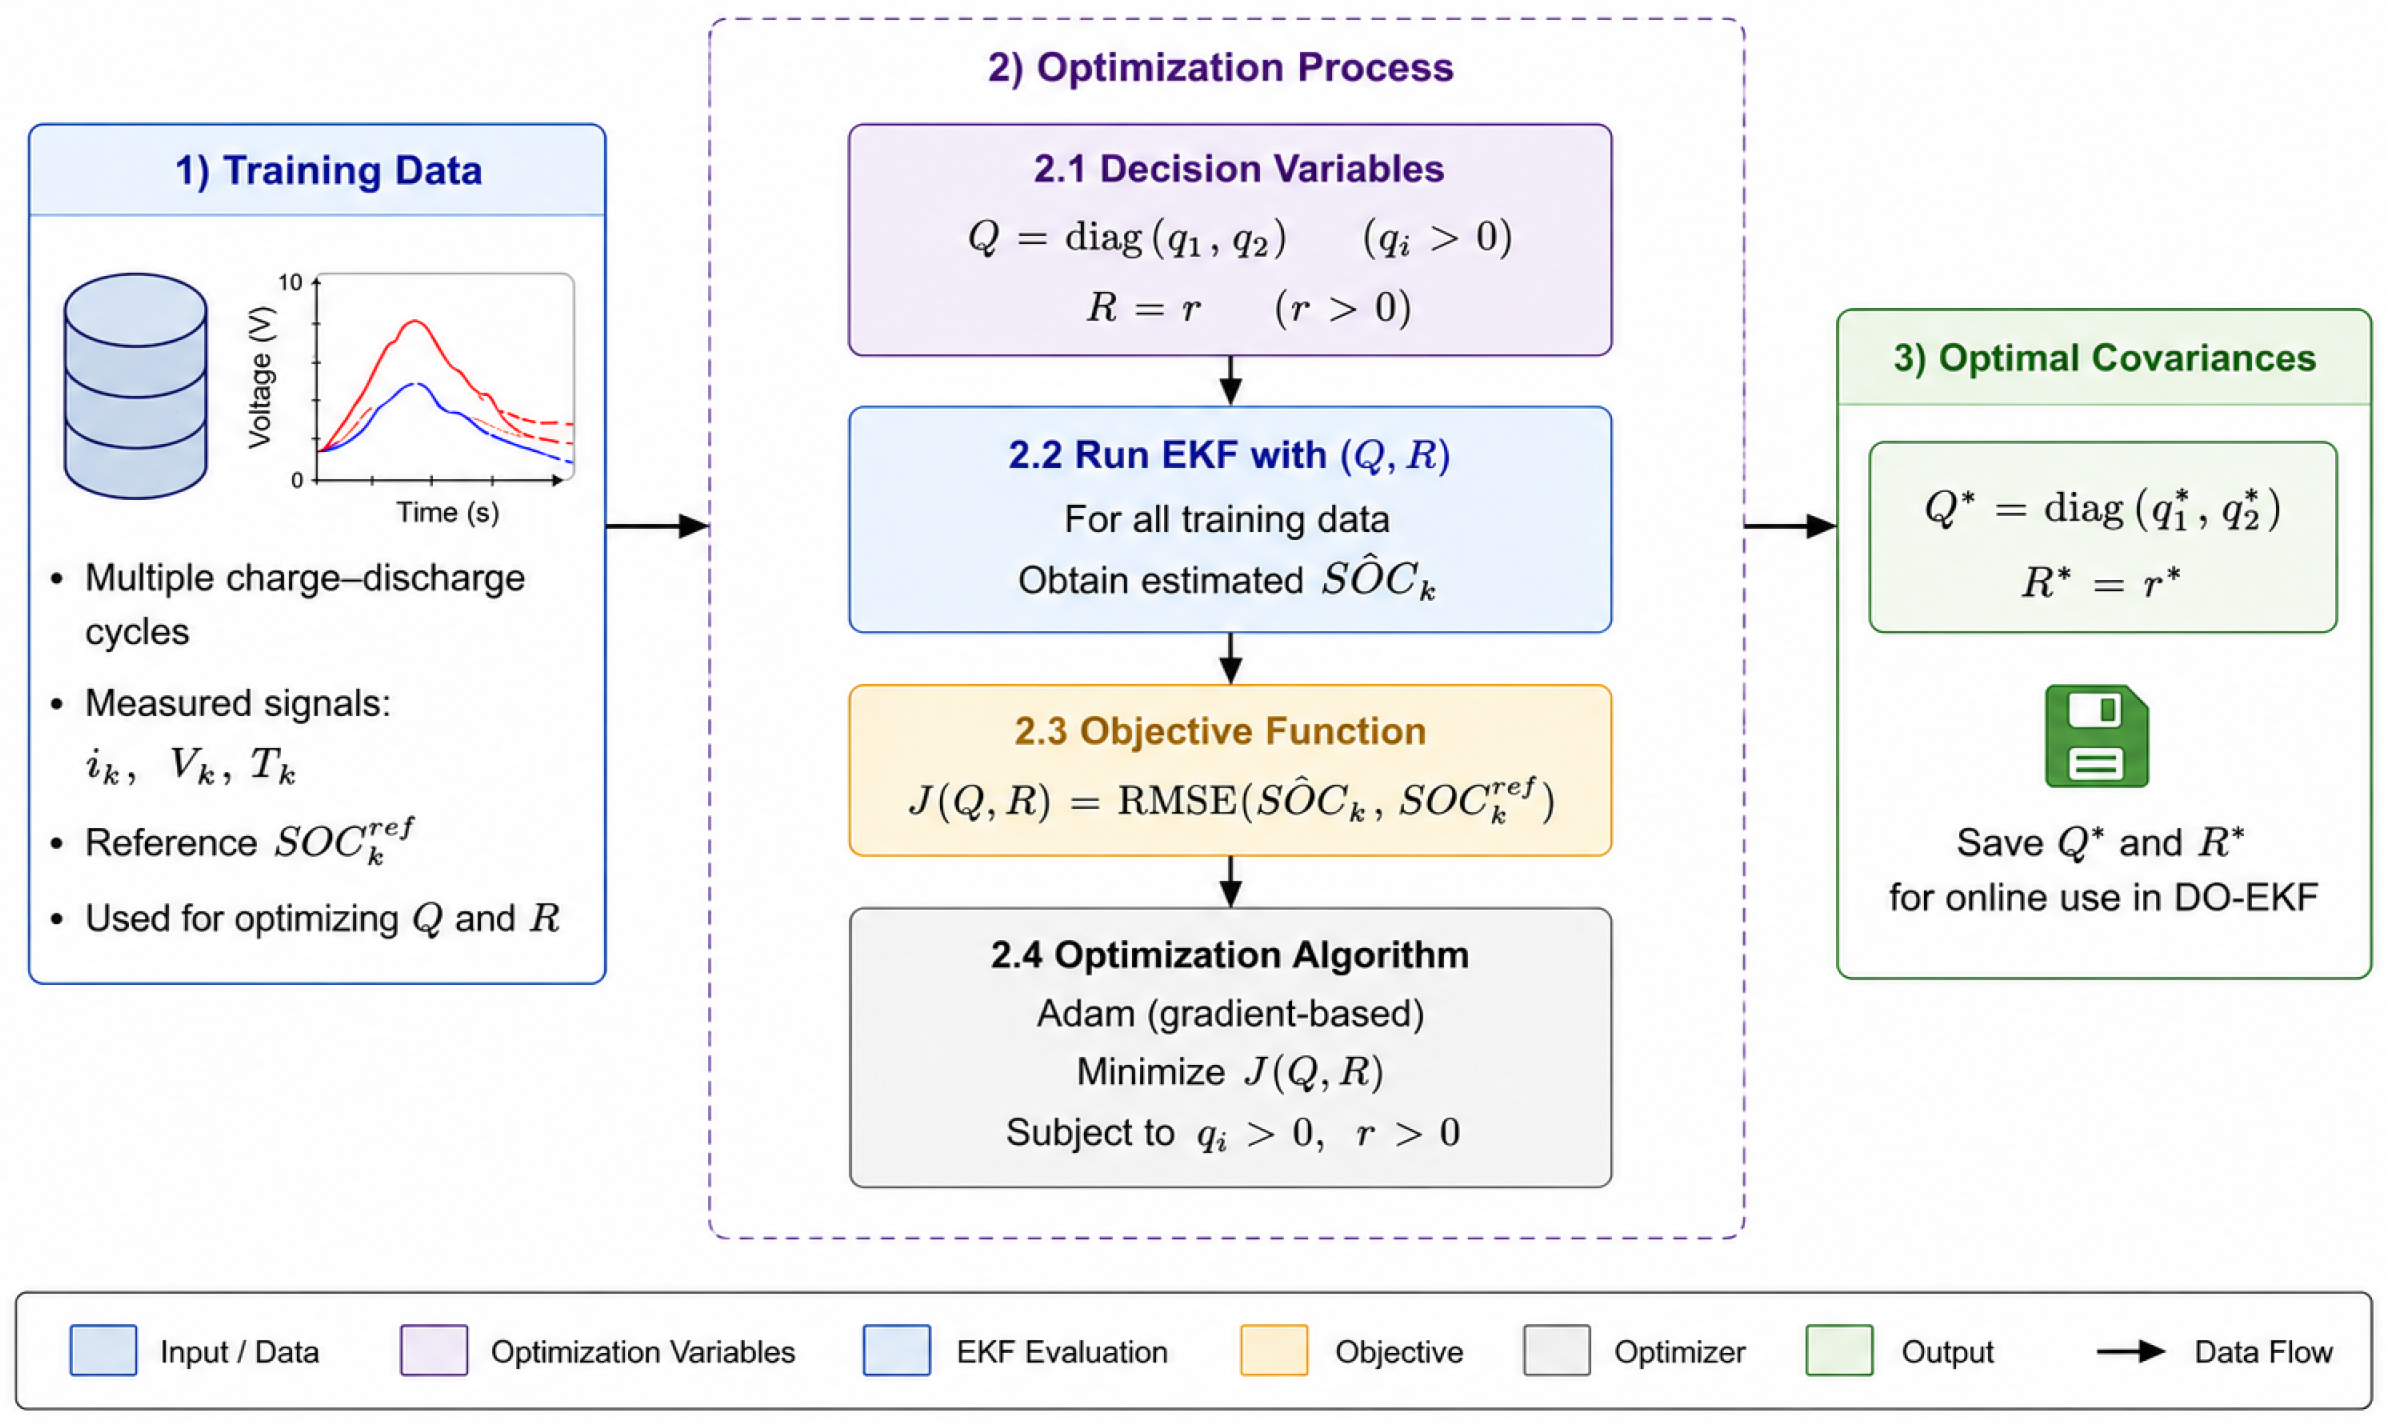
. In the proposed DO-EKF, these covariance parameters are optimized offline using the training scenarios and subsequently fixed during inference. As illustrated in
Figure 5, the optimization procedure searches for the covariance parameters that minimize the SOC estimation error on the training data. The parameters are optimized in the logarithmic domain to ensure positive values during the optimization process, as follows:
The covariance matrices were then obtained from
and
The initial optimization vector was set to . For each optimization iteration, the SOC estimation error was evaluated over the selected training scenarios. The gradient of the objective function with respect to each element of was estimated using a forward finite-difference approximation with a perturbation of .
The covariance parameters were updated using an Adam-type optimization scheme with a learning rate of , , , and . A maximum of 160 optimization epochs was allowed. The optimized parameters were evaluated using an independent validation subset after each epoch, and the parameter set producing the lowest validation RMSE was retained. Early stopping was applied when the validation RMSE did not improve by more than for 25 consecutive epochs.
The optimized covariance matrices obtained from the reported experiment were subsequently fixed and used during the DO-EKF inference stage. The resulting optimal covariance parameters obtained from the training process for the synthetic and NASA PCoE experiments are provided in
Appendix F.
Figure 5.
Optimization workflow of the process-noise covariance matrix and the measurement-noise covariance matrix for the DO-EKF.
Figure 5.
Optimization workflow of the process-noise covariance matrix and the measurement-noise covariance matrix for the DO-EKF.
2.3.3. Proposed DO-EKF Residual Learning Network
The proposed DO-EKFRes framework consists of two sequential stages. The first stage employs the Data-Optimized Extended Kalman Filter (DO-EKF) to provide a physics-based SOC estimate, whereas the second stage utilizes a Bidirectional Long Short-Term Memory (BiLSTM) network to compensate for the residual estimation error.
The DO-EKF is obtained by first optimizing the process and measurement-noise covariance matrices,
and
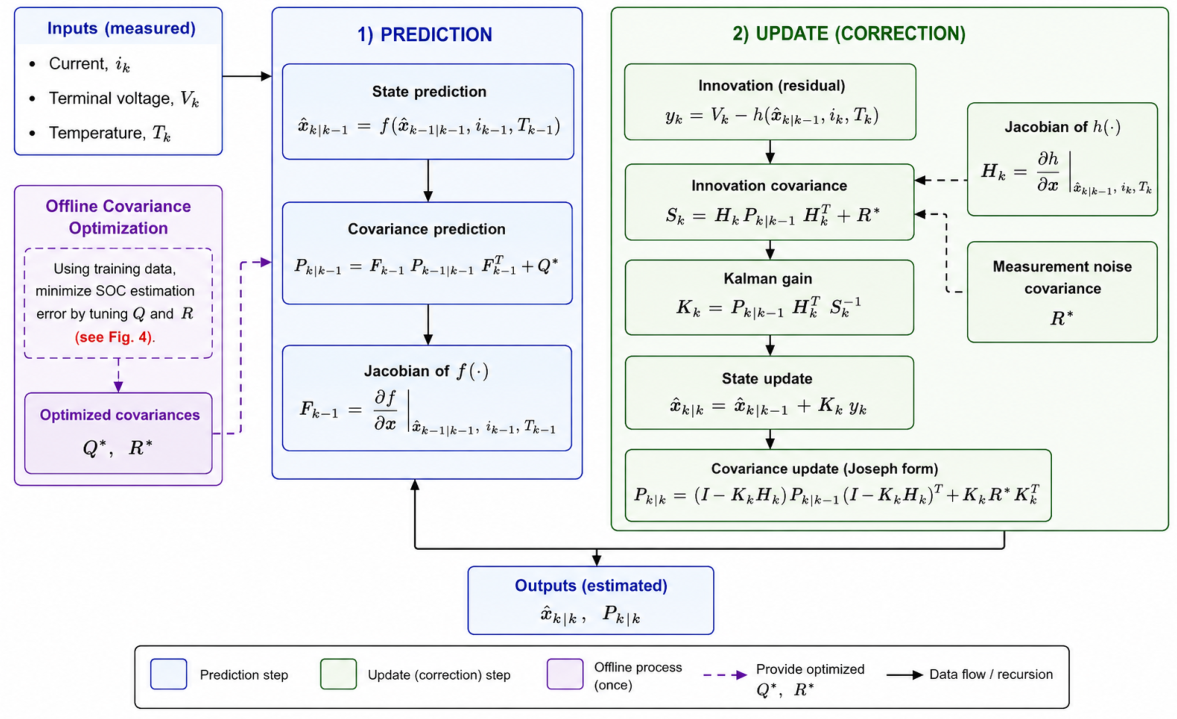
, using the training data. Following this offline optimization, the EKF operates with the optimized covariance matrices without further online covariance adaptation. The resulting estimator is referred to as DO-EKF. The overall workflow of the proposed DO-EKF is illustrated in
Figure 6.
As illustrated in
Figure 6, the optimized covariance matrices
and
are first obtained offline by minimizing the SOC estimation error. During online operation, the measured current, terminal voltage, and temperature are used in the prediction and correction steps of the EKF. The predicted state is corrected using the voltage innovation and the corresponding Kalman gain, after which the updated state and covariance are fed back to the next time step. The resulting SOC estimate is subsequently used as the input to the residual learning stage.
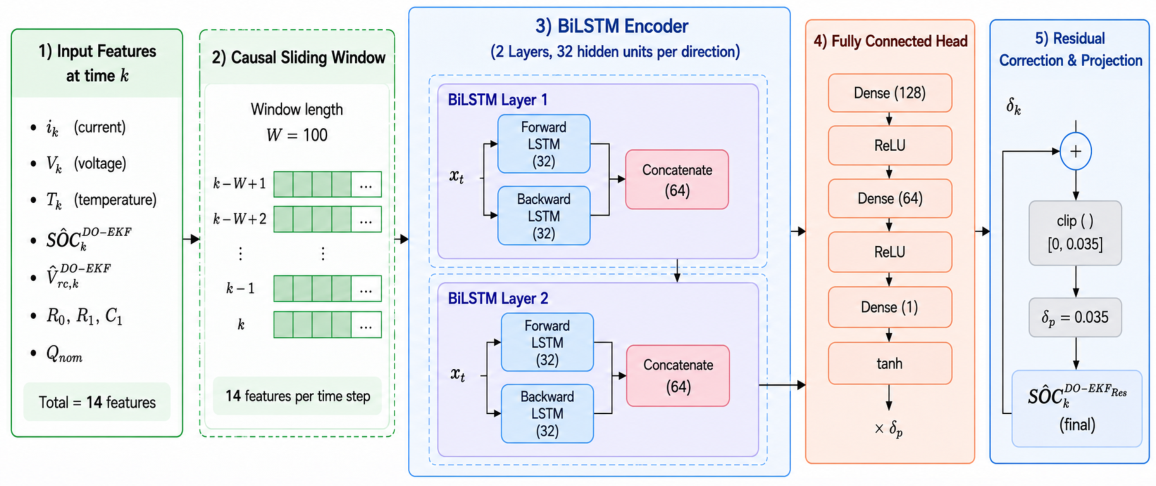
The residual learning stage is illustrated in
Figure 7. The residual network employs a two-layer BiLSTM architecture, with 32 hidden units in each direction, resulting in 64 features after forward–backward concatenation at each layer.
The output of the BiLSTM encoder is passed to a fully connected regression head consisting of Dense(128), ReLU, Dense(64), ReLU, and Dense(1) layers, followed by a hyperbolic tangent activation. The predicted residual is subsequently constrained using a clipping operation to ensure a physically valid correction range.
Regarding the BiLSTM hyperparameters, a sliding-window length of 100 samples and a learning rate of
were selected. It is important to highlight that the BiLSTM architecture and key hyperparameters were determined through sensitivity analysis using ablation experiments. The selected configuration provided near-optimal estimation accuracy without introducing unnecessary computational complexity. Further details of the ablation experiments are provided in
Appendix E. The results also show that the performance variations across the tested configurations are relatively small, indicating that the proposed residual learning framework is not highly sensitive to moderate changes in these hyperparameters.
For training the selected BiLSTM, the network receives a causal sequence of battery-related features and learns the residual between the DO-EKF estimate and the reference SOC. The input at each time step consists of 14 features, including the measured current, terminal voltage, temperature, DO-EKF SOC estimate, DO-EKF RC-voltage estimate, battery model parameters, and nominal capacity. The complete set of input features is listed and described in
Appendix B.
SOH is calculated causally for each discharge cycle using the capacity of the most recently completed cycle:
denotes the State of Health used as an input for cycle c, is the capacity of the most recently completed discharge cycle, and is the nominal battery capacity.
The residual target is defined as the difference between the reference SOC and the corresponding DO-EKF estimate,
where
denotes the reference SOC and
is the SOC estimated by the DO-EKF. Consequently, the BiLSTM is trained to learn the remaining estimation error that cannot be captured by the model-based estimator. To exploit the temporal dependency of battery dynamics, a sliding window of length
L is constructed for each sampling instant,
where
denotes the 14-dimensional feature vector at time step
k. The resulting feature sequence is processed by BiLSTM network to identify the most informative temporal features for residual estimation [
36,
38,
39]. The predicted residual correction is subsequently added to the DO-EKF estimate to obtain the final SOC estimate as shown in Equation (
22), where
denotes the residual correction predicted by the BiLSTM network.
For BiLSTM a maximum of 60 training epochs was used. The learning rate was adaptively reduced using a ReduceLROnPlateau scheduler with a patience of 5 epochs, a reduction factor of 0.5, and a minimum learning rate of . Early stopping was applied based on the validation residual RMSE with a patience of 15 epochs, and the model state corresponding to the lowest validation residual RMSE was retained for subsequent evaluation.
This hybrid formulation preserves the physical consistency of the DO-EKF while compensating for the remaining nonlinear modeling errors through data-driven residual learning. The bidirectional structure allows the network to capture temporal dependencies from both directions within the available window, while the attention mechanism emphasizes the most informative time steps for residual estimation. Therefore, the network focuses on learning the structured error remaining after model-based filtering rather than relearning the complete nonlinear mapping between battery measurements and SOC. This residual learning formulation is also consistent with recent studies that have demonstrated the effectiveness of BiLSTM-based and hybrid deep learning architectures for battery SOC estimation [
14]. Compared with a conventional unidirectional LSTM or GRU, the selected architecture provides a suitable representation for the window-based residual correction task.
In the same context, Transformer-based architectures provide an alternative mechanism for modeling long-range dependencies and have recently been applied to battery SOC estimation [
32]; however, their higher architectural complexity is not necessary for the relatively short, fixed-length residual windows considered in this study. Accordingly, BiLSTM with attention was selected as a compact temporal residual correction model that complements the model-based DO-EKF rather than replacing it.
2.4. Evaluation Performance
To quantitatively compare all evaluated frameworks, the estimation accuracy was assessed using the root mean square error (RMSE) and mean absolute error (MAE), defined as follows:
where
N denotes the total number of samples,
is the estimated SOC, and
is the corresponding reference SOC. RMSE is more sensitive to large estimation errors, whereas MAE provides the average magnitude of the estimation error.
For LOBO evaluation, the cycle-level RMSE is first averaged over all available discharge cycles for each held-out battery
b:
where
denotes the number of evaluated discharge cycles for battery
b. The final LOBO performance is then obtained using a battery-level macro-average:
where
is the number of batteries included in the LOBO evaluation. Thus, each battery contributes equally to the final aggregated result, independent of its number of available cycles.
2.5. Comparative Performance Analysis
A statistical analysis was conducted to evaluate the significance of the performance differences among the proposed DO-EKF
Res, DO-EKF, and standard EKF under the synthetic Monte Carlo benchmark. Following established best practices for statistical comparison of algorithms [
40], the Friedman test was first performed to determine whether statistically significant differences existed among the three estimation methods [
41]. Kendall’s coefficient of concordance (
W) was subsequently computed to quantify the degree of agreement among the model rankings across validation scenarios [
42,
43].
To identify specific differences between methods, post hoc pairwise comparisons were performed using the Wilcoxon signed-rank test [
44,
45]. To control the family-wise error rate arising from multiple comparisons, the Holm–Bonferroni correction was applied to the resulting
p-values [
46,
47]. Furthermore, the matched-pairs rank-biserial correlation (
) was reported to quantify the effect size of each pairwise comparison, providing a robust and interpretable measure of the magnitude of the observed performance differences [
48].
For the NASA LOBO evaluation, only four battery cells were available for validation, limiting the statistical power of the pairwise comparisons. Therefore, the NASA results are discussed primarily to demonstrate the generalization capability of the proposed framework on real-world battery data under the LOBO protocol, whereas the inferential statistical analysis is based on the synthetic Monte Carlo experiments.
3. Results and Discussion
3.1. Synthetic Monte Carlo Evaluation
The proposed DO-EKFRes framework was first evaluated using 30 independent Monte Carlo validation scenarios generated under controlled model mismatch and measurement uncertainty.
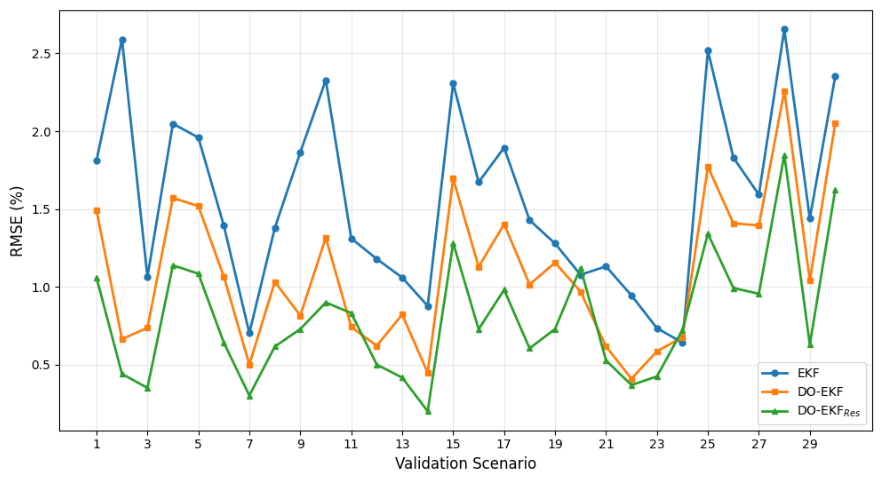
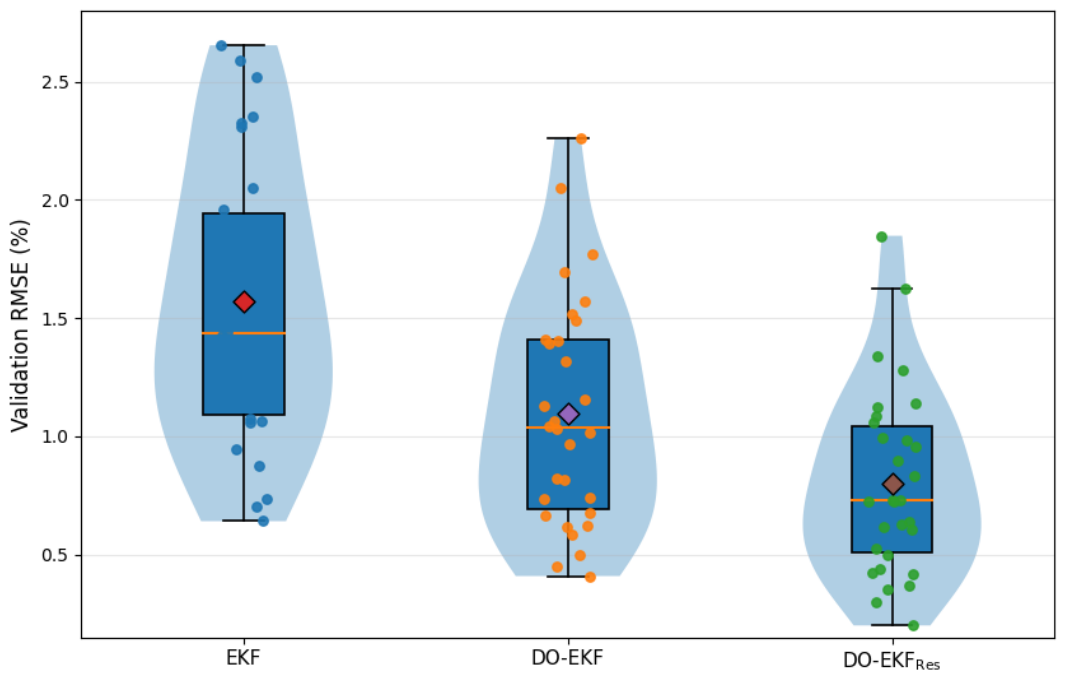
Figure 8 presents the RMSE obtained for each validation scenario using the EKF, DO-EKF, and the proposed DO-EKF
Res. Across the 30 validation Monte Carlo scenarios, the EKF exhibited the largest estimation errors due to the intentionally introduced mismatch between the estimator model and the true battery dynamics. Offline optimization of the process and measurement-noise covariance matrices consistently produced a more compact RMSE distribution, demonstrating that appropriate covariance selection enhances the EKF under modeling uncertainties. However, residual errors remained because the ECM cannot fully represent the nonlinear battery behavior.
The proposed DO-EKF
Res further reduced the estimation error across nearly all validation scenarios while exhibiting the narrowest RMSE distribution. By learning the residual estimation error from temporal battery measurements and filter states, the BiLSTM effectively compensated for the systematic nonlinear modeling errors that remained after offline covariance optimization. As shown in
Figure 9, the proposed framework achieved not only the lowest mean and median RMSE but also the smallest performance variability, indicating more accurate and robust SOC estimation under diverse operating conditions.
Quantitatively, the proposed DO-EKF
Res achieved the lowest average RMSE of 0.803%, compared with 1.569% for the conventional EKF and 1.097% for the covariance-optimized DO-EKF, as illustrated in
Table 1. This corresponds to RMSE reductions of 48.8% and 26.8%, respectively. The proposed framework also achieved the lowest MAE of 0.715%, compared with 1.362% for EKF and 1.002% for DO-EKF. These results demonstrate that the residual learning stage improves both the average estimation accuracy and the robustness of SOC estimation across the validation scenarios.
3.2. NASA PCoE Dataset Evaluation
The NASA PCoE dataset was further used to evaluate the generalization capability of the proposed framework under a leave-one-battery-out (LOBO) evaluation. The composition of the dataset is detailed in
Table 2. As summarized in
Table 3, the proposed DO-EKF
Res consistently achieved the lowest RMSE and MAE across all four held-out batteries. The macro-averaged RMSE decreased from 22.727% for the conventional EKF to 12.770% for DO-EKF and further to 11.534% for the proposed DO-EKF
Res.
Compared with the conventional EKF, the proposed framework reduced the macro-averaged RMSE by 49.25%. More importantly, the residual learning stage provided a further 9.68% reduction in RMSE relative to the covariance-optimized DO-EKF. The improvement was consistent across all four held-out batteries, with RMSE reductions of 10.75%, 7.42%, 11.30%, and 10.34% over DO-EKF for B0005, B0006, B0007, and B0018, respectively.
The battery-wise results also demonstrate that the proposed framework maintained its advantage under different battery-specific operating conditions. For example, the RMSE of B0005 decreased from 21.645% with EKF to 11.554% with DO-EKF and 10.312% with DO-EKFRes. Similarly, for B0006, the corresponding RMSE values were 26.979%, 16.795%, and 15.549%. Comparable improvements were obtained for B0007 and B0018. These results indicate that the residual BiLSTM correction provides an additional benefit beyond covariance optimization and improves the generalization of the model-based estimator to previously unseen battery cells.
The performance of the proposed DO-EKFRes on the synthetic dataset differs from that observed on the unseen NASA batteries, which can be attributed to the different data characteristics and operating conditions of the two evaluation settings. Nevertheless, the smaller but consistent improvement observed across the unseen NASA batteries suggests that the residual learning stage provides a complementary correction under cross-battery generalization, rather than being restricted to the controlled synthetic model-mismatch conditions.
From another perspective, compared with previous LOBO study [
49], the proposed DO-EKF
Res consistently achieves lower RMSE across all evaluated test batteries. While the previous framework focused on improving the quality of the input signals through wavelet denoising prior to machine learning, the present work extends this line of research by improving the estimation process through data-driven covariance optimization followed by residual error learning. These methodological enhancements contribute to improved cross-battery generalization under the same LOBO evaluation protocol.
3.3. Comparative Evaluation with Adaptive SOC Estimation Methods
To further assess the practical significance of the proposed framework, its performance was compared with representative adaptive and machine-learning-based SOC estimation methods under identical synthetic dataset.
The comparison included the conventional EKF, the proposed covariance-optimized DO-EKF, the proposed DO-EKF
Res, the multi-input extreme learning machine (MI-ELM) method, and the Sage–Husa adaptive extended Kalman filter (Sage–Husa AEKF) [
20,
22]. All methods were evaluated using the same 30 synthetic validation scenarios, providing a consistent basis for quantitative and statistical comparison, based on that the outcome values maybe not the same outcome reported in previous works [
20,
22].
As summarized in
Table 4, the proposed DO-EKF
Res achieved the lowest RMSE and MAE among all five evaluated methods. The proposed framework achieved lower RMSE than MI-ELM and Sage–Husa AEKF, which obtained 1.271% and 3.981%, respectively. The corresponding RMSE reductions were 36.8% relative to MI-ELM and 79.8% relative to Sage–Husa AEKF. These results demonstrate that the proposed residual correction provides a substantial improvement over both the model-based benchmarks and the representative adaptive and machine-learning-based methods.
Furthermore, the five-way Friedman test confirmed a statistically significant difference among the evaluated methods (
,
). As reported in
Table 4, DO-EKF
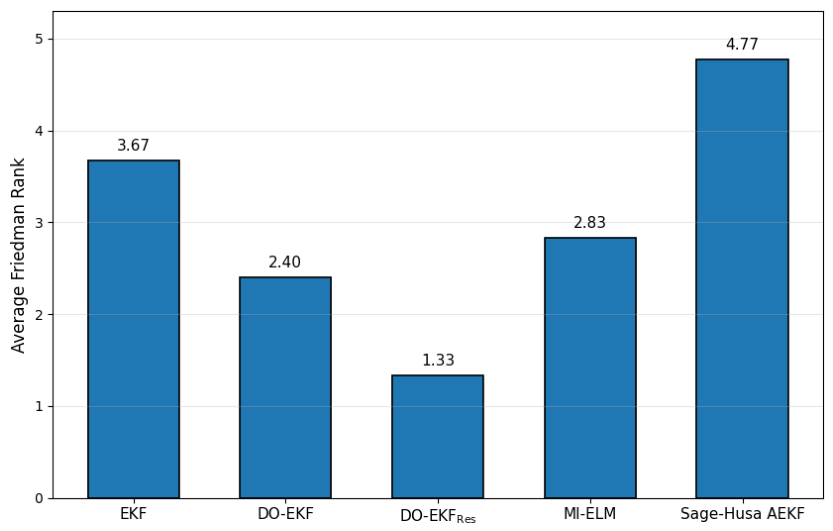
Res achieved the lowest average rank of 1.33, followed by DO-EKF (2.40), MI-ELM (2.83), EKF (3.67), and Sage–Husa AEKF (4.77). The lowest Friedman rank of the proposed framework indicates that it provided the most consistent overall performance across the 30 validation scenarios.
To further assess the pairwise differences, Wilcoxon signed-rank tests with Holm correction were performed between DO-EKF
Res and each benchmark method. The results are summarized in
Table 5. The proposed framework significantly outperformed EKF, DO-EKF, MI-ELM, and Sage–Husa AEKF, with Holm-adjusted
p-values below 0.001 in all four comparisons. The corresponding rank-biserial effect sizes were large (
), indicating that the observed differences were associated with substantial effect sizes.
The statistical results provide further evidence that the improvement introduced by the residual learning stage is not limited to a difference in average RMSE. In particular, the comparison between DO-EKF and DO-EKFRes yielded a large rank-biserial effect size () with a Holm-adjusted p-value of . This result demonstrates that the BiLSTM residual-correction stage provides a statistically significant improvement beyond the covariance optimization performed by the DO-EKF. The significant improvement over MI-ELM and Sage–Husa AEKF further indicates that the proposed sequential model-based and residual learning formulation provides a competitive alternative to representative adaptive and machine-learning-based SOC estimation methods.
Figure 10 further illustrates the average Friedman ranking of the five evaluated SOC estimation methods. DO-EKF
Res achieves the lowest average rank of 1.33, followed by DO-EKF (2.40), MI-ELM (2.83), EKF (3.67), and Sage–Husa AEKF (4.77). This ranking is consistent with the RMSE and MAE results presented in
Table 4 and further supports the robustness of the proposed framework across the synthetic validation scenarios.
3.4. Online Computational Complexity
The measured online computational cost is summarized in
Table 6. The proposed DO-EKF
Res required an average of 84.163 ms per validation scenario, corresponding to 93.515 μs per processed sample. This additional computational cost is mainly associated with the forward propagation of the BiLSTM and attention mechanism over the fixed-length temporal window. In comparison, the MI-ELM required 2.975 ms per scenario, whereas the conventional EKF and Sage–Husa AEKF required 1565.792 ms and 1416.563 ms, respectively.
From another side, the DO-EKF covariance optimization required 2461.557 s offline, whereas the residual BiLSTM required 72.465 s for training. These operations are performed offline and are therefore not included in the reported online inference time. Consequently, the measured 84.163 ms per scenario represents the online inference cost of the complete DO-EKFRes framework, including the model-based filtering and residual correction stages.
From a practical BMS perspective, the proposed framework provides a trade-off between estimation accuracy and online computational cost. The physics-based DO-EKF remains the primary SOC estimator, while the residual BiLSTM processes only the remaining estimation error within a fixed-length temporal window. This sequential formulation avoids replacing the complete model-based estimator with a computationally intensive end-to-end deep learning model, while providing substantial improvements in estimation accuracy. The measured online computational cost and the offline training strategy support the feasibility of the proposed framework for resource-constrained BMS applications, subject to the computational resources of the target embedded platform.
4. Conclusions
This study proposed a hybrid SOC estimation framework, termed DO-EKFRes, which combines offline covariance optimization with BiLSTM-based residual learning. The proposed framework preserves the recursive structure of the EKF while compensating for the remaining nonlinear estimation errors through residual correction, thereby improving estimation accuracy without increasing the online computational complexity. Furthermore, DO-EKFRes consistently outperformed the EKF, the DO-EKF, and representative adaptive filtering methods. The experimental results demonstrated RMSE reductions of up to 16.68% and 49.2% on the synthetic and NASA datasets, respectively, while statistical analyses confirmed that these improvements were both statistically and practically significant.
The main significance of the proposed framework lies in the sequential integration of covariance-optimized model-based filtering with residual deep learning, where the BiLSTM learns the remaining structured estimation error rather than relearning the complete SOC mapping. From a practical BMS perspective, the proposed framework eliminates the need for online covariance adaptation by transferring the optimization process to an offline stage. Consequently, it maintains a lightweight recursive estimator suitable for resource-constrained embedded battery management systems while providing improved estimation robustness and cross-battery generalization. Despite these promising results, two limitations should be acknowledged. First, the synthetic experiments provide controlled and reproducible evaluation but may not fully capture the complexity of real-world battery operating conditions. Second, although the NASA PCoE dataset enables cross-battery validation through the LOBO protocol, additional datasets covering different battery chemistries and operating conditions would further strengthen the assessment of generalization capability. These limitations will be addressed in future work through broader experimental validation under varying temperature, aging, and operating conditions, together with evaluation on additional battery datasets and real-time BMS platforms.




 ,
,