Article

Optimal Scheduling of Interconnected Multi-Carrier Energy Hubs with Multi-Type Energy Storage, Demand Response, and Electric Vehicles

Department of Electrical and Computer Engineering, Hakim Sabzevari University, Sabzevar 9617976487, Iran
*
Author to whom correspondence should be addressed.
World Electr. Veh. J. 2026, 17(9), 436; https://doi.org/10.3390/wevj17090436 (registering DOI)
Submission received: 28 July 2026 / Revised: 20 August 2026 / Accepted: 21 August 2026 / Published: 23 August 2026
(This article belongs to the Section Storage Systems)

Abstract

The coordinated operation of interconnected multi-carrier energy hubs is a key enabler of cost-efficient and flexible energy management in modern smart cities. This paper develops a comprehensive optimization framework for the day-ahead scheduling of interconnected energy hubs in residential and commercial sectors. The problem is formulated as a mixed-integer linear programming (MILP) model that jointly manages electricity, natural gas, and thermal energy flows. To enhance operational flexibility, the proposed model incorporates demand response programs for both electrical and thermal loads, multiple energy storage technologies, and electric vehicles with vehicle-to-grid (V2G) capability. Six operating scenarios are defined to assess the impact of different resources and coordination levels, ranging from independent hub operation to fully integrated interconnected scheduling. Simulation results show that coordinated operation of the energy hubs, supported by flexible loads, storage systems, and electric vehicles, can significantly reduce total daily operating costs compared with conventional standalone configurations. The findings confirm that energy exchange among hubs, combined with demand-side flexibility and EV participation, improves both economic performance and system efficiency. The proposed framework offers a scalable scheduling approach for future integrated multi-energy systems.

1. Introduction

1.1. Motivation

Interconnected energy hubs (EHs) have emerged as an effective framework for coordinating multiple energy carriers within integrated energy systems [1]. By enabling the conversion, storage, and distribution of electricity, natural gas, and thermal energy through a unified operational structure, EHs can improve resource utilization, enhance supply reliability, and reduce overall operating costs. These advantages become more pronounced when multiple hubs operate in an interconnected manner, since energy can be exchanged among neighboring hubs to compensate for local shortages and to make better use of locally available surpluses [2,3]. Such a coordinated structure is particularly attractive in residential and commercial energy districts, where electricity and thermal demand profiles differ significantly over time and operating conditions change continuously throughout the day. Under these circumstances, conventional supply-oriented energy management strategies are often not sufficient to ensure both economic efficiency and operational reliability. The presence of multiple energy carriers, diverse load patterns, and time-varying system conditions requires a more flexible scheduling framework capable of coordinating both supply and demand sides. In this regard, local flexibility resources can play a key role in improving system performance. Electrical and thermal energy storage systems provide temporal flexibility by storing energy during low-demand periods and releasing it during peak hours [4,5]. Demand response programs further enhance this capability by shifting controllable loads according to system requirements, while electric vehicles with vehicle-to-grid (V2G) capability can act as mobile storage resources and support the electricity balance when needed [6].
Therefore, the coordinated scheduling of interconnected EHs enriched with storage systems, responsive loads, and EVs offers a promising solution for the future operation of multi-energy systems. Such coordination can improve the balance among different energy carriers, reduce dependence on external energy procurement, and enhance the overall economic performance of the system.

1.2. State of the Art and Research Gap

Several researchers have investigated the benefits of interconnecting multiple energy hubs to improve reliability and reduce operational costs through energy sharing. These studies demonstrate that inter-hub exchange can compensate for local shortages and optimize the use of conversion units.
Early research in this area mainly focused on demonstrating the benefits of energy hub interconnection and establishing suitable modeling frameworks for representing multi-energy interactions. As the concept of interconnected hubs matured, subsequent studies gradually shifted from structural analysis toward operational optimization and coordinated energy management.
The operation of energy hubs has been widely modeled through mixed-integer linear programming, mainly because this framework offers enough flexibility to represent both continuous energy flows and discrete operational decisions within a unified optimization structure [7]. On this basis, early efforts gradually moved from the analysis of standalone hubs toward interconnected configurations. A notable step in this direction was taken in [8], where series and parallel arrangements of multiple energy hubs were examined through a generalized framework based on coupling matrices. Rather than focusing only on cost, that study also introduced several performance indicators to compare different interconnection structures from the viewpoints of reliability and energy delivery. This line of work was further extended in [9], which shifted attention from structural representation to actual operational coordination by proposing a decentralized energy management strategy for interconnected hubs. The results suggested that coordinated energy exchange among neighboring hubs can improve the overall economic behavior of the system, even when each hub retains a certain degree of local autonomy.
However, improving coordination between hubs alone does not guarantee maximum utilization of available flexibility. This limitation encouraged researchers to investigate internal flexibility sources within each hub, particularly through demand-side management and responsive energy consumption.
As research in this area evolved, it became increasingly clear that inter-hub coordination alone could not fully capture the flexibility potential of modern energy systems. Part of that flexibility lies on the demand side, particularly when consumers are allowed to respond to prices, incentives, or operating conditions. From this perspective, ref. [10] introduced an energy management strategy that strengthened the interaction between smart energy hubs and end users in an integrated energy environment. This development opened the way for a broader stream of studies in which demand response was no longer treated as an external feature, but as an active component of hub scheduling. In [11], for example, the role of flexible demand was linked to service continuity, with electric vehicle charging stations and storage devices being managed in a way that reduces load shedding. A similar concern appears in [12], where an integrated hub including converters, CHP units, thermal and electrical storage, and EV charging stations was operated under uncertainty. The analysis there was not limited to deterministic scheduling, but examined how uncertain conditions affect both operating cost and supply adequacy across several scenarios.
Following the integration of demand-side flexibility, research efforts expanded toward a broader representation of energy flexibility by combining multiple conversion technologies, storage systems, and controllable resources within the same scheduling framework.
The literature then moved toward richer representations of flexibility, especially through the integration of conversion technologies, storage options, and responsive loads. In [13], the incorporation of power-to-gas and tri-state compressed air energy storage into the energy hub structure reflected this broader view of flexibility. What makes that study particularly relevant is that these technologies were not examined in isolation; instead, they were coordinated with shiftable demand response to alleviate the impact of uncertainty in renewable generation and multi-carrier demand. A closely related idea was pursued in [14], where responsive load scheduling was directly coordinated with hub operation and energy price signals. Taken together, these studies indicate that flexibility in energy hubs is gradually being redefined as a joint outcome of supply-side conversion, storage behavior, and demand participation, rather than a feature attributed to a single technology.
Despite these advances, deterministic scheduling approaches may not fully capture the operational challenges of real energy systems, where renewable generation, demand behavior, and market conditions are inherently variable.
This transition naturally led to greater interest in uncertainty-aware and robust scheduling models. In [15], a robust planning framework was developed for integrated energy hubs supplying electricity, heating, and cooling, with explicit attention given to uncertain electricity prices, renewable generation, and demand levels. The same concern for realistic operating conditions can be seen in [16], where demand response, renewable resources, storage systems, and electric vehicles were brought together in one integrated model. By using Monte Carlo simulation to represent uncertainty in wind and photovoltaic generation, load, and market prices, that study moved closer to the complexity of actual multi-energy environments. The role of coordinated operation became even more pronounced in [17], which examined two interconnected energy hubs while simultaneously considering three energy carriers, thermal and electrical loads, and two forms of storage. In [18], the emphasis returned to operating cost minimization, but within a system that also included photovoltaic generation, electric vehicles, storage technologies, and CHP units. Although these studies differ in scope and formulation, they collectively show a clear shift from simplified hub representations toward more operationally realistic and flexibility-oriented models.
In parallel with uncertainty-aware modeling, another research direction has emphasized the role of emerging flexibility assets, particularly electric vehicles and advanced storage technologies, as active participants in energy management rather than passive components.
A parallel development in the literature has been the growing recognition of electric vehicles and storage systems as strategic flexibility resources rather than peripheral components. This is particularly visible in [19], where electric vehicle charging stations were modeled as responsive demand-side assets capable of supporting the load during peak periods and reducing outage-related costs. By also considering converter outage conditions, that work highlighted the contribution of EV-based flexibility not only in normal operation but also under contingency states. A broader multi-objective perspective was later adopted in [20], where the scheduling of renewable energy hubs was formulated with simultaneous attention to cost, emissions, energy loss, unmet demand, and reliability. In that framework, both stationary and mobile storage resources were coordinated across coupled electrical and thermal networks, illustrating how storage can serve economic, environmental, and reliability objectives at the same time. The coordination problem was further expanded in [21], which proposed a two-layer management structure linking hub-level scheduling decisions with upstream grid interactions in day-ahead and real-time markets. Meanwhile, ref. [22] contributed from a data-driven uncertainty standpoint by showing that KDE-based modeling of uncertain variables can provide more realistic estimates of operating cost and risk than conventional Gaussian assumptions in PV-battery hub scheduling.
Building upon these individual developments, recent research has increasingly attempted to combine multiple flexibility mechanisms and address the interactions among different energy carriers within more comprehensive frameworks.
More recent studies have attempted to capture the full complexity of interconnected multi-carrier systems under uncertainty. In [23], a stochastic optimization model was presented for multi-carrier energy hubs coordinating electricity, gas, and water while also considering uncertain renewable generation, EV parking lot behavior, and variable multi-energy demand. By allowing electricity trading both among hubs and with the upstream grid, the study moved beyond isolated hub operation and toward a more networked energy management perspective. The integration of hydrogen vehicles and EVs also reflected a growing interest in cleaner and more flexible transport-energy coupling. A similarly comprehensive direction can be seen in [24], where coordinated scheduling across electricity, natural gas, and district heating networks was strengthened through the joint use of storage systems and incentive-based demand response. That study made it clear that flexibility becomes substantially more valuable when different carriers and responsive resources are scheduled together rather than separately. Finally, ref. [25] developed a robust optimization framework for energy hub scheduling in the presence of renewable resources while jointly considering heating, cooling, and electrical storage. The resulting MINLP formulation offered a more detailed representation of nonlinear operational behavior and binary decision-making, indicating the methodological maturity the field has reached in recent years.
Even so, a closer reading of the literature suggests that these advances have not yet been fully integrated into a single framework. Many studies concentrate on one or two dimensions of the problem—such as inter-hub coordination, demand response, storage, uncertainty, or electric vehicles—without combining them in a sufficiently comprehensive way. This becomes particularly important in interconnected multi-carrier systems, where the value of one flexibility option often depends on how effectively it is coordinated with the others.
To clarify the methodological position of the proposed framework, a comparative analysis with representative energy hub scheduling studies is provided in Table 1. The comparison focuses on the simultaneous consideration of interconnected energy hubs, multi-carrier energy management, electrical and thermal demand response, energy storage technologies, EV/V2G integration, and scenario-based evaluation. Although previous studies have investigated several of these flexibility resources individually or in partial combinations, the proposed framework emphasizes their coordinated operation and evaluates the incremental contribution of each flexibility layer through a structured scenario-based analysis.

1.3. Contribution

The literature on multi-carrier energy hubs has made clear progress, yet it still leaves an important practical question unanswered: how should inter-hub cooperation, demand-side flexibility, storage, and electric vehicles be coordinated in a single operational framework? In many studies, these elements appear side by side, but they are not actually integrated in a way that reflects the coupling among electricity, heat, and mobility. As a result, the scheduling model remains partial, and some of the available flexibility is left unused. This limitation is especially visible in interconnected hub systems. A number of papers consider energy exchange between hubs, but the exchange is often treated as an isolated feature rather than part of a broader flexibility strategy. In other words, the network connection is modeled, yet the internal response of each hub is simplified. The opposite also happens: detailed demand response or storage models are developed for a single hub, while the benefit of cooperation with a neighboring hub is ignored. That separation weakens both economic performance and supply adequacy.
Another weakness of the current literature is the uneven treatment of demand response. Most existing formulations focus on electrical load shifting, while thermal demand is usually assumed to be fixed or only loosely adjustable. This is a restrictive assumption for multi-carrier systems, because thermal loads also provide operational flexibility through their timing and magnitude. Ignoring that flexibility means the model cannot fully exploit the trade-off between electric and thermal supply resources, especially during high-price or high-demand periods. A further gap concerns the role of electric vehicles. EVs are often added as an auxiliary feature, but not coordinated carefully with stationary storage and hub-level dispatch decisions. In reality, EV charging and discharging can significantly affect both cost and reliability, particularly when the system faces load peaks or limited inter-hub transfer capability. If EVs are not scheduled alongside batteries, thermal storage, and DR actions, the overall optimization misses an important source of flexibility.
To address these shortcomings, this paper proposes an integrated optimization framework for interconnected multi-carrier energy hubs. The model combines bidirectional inter-hub exchange, electrical and thermal demand response, stationary electrical and thermal storage, and EV/V2G operation within one unified formulation. The main contributions are as follows:
  • Integrated inter-hub coordination: The model captures energy exchange between two heterogeneous hubs, namely a residential hub and a commercial hub, so that surplus energy in one hub can support the other when needed. This improves system reliability and reduces dependence on external supply.
  • Dual-carrier demand response modeling: Electrical and thermal demand response are both included in the scheduling problem. This allows the operator to shift not only electric loads, but also thermal consumption, making the dispatch more responsive to price variation and peak conditions.
  • Joint optimization of storage and EV/V2G: The proposed framework coordinates electrical storage, thermal storage, and electric vehicles in one optimization structure. EVs are not treated as an afterthought; they are part of the flexibility portfolio and participate in charging and discharging decisions alongside stationary resources.
  • Reliability-oriented objective formulation: The model explicitly accounts for unserved electricity and heat through VOLL-based penalties. This makes the optimization sensitive not only to operating cost, but also to supply adequacy, which is important when comparing scenarios with and without DR, exchange limits, and EV support.
  • Scenario-based performance assessment: Six operating scenarios are defined to isolate the effect of each flexibility layer. This makes it possible to quantify the marginal value of electrical DR, thermal DR, inter-hub exchange, and EV/V2G, both separately and in combination.


1.4. Paper Organization

The remainder of this paper is organized as follows. Section 2 introduces the mathematical formulation and optimization framework of the proposed approach. The configuration of the interconnected energy hub system is described in Section 3, while the simulation results and performance analysis are discussed in Section 4. Finally, the main conclusions and future research perspectives are summarized in Section 5.

2. Mathematical Formulation

The proposed model is formulated as a mixed-integer linear programming problem for the day-ahead scheduling of two interconnected energy hubs following the fundamental energy-hub concept introduced in [26]. The scheduling horizon is divided into hourly intervals, and the model determines the optimal procurement of electricity, gas, and heat, together with storage operation, demand response, inter-hub power exchange, and EV/V2G participation within an integrated multi-energy system framework [27].
Let i H denote the energy hub index, where H = R , C represents the residential and commercial hubs. The time index is denoted by t τ , where τ = { 1 , 2 , , 24 } .

2.1. Objective Function

The objective function is formulated to minimize the overall operational cost of the integrated energy hub system.
m i n   O F = C e n + C D R + C E V + C e x + C u n s
In (1), C e n   denotes the energy procurement cost, C D R represents the cost incurred by demand response programs, C E V corresponds to the operating cost of EV/V2G systems, C e x   indicates the cost of energy exchange between interconnected hubs, and C u n s refers to the penalty cost associated with unmet electrical and thermal demand.
The energy procurement cost can be expressed as:
C e n = t τ ( α t e   P t e + α t g   P t g + α t q   P t q )
where α t e , α t g , and α t q   represent the electricity, natural gas, and heat prices at time (t), respectively. The variables P t e , P t g , and P t q indicate the amounts of electricity, gas, and heat purchased from the upstream energy networks. This cost component incentivizes the optimization model to schedule energy consumption during lower-price periods by exploiting the flexibility of available energy resources.
The cost associated with the demand response program is formulated as:
C D R   =   t τ i H ( c D R e   S e , i , t   +   c D R q   S q , i , t )
In (3), S e , i , t   and S q , i , t denote the shifted electrical and thermal loads of hub (i), respectively, whereas c D R e and c D R q represent the corresponding demand response (DR) incentive or compensation coefficients. By assigning a cost to the utilization of demand-side flexibility, this term discourages excessive load shifting and promotes a balanced demand response strategy.
The operating cost associated with the EV/V2G system is expressed as:
C E V   = t τ c E V   ( P E V , t c h   +   P E V , t d i s )
where P E V , t c h and P E V , t d i s denote the charging and discharging power of the EV, respectively. The parameter c E V   represents the battery degradation cost or the participation cost associated with EV operation. By incorporating this cost component, the optimization model discourages unrealistic and excessively frequent charging and discharging cycles, thereby promoting more practical EV battery utilization.
The cost associated with electricity exchange among interconnected energy hubs is formulated as:
C e x   = t τ c e x   F t a b s
In this expression, F t a b s   denotes the absolute amount of electrical power exchanged between the two interconnected energy hubs, while c e x   represents the corresponding energy exchange cost coefficient. This cost component accounts for the expenses associated with inter-hub energy transfers, including transaction fees, network usage charges, and coordination costs.
The penalty cost associated with unserved energy demand is formulated as:
C u n s   =   t τ i H ( V O L L e   U e , i , t   +   V O L L q   U q , i , t )
where U e , i , t   and U q , i , t   denote the unserved electrical and thermal loads, respectively. The parameters V O L L e   and V O L L q   represent the values of lost load (VOLL) for electrical and thermal energy. As these coefficients are typically assigned high values, this penalty term strongly discourages load curtailment, allowing it only when it becomes economically justified or operationally unavoidable.

2.2. Energy Balance and Hub Coupling Constraints

For each energy hub, the electrical power balance requires that the electricity demand be met through a combination of purchased electricity, electricity generated via gas-to-electric conversion, energy storage operation, power exchange with neighboring hubs, demand response actions, EV/V2G operation, and, if necessary, unserved energy. This formulation is consistent with established optimal scheduling models for residential energy hubs [27].
L e , i , t = η e e P e , i , t + η g e P g , i , t + P e , i , t d i s P e , i , t c h + P i , t e x + U e , i , t + S e , i , t A e , i , t + δ i E V ( P E V , i , t d i s P E V , i , t c h )
In (7), P e , i , t   and P g , i , t denote the amounts of electricity and natural gas purchased by hub (i), respectively. The parameters η e e   and η g e represent the electricity-to-electricity and gas-to-electricity conversion efficiencies. The variables P e , i , t d i s and P e , i , t   c h correspond to the discharging and charging power of the electrical energy storage system. The variable P i , t e x   indicates the net electrical power exchanged by hub (i) with the interconnected hubs. Moreover, S e , i , t   and A e , i , t represent the shifted and advanced electrical loads resulting from demand response actions. Finally, P E V , i , t d i s   and P E V , i , t c h denote the power injected into the grid through V2G operation and the charging demand of the EV, respectively. This constraint guarantees that the electrical load L e , i , t is balanced and satisfied during every scheduling interval. δ i E V is a binary parameter indicating the hub to which the EV is connected. For example, δ i E V = 1 and δ i E V = 0.
The thermal energy balance constraint for each energy hub is expressed as:
η g q . P g , i , t +   η q q . P q , i , t + P q , i , t d i s P q , i , t c h + U q , i , t + S q , i , t A q , i , t = L q , i , t
In (8), P q , i , t denotes the amount of heat purchased by hub (i), while η g h   and η h h represent the gas-to-heat and heat-to-heat conversion efficiencies, respectively. The variables P q , i , t d i s   and P q , i , t c h   correspond to the discharging and charging power of the thermal energy storage system. In addition S q , i , t   and A q , i , t   denote the shifted and advanced thermal loads resulting from demand response actions, whereas U q , i , t   represents the unserved thermal demand. This constraint ensures that the thermal energy balance is maintained for each energy hub throughout the scheduling horizon.
In this study, the CHP unit is modeled as a dispatchable conversion device rather than an independent electricity and heat generation source. The electrical and thermal outputs of the CHP unit are simultaneously determined by the natural gas input and the corresponding conversion efficiencies. Therefore, the CHP production level is indirectly controlled through the natural gas consumption decision variable. The operational limitation of the CHP unit is implicitly represented by the upper bound imposed on the natural gas procurement variable, which prevents unrealistic CHP output levels while preserving the coupling between electrical and thermal energy production.
Although high VOLL values are assigned to unserved electrical and thermal energy in the objective function, load shedding may still occur under specific operating conditions. This is because unserved energy is retained as a penalty-based variable to preserve model feasibility when the available conversion units, storage systems, and inter-hub exchange capability are insufficient to fully satisfy the demand. Therefore, the occurrence of unserved demand does not result from economic preference, but from the operational limitations of the interconnected energy hub system.
The total electricity imported from the upstream grid is determined by the combined electricity purchases of the two energy hubs:
P t e   = i H P e , i , t
Here, P t e   represents the total electricity purchased at the system level, whereas P e , i , t   denotes the electricity procured by each individual hub. This relationship connects the electricity purchasing decisions made at the hub level to the overall electricity procurement cost included in the objective function.
Similarly, the total natural gas purchased is obtained by summing the gas purchases of both energy hubs:
P t g   =   i H P g , i , t
In (10), P t g represents the total natural gas purchased from the gas network. This equation ensures that the gas procurement cost is determined based on the combined gas consumption of the interconnected energy hubs.
The total heat purchased is expressed as follows:
P t q   =   i H P q , i , t
Here, P t q denotes the total heat purchased from the upstream heat network. This equation establishes the connection between hub-level thermal energy procurement decisions and the overall heat procurement cost at the system level.

2.3. Inter-Hub Electricity Exchange

The exchanged electrical power between the two hubs is represented by a single variable, F t . The corresponding power exchange terms for the residential and commercial hubs are defined as follows:
P R , t e x   =   F t ,               P C , t e x   = +   F t
In (12), a positive value of F t indicates that electrical energy is transferred from the residential hub to the commercial hub. Accordingly, this exchange is considered as an energy export ( F t ) for the residential hub and an energy import ( + F t ) for the commercial hub. This formulation ensures the internal balance of energy exchange between the two interconnected hubs.
The exchanged electrical power is constrained by the capacity limit of the interconnection line:
F m a x     F t     F m a x
where F m a x   represents the maximum permissible power exchange capacity between the two hubs. This constraint reflects the physical and contractual limitations of the interconnection line.
To incorporate the absolute value of the power exchange cost into the linear optimization model, the following linearization approach is applied:
F t a b s     F t ,                     F t a b s     F t
In (14), F t a b s   is introduced as an auxiliary non-negative variable to represent F t . This approach eliminates the direct inclusion of the nonlinear absolute-value term in the objective function, thereby maintaining the linearity of the optimization model.

2.4. Electrical and Thermal Storage Constraints

The operational dynamics of both electrical and thermal energy storage systems are represented using a unified modeling framework:
E k , i , t   =   E k , i , t 1   +   η k c h   P k , i , t c h     1 η k d i s   P k , i , t d i s ,                               k     { e ,   q }
In (15), k = e   denotes the electrical storage system, while k = q represents the thermal storage system. The variable E k , i , t   indicates the stored energy level at time t , whereas P k , i , t c h   and P k , i , t d i s   represent the charging and discharging power rates, respectively. The parameters η k c h   and η k d i s   correspond to the charging and discharging efficiencies. This equation describes the evolution of the stored energy by considering the previous energy state and the storage actions performed during the current time period.
The stored energy level is constrained to remain within the specified minimum and maximum capacity limits of the storage system:
E k , i m i n     E k , i , t     E k , i m a x ,                       k     { e ,   q }
where E k , i m i n and E k , i m a x denote the minimum and maximum permissible energy capacities of storage type k in hub i , respectively. This constraint ensures that the storage systems operate within their capacity limits and prevents overcharging or excessive energy depletion.
To guarantee cyclic daily operation of the storage systems, the final stored energy level is assumed to be equal to the initial energy level:
E k , i , T   =   E k , i , 0 ,                       k     { e ,   q }
This constraint prevents the optimization model from completely depleting the storage units at the end of the scheduling period to artificially reduce the operating cost. Consequently, the storage systems are utilized as energy-shifting resources rather than being treated as unlimited energy sources.
To avoid concurrent charging and discharging operations in stationary energy storage systems, binary decision variables are introduced:
P k , i , t c h     P k , i c h , m a x   Z k , i , t ,                       P k , i , t d i s     P k , i d i s , m a x   1     Z k , i , t ,               k     e ,   q    
In (18), Z k , i , t   denotes a binary decision variable. If Z k , i , t = 1 the storage unit of type k at hub i is permitted to charge while discharging is restricted. Conversely, when Z k , i , t = 0 the unit can discharge and charging is prohibited. This constraint prevents unrealistic simultaneous charging and discharging behavior in the storage system.

2.5. Demand Response Constraints

Demand response provides temporal flexibility by rescheduling controllable electrical and thermal loads while preserving their total energy requirements over the scheduling horizon [28]. For electrical demand response, the total amount of shifted load must equal the total amount of advanced load throughout the scheduling horizon:
t τ S e , i , t =   t τ A e , i , t
In (19), S e , i , t   represents the electrical load shifted from time t , while A e , i , t   denotes the additional electrical load assigned to time t   as a result of load rescheduling. This equation ensures that electrical demand response only modifies the consumption pattern over time without changing the total daily electrical energy consumption.
Similarly, the energy conservation constraint for thermal demand response is formulated as follows:
t τ S q , i , t = t τ A q , i , t
In (20), S q , i , t and A q , i , t   represent the shifted and advanced thermal loads, respectively. This equation enables thermal demand flexibility by allowing load adjustments over time while maintaining the same total daily thermal energy requirement.
The DR variables are constrained by their respective maximum permissible participation limits:
0     S e , i , t     S ¯ e , i , t ,                           0     A e , i , t     A ¯ e , i , t
where S ¯ e , i , t   and A ¯ e , i , t   denote the maximum allowable shiftable and advanceable electrical loads, respectively. These constraints limit excessive load adjustments and account for user comfort requirements and operational limitations.
The constraints associated with thermal DR are defined as follows:
0     S q , i , t     S ¯ q , i , t ,                             0     A q , i , t     A ¯ q , i , t
where S ¯ q , i , t   and A ¯ q , i , t   represent the maximum permissible thermal DR adjustments, respectively. These constraints are essential since thermal loads generally have limited flexibility and are influenced by comfort requirements and temperature regulation limitations.

2.6. EV/V2G Constraints

The EV/V2G scheduling model accounts for battery charging and discharging, conversion losses, vehicle availability, and the energy consumed during transportation, consistent with established bidirectional EV scheduling formulations [29,30]. Accordingly, the stored energy of the EV battery is updated as follows:
E E V , t   =   E E V , t 1   +   η E V c h   P E V , t c h     1 η E V d i s   P E V , t d i s     E t t r i p
In (23), E E V , t   denotes the battery state of charge of the EV at time t . The terms P E V , t c h   and P E V , t   d i s represent the charging and discharging power of the EV battery, while η E V   c h and η E V   d i s   indicate the corresponding charging and discharging efficiencies. The parameter E t t r i p accounts for the energy consumed during EV travel. This formulation considers both the bidirectional power exchange between the EV and the grid and the energy requirements associated with vehicle mobility.
The stored energy of the EV battery is required to remain within its predefined operating limits:
E E V m i n     E E V , t     E E V m a x
where E E V m i n   and E E V m a x   denote the minimum and maximum permissible stored energy levels of the EV battery, respectively. This constraint ensures safe battery operation by preventing excessive discharge and overcharging conditions.
EV charging and discharging operations are permitted only during periods when the EV is connected and available:
0     P E V , t c h     P E V c h , m a x   A t E V ,                             0     P E V , t d i s     P E V d i s , m a x   A t E V
In (25), A t E V represents the EV availability indicator. When the EV is connected to the hub, A t E V = 1 , enabling both battery charging and V2G discharging operations. Conversely, when the EV is unavailable, A t E V = 0 and both charging and discharging powers are set to zero.
For the EV battery, an identical operating logic is adopted:
P E V , t c h     P E V c h , m a x   Z E V , t ,                     P E V , t d i s     P E V d i s , m a x   ( 1   Z E V , t )
where Z E V , t   represents the binary variable that defines the EV charging and discharging status. This constraint ensures that the EV battery cannot charge and supply power to the hub simultaneously, thereby preventing conflicting operating modes.

2.7. Variable Domains and Operational Limits

The unserved electrical and thermal loads are restricted by their respective demand levels:
0     U e , i , t     L e , i , t ,                             0     U q , i , t     L q , i , t
In (28), U e , i , t   and U q , i , t   are limited by the corresponding original electrical and thermal demands. This constraint ensures that the unserved energy variables remain within physically feasible ranges. Since these variables are penalized in the objective function using the value of lost load (VOLL), they are activated only when fully satisfying the demand becomes economically inefficient or technically infeasible.
The continuous operational variables are constrained to take non-negative values:
P e , i , t ,   P g , i , t ,   P q , i , t ,   P k , i , t c h ,   P k , i , t d i s ,   S k , i , t ,   A k , i , t ,   U k , i , t     0
Equation (28) establishes the non-negativity constraints for the primary decision variables. This condition guarantees that energy purchases, storage charging and discharging operations, demand response actions, and unserved load quantities remain within physically feasible ranges and cannot assume negative values.
The binary decision variables are defined as follows:
Z e , i , t ,   Z q , i , t ,   Z E V , t     { 0 ,   1 }
Equation (29) specifies the binary nature of the status variables employed to enforce mutually exclusive operating modes. By incorporating these binary variables, the overall optimization framework is formulated as a mixed-integer linear programming (MILP) problem.

3. Proposed Methodology

3.1. System Description

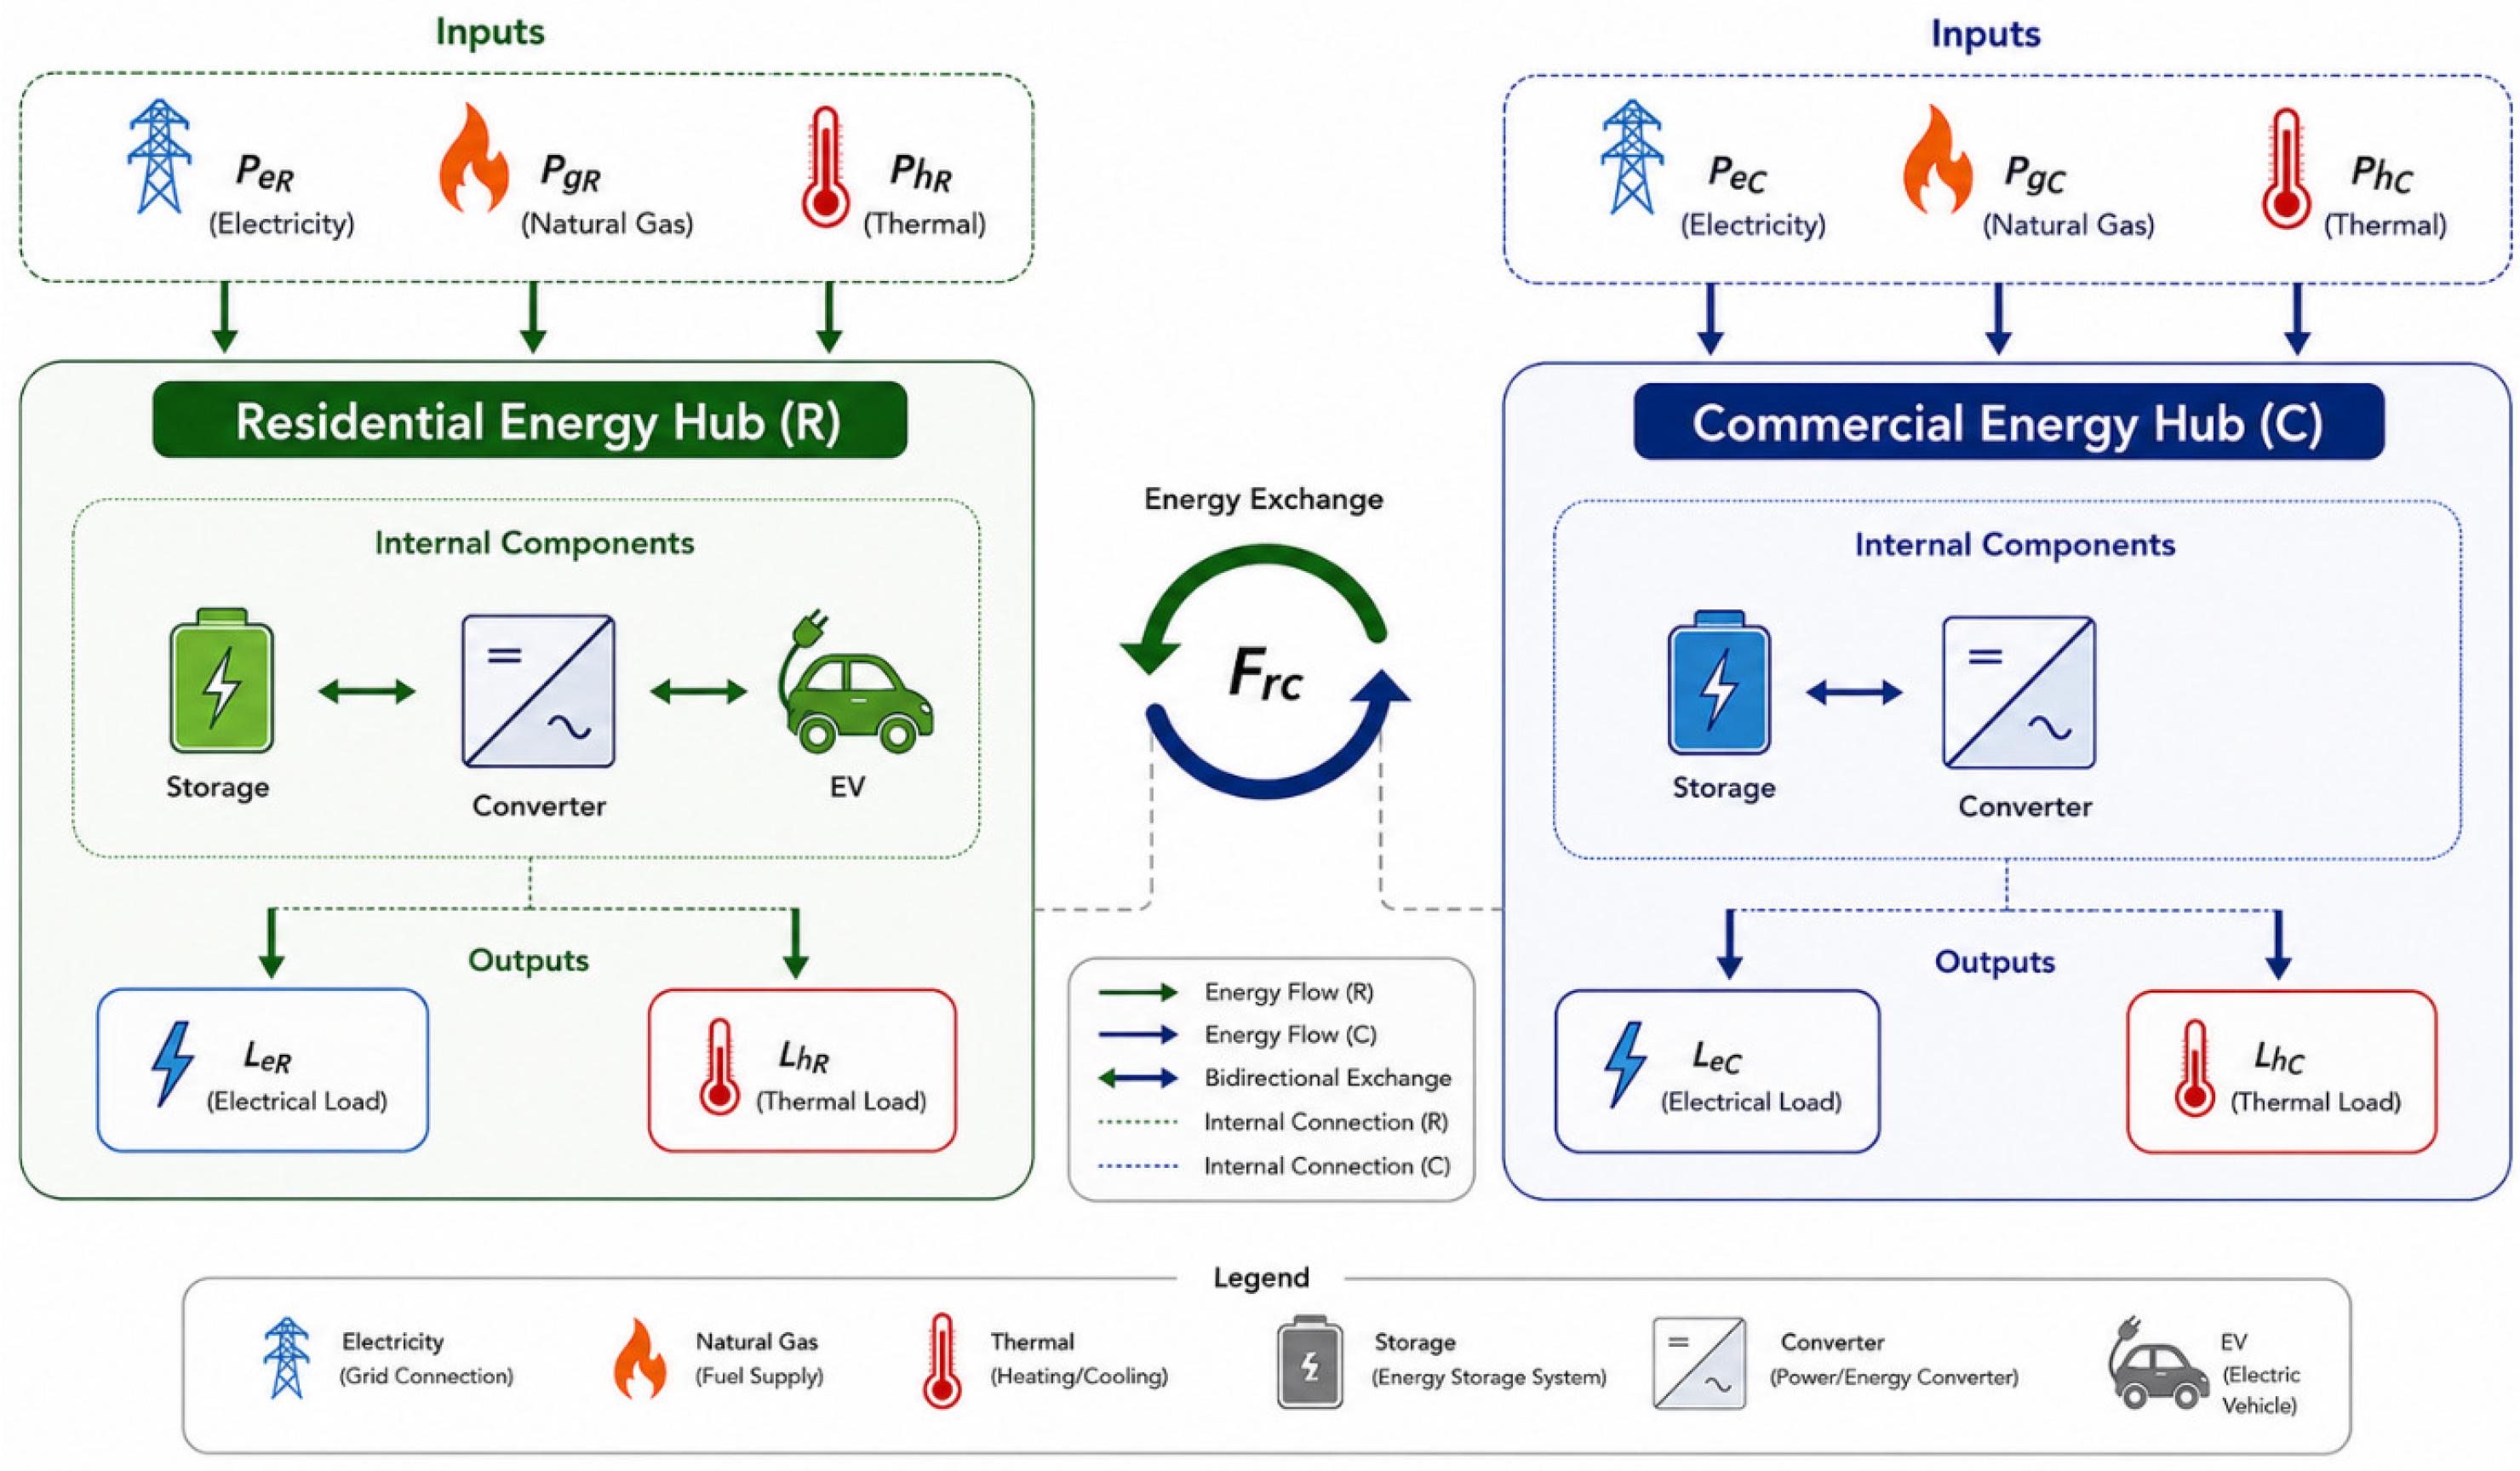
The proposed framework is developed for two interconnected energy hubs, namely a residential energy hub and a commercial energy hub. As shown in Figure 1, each hub receives three upstream energy carriers: electricity, natural gas, and thermal energy. These inputs are denoted by PeR, PgR, and PhR for the residential hub, and by PeC, PgC, and PhC for the commercial hub. On the demand side, the residential hub supplies the electrical and thermal loads LeR and LhR, while the commercial hub meets LeC and LhC. In addition to direct energy procurement from upstream networks, each hub is equipped with a combined heat and power (CHP) unit as well as electrical and thermal energy storage systems. The CHP unit converts natural gas into coupled electrical and thermal outputs, thereby increasing the operational flexibility of the hub and improving the coordination between energy carriers. The storage units provide time-shifting capability and help reduce dependence on external networks during high-price periods.
A bidirectional electrical link is established between the two hubs to enable coordinated operation. The exchanged power is represented by Frc, through which electricity can be transferred from one hub to the other when such a transfer is economically advantageous or operationally required. In this study, the interconnection between the two hubs is limited to electricity exchange only. It should be noted that EV participation is considered only in the residential hub. Therefore, in addition to storage-based flexibility, the residential hub can also benefit from EV charging and discharging through V2G operation in the corresponding scenario. Altogether, this interconnected structure provides a suitable basis for the joint scheduling of energy supply, CHP operation, storage management, demand response, EV participation, and inter-hub electricity exchange within a unified optimization framework.

3.2. Scenario-Based Operation Strategy

To investigate the performance of the proposed framework, the interconnected hub system is evaluated under six operational scenarios. These scenarios are defined in a progressive manner, beginning with the basic operating condition and then gradually incorporating additional flexibility options. Such a structure makes it possible to separately assess the role of electrical demand response, thermal demand response, inter-hub coordination, and EV/V2G participation, as well as their combined effect on system operation.
It is worth mentioning that the CHP units and the electrical and thermal storage systems are available in all scenarios. The difference among scenarios lies in the activation of demand response programs, inter-hub electricity exchange, and EV/V2G support.
  • SC1: Base case considering interconnected energy hubs without demand response and without EV participation.
  • SC2: Interconnected energy hubs with only electrical demand response enabled.
  • SC3: Interconnected energy hubs with only thermal demand response enabled.
  • SC4: Interconnected energy hubs with both electrical and thermal demand response programs activated.
  • SC5: Interconnected energy hubs with combined electrical and thermal demand response, where the inter-hub electricity exchange is subject to a limited transfer capacity.
  • SC6: Full coordinated operation considering electrical and thermal demand response, limited inter-hub electricity exchange capacity, and EV/V2G participation.
  • SC7: No-storage benchmark scenario based on SC6, in which electrical and thermal demand response, limited inter-hub electricity exchange, and EV/V2G participation remain active, while all stationary electrical and thermal energy storage systems are disabled.
Although all scenarios consider interconnected energy hubs and allow bidirectional electricity exchange, SC5 and SC6 specifically introduce a limited inter-hub exchange capacity to evaluate the impact of physical transfer restrictions. In SC1–SC4, a higher exchange capacity is considered, while the exchange capacity is reduced to 0.6 p.u. in SC5 and SC6.

3.3. Solution Algorithm and Evaluation Metrics

The scheduling problem is formulated as a day-ahead mixed-integer linear programming model over a 24-h horizon. The model is implemented in MATLAB 2023b and solved using the intlinprog solver. At each time interval, the optimization determines the optimal levels of electricity, natural gas, and thermal energy procurement, CHP operation, storage charging and discharging, demand response activation, inter-hub electricity exchange, and, when enabled, EV charging and discharging.
To ensure a fair comparison among the scenarios, the same demand profiles, energy prices, and technical parameters are used in all cases. The scenarios differ only in the activation of specific flexibility options and their corresponding operational constraints. This setup allows the effect of each flexibility source to be evaluated under identical input conditions. After each scenario is solved, the main decision variables are extracted and used to calculate the performance indicators. These indicators include the total operating cost, energy procurement cost, demand response cost, EV operation cost, inter-hub exchange cost, unserved-load penalty, shifted electrical and thermal demand, storage operation, exchanged electricity between hubs, EV charging and discharging energy, and electrical and thermal unserved energy. These metrics provide a consistent basis for comparing the scenarios and identifying the operational value of demand response, storage scheduling, inter-hub coordination, and EV/V2G participation in the interconnected energy hub system.

4. Simulation Results and Discussion

4.1. Case Study Description

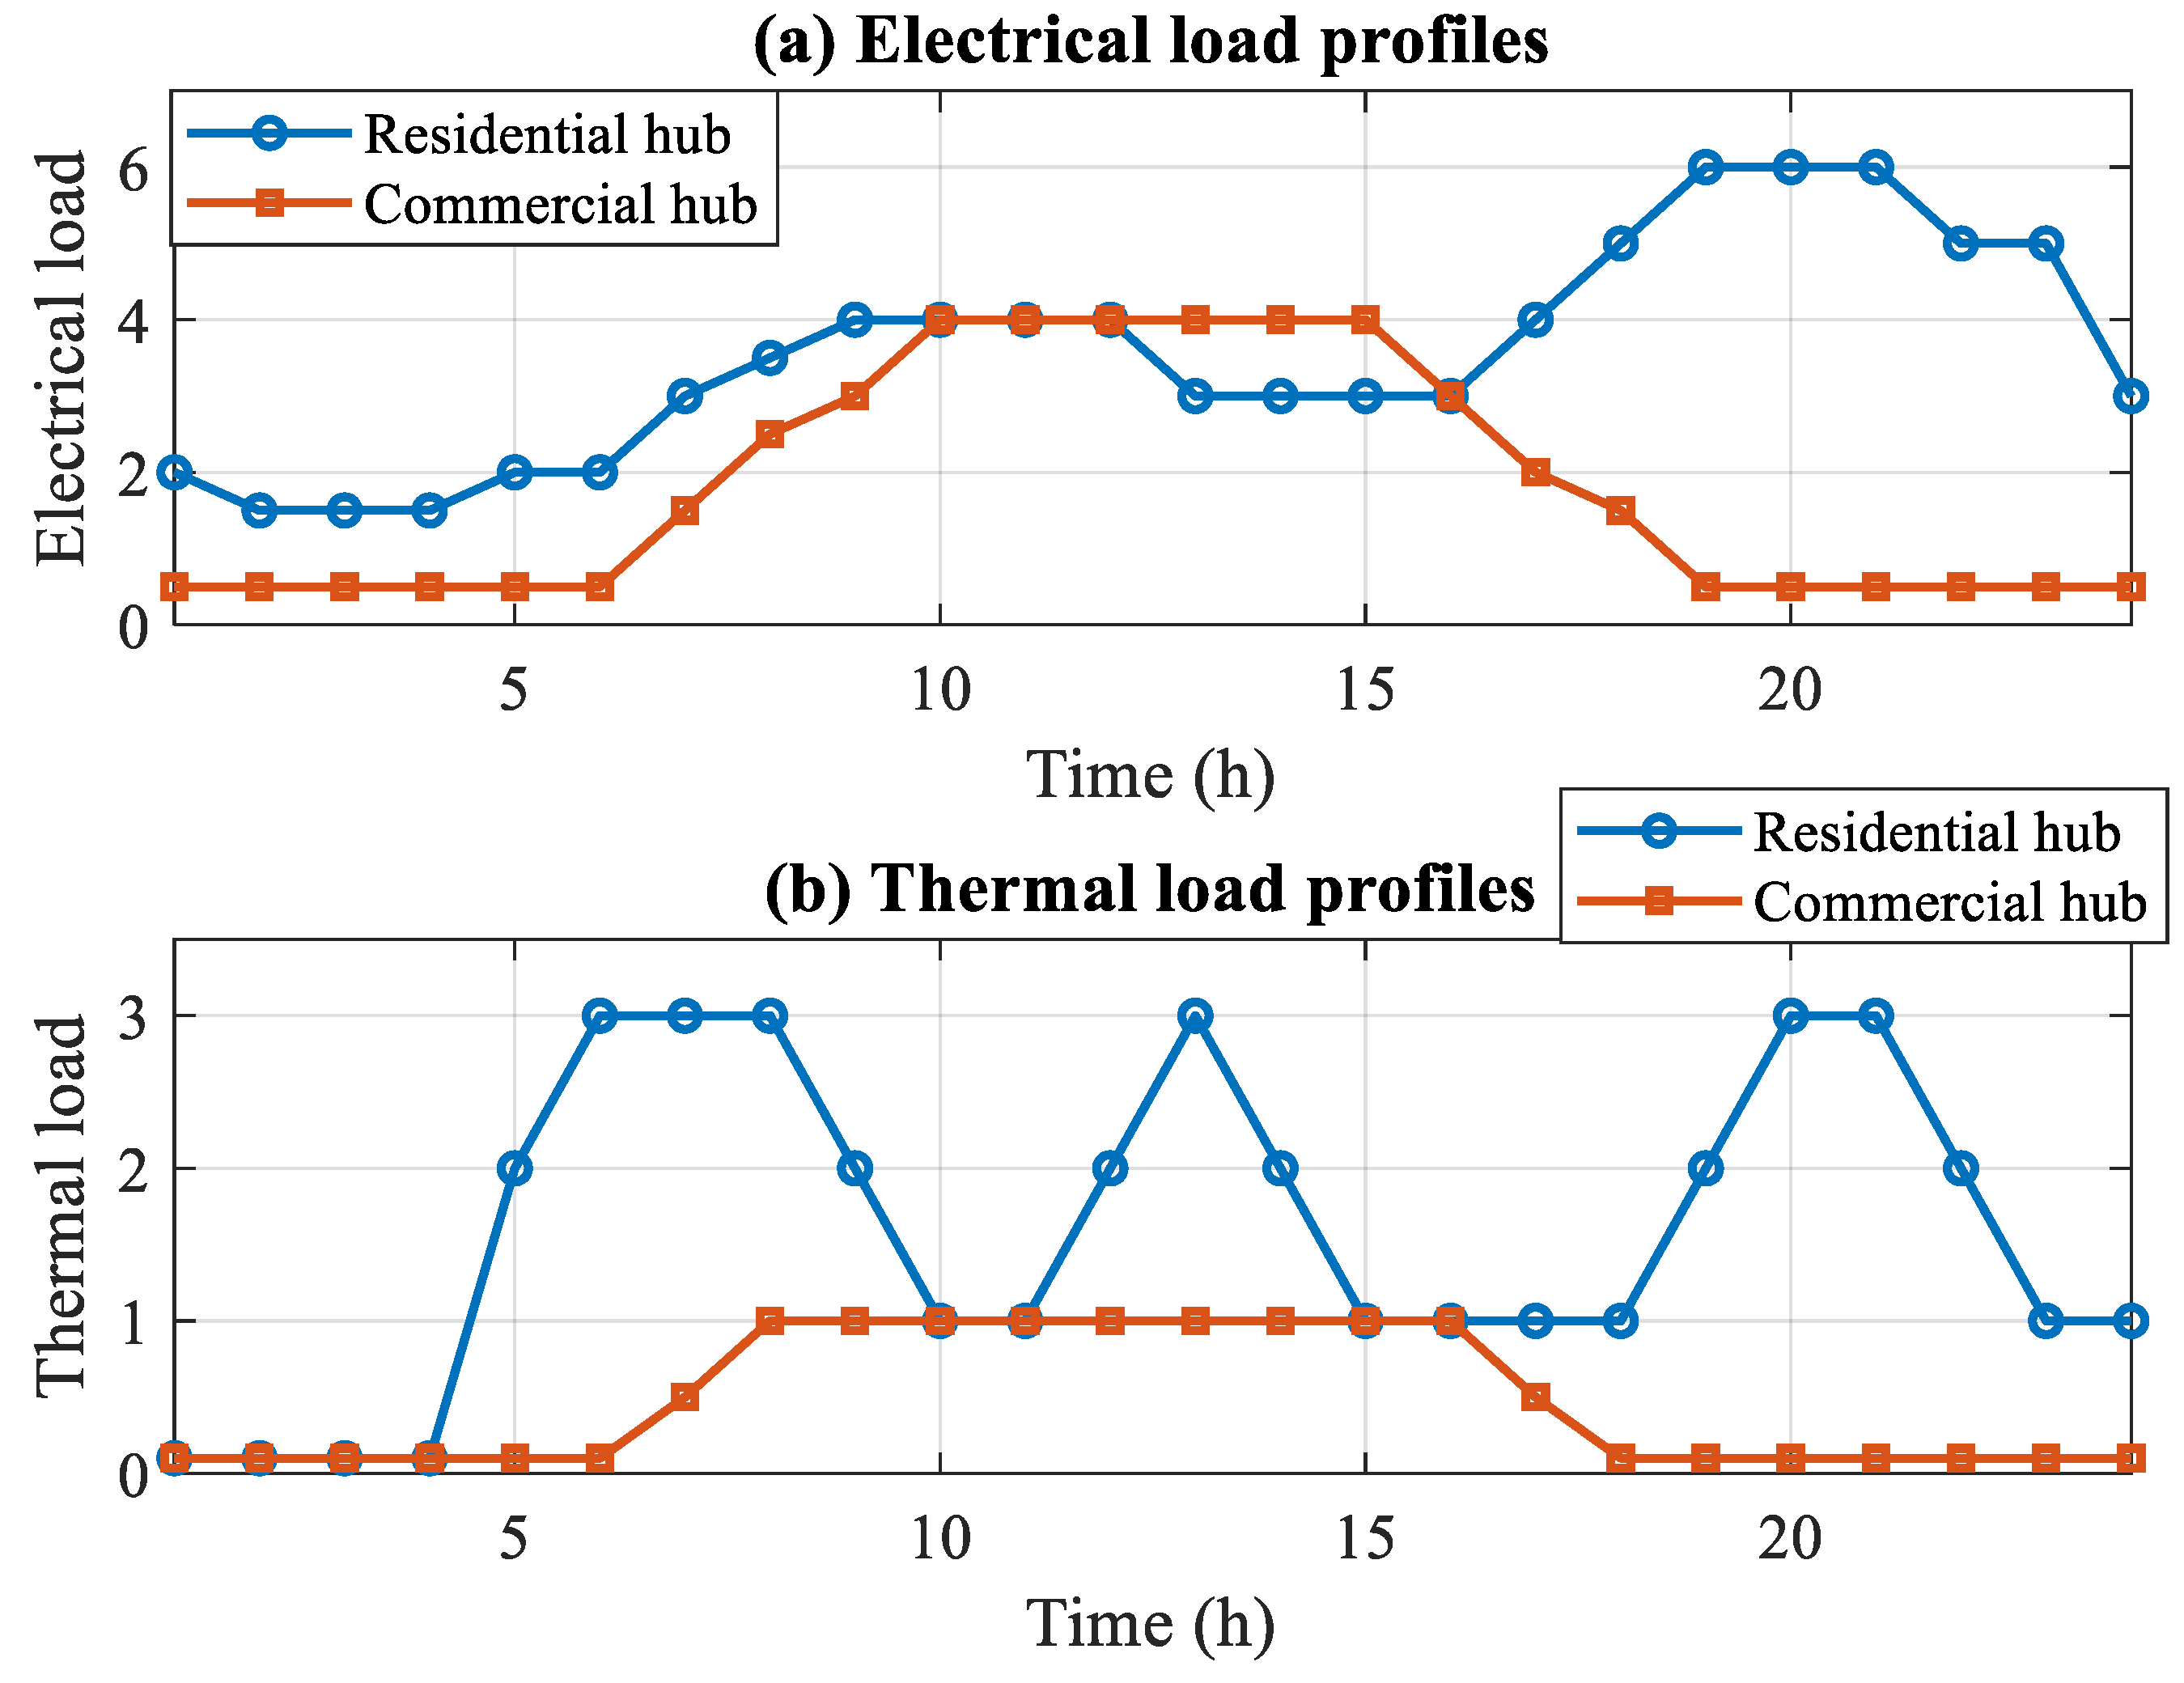
The proposed MILP-based framework is validated using an interconnected system comprising a residential and a commercial energy hub. The day-ahead scheduling is performed over a 24-h horizon with hourly time steps. To ensure a consistent baseline for comparison, demand profiles, energy prices, and technical efficiencies remain identical across the six evaluated scenarios; only the activation of flexibility options (DR, EV, and inter-hub exchange) varies. Figure 2 illustrates the hourly electrical and thermal load profiles. The residential hub exhibits peak electricity demand during the evening (18:00–22:00), while the commercial hub’s demand is primarily concentrated during business hours (08:00–17:00). These asynchronous load patterns, coupled with the differing thermal requirements, provide the necessary potential for inter-hub coordination and localized flexibility harvesting. The economic and technical parameters are summarized in Table 2 and Table 3.
Electricity procurement is modeled based on a time-of-use (TOU) tariff, while natural gas and external heat prices are considered constant during the scheduling horizon. The scheduling problem is formulated over 24 hourly time intervals, where t represents the hourly period. Both electrical and thermal Demand Response (DR) programs are modeled as energy-conserving load-shifting mechanisms, meaning that the total daily energy consumption remains unchanged, while only the timing of energy usage is optimized.
Furthermore, all energy storage systems (ESSs), including electrical and thermal storage units, as well as the aggregated Electric Vehicle (EV) battery, are subject to cyclic boundary conditions. Accordingly, the stored energy at the end of the scheduling horizon (t = 24) is required to return to its initial value at the beginning of the horizon (t = 0). In SC6, the EV model additionally considers availability periods and trip-related energy consumption to represent realistic EV operating conditions. The coordination between interconnected hubs is limited to bidirectional electricity exchange (Frc), which is constrained by the physical capacity of the interconnecting line to prevent unrealistic energy transfers between hubs.
The reported Inter-Hub Exchange represents the cumulative absolute exchanged energy over the 24-h scheduling horizon, calculated as t F t   Δ t , and should not be interpreted as the instantaneous exchange capacity.

4.2. Comparative Results of Different Scenarios

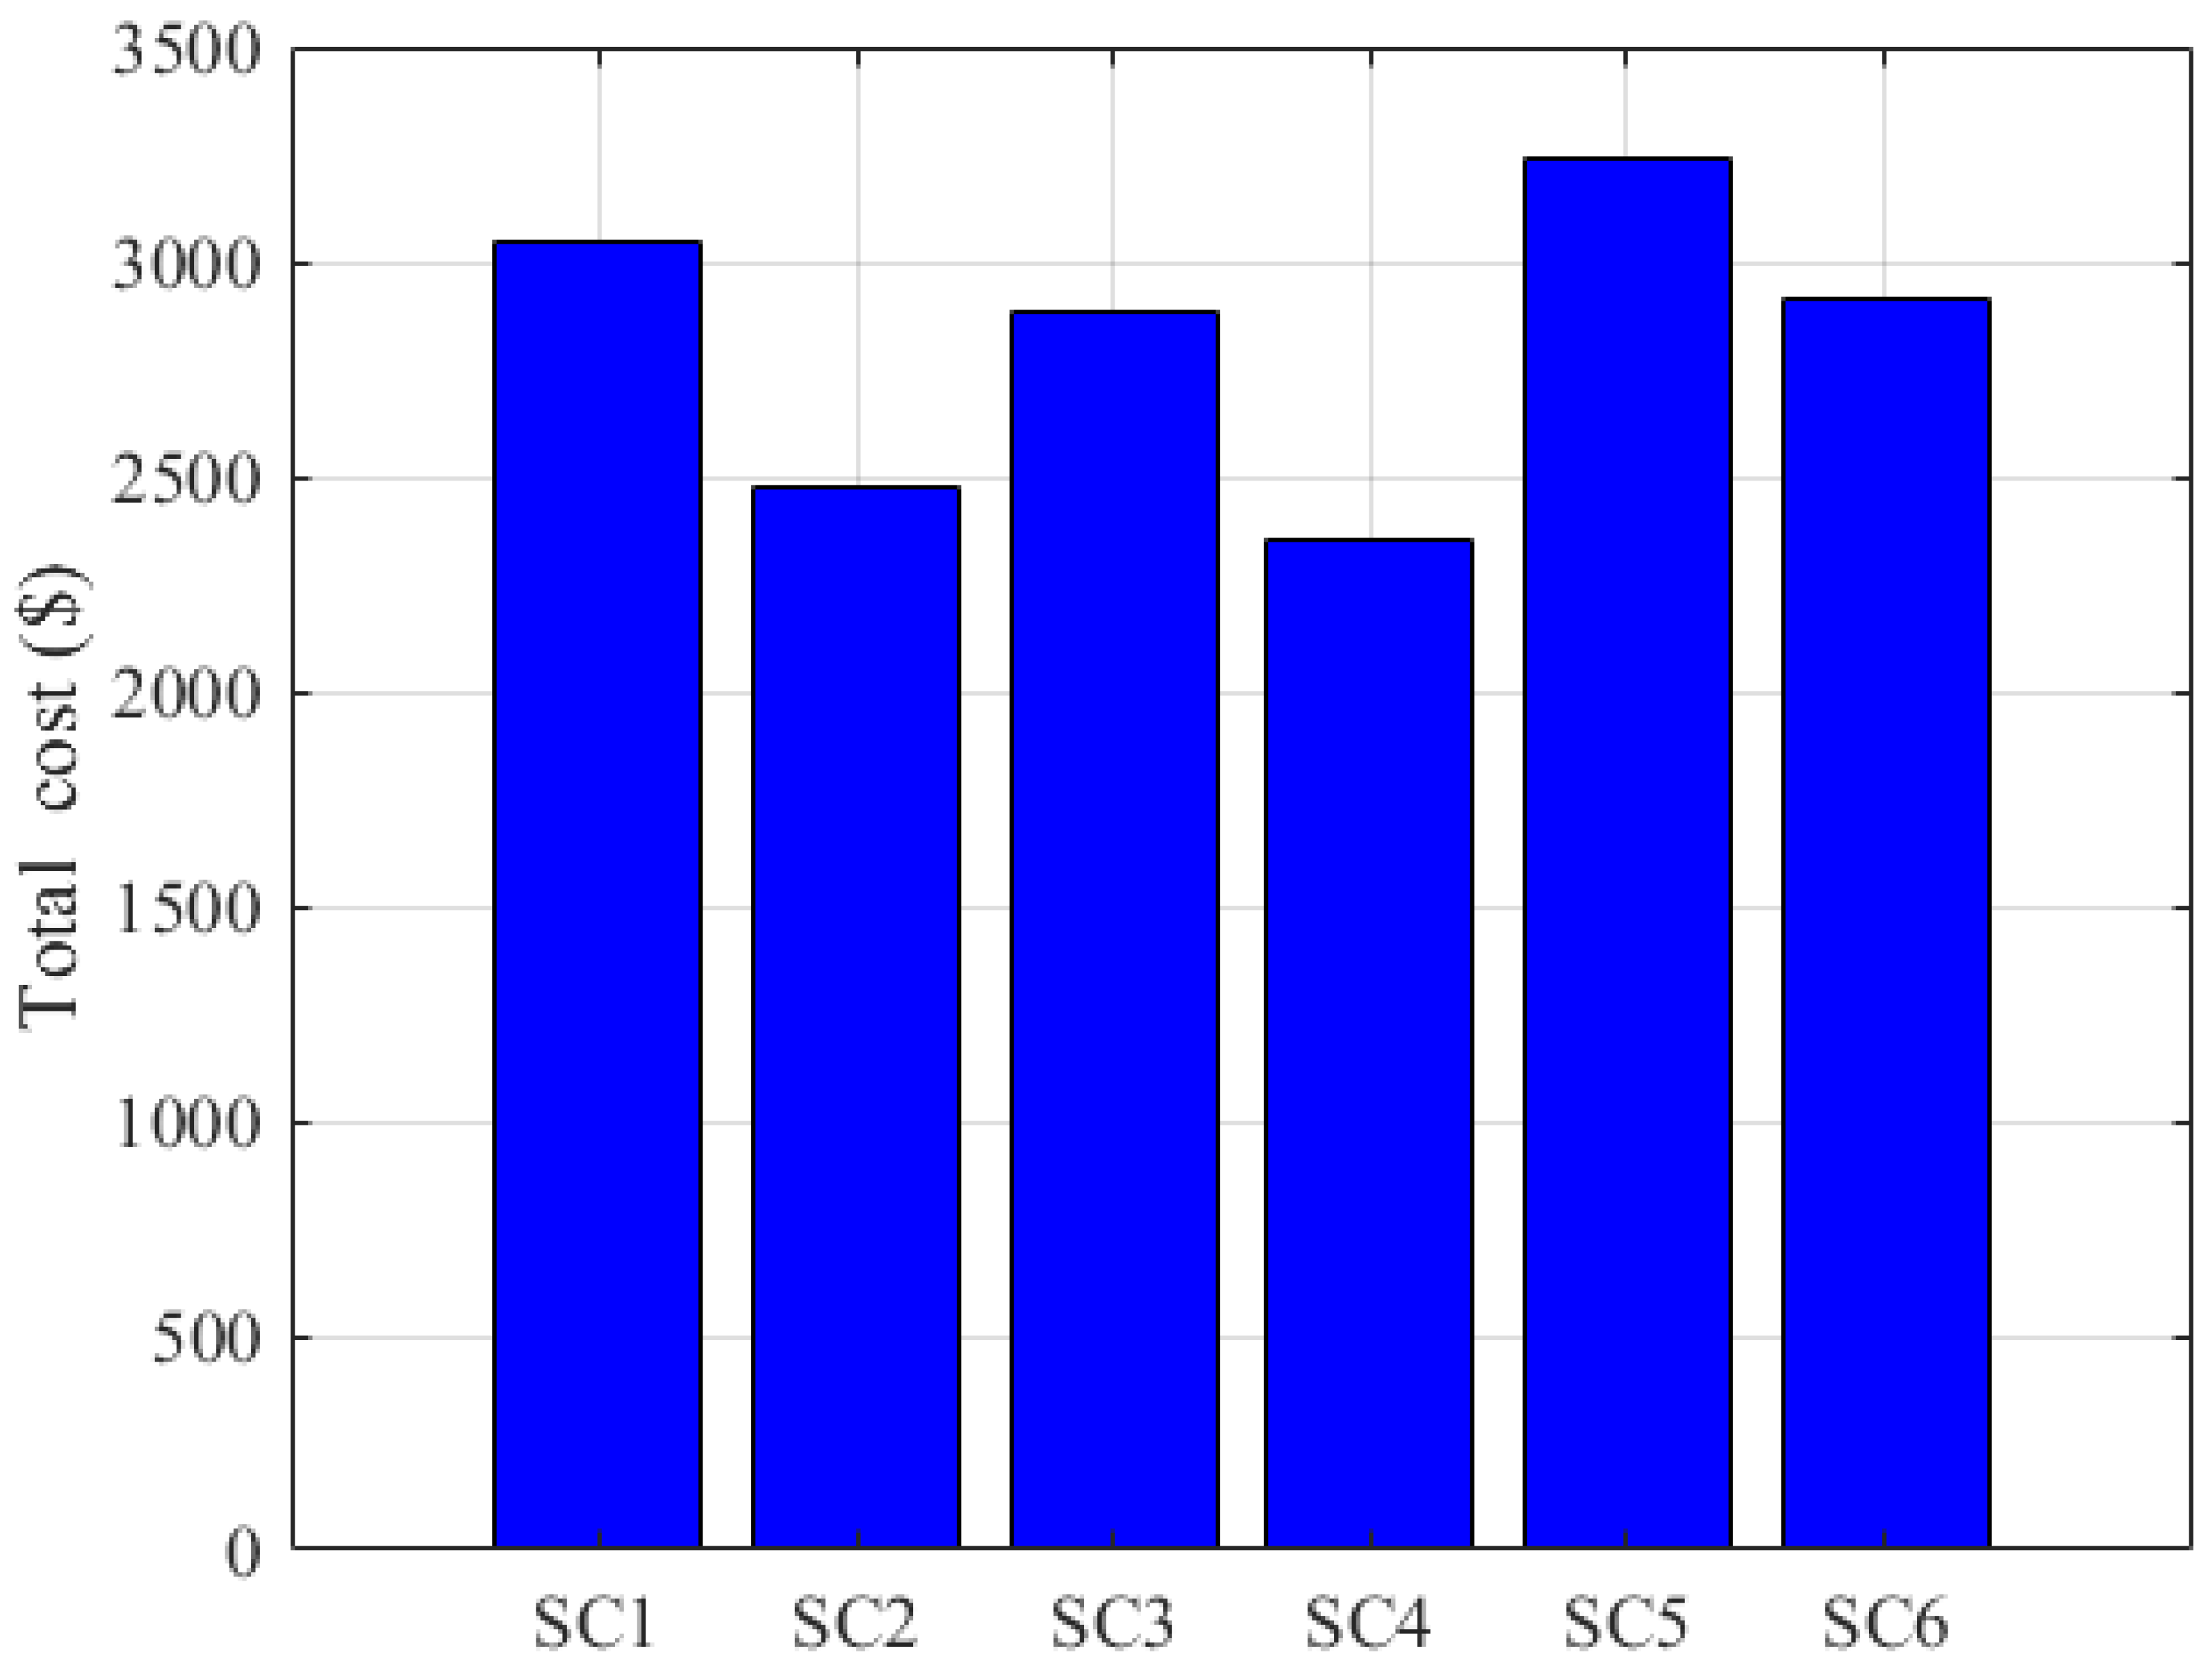
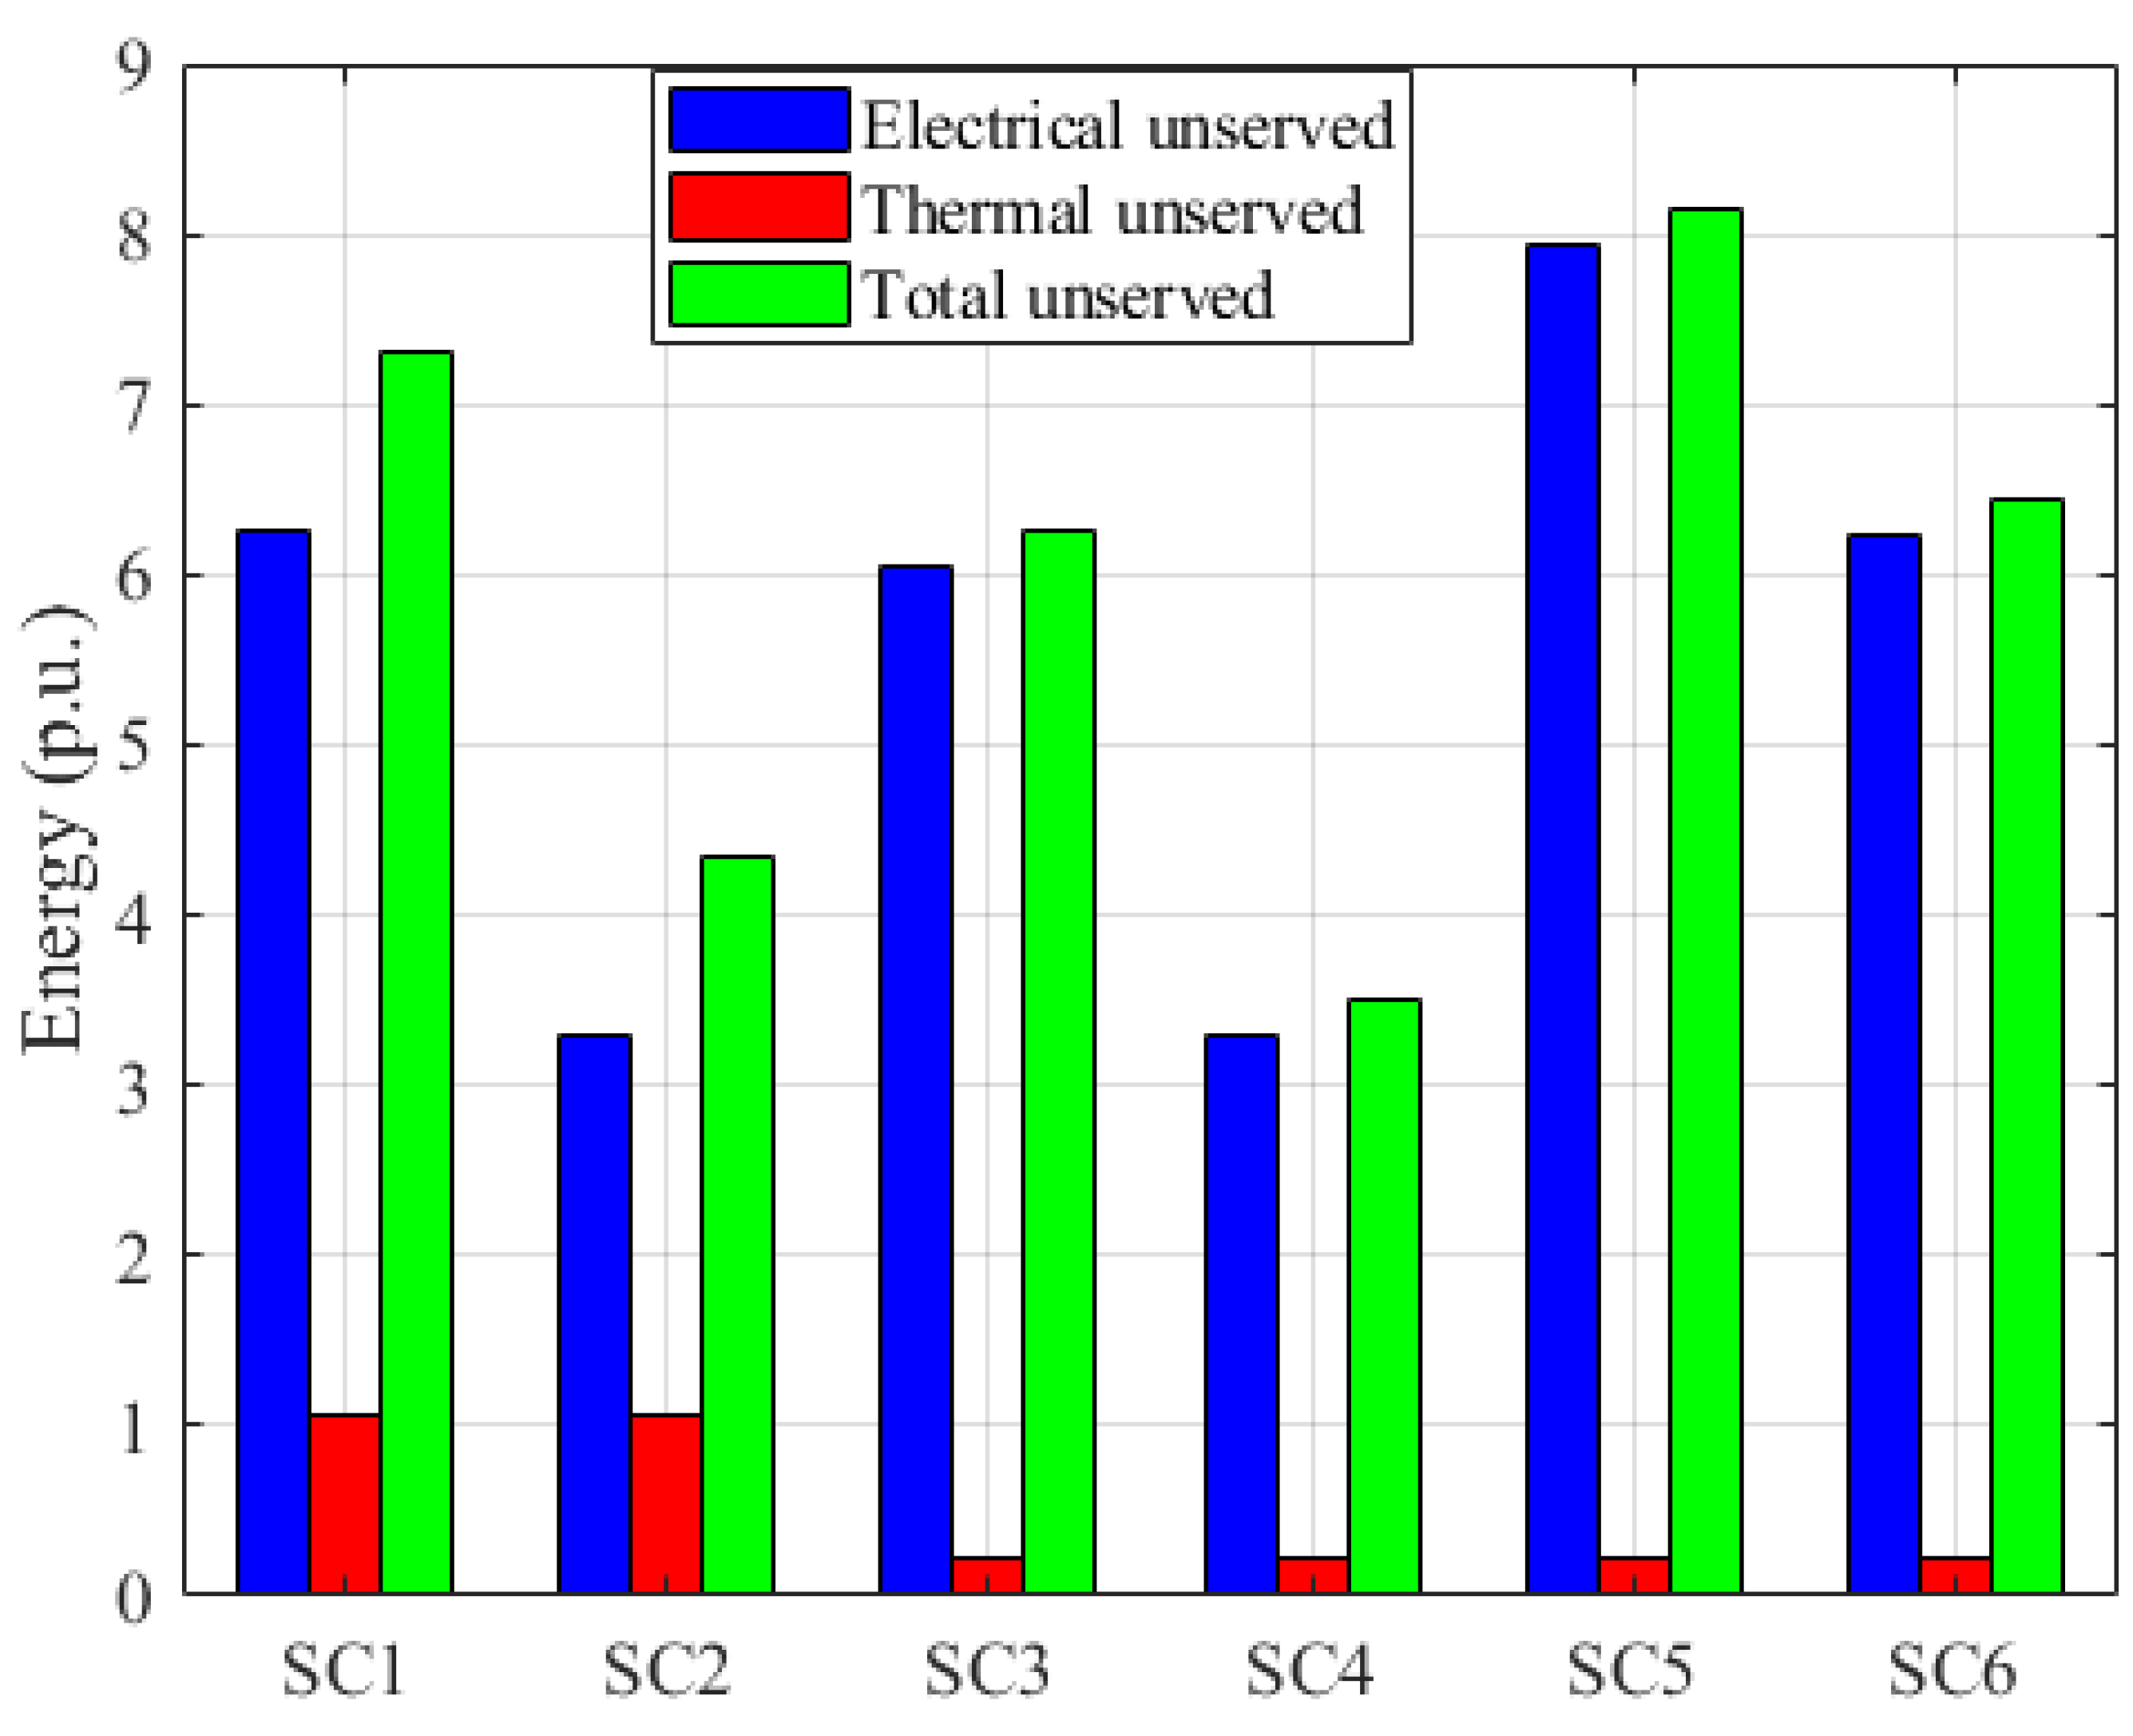
Table 4 presents the comparative results obtained for the six studied scenarios of the interconnected energy hub system. The table reports the total cost, electrical and thermal unserved energy, electrical and thermal demand response, inter-hub exchanged energy, and EV charging/discharging quantities. In addition, Figure 3 illustrates the total cost comparison among different scenarios, while Figure 4 compares the corresponding electrical, thermal, and total unserved energy levels. These results provide an overall evaluation of the economic and reliability performance of the proposed multi-energy scheduling framework under different operating conditions.
As reported in Table 3 and illustrated in Figure 3, Scenario 1 represents the base operating condition, with a total cost of $3044.5. In this scenario, no demand response or EV operation is activated; therefore, the system has limited flexibility to adjust its energy consumption pattern. Consequently, Scenario 1 leads to relatively high electrical and thermal unserved energy values of 6.2548 p.u. and 1.055 p.u., respectively. This case is therefore considered the reference condition for evaluating the effectiveness of the flexibility options introduced in the subsequent scenarios.
Among all studied cases, Scenario 4 achieves the lowest total cost, equal to $2356.2. Compared with the base case, this represents a cost reduction of approximately 22.6%. This improvement is also reflected in the unserved energy indices, where the electrical and thermal unserved energy values decrease to 3.2800 p.u. and 0.215 p.u., respectively. These results indicate that the configuration considered in Scenario 4 provides the most cost-effective condition among the investigated scenarios. Scenario 2 also shows a considerable improvement compared with the base case. The total cost decreases from $3044.5 in Scenario1 to $2479.4 in Scenario 2, corresponding to an approximate reduction of 18.6%. Moreover, the electrical unserved energy is reduced from 6.2548 p.u. to 3.2800 p.u. This reduction confirms that the flexibility introduced in this scenario significantly improves both the economic performance and the electrical supply adequacy of the system.
Scenario 3, with a total cost of $2881.3, provides a smaller cost reduction compared with Scenario 2. However, it substantially decreases thermal unserved energy from 1.055 p.u. in Scenario 1 to 0.215 p.u. This observation shows that the improvement achieved in each scenario depends strongly on the type of flexibility activated and the corresponding energy carrier affected by that flexibility. Therefore, the scenarios should be evaluated not only based on total cost, but also according to the electrical and thermal unserved energy indicators. A direct comparison between Scenarios 2, 3, and 4 highlights the advantage of coordinated utilization of flexibility options. While Scenario 2 mainly improves the electrical-side performance and Scenario 3 mainly improves the thermal-side performance, Scenario 4 combines the benefits of both and consequently provides the best overall result. In Scenario 4, the system simultaneously achieves the minimum total cost and one of the lowest total unserved energy levels among all cases. This demonstrates that coordinated operation across different energy carriers is more effective than relying on a single flexibility option.
By contrast, Scenario 5 records the highest total cost, equal to $3235.6, and the highest electrical unserved energy, equal to 7.9365 p.u. Although flexibility resources are activated in this scenario, the overall performance deteriorates compared with Scenario 4. This case is useful because it shows that adding flexibility resources is not always sufficient on its own. Scenario 6 improves the performance relative to Scenario 5, reducing the total cost from $3235.6 to $2917.0 and decreasing electrical unserved energy from 7.9365 p.u. to 6.2265 p.u. Nevertheless, its performance remains inferior to Scenario 4 in terms of both total cost and unserved energy. This comparison suggests that although additional flexibility can partially mitigate unfavorable operating conditions, it cannot fully compensate for the loss of more coordinated and less constrained operation. To explicitly assess the contribution of stationary energy storage, Scenario 7 is introduced as a no-storage benchmark based on Scenario 6. In this scenario, electrical and thermal demand response programs, limited inter-hub electricity exchange, and EV/V2G operation remain active; however, the stationary electrical and thermal energy storage systems are disabled. As shown in Table 3, removing stationary storage increases the total operating cost from 2917.0 in Scenario 6 to3868.6 in Scenario 7, corresponding to a 32.6% cost increase. In addition, electrical unserved energy rises from 6.2265 p.u. to 9.3734 p.u., while thermal unserved energy increases substantially from 0.215 p.u. to 2.706 p.u. The total unserved energy consequently increases from 6.4415 p.u. to 12.0794 p.u., representing an increase of approximately 87.5%. Although EV/V2G operation and both demand response programs remain available in Scenario 7, they cannot fully compensate for the absence of stationary BESS and TESS. Therefore, the comparison between Scenarios 6 and 7 confirms the important role of stationary electrical and thermal storage in reducing operating costs, alleviating peak-related supply shortages, and improving the reliability of the interconnected multi-energy hub system. The trends illustrated in Figure 4 are consistent with the numerical results reported in Table 3. Scenarios with lower total cost generally exhibit lower total unserved energy, confirming the strong connection between economic scheduling and service reliability. However, the comparison also shows that total cost minimization alone is not sufficient to fully characterize system performance. For instance, scenarios with relatively close cost values may still have different distributions of electrical and thermal unserved energy. Therefore, both economic and reliability-related indicators are required for a comprehensive assessment of the interconnected energy hub system. Overall, the comparative analysis demonstrates that Scenario 4 provides the best performance among the studied cases. It achieves the lowest total cost while maintaining reduced electrical and thermal unserved energy. The results also show that coordinated utilization of flexibility resources improves the operational efficiency of the multi-energy hub system and enhances its ability to satisfy electrical and thermal demands. These findings provide the basis for the more detailed analyses presented in the following subsections.
  • Sensitivity Analysis of Value of Lost Load (VOLL) Parameters
To evaluate the robustness of the proposed scheduling framework with respect to the penalty assigned to unserved energy, a sensitivity analysis is performed by varying the electrical and thermal value of lost load parameters. Since the VOLL coefficients determine the trade-off between operational cost and supply adequacy in the objective function, their selection may influence the optimal scheduling decisions. Therefore, three cases are considered: a low penalty case with VOLLe = 100 and VOLLh = 75, the base case with VOLLe = 200 and VOLLh = 150, and a high penalty case with VOLLe = 300 and VOLLh = 225. The analysis is conducted for SC6, which represents the complete proposed framework including demand response, limited inter-hub electricity exchange, and EV/V2G operation. Table 5 presents the results of the VOLL sensitivity analysis. As observed, increasing the VOLL parameters leads to a proportional increase in the total operating cost due to the higher economic penalty associated with unserved energy. However, the total unserved energy remains unchanged across all examined cases. This indicates that the optimal operational decisions, including the utilization of flexibility resources, are not affected by moderate variations in the VOLL parameters within the investigated range. The unchanged level of unserved energy suggests that the obtained scheduling solution is mainly governed by the physical constraints of the system, including available flexibility capacity, inter-hub exchange limitations, and resource operating limits, rather than only by the penalty coefficients. Therefore, the proposed framework demonstrates robustness against reasonable variations in VOLL values while maintaining the same supply adequacy performance.

4.3. Impact of Demand Response, Storage, and EVs

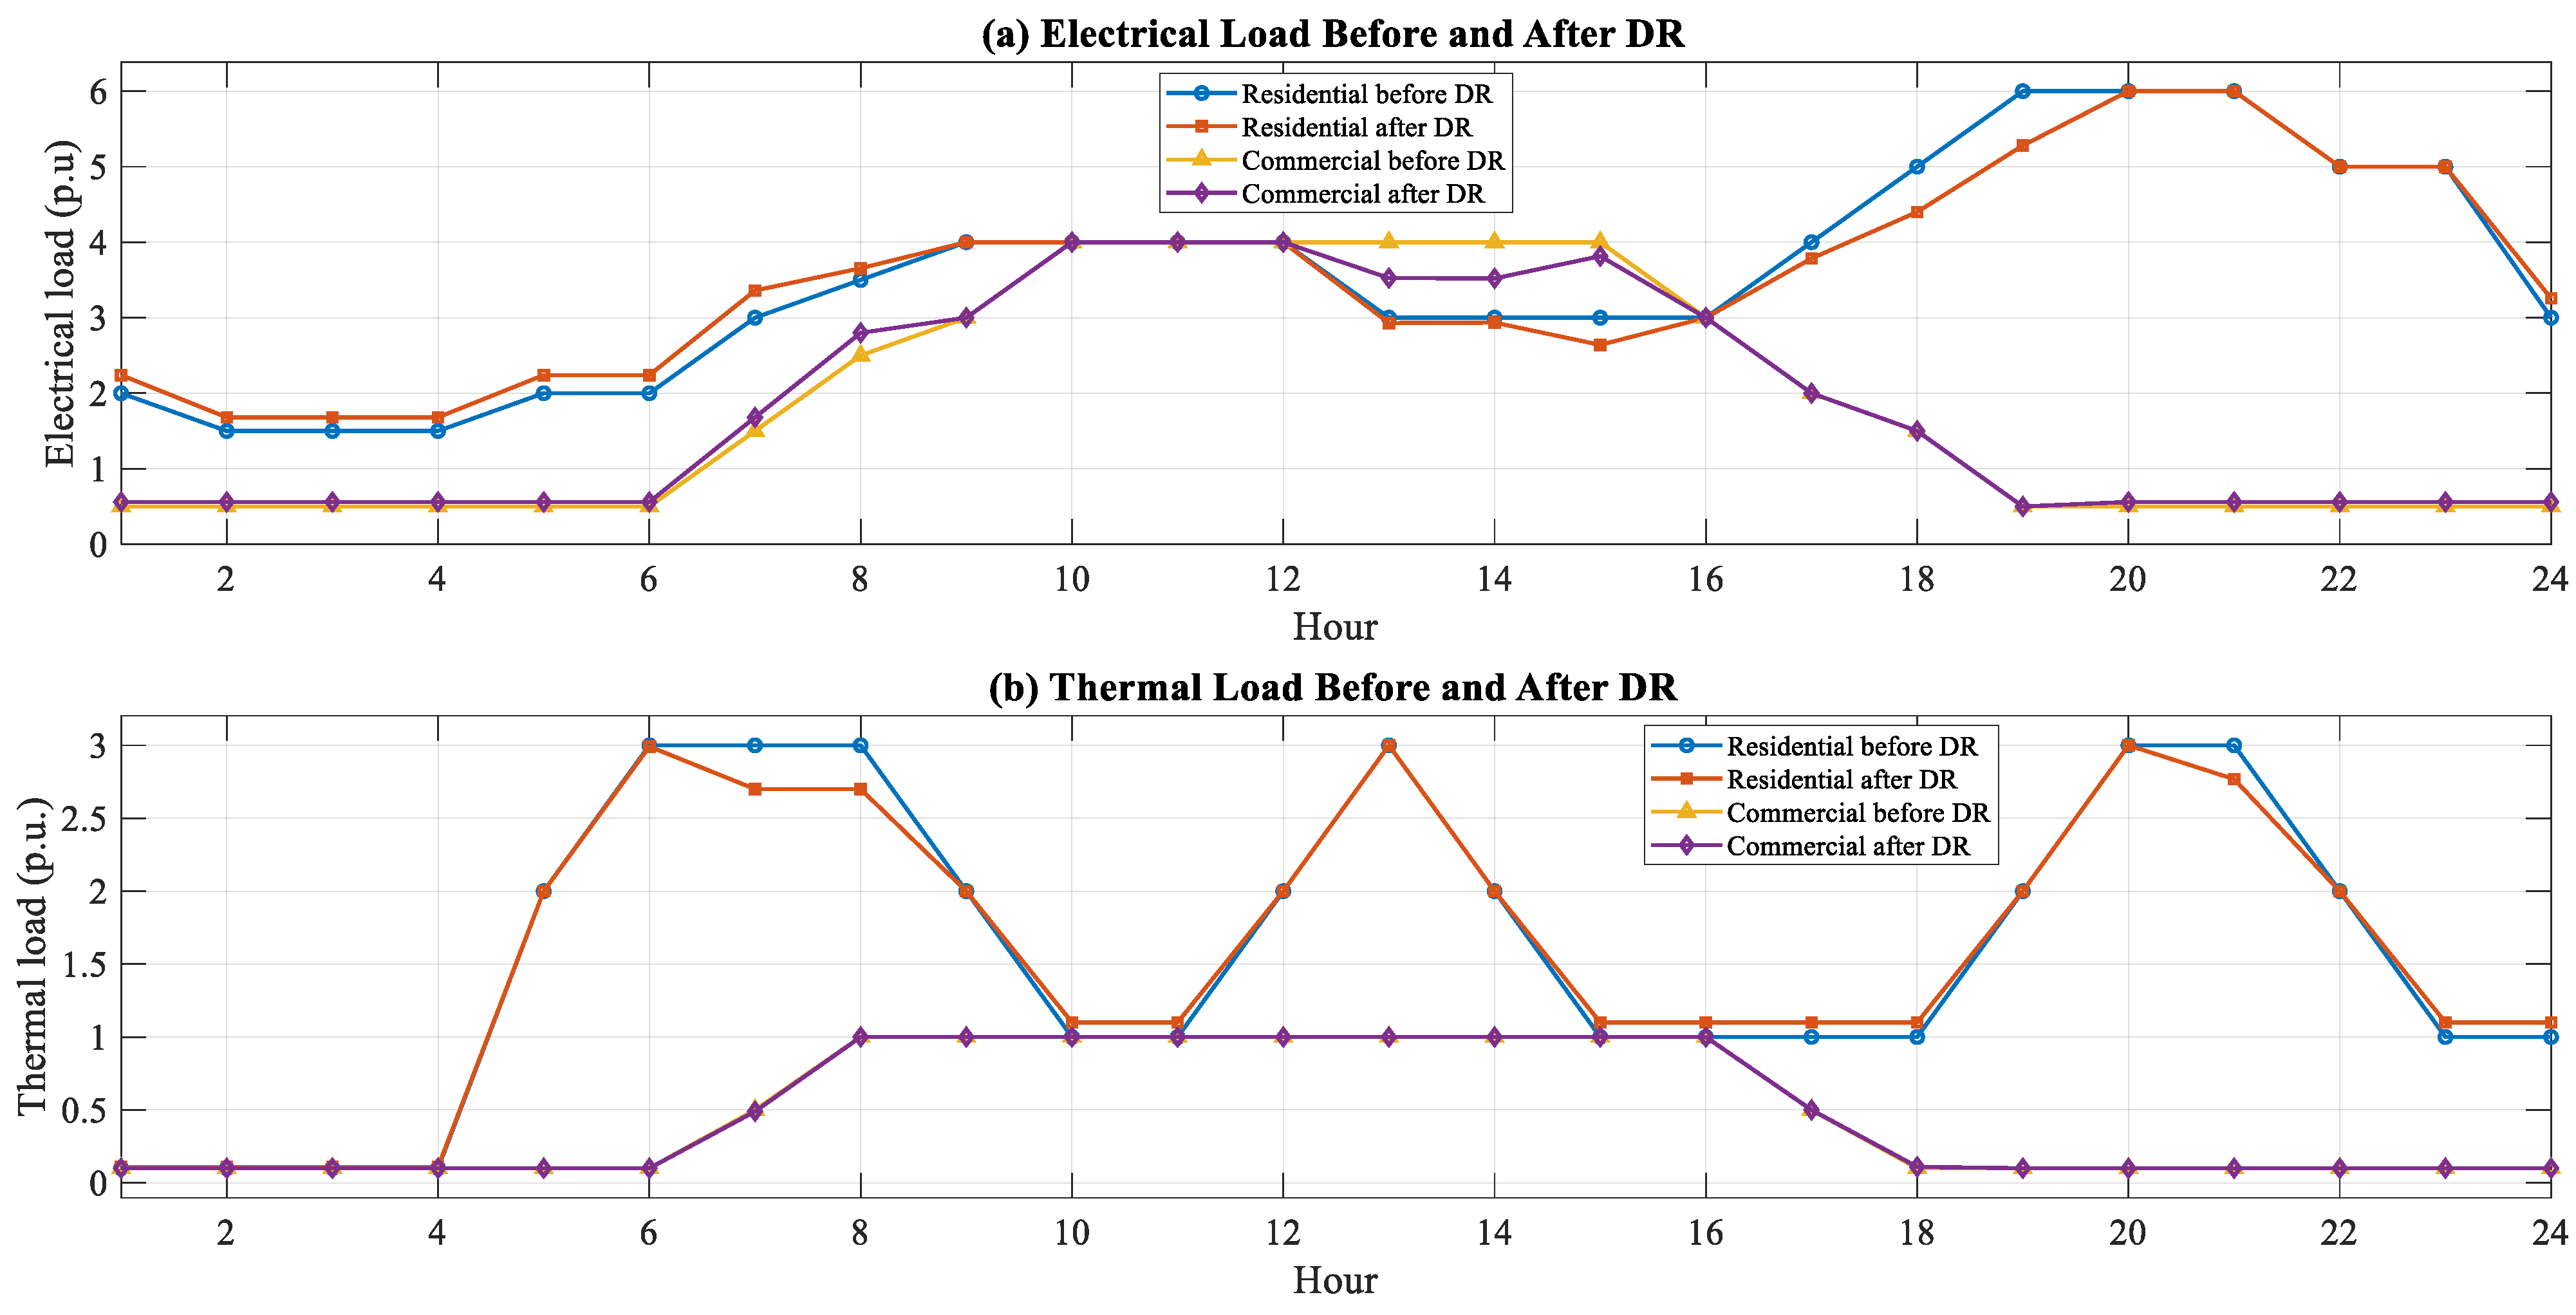
This subsection analyzes the operation of the main flexibility resources in the optimized schedules. Figure 5 first shows the direct impact of demand response on the hourly electrical and thermal load profiles. As observed, DR reduces demand during critical periods and shifts part of the load to other hours, leading to smoother electrical and thermal profiles. Therefore, the role of DR is mainly to reshape the load distribution over the scheduling horizon rather than simply reduce total demand.
It should be noted that Figure 5 only represents the direct effect of electrical and thermal DR. The effects of EV/V2G operation and inter-hub transfer limits are reflected indirectly through the optimization process and their interaction with DR, storage, and energy exchange decisions.
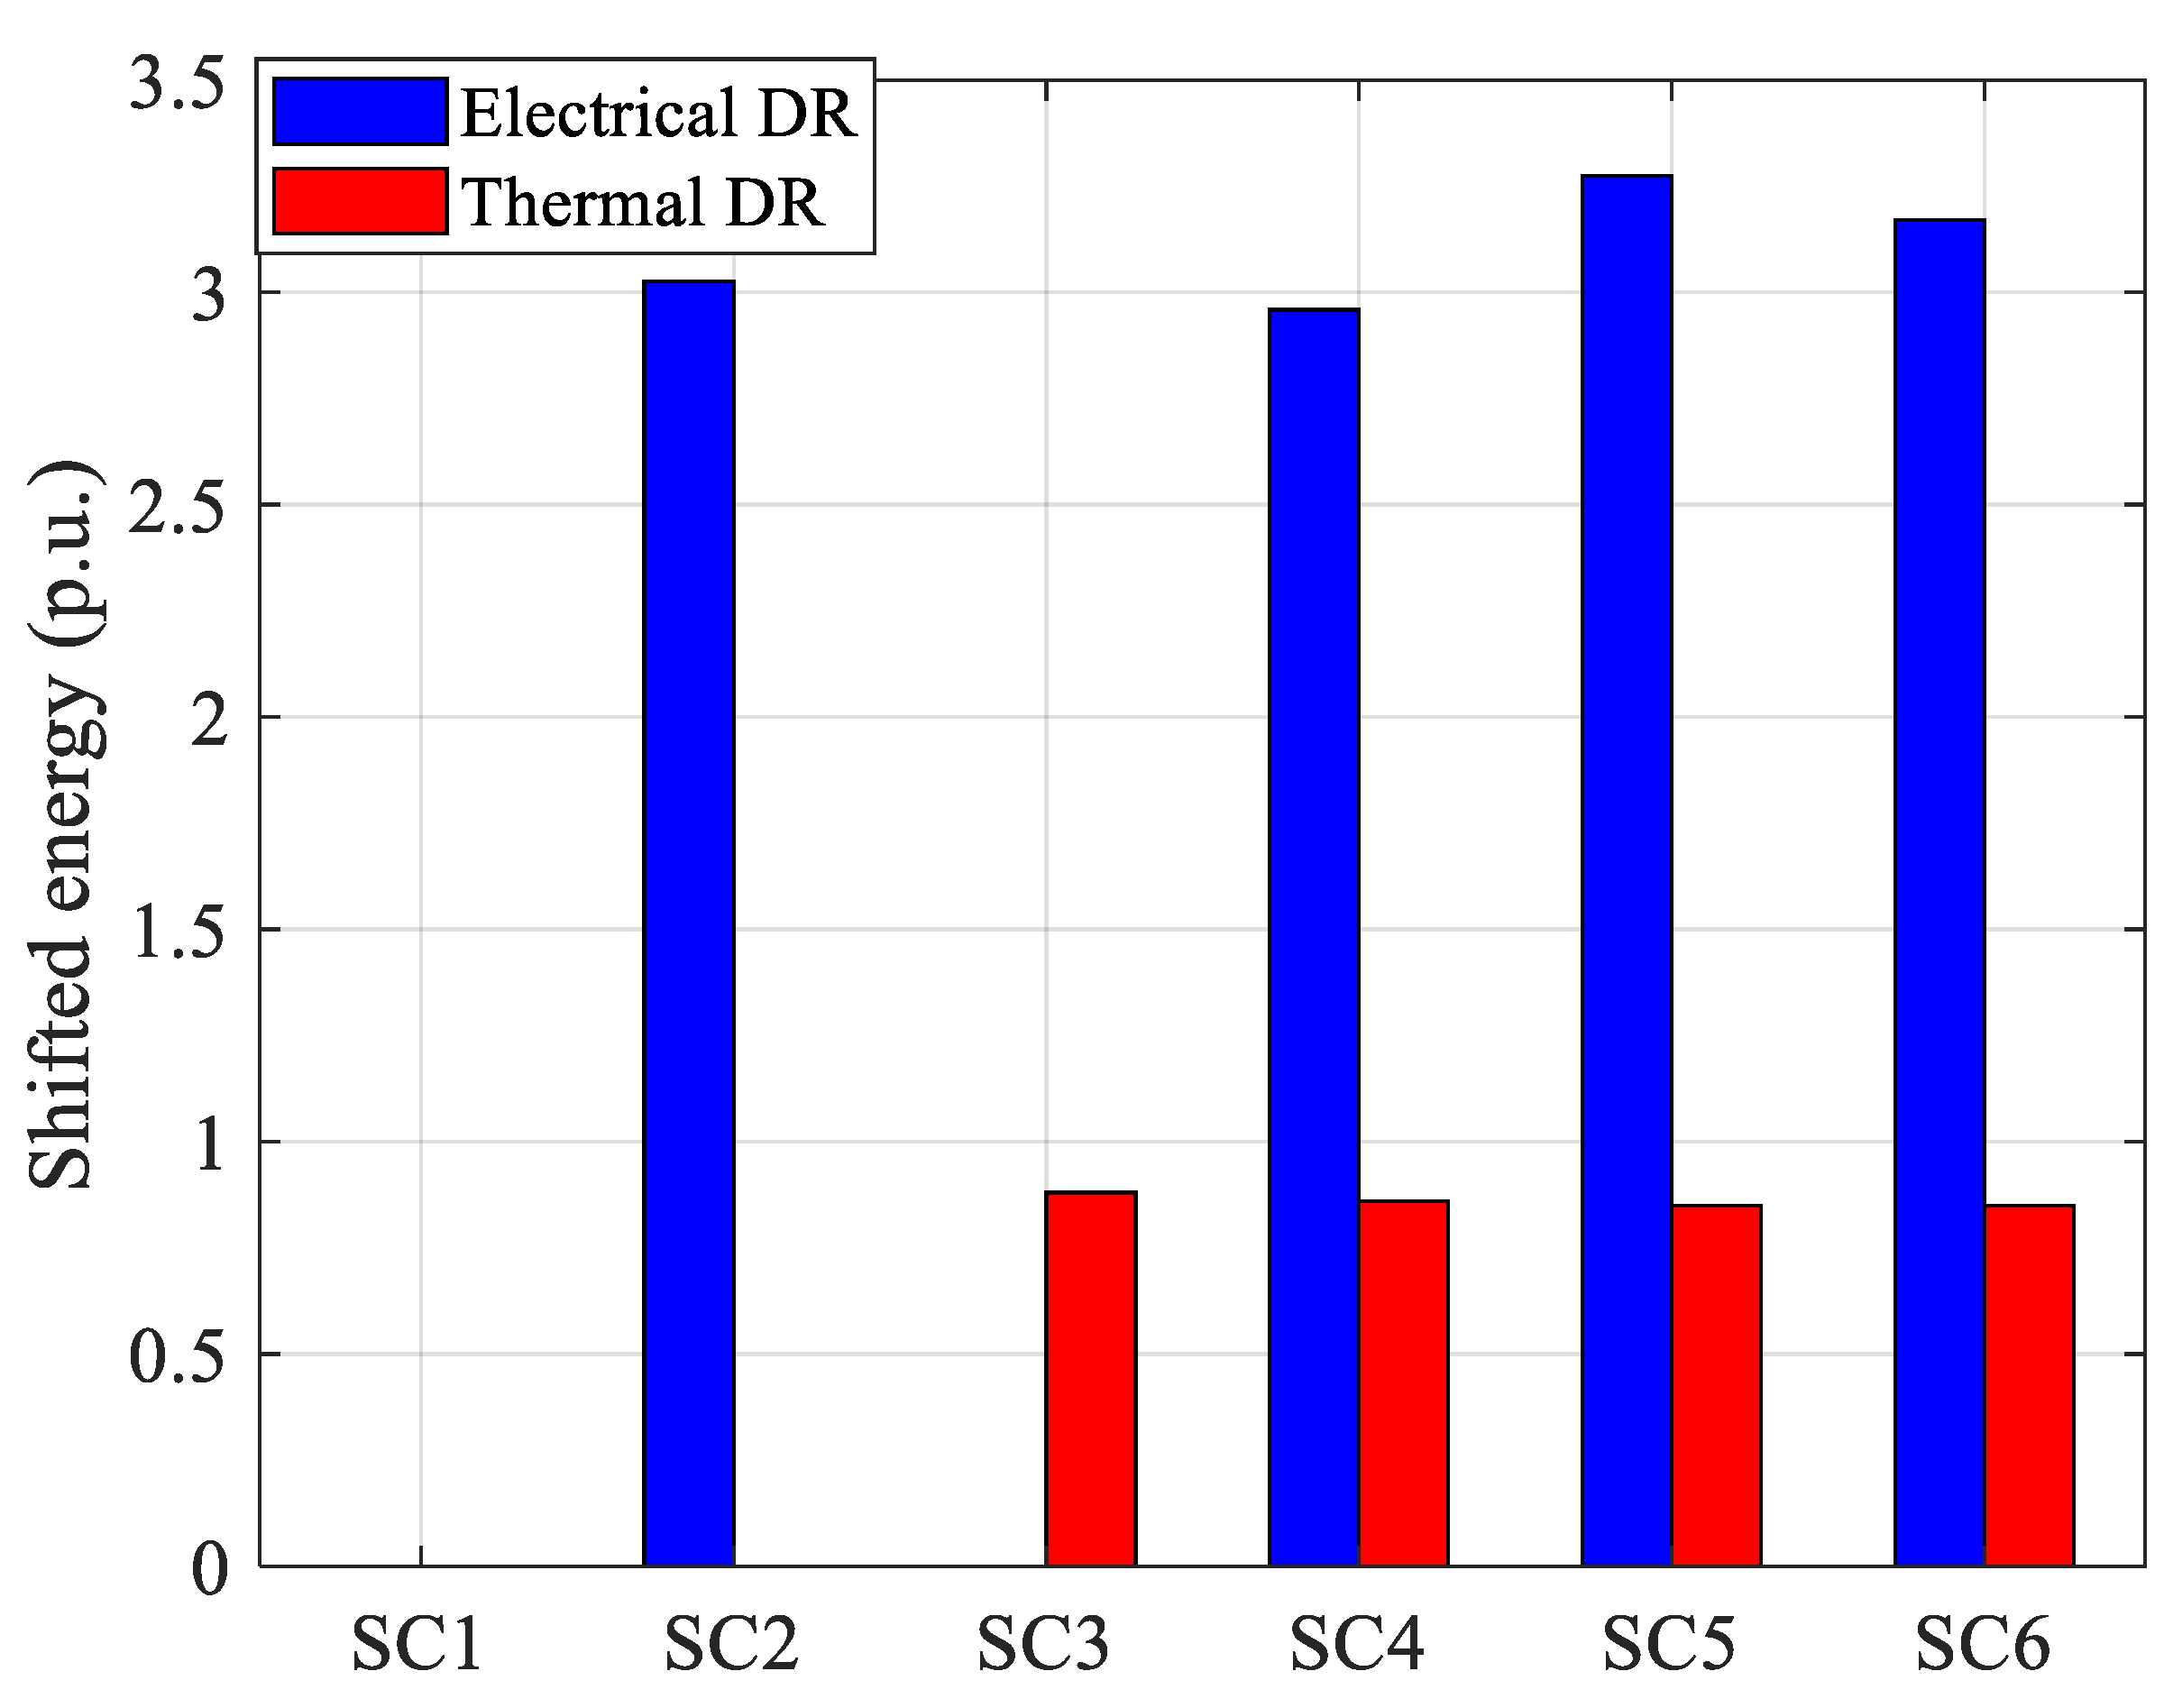
Figure 6 illustrates the participation level of electrical and thermal demand response across the studied scenarios. This comparison provides a scenario-level view of how much flexible demand is activated under different operating conditions. Figure 7 presents the EV charging, discharging, and state-of-charge profiles over the 24-h scheduling horizon. Together, these figures clarify how each flexibility resource contributes to balancing the interconnected hubs and improving the operational performance of the system.
It should be noted that electrical and thermal energy storage systems are considered as inherent components of the proposed interconnected energy hub structure and are therefore included in all scenarios. Accordingly, the objective of the scenario analysis is not to isolate the individual contribution of storage systems, but rather to evaluate the additional impacts of demand response, inter-hub exchange limitations, and EV/V2G integration under a consistent system configuration. Maintaining the storage units in all scenarios ensures a fair comparison among different operational strategies, while their contribution is reflected through their capability to provide temporal energy shifting and operational flexibility.
As shown in Figure 6, electrical and thermal demand response programs are activated according to the predefined scenario configurations. The obtained results demonstrate that electrical DR generally provides a higher level of flexibility compared with thermal DR, which is mainly related to the larger potential of electrical loads for temporal shifting. By modifying the distribution of demand over the scheduling horizon, DR reduces the pressure on energy supply resources and contributes to improving the overall economic performance of the interconnected energy hub system.
A comparison among different scenarios indicates that the activation of additional flexibility resources changes the required level of demand-side participation. In particular, Scenario 5 presents a higher electrical DR participation due to the more restrictive inter-hub exchange condition, requiring the system to rely more on local flexibility. In Scenario 6, the integration of EV/V2G provides an additional source of flexibility, which slightly reduces the dependence on DR while maintaining the supply–demand balance. This observation highlights the complementary interaction between different flexibility resources rather than the independent operation of each component.
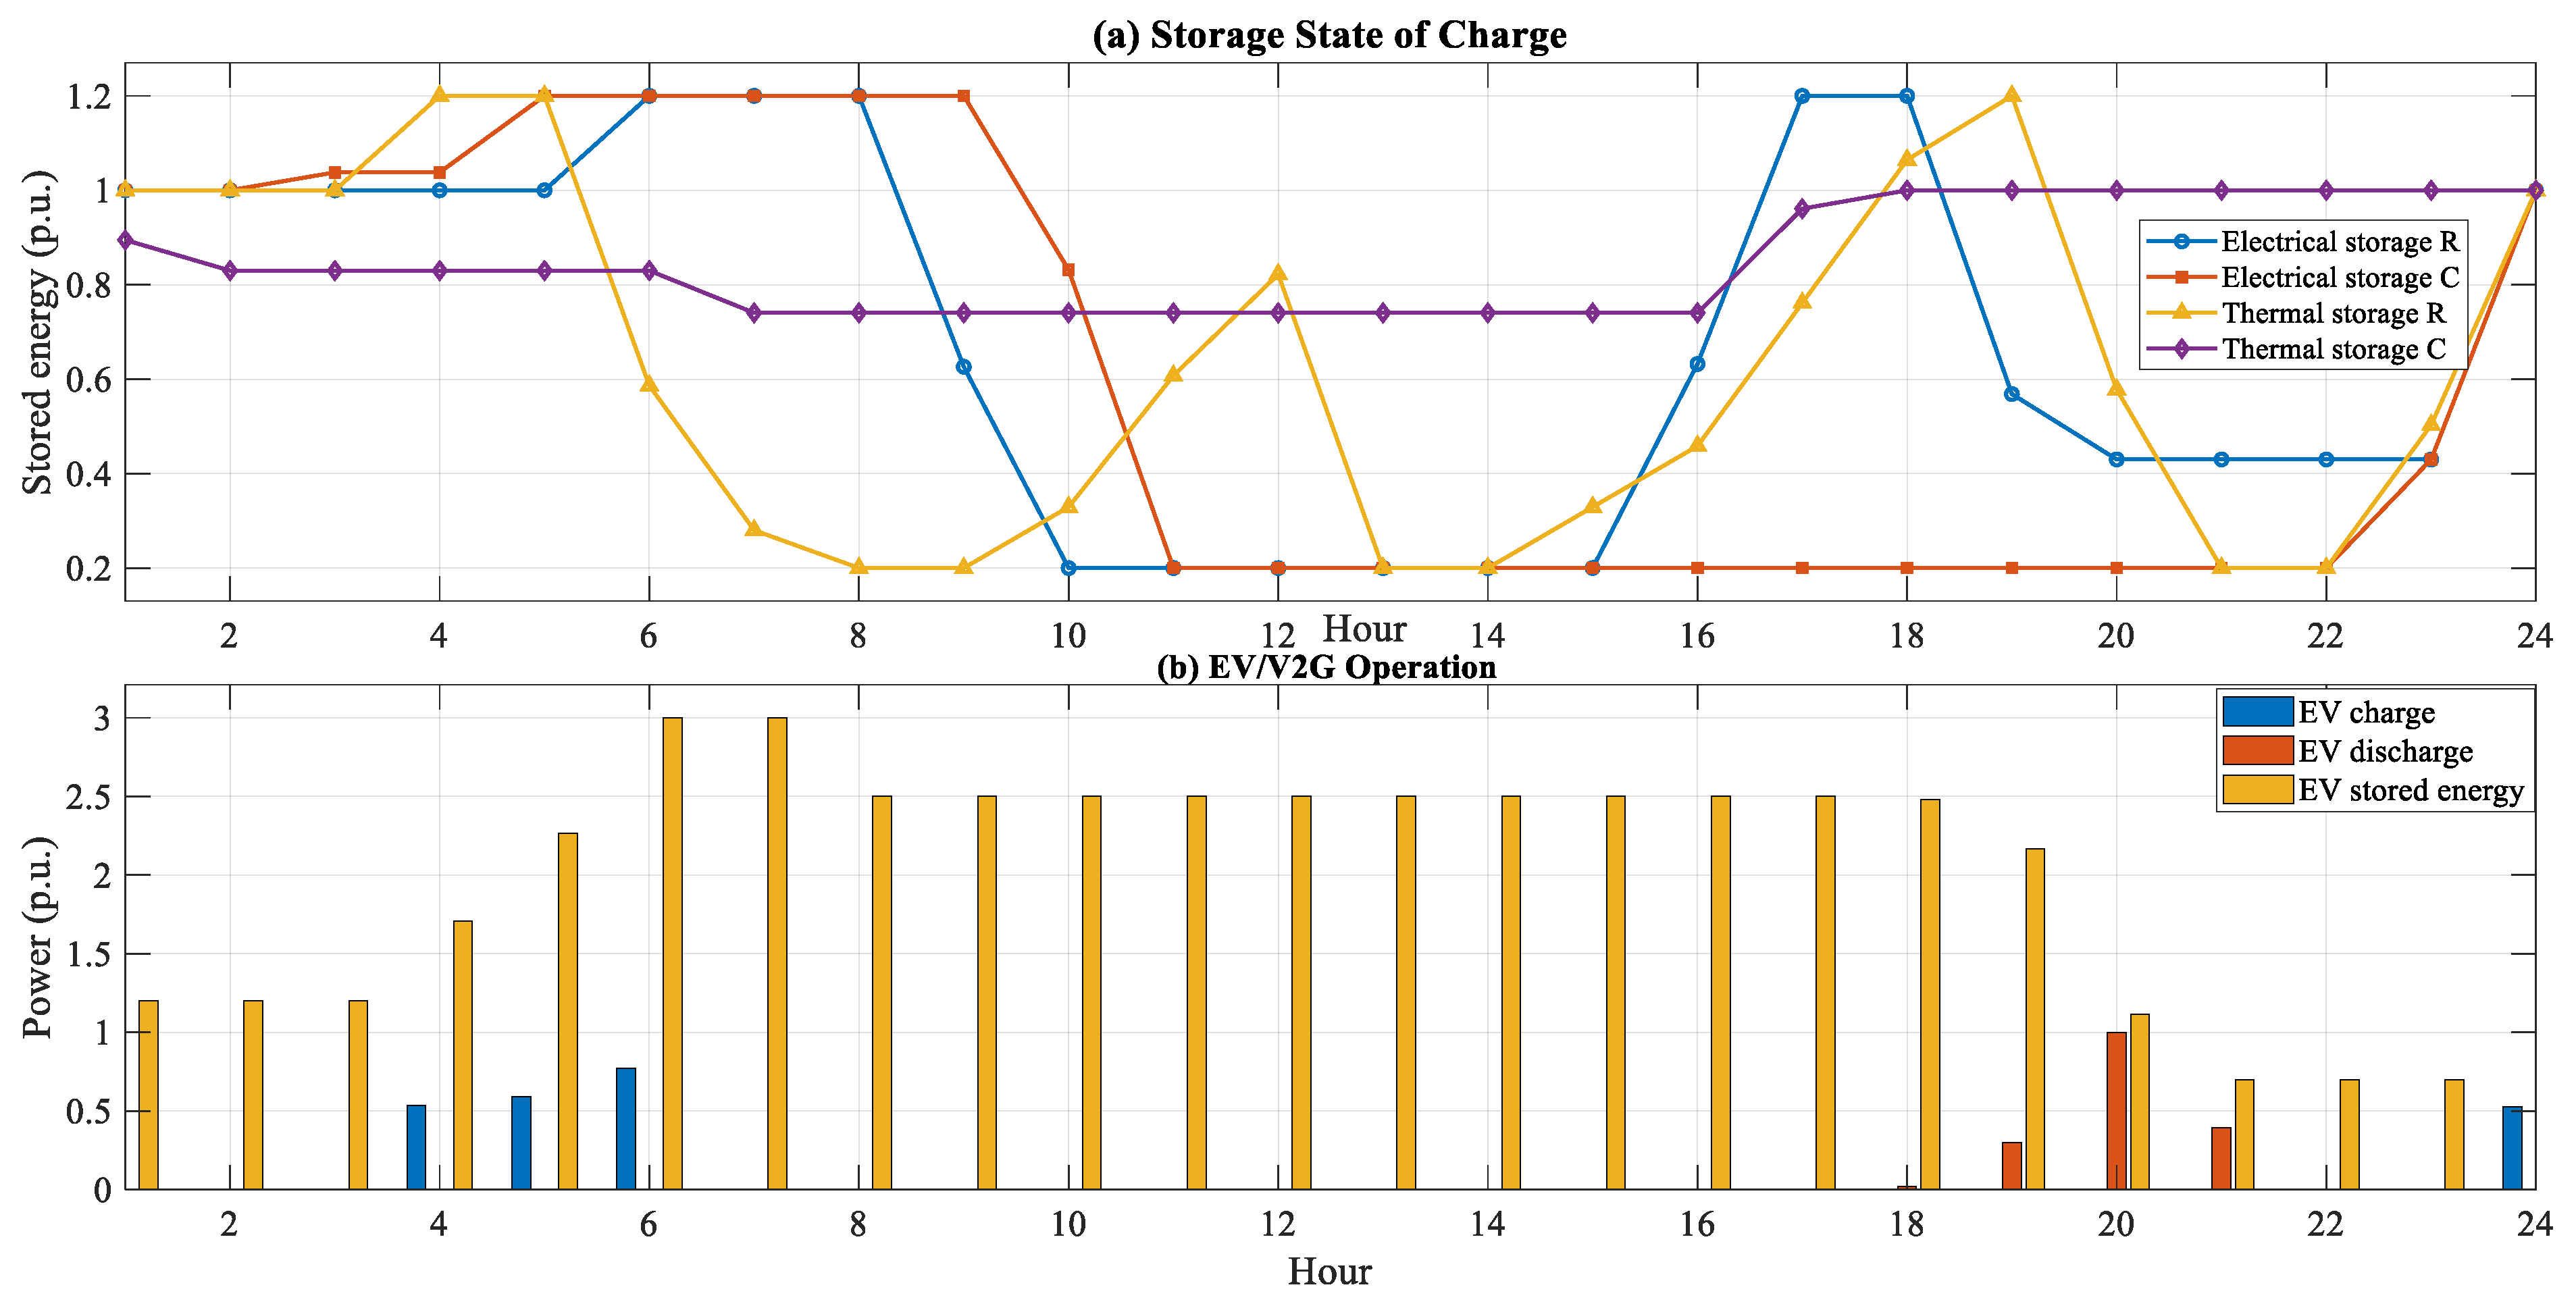
Figure 7 presents the hourly operation of electrical and thermal storage units as well as the EV/V2G system in the optimized schedule. As illustrated in Figure 7a, the stored energy levels of electrical and thermal storage units vary throughout the scheduling horizon, indicating that these components actively participate in energy management. The storage units are charged during periods with lower system stress and discharged when demand increases or additional energy support is required. This temporal shifting capability allows the interconnected hubs to reduce peak energy requirements and improve operational flexibility.
The stored energy profiles are not identical for residential and commercial hubs due to their different consumption characteristics. Residential demand shows stronger variations during specific daily periods, while commercial demand is mainly affected by daytime activities. Therefore, the optimization model determines different charging and discharging patterns for each hub based on their local requirements. This confirms that storage units are not passive elements but active flexibility resources that contribute to balancing energy supply and demand.
Figure 7b shows the charging, discharging, and stored energy profile of the EV under Scenario 6. The EV is mainly charged during suitable operating periods and provides energy support during higher-demand hours through V2G operation. This coordinated behavior enables the EV to participate in demand balancing and reduces the need for additional energy procurement during critical periods. Furthermore, the stored energy remains within the predefined operating limits, confirming that the EV battery constraints are satisfied throughout the scheduling horizon.
Overall, the results demonstrate that demand response, storage systems, and EVs provide complementary sources of flexibility. However, these findings also suggest that the system’s operational efficiency is not strictly proportional to the number of active flexibility resources. Instead, optimal performance relies on the effective alignment and coordination of these resources with the system’s inherent load profiles and constraints. Consequently, the greatest benefits are realized when the flexibility portfolio is strategically matched to the specific operational needs of the interconnected hubs, rather than simply maximizing the diversity of the available resources.

4.4. Effect of Inter-Hub Energy Exchange

Inter-hub energy exchange is considered here as a practical way to improve cooperation between the residential and commercial hubs. In this study, the residential and commercial hubs are allowed to exchange electrical energy within the predefined transfer limits. This connection enables each hub to use the surplus or more economical energy available in the other hub instead of relying only on local generation or external energy purchase.
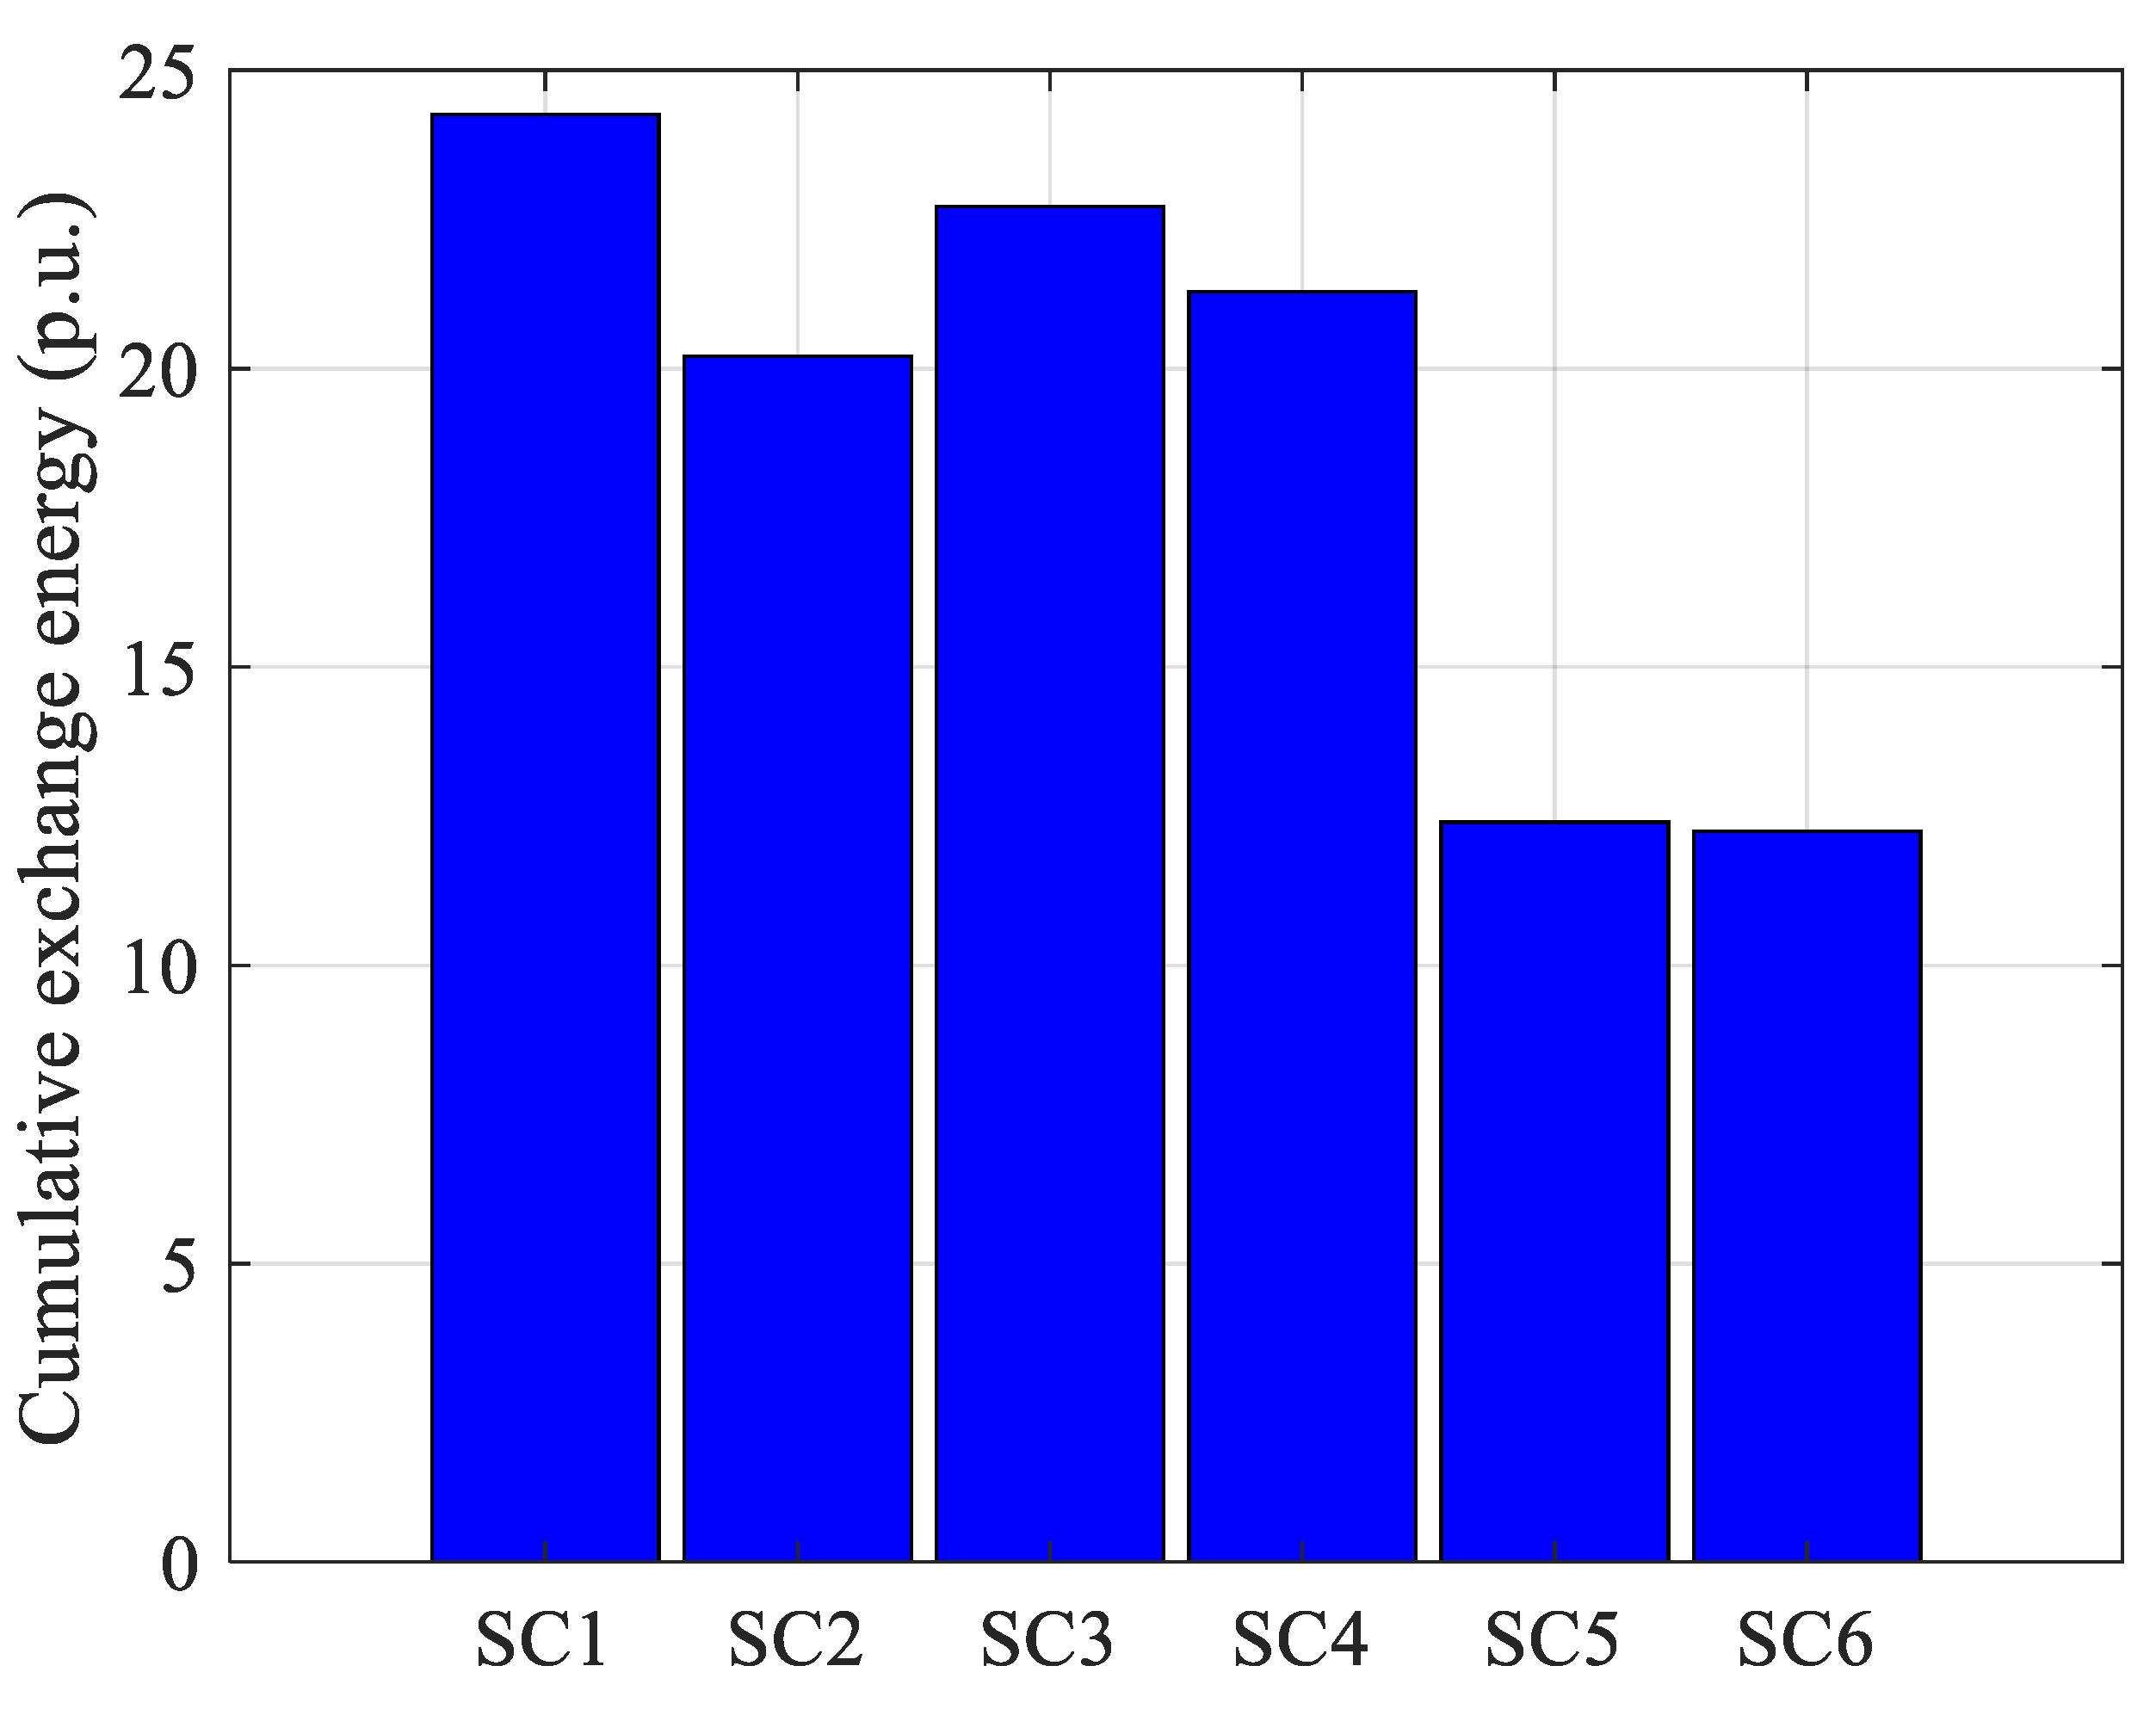
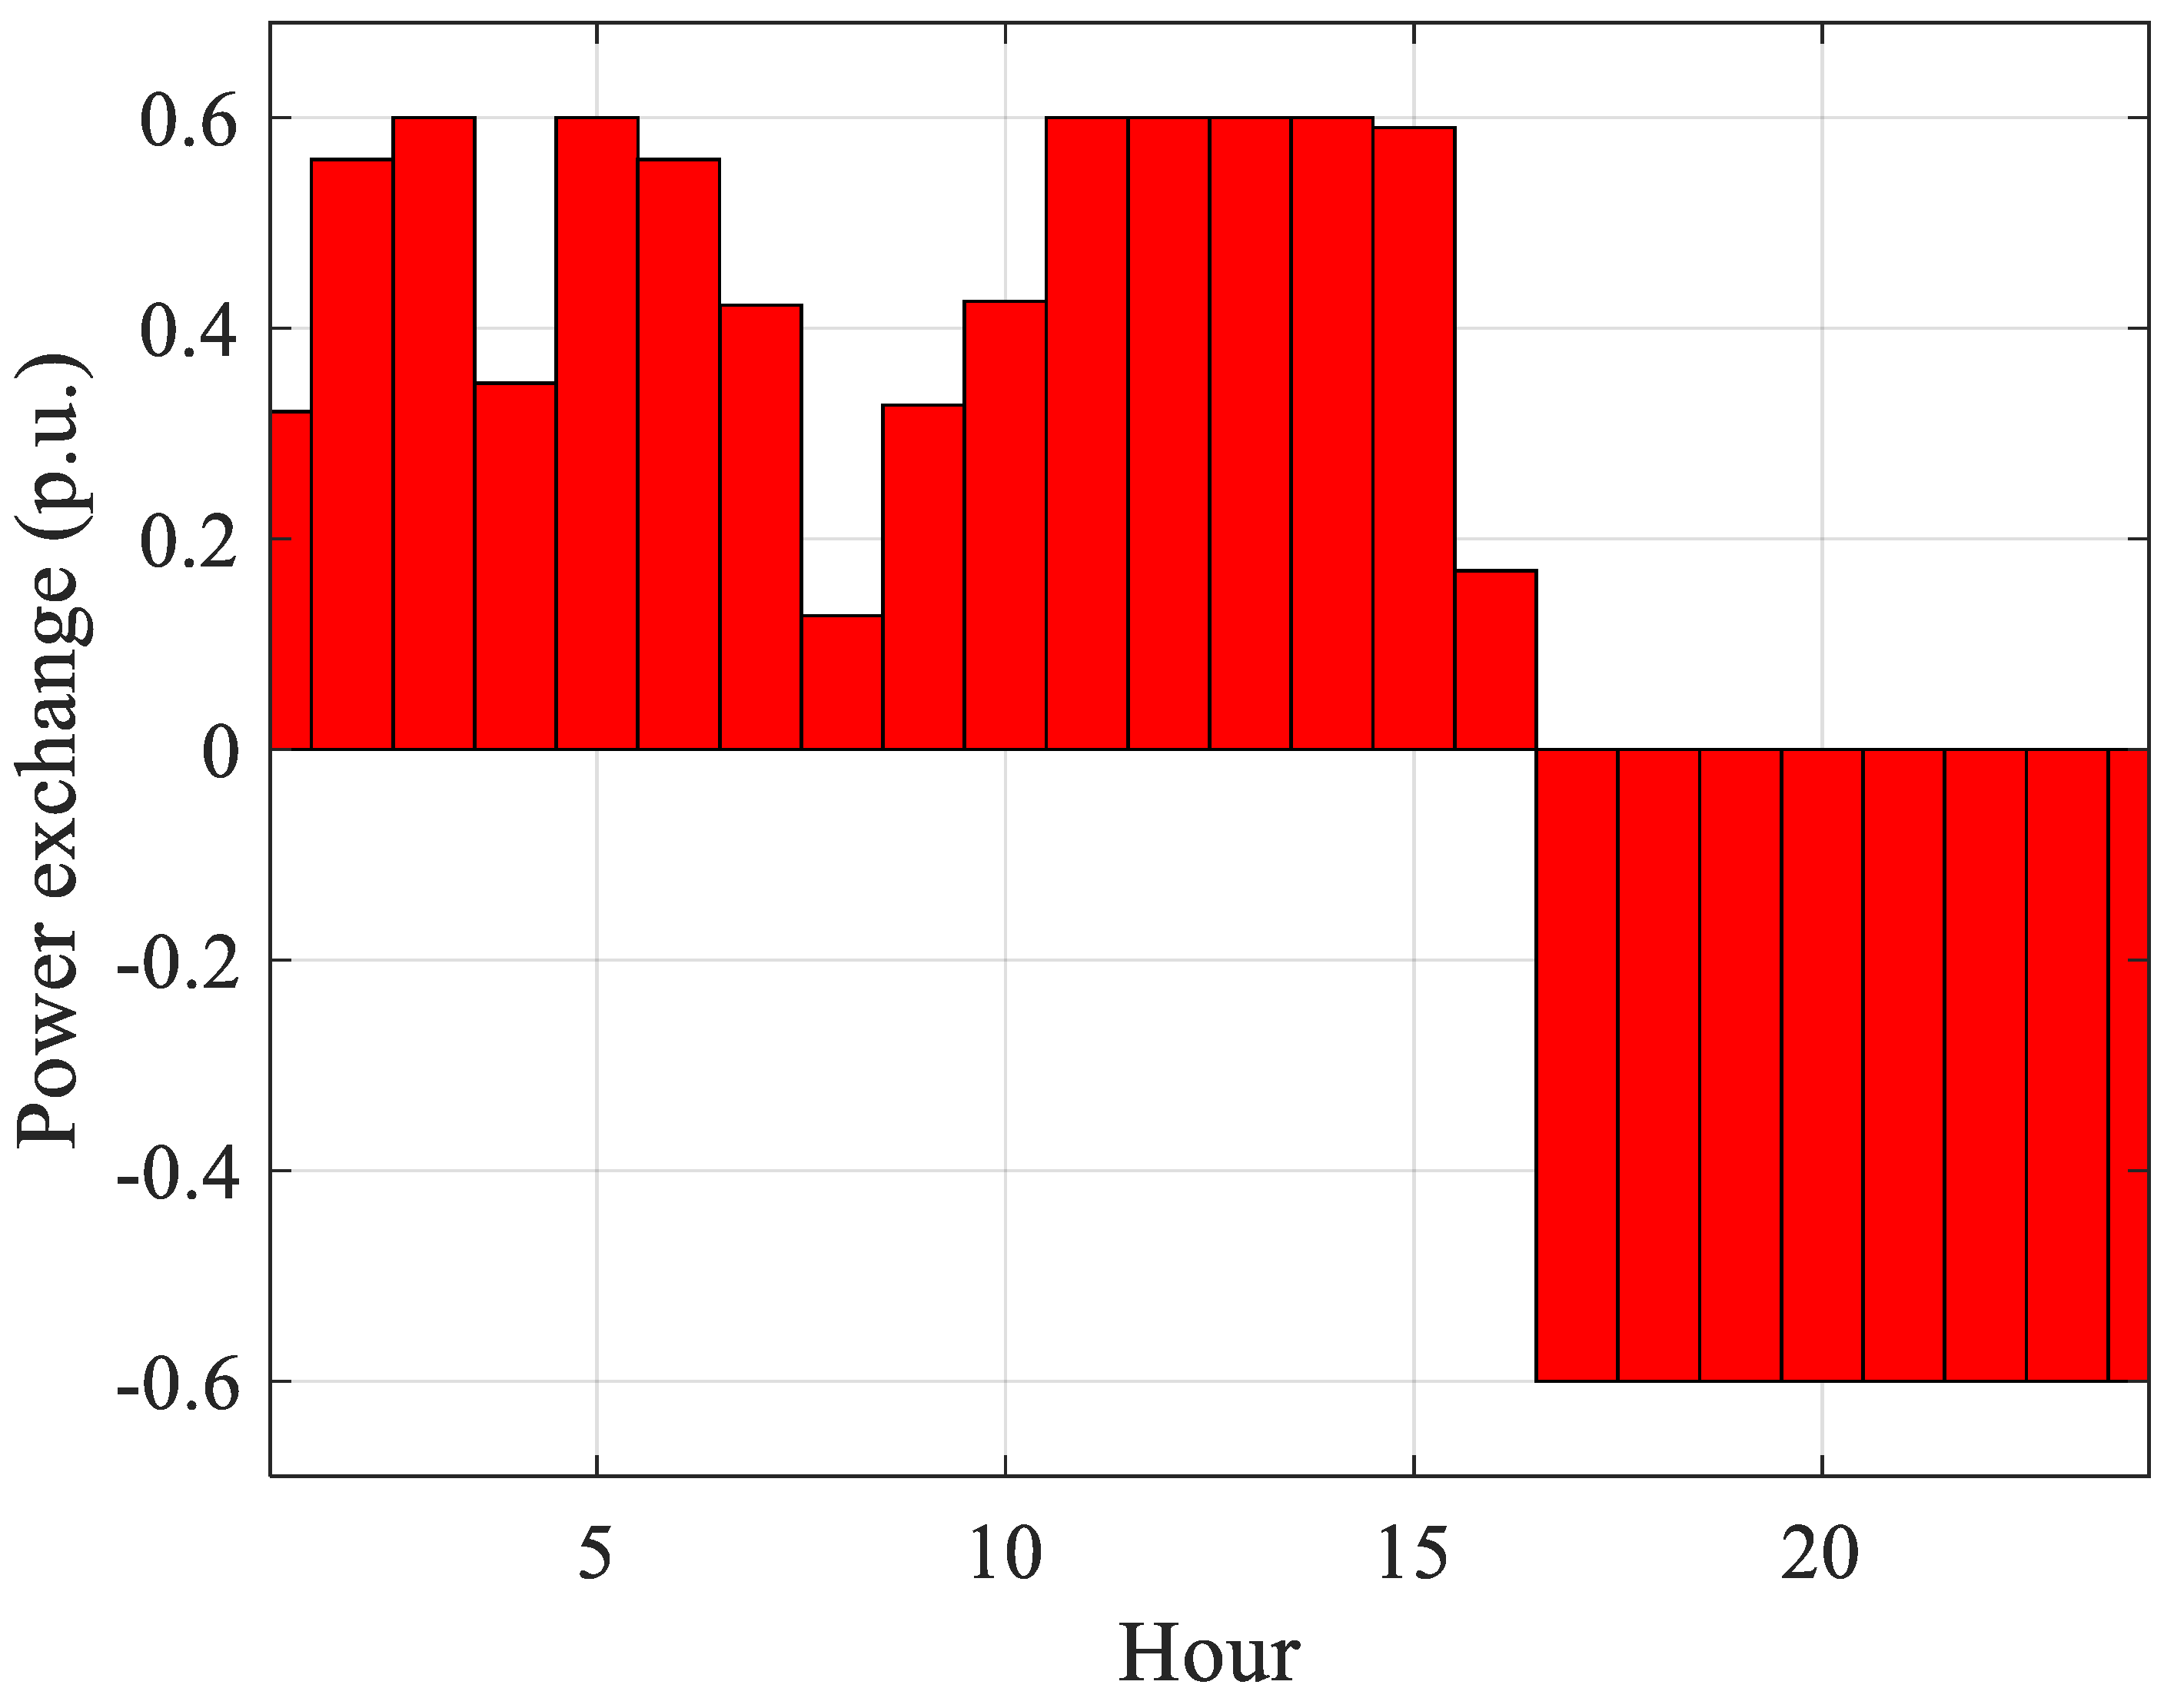
As a result, the exchange mechanism can improve resource sharing, reduce supply shortages, and enhance the overall coordination between the two hubs. Figure 8 compares the total absolute inter-hub energy exchange among the studied scenarios. As can be observed, SC1 and SC3 show the highest exchange levels, while SC5 and SC6 present noticeably lower values. This indicates that the amount of exchanged energy is strongly affected by the available flexibility options in each scenario. When fewer local flexibility resources are available, the hubs depend more on mutual energy exchange to balance their demands. In contrast, when storage systems, demand response, and EV participation are introduced, part of the required flexibility is provided locally, and the need for inter-hub exchange decreases. Figure 9 presents the hourly power exchange profile between the residential and commercial hubs for scenario 6. According to the adopted sign convention, positive values represent electricity transfer from the residential hub to the commercial hub, while negative values correspond to power flow in the opposite direction. The profile shows that the direction and magnitude of exchange vary significantly over the scheduling horizon. During the early and mid-day hours, the exchange is mostly positive, meaning that one hub supports the other according to the available energy and demand conditions. However, from the late afternoon onward, the exchange direction is reversed and reaches the transfer limit for several consecutive hours. This pattern highlights the time-dependent nature of energy sharing between interconnected hubs.
The hourly profile also shows that the exchange line is actively used during periods with higher operational stress. In particular, the sustained negative exchange during the final hours suggests that the receiving hub requires additional support when local resources are not sufficient or when external supply becomes less favorable. Such bidirectional operation improves the adaptability of the system and allows the hubs to respond more effectively to changes in load, storage status, and flexible resource availability.
Overall, the results confirm that inter-hub energy exchange plays a key role in the coordinated operation of multi-energy hubs. It provides an additional layer of flexibility by enabling energy sharing between hubs with different demand patterns and resource conditions. However, the results also show that the exchange requirement decreases when local flexibility resources are strengthened. This suggests that inter-hub exchange is most effective when it works together with demand response, storage operation, and EV participation, rather than acting as the only balancing mechanism.

4.5. Discussion of the Best Scenario

According to the comparative results, SC4 provides the most favorable overall performance among the studied scenarios. This scenario combines electrical and thermal demand response while maintaining the coordinated operation of the storage units and the interconnected hubs. As reported in Table 3, SC4 achieves the lowest total cost, equal to 2356.2, and also results in the lowest total unserved energy among all cases. The superiority of SC4 mainly comes from the simultaneous use of electrical and thermal demand-side flexibility. Electrical demand response reduces the pressure on the system during periods of high electricity demand, while thermal demand response improves heat-supply adequacy by shifting part of the thermal load within the scheduling horizon. As a result, the system benefits from flexibility in both energy carriers rather than relying on only one side of the demand.
Compared with SC2, where only electrical demand response is enabled, SC4 further reduces the thermal unserved energy from 1.055 p.u.·h to 0.215 p.u.·h. Similarly, compared with SC3, where only thermal demand response is considered, SC4 significantly decreases the electrical unserved energy from 6.0373 p.u.·h to 3.2800 p.u.·h. These comparisons confirm that the coordinated use of electrical and thermal DR is more effective than activating either flexibility option separately. Although SC6 includes EV participation and improves the performance relative to SC5, it does not achieve the best overall result. The total cost in SC6 is reduced from 3235.6 to 2917.0 compared with SC5, and the electrical unserved energy decreases from 7.9365 p.u.·h to 6.2265 p.u.·h. However, both values remain higher than those obtained in SC4. Therefore, EV participation provides an additional source of flexibility, but under the studied assumptions and constraints, it cannot fully compensate for the more favorable coordinated DR operation observed in SC4.
Overall, SC4 can be regarded as the preferred operating strategy for the proposed system. The results show that the best performance is obtained when electrical and thermal demand response are jointly scheduled with the available storage and hub coordination mechanisms. This finding highlights the importance of matching each flexibility resource with the corresponding energy carrier and operating constraint, rather than simply increasing the number of available flexible components.

5. Conclusions

This paper presented a day-ahead scheduling framework for an interconnected multi-energy hub system including residential and commercial hubs. The optimization problem was formulated with the aim of minimizing the total operating cost while accounting for both electrical and thermal unserved energy. Therefore, the objective function was not limited to economic operation only, but also reflected the ability of the system to supply multi-energy demands under different flexibility conditions.
The scenario-based results provided a clear insight into the role of different flexibility options. In the base case, the absence of flexibility led to the highest operating cost and the largest amount of unserved energy. When demand response was introduced, part of the load was shifted from expensive or constrained hours to more suitable periods, which reduced the total cost and improved the supply–demand balance. However, the results also showed that demand response alone could not fully remove the need for additional operational support.
The inclusion of energy storage systems improved scheduling performance by enabling energy to be stored during low-cost periods and discharged during peak or constrained hours. The results also highlighted the importance of inter-hub transfer capacity. When a tighter transfer constraint was imposed in SC5, the ability of the residential and commercial hubs to support each other was reduced, resulting in higher electrical unserved energy and operating cost. In contrast, SC4 achieved the best economic performance and the minimum total cost while maintaining reduced levels of electrical and thermal unserved energy. EV/V2G participation provided additional flexibility under the constrained conditions of SC6. Although this scenario did not produce the lowest cost, EVs supported hub operation and partially reduced unmet demand.
Overall, the comparative analysis confirms that the objective function captures the trade-off between economic performance and supply adequacy. The results show that the benefits of coordinating demand response, storage, inter-hub exchange, and EV/V2G depend on transfer capacity, resource availability, and operating conditions.
Future studies will extend the proposed deterministic MILP framework by incorporating uncertainty-aware optimization approaches. In particular, uncertainties related to renewable generation, demand forecasting, electricity prices, and EV availability will be investigated using stochastic or robust optimization methods to improve the practical applicability of interconnected energy hub scheduling.

Author Contributions

Conceptualization, H.L. and M.S.; methodology, H.L.; software, H.L.; validation, H.L., M.S. and H.R.; formal analysis, H.L.; investigation, H.L. resources, H.R.; data curation, H.L.; writing—original draft preparation, H.L.; writing—review and editing, H.L., M.S. and H.R.; visualization, H.L.; supervision, M.S. All authors have read and agreed to the published version of the manuscript.

Funding

This research received no external funding.

Data Availability Statement

The data presented in this study are available on request from the corresponding author.

Conflicts of Interest

The authors declare no conflict of interest.

Nomenclature

Symbols
SymbolDescription
tScheduling time interval
TNumber of scheduling periods
PElectrical power
HThermal power
EStored energy
FrcBidirectional electricity exchange between interconnected hubs
FabsAbsolute value of inter-hub electricity exchange
PchCharging power of energy storage system
PdisDischarging power of energy storage system
EmaxMaximum energy capacity of storage system
PmaxMaximum charging/discharging power
PEVElectric vehicle charging/discharging power
EEVElectric vehicle battery stored energy
UeUnserved electrical energy
UhUnserved thermal energy
CopOperational cost
VOLLeValue of lost electrical energy
VOLLhValue of lost thermal energy
(η)Conversion efficiency
xContinuous decision variable
uBinary decision variable
Subscripts and Superscripts
SymbolDescription
eElectrical energy
hThermal energy
RResidential energy hub
CCommercial energy hub
CHPCombined heat and power unit
EVElectric vehicle
ESSEnergy storage system
chCharging operation
disDischarging operation
maxMaximum value
minMinimum value
tTime index

Abbreviations

AbbreviationDescription
EHEnergy Hub
MEHMulti-Energy Hub
MILPMixed-Integer Linear Programming
DRDemand Response
ESSEnergy Storage System
EVElectric Vehicle
V2GVehicle-to-Grid
CHPCombined Heat and Power
TOUTime-of-Use
VOLLValue of Lost Load
PVPhotovoltaic
RESRenewable Energy Sources
SCScenario
MCMonte Carlo

References

  1. Hamedani, E.A.; Khodaparast, P.; Hosseini, E.; Mahmudy, T.; Yajloo, A.B. A mini-review of energy hub: Concept, components, classifications, and applications. Energy Rep. 2026, 15, 108886. [Google Scholar] [CrossRef] [Scilit]
  2. Samadi, M.; Nikkhah, M.H.; Lotfi, H. Electric vehicles and the operation of multi-carrier energy systems in the smart grid: A review study. Int. J. Ambient Energy 2024, 45, 2331231. [Google Scholar] [CrossRef] [Scilit]
  3. Nikkhah, M.H.; Lotfi, H.; Samadi, M.; Hajiabadi, M.E. Scenario-Based Modeling of Converter Failures in Energy Hub Management Cost. Results Eng. 2025, 27, 106460. [Google Scholar] [CrossRef] [Scilit]
  4. Mokaramian, E.; Shayeghi, H.; Younesi, A.; Shafie-Khah, M.; Siano, P. Energy hubs components and operation: State-of-the-art review. Renew. Sustain. Energy Rev. 2025, 212, 115395. [Google Scholar] [CrossRef] [Scilit]
  5. Aljabery, A.A.M.; Mehrjerdi, H.; Mahdavi, S.; Hemmati, R. Multi carrier energy systems and energy hubs: Comprehensive review, survey and recommendations. Int. J. Hydrogen Energy 2021, 46, 23795–23814. [Google Scholar] [CrossRef] [Scilit]
  6. Garau, M.; Torsæter, B.N. A methodology for optimal placement of energy hubs with electric vehicle charging stations and renewable generation. Energy 2024, 304, 132068. [Google Scholar] [CrossRef] [Scilit]
  7. Javadi, M.S.; Nezhad, A.E.; Jordehi, A.R.; Gough, M.; Santos, S.F.; Catalão, J.P. Transactive energy framework in multi-carrier energy hubs: A fully decentralized model. Energy 2022, 238, 121717. [Google Scholar] [CrossRef] [Scilit]
  8. Tarahomi, N.; Samadi, M.; Nikkhah, M.H. General Modeling of Interconnected Hubs in Series and Parallel Structures. Int. J. Energy Res. 2023, 2023, 9983860. [Google Scholar] [CrossRef] [Scilit]
  9. Wang, X.; Liu, Y.; Liu, C.; Liu, J. Coordinating energy management for multiple energy hubs: From a transaction perspective. Int. J. Electr. Power Energy Syst. 2020, 121, 106060. [Google Scholar] [CrossRef] [Scilit]
  10. Lei, J.; Zhou, C.; Li, X.; Huang, A.; Bai, H.; Yuan, Z.; Zhou, L. Energy management considering energy storage and demand response for smart energy hub in Internet of Things. IEEE Access 2020, 13, 120663–120671. [Google Scholar] [CrossRef] [Scilit]
  11. Mirzaei, M.A.; Zare Oskouei, M.; Mohammadi-Ivatloo, B.; Loni, A.; Zare, K.; Marzband, M.; Shafiee, M. Integrated energy hub system based on power-to-gas and compressed air energy storage technologies in the presence of multiple shiftable loads. IET Gener. Transm. Distrib. 2020, 14, 2510–2519. [Google Scholar] [CrossRef] [Scilit]
  12. Nikkhah, M.H.; Lotfi, H.; Samadi, M.; Hajiabadi, M.E. Energy hub management considering demand response, distributed generation, and electric vehicle charging station. Int. Trans. Electr. Energy Syst. 2023, 2023, 9042957. [Google Scholar] [CrossRef] [Scilit]
  13. Hu, Y.; Jin, Y. Energy hubs integrating renewable energy sources and demand response programs for cost-effective operations. Energy 2025, 333, 137271. [Google Scholar] [CrossRef] [Scilit]
  14. Aghamohamadi, M.; Samadi, M.; Pirnahad, M. Modeling and evaluating the energy hub effects on a price responsive load. Iran. J. Electr. Electron. Eng. 2019, 15, 65–75. [Google Scholar] [CrossRef] [Scilit]
  15. Jordehi, A.R.; Javadi, M.S.; Shafie-khah, M.; Catalão, J.P. Information gap decision theory (IGDT)-based robust scheduling of combined cooling, heat and power energy hubs. Energy 2021, 231, 120918. [Google Scholar] [CrossRef] [Scilit]
  16. Mokaramian, E.; Shayeghi, H.; Sedaghati, F.; Safari, A.; Alhelou, H.H. An optimal energy hub management integrated EVs and RES based on three-stage model considering various uncertainties. IEEE Access 2022, 10, 17349–17365. [Google Scholar] [CrossRef] [Scilit]
  17. Roustai, M.; Rayati, M.; Sheikhi, A.; Ranjbar, A. A scenario-based optimization of smart energy hub operation in a stochastic environment using conditional-value-at-risk. Sustain. Cities Soc. 2018, 39, 309–316. [Google Scholar] [CrossRef] [Scilit]
  18. Hou, W.; Liu, Z.; Ma, L.; Wang, L. A real-time rolling horizon chance constrained optimization model for energy hub scheduling. Sustain. Cities Soc. 2020, 62, 102417. [Google Scholar] [CrossRef] [Scilit]
  19. Rossi, M.; Jin, L.; Ferrario, A.M.; Di Somma, M.; Buonanno, A.; Papadimitriou, C.; Morch, A.; Graditi, G.; Comodi, G. Energy hub and micro-energy hub architecture in integrated local energy communities: Enabling technologies and energy planning tools. Energies 2024, 17, 4813. [Google Scholar] [CrossRef] [Scilit]
  20. Mesloub, A.; Faridi, W.; Ghodratallah, P.; Rajab, H.; Singh, N.S.S.; Sadeq, A.M.; Aich, W.; Shalaby, M. Multi-objective economic energy management strategy in thermal and electrical grids with energy hubs including renewable units and storage systems. Sci. Rep. 2026, 16, 2675. [Google Scholar] [CrossRef] [Scilit] [PubMed]
  21. Aich, W.; Basem, A.; Sawaran Singh, N.S.; Mausam, K.; Hussein, Z.A.; Dixit, S.; Ali, N.B.; Said, L.B.; Rajhi, W.; Mostafazadeh, L. Two-layer energy scheduling of electrical and thermal smart grids with energy hubs including renewable and storage units considering energy markets. Sci. Rep. 2025, 15, 25079. [Google Scholar] [CrossRef] [Scilit] [PubMed]
  22. Giannelos, S.; Pudjianto, D.; Zhang, T.; Strbac, G. Energy hub operation under uncertainty: Monte Carlo risk assessment using gaussian and KDE-based data. Energies 2025, 18, 1712. [Google Scholar] [CrossRef] [Scilit]
  23. Dolatnia, A.; Sarvari, P.; Sarmadi, B.K.; Baghramian, A. An interval-based model for stochastic optimal scheduling of multi carrier energy hubs in the presence of multiple sources of uncertainty. Electr. Power Syst. Res. 2025, 242, 111447. [Google Scholar] [CrossRef] [Scilit]
  24. Dini, A.; Hassankashi, A.; Pirouzi, S.; Lehtonen, M.; Arandian, B.; Baziar, A.A. A flexible-reliable operation optimization model of the networked energy hubs with distributed generations, energy storage systems and demand response. Energy 2022, 239, 121923. [Google Scholar] [CrossRef] [Scilit]
  25. Asgarian Honarmand, H.; Ghaderi Shamim, A.; Meyar-Naimi, H. A robust optimization framework for energy hub operation considering different time resolutions: A real case study. Sustain. Energy Grids Netw. 2021, 28, 100526. [Google Scholar] [CrossRef] [Scilit]
  26. Geidl, M.; Koeppel, G.; Favre-Perrod, P.; Klöckl, B.; Andersson, G.; Fröhlich, K. Energy hubs for the future. IEEE Power Energy Mag. 2007, 5, 24–30. [Google Scholar] [CrossRef] [Scilit]
  27. Bozchalui, S.A.; Hashmi, S.A.; Hassen, H.; Cañizares, C.A.; Bhattacharya, K. Optimal operation of residential energy hubs in smart grids. IEEE Trans. Smart Grid 2012, 3, 1755–1766. [Google Scholar] [CrossRef] [Scilit]
  28. Siano, P. Demand response and smart grids—A survey. Renew. Sustain. Energy Rev. 2014, 30, 461–478. [Google Scholar] [CrossRef] [Scilit]
  29. He, Y.; Venkatesh, B.; Guan, L. Optimal scheduling for charging and discharging of electric vehicles. IEEE Trans. Smart Grid 2012, 3, 1095–1105. [Google Scholar] [CrossRef] [Scilit]
  30. Mancarella, P. MES (multi-energy systems): An overview of concepts and evaluation models. Energy 2014, 65, 1–17. [Google Scholar] [CrossRef] [Scilit]
Figure 1. Interconnected residential and commercial energy hubs.
Wevj 17 00436 g001
Figure 2. Hourly electrical and thermal load profiles of the residential and commercial hubs over the 24-h scheduling horizon.
Wevj 17 00436 g002
Figure 3. Total cost comparison among the studied scenarios.
Wevj 17 00436 g003
Figure 4. Electrical, thermal, and total unserved energy comparison among the studied scenarios.
Wevj 17 00436 g004
Figure 5. Electrical and thermal load profiles before and after optimized demand response implementation: (a) electrical demand and (b) thermal demand.
Wevj 17 00436 g005
Figure 6. Electrical and thermal demand response participation across the studied scenarios.
Wevj 17 00436 g006
Figure 7. Hourly operation of storage and EV resources: (a) stored energy profiles of electrical and thermal storage units in residential and commercial hubs, and (b) EV charging, discharging, and stored energy profiles under Scenario 6.
Wevj 17 00436 g007
Figure 8. Total absolute inter-hub energy exchange under different scenarios.
Wevj 17 00436 g008
Figure 9. Hourly bidirectional power exchange between residential and commercial energy hubs under scenario 6.
Wevj 17 00436 g009
Table 1. Comparison of the proposed framework with representative energy hub scheduling studies.
Ref.Interconnected Energy HubsMulti-Carrier Energy (E/G/H)Electrical DRThermal DRElectrical StorageThermal StorageEV/V2GScenario-Based Evaluation of Flexibility Layers
[8]
[9]
[12]
[16]
[17]
[18]
[20]
[23]
[24]
This work
Table 2. Economic and general simulation data.
ParameterValueUnit
Scheduling horizon24h
Time step1h
Off-peak electricity price8$/(p.u.·h)
Mid-peak electricity price10$/(p.u.·h)
On-peak electricity price14$/(p.u.·h)
Natural gas price7$/(p.u.·h)
Heat price3$/(p.u.·h)
Electrical value of lost load (VOLLe)200$/(p.u.·h)
Thermal value of lost load (VOLLh)150$/(p.u.·h)
Table 3. Technical parameters of the interconnected energy hub system.
ParameterValueUnit
Electrical conversion efficiency, ηee0.985-
Gas-to-electricity efficiency, ηge0.37-
Gas-to-heat efficiency, ηgh0.43-
Heat conversion efficiency, ηhh0.90-
Electrical storage charge/discharge efficiency0.95/0.95-
Thermal storage charge/discharge efficiency0.95/0.95-
Electrical storage energy limits0.2–1.2p.u.·h
Thermal storage energy limits0.2–1.2p.u.·h
Maximum storage charge/discharge power0.6p.u.
Initial storage energy1.0p.u.·h
Electrical DR limit12%
Thermal DR limit10%
Electrical DR cost coefficient0.01$/(p.u.·h)
Thermal DR cost coefficient0.01$/(p.u.·h)
Inter-hub exchange capacity limit in SC1–SC42p.u.
Inter-hub exchange capacity limit in SC1–SC40.6p.u.
EV charge/discharge efficiency0.95/0.95-
Maximum EV charge/discharge power1.0/1.0p.u.
EV energy storage limits0.2–3.0p.u.·h
Initial EV stored energy1.2p.u.·h
EV trip-energy requirement0.50p.u.·h
EV cost coefficient0.01$/(p.u.·h)
EV availability periodst∈[1,7]∪[18,24]h
All power and energy quantities are expressed in normalized per-unit values. Accordingly, energy-related cost coefficients are reported in $/(p.u.·h), and p.u.·h represents normalized energy over one hourly interval.
Table 4. Scenario Comparison Results for the Interconnected Energy Hub System.
Scenario No.Cost ($)Electrical Unserved (p.u.)Thermal Unserved (p.u.)Electrical DR (p.u.)Thermal DR (p.u.)Inter-Hub Exchange (p.u.)EV Discharge (p.u.)EV Charge (p.u.)
13044.56.25481.0550.00000.0023.1340.00000.0000
22479.43.28001.0553.02620.0020.0740.00000.0000
32881.36.03730.2150.00000.8822.7570.00000.0000
42356.23.28000.2152.95890.8620.1730.00000.0000
53235.67.93650.2153.27500.8512.1680.00000.0000
62917.06.22650.2153.17060.8512.1401.71002.4211
73868.29.3732.7063.1960.8912.101.9772.717
All reported non-cost quantities represent cumulative per-unit amounts over the 24-h scheduling horizon.
Table 5. Sensitivity analysis of VOLL parameters for SC6.
CaseVOLLeVOLLhTotal Cost ($)Total Unserved Energy (p.u.)
Low VOLL100752278.26.4415
Base VOLL2001502917.06.4415
High VOLL3002253555.86.4415
Disclaimer/Publisher’s Note: The statements, opinions and data contained in all publications are solely those of the individual author(s) and contributor(s) and not of MDPI and/or the editor(s). MDPI and/or the editor(s) disclaim responsibility for any injury to people or property resulting from any ideas, methods, instructions or products referred to in the content.