Article

Perceived Environmental Benefits and Electric Vehicle Intentions in Canada: Separate Analyses of Car Owners’ Purchase Likelihood and Non-Car Owners’ Stated Preference

Interdisciplinarity & Human Studies, Faculty of Arts, Laurentian University, Sudbury, ON P3E 2C6, Canada
World Electr. Veh. J. 2026, 17(8), 414; https://doi.org/10.3390/wevj17080414
Submission received: 27 June 2026 / Revised: 4 August 2026 / Accepted: 5 August 2026 / Published: 7 August 2026
(This article belongs to the Section Marketing, Promotion and Socio Economics)

Highlights

What are the main findings?
  • Among car owners, stronger agreement that EVs help protect the environment was consistently associated with higher plug-in electric vehicle purchase likelihood across parsimonious and adjusted ordered-logit models.
  • Among non-car owners, the corresponding association with stated EV preference was positive in parsimonious models but imprecise after broader demographic adjustment; this analysis is exploratory.
What are the implications of the main findings?
  • Car ownership defines a different decision context, not a tested adoption stage or moderator; the two group-specific outcomes cannot be compared on a common scale.
  • The focal single item supports inference about the perceived environmental benefit of EVs, not a validated general environmental-concern construct or the full Value–Belief–Norm sequence.

Abstract

Believing that electric vehicles (EVs) benefit the environment may be associated with EV intentions, but current car owners and non-car owners answer different practical questions. This cross-sectional online survey of 328 adults residing in Canada therefore analyzes the groups separately. The focal item—“The use of EVs will help protect the environment”—is treated as a perceived environmental benefit of EVs rather than as a validated general environmental-concern scale. For 226 car owners with complete focal variables, an ordered logistic model including personal environmental responsibility produced an odds ratio (OR) of 1.82 per one-category increase in perceived environmental benefit (95% confidence interval [CI] 1.51–2.19; p < 0.001). The association remained positive in the available demographic sensitivity model (OR 2.05, 95% CI 1.68–2.51). For 72 non-car owners, the parsimonious exploratory model produced an OR of 1.47 (95% CI 1.04–2.08; p = 0.029), but the estimate was attenuated after broader demographic adjustment (OR 1.39, 95% CI 0.96–2.02; p = 0.080). Cluster-robust stacked cumulative-logit diagnostics found no evidence against proportional odds in the primary models. Because owners reported five-category purchase likelihood for a plug-in electric vehicle and non-owners reported seven-category stated EV preference, no formal group comparison was conducted. The findings are associational, based on single items and a non-probability sample, and are consistent only with selected propositions of Value–Belief–Norm theory. Evidence is strongest for a positive owner–context association and suggestive, but less stable, for non-car owners.

1. Introduction

Electric vehicles (EVs) are central to transportation decarbonization, but adoption is a high-cost consumer decision shaped by environmental beliefs, vehicle price and range, charging access, household mobility needs, prior experience, and supporting infrastructure [1,2,3,4,5,6,7,8,9,10]. Consumers may view EVs favorably while remaining uncertain about whether a vehicle fits their everyday travel, housing, parking, or financial circumstances. EV intentions are therefore best interpreted as socio-technical judgments rather than as direct measures of future purchases.
Canada provides a relevant setting because cold-climate driving, dispersed settlement, provincial policy differences, and uneven charging access can make the feasibility of EV use highly context-dependent [1,2,3,7,11]. Consumer-level research must accordingly distinguish a positive environmental evaluation of EVs from the practical capacity to acquire and use one.
Prior work commonly links environmental attitudes and perceived environmental benefits to EV interest [4,5,6,12,13,14]. The item available in this study, however, asks respondents whether EV use will help protect the environment. That wording is narrower than general environmental concern: it is an evaluation of EVs’ environmental benefit. Treating the item precisely avoids attributing latent-construct validity to a single proposition.
Current car owners and non-car owners also face different decision contexts. Owners were asked how likely they would be to select a plug-in electric vehicle if purchasing another vehicle in the next month; non-owners were asked whether they would prefer to drive an EV rather than a conventional car. The outcomes differ in wording, response scale, temporal proximity, and behavioral commitment. Ownership status is therefore used to define separate analyses, not a proven sequential adoption stage, a tested moderator, or a basis for comparing coefficient magnitudes.
The study asks two group-specific questions: (1) Among car owners, is perceived environmental benefit of EVs associated with plug-in electric vehicle purchase likelihood? And (2) among non-car owners, is the same item associated with stated EV preference? A secondary exploratory question compares the Q25 coefficient with the coefficient for owner-specific personal environmental responsibility (Q32) within the same owner model. The contribution lies in construct precision, transparent model reporting, and the separation of non-equivalent decision contexts rather than in claiming that an environment–intention association is itself novel.
The remainder of the article develops a parsimonious theoretical framework, describes the sample and item-level measures, reports complete ordered-logit and sensitivity results, and discusses the limited inferences warranted by the cross-sectional non-probability design.

2. Literature Review and Theoretical Framework

2.1. Perceived Environmental Benefit and EV Intentions

EV research identifies purchase price, financial incentives, range, charging convenience, social influence, education, income, prior experience, and vehicle attributes as potential correlates of adoption [3,4,5,6,7,8,9,10,12,13,14]. Environmental evaluations are important within that wider set because an EV’s expected environmental benefit can contribute to a favorable attitude toward the technology [5,12,13].
A positive environmental evaluation does not ensure adoption. EVs are durable goods that may require changes in charging and mobility routines. Cost, infrastructure, compatibility, and uncertainty can interrupt the translation from favorable evaluation to purchase likelihood [4,7,8,14,15,16]. The present study therefore interprets Q25 narrowly and avoids treating it as a sufficient explanation of behavior.

2.2. Value–Belief–Norm Theory as a Limited Organizing Lens

Value–Belief–Norm (VBN) theory describes a sequence linking values, environmental beliefs, awareness of consequences, ascription of responsibility, personal norms, and action [17,18]. The available items overlap with selected propositions in this sequence: Q25 concerns an environmental consequence attributed to EV use, and Q32 concerns personal responsibility for problems associated with the respondent’s current vehicle. Higher scores may therefore be consistent with parts of the VBN logic.
This study does not measure or test the complete VBN chain. It contains no validated multi-item measures of values, awareness of consequences, personal norms, or observed behavior. The findings are consequently described as consistent with selected VBN propositions, not as confirming, refining, extending, or validating VBN theory.

2.3. Secondary Interpretive Perspectives

The Theory of Planned Behavior (TPB) emphasizes attitudes, subjective norms, and perceived behavioral control [19]. Technology Acceptance Model (TAM) and Unified Theory of Acceptance and Use of Technology (UTAUT) research similarly highlights perceived usefulness, ease of use, social influence, and facilitating conditions [16,20,21,22,23,24,25,26]. These perspectives help explain why a favorable environmental evaluation may coexist with practical hesitation.
The survey variables analyzed here do not operationalize the complete TPB, TAM, or UTAUT models. These frameworks are used only to interpret feasibility constraints and perceived usefulness. No claim is made that the study tests or integrates those theories.

2.4. Ownership-Related Decision Contexts and Expectations

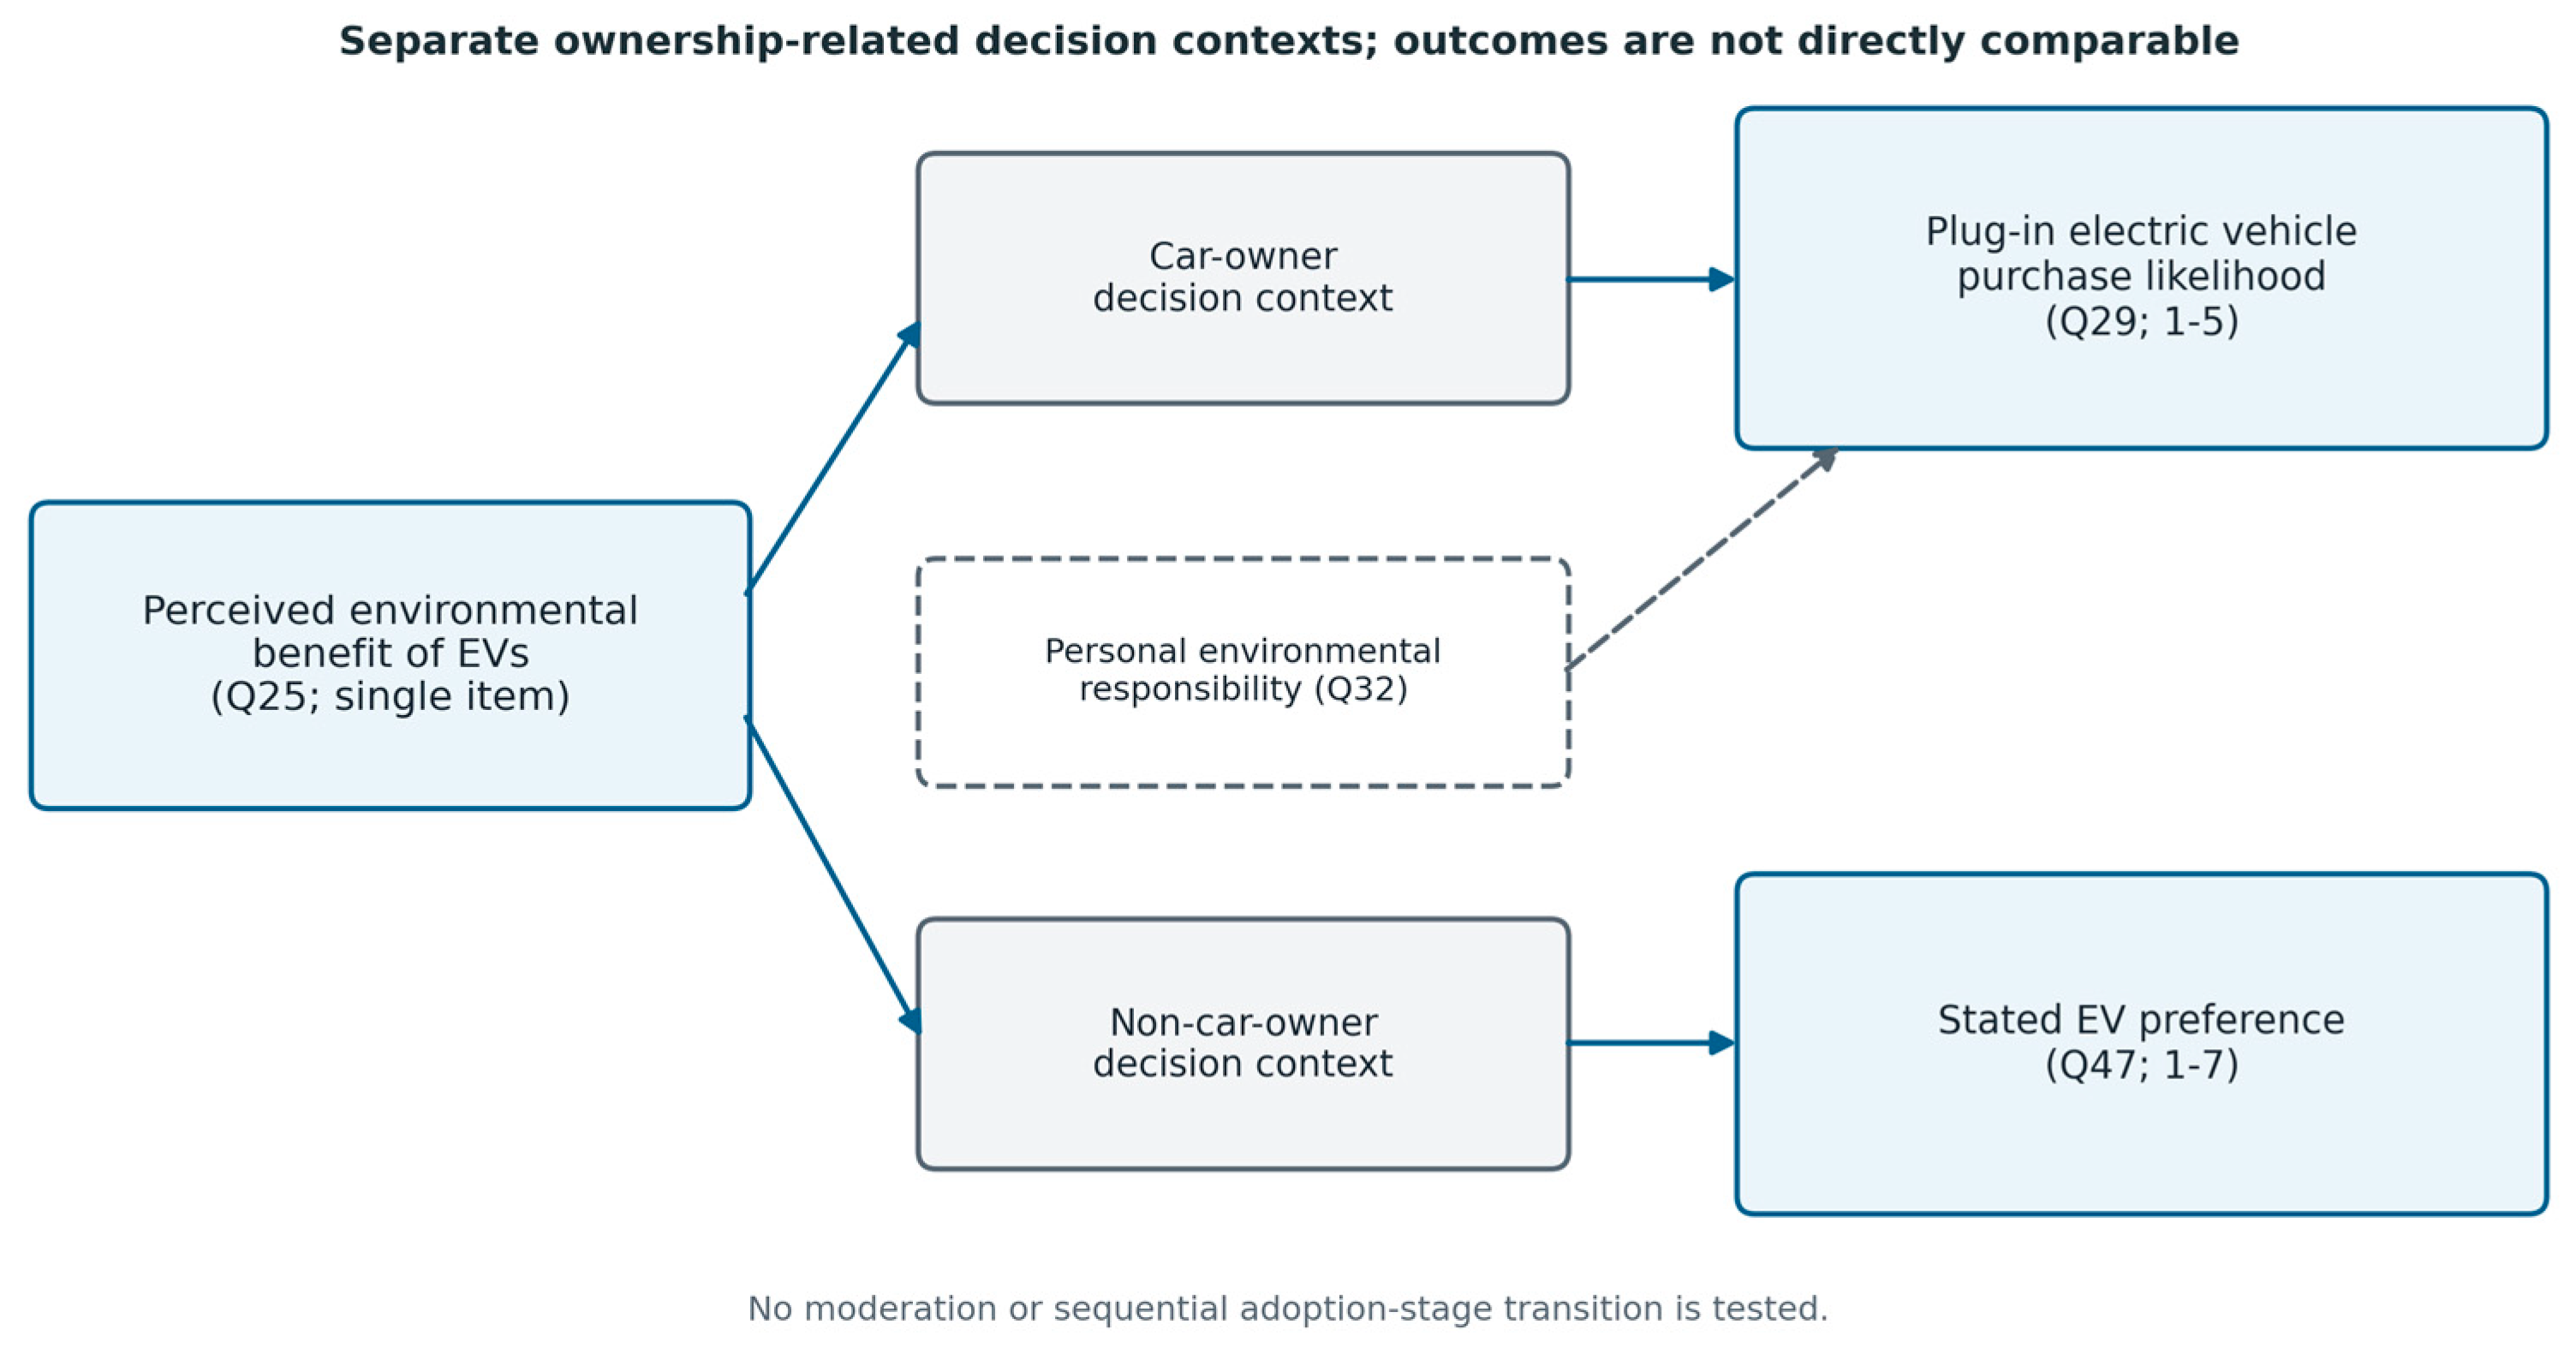
For an owner, Q29 invokes a near-term hypothetical replacement choice. For a non-owner, Q47 expresses a general preference without an imminent purchase frame. Figure 1 shows two separate pathways and explicitly avoids a comparison arrow between the outcomes.
H1. 
Among car owners, stronger agreement with Q25 is associated with higher categories of Q29 plug-in electric vehicle purchase likelihood.
H2. 
Among non-car owners, stronger agreement with Q25 is associated with higher categories of Q47 stated EV preference.
Exploratory RQ1: Within the primary car-owner model, does the Q25 coefficient differ from the Q32 personal-responsibility coefficient?

3. Materials and Methods

3.1. Study Design and Ethics

The study used a cross-sectional, self-administered online questionnaire hosted in REDCap. Adults aged 18 years or older who resided in Canada reviewed study information and provided informed consent before responding. The instrument contained demographic, vehicle-ownership, EV-perception, technology-readiness, and intention items. Because predictor and outcome responses were collected at one time from the same respondent, the design estimates associations and does not establish temporal ordering or causality.
The study was conducted in accordance with the Declaration of Helsinki and was approved by the Laurentian University Research Ethics Board (approval number 6021688, 31 July 2025). Responses in the analysis package were de-identified.

3.2. Recruitment, Sample, and Analytic Flow

The recruitment documentation supplied with the manuscript identifies social media, email invitations, community networks, and Prolific as recruitment channels. The resulting volunteer sample is non-probability-based and is not statistically representative of Canadian adults. The study records retained for this revision do not contain recruitment dates, source-specific participant counts, or Prolific eligibility and compensation details. They also do not document formal procedures for detecting duplicate, automated, or inattentive responses. Accordingly, no exclusions on those grounds can be verified from the de-identified analysis file or the reproducibility workflow. These protocol details are reported as unavailable rather than inferred.
The de-identified file contains 328 rows: 231 respondents reported owning at least one car, 73 reported not owning a car, and 24 did not report ownership status. Ownership-specific analyses excluded the 24 respondents without status. Complete-case counts varied by model because items and immigration duration had small amounts of missing data (Table 1). No imputation or outcome-category collapsing was used in the primary ordered models.

3.3. Measures and Construct Boundaries

Perceived environmental benefit of EVs (Q25) was measured with the statement “The use of EVs will help protect the environment,” scored from 1 (Strongly disagree) to 7 (Strongly agree). It is the focal predictor in both group-specific analyses.
Personal environmental responsibility (Q32), available for car owners, was measured with “I feel personally responsible for the environmental problems resulting from the type of vehicle I own,” scored from 1 (Strongly disagree) to 7 (Strongly agree). Future-generation environmental-benefit belief (Q48), reported descriptively for non-car owners, was measured with “I think EVs contribute to saving the environment for the next generation,” on the same 1–7 anchors.
Car-owner purchase likelihood (Q29) was assessed through the question “If you were to purchase another vehicle in the next month, how likely would you be to purchase each of the following vehicle types?” The analyzed option was labeled “Plug-In Electric” and used five categories from 1 (Very unlikely) to 5 (Very likely). Non-car-owner stated preference (Q47) was assessed through the question “I would prefer to drive an EV instead of a conventional car,” scored from 1 (Strongly disagree) to 7 (Strongly agree). No reverse coding was applied.
Each core construct is represented by one item. A single, concrete proposition can possess face validity for its exact wording, but internal consistency, convergent validity, discriminant validity, and reliability against measurement error cannot be estimated. The design may therefore underrepresent broader constructs and attenuate or otherwise distort associations. All interpretation remains at the item level.
The supplied vehicle indicator combines respondents reporting a primary or secondary “Plug-In Electric” or “Hybrid-Electric” vehicle. The archived data do not preserve separate battery-electric vehicle (BEV), plug-in hybrid-electric vehicle (PHEV), and conventional hybrid-electric vehicle (HEV) categories. These categories are conceptually distinct: BEVs use battery-electric propulsion without an internal-combustion engine; PHEVs combine plug-in charging with an engine; and HEVs do not charge from the grid. The combined indicator is not relabeled as an EV-owner measure, and the requested BEV/PHEV-specific exclusion cannot be performed from this file.

3.4. Sample Characteristics and Available Controls

The de-identified analysis file contains age group, gender, province/territory, education, household income, immigration duration, and the combined vehicle-fuel indicator. It does not contain recruitment source, urban/rural residence, housing or home-ownership status, parking or charging access, commuting distance, driving experience, or prior EV experience. Those unavailable variables were not treated as controls. Table 2 reports the available characteristics overall and by ownership group using within-column denominators.

3.5. Statistical Analysis

Ordered logistic regression models the cumulative odds of being in a higher rather than a lower outcome category. It estimates one slope for each predictor across all outcome cut points under the proportional-odds assumption. The reported coefficient (beta) is a log-odds change; SE is its standard error; z is beta divided by SE; p is the two-sided probability under the null; OR is exp(beta); CI is a 95% confidence interval; LR chi-square compares the fitted model with an intercept-only model; McFadden’s pseudo R-squared is a relative fit index rather than explained variance; and cut points (thresholds) locate boundaries between adjacent outcome categories.
The owner analysis used four nested specifications. O1 contained Q25 alone. O2, the primary owner model, added Q32. O3 reproduced the original immigration-adjusted specification with less than five years in Canada as the reference. O4 added all demographics available in the archive: ordinal trends for age group, education, and income; female versus male; Ontario versus other province/territory; and immigration indicators. Treating ordered demographic categories as one-step trends reduced sparse dummy cells and was specified before inspecting their p-values.
The non-owner analysis was designated exploratory because only 72 respondents had complete Q47 and Q25 data and one outcome category contained a single response. N1, the primary exploratory model, contained Q25 alone. N2 added immigration indicators. N3 added the available demographic trends and Ontario indicator; the one respondent in the ‘Other’ gender category was excluded from the male/female trend, leaving N = 70. N3 is intentionally treated as a stress test rather than as a stable explanatory model.
Primary proportional-odds restrictions were assessed with a stacked cumulative-logit Wald diagnostic. Respondents contributed one binary cumulative response at each cut point, cut-point-by-predictor interactions relaxed equal slopes, and a respondent-clustered sandwich covariance accounted for repeated cumulative rows. Global and variable-specific tests are reported. Because neither primary model rejected equal slopes at p < 0.05, generalized ordered-logit alternatives were not required.
Sensitivity analyses used (i) Q29 ≥ 4 (Likely or Very likely) and Q47 ≥ 5 (Somewhat agree or higher) as transparent binary thresholds; (ii) the O3 owner model after excluding every respondent coded with the combined plug-in-electric/hybrid-electric indicator; (iii) leave-one-out and 500-replicate outcome-category-stratified bootstrap checks for N1; and (iv) average standardized probabilities of the highest outcome category when Q25 was set to 1 or 7 while retaining every other modeled covariate at each respondent’s observed value. Probability intervals were based on 4000 draws from the estimated parameter covariance matrix. Models were estimated by maximum likelihood in a reproducible Python 3.12 pipeline using NumPy, pandas, and SciPy; conventional model-based SEs were used because there was one independent questionnaire record per respondent.

3.6. Missing Data and Reproducibility

Analyses used complete cases for the variables in each specification; no imputation was performed. Variable-level missingness, all category frequencies, model thresholds, complete control coefficients, software versions, and executable code are provided in the Supplementary Materials (Methods and Reproducibility Archive). The archive reconstructs every statistic reported here from the de-identified file.

4. Results

4.1. Sample Composition

The owner sample was older and had higher household income than the non-owner sample. Ontario accounted for 58.0% of owners and 64.4% of non-owners. Complete demographic information was available for all reported owners and non-owners except for one owner with missing income, one non-owner with missing immigration duration, and one non-owner who reported gender as ‘Other.’ The 21 missing age, gender, province, and education records occurred in the overall file among respondents outside the two reported ownership groups.

4.2. Item Distributions

Q25 averaged 5.29 (SD 1.55; N = 304). Among owners, Q29 averaged 2.87 (SD 1.29; N = 226) and Q32 averaged 4.21 (SD 1.82; N = 228). Among non-owners, Q47 averaged 4.69 (SD 1.62; N = 72) and Q48 averaged 5.22 (SD 1.49; N = 72). These means describe different items and do not constitute a test of group differences. Table 3 summarizes the item-level descriptive statistics and response anchors.

4.3. Car-Owner Ordered-Logit Results

Q25 was positively associated with Q29 in every owner specification. In O2, a one-category increase in Q25 corresponded to 1.82 times the odds of being in a higher Q29 category (95% CI 1.51–2.19; p < 0.001). Q32 was positive in O2 (OR 1.20, 95% CI 1.03–1.41; p = 0.023) but attenuated after immigration and broader demographic adjustment. The exploratory within-model Wald comparison in O2 found that the Q25 coefficient exceeded the Q32 coefficient by 0.412 (chi-square(1) = 8.16, p = 0.004). Because this contrast was exploratory and Q32 was specification-sensitive, it is not treated as a confirmatory hypothesis result.
Average standardized O2 estimates placed the probability of the highest Q29 category (‘Very likely’) at 0.007 (95% CI 0.002–0.018) when Q25 was set to 1 and at 0.194 (95% CI 0.126–0.272) when Q25 was set to 7, retaining observed Q32 values. These are model-based probabilities for a stated category, not probabilities of an actual vehicle purchase. Table 4 summarizes the owner-model estimates and fit statistics.

4.4. Non-Car-Owner Exploratory Ordered-Logit Results

The Q25 association was positive in N1 (OR 1.47, 95% CI 1.04–2.08; p = 0.029) and N2 (OR 1.55, 95% CI 1.08–2.24; p = 0.018). N2’s overall LR test was not significant (chi-square(4) = 6.26, p = 0.180), and the Q25 interval crossed one after broader demographic adjustment in N3 (OR 1.39, 95% CI 0.96–2.02; p = 0.080). The low fit indices, small sample, sparse lowest category, and covariate sensitivity limit the result to suggestive exploratory evidence.
Average standardized N1 estimates placed the probability of the highest Q47 category (‘Strongly agree’) at 0.032 (95% CI 0.003–0.132) when Q25 was set to 1 and 0.253 (95% CI 0.071–0.372) when Q25 was set to 7. The wide intervals reflect limited precision. Table 5 summarizes the non-owner models and their fit statistics.

4.5. Assumption Checks and Sensitivity Analyses

Table 6 reports the proportional-odds diagnostics. Neither primary model showed evidence against proportional odds (owner global p = 0.199; non-owner global p = 0.512). The owner Q25 estimate remained positive after conservatively excluding every respondent coded with the combined plug-in-electric/hybrid-electric indicator (N = 180; OR 2.00, 95% CI 1.61–2.49; p < 0.001). This exclusion is broader than the requested BEV/PHEV exclusion because the available indicator cannot separate BEV, PHEV, and HEV categories.
In the non-owner N1 leave-one-out analysis, the Q25 coefficient remained positive in all 72 refits and ranged from 0.299 to 0.469 (OR 1.35–1.60). The 500-replicate outcome-category-stratified bootstrap OR interval was 1.03–2.15, with positive coefficients in 98.2% of replicates. The binary sensitivity was significant for owners but not for non-owners, reinforcing the latter result’s threshold sensitivity. The full sensitivity output appears in Supplementary Table S4.

5. Discussion

5.1. Contribution and Construct Precision

The most defensible finding is that, among car owners, stronger agreement that EVs help protect the environment is consistently associated with a higher stated likelihood of selecting a plug-in electric vehicle. The association survives available demographic adjustment and a conservative exclusion of respondents coded with the combined plug-in-electric/hybrid-electric indicator. This result aligns with prior environment–intention research [5,12,13,14] but is framed as an item-level association rather than as a new general law of EV adoption.
The study’s contribution is methodological and contextual. It corrects the focal construct label, reports all available controls and thresholds, tests proportional odds, and keeps owner purchase likelihood separate from non-owner preference. These choices narrow the claim but improve interpretability and reproducibility.

5.2. Owner Context and the Q25–Q32 Distinction

Q25 was more stable than Q32 across owner specifications. The exploratory O2 contrast favored Q25, but Q32’s significance changed after adjustment. One interpretation is that endorsing an EV’s environmental benefit differs from accepting personal responsibility for the environmental consequences of one’s current vehicle. Responsibility wording may be more sensitive to dependence on a vehicle, perceived alternatives, or defensiveness.
The data do not measure the mechanisms needed to test that interpretation. Charging access, cost, parking, commute, household constraints, and prior EV experience are not present in the de-identified analysis file. TPB, TAM, and UTAUT therefore offer boundary-condition language, not tested mediation pathways.

5.3. Non-Car-Owner Result as Exploratory Evidence

The non-owner association is weaker evidence. Although N1 and N2 produced positive Q25 coefficients, N3 was imprecise and the binary threshold sensitivity was not significant. With 72 focal complete cases, one observation in the lowest Q47 category, and limited capacity to adjust for selection or feasibility variables, model estimates can respond materially to specification and individual observations.
The non-owner result should therefore not be described as validation, a direct replication of the owner result, or proof that the same mechanism operates in both groups. It indicates a positive pattern worthy of testing with a larger sample and a common outcome instrument.

5.4. Theoretical Interpretation

The findings are consistent with the limited VBN proposition that perceived environmental consequences can accompany pro-environmental intention [17]. They do not test the complete Value–Belief–Norm–Behavior sequence, and the cross-sectional ordering permits reverse causality: respondents who already prefer EVs may be more willing to endorse their environmental benefit.
TPB and technology acceptance perspectives suggest why a favorable environmental evaluation may be insufficient when perceived control or facilitating conditions are weak [16,19,20,21,22]. Because those constructs were not fully measured, the present evidence cannot adjudicate among theories or establish an integrated model.

5.5. Practical Implications

For policy and communication, the owner result suggests that accurate information about environmental performance may remain relevant to EV consideration. Environmental claims should be specific, evidence-based, and paired with information about total cost, charging, range, winter operation, and vehicle suitability rather than relying on guilt or broad moral appeals.
The study does not directly estimate the effects of incentives, infrastructure, marketing, or information campaigns. Recommendations about those interventions are implications for future testing, not causal conclusions from the present coefficients. Larger studies should experimentally compare environmental-benefit messages with affordability and feasibility information and should measure actual downstream behavior.

5.6. Limitations and Future Research

First, cross-sectional self-reports prevent causal inference and allow reverse causality. Predictor and outcome items in the same questionnaire also create common-method variance and consistency-motif risks.
Second, non-probability recruitment through online and community channels creates self-selection and unknown coverage error. The sample is not a population estimate for Canada. The absence of verified recruitment dates, source-specific counts, Prolific eligibility and compensation records, and documented duplicate, automated, or inattentive-response screening limits source-specific nonresponse assessment and means that undetected repeated or low-quality responses cannot be ruled out.
Third, Q25, Q32, Q47, and Q48 are single items. Construct underrepresentation and unmeasured reliability restrict conclusions to their exact wording.
Fourth, owner and non-owner outcomes differ in item wording, response scale, temporal frame, and behavioral commitment. H4 was removed because no valid common-scale group test is possible.
Fifth, the non-owner sample is small, its lowest outcome category is sparse, and the Q25 estimate is not robust to every adjustment or binary threshold. Its findings are exploratory.
Sixth, the de-identified analysis file lacks urban/rural residence, housing and home ownership, parking/charging access, commute distance, driving experience, current vehicle categories separated into BEV/PHEV/HEV, prior EV experience, and recruitment source. Residual confounding and omitted-variable bias remain plausible.
Future research should use validated multi-item measures, the same intention outcome for both ownership groups, probability or benchmarked sampling, larger non-owner samples, and longitudinal or behavioral outcomes such as test drives, dealership inquiries, rebate applications, and registrations. Measurement invariance and formally powered moderation tests would be required before making group-comparison claims.

6. Conclusions

Among surveyed Canadian car owners, a stronger perceived environmental benefit of EVs was consistently associated with higher stated plug-in electric vehicle purchase likelihood. Among non-car owners, the analogous association with stated EV preference was positive in parsimonious models but less stable after adjustment and should be treated as exploratory. The two outcomes are not directly comparable, car ownership is not established as an adoption stage, and the single focal item does not validate general environmental concern or the full VBN model. The evidence supports cautious, item-level, associational conclusions and a clear agenda for larger studies using common measures and observed behavior.

Supplementary Materials

The following supporting information can be downloaded at https://www.mdpi.com/article/10.3390/wevj17080414/s1: Table S1: Item category frequencies and missingness; Table S2: Complete car-owner ordered-logit results, including all controls and thresholds; Table S3: Complete non-car-owner ordered-logit results, including all controls and thresholds; Table S4: Diagnostics, standardized probabilities, and sensitivity analyses; Reproducibility Archive: de-identified data, codebook, executable analysis code, complete output, software versions, and README.

Funding

This research received no external funding.

Institutional Review Board Statement

The study was conducted in accordance with the Declaration of Helsinki and approved by the Laurentian University Research Ethics Board. Approval number and date: 6021688, 31 July 2025.

Informed Consent Statement

Informed consent was obtained from all subjects involved in the study.

Data Availability Statement

The original contributions presented in this study are included in the article/Supplementary Materials. Further inquiries can be directed to the corresponding author.

Acknowledgments

The author thanks the survey participants for their time and responses. Generative AI tools were used for language editing, formatting assistance, code drafting, and manuscript structuring. The author reviewed the manuscript, analysis decisions, numerical output, and references and retains responsibility for the work.

Conflicts of Interest

The author declares no conflicts of interest.

References

  1. International Energy Agency. Global EV Outlook 2025; IEA: Paris, France, 2025; Available online: https://www.iea.org/reports/global-ev-outlook-2025 (accessed on 4 August 2026).
  2. Razi, F.; Dincer, I. A Review of the Current State, Challenges, Opportunities and Future Directions for Implementation of Sustainable Electric Vehicle Infrastructure in Canada. J. Energy Storage 2022, 56, 106048. [Google Scholar] [CrossRef]
  3. Mohamed, M.; Higgins, C.; Ferguson, M.; Kanaroglou, P. Identifying and Characterizing Potential Electric Vehicle Adopters in Canada: A Two-Stage Modelling Approach. Transp. Policy 2016, 52, 100–112. [Google Scholar] [CrossRef]
  4. Liao, F.; Molin, E.; van Wee, B. Consumer Preferences for Electric Vehicles: A Literature Review. Transp. Rev. 2017, 37, 252–275. [Google Scholar] [CrossRef]
  5. Li, W.; Long, R.; Chen, H.; Geng, J. A Review of Factors Influencing Consumer Intentions to Adopt Battery Electric Vehicles. Renew. Sustain. Energy Rev. 2017, 78, 318–328. [Google Scholar] [CrossRef]
  6. Coffman, M.; Bernstein, P.; Wee, S. Electric Vehicles Revisited: A Review of Factors That Affect Adoption. Transp. Rev. 2017, 37, 79–93. [Google Scholar] [CrossRef]
  7. Hardman, S.; Jenn, A.; Tal, G.; Axsen, J.; Beard, G.; Daina, N.; Figenbaum, E.; Jakobsson, N.; Jochem, P.; Kinnear, N.; et al. A Review of Consumer Preferences of and Interactions with Electric Vehicle Charging Infrastructure. Transp. Res. Part D Transp. Environ. 2018, 62, 508–523. [Google Scholar] [CrossRef]
  8. Schuitema, G.; Anable, J.; Skippon, S.; Kinnear, N. The Role of Instrumental, Hedonic and Symbolic Attributes in the Intention to Adopt Electric Vehicles. Transp. Res. Part A Policy Pract. 2013, 48, 39–49. [Google Scholar] [CrossRef]
  9. Sierzchula, W.; Bakker, S.; Maat, K.; van Wee, B. The Influence of Financial Incentives and Other Socio-Economic Factors on Electric Vehicle Adoption. Energy Policy 2014, 68, 183–194. [Google Scholar] [CrossRef]
  10. Chen, C.-F.; Zarazua de Rubens, G.; Noel, L.; Kester, J.; Sovacool, B.K. Assessing the Socio-Demographic, Technical, Economic and Behavioral Factors of Nordic Electric Vehicle Adoption and the Influence of Vehicle-to-Grid Preferences. Renew. Sustain. Energy Rev. 2020, 121, 109692. [Google Scholar] [CrossRef]
  11. Jonas, T.; Daniels, N.; Macht, G.A. Electric Vehicle User Behavior: An Analysis of Charging Station Utilization in Canada. Energies 2023, 16, 1592. [Google Scholar] [CrossRef]
  12. Degirmenci, K.; Breitner, M.H. Consumer Purchase Intentions for Electric Vehicles: Is Green More Important than Price and Range? Transp. Res. Part D Transp. Environ. 2017, 51, 250–260. [Google Scholar] [CrossRef]
  13. Rezvani, Z.; Jansson, J.; Bengtsson, M. Consumer Motivations for Sustainable Consumption: The Interaction of Gain, Normative and Hedonic Motivations on Electric Vehicle Adoption. Bus. Strategy Environ. 2018, 27, 1272–1283. [Google Scholar] [CrossRef]
  14. Salari, N. Electric Vehicles Adoption Behaviour: Synthesising the Technology Readiness Index with Environmentalism Values and Instrumental Attributes. Transp. Res. Part A Policy Pract. 2022, 164, 60–81. [Google Scholar] [CrossRef]
  15. Lane, B.; Potter, S. The Adoption of Cleaner Vehicles in the UK: Exploring the Consumer Attitude-Action Gap. J. Clean. Prod. 2007, 15, 1085–1092. [Google Scholar] [CrossRef]
  16. Huijts, N.M.A.; Molin, E.J.E.; Steg, L. Psychological Factors Influencing Sustainable Energy Technology Acceptance: A Review-Based Comprehensive Framework. Renew. Sustain. Energy Rev. 2012, 16, 525–531. [Google Scholar] [CrossRef]
  17. Stern, P.C.; Dietz, T.; Abel, T.; Guagnano, G.A.; Kalof, L. A Value-Belief-Norm Theory of Support for Social Movements: The Case of Environmentalism. Hum. Ecol. Rev. 1999, 6, 81–97. Available online: https://humanecologyreview.org/pastissues/her62/62sternetal.pdf (accessed on 4 August 2026).
  18. Jansson, J.; Nordlund, A.; Westin, K. Examining Drivers of Sustainable Consumption: The Influence of Norms and Opinion Leadership on Electric Vehicle Adoption in Sweden. J. Clean. Prod. 2017, 154, 176–187. [Google Scholar] [CrossRef]
  19. Ajzen, I. The Theory of Planned Behavior. Organ. Behav. Hum. Decis. Process. 1991, 50, 179–211. [Google Scholar] [CrossRef]
  20. Davis, F.D. Perceived Usefulness, Perceived Ease of Use, and User Acceptance of Information Technology. MIS Q. 1989, 13, 319–340. [Google Scholar] [CrossRef] [PubMed]
  21. Venkatesh, V.; Davis, F.D. A Theoretical Extension of the Technology Acceptance Model: Four Longitudinal Field Studies. Manag. Sci. 2000, 46, 186–204. [Google Scholar] [CrossRef]
  22. Venkatesh, V.; Morris, M.G.; Davis, G.B.; Davis, F.D. User Acceptance of Information Technology: Toward a Unified View. MIS Q. 2003, 27, 425–478. [Google Scholar] [CrossRef]
  23. Buhmann, K.M.; Rialp-Criado, J.; Rialp-Criado, A. Predicting Consumer Intention to Adopt Battery Electric Vehicles: Extending the Theory of Planned Behavior. Sustainability 2024, 16, 1284. [Google Scholar] [CrossRef]
  24. Sun, Z.; Lee, B. Exploring Factors Influencing Electric Vehicle Purchase Intentions through an Extended Technology Acceptance Model. Vehicles 2024, 6, 1513–1544. [Google Scholar] [CrossRef]
  25. Bektas, B.C.; Akyildiz Alcura, G. Understanding Electric Vehicle Adoption in Turkiye: Analyzing User Motivations through the Technology Acceptance Model. Sustainability 2024, 16, 9439. [Google Scholar] [CrossRef]
  26. He, X.; Hu, Y. The Decision-Making Processes for Consumer Electric Vehicle Adoption Based on a Goal-Directed Behavior Model. World Electr. Veh. J. 2024, 15, 386. [Google Scholar] [CrossRef]
Figure 1. Conceptual model for separate ownership-related decision contexts. Solid arrows identify the two group-specific Q25 associations; the dashed Q32 arrow denotes the secondary within-owner predictor. The figure does not assert moderation, causal mediation, or a sequential adoption stage.
Wevj 17 00414 g001
Table 1. Sample accounting and complete-case analytic samples.
StageN
Total rows in de-identified data328
Reported car owners231
Reported non-car owners73
Ownership status missing24
Owner Q25 + Q32 outcome-complete sample (O2)226
Owner original immigration-adjusted sample (O3)223
Non-owner Q25 outcome-complete sample (N1)72
Non-owner immigration-adjusted sample (N2)71
Owners with non-missing combined fuel-type indicator228
Owners coded plug-in-electric or hybrid-electric43
Note: O2 includes Q29, Q25, and Q32 complete cases. O3 additionally requires immigration duration. N1 includes Q47 and Q25 complete cases. N2 additionally requires immigration duration. The combined vehicle-fuel indicator is available only for reported owners.
Table 2. Available sample characteristics overall and by ownership group, n (%).
CharacteristicOverall (N = 328)Owners (N = 231)Non-Owners (N = 73)
Age: 18–2430 (9.1)9 (3.9)21 (28.8)
Age: 25–3497 (29.6)69 (29.9)27 (37.0)
Age: 35–4489 (27.1)74 (32.0)15 (20.5)
Age: 45–5440 (12.2)34 (14.7)4 (5.5)
Age: 55 or older51 (15.5)45 (19.5)6 (8.2)
Age: Missing21 (6.4)0 (0.0)0 (0.0)
Gender: Male159 (48.5)122 (52.8)36 (49.3)
Gender: Female147 (44.8)109 (47.2)36 (49.3)
Gender: Other (please specify)1 (0.3)0 (0.0)1 (1.4)
Gender: Missing21 (6.4)0 (0.0)0 (0.0)
Region: Atlantic5 (1.5)5 (2.2)0 (0.0)
Region: Quebec26 (7.9)19 (8.2)7 (9.6)
Region: Ontario184 (56.1)134 (58.0)47 (64.4)
Region: Prairies54 (16.5)45 (19.5)9 (12.3)
Region: British Columbia36 (11.0)27 (11.7)9 (12.3)
Region: Territories2 (0.6)1 (0.4)1 (1.4)
Region: Missing21 (6.4)0 (0.0)0 (0.0)
Education: Secondary or less21 (6.4)13 (5.6)8 (11.0)
Education: Certificate/diploma or post-secondary without degree52 (15.9)33 (14.3)19 (26.0)
Education: Bachelor’s degree139 (42.4)109 (47.2)30 (41.1)
Education: Postgraduate without degree or master’s72 (22.0)56 (24.2)13 (17.8)
Education: Doctorate/PhD student23 (7.0)20 (8.7)3 (4.1)
Education: Missing21 (6.4)0 (0.0)0 (0.0)
Household income: Below $40,00041 (12.5)14 (6.1)26 (35.6)
Household income: $40,000–$79,99974 (22.6)56 (24.2)18 (24.7)
Household income: $80,000–$149,999123 (37.5)101 (43.7)21 (28.8)
Household income: $150,000 or more67 (20.4)59 (25.5)8 (11.0)
Household income: Missing23 (7.0)1 (0.4)0 (0.0)
Immigration background: Less than 5 years24 (7.3)8 (3.5)14 (19.2)
Immigration background: 5 to 10 years31 (9.5)26 (11.3)5 (6.8)
Immigration background: More than 10 years74 (22.6)66 (28.6)8 (11.0)
Immigration background: Born and raised in Canada173 (52.7)128 (55.4)45 (61.6)
Immigration background: Missing26 (7.9)3 (1.3)1 (1.4)
Note: Percentages use the full column denominator and therefore include missing values as a displayed category. Regions combine provinces/territories to avoid sparse presentation cells. The 24 respondents with missing ownership status remain in the overall column but not in either ownership column.
Table 3. Item-level descriptive statistics and response anchors.
ItemNMeanSDMedianRangeAnchors
Q25 perceived environmental benefit3045.291.556.01–71 = Strongly disagree; 7 = Strongly agree
Q32 personal environmental responsibility2284.211.825.01–71 = Strongly disagree; 7 = Strongly agree
Q48 future-generation environmental-benefit belief725.221.496.01–71 = Strongly disagree; 7 = Strongly agree
Q29 plug-in electric vehicle purchase likelihood2262.871.293.01–51 = Very unlikely; 5 = Very likely
Q47 stated EV preference724.691.625.01–71 = Strongly disagree; 7 = Strongly agree
Note: Full counts and percentages for every response category appear in Supplementary Table S1. Q25, Q32, Q47, and Q48 use seven categories; Q29 uses five. Missing values are not included in item means.
Table 4. Car-owner ordered logistic regression: focal terms and model fit.
Term/StatisticO1 Q25O2 PrimaryO3 ImmigrationO4 Demographic Sensitivity
Q25 perceived environmental benefit0.673 (0.089); OR 1.96 [1.65, 2.33]; p < 0.0010.596 (0.095); OR 1.82 [1.51, 2.19]; p < 0.0010.649 (0.098); OR 1.91 [1.58, 2.32]; p < 0.0010.719 (0.102); OR 2.05 [1.68, 2.51]; p < 0.001
Q32 personal environmental responsibility0.184 (0.081); OR 1.20 [1.03, 1.41]; p = 0.0230.121 (0.085); OR 1.13 [0.96, 1.33]; p = 0.1510.108 (0.086); OR 1.11 [0.94, 1.32]; p = 0.211
N226226223222
LR chi-square (df)64.72 (1), p < 0.00169.88 (2), p < 0.00174.52 (5), p < 0.00186.18 (10), p < 0.001
McFadden pseudo R20.0910.0990.1070.124
AIC654.49651.32643.01638.72
BIC671.59671.84673.67686.36
Note: Coefficient (SE); OR [95% OR CI]; p-value. Higher coefficients indicate higher cumulative odds of a higher Q29 category. O3 and O4 use less than 5 years in Canada as the reference category. O4 uses one-step ordinal trends for age, education, and income, male as the gender reference, and other province/territory as the regional reference. All control coefficients and thresholds are reported in Supplementary Table S2. Pseudo R2 is a fit index, not a percentage of variance explained.
Table 5. Non-car-owner exploratory ordered logistic regression: focal term and model fit.
Term/StatisticN1 Q25N2 ImmigrationN3 Demographic Sensitivity
Q25 perceived environmental benefit0.387 (0.177); OR 1.47 [1.04, 2.08]; p = 0.0290.440 (0.186); OR 1.55 [1.08, 2.24]; p = 0.0180.332 (0.190); OR 1.39 [0.96, 2.02]; p = 0.080
N727170
LR chi-square (df)4.78 (1), p = 0.0296.26 (4), p = 0.18021.00 (9), p = 0.013
McFadden pseudo R20.0190.0250.084
AIC266.37266.09258.68
BIC282.31288.72292.41
Note: Coefficient (SE); OR [95% OR CI]; p-value. N2 uses less than 5 years in Canada as the reference category. N3 uses the demographic coding described for O4 and excludes the single ‘Other’ gender response. Complete coefficients and thresholds are in Supplementary Table S3. All non-owner models are exploratory. Pseudo R2 is a fit index, not explained variance.
Table 6. Primary-model proportional-odds diagnostics.
ModelTestChi-Squaredfp-Value
O2 Owner primaryGlobal equal-slopes test8.5860.199
O2 Owner primaryQ25 perceived environmental benefit4.6230.202
O2 Owner primaryQ32 personal environmental responsibility6.7330.081
N1 Non-owner primary exploratoryGlobal equal-slopes test4.2650.512
N1 Non-owner primary exploratoryQ25 perceived environmental benefit4.2650.512
Note: Stacked cumulative-logit Wald tests use respondent-clustered covariance. A nonsignificant result indicates no detected difference in slopes across outcome cut points; it does not prove exact equality.
Disclaimer/Publisher’s Note: The statements, opinions and data contained in all publications are solely those of the individual author(s) and contributor(s) and not of MDPI and/or the editor(s). MDPI and/or the editor(s) disclaim responsibility for any injury to people or property resulting from any ideas, methods, instructions or products referred to in the content.