Article

Comparative Life Cycle Assessment of Battery Electric and Internal Combustion Engine Passenger Cars Under a Fossil-Dominated Electricity Grid: The Case of Saudi Arabia


by
Ahmed S. Alghamdi
Jubail Industrial College, Royal Commission for Jubail and Yanbu, Jubail Industrial City EJAB3628, Saudi Arabia
World Electr. Veh. J. 2026, 17(8), 415; https://doi.org/10.3390/wevj17080415
Submission received: 8 July 2026 / Revised: 28 July 2026 / Accepted: 4 August 2026 / Published: 7 August 2026
(This article belongs to the Section Energy Supply and Sustainability)

Abstract

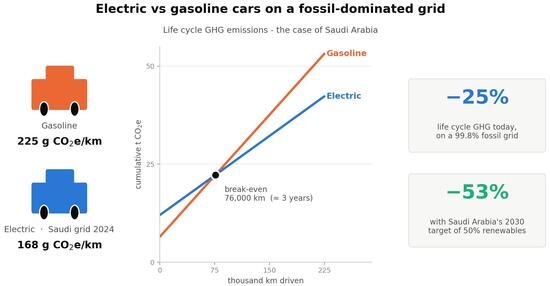
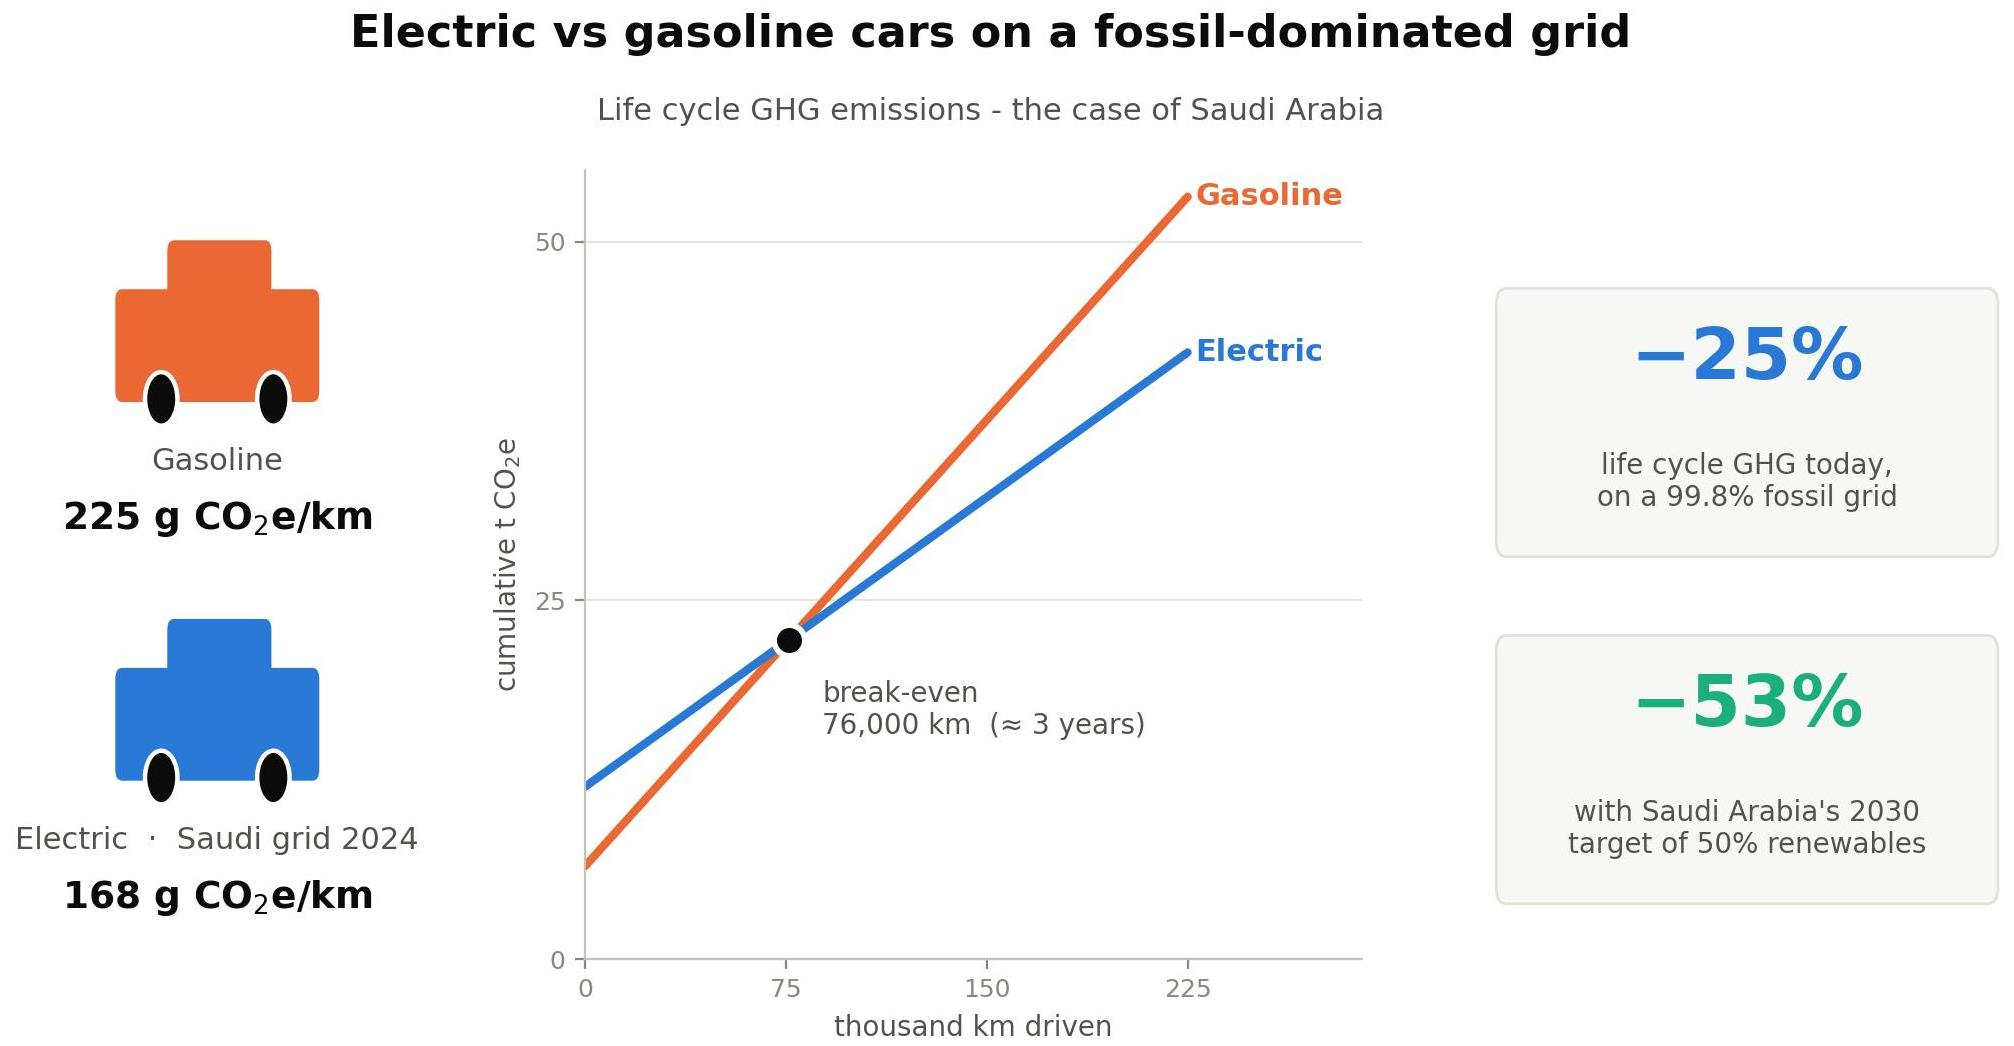
This study quantifies whether vehicle electrification reduces greenhouse gas emissions on one of the world’s most fossil-intensive electricity grids. A transparent, ISO 14040/14044-conformant cradle-to-grave life cycle assessment compares a mid-size battery electric vehicle (BEV, 60 kWh) with a comparable gasoline car over 225,000 km, using a fully source-traceable process-sum inventory and life cycle (well-to-wheel) emission factors for both energy carriers. On the 2024 Saudi grid (692 g CO2e/kWh, 99.8% fossil) the BEV emits 37.8 t CO2e (168 g CO2e/km) against the gasoline car’s 50.6 t (225 g CO2e/km)—a 25% reduction, with the BEV’s 1.9 times higher production emissions repaid at 76,000 km, approximately three years of typical Saudi driving. The advantage rises to 44% on the world-average grid, 53% under Saudi Arabia’s 50% renewable-electricity target for 2030, and 66–80% on the EU and French grids; grid parity would require 991 g CO2e/kWh, above any national grid. The result is robust to hot climate energy consumption (+15%, advantage 25%), Gulf-sourced materials (break-even shortens to 68,000 km), battery capacity (40–80 kWh), and 10,000-run Monte Carlo uncertainty propagation (BEV superior in 99.6% of draws). Electrification is therefore a sound climate strategy even in fossil-grid economies, and its benefit roughly doubles with the announced power-sector transition.

Graphical Abstract

1. Introduction

The transport sector accounts for roughly one quarter of global energy-related CO2 emissions, and light-duty passenger vehicles form its largest segment. Saudi Arabia—which historically supplied almost exclusively with gasoline vehicles—has committed to an electric-mobility transition as follows: 30% electric vehicles in Riyadh by 2030 under Vision 2030, a domestic EV industry, 50% renewable electricity by 2030 and net-zero emissions by 2060 [1,2]. A battery electric vehicle (BEV), however, does not eliminate emissions; it relocates them to the power station and to the battery supply chain. Whether electrification reduces greenhouse gas (GHG) emissions is therefore a system property that only life cycle assessment (LCA) can resolve [3,4], and the question is acute for states whose electricity is almost entirely fossil-fuelled—99.8% from gas and oil in the Saudi case [5].
This paper builds methodologically on a process-sum life cycle model previously applied to industrial machinery [6], in which each stage’s emission is computed directly from the bill of materials, stage energy inputs and published emission factors rather than through proprietary LCA databases. Two questions drive the analysis. First, does the use-phase dominance found for energy-using products (77–80% of life cycle emissions for the machine tool of [6]) persist for passenger cars when the energy carrier changes? Second, how does the traction battery—a single component that concentrates embodied emissions—redistribute burdens across the life cycle, and does that redistribution overturn the BEV’s advantage on a fossil grid?
The novelty of this work relative to the existing Gulf-region literature [7,8,9] is threefold, as summarised in Table 1. First, it is the only vehicle LCA to evaluate both the current (2024) and the announced 2030 Saudi electricity mix—including an alternative partial-delivery pathway—thereby linking the vehicle-level comparison directly to the Kingdom’s National Renewable Energy Programme targets; prior regional studies use a single historical grid year. Second, whereas the regional predecessors rely on proprietary LCA software and databases whose inventories cannot be inspected or reproduced, every input here is an explicit, cited value in a published equation set, and the complete model is provided in two independently executable implementations (Python and Excel); this directly addresses the reproducibility problem widely noted in vehicle carbon research. Third, the study quantifies uncertainty formally—deterministic sensitivity on six parameters plus 10,000-run Monte Carlo propagation with variance decomposition—where the regional literature reports point estimates. The intended contribution is thus a reproducible, uncertainty-quantified benchmark for vehicle electrification in fossil-grid economies.
Three scope constraints are stated at the outset. The assessment covers climate change (GWP-100) and cumulative energy demand only; toxicity, mineral depletion and water-consumption categories—in which BEVs can perform worse [10]—are outside the boundary. Energy-consumption inputs are European real-world values, with Saudi-specific heat and air-conditioning effects treated by scenario analysis rather than measured local drive cycles. Road and charging infrastructure are excluded on the shared-burden grounds examined in Section 3.1. Section 2 reviews the literature, Section 3 defines the model, Section 4 presents results and uncertainty, Section 5 discusses policy implications and limitations, and Section 6 concludes.

2. Literature Review

Comparative LCAs of electric and conventional vehicles form the mature literature whose conclusions have evolved with battery technology and grid decarbonisation. Notter et al. [11] produced the first transparent life cycle inventory of a lithium-ion traction battery and concluded that the battery contributes approximately 15% of the BEV’s total environmental burden, with the electricity consumed during use dominating the outcome. Hawkins et al. [10] established the canonical result of the field as follows: BEV production carries roughly twice the GHG burden of ICEV production (87–95 g CO2e/km against 43 g CO2e/km over a 150,000 km life), of which the battery is 35–41%, yet the BEV reduces life cycle global warming potential by 10–24% relative to gasoline when charged with average European electricity, while charging from coal-dominated electricity erases the benefit entirely. Ellingsen et al. [12] measured 172 kg CO2e per kWh of pack capacity from industry data, an upper anchor subsequently revised downward as manufacturing scaled: the IVL review lowered the consensus range to 61–106 kg CO2e/kWh [13], harmonised distributions now centre on 62–74 kg CO2e/kWh depending on chemistry [14], and the ICCT’s 2025 European update adopts 72.8 kg CO2e/kWh for NMC622 cells [15].
At the whole-vehicle level, Qiao et al. [16] found BEV production in China 50% more emission-intensive than ICEV production (15.0 vs. 10.0 t CO2e), and a companion fleet study estimated an 18% life cycle advantage on the 2015 Chinese grid [17]. Cox et al. [18] propagated parameter uncertainty through Monte Carlo simulation and identified electricity supply as the dominant source of variance in BEV results. Knobloch et al. [19] generalised the comparison to 59 world regions and found BEVs already less emission-intensive than ICEVs in 53 of them. Bieker’s global comparison [20] reported life cycle reductions for mid-size BEVs of 66–69% in Europe, 60–68% in the United States, 37–45% in China and 19–34% in India for 2021 registrations, and the 2025 European update [15] widened the gap as follows: 63 g CO2e/km for the BEV against 235 g CO2e/km for gasoline, with the production ‘backpack’ recovered after approximately 17,000 km. Prospective studies reach the same direction of result across all energy futures considered: Sacchi et al. [21] find electrification beneficial in most regions today and essentially everywhere by the 2030s, and Šimaitis et al. [22] show 2025-built BEVs emitting 24–47% less than hybrids under every 1.5–3.0 °C pathway, with break-even at 51,000–87,000 km. The International Energy Agency’s assessment is that a global-average mid-size BEV purchased today halves life cycle GHG emissions relative to its gasoline counterpart [23].
Three strands bear directly on the present study. The first concerns fossil-dominated grids. Onat et al. [7] assessed electric mobility in Qatar—a grid, like Saudi Arabia’s, almost entirely gas-fired—and found EVs still reduced global warming potential, though by a diminished margin. For Saudi Arabia itself, Alwosheel and Koroma [8] modelled five sedan powertrains on the 2022 grid (735 g CO2e/kWh) and reported 0.41 kg CO2e/km for gasoline against 0.34 for a BEV (−16%) and 0.29 for a hybrid—a rare case of the hybrid outperforming the BEV—while a companion study extended the analysis to SUVs [9]. Table 1 positions the present work against these regional predecessors. The second strand is end of life: battery recycling carries burdens of 9.5–11.9 kg CO2e/kWh but returns credits of 17.5–25.5 kg CO2e/kWh [24,25], industrial-scale recycling cuts battery-material footprints by more than half [26], and conventional metals recycling avoids approximately 1.6 kg CO2e per kg of steel [27] and 14 kg per kg of aluminium [28]. The third strand is methodological: harmonised reviews consistently identify grid emission factor, battery production intensity, vehicle lifetime and real-world energy consumption as the four governing parameters [14,18], and these are the parameters varied in Section 4.

3. Materials and Methods

3.1. Goal and Scope Definition

The goal of the study is to quantify and compare the life cycle GHG emissions and cumulative energy demand of a representative mid-size battery electric passenger car and a comparable gasoline internal combustion engine car, and to determine how the comparison responds to the carbon intensity of the charging electricity. The assessment is attributional and follows the four-phase framework of ISO 14040/14044 [3,4]. A process-sum formulation is adopted deliberately rather than a proprietary LCA database, for three reasons. First, transparency: every exchange in the inventory is an explicit, cited number in a published equation, so reviewers and readers can audit or replace any value—impossible when inventories sit inside commercial database licences. Second, reproducibility: the model executes from a short script with no licensed software, addressing a recognised weakness of vehicle-LCA practice. Third, adequacy to the question: the comparison is dominated by a small number of well-characterised flows (bulk materials, one battery, and two energy carriers), for which aggregate industry-average emission factors from the producing associations are the appropriate resolution; database-level process detail would add opacity without changing the governing parameters identified in the literature [14,18]. The impact category evaluated is climate change (kg CO2-equivalent, GWP-100); cumulative energy demand (MJ) is a complementary indicator, consistent with [6].
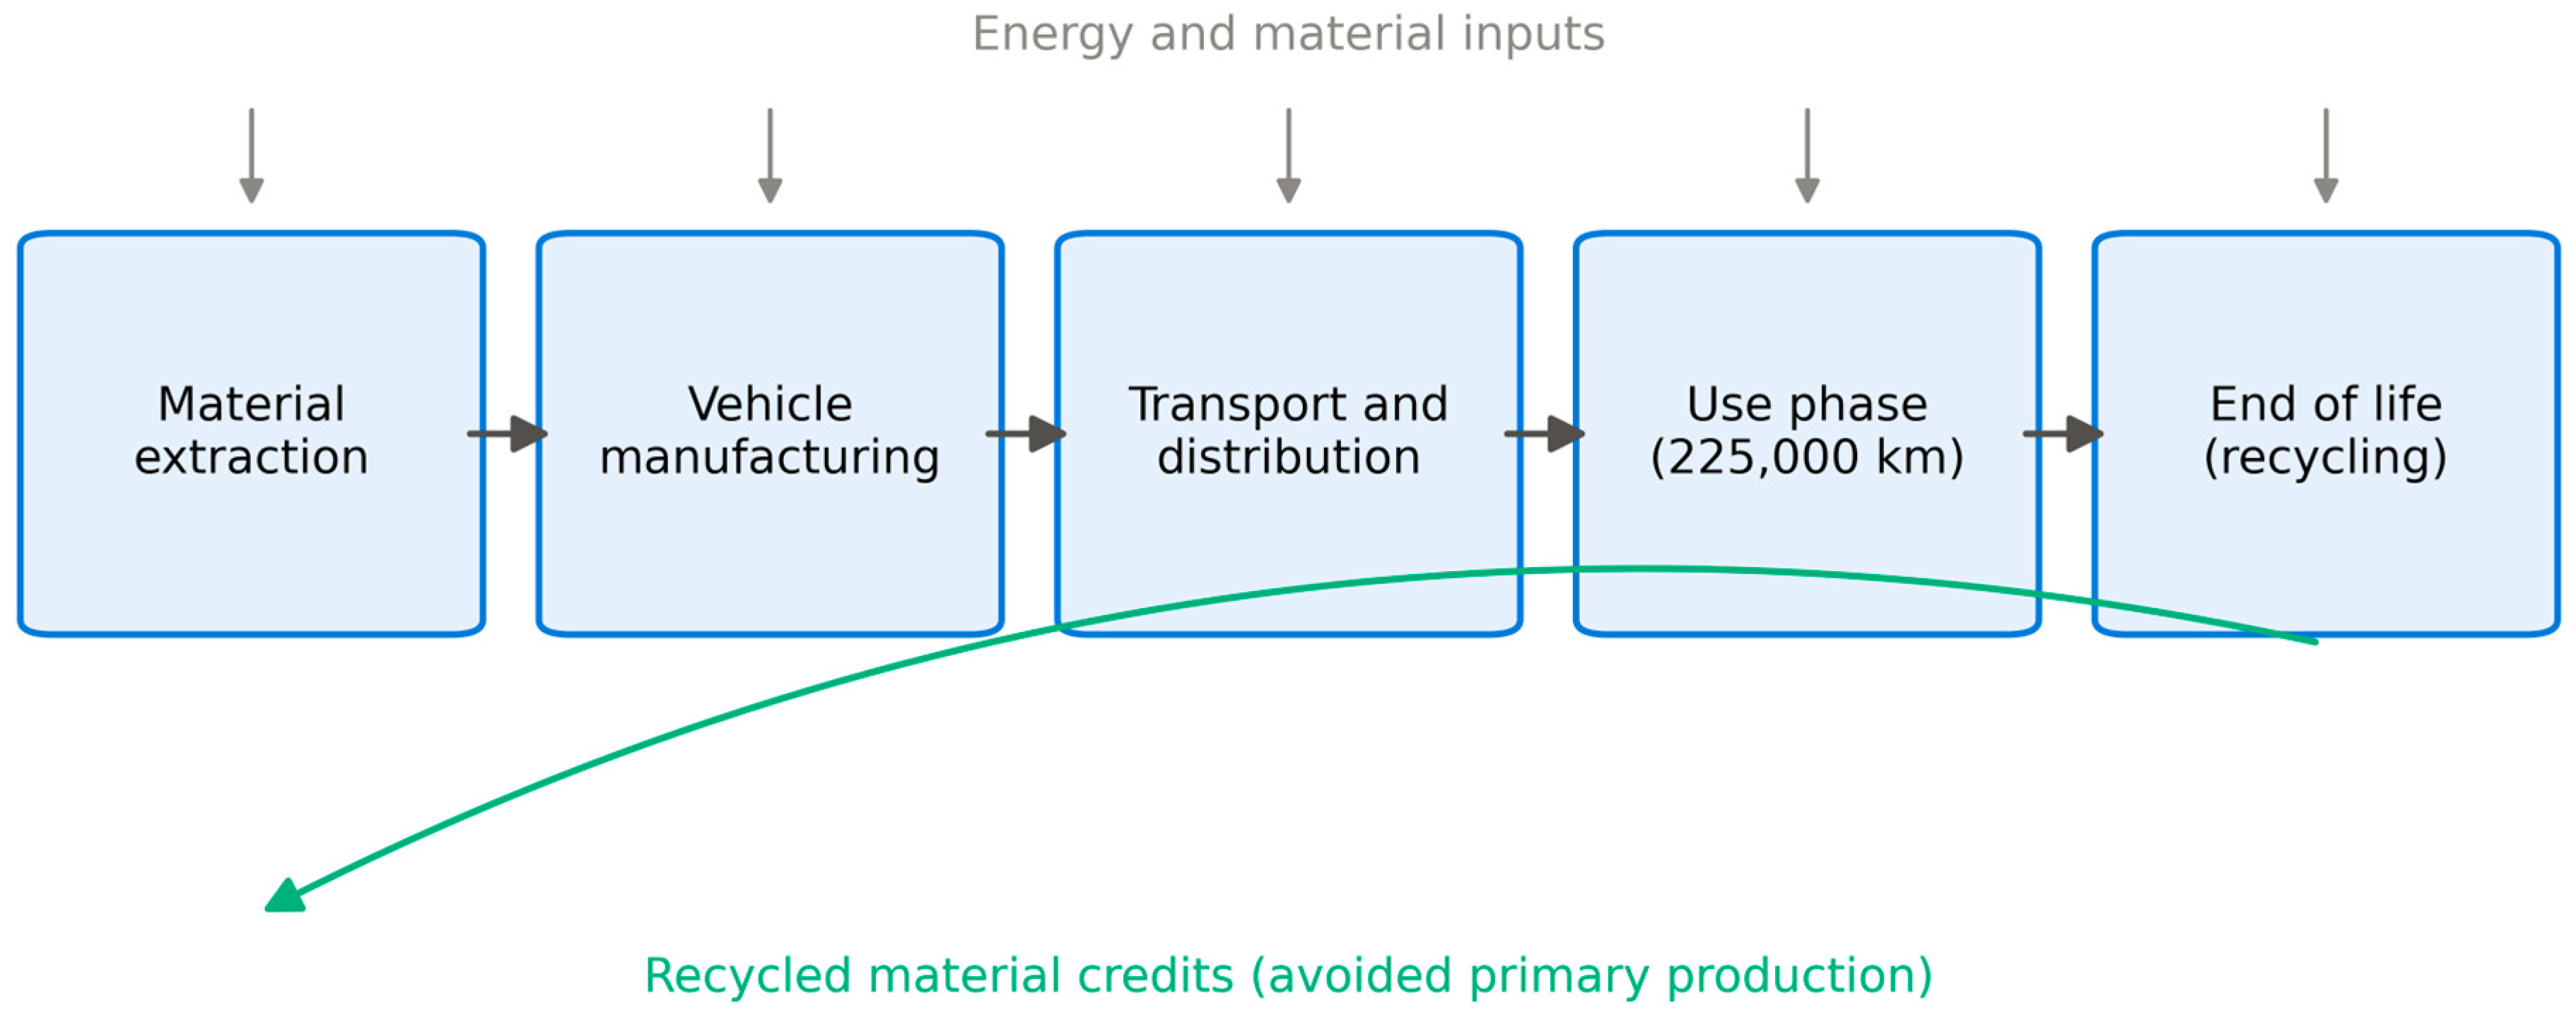
The functional unit is the provision of 225,000 km of passenger transport over a 15-year service life by a mid-size (C/D-segment) passenger car. This is the harmonisation value of the European Commission’s vehicle-LCA study and the European Parliament’s review [29,30] and sits centrally in the 150,000–295,000 km literature range [10,31]. Saudi usage supports the same benchmark reached faster: at the KAPSARC estimate of roughly 25,750 km per year [32]—about 40% above European annual mileage—225,000 km is accumulated in approximately nine years, comfortably within the 15-year design life, and Saudi vehicle-retention data therefore alter the timing of the comparison rather than its total; lifetime is varied over 150,000–300,000 km in Section 4.5. The system boundary (Figure 1) is cradle to grave: raw material extraction and primary production, vehicle manufacturing and assembly, transport and distribution, the use phase including both energy supply chains on a consistent well-to-wheel basis, maintenance, and end of life with recycling credits (avoided-burden approach). Road and charging infrastructure are excluded: road construction and maintenance are shared by both powertrains and allocate identically per vehicle-kilometre [33,34], while dedicated energy-supply infrastructure contributes of the order of 4–8 g CO2e/km for BEVs and 1–2 g CO2e/km for gasoline vehicles [35]—a second-order difference (≤3% of either vehicle’s total here) that would slightly favour the ICEV and is noted in Section 5.3.

3.2. Reference Vehicles

The ICEV is a mid-size gasoline sedan of 1400 kg curb mass, representative of the class that dominates the Saudi fleet, with material composition from the GREET vehicle-cycle model [36]. The BEV is a mid-size sedan of 1700 kg curb mass: a 1325 kg glider and powertrain plus a 375 kg lithium-ion pack of 60 kWh (NMC-type, ≈160 Wh/kg at pack level). The 60 kWh specification matches the mid-size BEVs actually sold in Saudi Arabia: the BYD Atto 3 (60.5 kWh), Tesla Model 3/Y RWD (≈60–62.5 kWh), BYD Dolphin (44.9–60.5 kWh), MG4 (51–64 kWh) and Hyundai Ioniq 5/Kia EV6 (58–77.4 kWh) bracket a market median of approximately 60 kWh; capacity is varied over 40–80 kWh in Section 4.5 to cover this envelope. The BEV’s non-battery composition is adapted from GREET and Hawkins et al. [10] as follows: the cast-iron engine block is eliminated while aluminium and copper contents increase (motor, power electronics, and harness); the modelled 53 kg of copper equals the IEA’s estimate for a typical electric car [37]. Table 2 summarises both vehicles; Table 3 gives the material inventories and emission factors.

3.3. Life Cycle Inventory

The inventory follows the process-sum formulation of [6], in which each stage’s carbon emission is the product of physical activity data and published emission factors. The material-stage emission is:
CEm = Σi Mi × CMi
Emission factors (Table 3) are taken from industry-association environmental profiles where available—worldsteel for steel [27], the International Aluminium Institute for aluminium [28], the International Copper Association for copper [41], PlasticsEurope and the Gulf Petrochemicals and Chemicals Association for polymers [42,43]—supplemented by the Inventory of Carbon and Energy and Ashby’s compilation for glass, rubber and cast iron [44,45]. Primary (virgin) production is assumed for all materials in both vehicles, a symmetrical and conservative choice bounded by the recycling credits of Section 3.6. Because Saudi steel is predominantly gas-based DRI-EAF (route intensity 1.47 t CO2/t [27]) and Gulf aluminium smelting averages 8.0 t CO2e/t [46] against the 14.8 t global mean, a regional-sourcing scenario replacing the global factors with these Gulf values is evaluated in Section 4.6. The traction battery is treated at 72.8 kg CO2e per kWh—the ICCT’s 2025 value for NMC622 [15], central in the harmonised distribution of Peiseler et al. (5th–95th percentile 59–115) [14]—with embodied energy of 500 MJ/kWh [47]. All symbols used in Equations (1)–(5) are defined in Table 4.
Table 3. Material inventories and primary-production emission factors. EE = embodied energy; CF = carbon footprint.
MaterialEE (MJ/kg)CF (kg CO2e/kg)ICEV Mass (kg)BEV Mass (kg)Source
Steel32.02.10863.8728.8[27,44]
Cast iron25.02.00155.426.5[44,45]
Aluminium (primary)21014.896.6198.8[28,45]
Copper46.73.9726.653.0[41]
Glass11.00.7540.639.8[45]
Plastics85.01.90156.8198.8[42,43]
Rubber90.04.0033.633.1[45]
Other60.02.5026.646.4Assumption
Battery pack (per kWh)500 MJ/kWh72.8 kg CO2e/kWh60 kWh/375 kg[14,15,47]
Table 4. Nomenclature for Equations (1)–(5).
SymbolDefinitionUnit
CEm, CEp, CEt, CEu, CEeCarbon emission of the material, production, transport, use and end-of-life stageskg CO2e
MiMass of material i in the vehiclekg
CMiCradle-to-gate carbon footprint of primary production of material ikg CO2e/kg
WTransported vehicle masst
DTransport leg distancekm
CTiEmission factor of transport mode ikg CO2e/(t·km)
FCReal-world fuel consumption of the ICEVL/km
ECGrid-side electricity consumption of the BEV (incl. charging losses)kWh/km
LLifetime driving distance (functional unit)km
EFttv/EFvttTank-to-wheel combustion/well-to-tank fuel-supply emission factor of gasolinekg CO2e/L
EFyridLife cycle emission factor of charging electricitykg CO2e/kWh
rEnd-of-life metal recovery rate

3.4. Manufacturing, Assembly and Distribution

Part manufacturing and vehicle assembly are modelled from Argonne National Laboratory’s plant-level analysis as follows: 33.9 GJ and 2.0–2.2 t CO2 for a 1532 kg sedan, i.e., 22.1 MJ and 1.37 kg CO2 per kg of vehicle [48], applied to the ICEV curb mass and to the BEV glider mass (battery manufacturing energy is contained in the per-kWh factor). The transport stage assumes manufacture in East Asia and use in Riyadh: 100 km road haulage to the export port, 12,000 km ocean shipping to Jeddah, 950 km road transport to Riyadh, and 50 km to the dismantling facility at end of life. Stage emissions follow:
CEt = Σ W × D × CTi
with mode factors of 0.011 kg CO2e/t·km for ocean container shipping and 0.11 kg CO2e/t·km for road haulage, consistent with GLEC-class defaults and with [6].

3.5. Use Phase and Maintenance

Use-phase emissions are computed well-to-wheel for both energy carriers (Table 5). For the ICEV,
CEu = FC × L × (EFttv + EFvtt)
with real-world consumption of 7.0 L/100 km—the WLTP class value uplifted by the ≈20% real-world gap measured by the European Commission’s on-board monitoring programme [38,49] and consistent with the IEA reference mid-size car [23]—a tank-to-wheel factor of 2.35 kg CO2/L [39] and a well-to-tank fuel-supply factor of 0.55 kg CO2e/L (JEC well-to-wheel study, ≈17 g CO2e/MJ at 32.2 MJ/L [40]). For the BEV,
CEu = EC × L × EFyrid;
with grid-side consumption of 19.0 kWh/100 km including charging losses [23,50], between the ICCT European lower–medium value of 20.6 kWh/100 km [20] and certified values of current mid-size models [51]. The two energy pathways are boundary-consistent: the electricity factors in Table 6 are life cycle values compiled under the Ember methodology, which includes upstream methane and fuel-supply emissions of generation (country-level gas factors after Jordaan et al., and the IPCC AR5 life cycle midpoint for oil-fired plants) [52,53], mirroring the well-to-tank component included for gasoline. The following five scenarios are evaluated: Saudi Arabia 2024 (692 g CO2e/kWh; ≈67% gas, 33% oil [5]), the world average (473 g [52]), the EU average (213 g [52]), France (41 g), and a prospective ‘Saudi 2030’ scenario constructed explicitly as EF = 0.5 × EF2024 + 0.5 × EF_PV, where the 50% renewable share carries the AR5 life cycle intensity of utility solar PV (40 g CO2e/kWh [53]), giving 366 g CO2e/kWh; an alternative partial-delivery pathway (35% renewables by 2030) giving 464 g CO2e/kWh is tested in Section 4.3. Maintenance is minor in all published vehicle LCAs [20,29]; lifetime values of 1.0 t CO2e (ICEV) and 0.7 t (BEV) are adopted. Gulf summer temperatures shorten tyre and fluid replacement intervals, but even a 50% increase in maintenance emissions would move either vehicle’s total by less than 1.1%, so climate sensitivity is instead applied where it matters—energy consumption: a hot-climate scenario raises BEV consumption by 15% (air-conditioning and thermal-management load at ≈35 °C [54,55]) and ICEV consumption by 12% [54,55] in Section 4.6. No battery replacement is required within the 225,000 km lifetime [20,29].

3.6. End of Life

The end-of-life stage comprises a dismantling and shredding burden of 0.3 t CO2e per vehicle—consistent with certified OEM LCAs in which end of life is 1–2% of the total [8,56]—and recycling by the avoided-burden approach:
CEe = CE_dismantling + Σi Mi × r × (CMi,recycledCMi,primary)
A metal recovery rate r of 90% is applied, matching the 88.3% achieved under the EU End-of-Life Vehicles Directive in 2023 [57]. Avoided burdens are 1.6 kg CO2e/kg for steel and cast iron [27], 14.2 kg for aluminium [28] and 3.0 kg for copper [41]. In the baseline the traction battery is hydrometallurgically recycled at end of vehicle life (burden 9.5, credit 25.5 kg CO2e/kWh [24,25,26]). Because second-life battery deployment is part of the Kingdom’s EV industrial planning, an alternative scenario is evaluated in Section 4.6 in which the retired pack (≈70–80% residual capacity) is repurposed for stationary storage before eventual recycling, displacing new battery manufacture; following the harmonised evidence that second-life use avoids 22–51% of new-battery production burdens [58], a net credit of 25 kg CO2e per kWh of repurposed capacity is applied in place of the immediate-recycling credit.

3.7. Impact Assessment, Sensitivity and Uncertainty Analysis

Stage emissions are summed and normalised to g CO2e/km. Deterministic sensitivity covers grid intensity (0–1100 g CO2e/kWh), lifetime (150,000/225,000/300,000 km), battery production intensity (54–115 kg CO2e/kWh [14]), battery capacity (40/60/80 kWh), regional material sourcing, hot-climate consumption, and the second-life scenario. Parameter uncertainty is propagated by Monte Carlo simulation (10,000 runs), following [6,18]. Distributions and truncation bounds are: battery intensity—triangular (54, 72.8, 115 kg CO2e/kWh), the harmonised 5th/mode/95th percentiles [14,15]; BEV consumption—normal (19.0, 1.5) truncated to [15,25] kWh/100 km, reflecting the fleet-wide spread measured across 342 European models [51]; ICEV consumption—normal (7.0, 0.5) truncated to [5.5, 9] L/100 km [38]; Saudi grid factor—normal (692, 40) truncated to [550, 850] g CO2e/kWh; lifetime—triangular (150,000, 225,000, 300,000 km) spanning the literature range [10,31]; material factors—a common normal (1.00, 0.10) multiplier truncated to [0.7, 1.3] [44]. Truncation excludes physically implausible draws. Correlation structure is handled by construction: lifetime and the two consumption draws are shared between the paired BEV and ICEV in each run, so the vehicles are compared under identical usage—the appropriate structure for a fleet-substitution decision—while supply-side parameters are drawn independently. The contribution of each parameter to output variance is quantified by squared rank-correlation shares in Section 4.7. All computations are implemented in Python 3 and provided as Supplementary Materials together with a formula-live Excel replication.

4. Results

4.1. Production Stage

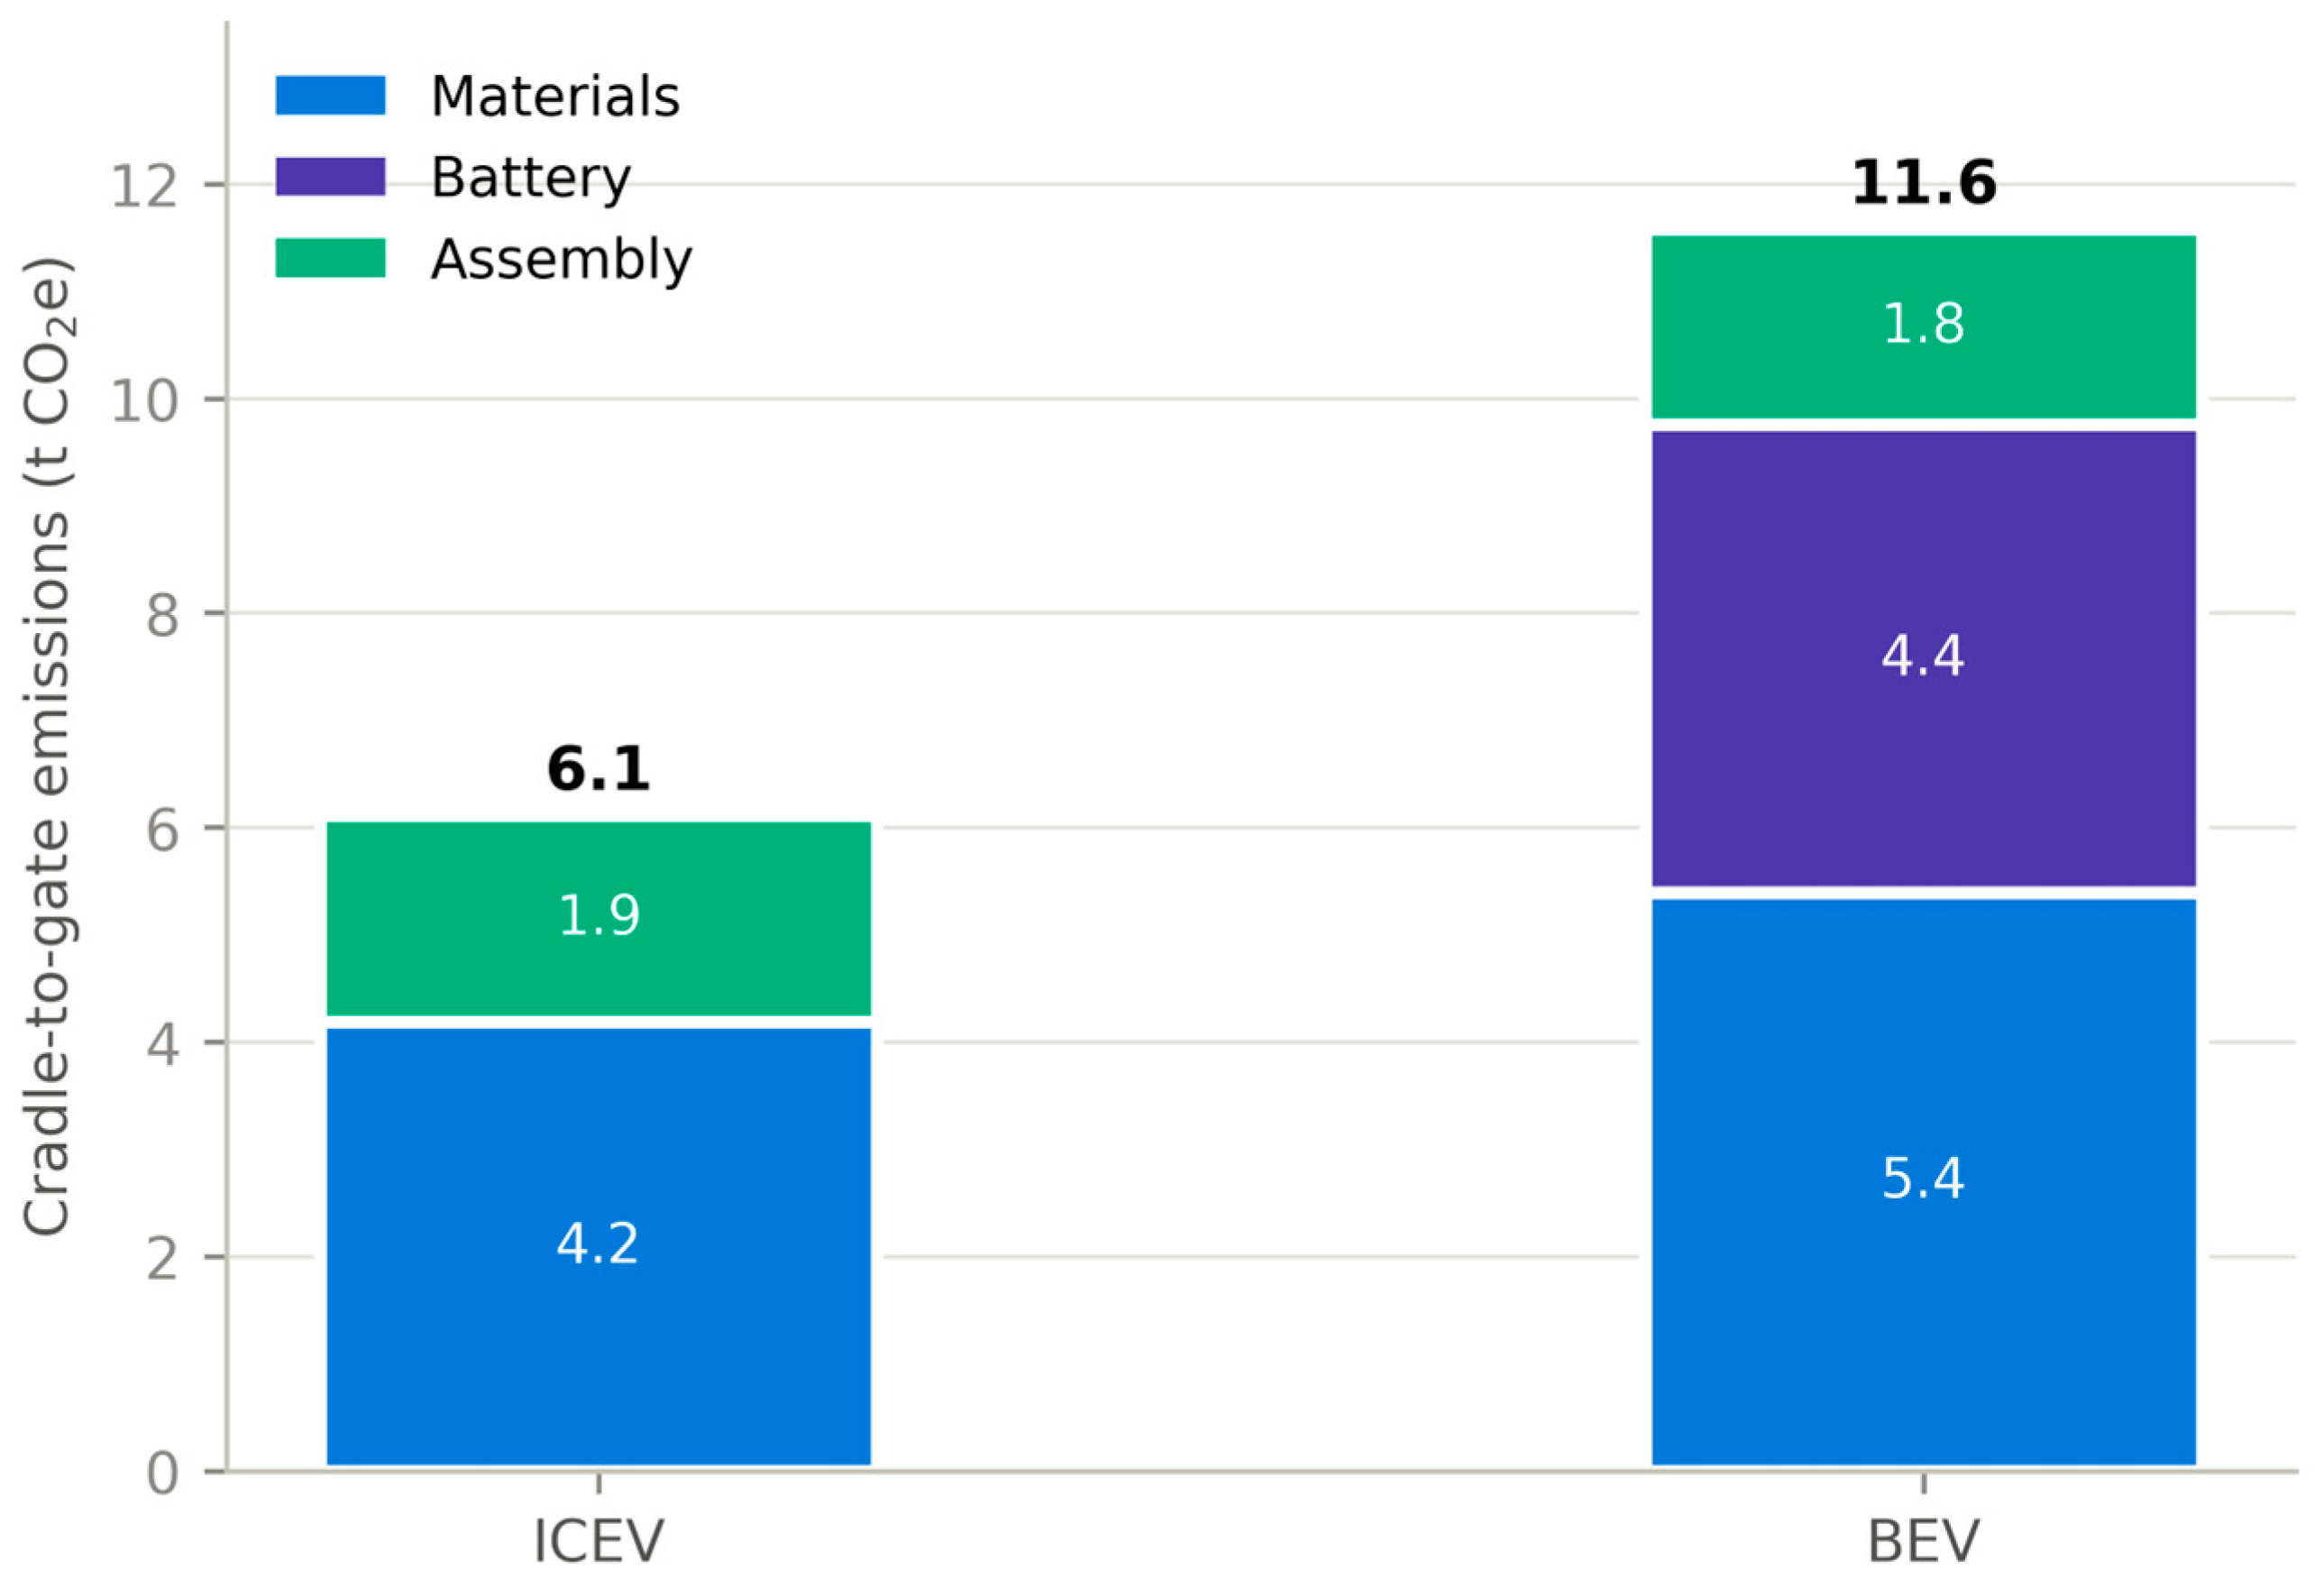
Cradle-to-gate production emissions are 6.1 t CO2e for the ICEV and 11.6 t CO2e for the BEV—a factor of 1.9, at the upper end of the 1.4–1.9 range reported across the literature [10,16] and consistent with the near-doubling found by Hawkins et al. [10] (Figure 2). Two components explain the difference. The traction battery contributes 4.4 t CO2e, 38% of BEV production emissions—echoing the 35–41% battery share of [10] despite a decade of falling per-kWh intensity, because pack sizes have grown in the same period. Aluminium contributes a further 2.9 t CO2e of the BEV’s 5.4 t material total (55%), against 1.4 t in the ICEV: at 14.8 kg CO2e/kg for primary production [28], the BEV’s doubled aluminium content is the second engine of its production ‘backpack’. Assembly emissions are marginally lower for the BEV (1.8 vs. 1.9 t) because the per-kilogram factor of [48] is applied to the glider only. The material-stage energy demand is 91.3 GJ (BEV glider) and 71.4 GJ (ICEV); adding battery production (30.0 GJ) widens the gap in the same proportion as the carbon results.

4.2. Life Cycle Results on the Current Saudi Grid

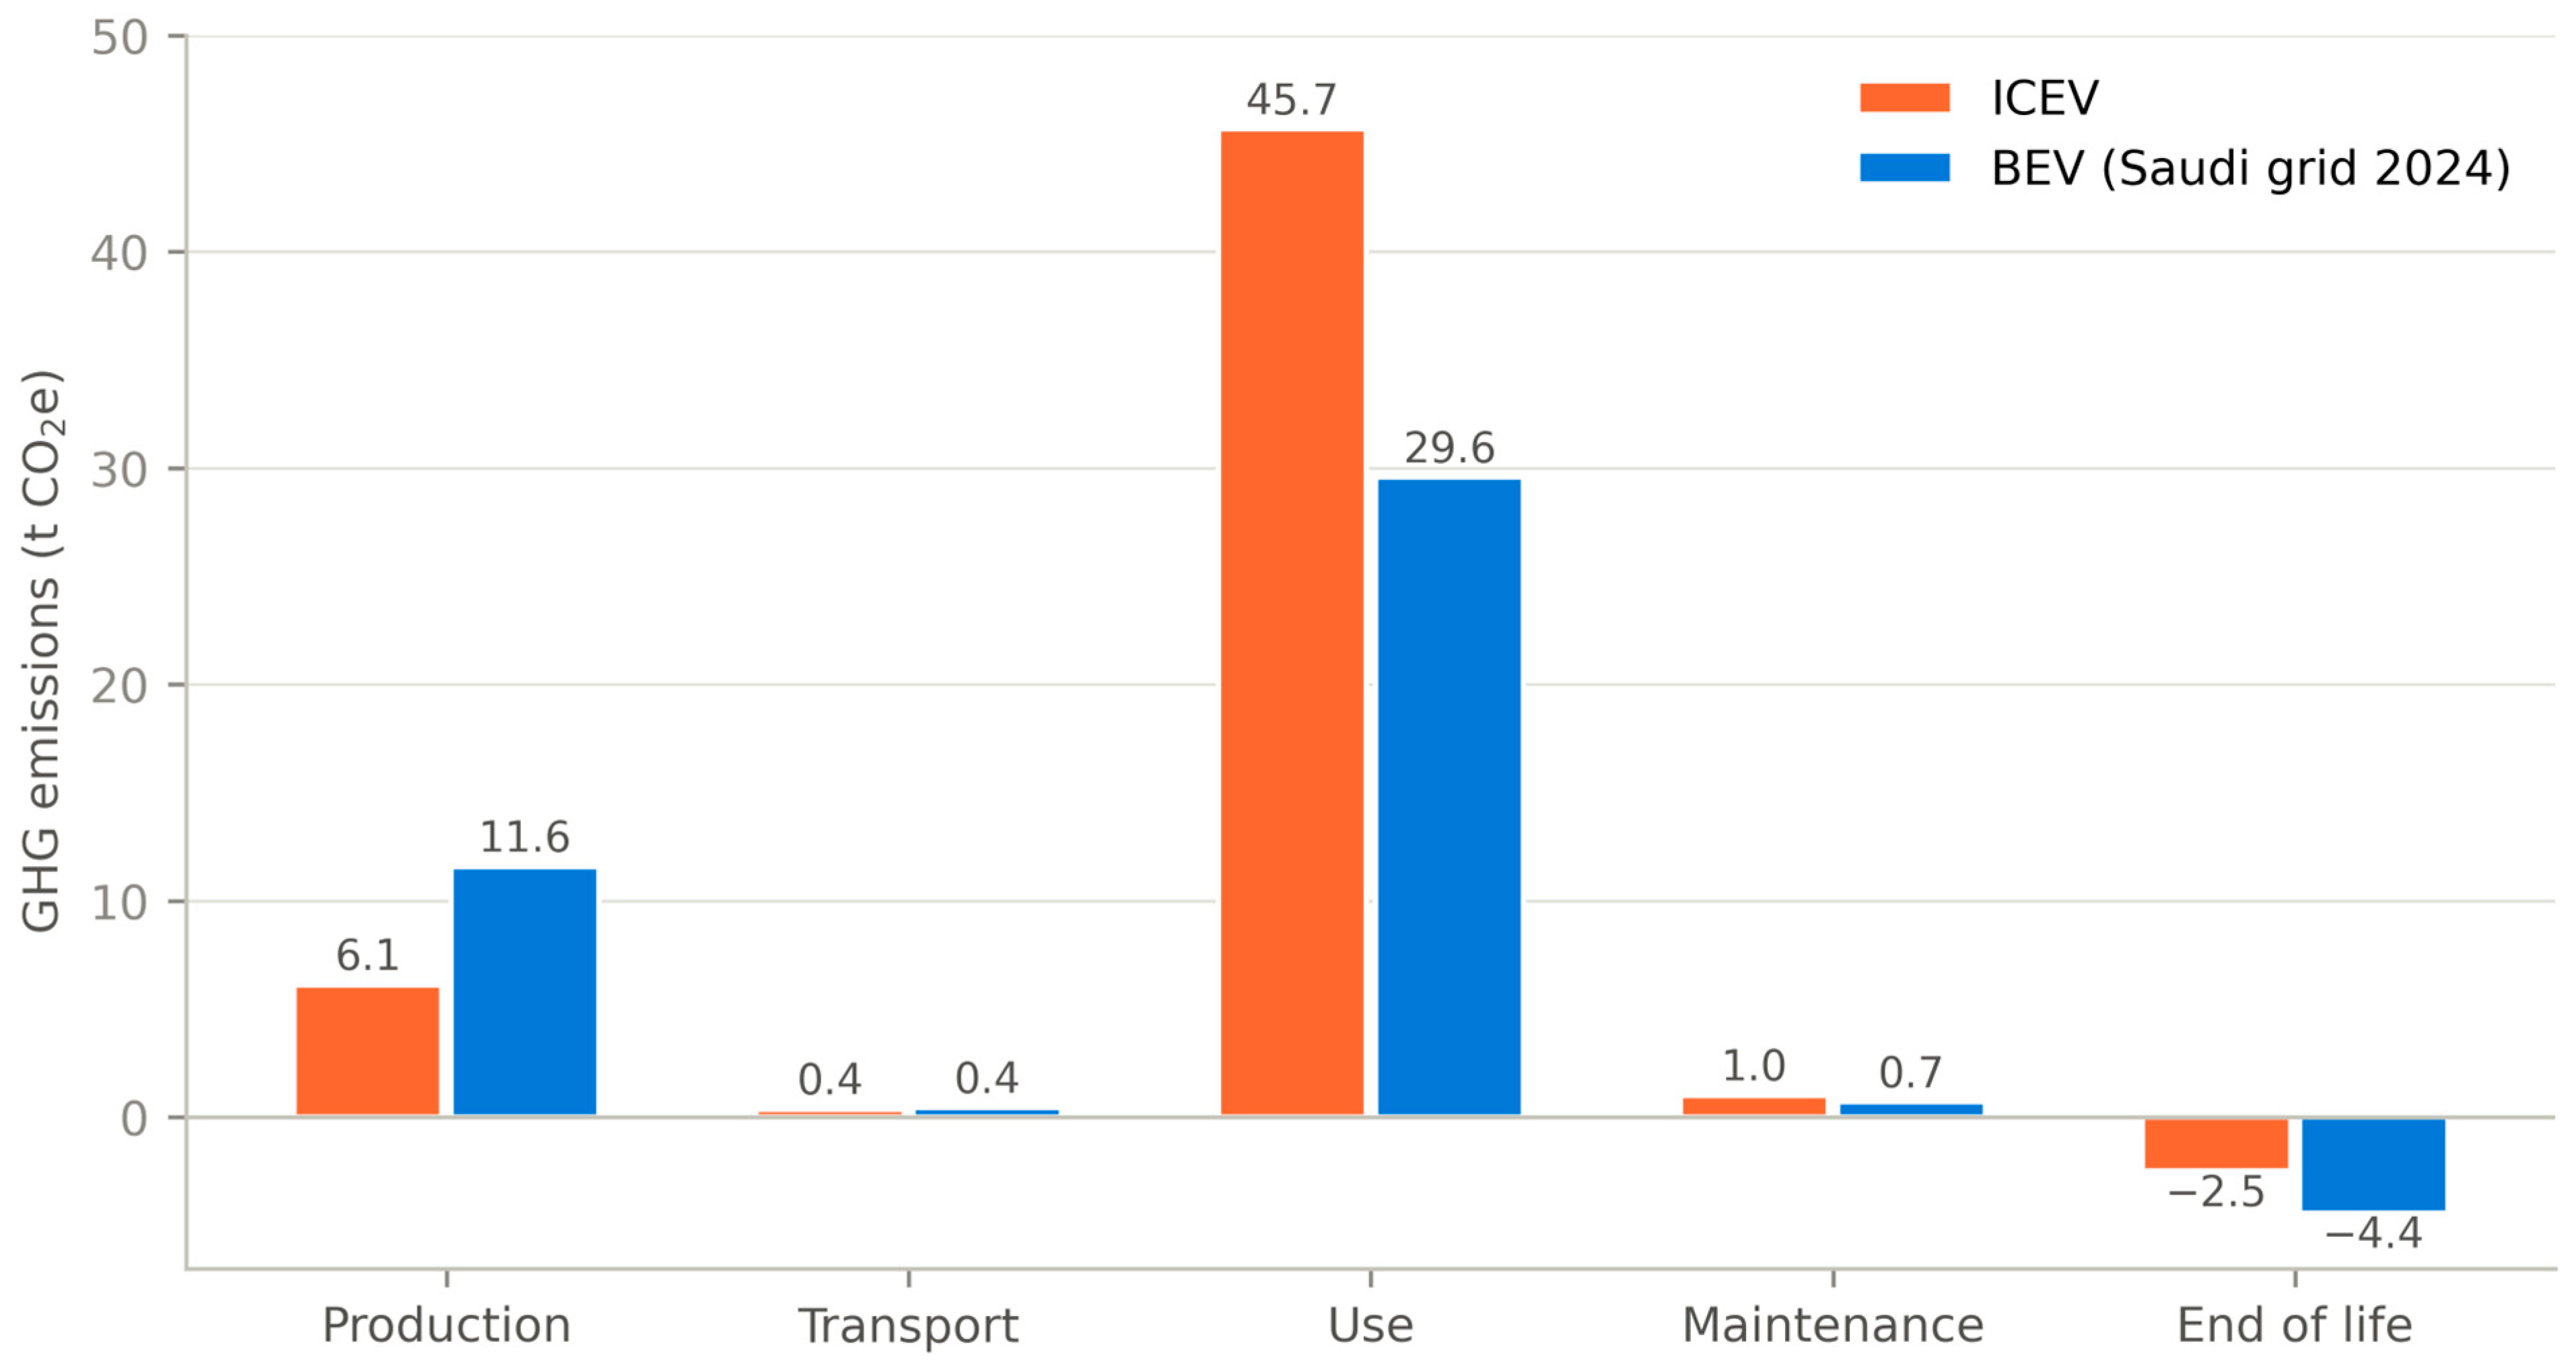
Table 7 and Figure 3 present the stage-by-stage inventory results for the base case: the 2024 Saudi grid for the BEV. The ICEV emits 50.6 t CO2e over its life (225 g CO2e/km), of which the use phase contributes 45.7 t (37.0 t tank-to-wheel combustion, 8.7 t upstream fuel supply)—85% of the gross total, closely reproducing the use-phase dominance found for energy-using products generally and for the machine tool of [6] (77–80%) in particular. The BEV emits 37.8 t CO2e (168 g CO2e/km) when charged with Saudi electricity, a 25.3% reduction relative to the ICEV. Its use phase (29.6 t) remains the largest stage at 70% of the gross total, but production rises to 27% of the total, against 12% for the ICEV—the redistribution of burdens from operation toward manufacturing that characterises electrified products. Transport and distribution are negligible for both vehicles (0.4 t, below 1%) and maintenance likewise (0.7–1.0 t). End-of-life recycling returns net credits of 2.5 t (ICEV) and 4.4 t (BEV); the larger BEV credit reflects both its aluminium content and the recovered battery materials.

4.3. Influence of the Electricity Grid

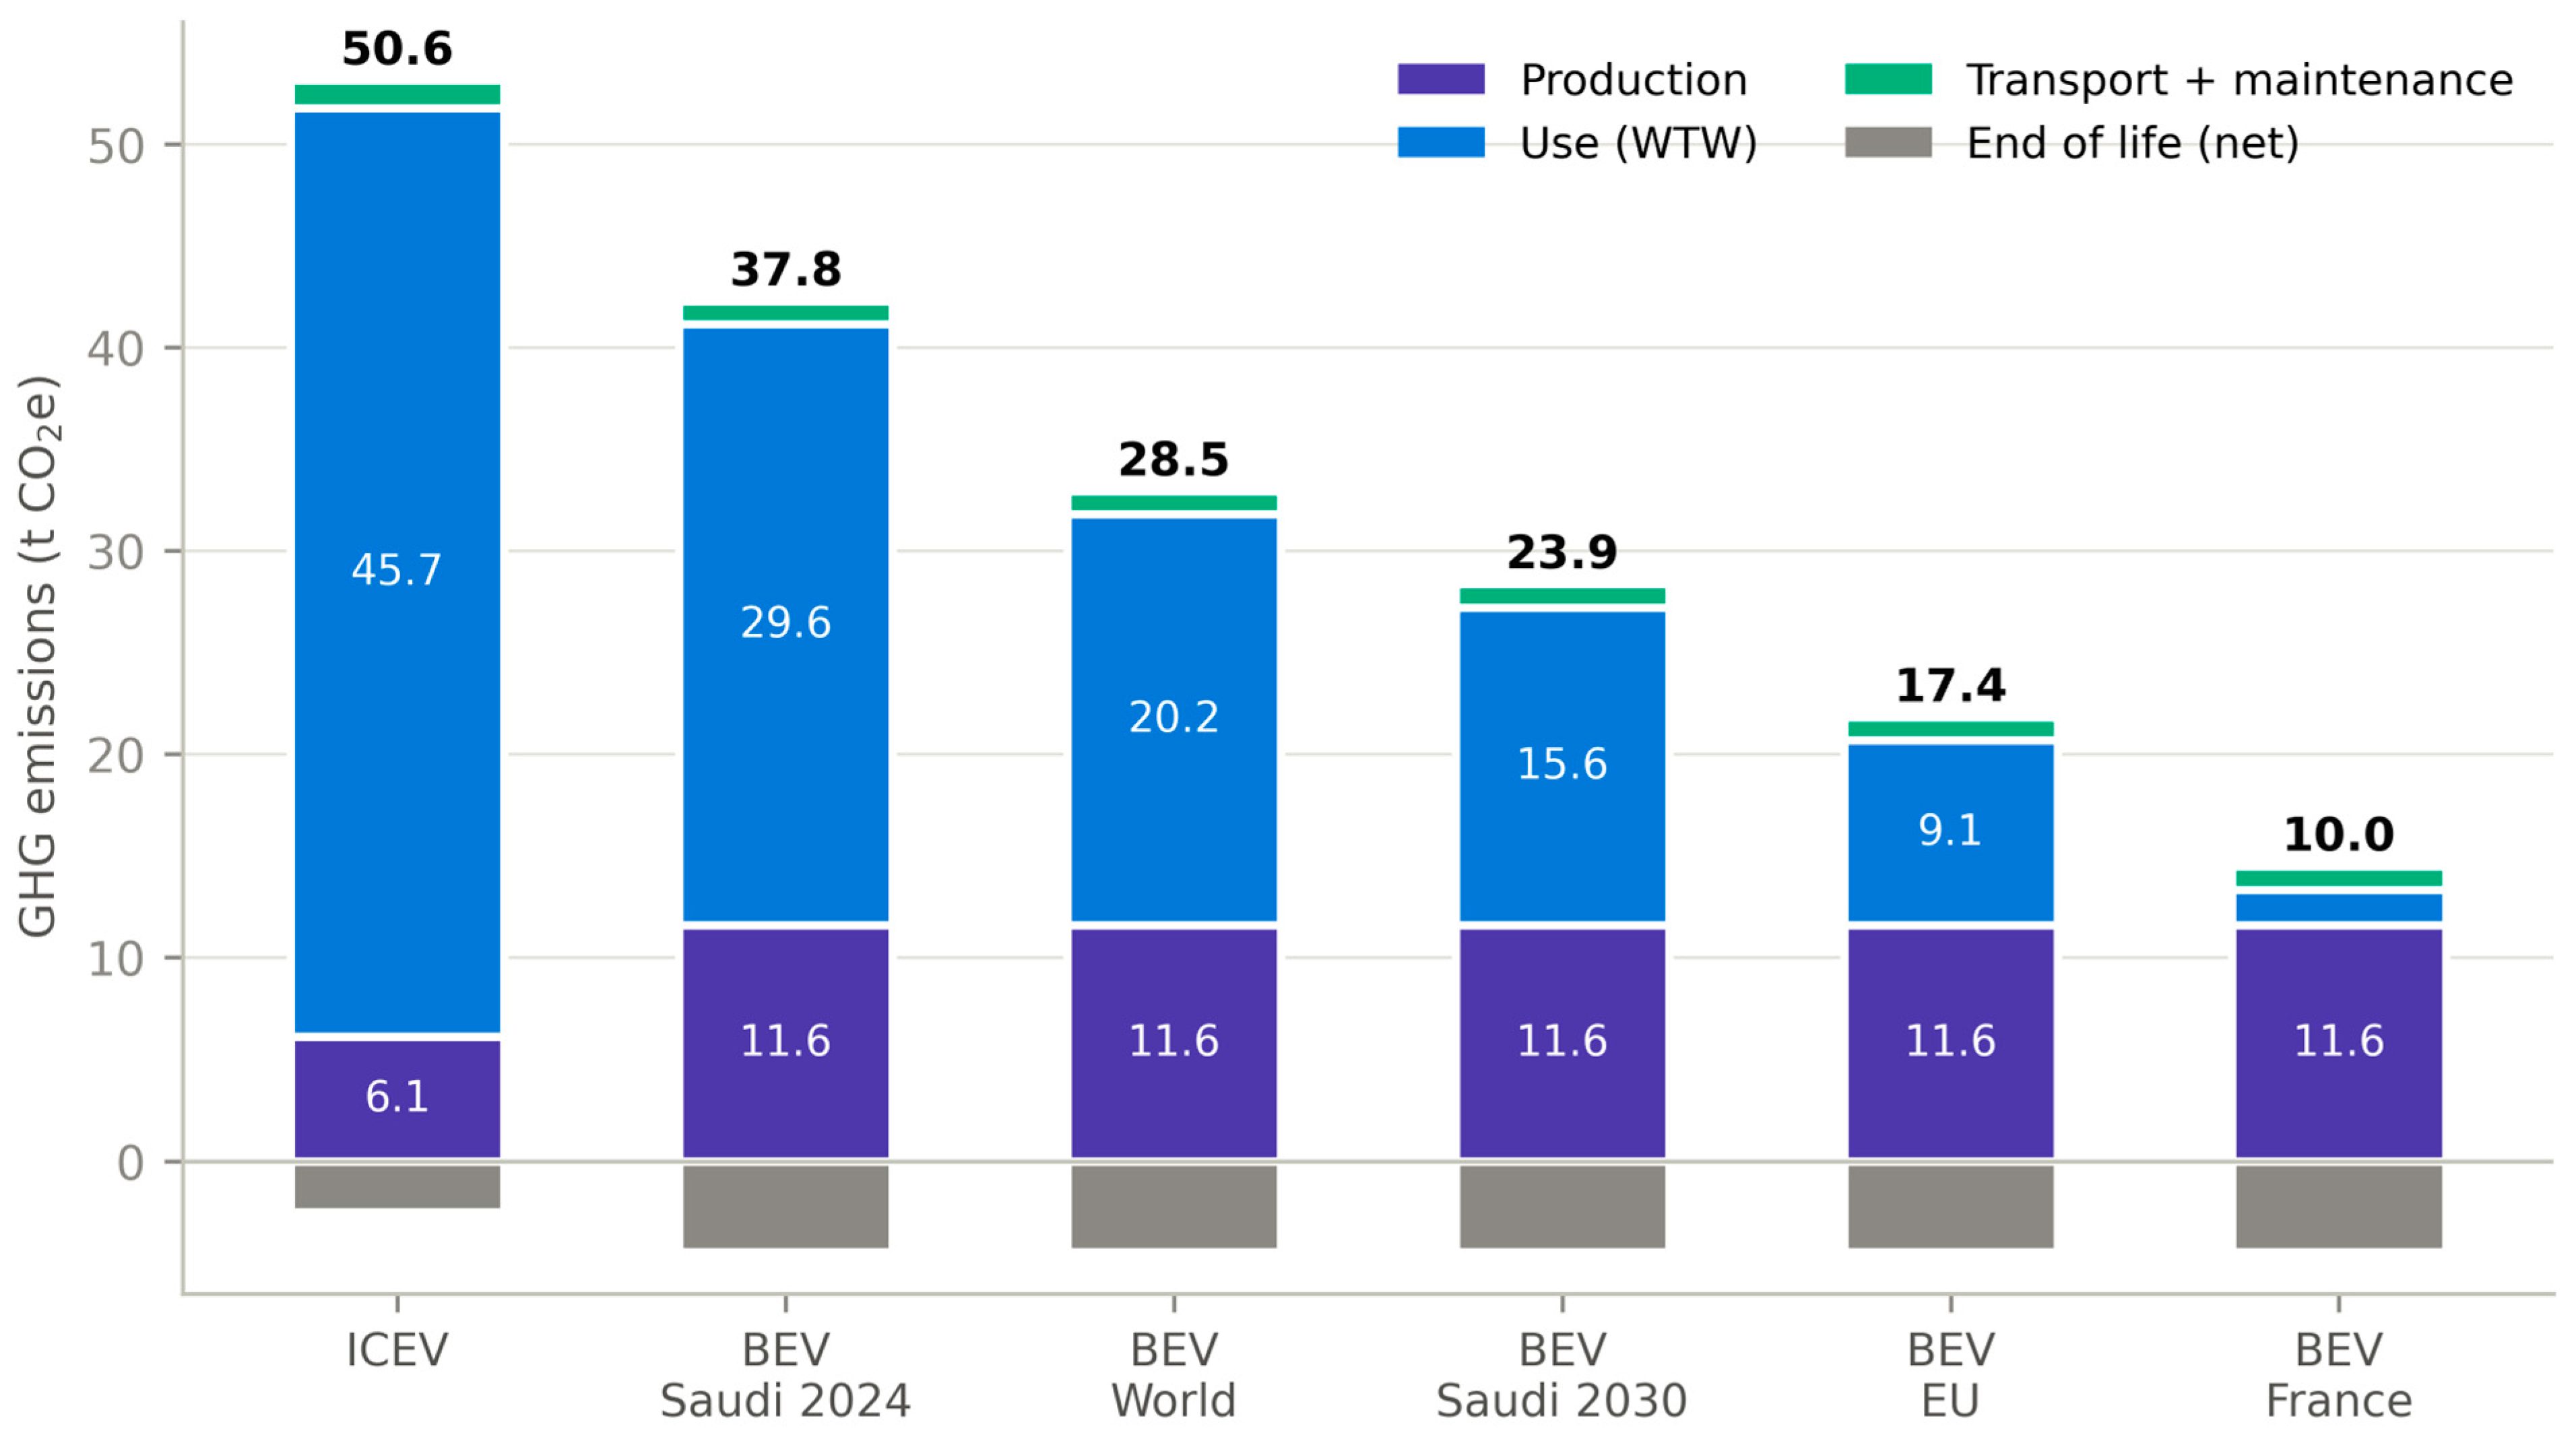
Table 8 and Figure 4 extend the comparison across the grid scenarios, all expressed as life cycle factors so that the electricity pathway carries its upstream fuel-supply emissions exactly as the gasoline pathway carries its well-to-tank component. The BEV’s life cycle total spans a factor of 3.8 between the extremes: 37.8 t CO2e on the 2024 Saudi grid and 10.0 t on the French grid—168 down to 45 g CO2e/km against the ICEV’s grid-independent 225 g CO2e/km. On the world-average grid the reduction is 44%; on the EU grid, 66%—matching the 66–69% reported for Europe by Bieker [20] and approaching the −73% of the 2025 ICCT update [15]. Under the Saudi 2030 target scenario the BEV’s total falls to 23.9 t (106 g CO2e/km) and the reduction more than doubles from 25% to 53%; even under the partial-delivery alternative (35% renewables, 464 g CO2e/kWh) the total is 28.1 t (125 g CO2e/km, −45%), so the policy conclusion—that the announced transition roughly doubles the electrification benefit—is robust to substantial under-delivery of the target. Figure 4 shows how grid decarbonisation reshapes the stage structure: the use phase falls from 70% of the BEV’s gross total on the 2024 Saudi grid to 12% on the French grid, leaving production dominant—the profile European BEVs are now approaching.

4.4. Break-Even Analysis

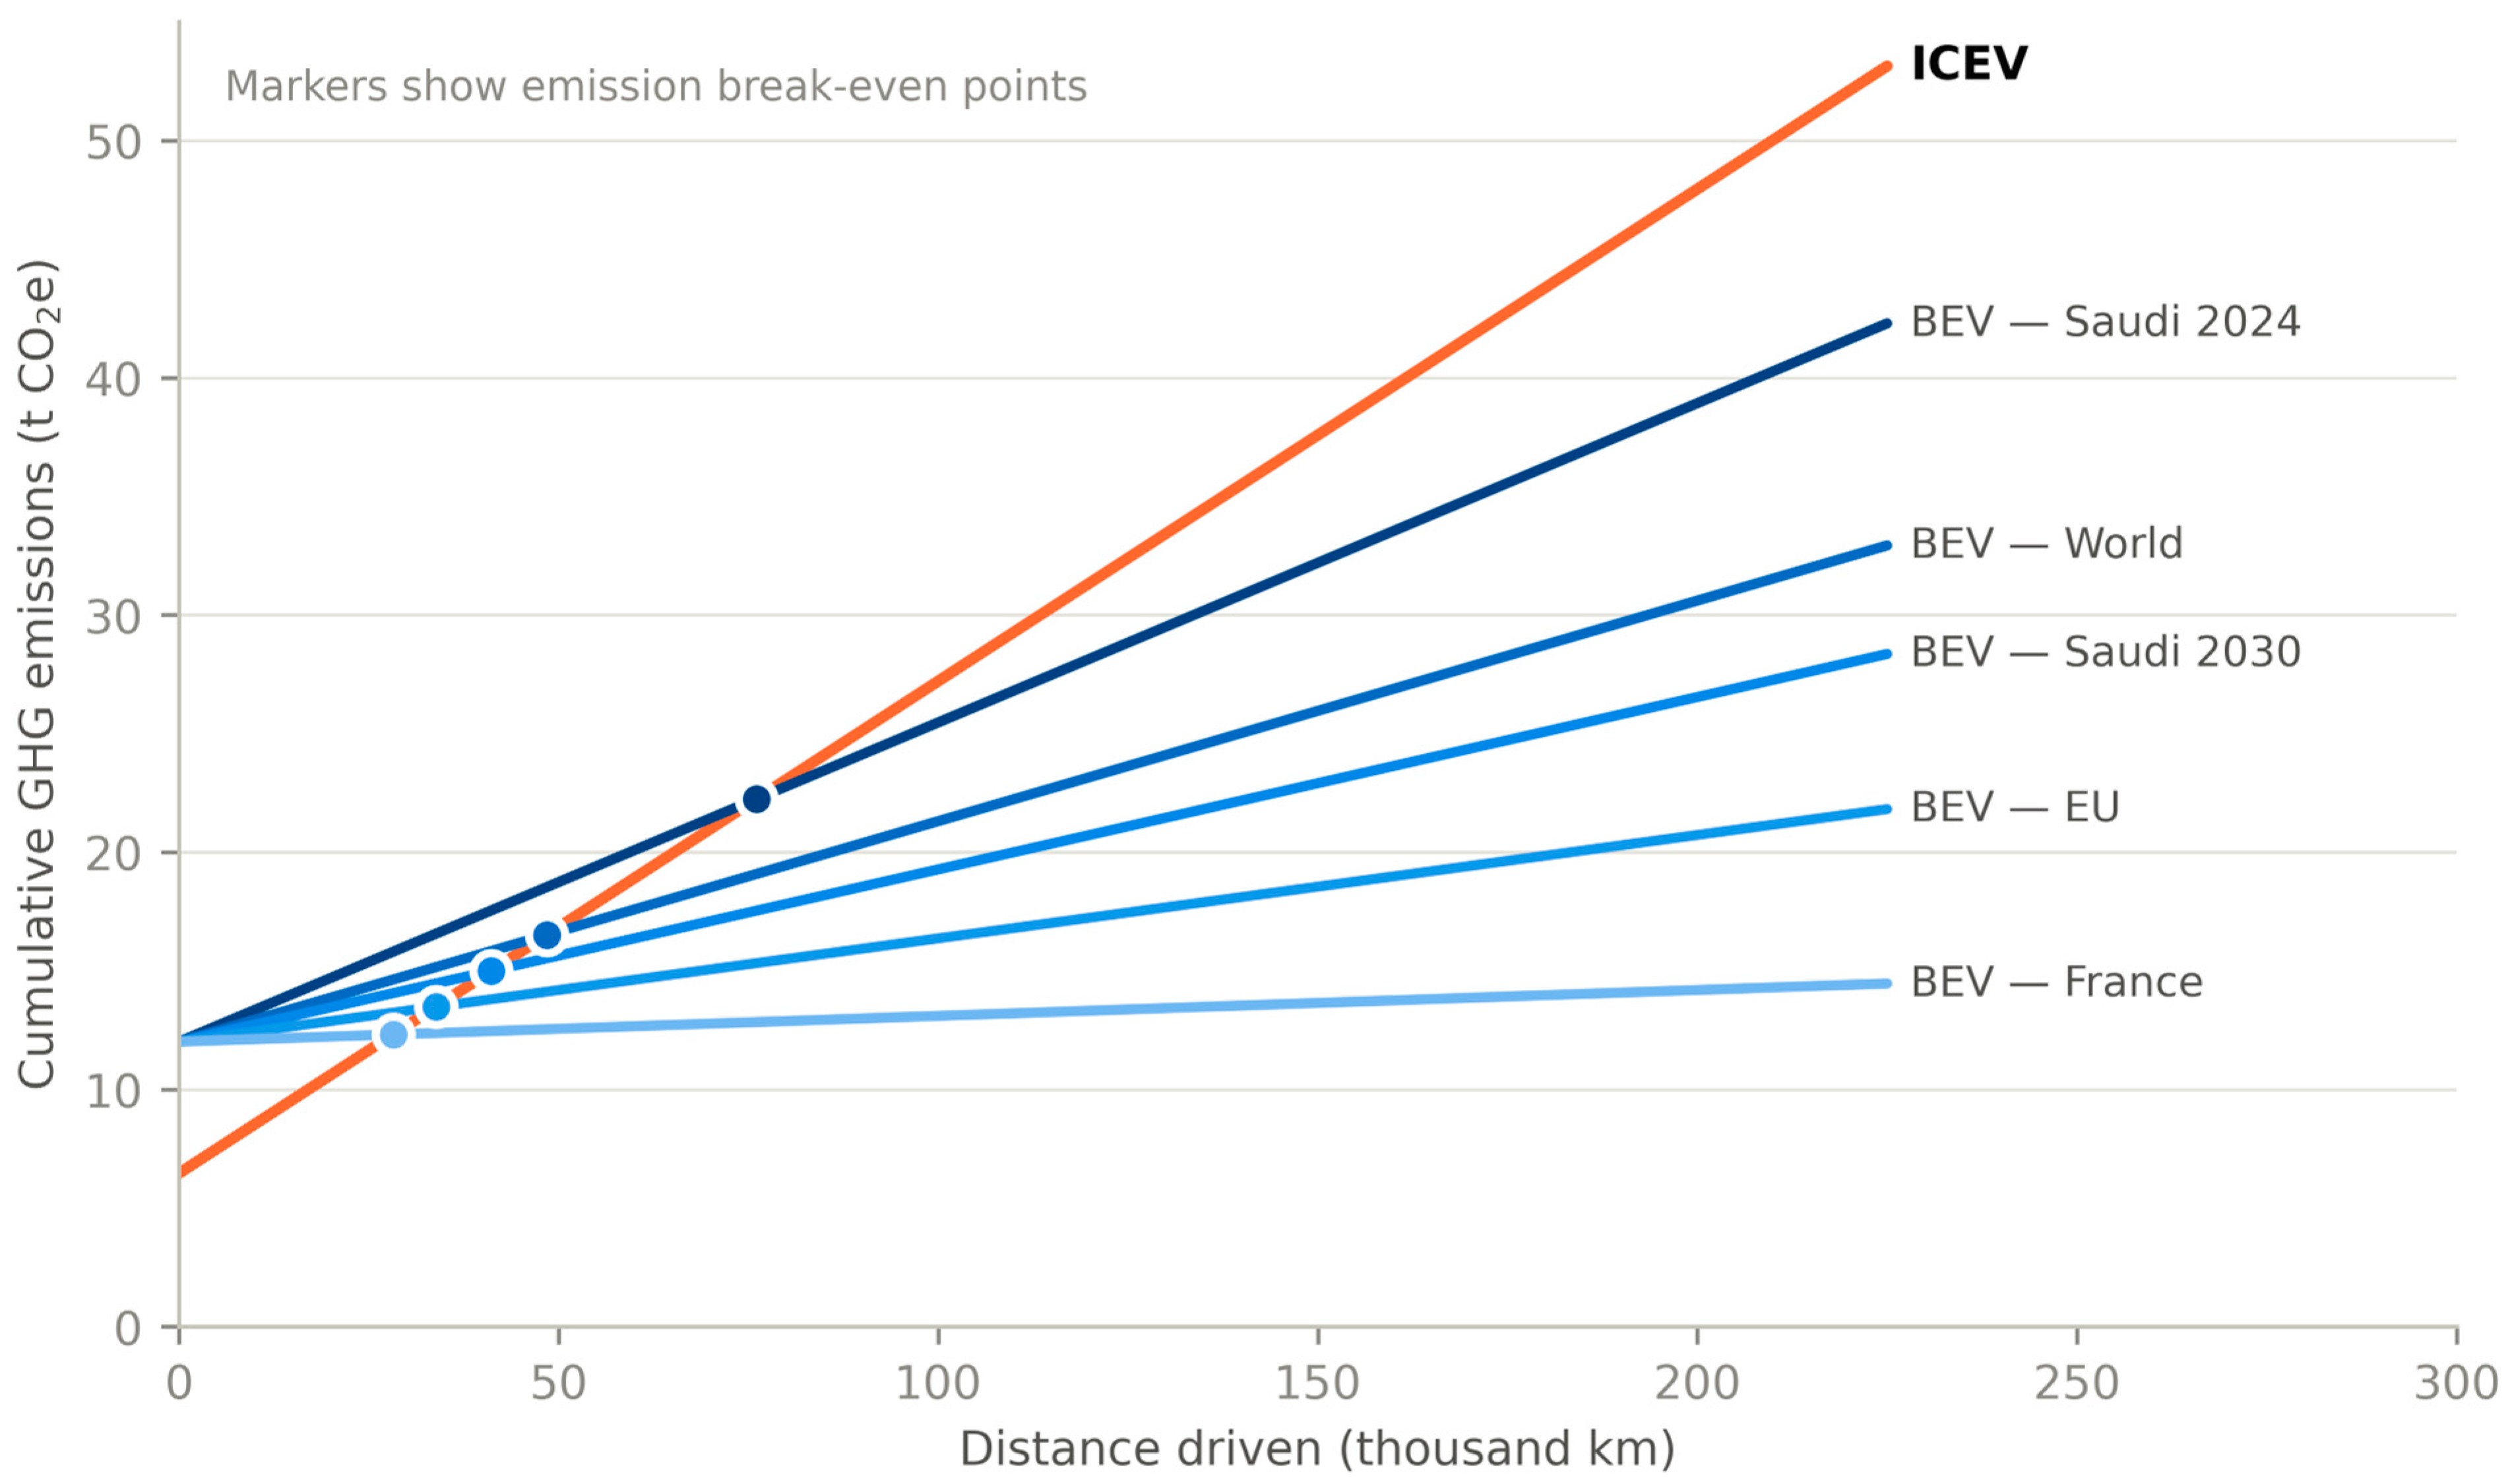
The BEV begins its life with a production deficit of 5.5 t CO2e (including distribution) and repays it through lower per-kilometre operating emissions (Figure 5). On the 2024 Saudi grid the crossover occurs at 76,000 km; at the KAPSARC estimate of Saudi annual mileage (≈25,750 km/yr [32]) this corresponds to almost exactly three years of typical driving—or just over four years at the more conservative 18,000 km/yr sometimes reported for the Kingdom—after which every kilometre widens the BEV’s advantage, reaching a cumulative saving of 12.8 t CO2e at end of life. Break-even falls to 48,400 km (≈1.9 years) on the world-average grid, 41,100 km on the 2030 target grid, 33,800 km on the EU grid and 28,200 km in France. These distances bracket the 51,000–87,000 km of Šimaitis et al. [22] and sit above the ≈17,000 km of the ICCT’s EU analysis [15], the difference attributable to that study’s cleaner projected charging mix and smaller reference battery; in every scenario the deficit is repaid within the first third of vehicle life, and within the typical Saudi ownership period.

4.5. Deterministic Sensitivity

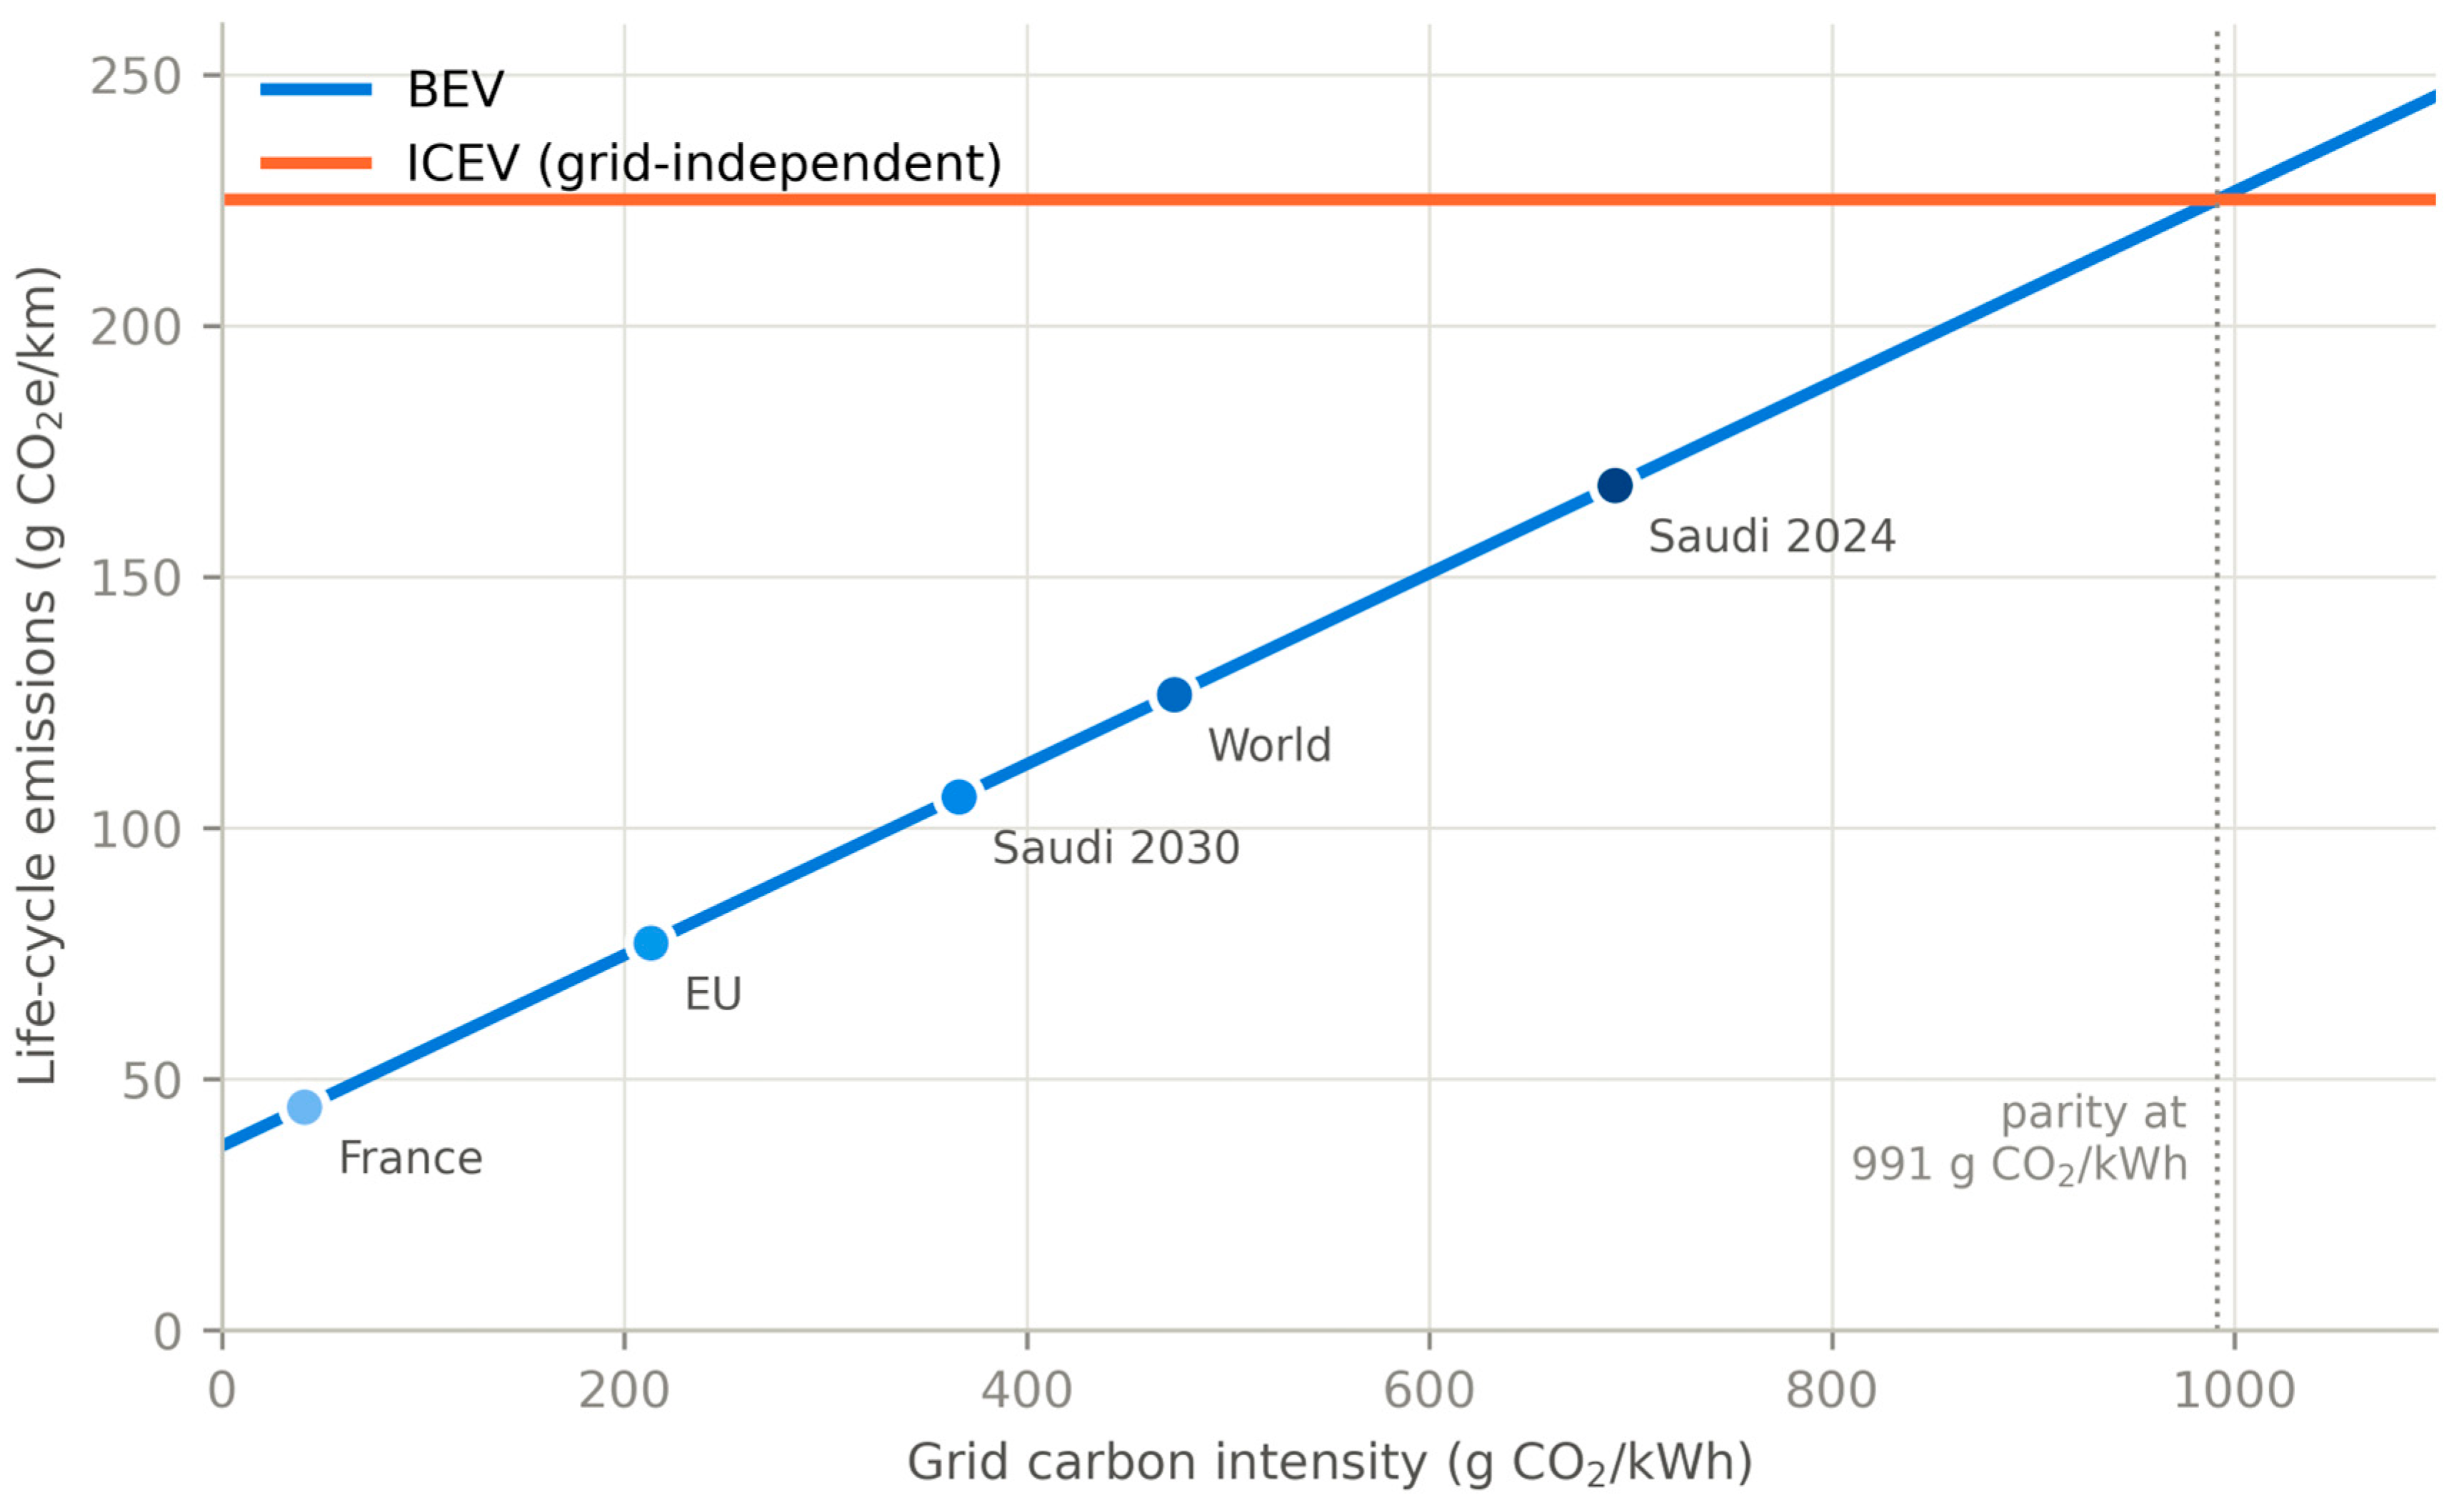
Lifetime. Shortening the service life to 150,000 km raises both vehicles’ per-km intensity (ICEV 234, BEV 185 g CO2e/km on the Saudi grid) because the production burden amortises over fewer kilometres; the BEV’s advantage narrows to 21% but does not invert. Extending to 300,000 km deepens it to 28%—the mirror image of the machine-tool finding of [6], where longer life increased total emissions but improved per-unit-of-service intensity. Battery production intensity. Across the harmonised 54–115 kg CO2e/kWh range [14] the BEV’s Saudi-grid total moves only between 36.7 and 40.4 t (−3.0% to +6.7%); even at the 95th percentile the BEV retains a 20% advantage. Battery capacity. Across the 40–80 kWh envelope of the Saudi mid-size market, the life cycle total spans 36.7–39.0 t CO2e and break-even spans 56,100–96,100 km (2.2–3.7 years at Saudi mileage): capacity is the strongest lever on the payback distance, supporting right-sizing of packs to actual range needs. Grid intensity remains the governing parameter overall (Figure 6), confirming Cox et al. [18]. The grid intensity at which the BEV and ICEV exchange ranking is 991 g CO2e/kWh (Figure 6)—approximately unabated coal-fired generation, 43% above the current Saudi factor.

4.6. Regional Scenarios: Climate, Materials and Second Life

Three scenarios test the regional realism concerns specific to the Gulf (Table 9). Hot climate. Raising energy consumption by 15% (BEV) and 12% (ICEV) for sustained air-conditioning and thermal load at ≈35 °C [54,55] increases both totals—ICEV to 56.1 t (249 g CO2e/km), BEV to 42.3 t (188 g)—but leaves the relative advantage essentially unchanged at 25%, and break-even actually shortens to 71,500 km because the ICEV’s per-kilometre penalty grows faster in absolute terms. Regional material sourcing. Replacing global steel, aluminium and polymer factors with Gulf production routes (DRI-EAF steel at 1.47 t CO2/t [27], gas-based smelter aluminium at 8.0 t CO2e/t [46], GCC polyolefins [43]) lowers material emissions for both vehicles—the BEV by more in absolute terms given its aluminium intensity—cutting the production gap to 4.9 t and break-even to 67,700 km. A domestic or Gulf-sourced supply chain thus improves the case for electrification, a finding directly relevant to the Kingdom’s localisation agenda. Second life. Repurposing the retired pack for stationary storage (credit 25 kg CO2e/kWh [58]) instead of immediate recycling improves the BEV total by a further 0.5 t to 37.3 t CO2e. Individually modest, the three scenarios are directionally aligned: none weakens the baseline conclusion, and two strengthen it.

4.7. Monte Carlo Uncertainty Analysis

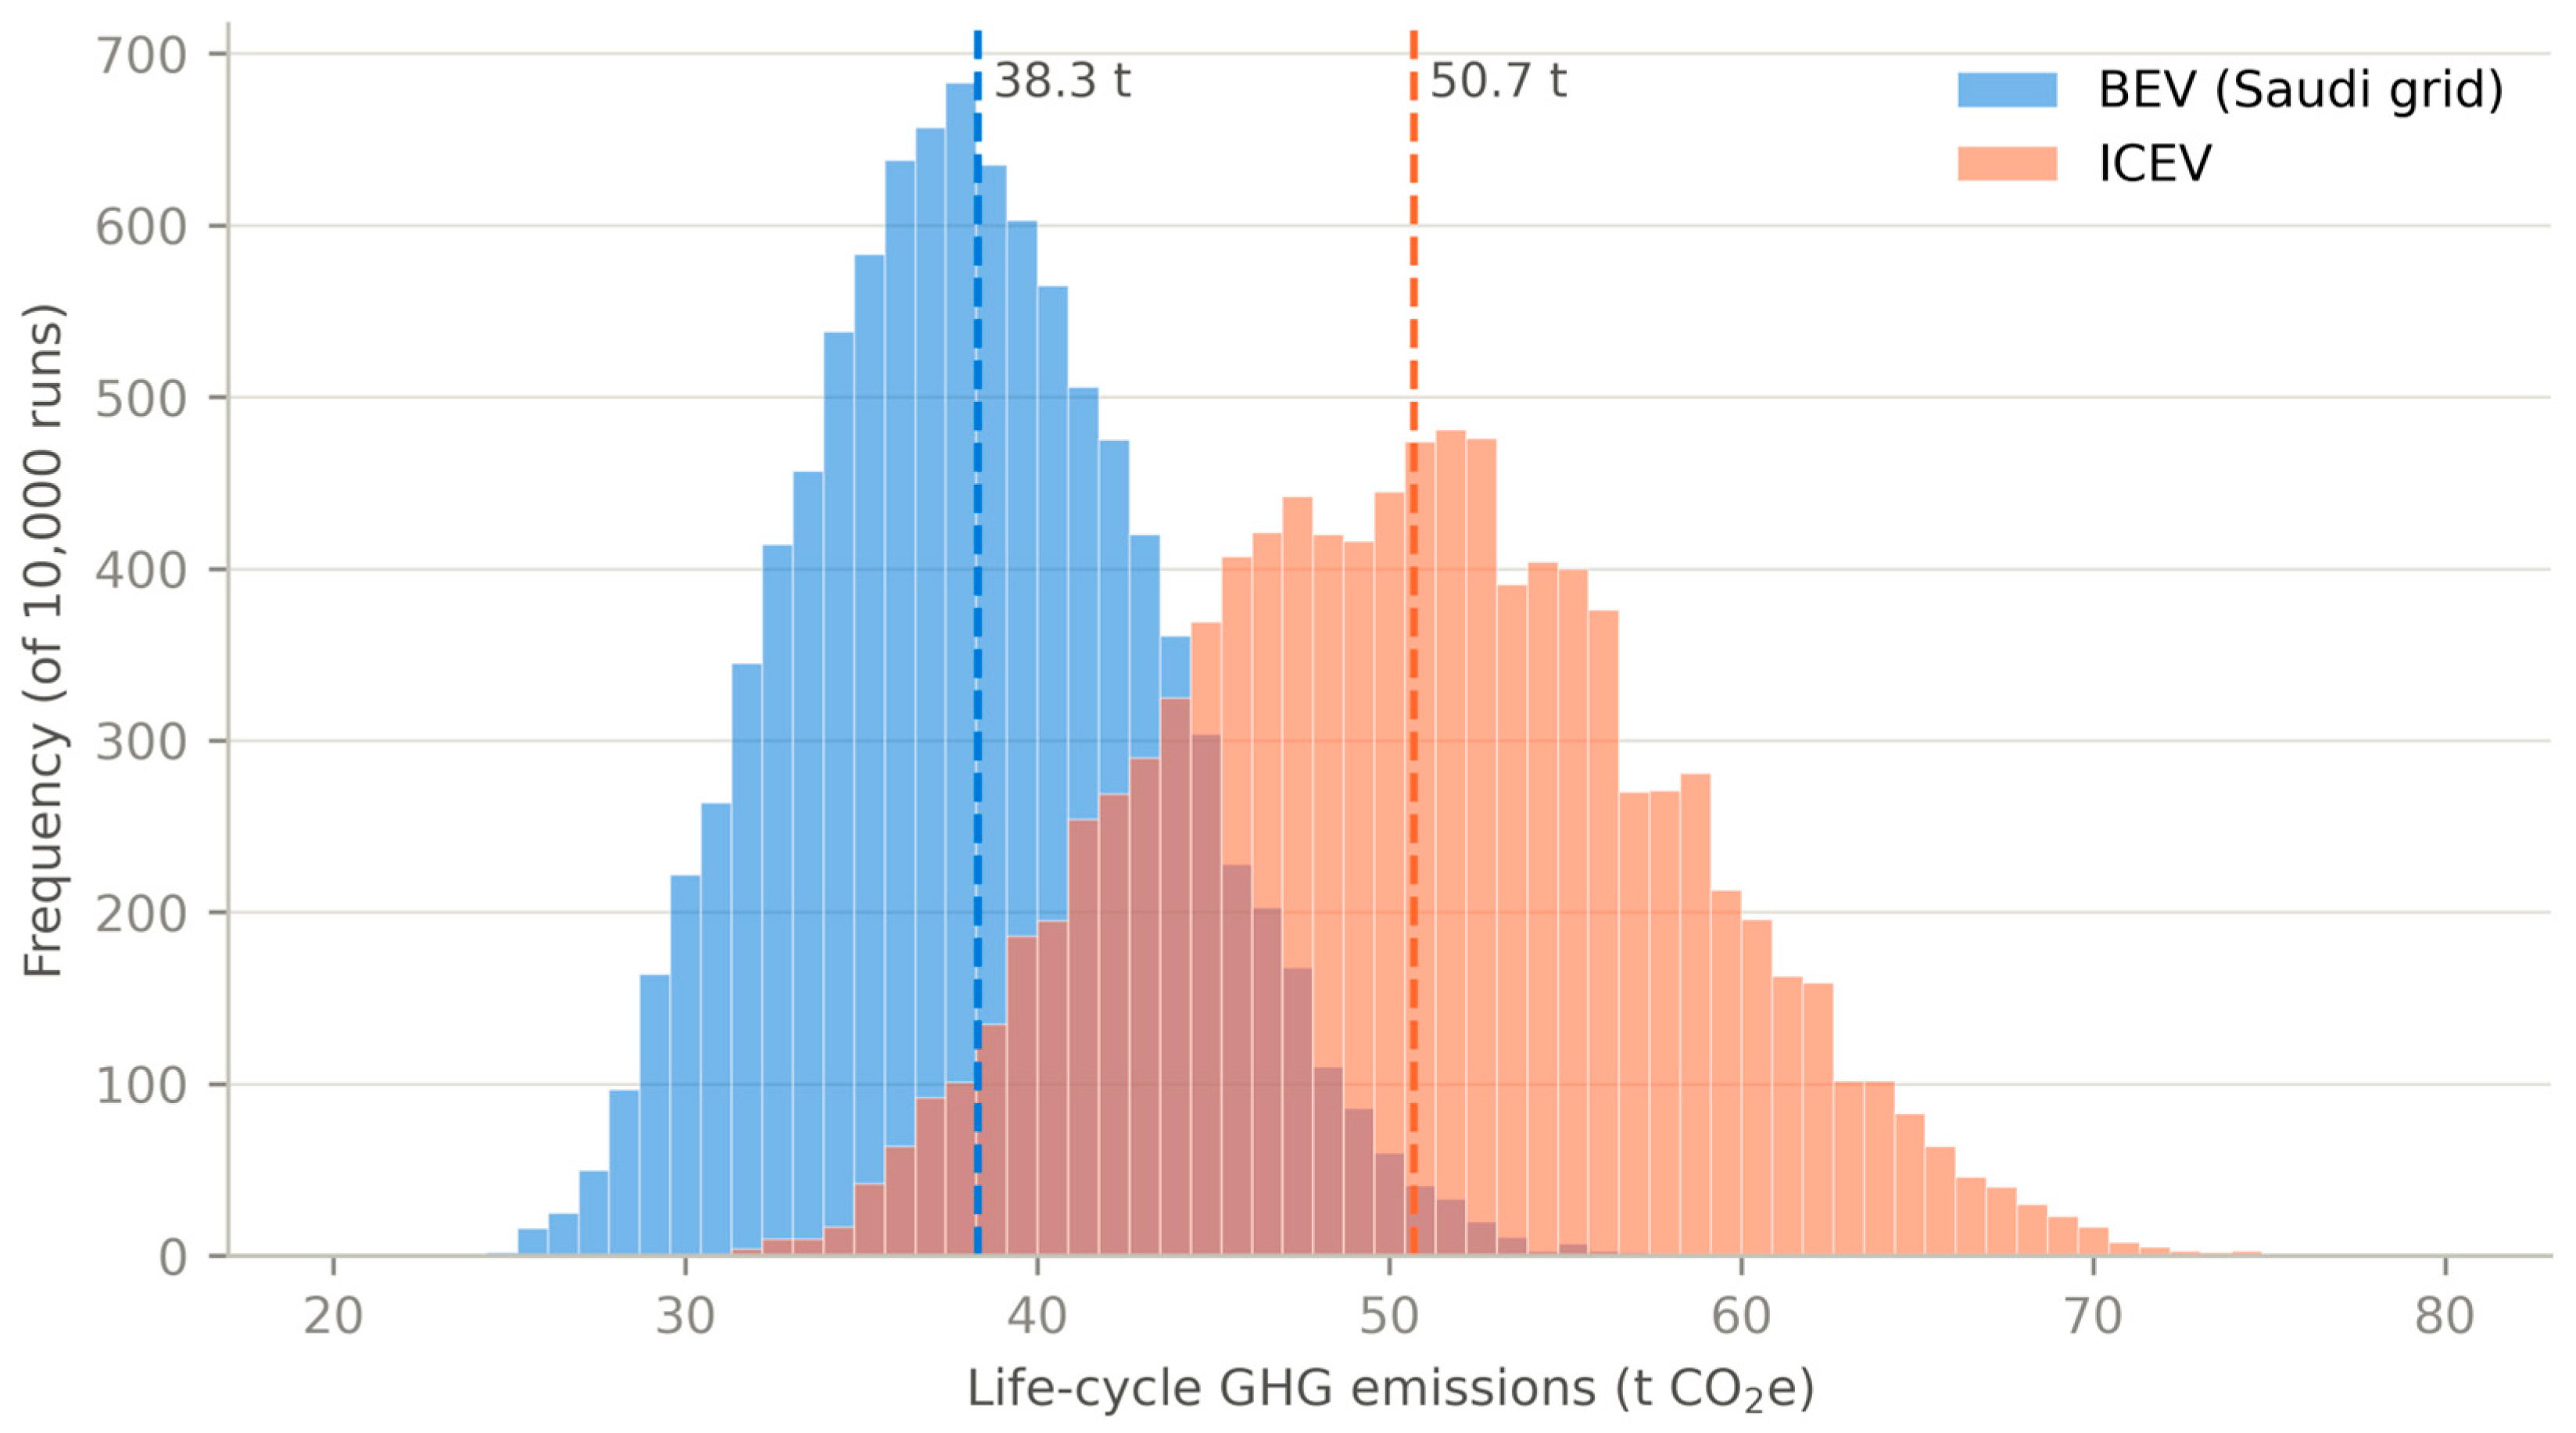
Figure 7 and Table 10 report the Monte Carlo results for the Saudi-grid base case. The ICEV’s total is 50.7 ± 7.2 t CO2e (5th–95th percentile 39.3–62.9) and the BEV’s 38.3 ± 5.1 t (30.1–47.1). The apparent breadth of these marginal distributions—a coefficient of variation of 13–14%—is dominated not by data quality but by the deliberately wide lifetime distribution: variance decomposition by squared rank correlation attributes 67% of BEV output variance and 81% of ICEV variance to the 150,000–300,000 km lifetime spread, with energy consumption contributing 19% and the grid factor 11% (BEV); battery intensity and material factors contribute below 2% each. Because lifetime and driving intensity are shared between the paired vehicles in each draw, this dominant variance source cancels in the comparison: the BEV emits less than the ICEV in 99.6% of the 10,000 runs, with a mean saving of 12.4 t CO2e. The distributions of the individual totals overlap, but the distribution of the difference does not include zero except in the extreme tail—the statistic that matters for the substitution decision.

5. Discussion

5.1. Comparison with the Literature

The model benchmarks closely against independent studies at every level of aggregation, and the comparisons are worth drawing in detail because they locate the fossil-grid case within the global evidence base. At the vehicle level, the ICEV intensity of 225 g CO2e/km sits within 5% of the ICCT’s 235 g CO2e/km for European gasoline cars [15] and inside the 220–260 g band of Hawkins et al. [10]; the BEV production total of 11.6 t CO2e lies between the academic mid-size estimates of 13–15 t [10,16] and the European Commission’s compact-BEV values of 8–10 t [29], with the production ratio of 1.9 matching the upper literature range. At the comparison level, the EU-grid reduction of 66% reproduces Bieker’s 66–69% [20]; the world-average reduction of 44% is consistent with the IEA’s roughly-half assessment for a global-average purchase [23]; and the fossil-grid margin of 25% aligns with the direction of Qiao et al.’s 18% on the 2015 Chinese grid [17]—a grid of comparable carbon intensity—and with Knobloch et al.’s finding that BEVs already outperform in regions covering 95% of transport demand [19]. The break-even span of 28,000–76,000 km brackets published values [15,22] once charging-mix and battery-size differences are accounted for. This convergence, obtained from an independent equation-level inventory rather than a proprietary database, supports the robustness of both approaches.
The Saudi-specific comparison merits closer attention. Alwosheel and Koroma [8] report a smaller BEV advantage for the Kingdom (−16%, versus −25% here) and find hybrids currently superior to BEVs. Three model differences explain the gap, each moving in the same direction: this study uses the 2024 grid factor (692 g CO2e/kWh) rather than their 2022 value (735 g), a 60 kWh reference battery rather than a larger pack, and the 2025-vintage battery production intensity (72.8 kg CO2e/kWh) rather than earlier, higher values. The difference between the two studies is therefore instructive rather than contradictory as follows: it quantifies how quickly the comparison moves in the BEV’s favour as the grid and the battery industry decarbonise—roughly nine percentage points of advantage in two model-years—and both studies agree that power-sector decarbonisation is the binding constraint on the climate value of Saudi electrification. The Qatari assessment of Onat et al. [7] is likewise directionally consistent. The hot-climate scenario (Section 4.6) additionally shows that the harsh-climate concern, often raised against European consumption values in Gulf assessments, changes the margin by less than one percentage point.
The stage-structure findings generalise those of the machine-tool study [6] on which this work builds methodologically. There, the use phase produced ≈77–80% of life cycle emissions and a material substitution (CFRP) could invert stage dominance; here, the use phase produces 85% (ICEV) and 70% (BEV, Saudi grid) of gross emissions, and the traction battery plays precisely the CFRP role—a single component that concentrates embodied carbon and shifts the life cycle’s centre of gravity toward production, to 80% of gross emissions on the near-decarbonised French grid (Figure 4). The parallel underlines a general design principle for energy-using products: as the energy supply decarbonises, embodied emissions become the dominant lever, and material efficiency, battery right-sizing and recycling rise in priority relative to operational efficiency. Operational efficiency itself is not exhausted as a lever; however, beyond fixed consumption values, vehicle-level energy management—including optimal torque-distribution control demonstrated for in-wheel-motor electric vehicles with deep-reinforcement-learning methods [59]—can reduce real-world electricity demand and thereby shorten the carbon break-even distance further.

5.2. Policy Implications for Saudi Arabia

Three implications follow for the Saudi context. First, vehicle electrification already delivers a robust climate benefit on the current, almost entirely fossil-fuelled grid: the 991 g CO2e/kWh parity intensity exceeds the 2024 Saudi factor by 43%, and the Monte Carlo analysis shows the advantage surviving in 99.6% of parameter combinations. The concern that EVs merely displace emissions to gas- and oil-fired power stations is, for the Kingdom, quantitatively unfounded—and the carbon payback period of roughly three years of typical Saudi driving [32] falls within the country’s short vehicle-ownership cycles, meaning even first owners typically hold the vehicle past its break-even point. Second, the announced power-sector transition roughly doubles the benefit—from 25% to 53% at the full 50% renewable target, and to 45% even under a 35% partial-delivery pathway—so vehicle electrification and grid decarbonisation are strongly complementary policies whose joint pursuit matters more than their sequencing. Third, the supply-chain findings align electrification with the localisation agenda: Gulf-sourced DRI-EAF steel and gas-based aluminium shorten the BEV’s break-even by 8000 km, battery right-sizing (40 kWh) shortens it by a further 20,000 km, and second-life battery deployment adds an end-of-life credit—while a domestic recycling capability would retain the material credits of Section 4.6 within the Kingdom’s nascent EV industrial ecosystem.

5.3. Limitations and Future Work

Five limitations bound the interpretation. First, although both energy pathways are evaluated on a life cycle well-to-wheel basis, the electricity factors are annual national averages; marginal charging attribution, time-of-day charging profiles, and transmission-loss allocation could move BEV use-phase totals in either direction and merit Saudi-specific analysis as charging demand grows. Second, energy consumption inputs remain European real-world values adjusted by scenario; measured Saudi drive cycles—extreme ambient temperature, sustained air-conditioning, highway speed profiles—are the clearest avenue for future work, though Section 4.6 bounds their plausible effect on the comparison at under one percentage point. Third, the inventory assumes primary production for all materials symmetrically, with recycling as an end-of-life credit; a consequential treatment of recycled content, and Gulf-specific inventories beyond the emission-factor substitution of Section 4.6, would refine stage attribution. Fourth, the assessment covers climate change and energy only; toxicity, acidification, mineral depletion and water consumption—salient for Gulf mining and refining chains—remain outside the scope, and BEVs can perform worse in several of these categories [10]. Fifth, the analysis is vehicle-level; fleet conclusions require adoption dynamics—including the consumer-adoption determinants analysed for comparable MENA markets by Boubker et al. [60]—together with charging-infrastructure roll-out and grid-expansion modelling of the kind pursued in [7,21], and infrastructure differences excluded here (≈4–8 g CO2e/km for charging infrastructure [35]) would marginally reduce the BEV advantage in a fleet-wide accounting. Extension to hybrids and fuel-cell vehicles under the same transparent inventory would complete the regional powertrain comparison.

6. Conclusions

This study applied a transparent, ISO 14040/14044-conformant process-sum life cycle model—extended from a methodology previously demonstrated on industrial machinery [6]—to compare a mid-size battery electric car with a gasoline car, with the use phase evaluated across life cycle-consistent electricity scenarios centred on Saudi Arabia. Over 225,000 km, the ICEV emits 50.6 t CO2e (225 g CO2e/km), 85% in the well-to-wheel use phase. The BEV emits 37.8 t (168 g CO2e/km) on the 2024 Saudi grid—a 25% reduction—falling to 28.5 t on the world-average grid, 23.9 t under the Kingdom’s 50% renewable target (28.1 t under a 35% partial-delivery pathway), and 17.4 t on the EU grid. Production emissions are 1.9 times the ICEV’s, with the 60 kWh battery contributing 38%; the deficit is repaid at 76,000 km on the current grid—about three years of typical Saudi driving—and within the first third of vehicle life in every scenario. The ranking survives hot-climate consumption, Gulf material sourcing (which shortens break-even), battery capacities from 40 to 80 kWh, second-life end-of-life treatment, and Monte Carlo propagation of all parameter uncertainties simultaneously (BEV superior in 99.6% of 10,000 draws, with the residual spread dominated by the shared lifetime assumption rather than by data quality). Grid parity would require 991 g CO2e/kWh—above any national grid. Vehicle electrification is therefore a sound climate strategy even in the most fossil-intensive grid environments; its value compounds with power-sector decarbonisation, and as the use phase decarbonises the analytical priority shifts to embodied emissions—battery production, aluminium, and end-of-life recovery.

Supplementary Materials

The following supporting information can be downloaded at https://www.mdpi.com/article/10.3390/wevj17080415/s1, the complete life cycle inventory model (Python), all input data with sources, and the scripts generating every figure and table.

Funding

This research received no external funding.

Institutional Review Board Statement

Not applicable.

Informed Consent Statement

Not applicable.

Data Availability Statement

The complete inventory model, input data and figure-generation scripts are contained in the Supplementary Materials and are available from the corresponding author on request.

Conflicts of Interest

The author declares no conflicts of interest.

Abbreviations

The following abbreviations are used in this manuscript: BEV—battery electric vehicle; ICEV—internal combustion engine vehicle; LCA—life cycle assessment; LCI—life cycle inventory; LCIA—life cycle impact assessment; GHG—greenhouse gas; GWP—global warming potential; NMC—nickel manganese cobalt (lithium-ion cathode chemistry); WTT—well-to-tank; TTW—tank-to-wheel; WTW—well-to-wheel; RE—renewable energy; EF—emission factor; EU—European Union; ICCT—International Council on Clean Transportation; IEA—International Energy Agency; ELV—end-of-life vehicle; CFRP—carbon-fibre-reinforced polymer; DRI-EAF—direct reduced iron/electric arc furnace; PV—photovoltaic.

References

  1. National Renewable Energy Program. Available online: https://www.iea.org/policies/14658-saudi-national-renewable-energy-program-nrep (accessed on 3 August 2026).
  2. Saudi Green Initiative Targets: Reducing Carbon Emissions. Available online: https://www.sgi.gov.sa/about-sgi/sgi-targets/reduce-carbon-emissions/ (accessed on 3 August 2026).
  3. ISO 14040:2006; Environmental Management—Life Cycle Assessment—Principles and Framework. International Organization for Standardization: Geneva, Switzerland, 2006.
  4. ISO 14044:2006; Environmental Management—Life Cycle Assessment—Requirements and Guidelines. International Organization for Standardization: Geneva, Switzerland, 2006.
  5. Ember. Saudi Arabia Electricity Profile, Yearly Electricity Data. Available online: https://ember-energy.org/countries-and-regions/saudi-arabia/ (accessed on 8 July 2026).
  6. Baabdullah, O.A.B. Life Cycle Analysis of a Machine Tool. Master’s Thesis, University of Manchester, Manchester, UK, 2016. [Google Scholar]
  7. Onat, N.C.; Kucukvar, M.; Aboushaqrah, N.N.M.; Jabbar, R. How Sustainable Is Electric Mobility? A Comprehensive Sustainability Assessment Approach for the Case of Qatar. Appl. Energy 2019, 250, 461–477. [Google Scholar] [CrossRef]
  8. Alwosheel, A.; Koroma, M.S. Environmental Performance of Passenger Cars in the KSA: Comparison of Different Technologies via a Life Cycle Assessment Approach; KAPSARC: Riyadh, Saudi Arabia, 2024. [Google Scholar] [CrossRef]
  9. Koroma, M.S.; Alwosheel, A.; Bhatt, Y.; Arora, A. Life Cycle Environmental and Cost Analysis of SUVs: A Saudi Arabia Case Study. Sustain. Futures 2025, 9, 100715. [Google Scholar] [CrossRef]
  10. Hawkins, T.R.; Singh, B.; Majeau-Bettez, G.; Strømman, A.H. Comparative Environmental Life Cycle Assessment of Conventional and Electric Vehicles. J. Ind. Ecol. 2013, 17, 53–64. [Google Scholar] [CrossRef]
  11. Notter, D.A.; Gauch, M.; Widmer, R.; Wäger, P.; Stamp, A.; Zah, R.; Althaus, H.-J. Contribution of Li-Ion Batteries to the Environmental Impact of Electric Vehicles. Environ. Sci. Technol. 2010, 44, 6550–6556. [Google Scholar] [CrossRef] [PubMed]
  12. Ellingsen, L.A.-W.; Majeau-Bettez, G.; Singh, B.; Srivastava, A.K.; Valøen, L.O.; Strømman, A.H. Life Cycle Assessment of a Lithium-Ion Battery Vehicle Pack. J. Ind. Ecol. 2014, 18, 113–124. [Google Scholar] [CrossRef]
  13. Emilsson, E.; Dahllöf, L. Lithium-Ion Vehicle Battery Production—Status 2019 on Energy Use, CO2 Emissions, Use of Metals, Products Environmental Footprint, and Recycling; Report C 444; IVL Swedish Environmental Research Institute: Stockholm, Sweden, 2019. [Google Scholar]
  14. Peiseler, L.; Schenker, V.; Schatzmann, K.; Pfister, S.; Wood, V.; Schmidt, T.S. Carbon Footprint Distributions of Lithium-Ion Batteries and Their Materials. Nat. Commun. 2024, 15, 10301. [Google Scholar] [CrossRef] [PubMed]
  15. Negri, M.; Bieker, G. Life-Cycle Greenhouse Gas Emissions from Passenger Cars in the European Union: A 2025 Update; International Council on Clean Transportation: Washington, DC, USA, 2025. [Google Scholar]
  16. Qiao, Q.; Zhao, F.; Liu, Z.; Jiang, S.; Hao, H. Cradle-to-Gate Greenhouse Gas Emissions of Battery Electric and Internal Combustion Engine Vehicles in China. Appl. Energy 2017, 204, 1399–1411. [Google Scholar] [CrossRef]
  17. Qiao, Q.; Zhao, F.; Liu, Z.; He, X.; Hao, H. Life Cycle Greenhouse Gas Emissions of Electric Vehicles in China: Combining the Vehicle Cycle and Fuel Cycle. Energy 2019, 177, 222–233. [Google Scholar] [CrossRef]
  18. Cox, B.; Mutel, C.L.; Bauer, C.; Mendoza Beltran, A.; van Vuuren, D.P. Uncertain Environmental Footprint of Current and Future Battery Electric Vehicles. Environ. Sci. Technol. 2018, 52, 4989–4995. [Google Scholar] [CrossRef] [PubMed]
  19. Knobloch, F.; Hanssen, S.V.; Lam, A.; Pollitt, H.; Salas, P.; Chewpreecha, U.; Huijbregts, M.A.J.; Mercure, J.-F. Net Emission Reductions from Electric Cars and Heat Pumps in 59 World Regions over Time. Nat. Sustain. 2020, 3, 437–447. [Google Scholar] [CrossRef] [PubMed]
  20. Bieker, G. A Global Comparison of the Life-Cycle Greenhouse Gas Emissions of Combustion Engine and Electric Passenger Cars; White Paper; International Council on Clean Transportation: Washington, DC, USA, 2021. [Google Scholar]
  21. Sacchi, R.; Bauer, C.; Cox, B.; Mutel, C. When, Where and How Can the Electrification of Passenger Cars Reduce Greenhouse Gas Emissions? Renew. Sustain. Energy Rev. 2022, 162, 112475. [Google Scholar] [CrossRef]
  22. Šimaitis, J.; Lupton, R.; Vagg, C.; Butnar, I.; Sacchi, R.; Allen, S. Battery Electric Vehicles Show the Lowest Carbon Footprints among Passenger Cars across 1.5–3.0 °C Energy Decarbonisation Pathways. Commun. Earth Environ. 2025, 6, 476. [Google Scholar] [CrossRef] [PubMed]
  23. IEA. Comparative Life-Cycle Greenhouse Gas Emissions of a Mid-Size BEV and ICE Vehicle; Global EV Outlook 2024—Outlook for Emissions Reductions; International Energy Agency: Paris, France, 2024; Available online: https://www.iea.org/reports/global-ev-outlook-2024 (accessed on 8 July 2026).
  24. Ciez, R.E.; Whitacre, J.F. Examining Different Recycling Processes for Lithium-Ion Batteries. Nat. Sustain. 2019, 2, 148–156. [Google Scholar] [CrossRef]
  25. Mohr, M.; Peters, J.F.; Baumann, M.; Weil, M. Toward a Cell-Chemistry Specific Life Cycle Assessment of Lithium-Ion Battery Recycling Processes. J. Ind. Ecol. 2020, 24, 1310–1322. [Google Scholar] [CrossRef]
  26. Machala, M.L.; Chen, X.; Bunke, S.P.; Forbes, G.; Yegizbay, A.; de Chalendar, J.A.; Azevedo, I.L.; Benson, S.; Tarpeh, W.A. Life Cycle Comparison of Industrial-Scale Lithium-Ion Battery Recycling and Mining Supply Chains. Nat. Commun. 2025, 16, 988. [Google Scholar] [CrossRef] [PubMed]
  27. World Steel Association. Sustainability Indicators Report 2025; Worldsteel: Brussels, Belgium, 2025. [Google Scholar]
  28. International Aluminium Institute. Global Aluminium Industry Greenhouse Gas Emissions Intensity. Available online: https://international-aluminium.org/statistics/ (accessed on 8 July 2026).
  29. Hill, N.; Amaral, S.; Morgan-Price, S.; Nokes, T.; Bates, J.; Helms, H.; Fehrenbach, H.; Biemann, K.; Abdalla, N.; Jöhrens, J.; et al. Determining the Environmental Impacts of Conventional and Alternatively Fuelled Vehicles Through LCA; Final Report for the European Commission, DG Climate Action, ED11344; Ricardo Energy & Environment: Didcot, UK, 2020. [Google Scholar] [CrossRef] [PubMed]
  30. European Parliament. Environmental Challenges Through the Life Cycle of Battery Electric Vehicles; Study IPOL_STU(2023)733112; European Parliament: Brussels, Belgium, 2023. [Google Scholar] [CrossRef] [PubMed]
  31. Kawamoto, R.; Mochizuki, H.; Moriguchi, Y.; Nakano, T.; Motohashi, M.; Sakai, Y.; Inaba, A. Estimation of CO2 Emissions of Internal Combustion Engine Vehicle and Battery Electric Vehicle Using LCA. Sustainability 2019, 11, 2690. [Google Scholar] [CrossRef]
  32. Shatnawi, I.; Mikayilov, J.I. Driving Reductions in Emissions: Unlocking the Potential of Fuel Economy Targets in Saudi Arabia; Discussion Paper; KAPSARC: Riyadh, Saudi Arabia, 2024. [Google Scholar]
  33. Chester, M.V.; Horvath, A. Environmental Assessment of Passenger Transportation Should Include Infrastructure and Supply Chains. Environ. Res. Lett. 2009, 4, 024008. [Google Scholar] [CrossRef]
  34. Nordelöf, A.; Messagie, M.; Tillman, A.-M.; Ljunggren Söderman, M.; Van Mierlo, J. Environmental Impacts of Hybrid, Plug-in Hybrid, and Battery Electric Vehicles—What Can We Learn from Life Cycle Assessment? Int. J. Life Cycle Assess. 2014, 19, 1866–1890. [Google Scholar] [CrossRef]
  35. Lucas, A.; Silva, C.A.; Costa Neto, R. Life Cycle Analysis of Energy Supply Infrastructure for Conventional and Electric Vehicles. Energy Policy 2012, 41, 537–547. [Google Scholar] [CrossRef]
  36. Burnham, A.; Wang, M.; Wu, Y. Development and Applications of GREET 2.7—The Transportation Vehicle-Cycle Model; ANL/ESD/06-5; Argonne National Laboratory: Argonne, IL, USA, 2006. [Google Scholar]
  37. IEA. The Role of Critical Minerals in Clean Energy Transitions; International Energy Agency: Paris, France, 2021. [Google Scholar]
  38. European Commission. First Commission Report on Real-World CO2 Emissions of Cars and Vans Using Data from On-Board Fuel Consumption Monitoring Devices; COM(2024) 122 Final; European Commission: Brussels, Belgium, 2024. [Google Scholar]
  39. US EPA. Greenhouse Gas Emissions from a Typical Passenger Vehicle. Available online: https://www.epa.gov/greenvehicles/greenhouse-gas-emissions-typical-passenger-vehicle (accessed on 8 July 2026).
  40. JEC. JEC Well-to-Wheels Report V5; EUR 30284 EN; Publications Office of the European Union: Luxembourg, 2020. [Google Scholar] [CrossRef] [PubMed]
  41. International Copper Association. Copper Environmental Profile—Global 2023; ICA: Washington, DC, USA, 2023. [Google Scholar]
  42. PlasticsEurope. Eco-Profiles of the European Plastics Manufacturers: Polyolefins; PlasticsEurope: Brussels, Belgium, 2014. [Google Scholar]
  43. Gulf Petrochemicals and Chemicals Association. Eco-Profile of Polyolefins (HDPE and PP) in the GCC; GPCA: Dubai, United Arab Emirates, 2016. [Google Scholar]
  44. Hammond, G.; Jones, C. Inventory of Carbon & Energy (ICE), Version 2.0; Sustainable Energy Research Team; University of Bath: Bath, UK, 2011. [Google Scholar]
  45. Ashby, M.F. Materials and the Environment: Eco-Informed Material Choice, 2nd ed.; Butterworth-Heinemann: Oxford, UK, 2013. [Google Scholar] [CrossRef]
  46. Emirates Global Aluminium. Sustainability Report 2023; EGA: Dubai, United Arab Emirates, 2024. [Google Scholar]
  47. Romare, M.; Dahllöf, L. The Life Cycle Energy Consumption and Greenhouse Gas Emissions from Lithium-Ion Batteries; Report C 243; IVL Swedish Environmental Research Institute: Stockholm, Sweden, 2017. [Google Scholar]
  48. Sullivan, J.L.; Burnham, A.; Wang, M. Energy-Consumption and Carbon-Emission Analysis of Vehicle and Component Manufacturing; ANL/ESD/10-6; Argonne National Laboratory: Argonne, IL, USA, 2010. [Google Scholar]
  49. Dornoff, J.; Valverde Morales, V.; Tietge, U. On the Way to ‘Real-World’ CO2 Values? The European Passenger Car Market After 5 Years of WLTP; International Council on Clean Transportation: Washington, DC, USA, 2024. [Google Scholar]
  50. ADAC. Charging Losses of Electric Vehicles: AC Charging Tests; Allgemeiner Deutscher Automobil-Club: Munich, Germany, 2022. [Google Scholar]
  51. Weiss, M.; Winbush, T.; Newman, A.; Helmers, E. Energy Consumption of Electric Vehicles in Europe. Sustainability 2024, 16, 7529. [Google Scholar] [CrossRef]
  52. Ember. European Electricity Review 2025; Global Electricity Review 2025; Electricity Data Methodology (Life-Cycle Emission Factors Including Upstream Methane and Fuel Supply); Ember: London, UK, 2025; Available online: https://ember-energy.org/ (accessed on 8 July 2026).
  53. Schlömer, S.; Bruckner, T.; Fulton, L.; Hertwich, E.; McKinnon, A.; Perczyk, D.; Roy, J.; Schaeffer, R.; Sims, R.; Smith, P.; et al. Annex III: Technology-Specific Cost and Performance Parameters. In Climate Change 2014: Mitigation of Climate Change; IPCC WG3 AR5; Cambridge University Press: Cambridge, UK, 2014. [Google Scholar]
  54. AAA. AAA Study Reveals Temperature Impacts on EV and Hybrid Efficiencies and Costs; AAA Newsroom, 2026. Available online: https://newsroom.aaa.com/ (accessed on 8 July 2026).
  55. Farrington, R.; Rugh, J. Impact of Vehicle Air-Conditioning on Fuel Economy, Tailpipe Emissions, and Electric Vehicle Range; NREL/CP-540-28960; National Renewable Energy Laboratory: Golden, CO, USA, 2000. [Google Scholar]
  56. Volvo Cars. Carbon Footprint Report—Volvo C40 Recharge; Volvo Car Corporation: Gothenburg, Sweden, 2021. [Google Scholar]
  57. Eurostat. End-of-Life Vehicle Statistics. Available online: https://ec.europa.eu/eurostat/statistics-explained/index.php?title=End-of-life_vehicle_statistics (accessed on 8 July 2026).
  58. Dong, Q.; Liang, S.; Li, J.; Kim, H.C.; Shen, W.; Wallington, T.J. Cost, Energy, and Carbon Footprint Benefits of Second-Life Electric Vehicle Battery Use. iScience 2023, 26, 107195. [Google Scholar] [CrossRef] [PubMed]
  59. Jin, L.; Tian, D.; Zhang, Q.; Wang, J. Optimal Torque Distribution Control of Multi-Axle Electric Vehicles with In-Wheel Motors Based on DDPG Algorithm. Energies 2020, 13, 1331. [Google Scholar] [CrossRef]
  60. Boubker, O.; Lakhal, M.; Ait Yassine, Y.; Lotfi, H. Towards Sustainable Transport in the Moroccan Context: The Key Determinants of Electric Cars Adoption Intention. World Electr. Veh. J. 2024, 15, 136. [Google Scholar] [CrossRef]
Figure 1. System boundary of the comparative life cycle assessment. Both vehicles follow the same stage sequence; recycling credits are returned to the material stage as avoided primary production.
Wevj 17 00415 g001
Figure 2. Cradle-to-gate production emissions by component. Values in t CO2e; the battery accounts for 38% of the BEV total.
Wevj 17 00415 g002
Figure 3. Life cycle GHG emissions by stage for the ICEV and the BEV charged on the 2024 Saudi grid. End-of-life values are net recycling credits.
Wevj 17 00415 g003
Figure 4. Stage composition of life cycle GHG emissions across grid scenarios. Grid decarbonisation shifts the BEV’s burden from the use phase toward production; end-of-life bars are net credits.
Wevj 17 00415 g004
Figure 5. Cumulative GHG emissions versus distance driven. Coloured markers on each line indicate the emission break-even point of that grid scenario against the ICEV; line shading orders the grid scenarios from cleanest (light) to most carbon-intensive (dark).
Wevj 17 00415 g005
Figure 6. Life cycle emission intensity of the BEV as a function of grid carbon intensity, with the scenario grids marked. The BEV–ICEV parity point lies at 991 g CO2e/kWh, above any current national grid factor.
Wevj 17 00415 g006
Figure 7. Monte Carlo distributions of life cycle GHG emissions (10,000 runs, Saudi 2024 grid). Dashed lines mark distribution means.
Wevj 17 00415 g007
Table 1. This study compared with Gulf-region vehicle-LCA predecessors.
FeatureOnat et al. [7]Alwosheel & Koroma [8]Koroma et al. [9]This Study
Region/segmentQatar, sedanKSA, sedanKSA, SUVKSA, mid-size sedan
Grid scenarios1 (historical)1 (2022)1 (2022)5 + alternative 2030 pathway
2030 renewable target modelledNoNoNoYes (two variants)
Inventory transparencyMRIO modelProprietary LCA softwareProprietary LCA softwareOpen process-sum equations, all inputs cited
Reproducible model providedNoNoNoYes (Python + Excel)
Uncertainty analysisNoNoNoMonte Carlo 10,000 runs + variance decomposition
Break-even analysisNoNoNoYes (km and years)
Table 2. Reference vehicle specifications and key model parameters.
ParameterICEVBEV
Vehicle classMid-size gasoline sedanMid-size battery electric sedan
Curb mass (kg)14001700 (1325 glider + 375 battery)
Traction battery60 kWh NMC, 72.8 kg CO2e/kWh [15]
Energy consumption (real-world)7.0 L gasoline/100 km [23,38]19.0 kWh/100 km incl. charging losses [20,23]
Fuel/electricity supply chainWell-to-wheel 2.90 kg CO2e/L [39,40]Life cycle grid factors, see Section 3.5
Lifetime225,000 km/15 years [29,30]225,000 km/15 years (no battery replacement [20,29])
Table 5. Use-phase assumptions.
ParameterValueSource
Lifetime distance/duration225,000 km/15 yr[29,30]
Saudi annual mileage (context)≈25,750 km/yr[32]
ICEV real-world consumption7.0 L/100 km[23,38]
Gasoline tank-to-wheel factor2.35 kg CO2/L[39]
Gasoline well-to-tank factor0.55 kg CO2e/L[40]
BEV grid-side consumption19.0 kWh/100 km[20,23,51]
Charging lossesIncluded (≈10–20%)[20,50]
Hot-climate scenarioBEV +15%, ICEV +12%[54,55]
Maintenance, lifetimeICEV 1.0 t; BEV 0.7 t CO2e[20,29,31]
Table 6. Electricity-grid scenarios for the BEV use phase (life cycle emission factors including upstream fuel supply).
ScenarioEF (g CO2e/kWh)Basis
Saudi Arabia 2024692Ember life cycle factor; ≈67% gas, 33% oil [5,52]
World average 2024473Ember Global Electricity Review 2025 [52]
EU average 2024213Ember European Electricity Review 2025 [52]
Saudi 2030 (50% RE)3660.5 × 692 + 0.5 × 40 (solar PV life cycle [53]); target [1,2]
Saudi 2030 alt. (35% RE)4640.65 × 692 + 0.35 × 40; partial delivery
France 202441Ember life cycle factor [52]
Table 7. Life cycle inventory results by stage (base case: BEV on Saudi 2024 grid). Negative values are net credits.
StageICEV Energy (GJ)ICEV (kg CO2e)BEV Energy (GJ)BEV (kg CO2e)
Materials (excl. battery)71.4418991.35391
Traction battery30.04368
Manufacturing and assembly31.0191929.31816
Transport and distribution5.73546.9430
Use (well-to-wheel)507.245,675384.829,583
Maintenance15.0100010.0700
End of life (net)4.0−24924.0−4444
Total634.350,645556.337,844
Per km (g CO2e/km) 225.1 168.2
Table 8. Life cycle totals, per-km intensities and emission break-even distances by grid scenario (life cycle electricity factors).
ScenarioBEV Total (t CO2e)BEV (g CO2e/km)Reduction vs. ICEVBreak-Even (km)
Saudi Arabia 202437.816825%76,100
World average 202428.512744%48,400
Saudi 2030 alt. (35% RE)28.112545%47,700
Saudi 2030 (50% RE)23.910653%41,100
EU average 202417.47766%33,800
France 202410.04580%28,200
ICEV (reference)50.6225
Table 9. Regional and end-of-life scenario results (Saudi 2024 grid unless stated).
ScenarioICEV Total (t CO2e)BEV Total (t CO2e)BEV AdvantageBreak-Even (km)
Baseline50.637.825.3%76,100
Hot climate (BEV +15%, ICEV +12%)56.142.324.7%71,500
Gulf material sourcing49.436.027.1%67,700
Second-life battery at EoL50.637.326.3%76,100
Battery 40 kWh50.636.727.5%56,100
Battery 80 kWh50.639.023.0%96,100
Table 10. Monte Carlo uncertainty results (10,000 runs, Saudi 2024 grid).
StatisticICEVBEV
Mean (t CO2e)50.738.3
Standard deviation (t CO2e)7.25.1
5th percentile (t CO2e)39.330.1
95th percentile (t CO2e)62.947.1
Coefficient of variation14%13%
Variance share of lifetime spread81%67%
P(BEV < ICEV)99.6%
Mean saving, ICEV − BEV (t CO2e)12.4
Disclaimer/Publisher’s Note: The statements, opinions and data contained in all publications are solely those of the individual author(s) and contributor(s) and not of MDPI and/or the editor(s). MDPI and/or the editor(s) disclaim responsibility for any injury to people or property resulting from any ideas, methods, instructions or products referred to in the content.