1. Introduction
With the advancement of industrialization, energy demands continue to rise. As a result of excessive energy consumption, resource depletion and environmental problems have become increasingly serious. Energy shortages have become an important factor restricting social development [
1]. Driven by various factors such as the “dual carbon” goal, energy security, intelligent vehicles and changes in consumer perception, new energy vehicles are a rapidly developing driving force in the automotive industry, with numerous new energy vehicle companies having emerged in recent years [
2]. New energy vehicles are conducive to environmental protection, as the promotion of such vehicles can reduce the use of oil [
3] and reduce emissions of carbon dioxide and harmful substances, thereby mitigating environmental pollution. The year 2012 witnessed the official issuance of the “Energy Conservation and New Energy Vehicle Industry Development Plan (2012–2020)”. To foster technological progress in the new energy vehicle sector, the government has committed 50 billion yuan in funding. China’s strategic positioning is to support pure electric drive and has achieved significant results, making China an important force in the global automotive industry. The “New Energy Vehicle Industry Development Plan (2021–2035)” came into force in 2020; it was pointed out that, by 2025, breakthroughs will be made in technologies such as on-board operating systems, drive power and power batteries, with new energy vehicle sales accounting for about 25% and intelligent connected vehicle sales accounting for 30%. Highly autonomous driving intelligent connected vehicles achieve limited area and specific scenario applications. The new energy automotive industry mainly involves upstream raw materials such as lithium ore and electrolytes; midstream components such as electronic controllers, motors and batteries; and downstream vehicle manufacturing and charging stations [
4].
Although the new energy vehicle industry has had a long period of development, it has more recently achieved high-quality and high-speed development due to the continuous introduction of relevant national policies. New energy vehicles had just emerged in 2010, following which the national subsidy policy effectively guided the basic development of the market [
5]. New energy vehicle subsidies have been shown to boost new energy vehicle sales by 62% [
6]. Since 2010, the scope and intensity of subsidies continuously increased; however, the government subsidy retreat plan was first proposed and implemented in April of 2015, and the fiscal subsidy retreat was increased in December of 2021. Enterprises should actively respond to the government’s call, research and develop new energy industry-related technologies, create core productivity such as technological advantages from distinctive industrial characteristics, shape a good corporate image and create independent brands [
7]. The low-pollution, low-emission characteristics of new energy vehicles are of great significance in addressing environmental pollution problems and national energy security issues. For emerging new energy vehicle companies, R&D investment is an important prerequisite for their development, eventually supporting the achievement of large-scale commercial processing and sales [
8].
The government subsidy program implemented in China can be divided into four evolutionary stages: the initial incubation stage, characterized by high subsidy quotas to stimulate market penetration; the rapid expansion stage, featuring policy support for scaling up industrial capacity; the gradual reduction stage, during which subsidy levels were progressively lowered and policy incentives were phased out; and the post-subsidy transitional stage, marked by the cancellation of national fiscal subsidies after 2022. The frequent adjustments across these stages have triggered prominent internal conflicts within the industry. On the one hand, the short-term and adjustable nature of the subsidy policies has introduced considerable uncertainty for listed new energy vehicle companies. Automotive innovation requires long-term and sustained capital investment, yet unstable subsidy expectations have led many firms to pursue short-term incremental innovation rather than breakthrough research and development in core technologies. On the other hand, the comprehensive withdrawal of fiscal subsidies has intensified the operational pressure on enterprise innovation. Without stable long-term policy support, companies face a reduction in available R&D funding, and the absence of a clear long-term subsidy incentive framework makes it difficult for firms to formulate stable innovation investment plans. The coexistence of shrinking short-term fiscal support and unclear long-term policy guidance has become a core constraint on sustainable R&D activities, which constitutes the primary motivation for this study.
This study employs the Granger causality test to examine whether there exists a bidirectional causal relationship between government subsidies and R&D investment. While enriching the theoretical literature, this study also provides a theoretical basis for enterprises to improve the utilization efficiency of subsidies obtained from the government.
1.1. Research Questions
Regarding the practical pain points, this article proposes two core research questions:
- (1)
How do government subsidies affect the R&D investment of new energy vehicle enterprises?
- (2)
Is there a bidirectional causal link between government subsidies and R&D investment?
1.2. Significance of the Study
The new energy vehicle industry is an emerging industry involving a complex range of processes and materials, leading to the problem of unreasonable allocation of innovative resources. To improve this situation, large-scale and long-term R&D funding support is often required and, therefore, various external financing channels need to be utilized. Government subsidization is a potential path for such financing, but due to differences in enterprise nature, R&D capabilities and other factors, the effectiveness of government subsidies varies. Thus, studying the impacts of government subsidies on R&D investment is of great practical significance for improving relevant financial policies and guiding innovative development.
1.3. Limitations of the Study
Considering the constraints of data disclosure, this article only selects A-share listed new energy vehicle companies as research samples, while unlisted small and medium-sized enterprises are excluded from the research scope. There is no mandatory requirement for non-listed small and medium-sized enterprises to disclose government subsidies and continuous long-term R&D expenditure data, which cannot support the dynamic PVAR model and variance decomposition analysis used in this study. This article did not conduct multidimensional grouping quantitative heterogeneity testing. Further research can be conducted by stratified regression based on property rights, enterprise size, and subsidy reduction stages to further quantify the effects of heterogeneity policies. Nevertheless, the theoretical analysis of the research topic considered in this article is still enlightening and verifiable. Therefore, this study provides valuable reference information and guidance for enterprises regarding how to improve their innovation levels.
2. Literature Review
Most scholars agree that government subsidies promote enterprise R&D investment. Shao et al. empirically analyzed panel data from 88 listed automobile manufacturers from 2001 to 2015, and showed that government subsidies have an obvious incentive effect on enterprises’ R&D behaviors [
9]. Dong explored the impacts of fiscal policies on the R&D investment intensity of new energy vehicle enterprises at different scales through a threshold model, focusing on the adjustment effect of subsidy withdrawal [
10]. Through meta-regression (i.e., Logit model regression), Rosario et al. found that public support for innovation has a favorable influence on company performance. Existing research has demonstrated that, beyond financial support for innovation, notable effects also stem from support for small- and medium-sized enterprises, the advancement of high-tech industries, and open and collaborative innovation [
11]. Employing a two-stage dynamic network DEA model, Ruan & Liu evaluated both the overall and stage-specific technological innovation efficiency of 13 A-share new energy vehicle companies over the period 2017–2024. Their results demonstrated that both the overall and phased innovation efficiency were below the optimal level, and the impacts of government subsidies and total assets on technological innovation efficiency are relatively limited [
12]. Based on panel data of manufacturing firms between 2011 and 2019, Liang et al. demonstrated that both fiscal subsidies and tax incentives can reinforce the linkage between green innovation and corporate performance. Their results further indicate that tax incentives exert a stronger moderating effect on high-tech manufacturing, whereas fiscal subsidies play a more pronounced role in traditional manufacturing [
13]. Using data from Chinese manufacturing companies from 2007 to 2017, Wang et al. reported that tax incentives and government subsidies incentivize corporate performance through innovation, with intermediary effects accounting for approximately 34.5% and 16.8%, respectively. Thus, implementing appropriate tax incentives and government subsidies for corporate innovation is crucial for improving corporate performance, especially for high-tech enterprises [
14].
By contrast, a number of scholars argue that government subsidies may crowd out firms’ R&D investment. Marino et al. reported that tax credit policies exert no significant impact on R&D investment intensity among French enterprises; more strikingly, even for firms with high-level R&D activity, the association between the two is negative [
15]. Yu et al. argued that government subsidies increase the market’s demand for R&D resources, leading to an increase in R&D resource prices [
16]. However, government subsidies cannot fully cover the cost increase caused by these price increases, which may ultimately lead to companies abandoning their innovation activities.
Li et al. carried out an empirical investigation of 30 provinces covering the period 2008–2022 with a panel vector autoregression model (PVAR). Their findings reveal that stringent environmental regulatory structures exert a favorable influence on the high-quality growth of the construction industry, whereas state-owned ownership structures constitute a barrier [
17]. Similarly, Luo et al. adopted the PVAR model to explore the dynamic interrelationships among technological innovation efficiency, financial development and economic development across the Guangdong–Hong Kong–Macao Greater Bay Area urban agglomeration over the period 2008–2018.Through Granger causality analysis, they showed that financial development unilaterally promotes economic development, while economic development in turn promotes the efficiency of technological innovation. Variance decomposition confirmed the significant contribution of financial development to economic development, as well as the mutually promoting effects between economic development and financial and technological innovation [
18].
Most existing empirical studies on innovation policies for new energy vehicles use static panel models—including fixed effects regression and DID estimation—to verify the unidirectional impact of subsidies on R&D investment during a fixed period. However, technological innovation in the new energy vehicle industry is a continuous, path-dependent and long-term strategic behavior, and policy incentives often result in time lag accumulation and dynamic evolutionary effects. The traditional static framework is limited to capturing short-term static correlations and cannot reflect the long-term equilibrium characteristics and bidirectional interactive feedback between policy support and corporate innovation investment. Considering these drawbacks of static research paradigms, this study constructs a dynamic PVAR framework that integrates the advantages of panel data and vector autoregression. The PVAR model allows all variables to be considered endogenous and effectively captures lagged shock effects, dynamic evolutionary trends and long-term equilibrium relationships between variables. Therefore, this dynamic empirical framework is more suitable for analyzing the sustained policy incentive mechanism of new energy vehicle enterprises, which makes up for the methodological shortcomings of previous innovation policy research.
3. Theory and Hypothesis
3.1. Externality Theory
Externality refers to the idea that the behaviors of individuals or groups in social activities interfere with the social activities of individuals or groups other than themselves. Positive externality refers to benefiting others while not receiving a return, while negative externality refers to causing losses to others but not bearing the corresponding costs. For example, “energy conservation” reflects a positive externality of the new energy vehicle industry on resources, and “emission reduction” reflects one of its positive externalities on the environment. These positive externalities have long-term strategic significance for society and even the entire country. R&D activities have significant externalities. With an increase in R&D activities, the production efficiency may improve and the income obtained may increase, both positive externalities. However, due to uncertainty, huge R&D investments may lead an enterprise’s income to drop lower than the sustainable level for the industry, causing its eventual elimination. In such a case, fewer and fewer enterprises may be willing to innovate, and the technical level will stagnate, leading to a negative externality. Therefore, it is necessary that the government acts—through R&D subsidies and other means—to reduce or even eliminate negative externalities of enterprise R&D, reduce the risks associated with R&D, ensure benefits, encourage enterprises to innovate and promote technological progress in the industry.
3.2. Signaling Theory
In market economic activities, signals are likewise transmitted among the government, enterprises and external investors. Financial backing is essential for firms throughout the course of business development. When internal financing falls short of sustaining innovation activities, enterprises must convey information on their operating status and project profitability to external investors so as to secure external funding. Meanwhile, companies may also proactively apply to the government for subsidies to finance innovative projects. Such subsidies, in turn, signal to the outside world the superiority of the firm’s technology and the high quality of its technical projects. The reason for this is that the government, as a third-party entity independent of each enterprise, can thoroughly review the application information of each enterprise and organize experts to evaluate the enterprise’s R&D level, innovation ability and development situation, conferring information and capability advantages. Receiving government subsidies effectively demonstrates that a company’s innovation level and development value are recognized by the government. This positive signal can help companies obtain external financing and attract more talent, and is conducive to improving their capacity for technological innovation and development. Companies with strong corporate innovation capabilities may be more likely to obtain government subsidies, as such companies can send positive signals to the government.
These two theories are not independent analytical frameworks but collectively explain the dynamic two-way cycle. Along the positive path, positive innovation externalities lead to insufficient private R&D incentives, and subsidies compensate for innovation costs, thereby promoting R&D accumulation. Along the reverse feedback path, sustained high-level R&D investment conveys high-quality innovation signals to the government, which subsequently allocates subsidy resources toward excellent innovative enterprises. The combined effect of these two mechanisms gives rise to a bidirectional interactive relationship, while the self-accumulative characteristics of both R&D and subsidies themselves predominantly drive the long-term fluctuations of the variables. This comprehensive theoretical logic underpins all subsequent empirical tests, including Granger causality and variance decomposition analyses.
3.3. Hypothesis
From the perspective of externality theory, innovation externalities result in insufficient R&D investment by enterprises; government subsidies can effectively compensate for innovation costs and provide positive incentives for R&D activities. In the initial stage of an R&D innovation project, due to the negative externalities of R&D, companies tend to maintain a high degree of confidentiality. Due to the uncertainty of R&D innovation, financial institutions and external investors will stay away from these companies to avoid risks, making it difficult to obtain financing through pledges on the basis of intellectual property alone. For these reasons, exogenous financing constraints typically restrict the development capability of high-tech listed companies, which may be eased through government subsidies [
19].
H1. Government subsidies have a significant promoting effect on the R&D investment of new energy vehicle enterprises.
Combining externality theory and signal theory, subsidies and R&D form a long-term two-way positive interaction, thereby achieving dynamic equilibrium. Government subsidy policies may fail to achieve their expected effects if the innovation capability of an enterprise is insufficient. Consequently, there is a dynamic game relationship between government subsidy policies and corporate innovation strategies, which exerts dual influences on both the actual effects of subsidies and the quality of corporate innovation outputs [
20]. Given that R&D initiatives typically demand substantial capital input, government subsidies serve to ease the financial constraints associated with such investments while strengthening enterprises’ confidence in pursuing long-term R&D efforts. After receiving government subsidies, enterprises convey this positive news to the market to indicate that the government values the enterprise, which can attract attention and further investment in the enterprise. The improvement of R&D capabilities is also beneficial in that it allows enterprises to receive more government subsidies, enabling R&D to enter a virtuous cycle [
21].
H2. There is a bidirectional causal link between government subsidies and R&D investment in new energy vehicle enterprises.
4. Research Design
This study selects government subsidies (sub) as the explanatory variable, corporate R&D investment (rd) as the dependent variable, and corporate profitability, the asset–liability ratio, corporate size and operating efficiency as control variables.
Dependent variable. R&D intensity (rd): The ratio of total annual R&D investment to total assets is used to measure a company’s R&D investment [
22]. The use of this ratio indicator eliminates the scale bias of absolute R&D expenditure and enables horizontal comparison of innovation investment among enterprises of different sizes.
Independent variable. Government subsidy (sub): The government subsidy value comes from the “government subsidy included in the current profit and loss” in each company’s annual report, which comprehensively reflects the governmental subsidies received by a company. In order to mitigate the influence of severe heteroscedasticity and reduce the skewness of the subsidy data, a natural logarithmic transformation was performed on the subsidy amount before regression analysis [
23].
Control variables. In order to avoid estimation bias caused by omitted variables, several control variables were included in the model together, thus reflecting the operating conditions of listed companies from various perspectives. In order to eliminate the influences of heteroscedasticity and dimensionality, logarithmic processing was applied to some variables. R&D investment is considered to be affected by factors such as profitability, the asset–liability ratio, company size and operating efficiency.
Return on assets (roa): Profitability is calculated as the ratio of net profit to total assets, which is the key to measuring the profitability level of a company; in particular, the stronger the profitability of a company, the stronger its ability to convert assets into net profit. Enterprises tend to choose projects that enhance their competitiveness.
Debt to asset ratio (lev): As an important indicator reflecting corporate financial risk, a higher asset–liability ratio indicates that an enterprise bears more debt and holds fewer own funds.
Enterprise size (size): Measured as the natural logarithm of year-end total assets. As the original total asset value of the sample listed companies varied greatly, logarithmic conversion was performed to standardize their variable scales. Large enterprises have abundant financial, talent and equipment resources, which can better support sustained high-intensity R&D activities compared to small enterprises.
Operating efficiency (op): Operating efficiency reflects a company’s operating situation, measured as the ratio of net profit to operating revenue.
Since planning for the new energy vehicle industry began in 2012, there is a severe lack of financial indicators reflecting the R&D investment of listed companies before 2012. As such, the scope of this study covers the period from 2012 to 2022. Relevant variable data can be found in the iFinD database and annual reports issued by listed companies.
The research sample covers new energy vehicle companies listed from 2012 to 2022. First, delisted companies and listed companies with ST designation, *ST designation or abnormal financial records were removed. Second, companies lacking complete annual disclosure records throughout the entire research window were excluded. Third, samples with missing R&D investment, government subsidy or control variable values in any given year were eliminated. After screening, 93 eligible listed new energy vehicle companies were retained, each with 11 complete annual observations. The final balanced panel contained 1023 total observations.
Establish a regression model for Hypothesis 1:
Using the PVAR (Panel Vector Autoregression) model:
Granger causality test, If two time series processes {X
t} and {Y
t}, t = 1, 2, …, T. are stationary, construct the following VAR model:
Variance decomposition shows the proportion of fluctuation contributed by each orthogonal interference term in the subsequent fluctuations of variables in the future period. Once the impact coefficient Φi is determined, the corresponding mean square error of the h-th period prediction can be determined by the following equation:
5. Empirical Analysis
To gain insight into the characteristics of each variable, the sample data were first subjected to descriptive statistical analysis.
Table 1 presents the results, with a study sample size of 1023. According to the results, the maximum and minimum R&D were 12.457 and 0.015, respectively. The average subsidy reached 16.996, indicating that the government’s support is relatively strong. The standard deviations of R&D and government subsidies were 1.625 and 1.476, respectively. These relatively large standard deviation values indicate that corporate R&D investment and government subsidies may vary greatly among the included listed companies.
5.1. Kernel Density Function Diagram
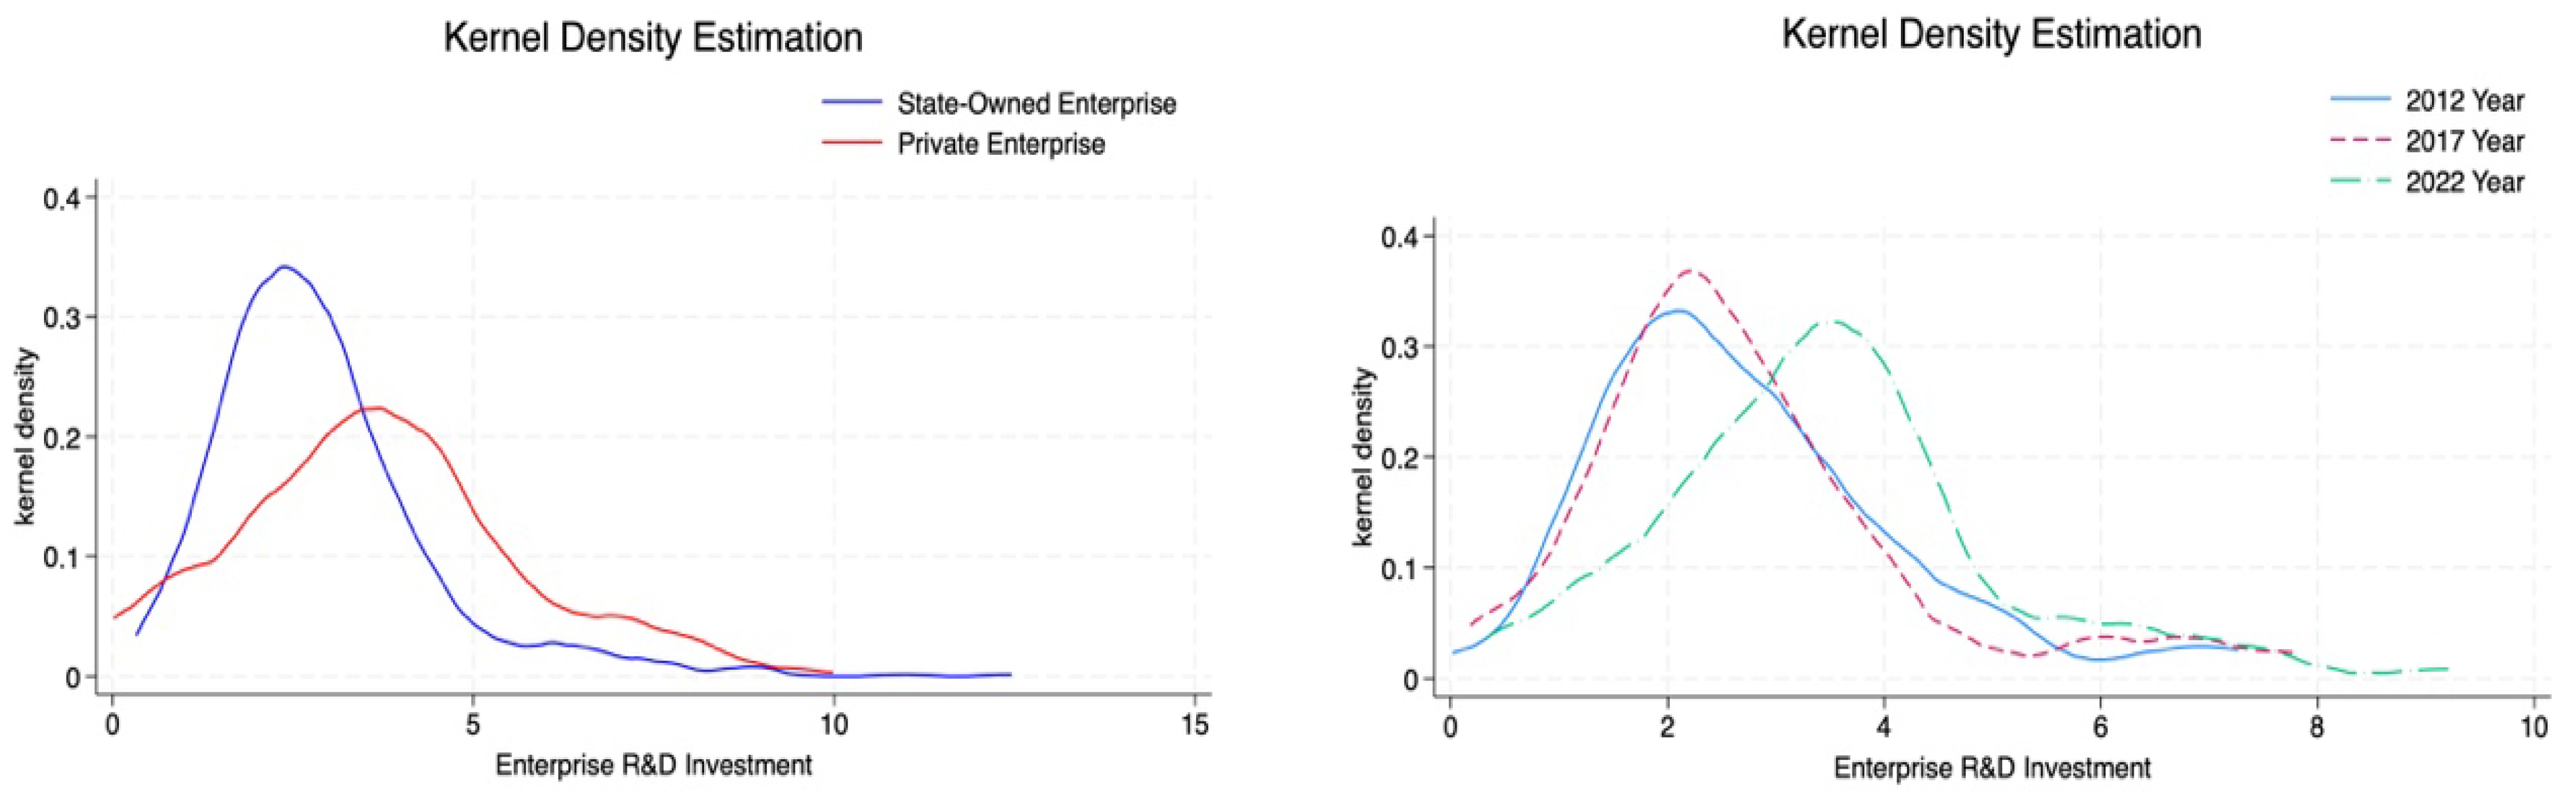
Figure 1 shows the kernel density estimation analysis results regarding enterprise R&D investment. The left figure compares R&D under different property rights, while the right figure compares R&D at different time points. From the left figure, it can be seen that the R&D of non-state-owned enterprises is higher than that of state-owned enterprises, and the difference in R&D values between non-state-owned enterprises is larger than that of state-owned enterprises. Although the R&D of state-owned enterprises is relatively low, their distribution curve has a high peak height, indicating convergence characteristics.
The right figure compares the R&D investment values at three time points. The distribution curves of R&D in 2017 and 2022 are shifted to the right of that for 2012, indicating that R&D investment has been gradually increasing. In addition, the vertical height of the distribution curve peaks is similar for 2012, 2017 and 2022, while the horizontal width has only slightly increased. These results indicate that, although the gap in R&D investment intensity has increased, the overall change is not significant.
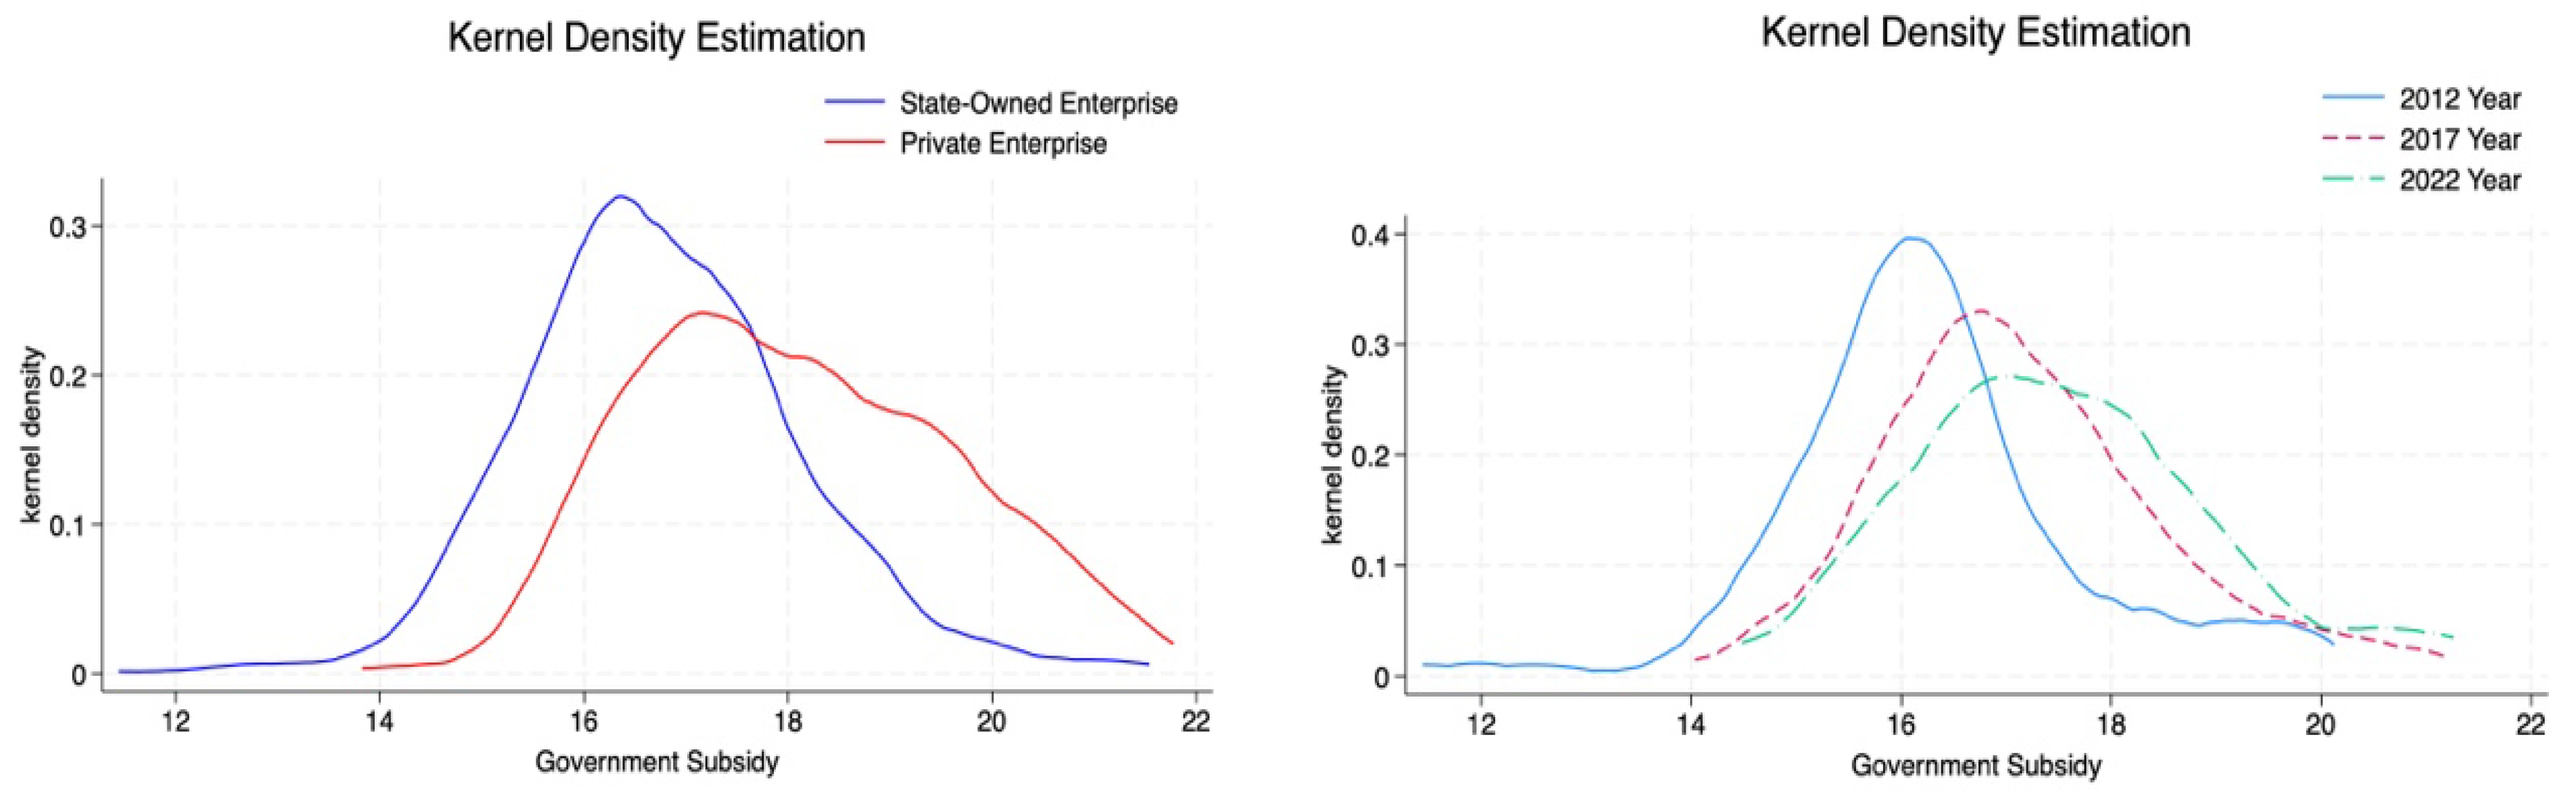
Figure 2 shows the kernel density estimation results regarding government subsidies. The left figure compares government subsidies for enterprises under different property rights, while the right figure compares government subsidies at different time points. From the left figure, non-state-owned enterprises receive slightly more intensive government subsidies than their state-owned counterparts, and the spread of subsidy intensity across the former is larger than across the latter. Although government subsidies for state-owned enterprises are relatively low, their distribution curve has a high peak height, once more indicating convergence characteristics.
The right figure compares the government subsidies for enterprises at three time points. The government subsidy distribution curves for enterprises in 2017 and 2022 are shifted to the right of that for 2012, indicating that government subsidies are gradually increasing. In addition, the distribution curves for 2017 and 2022 show decreases in their peak vertical height and increases in their width compared to the curve for 2012, indicating that the spread of government subsidy values for new energy vehicle enterprises in China is gradually widening.
5.2. Correlation Test
The results in
Table 2 indicated that there are significant positive correlations between corporate R&D investment and government subsidies, the asset–liability ratio and enterprise size. Overall, a considerable number of control variables were found to be significantly correlated with the dependent variable, allowing for the establishment of a regression model to further investigate their interdependence.
5.3. Multicollinearity Test
The multicollinearity test results are shown in
Table 3, from which it can be seen that the VIF values are below 10. Therefore, it can be concluded that there is no severe multicollinearity and the selected variables are appropriate. Consequently, we can state that the regression model has high reliability and is suitable for further causal analysis and interpretation of results.
Based on the results presented in
Table 4, the two-way fixed effects model was found to be the optimal one.
Column (1) of
Table 5 reports the estimates obtained from the fixed effects model: the coefficient of lnsub stands at 0.2648 and is statistically significant at the 1% level. Column (2) further reports the results with the control variables incorporated, where the coefficient of lnsub rises to 0.5951 and remains significant at the 1% level. There is a significant positive relationship between government subsidies and R&D investment, thus validating Hypothesis 1. It can be concluded that, by providing financial support to enterprises, the government increases their cash flow and reduces the pressure on capital utilization, thereby helping enterprises to increase R&D investment.
5.4. Robustness Test
The dependent variable was replaced with the ratio of R&D investment to operating income in order to test the robustness of the regression results.
Table 6 presents the robustness test results. In the models, the regression coefficients of government subsidies were 0.1476 and 0.9897, respectively, which were significant at the 5% and 1% confidence levels. The sign and significance of the coefficients were consistent with the benchmark regression results.
We further explored the dynamic relationship between the two models using the PVAR model. It was necessary to conduct stationarity tests on the variables to ensure the accuracy of model estimation, for which two methods were employed in this study.
Table 7 presents the stationarity test results, which indicate that all variables were significant at the 1% confidence level under both the LLC and ADF tests. Therefore, the sequences were confirmed to be stationary and could be used to construct the PVAR model.
5.5. Optimal Lag Order
Table 8 presents the results of the test for selecting the optimal lag order. Ultimately, the lag order in this study was set to 1.
5.6. Granger Causality
Table 9 presents the results of the Granger causality test. At the 5% significance level, corporate profitability is a Granger cause of R&D investment, and the asset–liability ratio is a Granger cause of government subsidies. Furthermore, at the 1% significance level, corporate size is a Granger cause of government subsidies. This indicates that an increase in the asset–liability ratio will enable enterprises to obtain more government subsidies, and the larger the enterprise, the more advantages it has in terms of obtaining government subsidies, comprehensively reflecting the government’s attention to enterprise size. The profitability of an enterprise itself affects its R&D investment. When the Granger causality test analyzed the dynamic relationship, sufficient evidence was provided to reject H2; this means that there is no statistically significant bidirectional causality.
The conflict between the significant positive static subsidy coefficient of bidirectional fixed effects regression and the insignificant Granger causality test of lagged subsidies stems from the essential differences in measurement between the two models, which is supported by the institutional and industry characteristics of China’s new energy vehicle industry. Firstly, the static bidirectional fixed effects model is correlated with the same period within the same year. According to China’s annual subsidy approval system, companies submit their annual research and development plans and apply for government subsidies, and receive subsidies to cover their innovation expenses for the current year. This synchronous planning creates a strong same-year match between subsidies and R&D investment, which explains the significant static coefficient, but this static correlation cannot reflect the cross-period delay transmission effect. Secondly, the Granger causality test examined whether lagged subsidies can predict future R&D changes after controlling for lagged R&D. The insignificant test results are not contradictory to the static correlation, which only proves that there is no stable lagged dynamic transmission path from subsidies to subsequent research and development. Two industry realities have led to this result: R&D investment exhibits extreme path dependence, and frequent annual adjustments to subsidy policies for new energy vehicles have broken years of sustained subsidy predictability. In addition, most subsidies are one-year special subsidies without rolling support for many years, which cannot generate delayed innovation spillover effects in the later stage.
5.7. GMM Parameter Estimation
The variables were incorporated into the PVAR model for generalized moment estimation.
Table 10 presents the model parameter estimation results, where the explanatory variables are all lagged one-order variables based on the dependent variables. For the logarithmic equation, the coefficient of the first-order lag of R&D investment is 0.7102 and is significant at the 1% confidence level, indicating that the previous value of corporate R&D investment intensity has a significant driving effect on its subsequent value. In the logarithmic equation of government subsidies, the coefficient of the first-order lag is 0.3784 and also significant at the 1% confidence level, indicating that it also has a significant impact on its own future value. Next, this study further explored the inherent dynamic relationship through an impulse response diagram analysis.
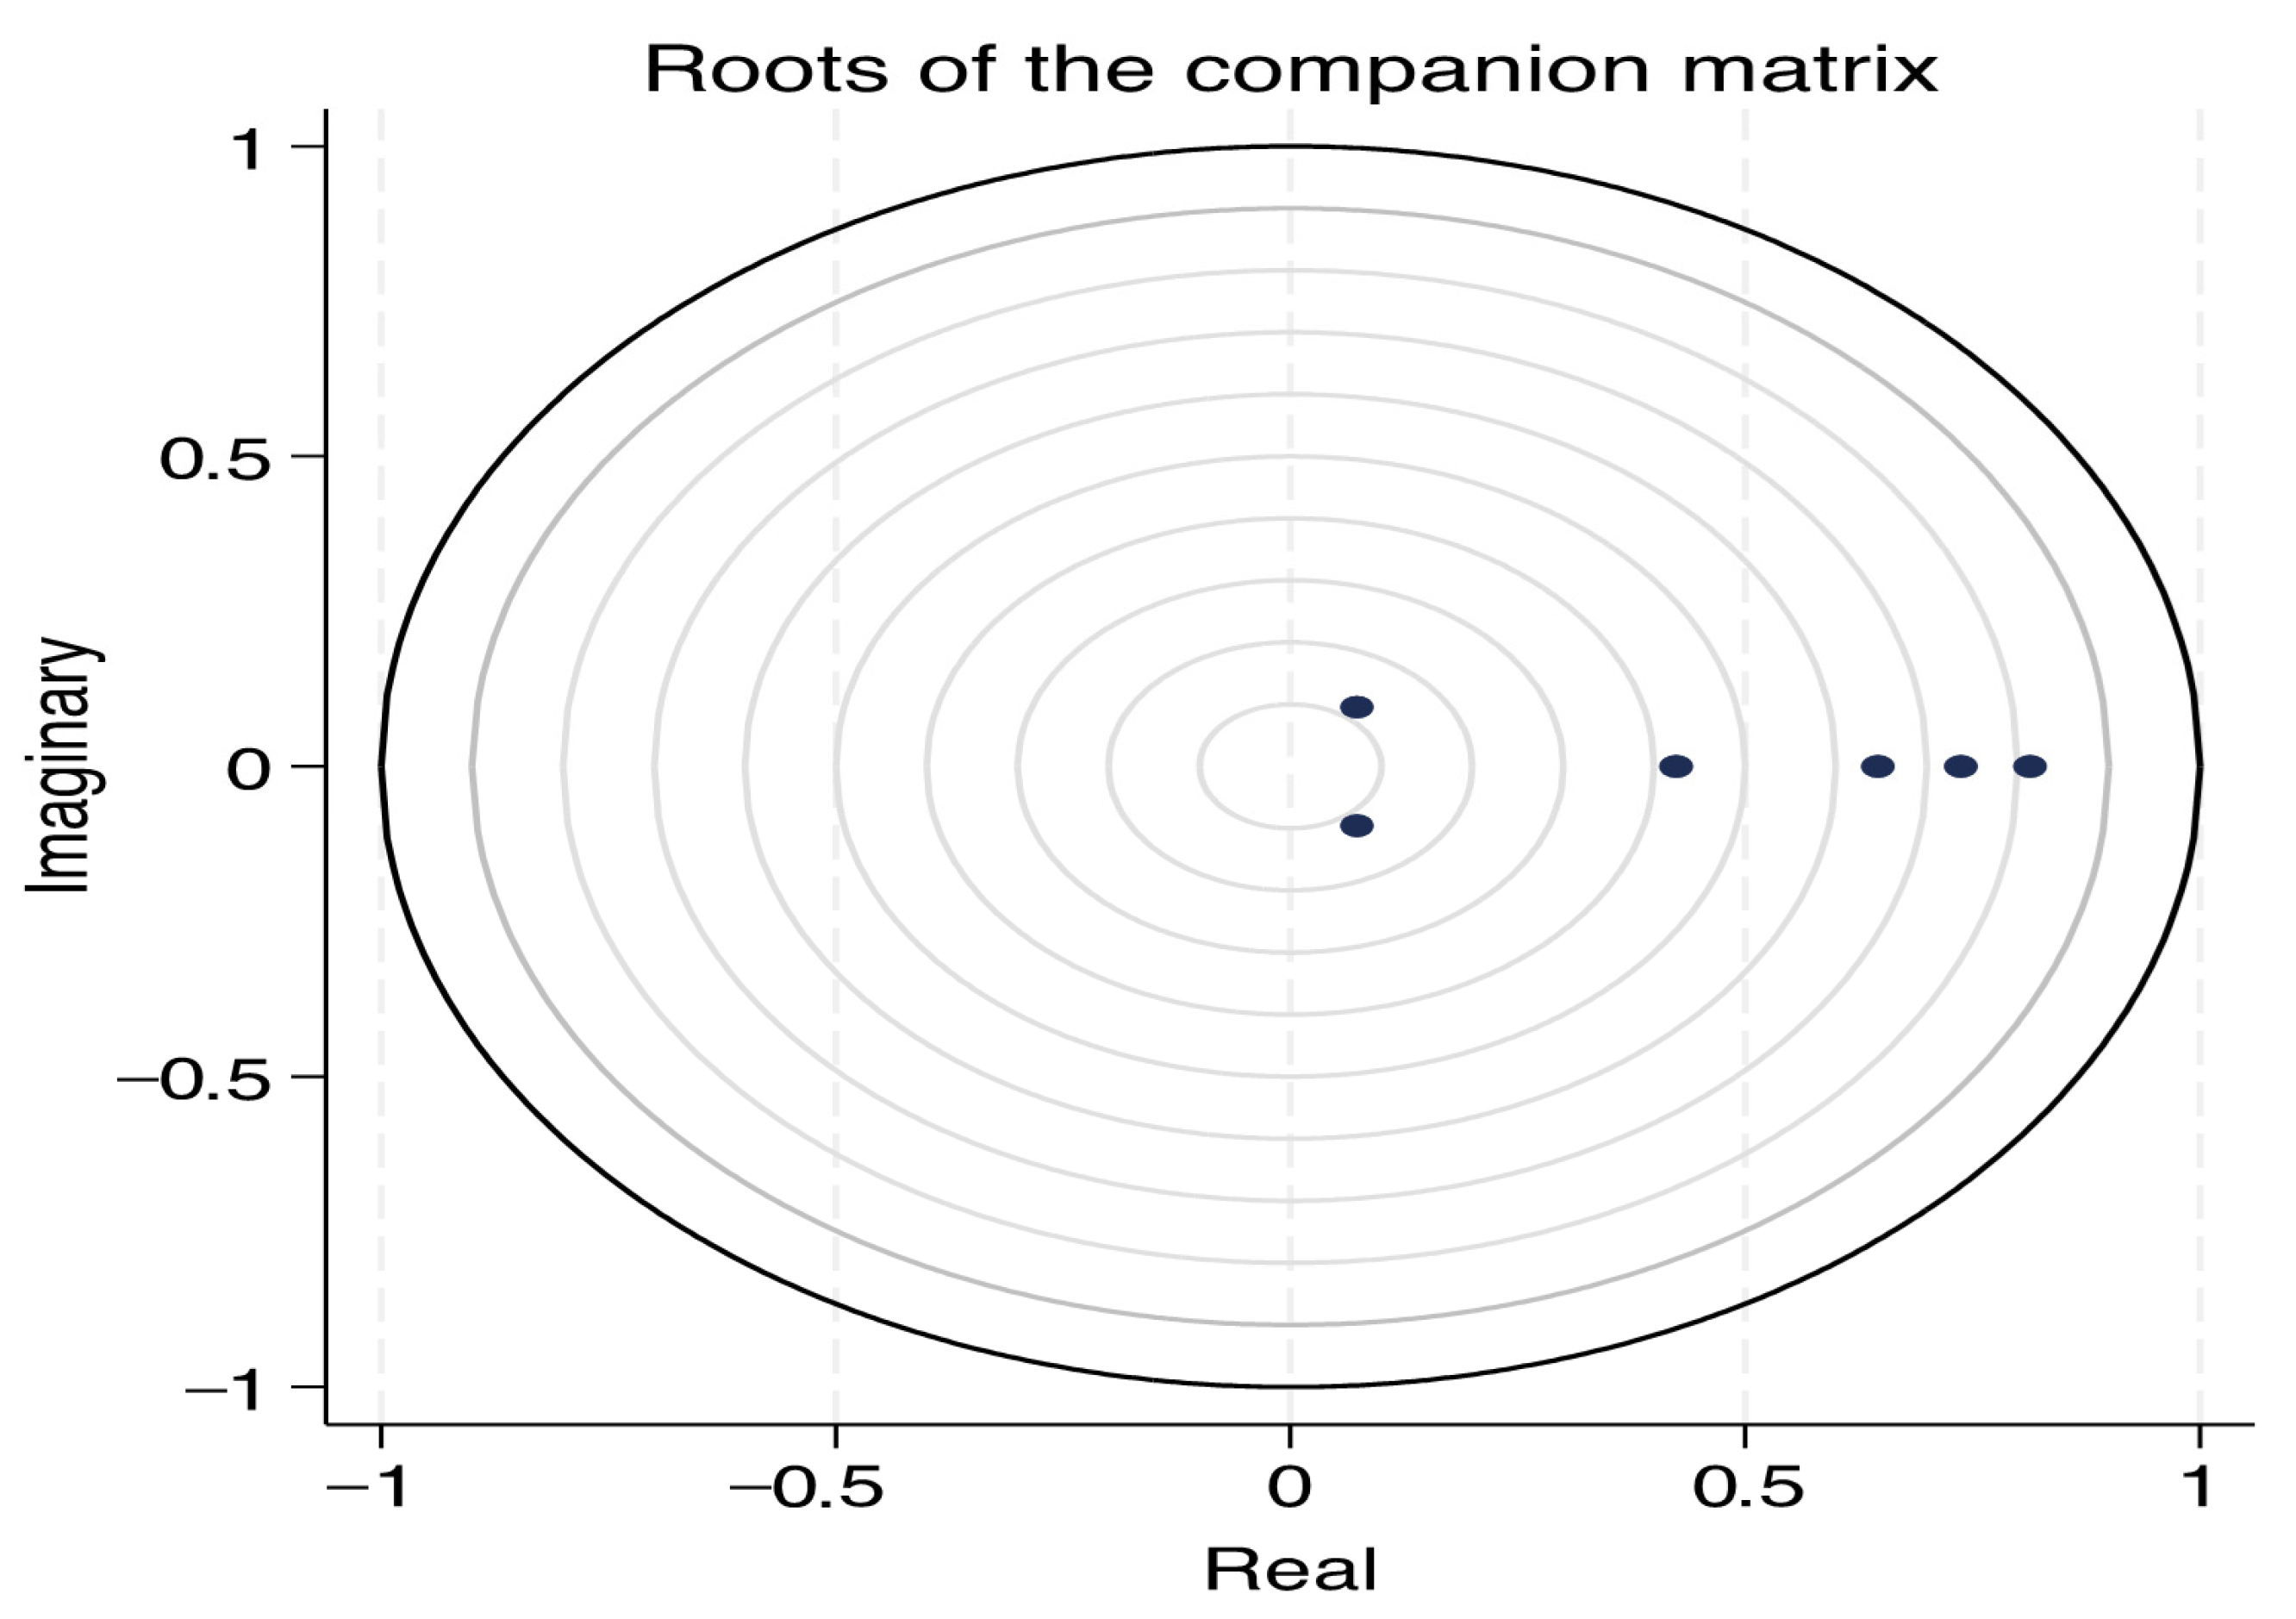
When examining panel data, if a variable has a unit root, it can cause a series of serious problems such as pseudo-regression, leading to significant errors. Thus, before conducting pulse response graph analysis, it was necessary to verify the stability of the PVAR model using a feature root graph. As depicted in
Figure 3, all eigenvalues of the PVAR model fall within the unit circle, which confirms the stability of the model system.
5.8. Impulse Response Analysis
This study conducted 1000 Monte Carlo simulations to generate impulse response maps.
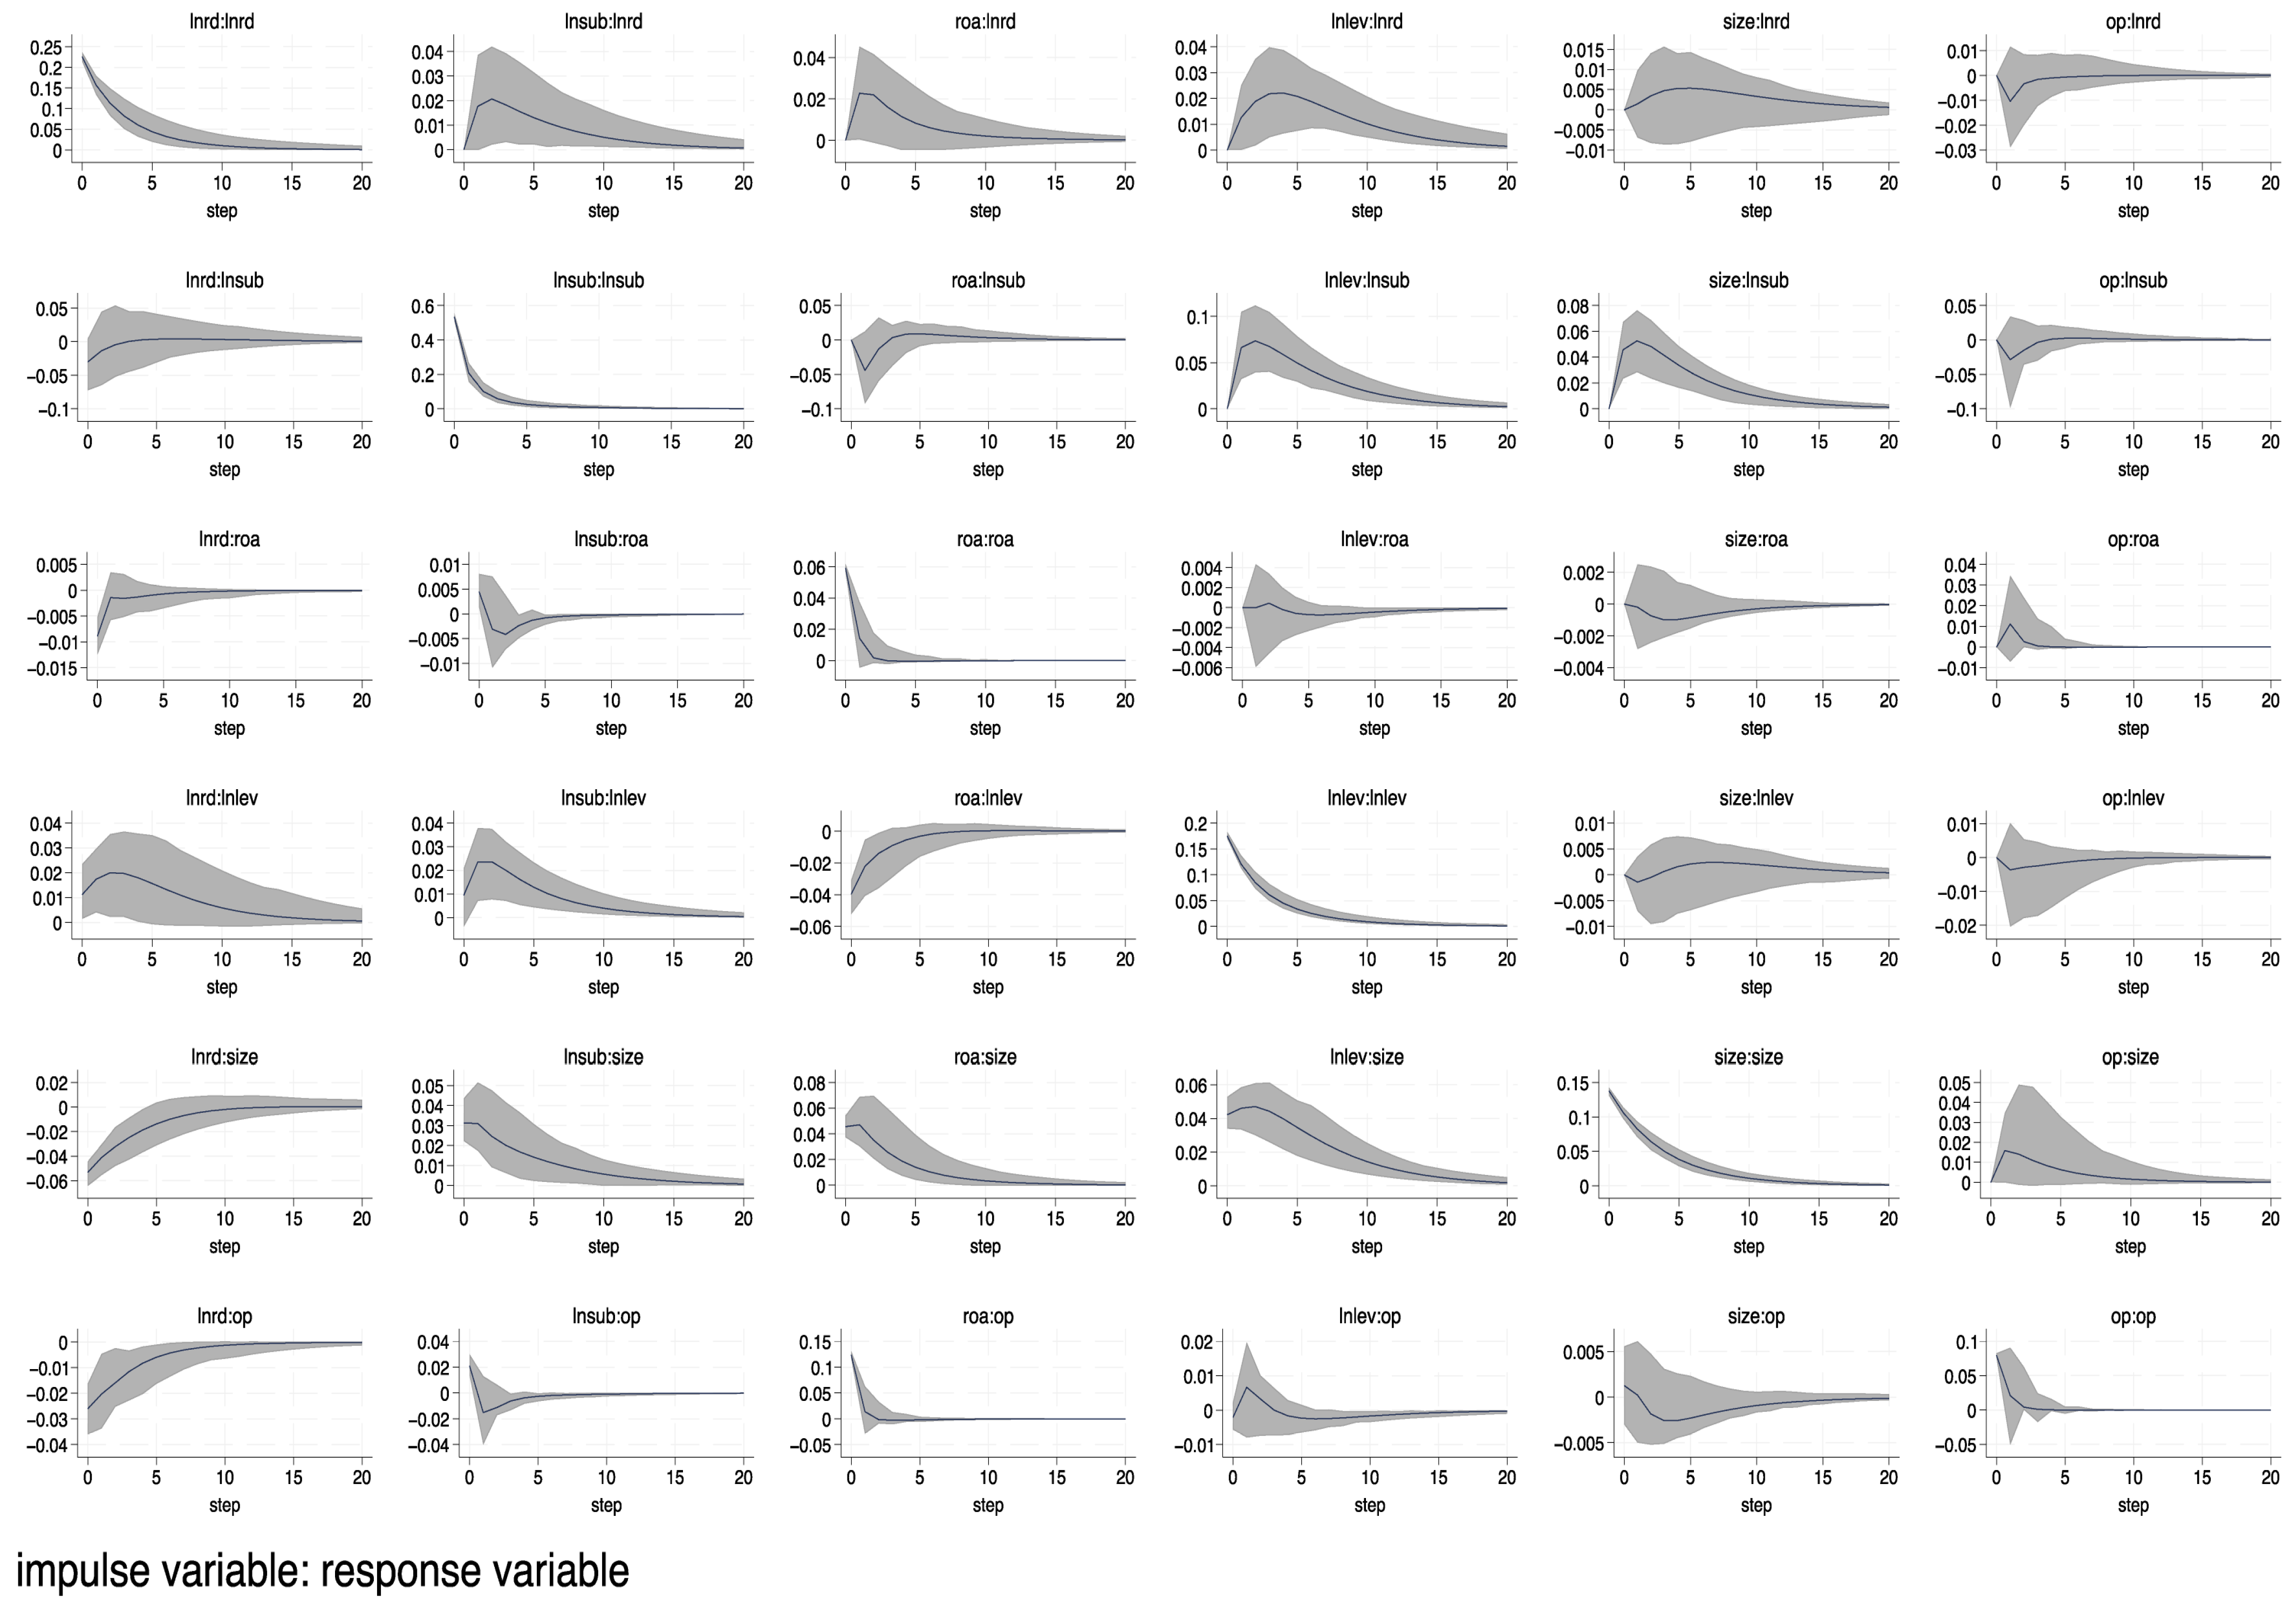
Figure 4 shows the pulse response plot, where the solid line represents the orthogonal pulse response function and the shaded area represents the 95% confidence interval. The first column shows the pulse response charts for R&D investment, and the second column shows the pulse response charts for government subsidies.
As shown in the figure, when a company’s R&D investment experiences a standard deviation shock, it immediately exhibits a strong positive response, with a current response value of 0.2. Subsequently, this positive response gradually weakens and, by the 10th period, the impact of its shock converges to 0. In contrast, government subsidies did not show an immediate fluctuation in the first period, followed by a weak negative response, which then turned into a positive response around the second period. Around the 5th period, the impact converged to 0.
When government subsidies experience a standard deviation shock, they immediately exhibit strong fluctuations, with a current response value of around 0.5. Afterward, this positive response gradually weakens and converges to 0 around the 5th period. In contrast, the intensity of enterprise R&D investment did not immediately show strong fluctuations, followed by a positive response in the first period, and then gradually strengthened. By the third period, the impact of government subsidies reached its maximum value, with a response value of 0.02, and then gradually weakened and converged to 0 around the 10th period.
5.9. Variance Decomposition Analysis
Variance decomposition was performed on R&D investment and government subsidies to analyze their contributions, with the respective results provided in
Table 11 and
Table 12.
At the first time point, 100% of the change in R&D is caused by itself. At the 11th time point, its contribution decreased to around 93.94%, while 1.64% of the change in enterprise R&D was caused by government subsidies and 1.40% was caused by the company’s profitability. The remaining 3.02% is caused by the asset–liability ratio, enterprise size and operational efficiency. In addition, the contribution of government subsidies to changes in R&D investment reached its maximum at the 16th time point, at 1.68%. Starting from the 9th time point, the contribution of government subsidies remained above 1.6%. It is worth noting that, although government subsidies have a significant positive explanatory effect on changes in R&D investment, the magnitude of its economic contribution is relatively limited, accounting for only about 1.6% of the long-term variation in corporate R&D investment.
At the first time point, 99.69% of the change in government subsidies was caused by itself. At the 8th time point, its contribution decreased to around 89.83%, while 0.3% of the change in government subsidies was caused by the intensity of R&D. In addition, the contribution of R&D to changes in government subsidies reached its maximum at the 16th time point, at 0.32%, with the contribution of R&D intensity thereafter remaining stable at this value.
6. Conclusions
China’s new energy vehicle industry is presently confronted with a range of challenges, including significant adjustments to subsidy policies, making it difficult to ensure the progress of R&D projects. The government needs to promptly adjust its current policies in order to improve enterprises’ R&D investment efficiency and ultimately achieve high-quality development. This study used panel data from 93 new energy vehicle enterprises over the period 2012–2022 to analyze the impacts of government subsidies on corporate R&D investment, including a Granger bidirectional causality test. The system has sorted out the bidirectional dynamic relationship between the two. Driven by externalities and signaling mechanisms, subsidies and R&D have formed a statistically significant long-term bidirectional positive interaction, achieving dynamic equilibrium. The analysis results show that government subsidies have a significant positive impact on corporate R&D investment, and that early R&D investment intensity has a significant positive impact on later R&D investment; that is, corporate R&D activities have a self-reinforcing effect. Similarly, government subsidies also have a significant impact on their own level, meaning that the past subsidy scale affects the current subsidy level. There exists a weak two-way positive interactive relationship between the two, and the long-term dynamic evolution of the two forms a stable equilibrium dominated by their respective self-inertias.
In view of the study’s findings, although government subsidies can effectively motivate R&D innovation in enterprises, their actual driving magnitude is relatively limited. Therefore, the government needs to optimize subsidy policy to improve its precision and efficient implementation, formulate differentiated and targeted subsidy mechanisms for new energy vehicle enterprises, amplify the incentive effect of subsidy policies on R&D investment, and break the marginal constraint represented by the low contribution of existing subsidies. Meanwhile, enterprises should rely on the advantages brought by their own R&D inertia to increase independent innovation investment, thus forming a benign innovation-driven development model.
7. Recommendations
Based on the empirical conclusions discussed above and the current development difficulties faced by China’s new energy vehicle industry, this study proposes targeted policy recommendations and suggestions for enterprise development below.
First, given the uncertainty and R&D development challenges brought about by frequent adjustments in government subsidy policies, the government should establish a stable, transparent and predictable subsidy policy mechanism for the new energy vehicle industry. Relevant departments should optimize the pace of policy adjustments, reduce policy mutations and create a policy environment that continuously supports enterprise technological innovation. Stable policy expectations can effectively hedge against the external uncertainties associated with enterprise R&D activities, ensuring the sustained and orderly progress of long-term R&D projects.
Second, the government should continue to maintain reasonable subsidy support for innovative enterprises. On the premise of maintaining the continuity of incentive policies, enterprises should be guided to form a benign accumulation mechanism for R&D investment; in particular, enterprises should make full use of their own R&D inertia advantages, use early R&D accumulation as the foundation for subsequent technological innovation, continuously maintain stable R&D investment intensity and consolidate the endogenous innovation momentum formed by long-term R&D accumulation.
Third, based on the inertia characteristics of government subsidy allocation, relevant departments should optimize the existing subsidy allocation system. As the historical scale and policy orientation of subsidies have a sustained impact on current subsidy allocation, the government should avoid rigid path dependence in subsidy resource allocation. The subsidy amount should be dynamically adjusted in accordance with the actual innovation performance and R&D needs of the enterprise, the subsidy resource stock should be optimized, and the scientificity and flexibility of government subsidy allocation mechanisms should be improved. Establish a regulatory system linked to asset-liability levels, and establish dynamic credit ratings based on enterprise size, long-term asset-liability fluctuations, and historical R&D conversion efficiency. Enterprises with consistently low leverage ratios and stable R&D output can obtain simplified subsidy approval procedures. Strengthen real-time tracking of the use of subsidy funds for high-leverage enterprises to prevent subsidies from being diverted for debt repayment; Adopt more relaxed regular spot checks for mature large companies with low leverage.
Fourth, based on the bidirectional positive correlation between subsidies and R&D, as well as the statistically significant but economically weak dynamic interaction results, the long-term evolution of these two variables is mainly dominated by their respective self-inertia. Thus, both the government and enterprises should objectively recognize the limited marginal incentive effect of a single subsidy policy. The long-term coordinated development of industrial innovation cannot rely solely on the two-way interaction between subsidies and enterprise R&D, and it is necessary to establish a diversified innovation support system to break the inefficient equilibrium state formed by the marginal mutual promotion effect between the two. Establish a long-term special subsidy-supported industry–university research joint R&D alliance, with subsidy policies focusing on collaborative innovation alliances, setting up dedicated multi-year rolling subsidy funds for industry–university research joint R&D projects, and giving priority to alliance teams mainly composed of small private enterprises facing high financing and leverage pressures. Compared with one-year subsidies for independent enterprises, long-term alliance subsidies can hedge against the R&D uncertainty caused by frequent annual subsidy policy adjustments, stabilize long-term innovation investment expectations, and weaken excessive dependence on individual enterprises to independently accumulate R&D stocks.
Fifth, given the limited actual driving force of government subsidies for enterprise R&D investment, it is suggested that the government should further improve the accuracy and implementation efficiency of subsidy policies. Differentiated and targeted subsidy mechanisms should be developed based on the size, innovation capability and R&D cycle characteristics of enterprises. By optimizing the subsidy evaluation criteria, strengthening post-supervision of subsidy funds and linking subsidy allocation to actual R&D output, the incentive efficiency of limited subsidy resources can be effectively improved, thus helping to break the marginal constraint represented by the low contribution of existing subsidy policy to R&D investment. When researching subsidy projects, the government should adhere to the principle of prioritizing innovation efficiency and comprehensively take factors such as enterprise size, property rights, profitability and the asset–liability ratio into consideration, such that all government R&D subsidies can be fully utilized. The government should improve the subsidy management system for new energy vehicles, allowing new energy vehicle enterprises to truly use funds at the forefront, and continue to monitor the trends of relevant subsidies, regularly inspect their use and punish violators accordingly [
24]. The government should attach importance to internal review to ensure that companies use funds reasonably and avoid incidents such as companies defrauding compensation. For this purpose, the government must establish strict management standards to help government subsidies maximize their value [
25]. It is necessary for the government to improve the relevant subsidy system and strictly regulate the use of subsidy funds. Enterprises that have already received government subsidies should be tracked and managed, and urged to strictly implement research and development subsidy policies [
26]. The government should improve subsidy policies based on the current situation, provide targeted subsidies to the R&D departments of enterprises and establish a sound regulatory mechanism [
27]. The government should require enterprises to not only disclose the flow of subsidy funds but also disclose the progress of and investment in R&D projects, thus enabling evaluation of the efficiency of subsidy fund use and providing a basis for the future adjustment of subsidy policies.
Finally, enterprises should establish an innovative development model with independent R&D as the main focus and policy support as a supplement. Enterprises should rely on the stable self-strengthening advantages of internal R&D investment, reduce their dependence on external subsidy policies, actively increase investment in independent innovation capital and talent, and transform policy incentives into independent innovation capabilities. In this way, a sustainable and benign innovation-driven development pattern may ultimately form, thereby fostering the high-quality development of China’s new energy vehicle industry.