2.2. Mining Duty Cycle Construction
For HESS sizing in mining electric dump trucks, the operating cycle must reflect not only vehicle speed but also road slope, payload state, haul distance, loading and dumping phases, and the direction of gravitational energy exchange [
29]. Therefore, the primary simulations in this study are based on three segment-level mining duty cycles rather than on a passenger car driving cycle [
30].
Cycle A represents conventional production haulage, in which the truck descends empty to the loading point, receives the payload, and then travels uphill in the loaded state. This cycle is dominated by traction energy demand during loaded uphill motion and has a limited regenerative braking potential during empty descent.
Cycle B represents reclamation or backfill operation, in which the truck travels uphill empty, receives material, and then descends loaded toward the backfill area. This cycle is dominated by high-power regenerative braking during loaded downhill motion and therefore imposes the most severe requirements on the supercapacitor buffer and the regenerative energy absorption capability of the HESS.
Cycle C represents mixed operating conditions, including both uphill and downhill segments with empty and loaded vehicle states. This cycle is used to evaluate intermediate HESS requirements between production haulage and reclamation/backfill operation.
Each duty cycle is represented as a sequence of segments with specified length, slope, target speed, payload state, vehicle mass, and duration. This segment-level representation makes it possible to calculate the instantaneous wheel power, distinguish traction and regenerative intervals, and evaluate the required battery and supercapacitor power flows under physically interpretable mining conditions. In
Table 2 segment-level parameterization of the mining duty cycles used as primary simulation inputs is presented.
Table 2.
Segment-level parameterization of the mining duty cycles used as primary simulation inputs.
Table 2.
Segment-level parameterization of the mining duty cycles used as primary simulation inputs.
| Cycle | Segment | Operating Phase | Payload State | Mass Used in Model, kg | Length, km | Slope, % | Target Speed, km/h | Duration, min | Energy Role |
|---|
| A | A1 | Empty descent to loading point | Empty | 45,000 | 2.5 | −8 | 30 | 5.0 | Low-to-moderate regenerative braking |
| A | A2 | Loading | Loading | 45,000–110,000 | | 0 | 0 | 5.0 | Auxiliary/non-traction phase |
| A | A3 | Loaded ascent to dumping point | Loaded | 110,000 | 2.5 | +8 | 25 | 6.0 | Dominant traction energy demand |
| A | A4 | Dumping | Emptying | 110,000–45,000 | | 0 | 0 | 3.0 | Auxiliary/non-traction phase |
| B | B1 | Empty ascent to loading point | Empty | 45,000 | 2.5 | +8 | 30 | 5.0 | Moderate traction energy demand |
| B | B2 | Loading | Loading | 45,000–110,000 | | 0 | 0 | 5.0 | Auxiliary/non-traction phase |
| B | B3 | Loaded descent to backfill area | Loaded | 110,000 | 2.5 | −8 | 25 | 6.0 | Dominant regenerative braking pulse |
| B | B4 | Dumping | Emptying | 110,000–45,000 | | 0 | 0 | 3.0 | Auxiliary/non-traction phase |
| C | C1 | Empty mixed-profile travel | Empty | 45,000 | 1.2 | +5 | 30 | 2.4 | Traction |
| C | C2 | Empty descent | Empty | 45,000 | 1.3 | −5 | 30 | 2.6 | Regeneration |
| C | C3 | Loading | Loading | 45,000–110,000 | | 0 | 0 | 5.0 | Auxiliary/non-traction phase |
| C | C4 | Loaded ascent | Loaded | 110,000 | 1.2 | +8 | 25 | 2.9 | High traction |
| C | C5 | Loaded descent | Loaded | 110,000 | 1.3 | −8 | 25 | 3.1 | High regeneration |
| C | C6 | Dumping | Emptying | 110,000–45,000 | | 0 | 0 | 3.0 | Auxiliary/non-traction phase |
The segment-level description in
Table 3 defines the only primary simulation input used for HESS sizing in this study. The proposed mining duty cycles explicitly include payload variation, long low-speed haul segments, large positive and negative road grades, non-traction loading and dumping phases, and high-power regenerative braking during loaded descent. Therefore, all subsequent HESS sizing, Pareto filtering, energy-balance calculations, and sensitivity analyses are based on Cycles A–C and not on passenger car driving cycle assumptions.
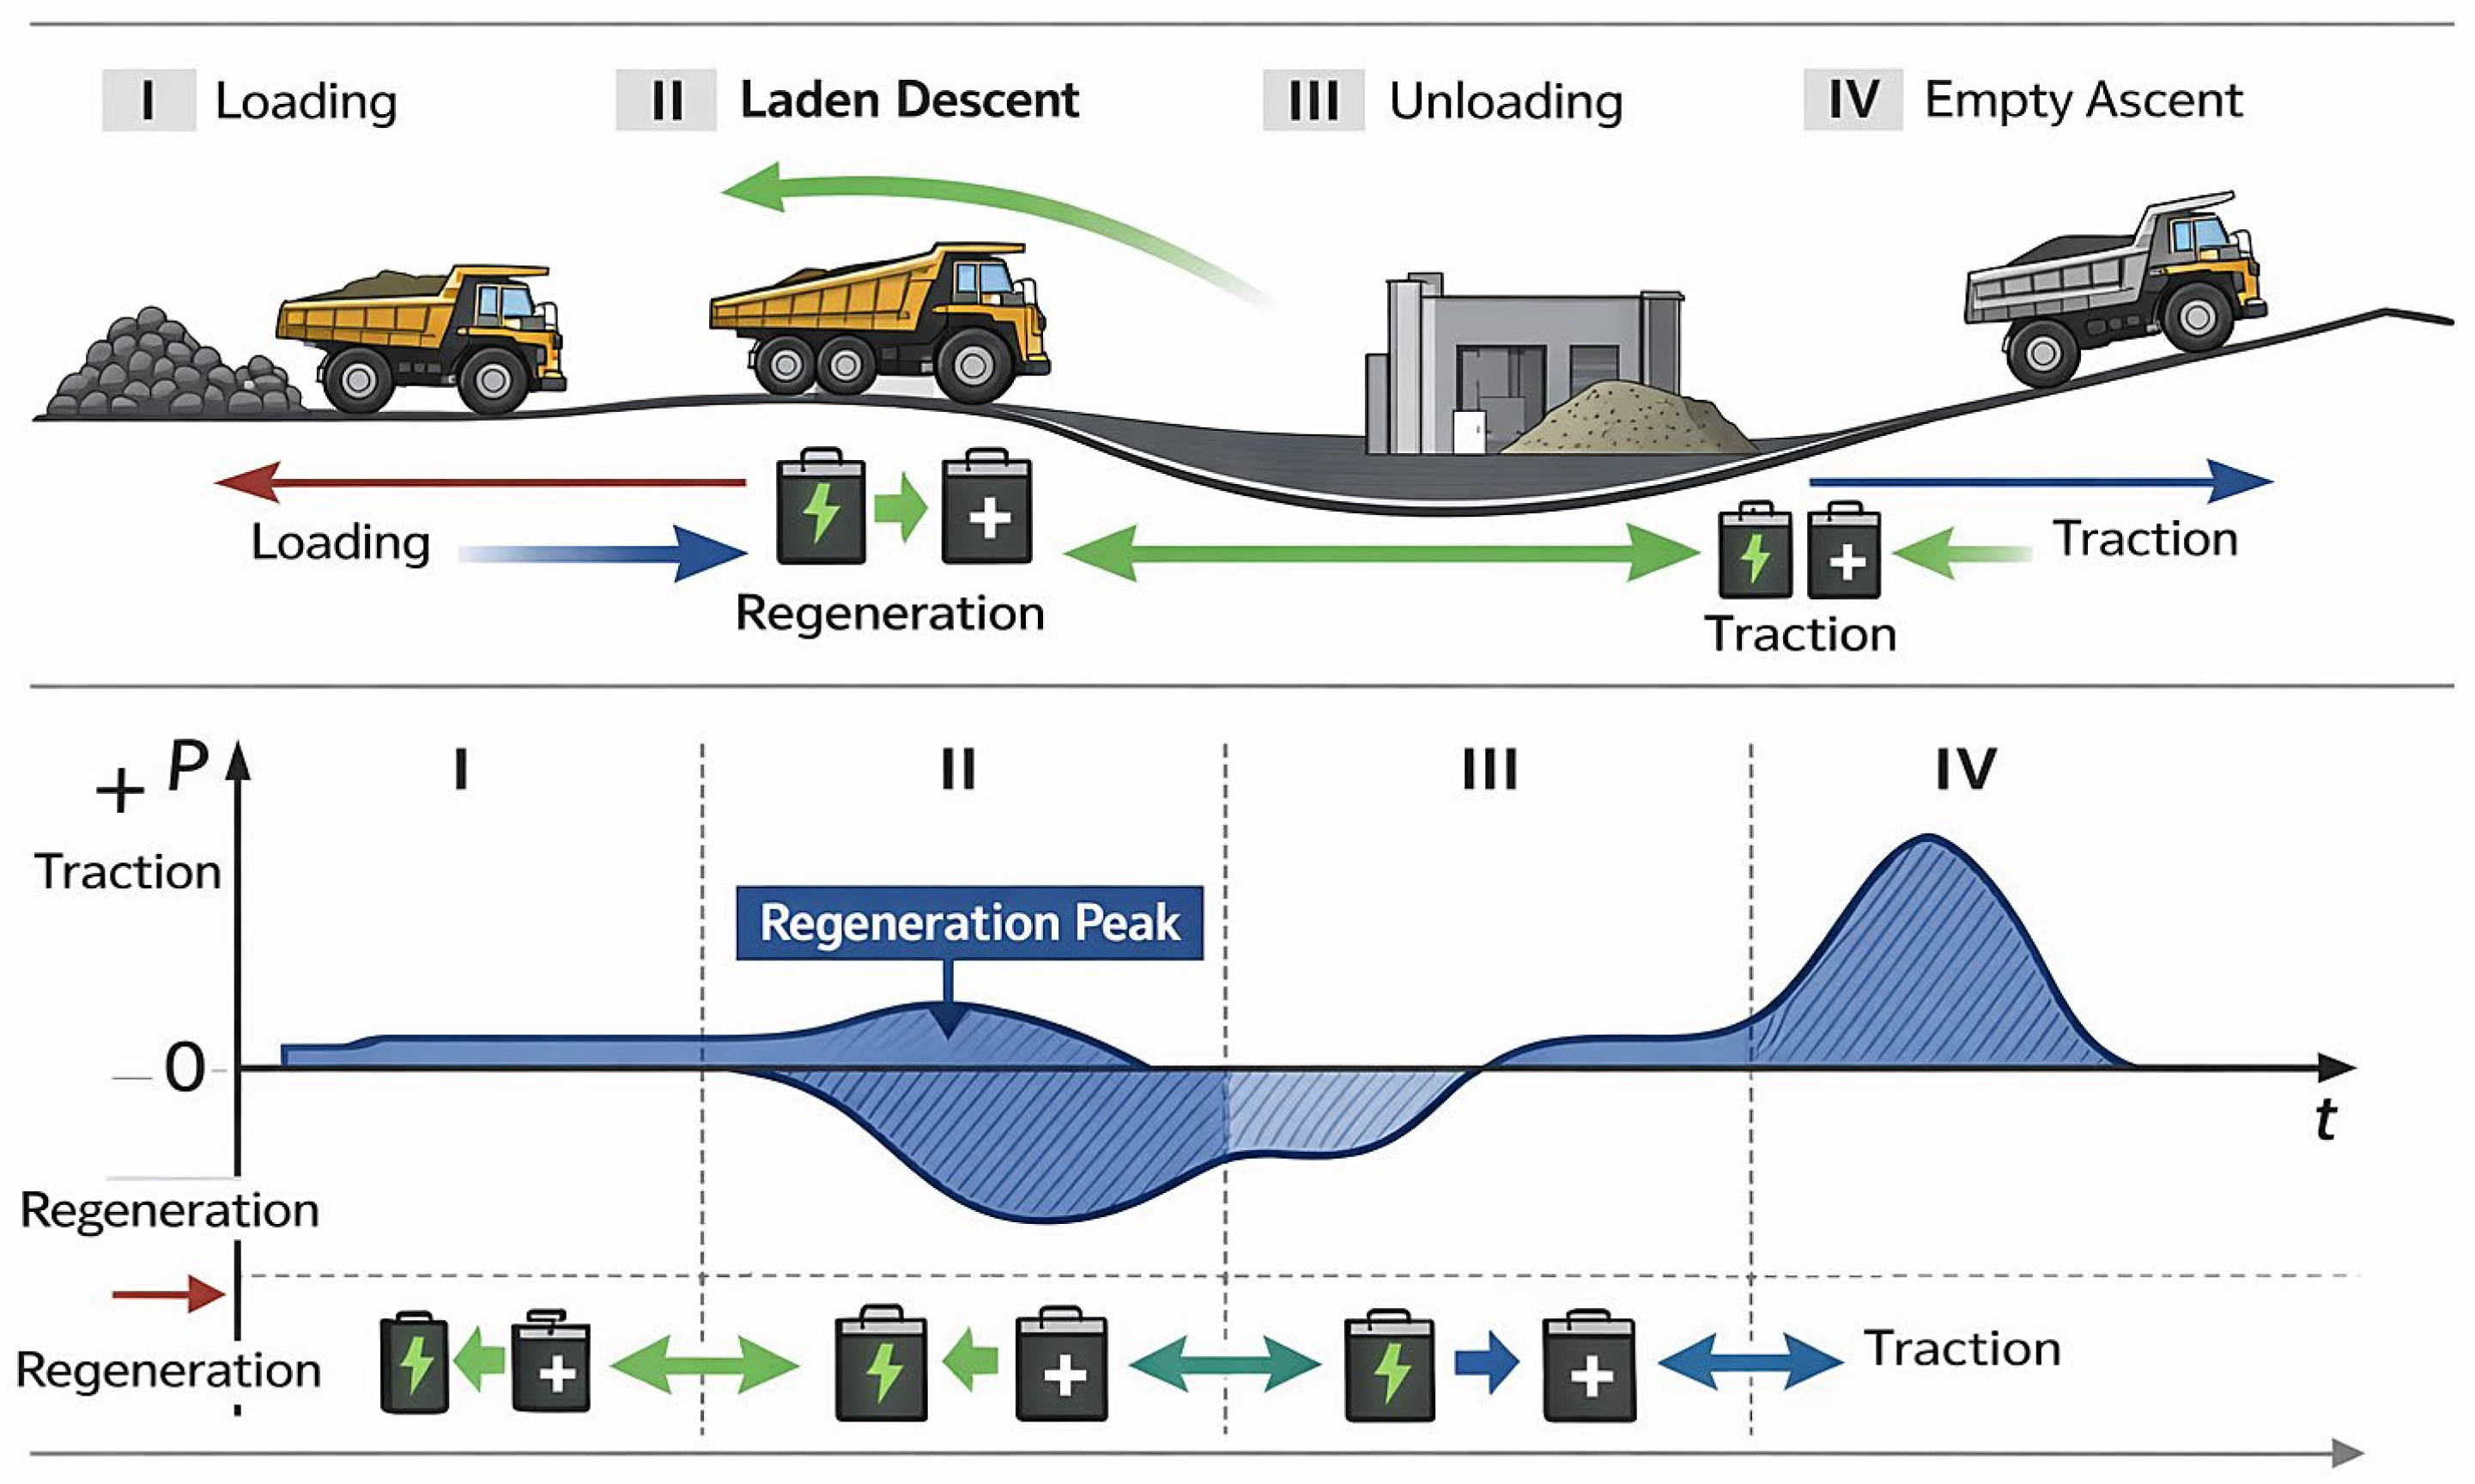
The three primary mining duty cycles used in the model are summarized in
Figure 1. The figure is intended to connect the technological operating phases with the corresponding traction and regenerative braking intervals [
31].
Figure 1 is used as a generalized physical and technological interpretation of the operating cycle, built on the basis of the analysis of typical operating parameters of heavy-duty mining dump trucks and used in the work as a methodological basis for the formation of input modeling data and the subsequent interpretation of the calculated results [
32].
Figure 1 shows that Cycle B differs fundamentally from the production cycle because the loaded segment occurs on the downhill path. This produces the highest regenerative-braking power and therefore defines the most severe sizing case [
33] for the supercapacitor branch.
The loading phase (I) is characterized by the absence of traction and, accordingly, insignificant energy flows, which can be negligible in further calculations. The main interest from the point of view of energy is the phase of loaded descent (II), during which the gravitational component of the force of motion exceeds the total drag forces. As a result, the traction electric drive enters the regenerative braking mode, forming pulses of negative power of high amplitude and limited duration, indicated on the graph as regeneration peak.
The unloading phase (III), like loading, makes a minimal contribution to the energy balance and serves as a transitional stage between the recuperative and traction parts of the cycle. In the phase of the reverse movement of the empty dump truck on a hill (IV), positive traction power is dominant, associated with overcoming the slope, rolling resistance and aerodynamic drag [
34]. It is at this stage that the storage battery provides the bulk of the energy costs, while the supercapacitor performs the function of smoothing short-term power peaks [
35].
Figure 1 clearly demonstrates the key feature of the operating cycle of mining dump trucks: energy-significant recovery is implemented in the form of short-term but high-power pulses, which are fundamentally different in time scale from the phases of traction energy consumption. This asymmetry in power and duration is a fundamental factor that determines the feasibility of using a hybrid energy storage system and the need to optimize the parameters of the supercapacitor buffer [
36].
Thus, the diagram presented in
Figure 1 serves as a link between the technological description of the operating cycle and the formalized mathematical model used further to calculate the dynamics, energy balance and multi-criteria optimization of the parameters of the hybrid energy storage system.
2.3. Longitudinal Dynamics and Energy Balance Model
The instantaneous power required on the truck’s wheels
is calculated based on the longitudinal dynamics equation:
where
is the mechanical power on the wheels;
is the instantaneous velocity, and is
the total force of resistance to motion (H), defined as
—rolling resistance force, where is the total weight of the dump truck; —acceleration due to gravity (9.81 m/s2); —rolling resistance coefficient; —slope angle of the route (rad).
- 2.
Aerodynamic Drag Force:
, where is the density of the air (1.225 kg/m3), is the coefficient of aerodynamic drag, and is the frontal area.
- 3.
Gravitational Component (Grade Force):
Takes a positive value on the ascent () and a negative value on the descent ().
- 4.
Inertial Force:
, where is the coefficient of inertia reduction of rotating and distributed masses (for electromechanical transmission , usually, is the longitudinal acceleration (m/s2).
The instantaneous HESS electrical power at the terminals is calculated taking into account the efficiency of the power circuit, where is the efficiency of the traction drive, is the efficiency of the power converter and electronics, and is the efficiency of recuperation.
The instantaneous power entering the energy storage system was determined based on the power on the wheels, taking into account the direction of the energy flow. In the traction mode, losses in the traction electric drive and power converters were taken into account, while in the recuperation mode, coefficients describing the efficiency of the reverse conversion and the limitations of the recuperation system were additionally introduced [
37,
38].
To avoid ambiguity in the interpretation of regenerative braking magnitudes, three power levels are distinguished in the model. The wheel-side mechanical power is calculated from the longitudinal dynamics equation before drivetrain conversion losses are applied. The DC bus regenerative power is the electrical power available at the traction DC bus after regenerative drive efficiency is considered. The HESS-accepted regenerative power is the portion of the DC bus regenerative power that is actually absorbed by the battery and supercapacitor branches after SOC, voltage, current, ESR, and DC/DC converter power constraints are imposed. Any remaining power is assigned to the residual braking channel and is not counted as stored regenerative energy.
The net change in HESS energy over the full cycle
ΔEcycle is the integral of the power over the cycle time:
2.4. HESS Component Models and Semi-Active Topology
The HESS is modeled as a semi-active battery–supercapacitor topology. The LiFePO4 battery branch is connected to the traction DC bus as the main energy source, whereas the supercapacitor branch is connected to the same DC bus through a bidirectional DC/DC converter. This converter provides voltage matching, current limitation, and bidirectional power exchange between the supercapacitor module and the traction bus. Therefore, the battery and supercapacitor are not treated as two ideal parallel sources; their power contributions are determined by a constrained supervisory control algorithm.
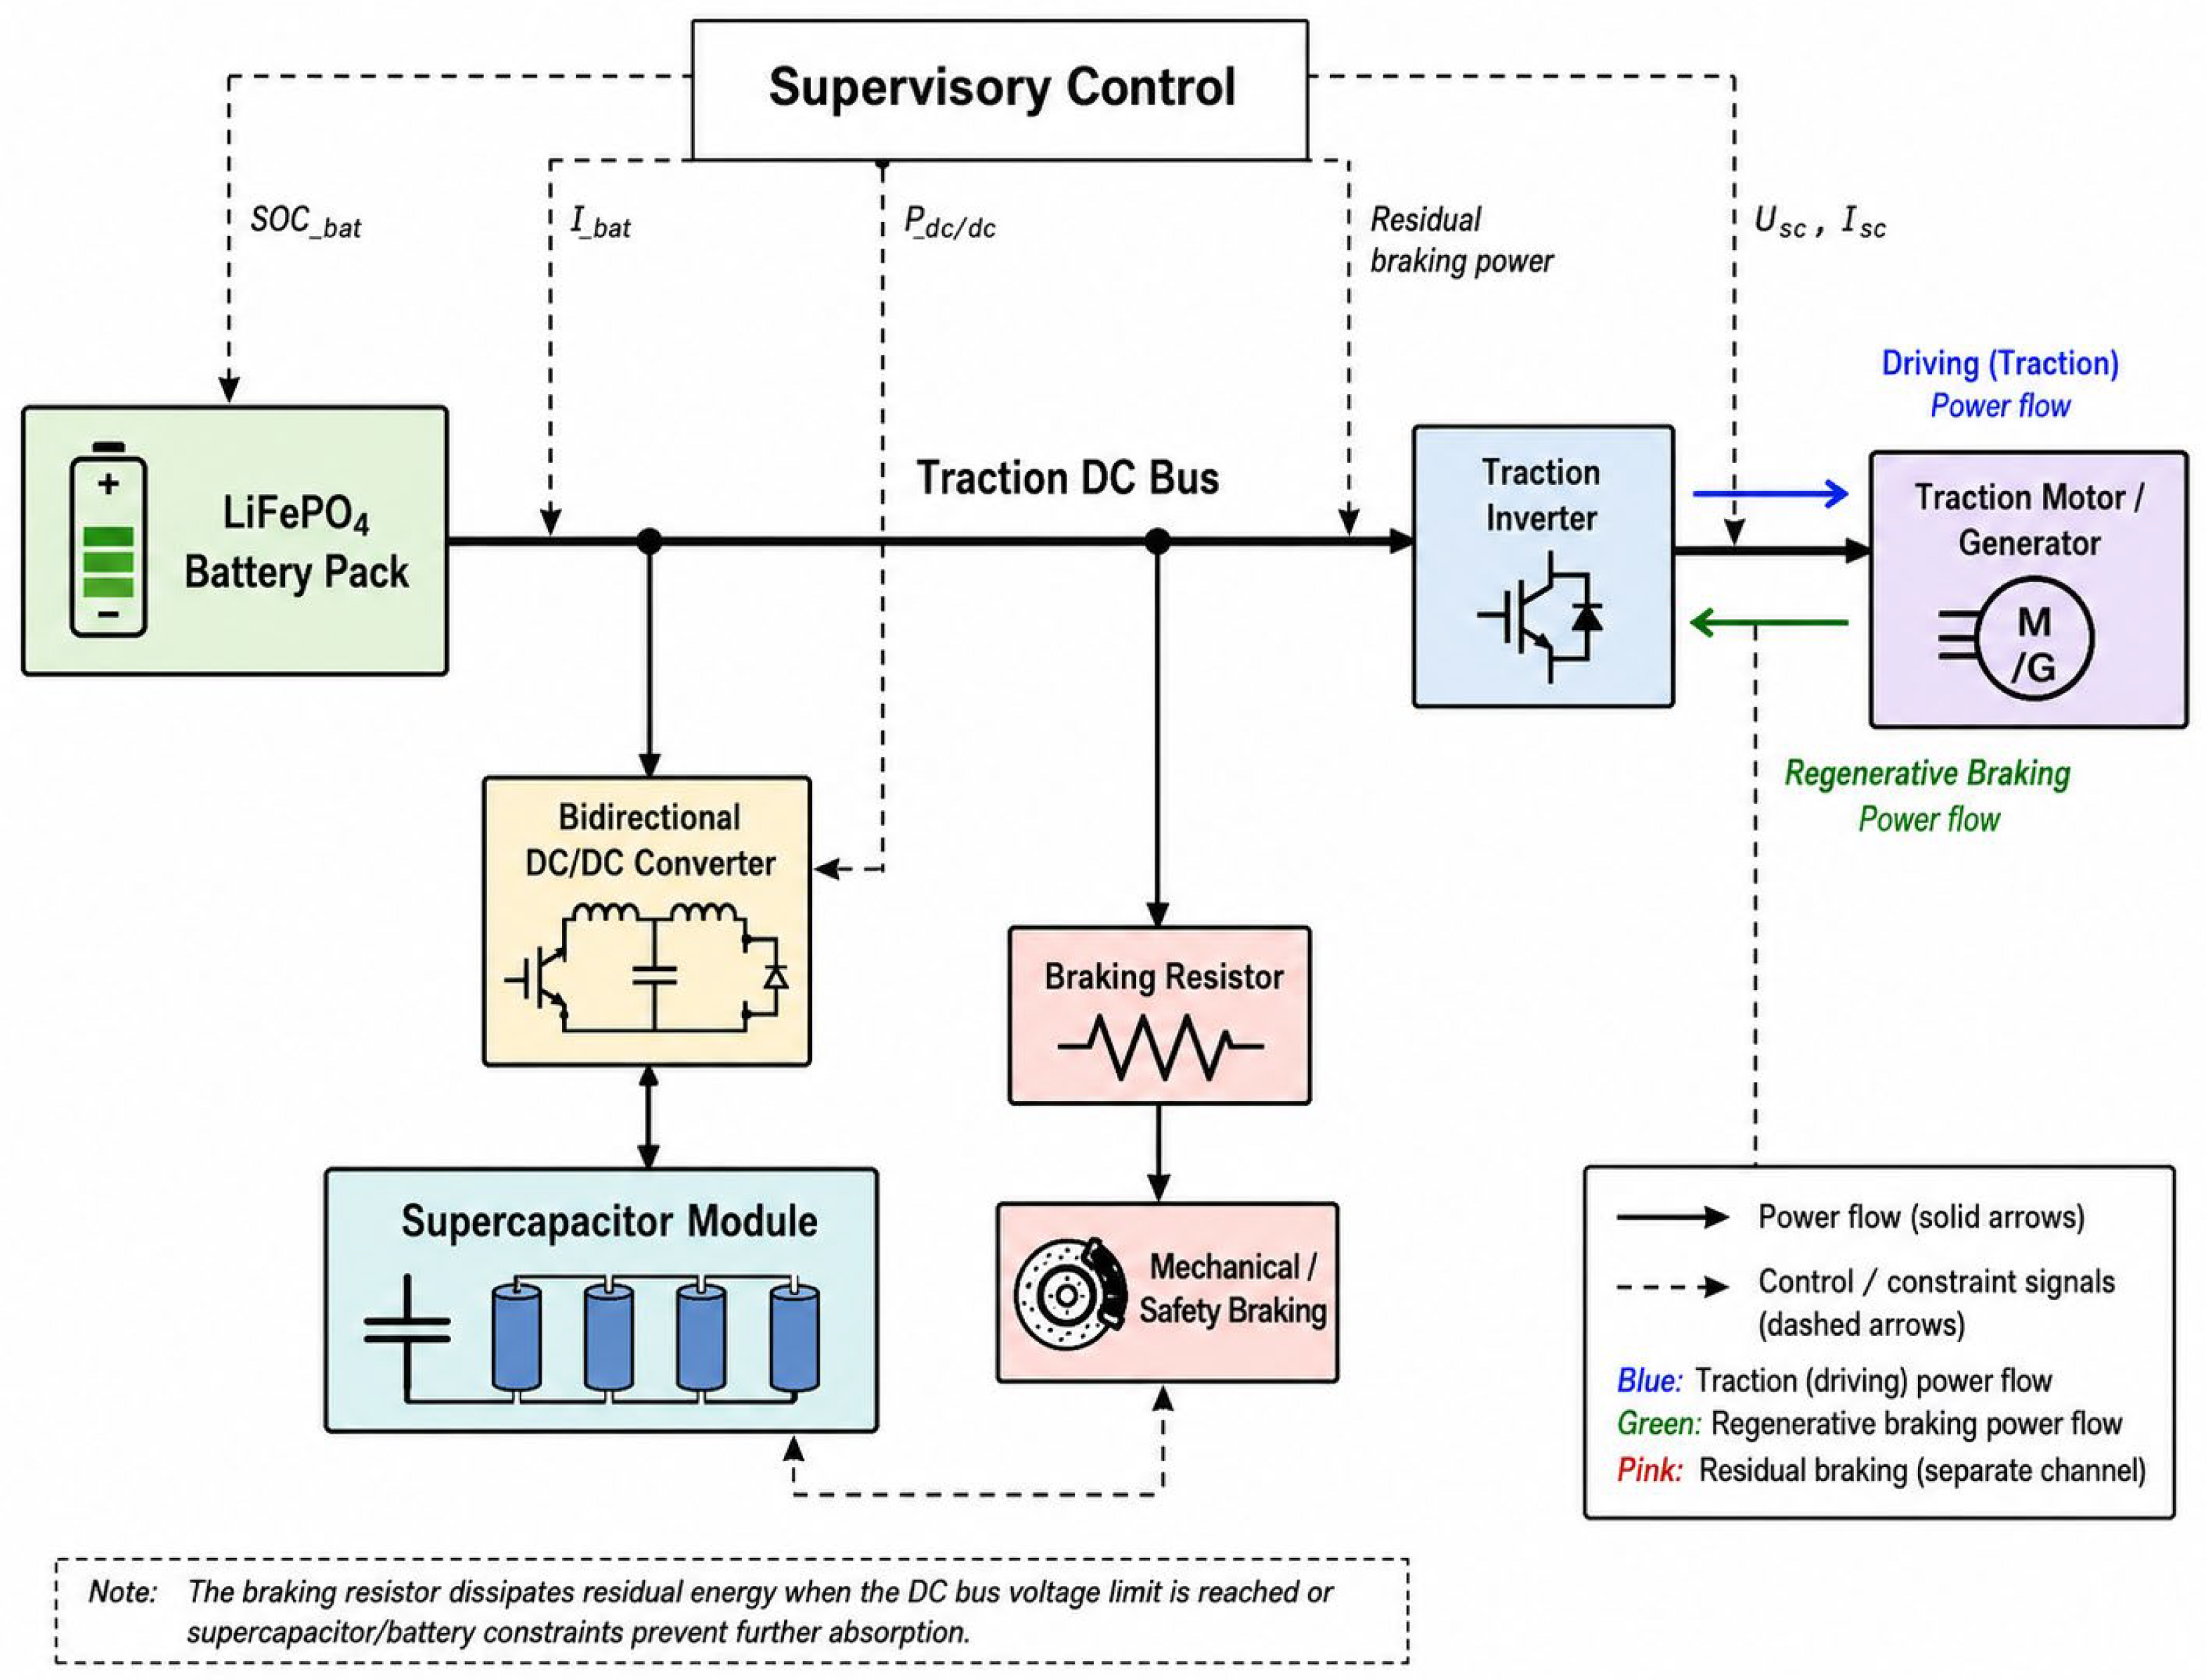
To clarify the physical structure of the proposed hybrid energy storage system and the logic of constrained power distribution, the semi-active HESS topology adopted in the present study is shown in
Figure 2. The scheme highlights the functional roles of the LiFePO
4 battery branch, the supercapacitor branch, the bidirectional DC/DC converter, and the residual braking channel. In addition,
Figure 2 identifies the key state and constraint variables used in the supervisory control algorithm, including the battery state of charge, supercapacitor voltage, branch currents, converter power, and residual braking power.
As shown in
Figure 2, the battery branch acts as the main energy source and is primarily responsible for supplying the slowly varying component of the traction power demand. By contrast, the supercapacitor branch is interfaced through a bidirectional DC/DC converter and is intended to absorb short high-power regenerative pulses and to support rapid transient power exchange. Such a semi-active topology makes it possible to decouple the voltage behavior of the supercapacitor from the main DC bus and to impose explicit limits on supercapacitor voltage, converter power, and branch currents.
Figure 2 also clarifies the role of the residual braking channel, which is essential for physically realistic modeling of regenerative braking. When the battery charge acceptance capability, supercapacitor voltage window, or DC/DC converter rating is reached, the remaining braking power cannot be stored and must be dissipated through the braking resistor or the mechanical/safety braking system. Therefore, the figure provides the structural basis for the constrained supervisory control model used in the subsequent sections and explains why the stored regenerative energy fraction in the revised manuscript is evaluated only from the portion of braking energy actually accepted by the HESS under the imposed limits.
1. Battery model, thermal response, and degradation stress indicators:
The LiFePO4 battery branch is represented by a first-order Thevenin equivalent circuit with SOC- and temperature-dependent parameters. This model extends the simple open-circuit voltage plus internal resistance representation and makes it possible to account for polarization voltage, current rate effects, and heat generation at system level.
The terminal voltage of the battery pack is calculated as
where
is the battery terminal voltage,
is the open-circuit voltage,
is the battery current,
is the ohmic resistance, and
is the polarization voltage of the RC branch.
The polarization dynamics are described as where and are the equivalent polarization resistance and capacitance.
The battery SOC dynamics are calculated as
where
is the nominal pack capacity in ampere-hours. The model enforces the operating window:
The thermal response of the battery pack is described by a lumped heat balance equation:
where
is the equivalent thermal capacity of the pack,
is the battery temperature,
is the ambient temperature,
is the equivalent heat transfer coefficient,
is ohmic heat generation, and
is polarization-related heat generation.
Because the present study is aimed at system-level HESS sizing and not at experimentally calibrated lifetime prediction, battery degradation is not reported as an absolute cycle life value. Instead, the following normalized aging stress indicators are used:
where
is the normalized RMS current stress indicator;
is the normalized peak current stress indicator. These indicators are used only to compare candidate HESS configurations under identical duty cycle assumptions. They should not be interpreted as a calibrated prediction of battery lifetime without experimental aging data for the specific cell, pack, cooling system, and charge/discharge protocol.
2. Supercapacitor model and usable energy window:
The supercapacitor branch is described by the equivalent module capacitance
, the equivalent series resistance
, and the permissible operating voltage window
. In contrast to a battery, the capacitance value in farads does not directly define the energy that can be absorbed during regenerative braking. Therefore, the usable supercapacitor energy is calculated from the voltage window:
where
is the usable supercapacitor energy, kWh;
is the equivalent capacitance of the supercapacitor module, F;
and
are the maximum and minimum allowable module voltages, V.
When converter and module losses are included, the net usable energy is written as
where
is the bidirectional DC/DC converter efficiency and
accounts for internal supercapacitor losses. In the baseline calculations, the voltage window is set as
and
. For
V, this corresponds to
V and
V.
The battery usable energy is defined as
where
is the nominal battery energy capacity, kWh;
and
define the allowed battery operating window. In the baseline model,
and
.
The primary HESS sizing indicator is therefore the dimensionless usable energy-buffer ratio
The capacitance remains a design variable, but it is not divided directly by the battery energy capacity. All Pareto maps, tables, nomograms, and conclusions are reported using the physically consistent indicator , while is retained only to specify the equivalent supercapacitor module design.
3. Constrained frequency-splitting supervisory control.
A constrained frequency-splitting supervisory control strategy is used to distribute the traction bus power demand between the battery and the supercapacitor branch. The objective is to assign slowly varying energy demand to the battery and short high-power transients to the supercapacitor, while satisfying SOC, voltage, current, converter-power, and braking safety constraints.
The bus power
is defined as positive in traction mode and negative in regenerative braking mode. The unconstrained battery power command is generated using a first-order low-pass filter (for the Laplace variable s):
where
is the preliminary battery power command,
is the traction bus power demand, and
is the filter time constant. The preliminary supercapacitor command is then calculated as
The preliminary commands are subsequently passed through a supervisory saturation layer:
Here, negative power denotes charging during regenerative braking, and positive power denotes discharge during traction. The battery charge and discharge limits depend on SOC and temperature, whereas the supercapacitor limits depend on module voltage, ESR, thermal state, and the bidirectional DC/DC converter rating.
When the demanded regenerative braking power exceeds the instantaneous charge acceptance capability of the HESS, the residual power is not stored but is assigned to the braking resistor and mechanical/safety braking channel:
where
is the regenerative braking power available at the traction bus,
and
are the powers accepted by the battery and supercapacitor,
is the converter loss, and
is the residual braking power dissipated by the braking resistor or mechanical braking system.
The DC/DC converter loss is approximated by
where
is the bidirectional converter efficiency. The supercapacitor ohmic loss is estimated as
where
is the supercapacitor branch current and
is the equivalent series resistance of the module.
The filter time constant
is not treated as an arbitrary parameter. For each candidate HESS configuration,
is selected within the bounded interval
in s [
2,
20] by minimizing the same multi-objective criterion used in the HESS sizing task. A practical initial value is estimated from the characteristic regenerative pulse duration and the usable supercapacitor energy:
where
is expressed in kWh,
is expressed in kW,
is an empirical tuning coefficient, and
limits the value to the interval
. The final
is selected by grid search together with the HESS design variables.
2.5. Constrained Supervisory Control and Optimization Problem
The problem of parametric optimization of a hybrid energy storage system is formulated in a general form for the vector of design variables .
The design vector includes the nominal battery energy capacity Ebat,nom in kWh and the equivalent supercapacitor module capacitance Csc in F. Since these quantities have different physical dimensions, their direct ratio is not used as an optimization output. Instead, the optimization results are reported through the dimensionless usable energy-buffer ratio
Optimization is performed when there are many targets’ functions
and systems of technical constraints
imposed on the permissible area of design solutions.
Minimizing the electrical load on the battery is considered as one of the key target functions, quantified through the rms value of the battery current over one operating cycle:
where
is the instantaneous current of the battery, and
is the duration of the operating cycle.
As a technical limitation, a limit on the peak power transmitted by HESS elements can be formulated:
where
is the maximum permissible power of the power drive and storage device.
Thus, the optimization problem is aimed at finding a globally optimal configuration of a hybrid energy storage system by varying two key parameters—
and
—while simultaneously meeting a set of physical, structural, and operational constraints [
39].
Then the peak power restrictions will be
To formalize the permissible range of HESS design parameters, the following system of constraints is introduced, while the optimization task is aimed at finding the global optimum of the HESS layout by varying two key variables:
is the nominal battery energy capacity, kWh.
is the equivalent capacitance of the supercapacitor module, F.
is the usable battery energy within the allowed SOC window, kWh.
is the usable supercapacitor energy within the allowed voltage window after converter and module losses, kWh.
is the dimensionless HESS usable energy buffer ratio.
Restriction system. Let us introduce a system of constraints that formalizes the permissible range of the design parameters of the hybrid energy storage system (HESS):
1. Weight and size limitation:
This inequality reflects the design and layout limitation and means that the total weight (or equivalent weight and dimensions) of the battery and supercapacitor module should not exceed the maximum permissible value set by the requirements for the object (chassis, power plant, vehicle) [
40]. Functional dependencies
and
emphasize that the mass of the relevant components is a function of their nominal energy capacity (or electrical capacity) and, indirectly, the selected electrochemical and structural technology.
2. Basic cycle energy limitation:
. This condition requires that the battery in single mode (without the participation of a supercapacitor) be able to meet the energy needs of the basic operating cycle. Here:
—nominal energy capacity of the battery;
—permissible depth of discharge, which limits the operating range of the battery in terms of resource;
is the energy required to perform the basic load cycle [
41]. The meaning of this limitation is to ensure the functional redundancy and reliability of the system: the supercapacitor is considered as a means of improving dynamics and reducing peak loads, but not as a mandatory source of energy for the main cycle. Thus, the design solution in which the correct operation of the system critically depends on the presence of a supercapacitor link is excluded [
42].
3. Power limitation: , where is the maximum peak power in the cycle.
4. By current: for all values of time t.
5. By voltage: the operating voltage ranges of the battery and SC are matched through the DC/DC converter.
In
Table 3, control and component constraints used in the constrained HESS model are presented.
Table 3.
Control and component constraints used in the constrained HESS model.
Table 3.
Control and component constraints used in the constrained HESS model.
| Constraint Group | Variable | Baseline Value | Sensitivity Range | Function in the Model |
|---|
| Battery SOC window | | 0.20–0.95 | 0.15–0.95 | Prevents deep discharge and overcharge |
| Supercapacitor voltage window | | | | Defines usable SC energy and voltage safety margin |
| Nominal DC bus voltage | | 700 V | 600–800 V | Voltage reference for converter matching |
| Battery continuous charge limit | | 0.5 C-rate equivalent | 0.3–1.0 C | Limits long regenerative charging |
| Battery pulse charge limit | | 1.0 C-rate equivalent | 0.5–1.5 C | Limits short regenerative pulses |
| Battery discharge limit | | 1.0 C-rate equivalent | 0.8–2.0 C | Limits traction power drawn from battery |
| Bidirectional DC/DC converter rating | | 750 kW | 500–1000 kW | Limits SC branch charge/discharge power |
| DC/DC converter efficiency | | 0.96 | 0.94–0.98 | Accounts for converter loss |
| Equivalent SC module ESR | | 0.02 Ω | 0.01–0.05 Ω | Accounts for supercapacitor ohmic loss |
| Residual braking channel | | calculated | — | Dissipates regenerative power not accepted by HESS |
| Control filter time constant | | optimized | 2–20 s | Determines battery/SC power split |
The limits in
Table 3 are used at every calculation step. Therefore, the reported stored regenerative energy fraction is not calculated from the theoretical regenerative energy alone but from the portion of regenerative energy actually accepted by the constrained battery–supercapacitor HESS after converter, ESR, SOC, voltage, current, and power limitations have been applied.
Objective functions (multi-criteria optimization):
Minimizing Net Energy Consumption: .
Minimizing battery load: to extend battery life.
System Weight Minimization: .
To find compromise solutions, a Pareto front is built, and the final choice of configuration is made taking into account the design priorities (durability and cost) [
43].
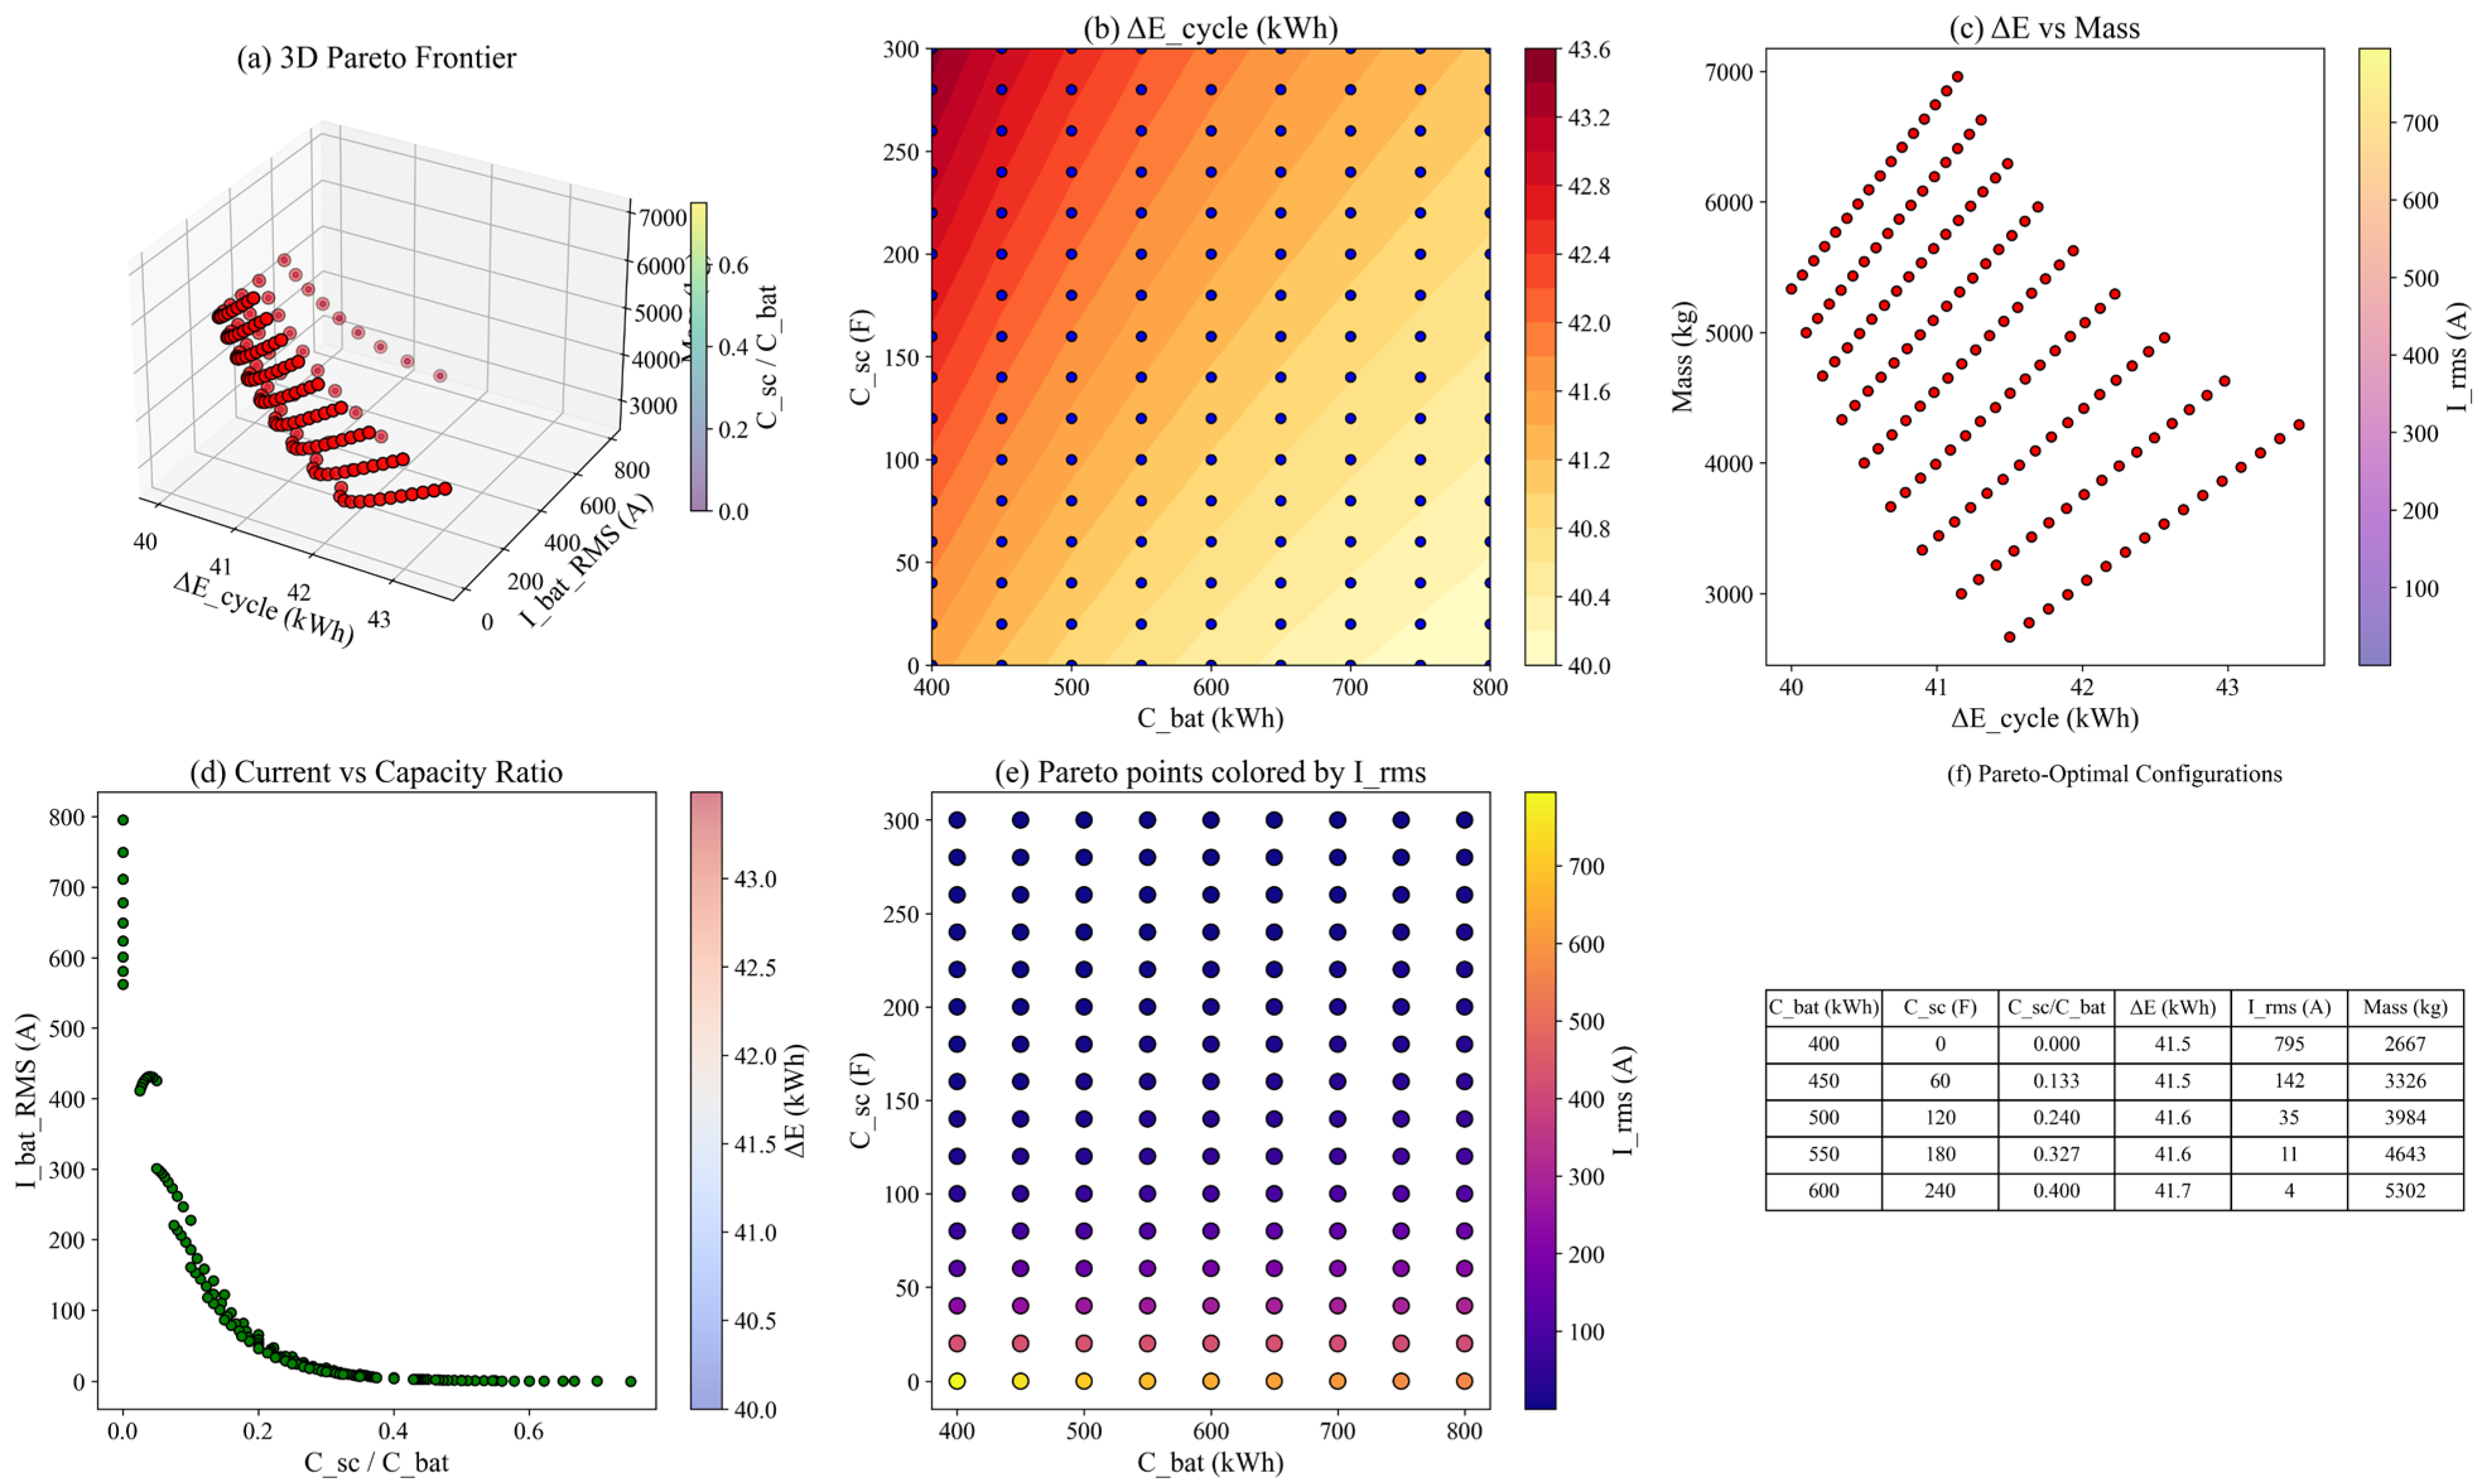
The optimization procedure is implemented as a reproducible grid-based Pareto search. For each duty cycle and each candidate set , the time domain simulation is performed over the complete segment-level duty cycle. At every time step, the constrained supervisory control algorithm updates , battery current, SC current, accepted regenerative energy, residual braking energy, and component losses. A candidate solution is considered feasible only if all SOC, voltage, current, converter power, and mass constraints are satisfied. The Pareto set is then obtained by non-dominated sorting in the objective function space consisting of net cycle energy, battery RMS current, and HESS mass.
The grid spacing was set to 25 kWh for , 5–10 F for Csc, and 1 s for τ. The complete search required fewer than 104 candidate simulations per duty cycle and was fully repeatable because no stochastic optimizer was used.
For clarity and to avoid ambiguity in the mathematical notation used in the vehicle-dynamics, HESS, control, and optimization models, the principal symbols are summarized in
Table 4. The symbols are also defined in the relevant equations where they first appear; therefore, the nomenclature table is used as a compact reference rather than as a substitute for local definitions in the main text.
Table 1 provides a consolidated reference for the variables used in the mathematical model, including vehicle dynamics quantities, HESS component parameters, control variables, and stress indicators.
2.7. Benchmark-Based Verification and Uncertainty Assessment
The purpose of this section is not to claim full experimental validation of the complete battery–supercapacitor HESS. Instead, the model is benchmark-verified at system level by comparing the pure battery reference configuration with publicly available data and previously published calculations for the same vehicle class. The HESS-specific results are additionally checked by energy balance closure, constraint satisfaction, and uncertainty analysis. Therefore, as the verification should be interpreted as benchmark-based system-level verification rather than independent field validation [
47,
48], a comparison of the calculated data with the published reference sources was carried out. The following are used as basic verification objects: the benchmark verification was performed for the same 65 t payload-class reference vehicle used in the model. Public Komatsu HD605-7/E-Dumper-class data were used only as an external scale reference, including a tare mass of approximately 45 t, a payload of approximately 65 t, and a battery capacity reported in the public benchmark range of about 600–700 kWh. The baseline configuration in the present model uses
Ebat = 600 kWh, whereas the wider range
Ebat = 400–800 kWh is treated as a design variable in the HESS optimization procedure.
The comparison was carried out for the basic configuration of a “pure battery dump truck” (Cbat = 600 kWh, Csc = 0) when driving along the typical quarry cycle described in Section Operating Cycle of a 65 t Payload-Class Mining Dump Truck. The following integral and peak indicators were evaluated:
- -
Total electricity consumption from the on-board storage unit per cycle;
- -
Maximum regenerative braking power;
- -
RMS current of the battery;
- -
Acceleration time of the unloaded dump truck to a speed of 15 km/h.
The results of the comparison are presented in
Table 5.
Analysis of the data in
Table 5 shows that the discrepancy between the calculated and reference values does not exceed 6% for all the parameters considered. The largest deviation (5.6%) was recorded for the acceleration time, which is explained by the simplified consideration of the inertial characteristics of the transmission in the model. The comparison in
Table 5 indicates that the vehicle-level longitudinal dynamics and pure battery energy balance model reproduce the order of magnitude of the benchmark indicators with deviations generally below 6–8%. However, this comparison does not constitute independent field validation of the complete HESS architecture because the supercapacitor branch, bidirectional DC/DC converter, and supervisory control algorithm were not tested against measured HESS telemetry [
49]. For this reason, the model is used as a constrained system-level sizing tool rather than as a final design certification model.
In
Table 6, uncertainty ranges used for robustness assessment of the constrained HESS model are presented.
For each candidate HESS configuration, the uncertainty assessment recalculates the main outputs over the parameter ranges shown in
Table 6. The reported outputs include net cycle energy, stored regenerative energy fraction, battery RMS current, maximum battery temperature rise, residual braking energy, and the normalized aging stress indicators. This procedure does not replace experimental validation, but it quantifies the robustness of the comparative HESS sizing conclusions to the main modeling assumptions.




 ,
,