1. Introduction
The global economy’s rapid progression has advanced human civilization, but simultaneously inflicted significant ecological damage [
1]. The transportation industry is an essential component of contemporary society, and it is critical to the growth of economies, the provision of decent wages to the population, and the realization of numerous macro- and microeconomic advantages. According to the IEA report [
2], oil demand remained 5.4% below its level in 2019 because of several factors, such as increased vehicle efficiency standards and the share of electric vehicles (EVs), while vehicle electrification raised electricity consumption in the sector by over 8% in 2024. In 2025, the transportation sector accounted for 20% of energy-related CO
2 emissions [
2], prompting a high demand for alternative technologies with comparable characteristic curves.
With technological breakthroughs recently, EVs have demonstrated a new potential to tackle many of society’s concerns. The concerns include rising reliance on fossil fuels, environmental issues, rapid industrialization, urban mobility, and the workforce. Despite customers’ favorable attitudes regarding EVs and major regulatory pushes by governments in several countries, the adoption of electric vehicles has remained challenging. EVs are considered one of the most essential methods of addressing some of the most critical issues of modern society, such as energy security, ecological pollution, and urban transportation. It is able to provide interaction between three main levels of development—economic growth, social well-being, and protection of the environment and the health of the nation. Currently, the largest automakers in the world are trying to actively master the production of vehicles based on alternative energy sources such as hydrogen and electric motors. According to a report [
3], EV units sold jumped from 0.77 million in 2016 to 16.63 million in 2025 globally.
For an oil-importing country like Uzbekistan, transitioning toward alternative energy solutions is a strategic necessity. While solar, hydrogen, and nuclear power face scaling challenges, EVs have emerged as the most viable immediate solution to mitigate oil reliance and combat the pollution stemming from rising car ownership. Despite the fact that the 19th-century origins of EVs remained niche due to the simplicity of internal combustion engines (ICEs). Modern sustainable transportation, however, requires a complex integration of economic and social planning [
4]. To achieve aggressive market share targets, it is important to move beyond technical deployment and rigorously assess consumer perceptions and adoption barriers.
After successfully launching a BYD Uzbekistan Factory joint venture (JV) in Jizzakh, Uzbekistan became a regional leader in the car manufacturing industry rather than only an EV-importing country. In 2026, production volume is planned to reach 40,000 units. The JV intends to manufacture 200,000 units of plug-in hybrid electric vehicles and EVs each year by 2030 [
5]. However, in line with the local EV procurement level, Uzbekistan imported more than 9.5 thousand units of EVs, reflecting nearly a sixfold increase in 2026 [
6]. As of 11 December 2025, the total number of registered EVs is 86.1 thousand units [
7]. This report [
8] predicts that by 2040, EVs will account for over 83% of new vehicle sales. Recently, the development tendency of the electric vehicle industry and market share in Uzbekistan as a whole reflects a positive trend. Conventional transportation has been causing an increase in ecological challenges. Many governments have developed effective policies to lessen environmental difficulties, such as encouraging people to use EVs, in light of the urgency of taking steps to address climate change [
9]. Because Uzbekistan is Central Asia’s largest carbon dioxide emitter, the government has begun implementing initiatives to minimize carbon emissions. As a signatory to the Paris Agreement, Uzbekistan has significantly accelerated its climate commitments, setting an ambitious target to reduce greenhouse gas emissions by 50% by 2030 compared to 2010 levels. To achieve these goals, the government is prioritizing the transport sector, which is a primary contributor to air pollution, by pursuing a nationwide electrification of the automotive fleet. The Strategy for the Transition of the Republic of Uzbekistan to a Green Economy for the period 2019–2030 and the Concept of the Development Strategy of the Republic of Uzbekistan until 2035 formalize these objectives, and the policy frameworks outline the following critical initiatives:
Full-cycle manufacturing: Establishing local EV production.
Regulatory and Physical Infrastructure: Developing the legislative frameworks necessary for EV implementation alongside the construction of essential charging networks.
Public Transport Transformation: Executing a phased transition toward battery electric buses and vehicles, step by step phasing out conventional engines in favor of high-speed and light rail systems modeled after successes in Singapore and Malaysia.
Urban Planning Reform: Cycling infrastructure, dedicated EV parking, and charging station integrations into New Uzbekistan’s urban designs.
Uzbekistan’s extensive professional experience in automobile manufacturing in Central Asia highlights the necessity of understanding current market dynamics and customer purchase intentions for the effective policy implementation in the region.
The Republic of Uzbekistan has transitioned from basic planning to considerable fiscal intervention to promote EV adoption in line with global trends. The government introduced a targeted preferential loan mechanism as part of the 2026 State Program [
10], where interest rates for EV purchases amount to 16% per annum. The state budget compensates any margin above this rate, which has decreased from the market average of 23% [
10].
Operational cost parity is considered a secondary financial pillar that aims to further strengthen the green transport sector. From 1 May 2026, the government is providing a direct electricity subsidy for charging stations. EV owners pay a fixed tariff of UZS 300 per 1 kWh, and the state treasury covers the difference, regardless of market fluctuations [
10,
11]. These domestic measures are complemented by the ongoing provision of customs duty and tax exemptions for EVs and charging equipment until 1 January, 2028 [
10], which effectively aligns national industrial policy with the ambitious emission targets set in the 2025 updated NDC.
Empirical research about EV adoption and customer behavior has predominantly focused on studies conducted in the Western economies and highly subsidized East Asian markets [
12,
13,
14,
15]. Researchers often apply established socio-psychological frameworks such as the Technology Acceptance Model (TAM) [
16] and the Extended Unified Theory of Acceptance and Use of Technology (UTAUT) [
17] to analyze consumer decision-making in these saturated contexts. Conversely, a significant empirical gap persists regarding these behavioral dynamics within the rapidly industrializing transition economies of Central Asia. The current study for emerging automotive markets like Uzbekistan is largely restricted to official government planning decrees [
18,
19], macroeconomic visions outlined in the “Uzbekistan-2030” strategy [
10], and high-level industrial news reports tracking rapid market growth [
11].
Consequently, there is a profound lack of academic, peer-reviewed analysis that applies global behavioral models to the unique Central Asian socio-economic context, leaving the actual drivers and barriers of consumer adoption in Uzbekistan under-theorized compared to the established global body of research. The limited empirical tracking within the broader region has failed to establish a unified consumer psychology; for instance, recent regional baseline research in neighboring Kazakhstan by [
20] concluded that financial and technological barriers exerted the strongest direct negative impact on purchase intentions, positioning upfront cost as a definitive market blocker. Given Uzbekistan’s unique combination of extensive domestic automotive manufacturing experience, aggressive fiscal interventions, and rapid clean-energy vehicle deployment, there is an urgent academic requirement to transition away from descriptive policy tracking. This paper addresses these distinct literature gaps by providing a theoretically grounded analysis of the socio-economic and behavioral factors shaping consumer purchase intentions within the unique institutional reality of the Uzbek marketplace.
2. Theoretical Framework and Hypothesis Development
2.1. Underpinning Theory
Individual decision-making constitutes the fundamentals of microeconomic analysis, offering a structure for comprehending consumer behavior within intricate market settings [
21]. This research employs Rational Choice Theory (RCT) as its principal methodological approach. Grounded in the tenet of methodological individualism, RCT suggests that economic and environmental actions stem from individuals assessing costs and benefits to optimize their personal utility [
22].
The application of RCT is especially suitable for examining EV adoption in Uzbekistan. Unlike products with rapid turnover, households typically make significant capital expenditures on automobiles, deciding to adopt electric mobility, a rare impulsive choice. Prolonged evaluation phases typically involve substantial financial obligations, during which consumers strive to maximize utility by assessing available variants [
23]. This study uses an RCT to explore how consumers in Uzbekistan assess the trade-offs between the perceived impediments of Purchase Cost (PC), Charging Infrastructure (ChI), and Government Incentives (GI) to ultimately determine Purchase Intention (PIEV).
While prominent socio-psychological paradigms such as the Theory of Planned Behavior (TPB) and the Technology Acceptance Model (TAM) are frequently deployed within consumer research, they lack the specific econometric leverage required for high-involvement, capital-intensive automotive transactions in emerging markets. TPB and TAM are optimized for low-cost, low-risk, rapid-turnover behavioral modifications where subjective norms and perceived ease of use dominate utility. Conversely, an automobile purchase in Uzbekistan represents a substantial, multi-year household capital expenditure and a high-stakes financial risk. Consequently, consumer behavior in this context is guided by systemic financial and structural considerations rather than purely social or psychological validation. RCT is therefore uniquely capable of modeling these explicit, calculation-heavy economic trade-offs, positioning the prospective buyer as a deliberate utility-maximizing agent evaluating tangible structural parameters.
To ensure deep analytical leverage within the unique transition economy of Uzbekistan, this study contextualizes RCT through the lens of Herbert Simon’s foundational concept of bounded rationality [
24]. In a state of absolute, classical rationality, a consumer faced with severe localized constraints—such as high upfront capital costs and a sparse public charging infrastructure—would logically minimize risk by rejecting the technology. However, bounded information processing and forward-looking expectations shift the matrix for optimizing utility. In this framework, aggressive institutional signaling, legislative mandates, and state decrees act as anchoring mechanisms. Prospective adopters calculate utility not merely based on the immediate, imperfect market conditions visible on the street today but on the expected future value generated by state intervention. Government policies effectively alter the subjective probabilities of risk, allowing consumers to rationally maintain high adoption intentions by expecting the state to absorb structural pricing and infrastructure deficits over time.
2.2. Hypothesis Development
The purchase intention of electric vehicles is the key dependent variable in this research on EV adoption. Recognizing the rapid advancement of electric vehicles, a growing number of studies are focusing on customer acceptance of EVs [
25,
26,
27,
28]. Western countries have historically conducted the majority of research on EV mobility, acceptance behavior, and sustainability perspectives [
29,
30,
31,
32,
33,
34]. However, recent environmental and energy security issues have shifted the focus to developing markets such as Uzbekistan.
Global policy analyses emphasize that sustained market penetration relies on a synchronized balance between demand-side privilege frameworks (e.g., consumer tax exemptions) and supply-side investment infrastructures (e.g., localized manufacturing and battery-swapping networks), as demonstrated by extensive international assessments across the EU, China, and developing nations [
17,
35]. Methodologically, recent meta-analyses and forecasting syntheses categorize these market tracking frameworks into micro-level bottom-up approaches (e.g., discrete choice and agent-based modeling) and macro top-down architectures (e.g., system dynamics), concluding that while upfront costs and charging infrastructure remain baseline structural constraints, modern adoption willingness is fundamentally accelerated by forward-looking institutional mandates and subjective expectation effects [
35].
Purchasing cost remains the main factor in the decision-making process of potential customers. As [
36] stated, “Price perception greatly affects a consumer’s decision to purchase a product”. While EVs often have higher upfront costs compared to ICE vehicles, they demonstrate superior long-term cost-effectiveness in fuel and maintenance expenditures [
37,
38]. Three price categories of electric vehicles, such as premium, standard, and economy classes, are available on the market in Uzbekistan, taking into account consumers’ purchasing power.
ChI is considered the fundamental basis of electric mobility. While most EVs in Uzbekistan have integrated AC-to-DC converters for home charging, massive EV adoption is strongly dependent on the availability and reliability of public ChI. This is important for minimizing EVs’ range-related issues, in particular for long-distance trips.
In the global policy-oriented EV adoption strategies, GI plays an important role. As it was noted by the Global EV Outlook [
2], the most common mechanisms include purchase refunds, tax exemptions, and credits, which are further strengthened by additional benefits such as bus lane access, parking, and charging fee waivers. The vehicle’s technical specifications, such as battery capacity or zero-emission range, are frequently utilized to calibrate these incentives.
Based on the economic context of Uzbekistan and the literature, the study presents three hypotheses:
Hypothesis 1. The purchase cost has a significant negative impact on customers’ intention to purchase electric vehicles.
Hypothesis 2. Sufficient charging infrastructure has a significant positive effect on the customers’ willingness to purchase electric vehicles.
Hypothesis 3. Government incentives have a significant positive effect on the customers’ willingness to purchase EVs.
This study uses a quantitative research design to evaluate the relative significance of three influencing factors on EV purchasing customer behavior: GI, ChI and PC. The research identifies the most critical of these three factors by assessing survey data collected from 180 valid respondents using hierarchical multiple linear regression modeling. The findings provide nuanced knowledge of how policy-oriented mechanisms overcome conventional economic constraints in Uzbekistan, offering practical applications for both industry and policymakers trying to accelerate the shift to sustainable urban mobility.
3. Materials and Methods
This paper’s research design is formulated as a systematic framework that organizes the collection and analysis of empirical data. To test specific hypotheses about consumer behavior in Uzbekistan, a quantitative research methodology was deemed most appropriate. Data collection was conducted via a structured online questionnaire applying the survey method. This method was selected because it is inexpensive and efficient to gather a geographically diverse sample across Uzbekistan, and has the ability to generate a standardized dataset appropriate for statistical modeling.
The targeted sample frame consisted of adult customers living in the main economic and urban centers of Uzbekistan, including Tashkent, Fergana, Andijan, and Samarkand. We distributed approximately 1000 survey invitations to these regions. In addition to the digital outreach, a personal telephone follow-up strategy was deployed to maximize participation rates, maintain high data quality, and qualitatively screen for non-response bias. Our outreach efforts confirmed that non-participation was due primarily to personal time constraints or a general unfamiliarity with the EV sector, and not any systematic exclusion based on demographics.
3.1. Survey Instrument and Operationalization
The survey instrument was developed by operationalizing three primary independent constructs—PC, Charging Infrastructure (ChI), and GI—and one dependent outcome construct—EV Purchase Intention (PIEV). To ensure measurement stability, all latent dimensions were measured using a symmetric five-point Likert scale ranging from 1 (Strongly Disagree) to 5 (Strongly Agree). The complete scale incorporates 15 distinct item indicators adapted from established transport-behavior literature and tailored to the institutional environment of Uzbekistan.
To mitigate Common Method Bias (CMB) at the source, several procedural design controls were integrated into the instrument’s rollout. The questionnaire was translated from English into Uzbek language through double-translation protocols to prevent semantic misunderstandings. The survey items were also sequenced from simple demographic questions to more complex structural ones to maintain respondent focus.
3.2. Psychometric Validation and Factorial Architecture
To evaluate the content validity of the structural dimensions of the 15-item instrument, Exploratory Factor Analysis (EFA) was executed in IBM SPSS Statistics for Windows, Version 23.0. Because the empirical data were derived from ordinal Likert scales and exhibited severe non-normality, Principal Axis Factoring (PAF) was chosen as the extraction method instead of standard Principal Component Analysis (PCA). PAF is highly robust against violations of multivariate normality because it isolates shared common variance from unique error residuals.
The mathematical framework of the factor extraction breaks down each observed item score (
) into a linear combination of common underlying latent factors (
) and a unique variance component (
), modeled as follows:
where
represents the factor loading of variable
on factor
, and
represents the four extracted common latent dimensions (PIEV, PC, ChI, and GI). The shared communality matrix (
) for each item is isolated via squared multiple correlations (SMC) to strip away unique error variances:
An oblique rotation method (Direct Oblimin) was applied to allow the underlying behavioral constructs to correlate naturally. This splits the factor coordinates into a pattern matrix (unbiased regression weights) and a structure matrix (total correlation weights), mapped through the factor correlation matrix (
):
Scale internal consistency was verified via Cronbach’s Coefficient Alpha (), applying a strict reliability acceptance threshold of 0.70.
3.3. Two-Tiered Common Method Bias Verification
To supplement procedural survey controls, common method variance was statistically evaluated post hoc using a rigorous two-tiered validation framework. Initially, a baseline Harman’s Single-Factor Test [
39] was executed by forcing all 15 measurement items into an unrotated, single-factor exploratory factor analysis configuration using principal axis factoring.
To overcome the recognized limitations of Harman’s test, a full collinearity Variance Inflation Factors (VIF) assessment approach [
40] was also implemented. Four distinct linear regression iterations were run, where each core construct was systematically rotated into the dependent position against the remaining variables acting as predictors. This dual-validation procedure confirms that the dataset does not suffer from substantial lateral or vertical multicollinearity and indicates that common method variance is highly unlikely to confound the structural paths.
3.4. Econometric Modeling Framework
Because Kolmogorov–Smirnov and Shapiro–Wilk tests confirmed significant deviations from normal distribution across all variables (p < 0.001), parametric OLS regression assumptions were violated. To generate reliable significance tests and unbiased standard errors, a two-stage hierarchical multiple linear regression analysis backed by empirical bootstrapping with 2000 resamples was deployed.
To control for confounding variables, all multi-category socio-demographic indicators were converted into binary dummy variables (
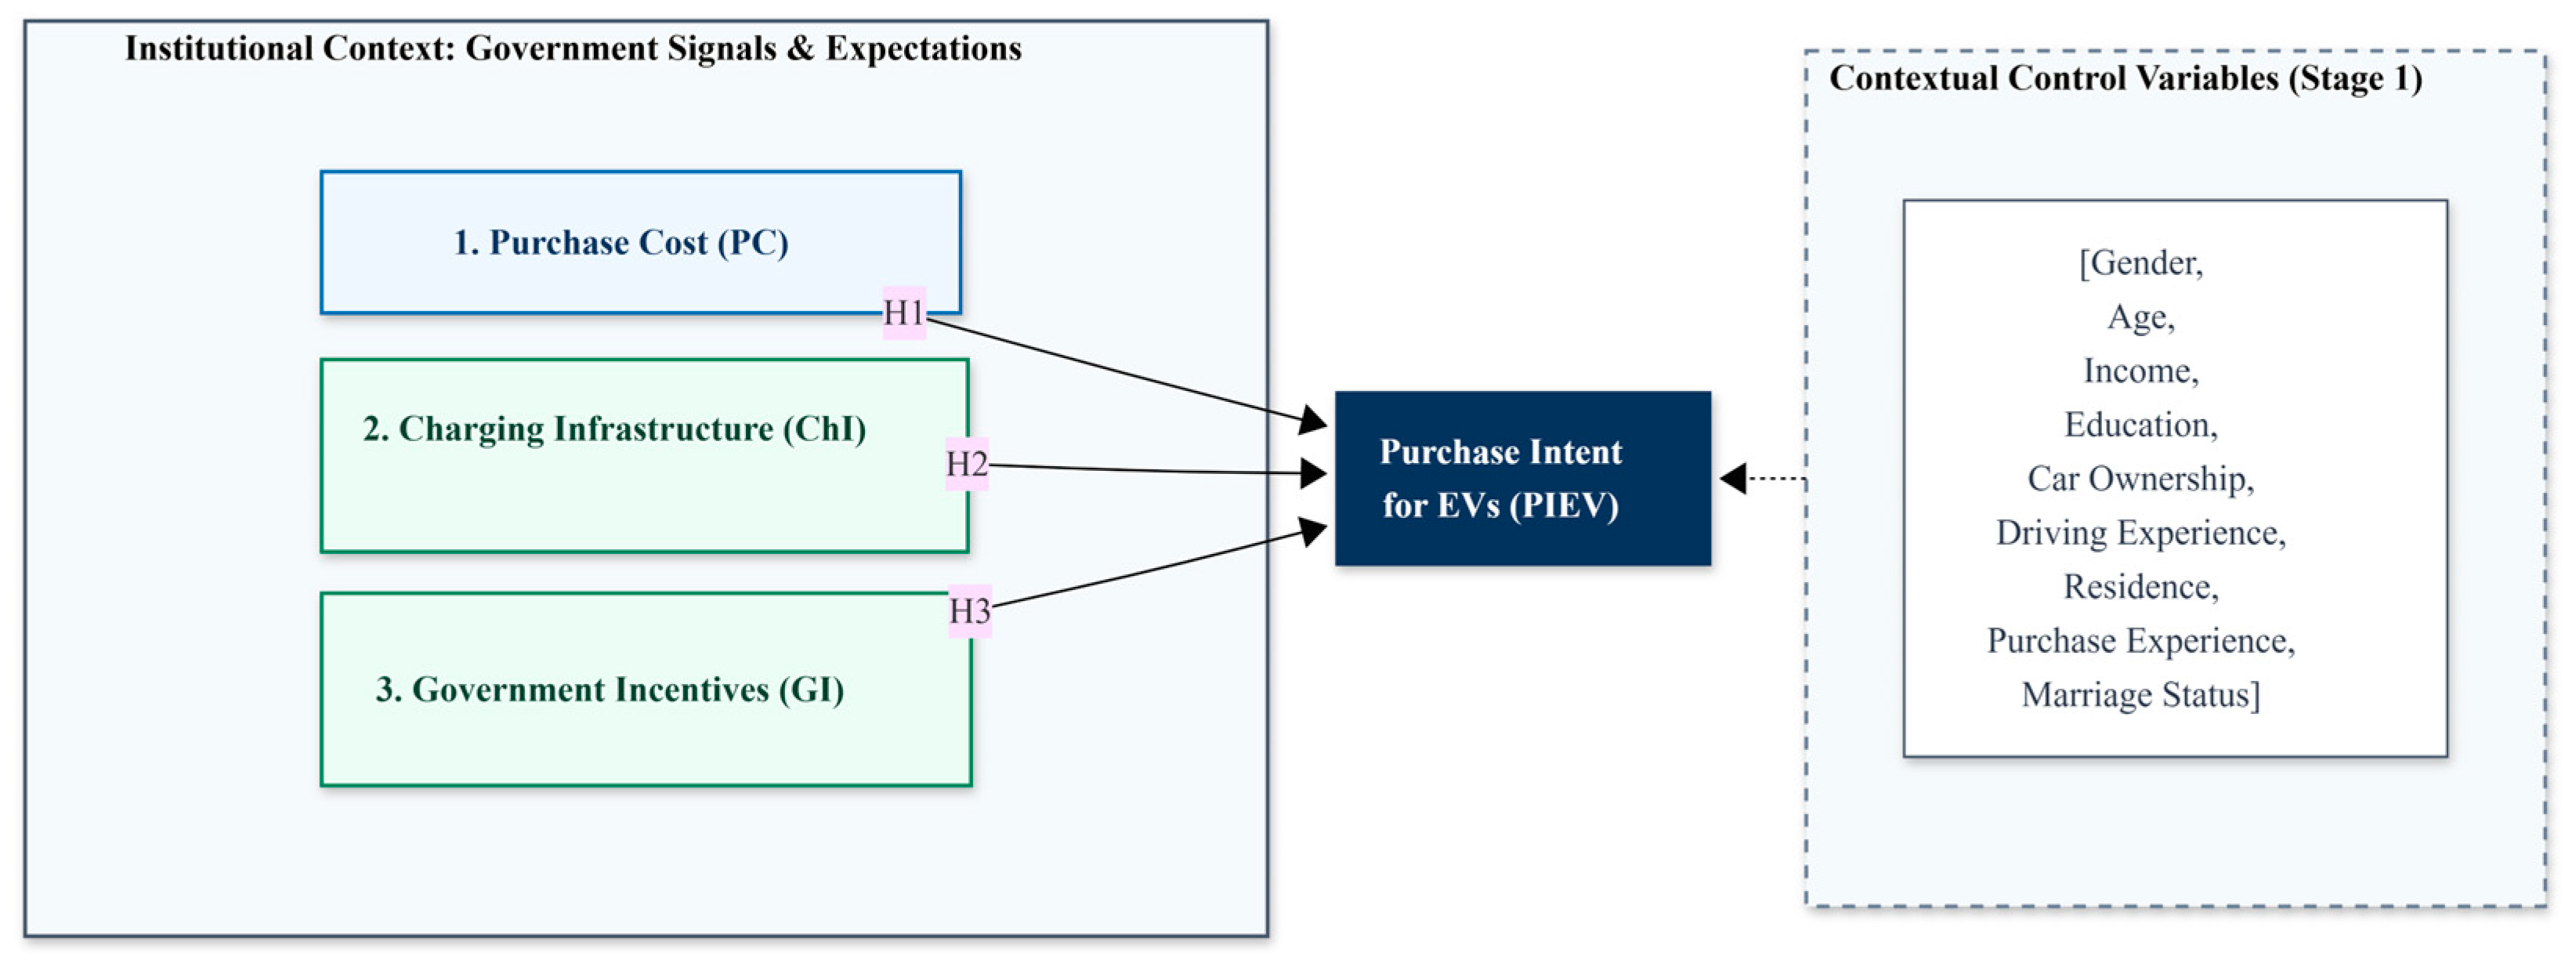
k − 1) relative to baseline reference groups. In the first stage (Model 1), these demographic baseline dummy covariates were introduced to isolate background variance. In the second stage (Model 2), the core independent predictors (PC, ChI, GI) were introduced simultaneously to determine the unique incremental variance change (
) and evaluate Hypotheses 1, 2, and 3. During the 2000 bootstrap simulations, localized demographic dummy indicators with low subsample frequencies occasionally manifested as mathematical constants within single iteration loops. The research model is given in
Figure 1.
3.5. Participants and Demographic Profile
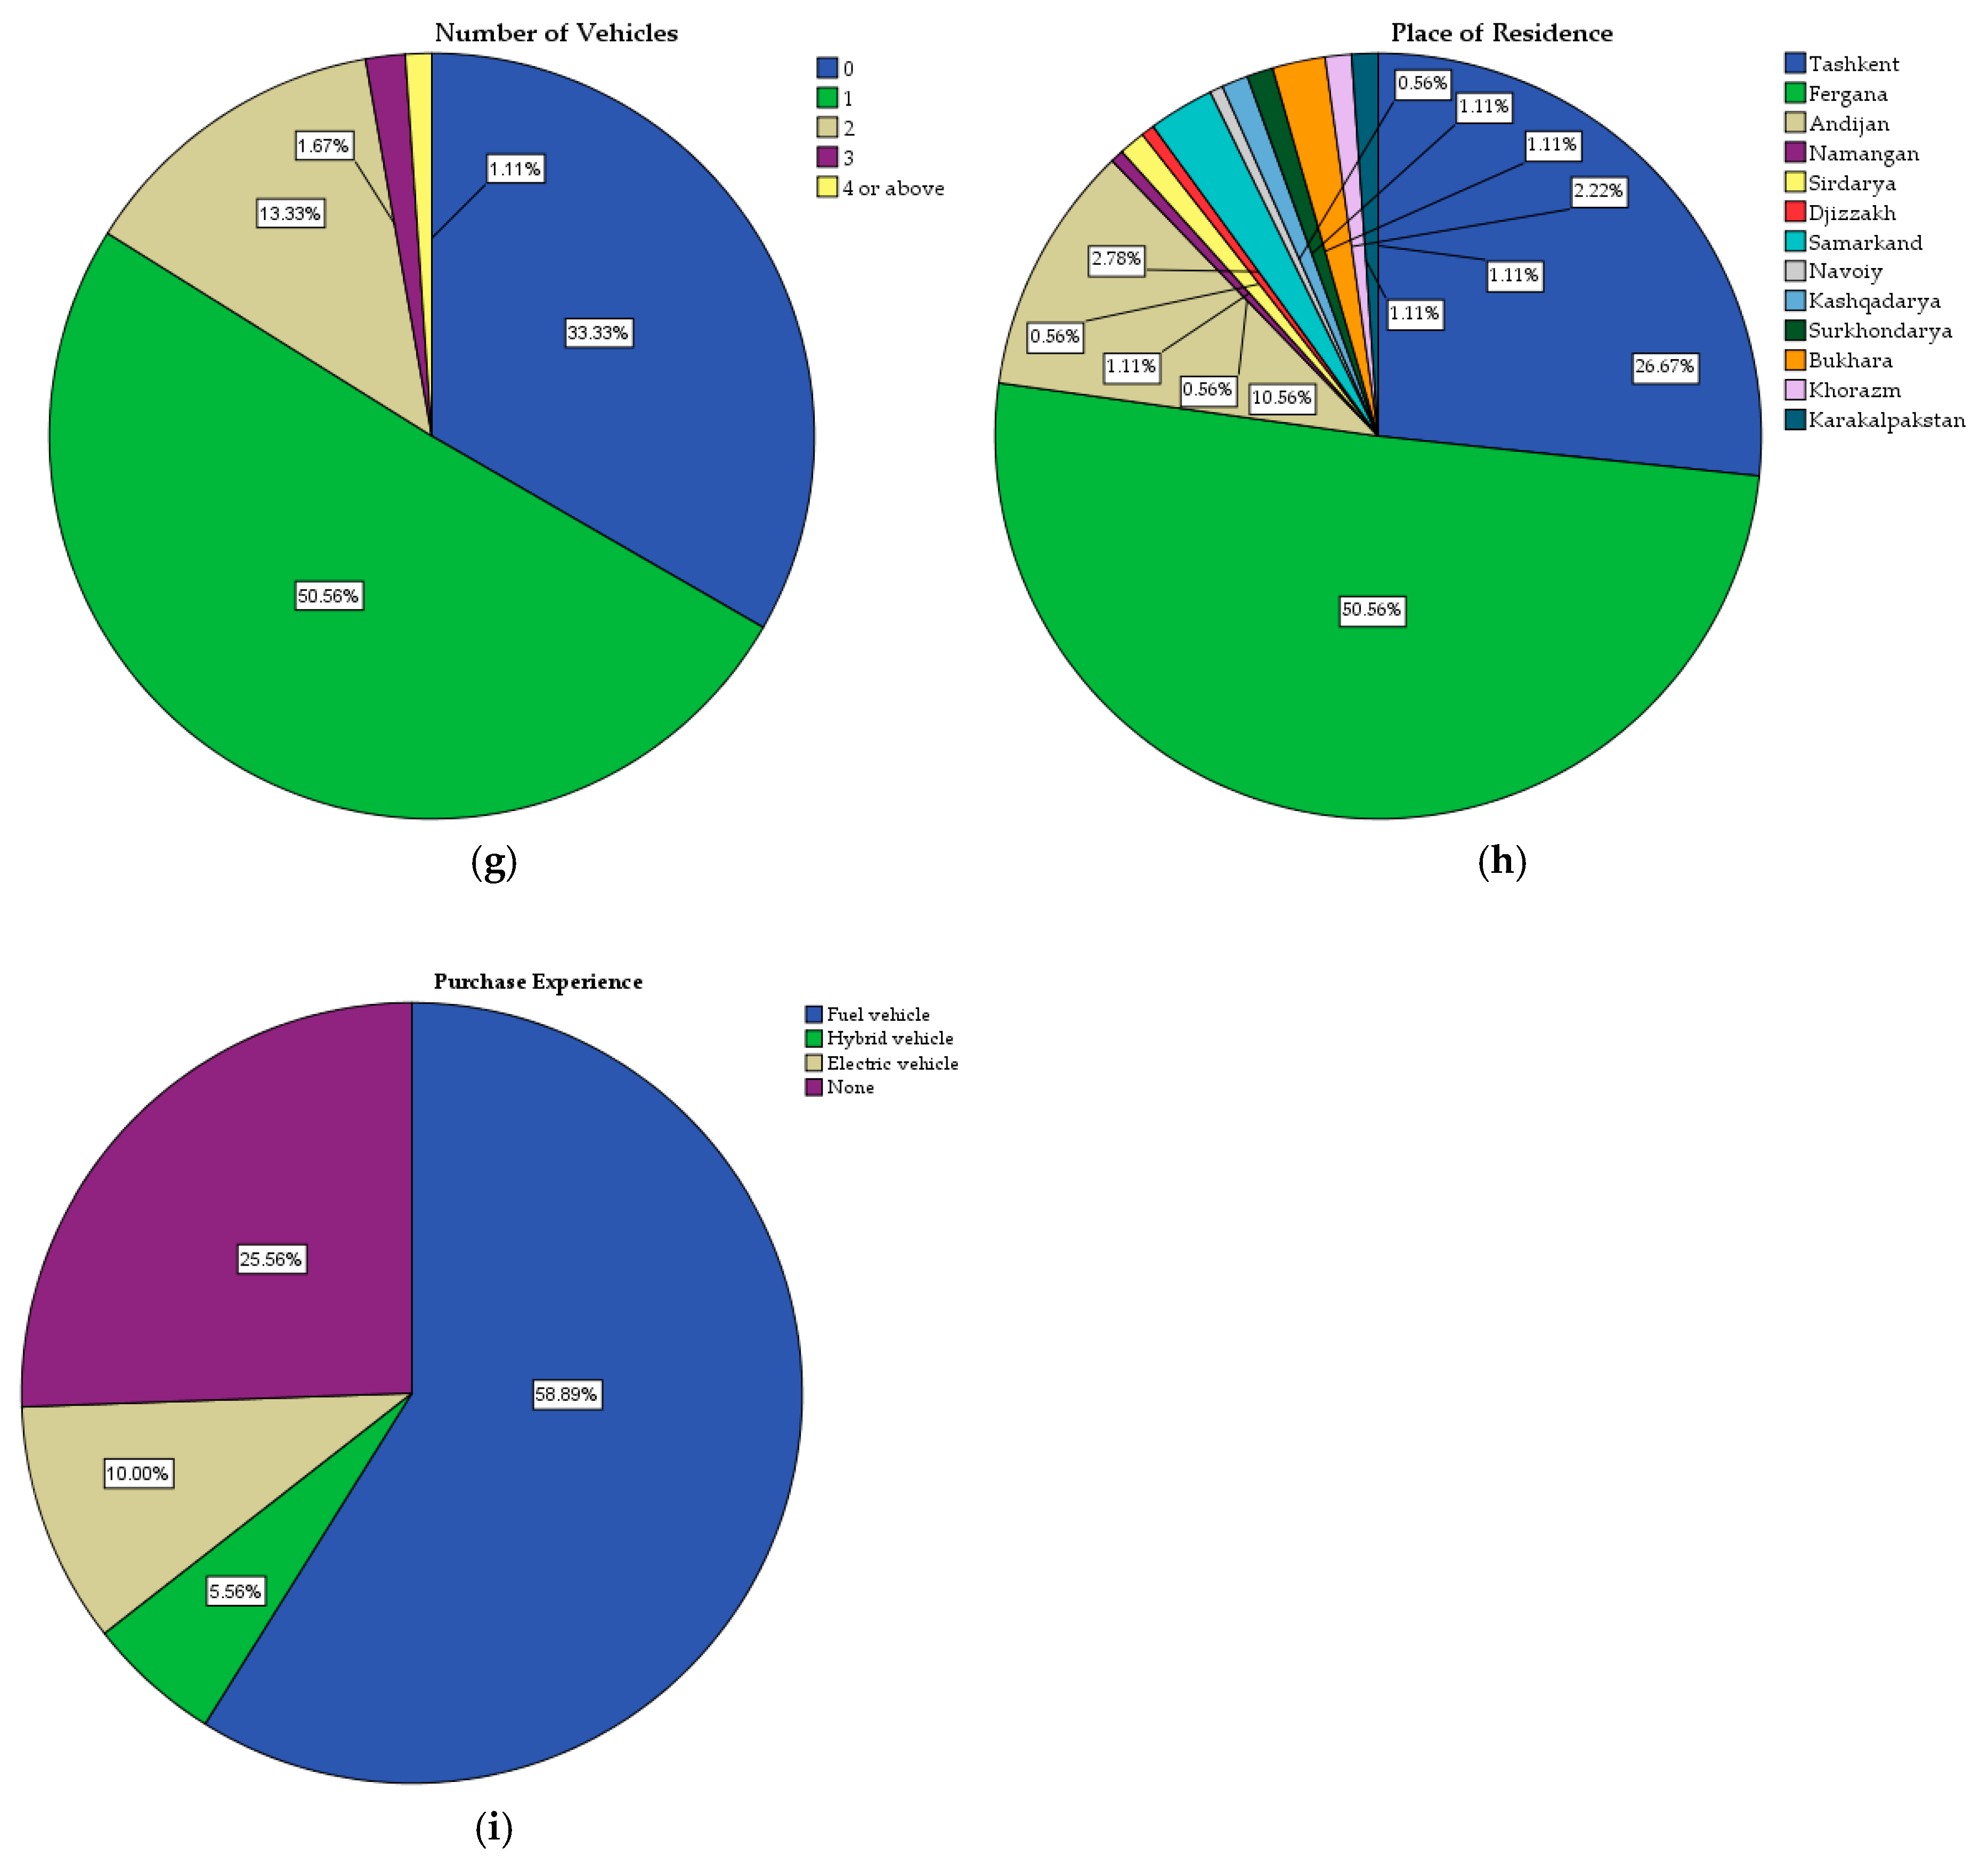
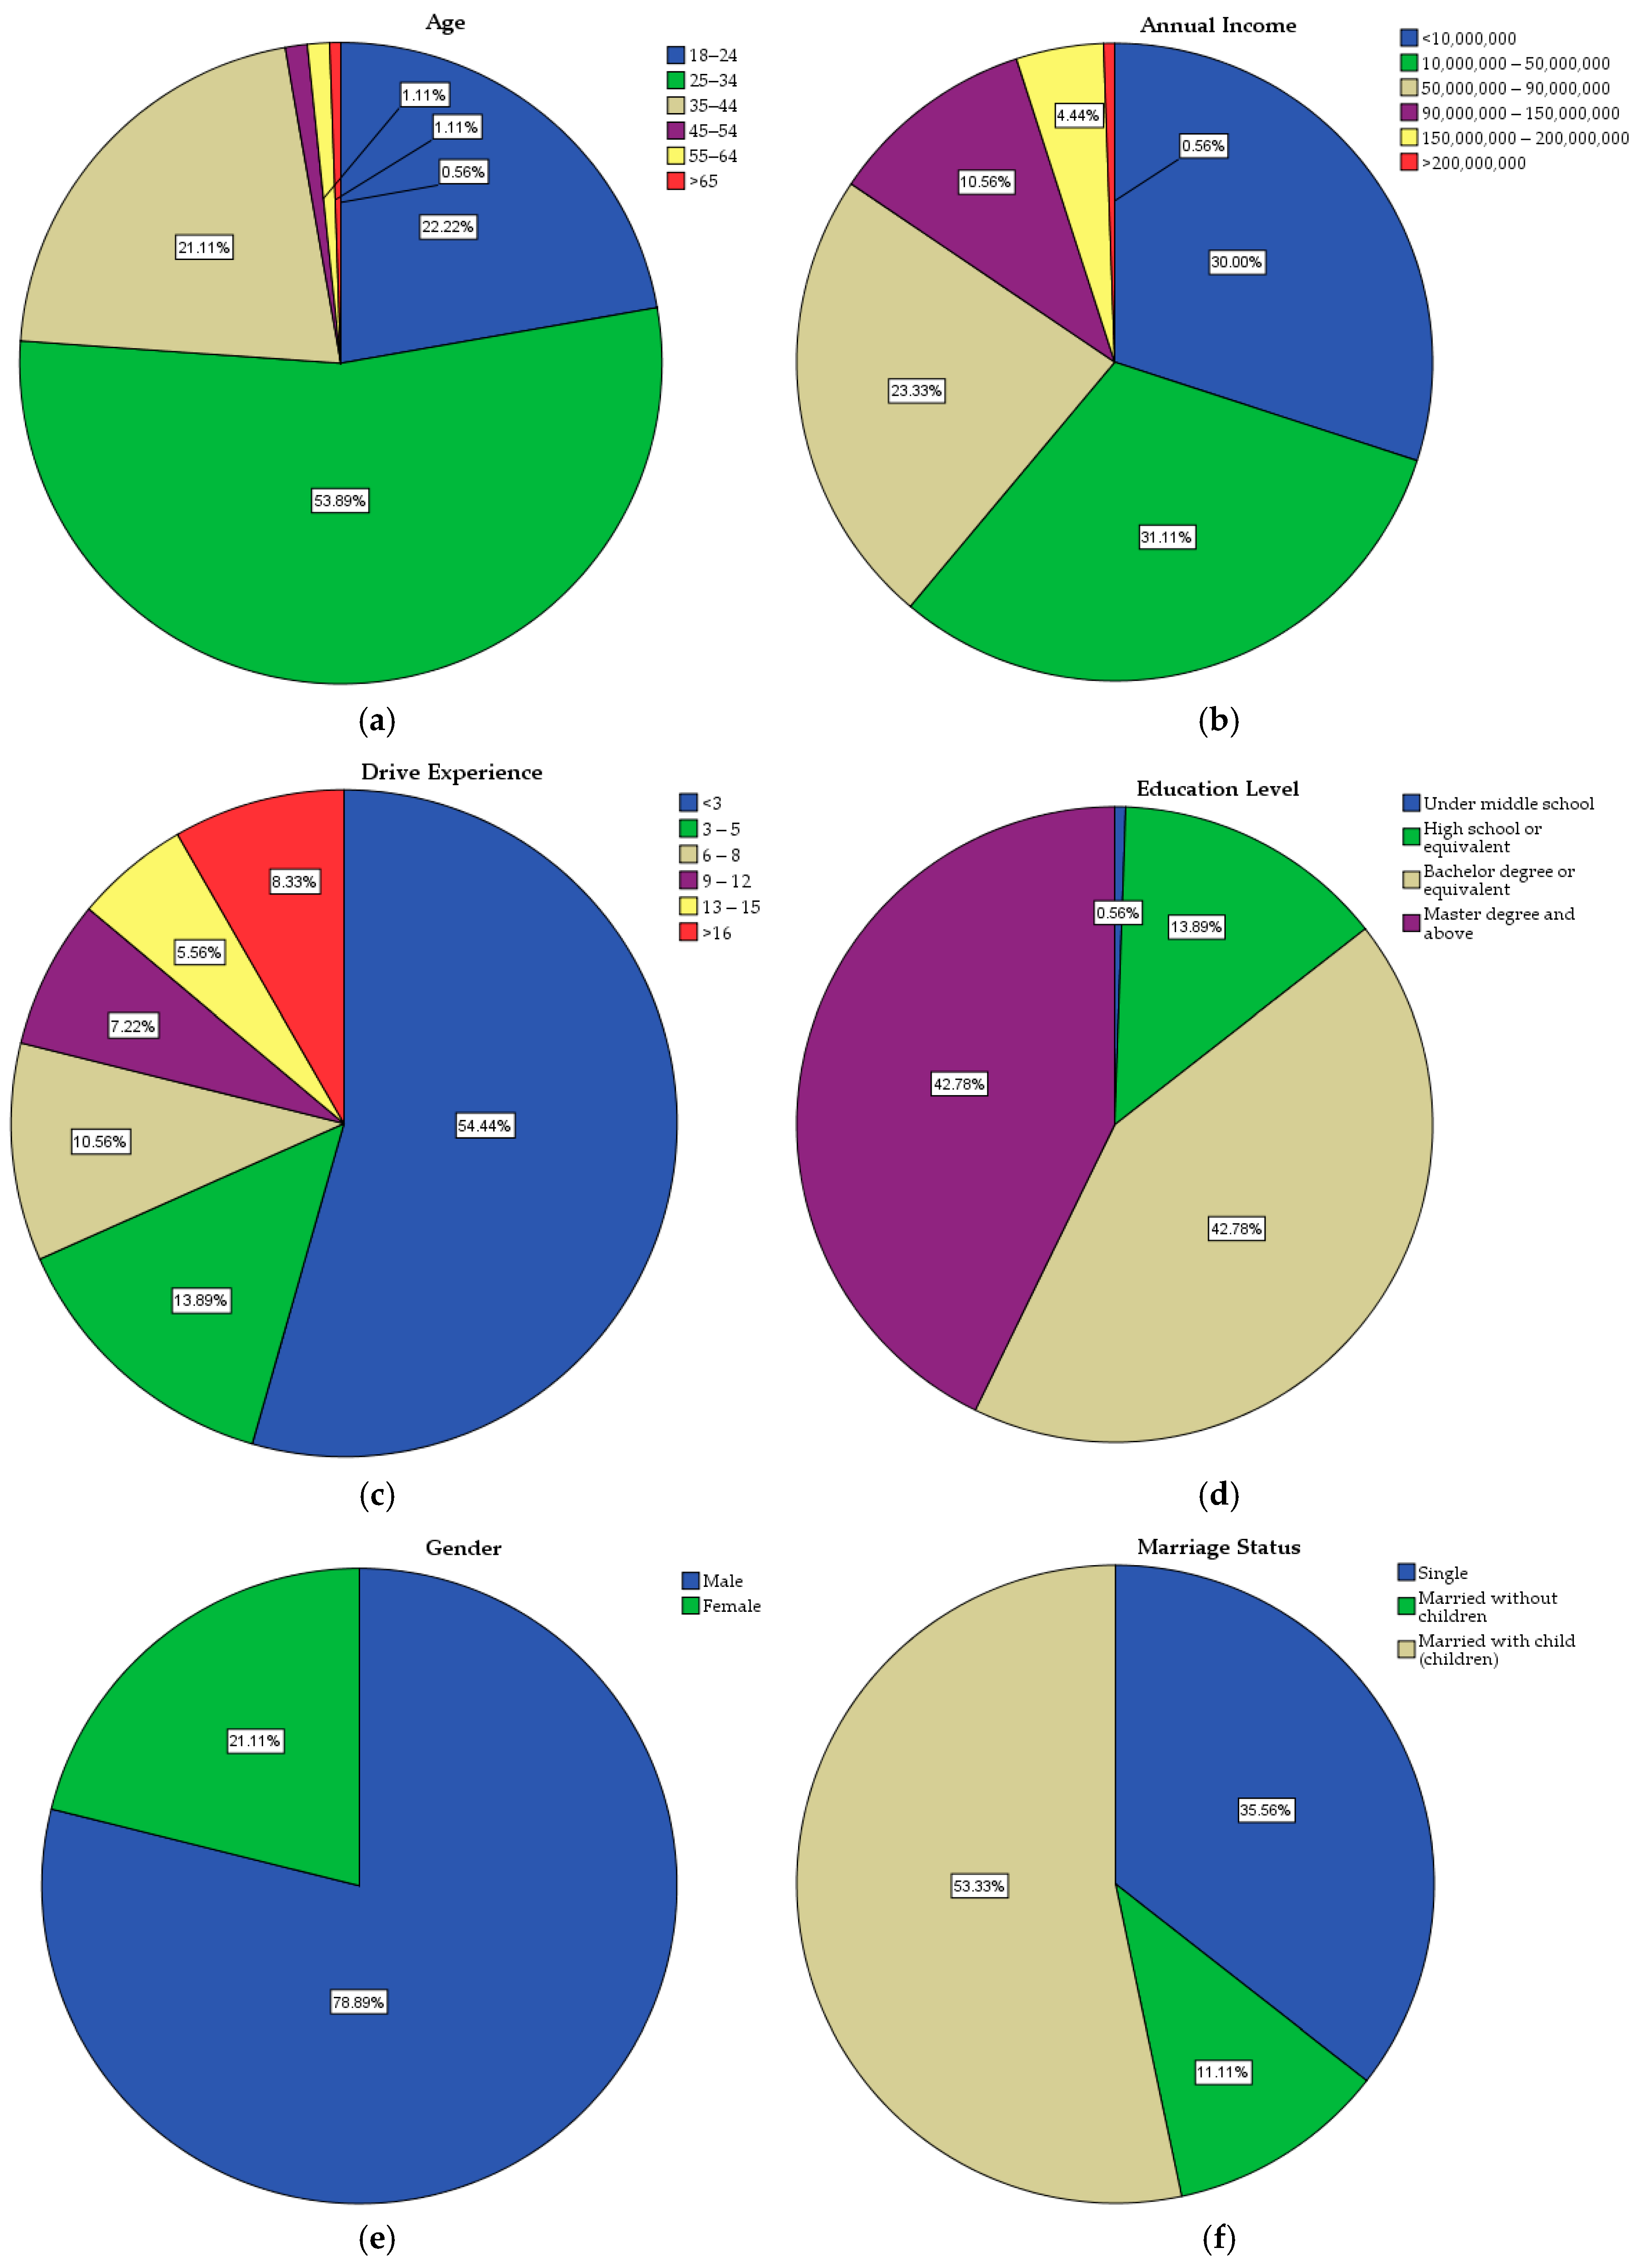
To confirm the composition and evaluate the background of the sample data collected, a detailed descriptive frequency analysis was conducted across nine collected sociodemographic parameters.
Figure 2 summarizes the complete demographic characteristics of the sample, detailing frequencies and valid percentages.
The empirical dataset derived from the 180 valid respondents exhibits a highly diversified socio-demographic composition across all nine operational parameters. Age stratification diagnostics (
Figure 2a) indicate that the dominant participation cohort is centered around the 25–34 age range (53.89%), followed by the 18–24 baseline tier (22.22%) and the 35–44 bracket (21.11%). Our approach effectively captures active consumer segments. Financial distributions (
Figure 2b) show a relatively stable cross-section of household incomes, with the primary income earners falling within the mid-to-lower brackets, consistent with the low absolute vehicle affordability baseline used in the descriptive statistics. Sample maturity is further supported by experience and educational metrics: 54.44% of respondents have less than three years of active driving experience (
Figure 2c), but the sample is highly educated, with 42.78% having a bachelor’s degree and 42.78% having a master’s degree or higher (
Figure 2d). Gender representation stands at 78.89% male and 21.11% female (
Figure 2e), reflecting typical automotive purchasing dynamics in the region. Geographically, while metropolitan Tashkent represents 26.67%, regional industrial hubs including Fergana (50.56%), Andijan (10.56%), and Samarkand (2.78%) and other regions are thoroughly integrated (
Figure 2h), providing a valid cross-provincial assessment of Uzbekistan’s modern transitional marketplace.
4. Results
This section of the paper presents the empirical results and a detailed interpretation of the data analysis.
4.1. Data Collection Process and Response Rates
After distributing about 1000 survey invitations to a targeted group of people across Uzbekistan’s densely populated cities like Tashkent, Fergana, Andijan, and Samarkand, 180 valid responses were received, giving an effective response rate of 18%.
4.2. Bias in Research and Common Method Variance
CMB was evaluated using a two-tiered validation workflow. Initially, a baseline Harman’s single-factor test was applied by forcing all 15 measurement items into an unrotated, single-factor exploratory factor analysis configuration using principal axis factoring. The results confirmed that no individual factor captured more than 50% of the total cumulative variance (see
Table 1). Thereby, CMB is not a pervasive threat to the study’s conclusions.
As displayed in
Table 2, the maximum generated full collinearity VIF across all tested model variations reached a peak of only 1.610, remaining safely below the conservative diagnostic ceiling threshold of 3.3 [
41]. Consequently, the potential threat of vertical or lateral multicollinearity, as well as systematic common method contamination, is substantially minimized, ensuring the structural independence and validity of the final path coefficients.
4.3. Data Screening and Treatment of Missing Data
Before the execution of the main statistical analyses, a thorough data screening procedure was performed to ensure the dataset’s quality. A descriptive examination of the 180 responses indicated a 0% incidence of missing data. This complete absence of missing values was systematically ensured by the survey platform’s “forced-response” mechanism, which mandated that participants complete each question before proceeding. Consequently, the statistical power of the ensuing regression analysis is preserved, and the findings are derived from the complete, intended sample.
4.4. Mean (M) and Standard Deviation (SD) of Variables
Table 3 shows the descriptive statistics of the collected data according to each given statement in the questionnaire.
4.4.1. Description for Purchase Intention of Electric Vehicles
The data analysis shows that a significant number of participants are very interested in buying an EV (M = 4.17, SD = 1.106). Moreover, they express a clear intention to switch to an EV within the next ten years (M = 4.34, SD = 1.074). Specifically, the highest degree of agreement was observed regarding the preference for EVs over ICE vehicles, contingent upon price parity (M = 4.45, SD = 1.015). This particular observation implies that, despite a high tendency for EV acquisition, the ultimate decision is influenced by the initial PC. Moreover, respondents perceive EVs as possessing superior technological appeal compared to conventional vehicles (M = 4.21, SD = 1.132). Statistically, the SD values for all items are just above 1.0. The observed dispersion of responses implies a diversity of consumer perspectives, a factor of considerable significance for the subsequent analysis. Furthermore, the descriptive statistics pertaining to PC reveal a notable financial consideration among the survey participants.
4.4.2. Description for Purchase Cost
Conversely to the high purchase intention ratings, the mean values for affordability and price reasonableness are considerably low. Most of the people surveyed stated that they could not afford an EV, given their current financial situation (M = 2.15, SD = 1.160), and disagreed with the idea that current EV prices in the Uzbek market are reasonable (M = 2.25, SD = 1.332).
Additionally, the majority of participants disagreed with the claim that EVs are not pricier than ICE vehicles (M = 2.85, SD = 1.482). This item had the highest SD in the set, which means that consumer opinions were more varied, ranging from strong disagreement to neutrality. This disparity probably means that a wider range of EV sectors has just been added to the market, thanks to the local auto manufacturer BYD Factory Uzbekistan and other EV importers and manufacturers, including premium cars and new, more affordable options. These findings show that, even though many people are interested, the high initial cost of buying the product is still a big barrier to widespread acceptance in Uzbekistan.
The descriptive statistical results for ChI show that the survey participants are generally dissatisfied with the current availability of EV charging stations in Uzbekistan.
4.4.3. Description for Charging Infrastructure
A significant majority of participants expressed dissatisfaction with the current availability of public charging stations (M = 2.20, SD = 1.198) and signaled that the existing locations are not yet convenient for the average user (M = 2.29, SD = 1.257). The data suggests that EV autonomy remains a critical obstacle for long-distance mobility. Respondents generally agreed with the negative statement that existing charging points are insufficient to support intercity or long-distance driving (M = 2.66, SD = 1.351). The SD values for all the items surveyed were greater than 1.0, indicating that dissatisfaction is the predominant feeling, but the responses varied considerably. This variance could be attributed to the geographical disparity between Tashkent and Fergana, which has experienced more accelerated infrastructure development, and the less developed regional provinces. These observations, taken together, emphasize that current perceptions of infrastructure do not yet correspond with the government’s ambitious electrification objectives.
4.4.4. Description for Government Incentives
The descriptive statistics for GI reveal a distinct divergence between consumer awareness and policy expectations. Respondents indicated a relative lack of detailed understanding concerning specific EV policies in Uzbekistan (M = 2.75, SD = 1.281), implying that despite the government’s active involvement, a communication gap persists between policy creation and public comprehension. Nevertheless, despite this knowledge deficit, the overall sentiment toward existing incentives is generally positive. Respondents indicated moderate satisfaction with the current incentive framework (M = 3.36, SD = 1.323). They also agreed that these programs positively impact the growth of the domestic EV industry (M = 3.45, SD = 1.291). The perceived accessibility of these advantages was rated neutrally (M = 3.13, SD = 1.299), implying that consumers might perceive the process of securing subsidies or tax credits as somewhat cumbersome. The highest mean within this domain was recorded for the belief that governmental support will establish EVs as the dominant market trend in the future (M = 3.58, SD = 1.316). This elevated score, coupled with the considerable SD across all items, substantiates that, despite individual experiences differing, there exists a shared confidence in the government’s capacity to facilitate the green transition in Uzbekistan.
A comparative examination of the mean scores for all study constructs, as presented in
Table 4, offers a concise summary of the prevailing sentiment within the current EV market in Uzbekistan. The results demonstrate a significant disparity between consumer expectations and market realities. The Purchase Intention construct produced the highest mean score (M = 4.29, SD = 0.834), signifying a robust and cohesive behavioral intent among respondents to accept electric mobility.
In contrast, the factors representing the current market environment, PC and ChI, received the lowest scores, with means of 2.417 (SD = 1.060) and 2.381 (SD = 1.111), respectively. These results confirm that high acquisition costs and inadequate charging networks remain the primary systemic barriers for Uzbek consumers. Meanwhile, the GI variable yielded a moderate mean score of 3.253 (SD = 1.062), indicating that although consumers acknowledge the beneficial impact of state assistance, a consistent “neutral-to-positive” expectation exists concerning more robust or readily available policy measures. Statistically, the PIEV variable demonstrated the smallest SD (<1.0), implying a strong agreement among participants concerning their inclination to adopt EVs. Conversely, all three independent variables presented SDs exceeding 1.0, which reflects a broader range of perspectives and experiences related to costs, infrastructure, and policy efficacy within the sample.
4.5. Reliability Test
The Cronbach’s alpha values for all constructs surpassed the generally accepted benchmark of 0.70 [
42]. Among the independent variables, GI achieved the highest reliability score of 0.874, followed closely by ChI at 0.846, both of which are considered highly satisfactory. The construct for PC produced the lowest Cronbach’s alpha value at 0.712, which, however, remains within the statistically acceptable range for exploratory research. In line with this, the dependent variable–PIEV–demonstrated a robust Cronbach’s alpha value of 0.772. The absence of any items necessitating removal to enhance the Cronbach’s alpha scores indicates that the initial survey’s construction and the data acquisition methods employed were executed with precision. These findings corroborate the stability and reliability of the measurement tools, thereby instilling a considerable level of assurance for the ensuing inferential statistical examination.
4.6. Normality
In this study, the Kolmogorov–Smirnov and Shapiro–Wilk tests were used to evaluate the distributional characteristics of the four main constructs being studied. According to the test, a significance value greater than 0.05 suggests that the data does not significantly differ from a normal distribution. As illustrated in
Table 5, the results for PIEV (
p < 0.001), PC (
p < 0.001), ChI (
p < 0.001), and GI (
p = 0.022) all did not exceed the 0.05 threshold, confirming their non-normality.
Due to the non-normal distribution inherent to these Likert-scale measures, parametric assumptions were violated. Consequently, non-parametric Spearman’s rank correlation () was employed for bivariate correlation analyses. Bootstrapping estimates robust standard errors and 95% bias-corrected and accelerated (BCa) confidence intervals, ensuring valid statistical inference without relying on normality assumptions.
4.7. Exploratory Factor Analysis (EFA)
The data met all statistical prerequisites for factor analysis. The KMO measure of sampling adequacy was 0.825, safely exceeding the recommended threshold of 0.70, indicating an excellent sample-to-item ratio. Bartlett’s Test of Sphericity was highly significant (
), confirming that the correlations among the items were sufficiently strong to warrant factorization. The PAF extraction yielded a clean four-factor solution based on the Kaiser criterion (eigenvalues > 1.0), which collectively accounted for 57.398% of the total cumulative variance. The rotated pattern matrix (
Table 6) revealed a clean, simple structure where all 15 items loaded strongly onto their designated factors.
4.8. Correlation Analysis
Since the study variables violated parametric normality assumptions, a non-parametric Spearman’s rank correlation coefficient (
) matrix was computed to examine the preliminary bivariate relationships among the constructs (
Table 7). The results indicated that all three independent variables have statistically significant, positive correlations with the dependent variable, PIEV. Specifically, GI displayed the strongest positive association (
), followed by PC (
) and ChI (
). Furthermore, the correlation coefficients among the independent variables ranged from 0.272 to 0.512. Because all inter-construct correlations fell safely below the conventional threshold of 0.70, multi-collinearity was not a concern, justifying the inclusion of all three predictors in the subsequent multiple linear regression model.
4.9. Hierarchical Multiple Linear Regression
A two-stage hierarchical multiple linear regression was conducted to evaluate the predictive power of the core independent variables while rigorously controlling for participant socio-demographic characteristics. To ensure full statistical compliance, all multi-category demographic variables were converted into binary dummy columns (k − 1) prior to model entry, with the baseline group designated as the reference category. To protect against violations of non-normal distribution of the data and matrix limitations, parameter estimations were computed using an empirical bootstrapping procedure based on 2000 simulation resamples to ensure stable estimation over potential non-normal matrix constraints.
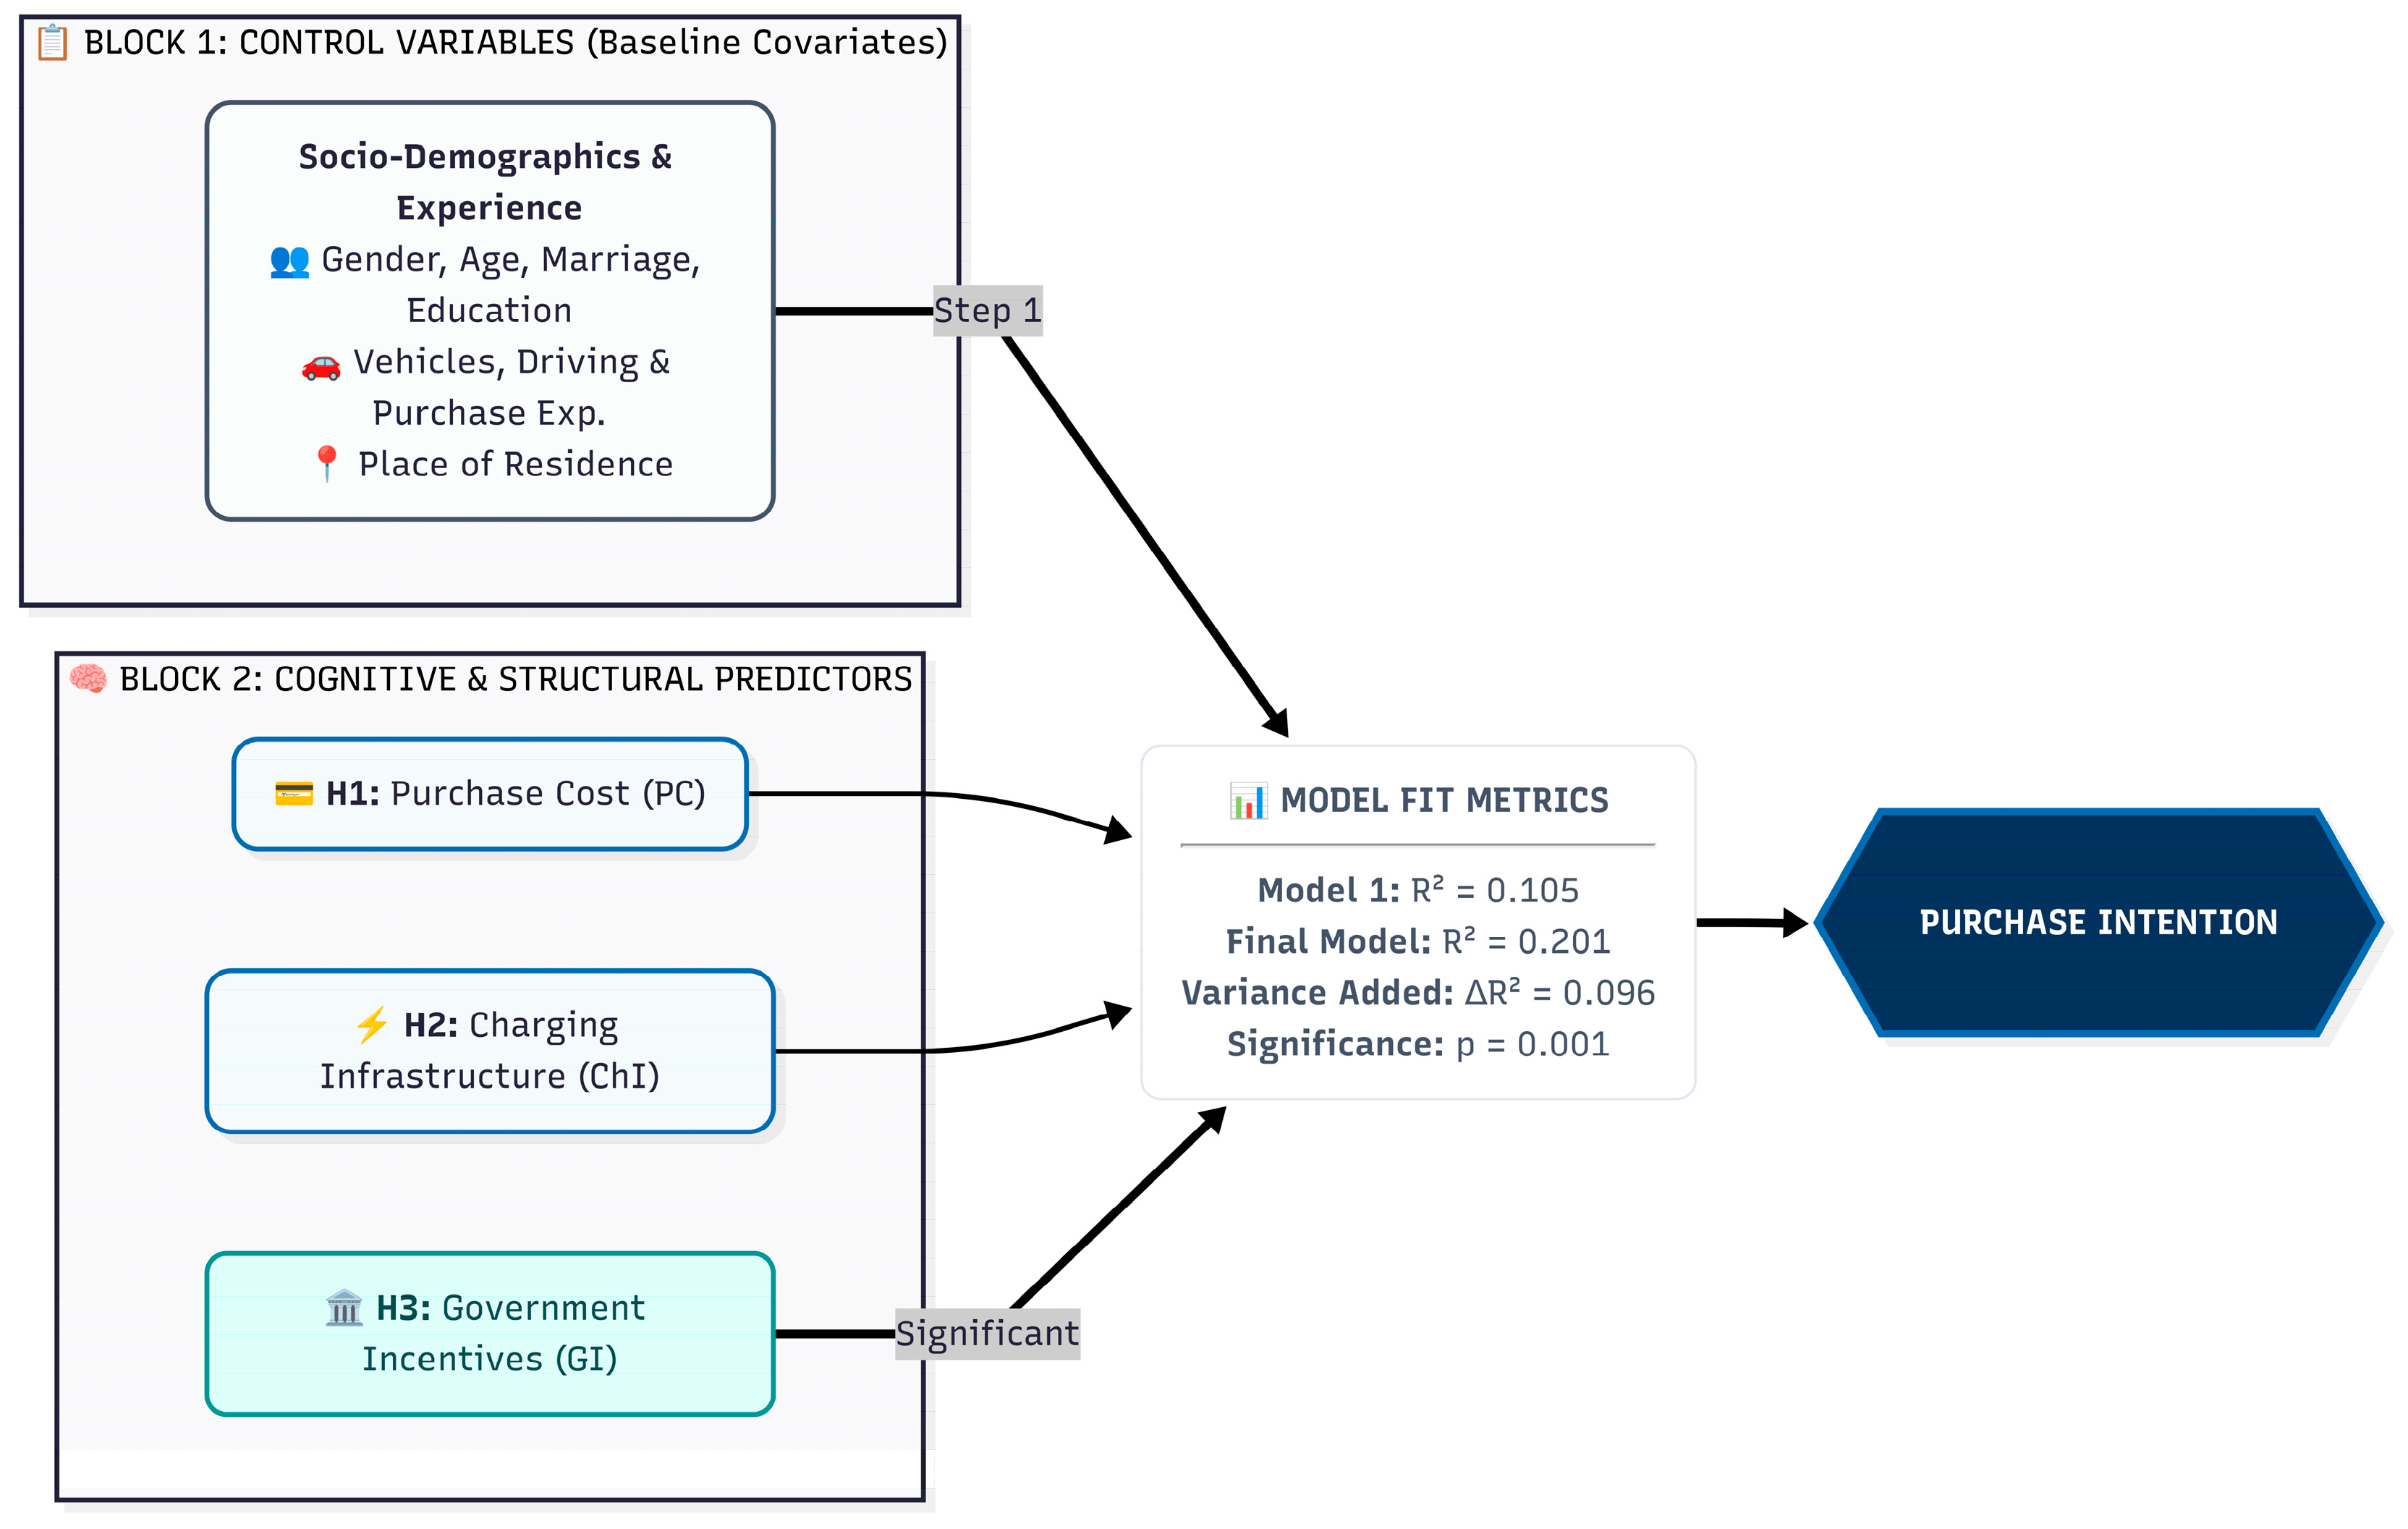
In Model 1, the baseline demographic dummy covariates were entered. This demographic baseline model accounted for a statistically non-significant proportion of variance in EV purchase intention ( = 0.105, F(29, 150) = 0.606, p = 0.943).
In Model 2, the primary independent constructs (PC, ChaI, and GI) were introduced. The inclusion of these variables resulted in a total variance explained of 20.1% ( = 0.201, Adjusted = 0.027, = 0.096, F(32, 147) = 1.153, p = 0.281; Model 2 Step F = 5.866, p = 0.001). While the global Model 2 framework does not achieve overall statistical significance (p = 0.281 from the results of ANOVA) due to the extensive number of socio-demographic control degrees of freedom, the stepwise addition of the structural predictors yields a highly significant incremental variance contribution ( = 0.096, p = 0.001).
Within the final fully adjusted model, and keeping in mind the non-significant global fit of Model 2 (p = 0.281), GI emerged as the sole statistically significant positive baseline predictor of PIEV (B = 0.266, = 0.339, p = 0.009, 95% BCa CI [0.073, 0.466]), supporting Hypothesis 3. This establishes that the specific directional contribution of GI on consumer intention shows localized resilience when accounting for baseline confounding socio-demographic factors, even though the combined system does not establish global predictive validity.
Conversely, PC (H1) (
B = 0.088,
= 0.112,
t = 1.189, Bootstrapped
p = 0.251, 95% BCa CI [−0.058, 0.245]) and ChI (H2) (
B = −0.068,
= −0.090,
t = −0.852, Bootstrapped
p = 0.475, 95% BCa CI [−0.247, 0.106]) both failed to achieve statistical significance, with their respective confidence intervals crossing zero. Therefore, Hypothesis 1 and Hypothesis 2 are not supported.
Table 8 gives a whole description of the outcomes.
Figure 3 and
Table 9 represent the main output from the analysis of the sample data. Contrasting these findings with global benchmarks reveals a distinct regional divergence. While Western and East Asian automotive studies consistently identify upfront purchase cost and charging network density as the primary significant drivers of adoption intent [
12,
43], these localized transactional variables drop out entirely within the Uzbek marketplace. Instead, consumer utility in Uzbekistan aligns with structural patterns observed only in heavily centralized transition economies, allowing it to bypass current physical and financial constraints. The overwhelming predictive variance of macro-level institutional interventions effectively absorbs traditional market barriers, proving that forward-looking state signaling can completely reshape conventional economic trade-offs.
5. Discussion
This study presents an integrative assessment of the factors influencing the EV adoption in Uzbekistan. The study developed a clear hierarchy of influence among the tested variables by thoroughly analyzing 180 verified survey responses. The empirical results suggest a more varied reality: in the current market in Uzbekistan, the GI is the primary catalyst for purchase intention, whereas the conceptual framework initially hypothesized that PC, ChI, and GI would all significantly drive consumer behavior towards EV purchase intention.
The statistical integrity of the survey instrument was confirmed in the initial phases of the study. Internal consistency was robust due to all structures being above the Cronbach’s alpha threshold value of 0.70. The GI scale exhibited the greatest reliability, as evidenced by a Cronbach’s alpha of 0.874, thereby suggesting a robust and consistent consensus among survey respondents regarding the influence of policy. Factor analysis yielded elevated KMO values and significant results from Bartlett’s Test (p < 0.001), thereby confirming the data’s suitability for subsequent structural modeling. These preliminary diagnostic procedures ensured that the resultant regression findings accurately represented authentic customer perspectives, rather than being artifacts of minor measurement inaccuracies.
The significant deviations from normal distribution revealed by the Kolmogorov–Smirnov and Shapiro–Wilk tests (p < 0.001) served as a vital methodological catalyst for this study’s analytical design. Traditional parametric assumptions are heavily restricted when evaluating subjective, Likert-scale responses in emerging market environments, meaning standard ordinary least squares significance tests frequently risk committing errors. By utilizing these distribution anomalies as a pivot point, the study implemented a robust, empirical bootstrapping approach with 2000 simulations. This resampling technique freed the regression model from rigid population normality constraints, deriving stable, distribution-independent standard errors and bias-corrected confidence intervals that ensure empirical reliability and robustness of the policy-driven paths discovered.
This investigation utilized hierarchical multiple linear regression to test three specific hypotheses. Rather than explaining a monolithic portion of consumer behavior, the adjusted hierarchical model accounted for a total of 20.1% of the variance in EV purchase intention ( = 0.201). Crucially, while the entry of baseline socio-demographic variables in Model 1 offered negligible explanatory value ( = 0.105, p = 0.943), the integration of the core structural constructs in Model 2 yielded a statistically significant incremental variance change ( = 0.096, p = 0.001). While the global combined model framework remains non-significant due to control degrees of freedom, the structural block itself introduces an isolated, authentic chunk of variance directly to PIEV once background demographic noise is controlled.
GI (H3—Supported): As the sole statistically significant predictor (
B = 0.266,
= 0.339,
p = 0.009, 95% BCa CI [0.073, 0.466]), GI substantially influences EV purchases. This finding aligns with recent presidential decrees advocating for tax and customs exemptions [
10]. Consequently, financial policy appears to be of greater significance than infrastructure at present.
PC and ChI (H1 and H2—Not Supported): It is noteworthy that neither PC (
B = 0.088,
= 0.112,
t = 1.189, Bootstrapped
p = 0.251, 95% BCa CI [−0.058, 0.245]) nor ChI (
B = −0.068,
= −0.090,
t = −0.852, Bootstrapped
p = 0.475, 95% BCa CI [−0.247, 0.106]) achieved statistical significance. From an econometric standpoint, the unexpected statistical non-significance of PC (
p = 0.251) and ChI (
p = 0.475) within the regression model is a clear manifestation of statistical absorption driven by partial collinearity. Spearman’s
(rho) correlation matrix (see
Table 7) shows that GI is strongly and significantly correlated with both ChI (
= 0.512,
p < 0.001) and PC (
= 0.272,
p < 0.001). When entered simultaneously into the hierarchical matrix, the variance component captured by macro policy expectations effectively absorbs the overlapping variance of the other two market predictors. This indicates that consumers in Uzbekistan do not view vehicle pricing or infrastructure convenience as isolated market attributes; instead, they process these factors through the lens of state-level management, viewing tax exemptions and institutional deployment as a single, unified policy signal.
A distinct early-adopter premium profile within the sampled cohort further explains this behavioral paradigm. Descriptively, the sample displays an exceptionally high cohesive willingness to adopt electric mobility (M = 4.29), yet simultaneously notes critical constraints regarding current vehicle affordability (M = 2.15) and public charging station convenience (M = 2.20). Rather than pointing to a contradiction, this baseline asymmetry reveals that the current Uzbekistan EV ecosystem is populated by classic technology enthusiasts. These pioneering consumers are structurally insulated from localized price sensitivities and immediate infrastructure deficiencies; their forward-looking intentions are anchored to technological novelty and macro policy momentum rather than the pragmatic constraints of current day-to-day utility.
5.1. Infrastructure Trajectories, Expectation Effects, and Demographic Resistances of the 45–54 Age Cohort
A powerful infrastructure expectation effect basically explains the persistent non-significance of ChI (p = 0.475). Bivariate descriptives uncover a striking paradox: while immediate satisfaction with current charging station convenience is critically low (M = 2.20), consumers exhibit an overwhelmingly high agreement score (M = 3.58) regarding item GI2.15 (“The support of Uzbek government policies makes me think that electric vehicles are the trend in the future”). This reveals that the physical charging realities visible on the street today do not influence early-stage consumer intent in Uzbekistan. Instead, the market is governed by forward-looking expectations; the public interprets aggressive state-level policy mandates and regulatory support as a guarantee that widespread infrastructure development is inevitable, thereby neutralizing current charging anxiety as a barrier to adoption.
A critical sociological finding uncovered by the hierarchical framework is the unique, statistically significant negative impact of the 45–54 age cohort dummy (B = −0.987, Bootstrapped p = 0.022, 95% BCa CI [−1.732, −0.134]) on EV purchase intentions. When systematically controlling for income tiers, education levels, and geographic locations, consumers within this specific age bracket demonstrated a significantly lower baseline inclination to accept electric mobility compared to the youngest consumer baseline (18–24 years old).
5.2. Limitations and Future Research
While this research offers substantial empirical support for the Uzbekistan market, certain constraints require consideration. Initially, despite the study’s concentration on three key influencing factors, it is recognized that EV adoption constitutes a complex process. Subsequent research endeavors should integrate supplementary variables, including environmental consciousness, social status signaling, and perceived risk, to achieve a more holistic understanding of consumer psychology. Secondly, a geographic disparity characterizes Uzbekistan’s developmental trajectory; the significant concentration of infrastructure and economic resources in only Tashkent, Fergana or Andijan may not fully reflect the purchasing intentions of consumers residing in less urbanized areas. Therefore, the results should be interpreted within the framework of urban and dynamic markets. Moreover, the dependence on a self-reported survey methodology introduces the potential for common method bias. Although our dual post hoc statistical diagnostics (Harman’s test and full collinearity VIFs) considerably minimize concerns about systematic variance contamination, these techniques reduce rather than eliminate the risk of bias, which persists as a limitation of cross-sectional survey designs.
Several research directions are suggested for future investigation. Future research endeavors should employ diversified sampling methods across various provinces of Uzbekistan to mitigate regional bias and improve the applicability of the results. Furthermore, although this study focused on socio-economic factors, it is essential to incorporate technical performance metrics, including battery lifespan, charging rates, and new EV technology introduction to the market, such as fuel cell EVs or battery swapping system applications to the EV ecosystem. As the Uzbekistan market develops over the next five to ten years, these technical aspects are expected to transition from secondary to primary factors influencing adoption. Finally, a comparative study between Uzbekistan and other Central Asian emerging economies would provide a crucial viewpoint on the regional scalability of existing EV policies and infrastructure approaches.
6. Conclusions and Policy Implications
This study established a controlled empirical framework to determine the core economic and structural determinants driving consumer EV purchase intentions in the rapidly expanding transition economy of Uzbekistan. By operationalizing three core theoretical paths—PC, ChI, and GI—within a quantitative design, this paper evaluated 180 verified respondent profiles across primary municipal hubs, including Tashkent, Fergana, Andijan, and Samarkand. Methodologically, the study advanced beyond traditional ordinary least squares assumptions by employing a robust, two-stage hierarchical multiple linear regression backed by an empirical bootstrapping procedure with 2000 resamples to neutralize severe data non-normality constraints.
The inferential and diagnostic outcomes of the modeling matrix yield three primary conclusions:
GI (H3—Fully Supported) emerged as the primary and sole statistically significant determinant driving purchase willingness (B = 0.266, Standardized = 0.339, t = 3.469, Bootstrapped p = 0.009). Because its bias-corrected and accelerated 95% confidence interval strictly excludes zero (95% BCa CI [0.073, 0.466]), macro-level policy instruments act as the singular core catalyst for electric mobility adoption in the current market.
PC (H1—Not Supported) failed to achieve statistical significance within the finalized regression model (B = 0.088, = 0.112, t = 1.189, Bootstrapped p = 0.251, 95% BCa CI [−0.058, 0.245]). This non-significance reflects a severe “affordability paradox” and statistical absorption. While descriptive diagnostics show a low absolute affordability mean (M = 2.15), the overarching predictive variance of policy expectations absorbs localized price sensitivities. Consumers evaluate upfront capital costs through the long-term stabilizing lens of state regulatory support.
ChI (H2—Not Supported) similarly lacked direct statistical significance regarding immediate adoption intentions (B = −0.068, = −0.090, t = −0.852, Bootstrapped p = 0.475, 95% BCa CI [−0.247, 0.106]). Bivariate indicators reveal a powerful “infrastructure expectation effect”, where critically low current satisfaction with public network convenience (M = 2.20) is effectively neutralized by high systemic trust in future policy vectors (M = 3.58 for item GI2.15). Adopters do not base their choice on the inadequate physical assets visible today but on the rational expectation that state mandates render widespread network expansion inevitable.
Furthermore, the hierarchical structure proved that while background socio-demographic controls explain negligible baseline variance in Model 1 ( = 0.105, p = 0.943), the structural block in Model 2 generates a highly significant incremental variance change ( = 0.096, Step = 5.866, p = 0.001), accounting for 20.1% of the total variance ( = 0.201). A unique demographic resistance was identified within the 45–54 age cohort (B = −0.987, Bootstrapped p = 0.022, 95% BCa CI [−1.732, −0.134]), signaling a culturally anchored behavioral inertia toward conventional combustion engines regardless of income tiers.
Policy Recommendations
Based on the empirical findings and active institutional frameworks in Uzbekistan, three targeted policy interventions are established:
Tiered preferential loan optimization: Under the 2026 State Program, the government caps preferential EV purchasing loans at 16% annually via state-budget compensation (against a 23% market average). To maximize capital efficiency and address the low affordability baseline (M = 2.15), the state treasury must progressively restrict these interest subsidies to entry-level and mass-market vehicle classifications, preventing fiscal benefits from accumulating exclusively within premium luxury segments.
Operational cost parity enforcement: To bridge the gap between low current infrastructure satisfaction (M = 2.20) and high policy trust (M = 3.58), the Ministry of Energy should aggressively publicize and execute its direct operational subsidy framework. Maintaining a fixed charging station electricity tariff of UZS 300 per 1 kWh shields consumers from market fluctuations, shifting utility evaluations toward long-term lifecycle financial parity.
Targeted fleet electrification and NDC alignment: The continuation of comprehensive customs duty and tax exemptions for EVs and charging equipment until 1 January 2028 provides a critical legislative window. Regulatory bodies should mandate the immediate electrification of high-utilization public transit networks, municipal fleets, and urban ride-hailing services. Synchronizing these industrial protections with commercial frameworks directly advances the emission reduction trajectories outlined in Uzbekistan’s updated NDC.
In summary, this paper quantifies these structural linkages, providing an empirical baseline for the emerging electric vehicle sector in Central Asia. The capacity of automakers and stakeholders to synchronize their logistical operations with these policy-driven customer expectations will remain the defining driver for the successful decarbonization of Uzbekistan’s national transportation system.