Article

A Quantitative Risk Assessment Framework for Electric Powertrain Systems of New Energy Vehicles Based on Layer of Protection Analysis (LOPA)

School of Emergency Management and Safety Engineering, China University of Mining and Technology-Beijing, Beijing 100083, China
*
Author to whom correspondence should be addressed.
World Electr. Veh. J. 2026, 17(6), 287; https://doi.org/10.3390/wevj17060287
Submission received: 28 April 2026 / Revised: 19 May 2026 / Accepted: 24 May 2026 / Published: 29 May 2026
(This article belongs to the Section Vehicle and Transportation Systems)

Abstract

In response to the frequent safety incidents associated with the core electrical systems (i.e., traction battery, charging system, and drive motor) of new energy vehicles (NEVs) and the lack of forward-looking quantitative risk assessment methods in existing detection and diagnostic technologies, this study introduces the Layer of Protection Analysis (LOPA) methodology into the field of NEV safety. Unlike qualitative methods (e.g., FMEA, FTA) or purely data-driven diagnosis, this work establishes a tailored semi-quantitative LOPA framework that defines scenario-specific independent protection layer (IPL) identification criteria and probability of failure on demand (PFD) assignment rules for NEV applications. Typical risk scenarios, including battery thermal runaway, electrical faults in charging systems, overheating of drive motors, and battery internal short circuits caused by mechanical abuse, are systematically analyzed in terms of their failure mechanisms and evolution processes. A tailored quantitative risk assessment framework is established and applied to conduct full-process risk evaluations for the four scenarios. The results indicate that, under the synergistic effect of multiple protection layers—including inherently safe design, basic process control systems, safety instrumented systems, and physical protection measures—the accident consequence frequencies of all scenarios are significantly lower than the tolerable risk thresholds. This verifies the applicability and effectiveness of the LOPA method in NEV safety analysis. The proposed quantitative framework provides a scientific basis for safety design optimization, identification of critical protective elements, and operation and maintenance strategy formulation throughout the lifecycle of NEVs. Furthermore, the limitations of data portability from process industries are discussed, and sensitivity analyses are conducted to confirm the robustness of the conclusions.

1. Introduction

Driven by global climate change mitigation and the “dual carbon” goals, the new energy vehicle (NEV) industry has become a strategic direction for the transformation and upgrading of the global automotive industry [1]. By the end of 2025, the penetration rate of NEVs in China’s domestic market had historically exceeded 47.9% [2,3]. However, behind the rapid expansion of the industry, the highly complex technical integration and severe operating conditions of NEV power systems have led to critical safety accidents such as fires and thermal runaways [4,5,6,7].
Significant differences exist between NEVs and conventional fuel vehicles in terms of structure, batteries, and electronic control systems [8]. Extensive research has been conducted on the safety detection and fault diagnosis of the core electrical systems [9,10]. For power batteries, detection is performed at the cell, module, and pack levels [11]. Charging systems are mainly tested for output voltage accuracy and current ripple [12]. Drive motor detection covers rotors, stators, and overall performance [13,14,15]. Academic studies have explored battery fault diagnosis via knowledge graphs and improved Boosting algorithms [16], state-of-health (SOH) assessment using ultrasonic acoustic parameters [17], and fault library-based analysis combined with FMEA and FTA [18]. Internationally, model and entropy-based multi-fault diagnosis strategies [19], OBD systems, and machine learning algorithms have also been investigated [20,21].
Layer of Protection Analysis (LOPA), a simplified semi-quantitative risk assessment method, has been widely used in high-risk process industries such as petrochemicals and rail transit [22,23]. However, its application in the NEV field, particularly for risk quantification and protection layer effectiveness evaluation of the core electrical systems, remains in its early stages [24,25].
Therefore, this study introduces LOPA into the NEV fault diagnosis domain. Typical risk points and scenarios of the core electrical systems are identified. Identification criteria for independent protection layers (IPLs) and a probability of failure on demand (PFD) assignment framework are established to determine whether the risk is within the tolerable range. This approach reduces the subjectivity of qualitative methods and addresses the lack of forward-looking quantitative risk assessment in current diagnostic technologies [26], thereby providing a standardized theoretical reference and quantitative decision-making basis for safety design optimization, identification of critical protective elements, and formulation of operation and maintenance strategies throughout the NEV lifecycle.
However, most existing studies focus on fault detection and diagnosis using qualitative or data-driven approaches. Methods such as FMEA and FTA can identify failure modes but cannot quantify residual risk or evaluate the effectiveness of multiple protection layers. Machine learning methods rely on historical fault data and lack forward-looking quantitative risk assessment capabilities. Therefore, a semi-quantitative method like LOPA, which can assess the combined effect of independent protection layers and provide a numerical risk estimate, is needed for NEV safety analysis.

2. Common Risks of New Energy Vehicles

2.1. Power Battery System

The power battery is the core component for energy storage and power supply in new energy vehicles (NEVs) [27,28]. Currently, mainstream NEV models are predominantly equipped with lithium-ion power batteries, which consist mainly of battery cells, battery modules, a battery management system (BMS), and an enclosure [29]. The operation of the battery involves complex electrochemical and thermodynamic reactions, leading to prominent safety hazards.
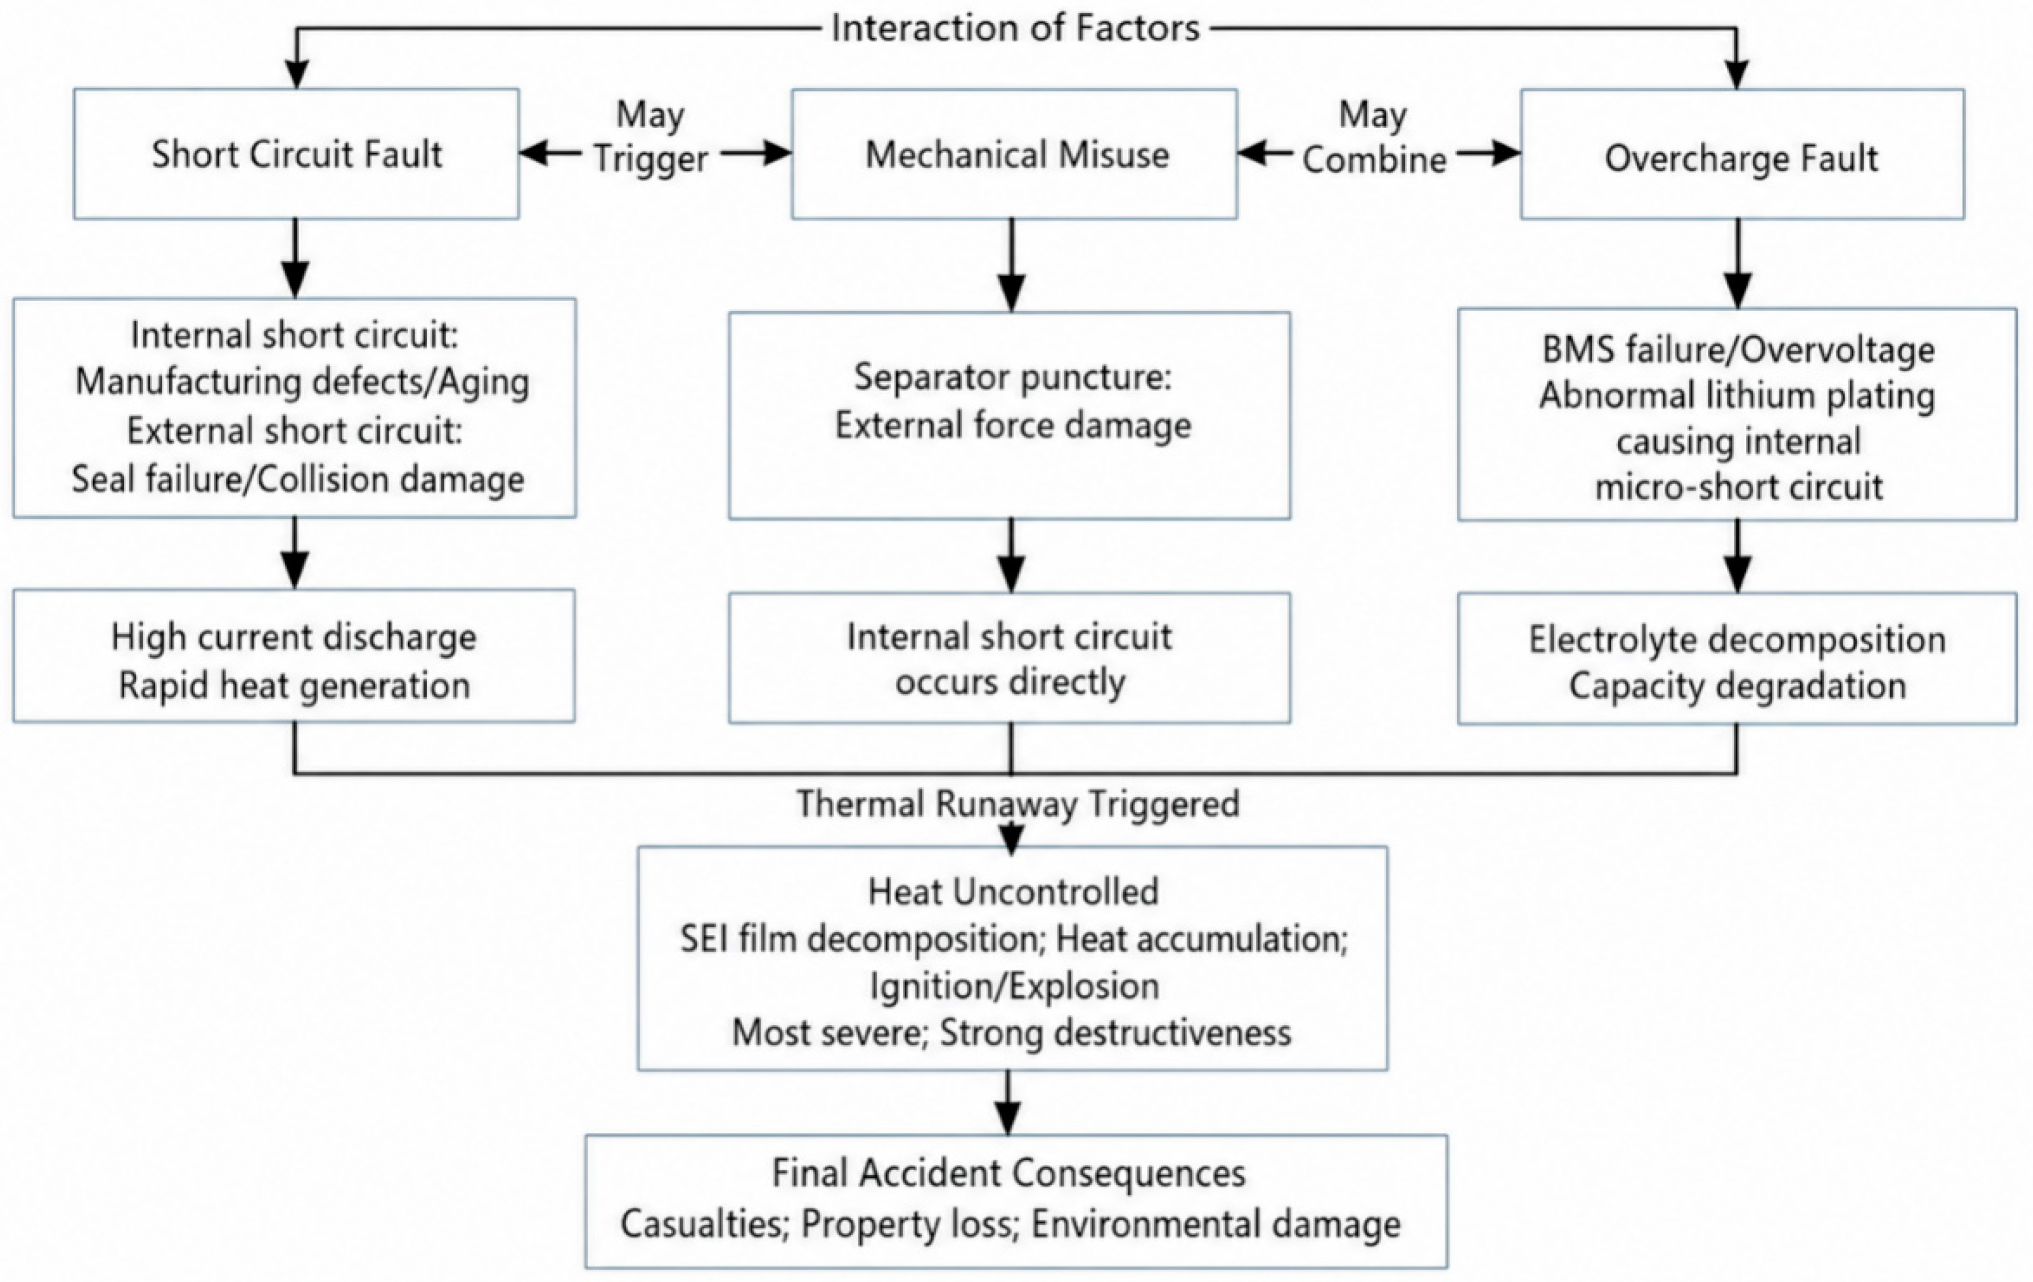
Safety hazards associated with power batteries are primarily concentrated in three categories, thermal runaway, short-circuit faults, and overcharge faults, which are interrelated and mutually inducing. Thermal runaway is typically triggered by mechanical abuse, electrical abuse, or thermal abuse, either individually or in combination [30,31]. Once the critical temperature is exceeded, the solid electrolyte interphase (SEI) film decomposes, initiating an exothermic chain reaction that results in thermal propagation and the release of toxic gases, representing the most lethal failure mode [32,33]. Short-circuit faults are classified into internal and external short circuits. Upon formation of a low-resistance loop, high-current discharge and rapid heat accumulation occur, which readily induces battery thermal runaway [34,35]. Overcharge faults are mostly caused by charging system anomalies, BMS failure, or cell inconsistency. Lithium dendrites precipitate on the anode, triggering micro-short circuits, causing irreversible damage to the cells and forming a vicious cycle that indirectly leads to thermal runaway [36]. The interrelationships and characteristics of the three types of faults are illustrated in Figure 1.

2.2. Charging System

The charging system of new energy vehicles (NEVs) is an integrated system in which the charging pile, on-board controller, and power battery pack work cooperatively. It achieves safe charging through AC/DC conversion, parameter negotiation, and battery management system (BMS) monitoring, while a standardized interface and multiple protection mechanisms construct a millisecond-level safety protection network [37].
The potential risks of this system mainly fall into three categories: electrical safety, mechanical physical, and environmental impacts. Electrical safety risks primarily originate from short circuits, leakage, overvoltage, overcurrent, and insulation failure of components, which may easily lead to body electrification, fire, and electric shock. Mechanical physical risks are mostly caused by component wear and external damage. Frequent plugging/unplugging, collisions, and other behaviors can result in terminal deformation, interface cracking, and cable damage, leading to poor contact, leakage, and short circuits. Environmental risks include, for example, high and low temperature extremes accelerating component aging, causing cable brittleness and seal failure; rainwater in coastal high-humidity areas causing metal oxidation; and dust/debris entering the charging interface, which may also cause poor contact and short circuits [38,39]. The major safety hazards of the charging system are summarized in Table 1.

2.3. Drive Motor

The drive motor is the core power component of new energy vehicles (NEVs), and its performance directly determines the vehicle’s power performance, economy, and reliability [40]. The drive motor system consists of a stator, rotor, windings, housing, resolver, cooling system, bearings, and other components. The motor controller unit (MCU) is responsible for power conversion and torque control. During driving, electrical energy is converted into torque output; during braking or coasting, energy recovery can be achieved [41].
Common fault types of the drive motor are mainly classified into three categories, electrical faults, thermal management faults, and mechanical faults, as shown in Table 2. Electrical faults are dominated by winding short circuits, which can be triggered by insulation aging, overloading, etc., leading to motor burnout [42]. Thermal management failures cause motor overheating and accelerated insulation aging [43]. Mechanical faults mainly include bearing wear and rotor imbalance, resulting in abnormal noise, vibration, and in severe cases, motor damage [44].

3. Layer of Protection Analysis

3.1. Method Overview

Layer of Protection Analysis (LOPA) provides a methodology for identifying scenario risks and comparing them with tolerable risk levels, thereby determining whether existing safety measures are adequate or whether additional safety measures are required [45,46,47]. As a semi-quantitative risk assessment method, LOPA reduces the subjectivity inherent in qualitative methods while being more feasible to implement than fully quantitative risk assessment methods. Consequently, it has been increasingly applied in risk assessment practices [45,46,47]. The main characteristics of LOPA are as follows:
(1)
Semi-quantitative nature: Unlike Hazard and Operability Analysis (HAZOP), which relies entirely on empirical judgment, or quantitative risk assessment (QRA), which requires large amounts of precise data, LOPA exhibits good operability in engineering practice.
(2)
Scenario orientation: LOPA focuses on explicit accident chains, enabling the identification of logical relationships among intermediate events, safety measures, and accident consequences.
(3)
Protection layer perspective: LOPA emphasizes the independence and effectiveness of multiple protection layers, highlighting the quantitative contribution of each layer to risk reduction.

3.2. Analysis Steps and Calculation Method

3.2.1. Basic Steps

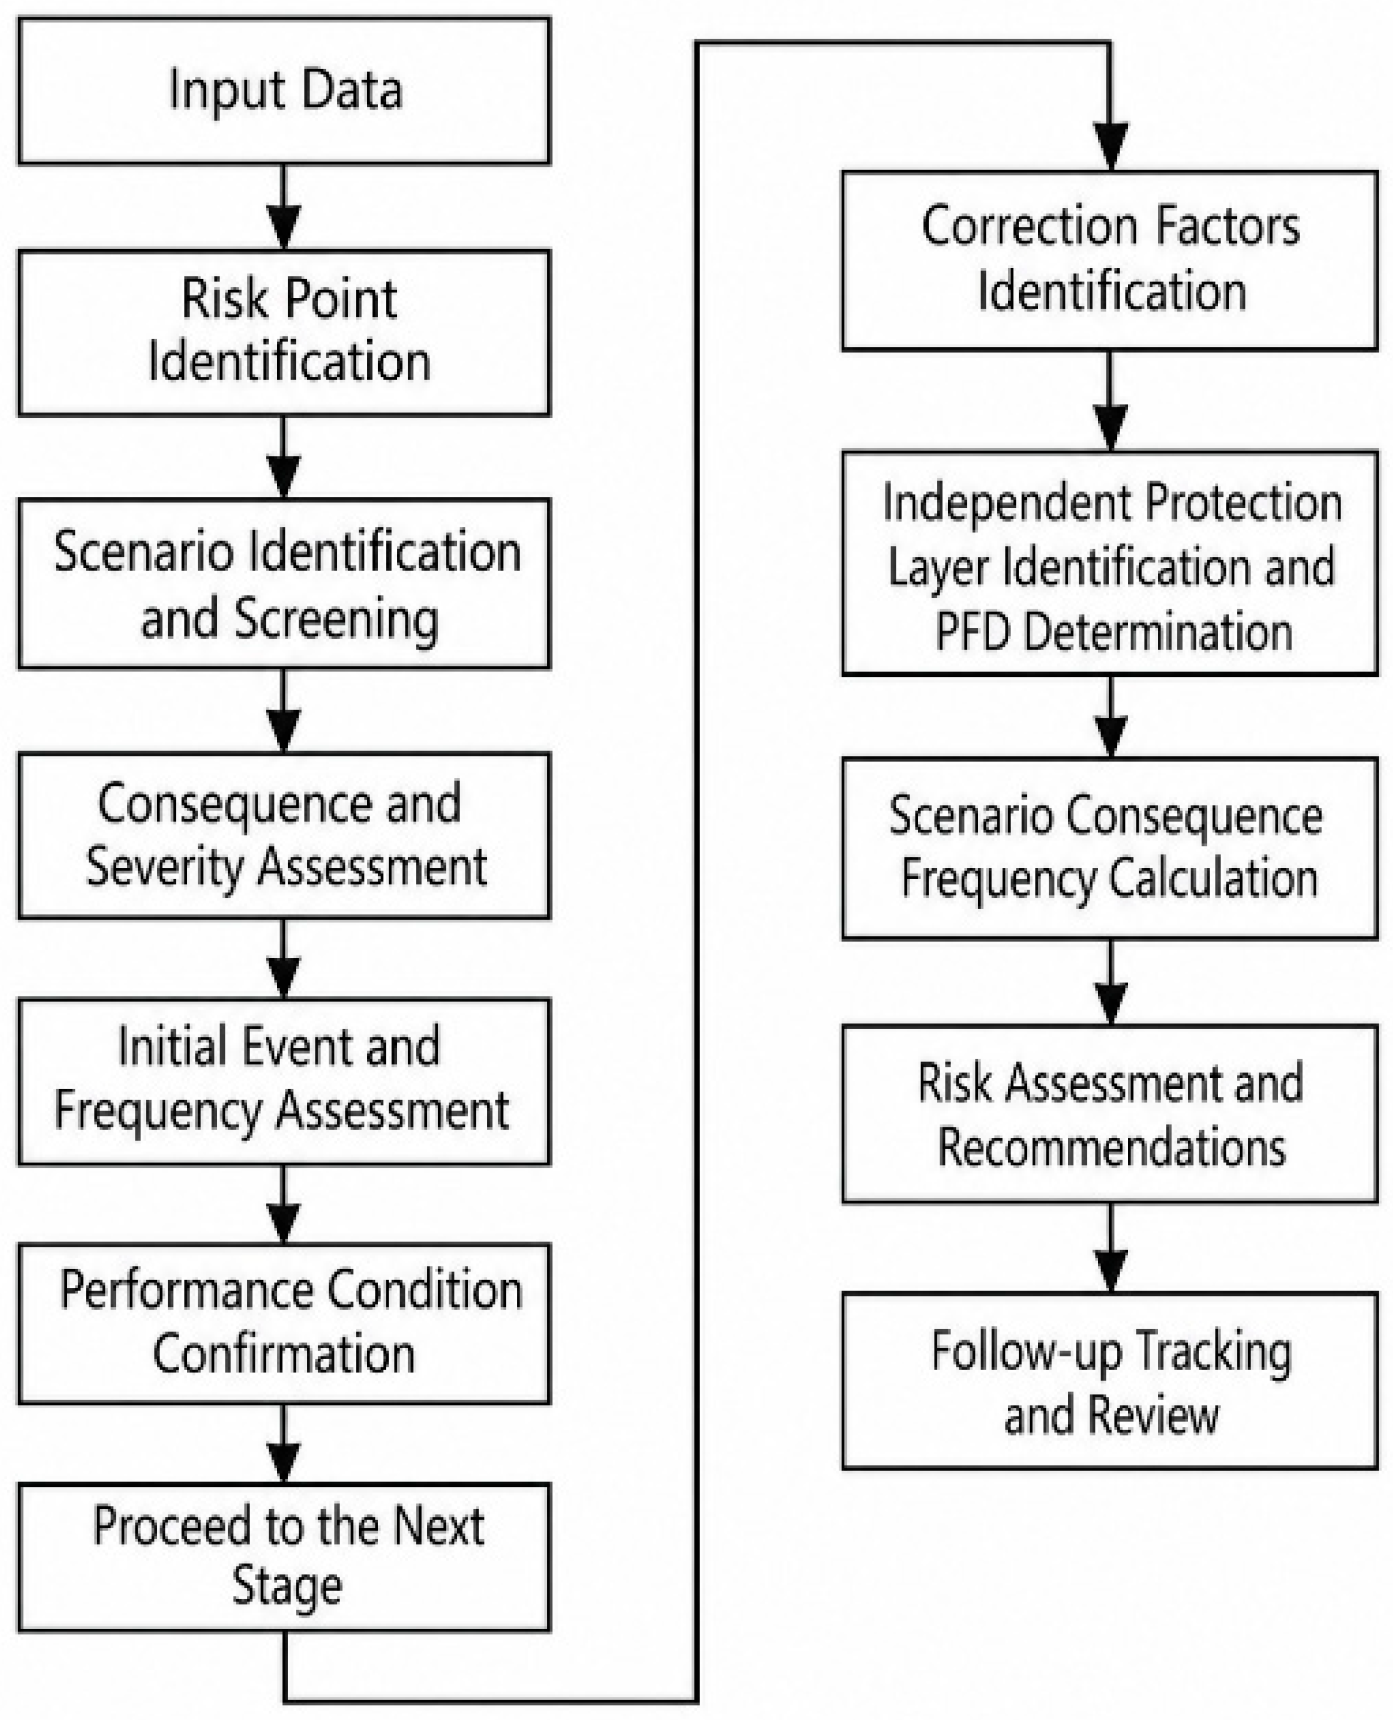
The basic steps of Layer of Protection Analysis (LOPA) include risk point identification, scenario identification and screening, consequence severity assessment, initiating event frequency determination, enabling condition confirmation, conditional modifier confirmation, independent protection layer (IPL) identification and probability of failure on demand (PFD) assignment, calculation of the mitigated consequence frequency, and risk evaluation and recommendations [48,49], as illustrated in Figure 2.

3.2.2. Calculation Method

The single-scenario analysis method is the most common and standard approach in LOPA, which can be used to calculate the risk of an independent accident consequence chain [50,51]. The calculation formula is as follows:
f n C = f n 1 × P n E × P n C × j = 1 J P F D n j ,
The meanings of the symbols in the formula are given in Table 3:
In the calculation formula, if there is no enabling event or enabling condition, P n E is taken as 1. If no external factors interfere, the conditional modifier P n C is also taken as 1 [52,53]. PFD values are derived from national standards and industry common values. Typical PFD values for independent protection layers in the NEV safety testing industry are listed in Table 4.
Note on data portability: The initiating event frequencies and PFD values listed in Table 4 are primarily derived from the process industry standard GB/T 32857-2025 [48], which is based on chemical plant equipment statistics. Directly applying these values to automotive components (BMS, OBC, MCU) introduces data portability uncertainties, as the automotive domain has different failure mechanisms, operational conditions, and safety integrity requirements (e.g., ISO 26262 functional safety standard). To address this limitation, we conduct a sensitivity analysis for each scenario in Section 4, varying the key parameters (initiating event frequency and critical PFDs) by ±1 order of magnitude to assess the robustness of the risk conclusions. Additionally, we discuss the necessity of establishing an automotive-specific LOPA database in the conclusions.

4. Application of LOPA in NEV Design

The specific application of Layer of Protection Analysis (LOPA) in the design of new energy vehicles (NEVs) [54] focuses on four typical risk scenarios: the power battery, the charging system, and the drive motor. Following the procedures described in the previous section, calculations are performed to determine whether the existing protection measures can reduce the risk of each scenario to an acceptable level. Based on the calculated results, a decision is made regarding whether additional protection layers should be added to the design.

4.1. LOPA for the Battery Thermal Runaway Scenario

(1)
Risk point identification and scenario identification
Risk point: Battery thermal runaway induced by overcharging.
Scenario: Charging system anomaly or BMS failure leads to battery overcharging, which subsequently triggers SEI film decomposition, thermal propagation, release of toxic gases, and fire/explosion.
(2)
Initiating event and frequency determination
The initiating event is either a charging system anomaly (output voltage/current of the charging pile exceeding the design threshold) or BMS failure. The electronic control system is among the most failure-prone subsystems in NEV powertrains. Referring to the frequency range of “BPCS instrument control loop failure” in Appendix A.13 of the cited standard GB/T 32857-2025 [48] (10−2~1 event/year), the initiating event frequency is taken as:
f I = 1 × 10 1 / year ,
(3)
Enabling condition confirmation
This scenario does not involve any enabling conditions (e.g., reactor utilization probability). The enabling condition probability is taken as 1.
(4)
Conditional modifier confirmation
This scenario does not involve conditional modifiers such as ignition probability or personnel exposure probability. The conditional modifier is taken as 1.
(5)
IPL identification and PFD assignment
Based on the typical PFD values in Appendix A.8 of GB/T 32857-2025, the following independent protection layers (IPLs) are identified:
IPL1 (Inherently safe design): The battery pack adopts LiFePO4 cells, which have a higher thermal runaway trigger temperature than NMC cells, and aerogel insulation layers are placed between cells. According to industry test data under overcharge conditions, the probability that this design feature fails to prevent thermal propagation (i.e., the PFD of the inherently safe design) is taken as 1 × 10⁻². This PFD represents the chance that the inherent safety feature does not mitigate the consequence when challenged, not the cell’s baseline failure rate.
IPL2 (Basic process control system, BPCS): BMS monitors voltage and temperature in real time. According to the typical PFD of BPCS in the standard (1 × 10⁻¹), PFD2 = 1 × 10⁻¹.
IPL3 (Critical alarm and human response): The dashboard alarm alerts the driver. The typical PFD for “human action (10 min response)” in the standard is 1 × 10⁻¹, so PFD3 = 1 × 10⁻¹.
IPL4 (Safety instrumented system, SIS): The high-voltage interlock loop (HVIL) is an independent hardware. SIL1 corresponds to a PFD range of [1 × 10⁻², 1 × 10⁻¹], PFD4 = 1 × 10⁻².
IPL5 (Post-release physical protection): Aerogel thermal insulation layer between cells. The typical PFD for post-release physical protection in the standard is 1 × 10⁻², PFD5 = 1 × 10⁻².
Independence analysis of IPLs: IPL2 (BMS) and IPL3 (dashboard alarm) share the same sensor signals (voltage, temperature) and power supply from the BMS. Therefore, they are not fully independent; a common failure in the BMS could disable both protection layers simultaneously. According to the reviewer’s suggestion, we merge IPL2 and IPL3 into a single composite layer with PFD23 = max(PFD2, PFD3) = 1 × 10⁻¹. The other IPLs (IPL1, IPL4, IPL5) are independent (different hardware, no shared power or logic). The total number of effective IPLs after merging is 4.
(6)
Consequence frequency calculation using the single-scenario method
Applying the standard formula:
f n C = f n 1 × P n E × P n C × j = 1 J P F D n j = 1 × 10 1 × 1 × 1 × 1 × 10 2 × 1 × 10 1 × 1 × 10 2 × 1 × 10 2 = 1 × 10 8 / year ,
(7)
Risk evaluation and recommendations
The calculated consequence frequency of 1 × 10⁻⁸ per year is far below the tolerable risk frequency of 1 × 10⁻⁶ per year. Therefore, the risk is acceptable. The independence analysis highlights that future NEV designs should ensure physical and signal independence between BPCS and alarming functions to achieve higher risk reduction.
Sensitivity analysis for battery thermal runaway scenario: To evaluate the impact of data portability from process industries, we vary the initiating event frequency ( f n 1 ) and the PFD of the merged IPL2&3 (the most uncertain layer) by ±1 order of magnitude. When f n 1 is reduced to 1 × 10⁻²/year or increased to 1 × 100/year, the mitigated consequence frequency ranges from 1 × 10⁻⁹/year to 1 × 10⁻⁷/year. When the merged PFD23 is reduced to 1 × 10⁻² or increased to 1 × 100, the consequence frequency ranges from 1 × 10⁻⁹/year to 1 × 10⁻⁷/year. In all cases, the resulting frequencies remain below the tolerable risk threshold of 1 × 10⁻⁶/year, confirming that the conclusion of acceptable risk is robust despite data uncertainties.

4.2. LOPA for the Charging System Electrical Fault Scenario

(1)
Risk point identification and scenario identification
Risk point: Electric shock or fire caused by leakage current from the charging pile.
Scenario: Internal insulation aging or moisture ingress in the charging pile generates leakage current, which may lead to personal electric shock or ignition of surrounding combustible materials.
(2)
Initiating event and frequency determination
Faults in public charging piles are not uncommon, and insulation- or grounding-related issues constitute a notable proportion of detected failures. This scenario considers leakage current as the initiating event. Referring to the frequency range for “pump seal failure” (10−2~10−1 events/year) in Appendix A.13 of GB/T 32857-2025, the initiating event frequency is taken as:
f I = 3 × 10 2 / year ,
(3)
Enabling condition confirmation
This scenario does not involve any enabling conditions. The enabling condition probability is taken as 1.
(4)
Conditional modifier confirmation
This scenario involves ignition probability. The electric spark generated by leakage current may ignite combustible materials such as vehicle interior trim and the plastic housing of the charging pile. According to Appendix A.6 of GB/T 32857-2025, the typical ignition probability for electrical sparks in non-hazardous areas is in the range of 0.01 to 0.1; a conservative value of 0.1 is adopted herein. Regarding personnel exposure probability, during charging, the driver is typically outside the vehicle but pedestrians or maintenance personnel may be present near the charging pile. Per the typical exposure probability range (0.1 to 0.5 for semi-confined spaces) suggested in Appendix A.6 of GB/T 32857-2025, a conservative value of 0.5 is adopted. The lethality is taken as 1, as once an electric shock or fire occurs, the probability of fatality is considered high. Per Appendix A.8 of GB/T 32857-2025, the fatality probability for severe electric shock or fire scenarios is typically taken as 1. The sensitivity analyses in subsequent sections confirm that even if these conditional probabilities vary within one order of magnitude, the conclusion of acceptable risk remains robust. The comprehensive conditional modifier is:
P C = 0.1 × 0.5 × 1 = 5 × 10 2 ,
(5)
IPL identification and PFD assignment
Based on the typical PFD values in Appendix A.8 of GB/T 32857-2025, the following independent protection layers (IPLs) are identified:
IPL1 (Inherently safe design): The charging interface adopts a standardized anti-misinsertion design, and the housing has an IP54 or higher protection rating to prevent ingress of rain and dust that could degrade insulation performance. Referring to the PFD range for inherently safe design [1 × 10⁻⁶, 1 × 10⁻¹], PFD1 = 1 × 10⁻¹.
IPL2 (Basic process control system, BPCS): The on-board charger (OBC) monitors charging current and voltage in real time. When abnormal fluctuations are detected, it dynamically adjusts power or issues an alarm. The OBC belongs to the BPCS. The typical PFD of BPCS in the standard is 1 × 10⁻¹, so PFD2 = 1 × 10⁻¹.
IPL3 (Critical alarm and human response): When the charging system detects a leakage anomaly but has not yet reached the hazardous threshold, an alarm is activated via the charging pile screen or a mobile app, reminding the user to stop charging and inspect. The typical PFD for “human action (10 min response)” in the standard is 1 × 10⁻¹; thus, PFD3 = 1 × 10⁻¹.
IPL4 (Safety instrumented system, SIS): The residual current device (RCD) is independent of the OBC controller. When the leakage current exceeds 30 mA, it can cut off the charging circuit within milliseconds. The RCD is a pure hardware safety device with a SIL1 safety instrumented function. Per Appendix A of GB/T 32857-2025 [48], the typical PFD range for SIL1 is 10−2 to 10−1; a conservative value of 5 × 10⁻³ is adopted for the RCD within this range. Thus, PFD4 = 5 × 10⁻³.
IPL5 (Post-release physical protection): A flame-retardant cover is installed at the charging interface to prevent flame propagation into the charging pile and vehicle in case of fire. The typical PFD for post-release physical protection (e.g., fire dikes, refractory materials) in the standard is 1 × 10⁻²; thus, PFD5 = 1 × 10⁻². This scenario focuses on electrical safety faults (leakage, overvoltage). Communication handshake failures between the EV and charger typically result in charging interruption rather than direct safety consequences. However, if such failures cause the BMS to lose control of the charging process, they may indirectly contribute to overcharge, which is already covered in the battery thermal runaway scenario via BMS failure modeling.
(6)
Consequence frequency calculation using the single-scenario method
Applying the standard formula:
f n C = f n 1 × P n E × P n C × j = 1 J P F D n j = 3 × 10 2 × 5 × 10 2 × 1 × 1 × 10 1 × 1 × 10 1 × 1 × 10 1 × 5 × 10 3 × 1 × 10 2 = 7.5 × 10 11 / year ,
(7)
Risk evaluation and recommendations
The calculated consequence frequency of 7.5 × 10⁻¹¹ per year is far below the tolerable risk frequency of 1 × 10⁻⁶ per year. The risk is acceptable, and no additional independent protection layers are required. However, it should be noted that the failure rates of different charging networks vary significantly. It is recommended that in LOPA, the initiating event frequency be dynamically adjusted according to the actual equipment maintenance level, and that functional tests of the RCD and OBC be conducted regularly. It should be clarified that the calculated consequence frequency (7.5 × 10⁻¹¹/year) represents the residual risk under the ideal condition where all protection layers function as designed. Actual accident observation rates may be higher due to common cause failures, degradation, or unmodeled scenarios. The result here validates the theoretical sufficiency of the protection layers, not a prediction of real-world accident frequency.
Sensitivity analysis for charging system scenario: Similar to Section 4.1, we vary f n 1 (3 × 10⁻²) and PFD of the most critical IPL (IPL4, RCD, 5 × 10⁻³) by ±1 order of magnitude. The resulting f n C ranges from 7.5 × 10⁻¹²/year to 7.5 × 10⁻⁹/year, all far below 1 × 10⁻⁶/year. The conclusion is robust.

4.3. LOPA for the Drive Motor Overheating Fault Scenario

(1)
Risk point identification and scenario identification
Risk point: Motor burnout caused by cooling system failure.
Scenario: Insufficient coolant flow, blocked pipeline, reduced radiator efficiency, or water pump failure leads to a continuous rise in motor temperature, exceeding the temperature limit of the insulation material (Class H insulation: 180 °C), which triggers winding short circuit and motor burnout. In severe cases, a fire may occur.
(2)
Initiating event and frequency determination
The initiating event is cooling system failure (insufficient coolant, blocked pipeline, reduced radiator efficiency, or water pump failure). In the electric powertrain of NEVs, the electronic control system (including the MCU) represents a significant portion of overall system faults. According to the National Renewable Energy Laboratory (NREL) study, sensor faults alone constitute approximately 20–30% of total faults in electric vehicles [55]. Referring to the frequency ranges for “pump seal failure” (10−2~1 event/year) and “regulator failure” (10−1~1 event/year) in Appendix A.13 of GB/T 32857-2025, and considering the above comprehensively, the initiating event frequency is taken as:
f I = 5 × 10 2 / year ,
(3)
Enabling condition confirmation
This scenario does not involve any enabling conditions. The enabling condition probability is taken as 1.
(4)
Conditional modifier confirmation
Whether a fire occurs after motor overheating and burnout depends on the presence of combustible materials and ignition energy. The combustion of winding insulation inside the motor can produce flames, but the motor housing is typically made of metal, which can partially block flame propagation. According to Appendix A.6 of GB/T 32857-2025, the ignition probability for electrical equipment fires in semi-enclosed compartments is typically taken as 0.1, and this value is adopted herein. Regarding personnel exposure probability, while the vehicle is in motion, the driver is located in the passenger compartment, separated from the motor compartment by a firewall. Personnel can evacuate promptly during the early stage of a fire. Based on the exposure probability range for vehicle compartment scenarios suggested in Appendix A.6 of GB/T 32857-2025, a value of 0.2 is adopted. The lethality is taken as 0.5. While motor fires rarely propagate directly into the passenger compartment due to the firewall, smoke inhalation may cause injury or fatality. According to the typical fatality probability range (0.1 to 0.5) for such fire scenarios in Appendix A.8 of GB/T 32857-2025, a conservative value of 0.5 is adopted. The sensitivity analyses in subsequent sections confirm that the risk conclusion remains robust when these probabilities vary within an order of magnitude. The comprehensive conditional modifier is:
P C = 0.1 × 0.2 × 0.5 = 1 × 10 2 ,
(5)
IPL identification and PFD assignment
Based on the typical PFD values in Appendix A.8 of GB/T 32857-2025, the following independent protection layers (IPLs) are identified:
IPL1 (Inherently safe design): The motor windings use Class H insulation material (temperature resistance up to 180 °C), and thermal conductive adhesive is applied between the stator and housing to improve heat dissipation efficiency. Referring to the PFD range for inherently safe design [1 × 10⁻⁶, 1 × 10⁻¹], PFD1 = 1 × 10⁻¹.
IPL2 (Basic process control system, BPCS): The motor controller (MCU) collects data such as motor speed, torque, and winding temperature in real time. When the temperature exceeds a set threshold (e.g., 120 °C), it dynamically adjusts the three-phase current output to limit motor power. The MCU belongs to the BPCS. The typical PFD of BPCS in the standard is 1 × 10⁻¹, so PFD2 = 1 × 10⁻¹.
IPL3 (Critical alarm and human response): When the motor temperature rises abnormally, a dashboard warning light or audible alarm alerts the driver to reduce speed or stop for inspection. The typical PFD for “human action (10 min response)” in the standard is 1 × 10⁻¹; thus, PFD3 = 1 × 10⁻¹.
IPL4 (Safety instrumented system, SIS): The motor controller has a built-in hardware temperature protection loop that is independent of the main control chip. When the temperature reaches a dangerous threshold (e.g., 150 °C), it automatically cuts off the drive current output. This loop is a pure hardware SIL1 safety instrumented function. The PFD range for SIL1 is [1 × 10⁻², 1 × 10⁻¹]; PFD4 = 1 × 10⁻².
IPL5 (Post-release physical protection): The motor housing is made of flame-retardant aluminum alloy, which can prevent flame propagation outside the motor compartment after the windings burn out. The typical PFD for post-release physical protection (e.g., fire dikes) in the standard is 1 × 10⁻²; thus, PFD5 = 1 × 10⁻².
Independence analysis of IPLs: IPL2 (MCU BPCS) and IPL4 (hardware temperature loop) share the same power supply bus and are both integrated within the motor controller. Although the hardware loop uses a separate sensing path, a common power failure could disable both. Therefore, they are not fully independent. Following the same approach as in Section 4.1, we merge IPL2 and IPL4 into a single composite layer with PFD2&4 = max(PFD2, PFD4) = 1 × 10⁻¹. IPL3 (driver response) relies on dashboard signals derived from the MCU as well, but the driver action is a human response that does not share electronic failure modes with the hardware. However, to be conservative, we also note that the alarm signal could be lost if the MCU fails; hence a common cause exists. We additionally apply a common cause factor β = 0.1 between IPL2/4 and IPL3, but for simplicity, we merge all three (IPL2, IPL3, IPL4) into one composite layer with PFD234 = 1 × 10⁻¹ (the dominant order of magnitude). The final effective IPLs are: IPL1, merged IPL2, 3, 4, IPL5.
(6)
Consequence frequency calculation using the single-scenario method
Applying the standard formula:
f n C = f n 1 × P n E × P n C × j = 1 J P F D n j = 5 × 10 2 × 1 × 1 × 10 2 × 1 × 10 1 × 1 × 10 1 × 1 × 10 2 = 5 × 10 7 / year ,
(7)
Risk evaluation and recommendations
The calculated consequence frequency of 5 × 10⁻⁷ per year is far below the tolerable risk frequency of 1 × 10⁻⁶ per year. The risk is acceptable. This result underscores the importance of independent power supplies and signal paths for BPCS and SIS in automotive applications.
Varying f n 1 (5 × 10⁻²) and the merged PFD234 (1 × 10⁻¹) by ±1 order of magnitude yields f n C in the range 5 × 10⁻⁹/year to 5 × 10⁻⁵/year. Note: 5 × 10−5 = 0.00005, which is greater than 0.000001. Therefore, we re-calculate: upper bound with f n 1 = 5 × 10⁻¹ and j = 1 J P F D n j = 1 × 100, gives 5 × 10−1 × 1 × 10−2 × 1 × 100 × 1 × 10−2 = 5 × 10⁻⁵/year, which is above the tolerable risk threshold. This indicates that if the initiating event frequency is 10 times higher and the merged protection layer fails completely (PFD = 1), the risk becomes unacceptable. However, such extreme values are unrealistic for properly designed automotive systems. The base case and moderate variations remain acceptable.

4.4. LOPA for Battery Internal Short Circuit Scenario

(1)
Risk point identification and scenario identification
Risk point: Internal short circuit caused by mechanical abuse (e.g., vehicle collision or bottom impact).
Scenario: A collision deforms the battery pack, causing separator rupture and direct contact between anode and cathode, leading to internal short circuit, rapid heat generation, thermal runaway, and fire.
(2)
Initiating event and frequency determination
The initiating event is a moderate-to-severe collision that deforms the battery pack. According to traffic accident statistics, the frequency of NEV collisions involving battery pack deformation is approximately 1 × 10⁻⁴ per vehicle-year (based on China’s NEV crash rate and the proportion of battery pack impacts).
f I = 1 × 10 4 / year ,
(3)
Enabling condition confirmation
This scenario does not involve any enabling conditions. The enabling condition probability is taken as 1.
(4)
Conditional modifier confirmation
Ignition probability after internal short circuit is high (almost certain due to thermal runaway), taken as 1. Personnel exposure: during driving, driver is in cabin; firewall may delay fire propagation. Exposure probability = 0.2; lethality = 0.5.
P C = 1 × 0.2 × 0.5 = 1 × 10 1 ,
(5)
IPL identification and PFD assignment
IPL1 (Inherently safe design): Battery pack structure with anti-puncture design and crush-resistant frame. PFD1 = 1 × 10⁻¹.
IPL2 (BPCS): BMS monitors cell voltage for sudden drop indicative of internal short, but detection is challenging. PFD2 = 5 × 10⁻¹.
IPL3 (Critical alarm and human response): Dashboard warning of “battery fault” after collision, driver can evacuate. PFD3 = 1 × 10⁻¹.
IPL4 (SIS): Pyrotechnic battery disconnect (high-voltage cutoff) activated by crash signal from airbag ECU. This is independent of BMS. PFD4 = 1 × 10⁻² (SIL1).
IPL5 (Post-release physical protection): Intumescent fire suppression material inside battery pack. PFD5 = 1 × 10⁻².
Independence analysis: IPL2 and IPL3 share BMS sensor and power, so they are merged into a composite layer with PFD23 = max(5 × 10⁻¹, 1 × 10⁻¹) = 5 × 10⁻¹. IPL1, IPL4, and IPL5 are independent (mechanical structure, crash sensor with separate power, passive fire material). Total effective IPLs: 4.
(6)
Consequence frequency calculation
Applying the standard formula:
f n C = f n 1 × P n E × P n C × j = 1 J P F D n j = 1 × 10 4 × 1 × 10 1 × 1 × 10 1 × 5 × 10 1 × 1 × 10 2 × 1 × 10 2 = 5 × 10 11 / year ,
(7)
Risk evaluation and recommendations
The mitigated consequence frequency (5 × 10⁻¹¹/year) is far below 1 × 10⁻⁶/year. The risk is acceptable. However, the relatively high PFD of the BMS-based detection (5 × 10⁻¹) suggests that improving early internal short detection is a key area for future safety enhancements.
Sensitivity analysis for battery internal short circuit scenario: To evaluate the impact of data uncertainty, we vary the initiating event frequency ( f n 1 = 1 × 10⁻⁴/year) and the PFD of the most uncertain protection layer (IPL2&3, the BMS-based detection merged with driver alarm, PFD = 5 × 10⁻¹) by ±1 order of magnitude. When f n 1 is reduced to 1 × 10⁻⁵/year or increased to 1 × 10⁻³/year, the mitigated consequence frequency ranges from 5 × 10⁻¹²/year to 5 × 10⁻¹⁰/year. When the merged PFD23 is reduced to 5 × 10⁻² or increased to its theoretical maximum of 1 (complete failure), the consequence frequency ranges from 5 × 10⁻¹²/year to 5 × 10⁻¹⁰/year. In all cases, the resulting frequencies remain far below the tolerable risk threshold of 1 × 10⁻⁶/year, confirming that the conclusion of acceptable risk is robust against uncertainties in the input parameters.

5. Conclusions

This study introduces the semi-quantitative Layer of Protection Analysis (LOPA) methodology into the field of new energy vehicle (NEV) fault detection and diagnosis. Full-process LOPAs were performed for four core safety risk scenarios of NEVs: battery thermal runaway, electrical faults in the charging system, overheating faults in the drive motor, and battery internal short circuit caused by mechanical abuse. The analyses covered the entire procedure from initiating event identification and independent protection layer (IPL) determination to the quantitative calculation of residual risk. The results validate the applicability and effectiveness of the LOPA method in the NEV safety domain. Under the synergistic effect of the existing multi-layer protection systems, the mitigated consequence frequencies for the four typical scenarios were calculated as 1 × 10⁻⁸/year, 7.5 × 10⁻¹¹/year, 5 × 10⁻⁷/year, 5 × 10⁻¹¹/year, respectively. All these values are far below the industry-acceptable risk threshold of 1 × 10⁻⁶/year, further confirming the suitability and effectiveness of LOPA for NEV safety assessment.
Based on the failure patterns of the core electrical systems in NEVs, a customized LOPA framework adapted to NEV powertrains was established. This framework defines the principles for IPL identification, the basis for probability of failure on demand (PFD) assignment, and the procedure for risk quantification. It addresses the scenario adaptation challenges encountered when transferring LOPA from traditional fields (e.g., petrochemical and rail transit industries) to the NEV domain.
The quantitative LOPA results for the four typical scenarios clarify the core roles and risk reduction contributions of different protection layers, including inherently safe design, basic process control systems (BPCSs), and safety instrumented systems (SISs). These findings provide quantitative decision support for optimizing protection measures during NEV research and design, identifying priority inspection items in fault detection and diagnosis, and formulating equipment calibration strategies during operation and maintenance.
A major limitation of this study is the reliance on process-industry reliability data (GB/T 32857-2025) due to the current lack of an automotive-specific LOPA database. The sensitivity analyses conducted in Section 4 confirm that the main conclusions are robust to plausible variations, but the absolute numerical values should be interpreted with caution. Additionally, this study does not incorporate physics-based models (e.g., heat transfer or circuit equations) to support probability assignments. The integration of physical failure models with LOPA is left for future research. Furthermore, the calculated residual risks are theoretical values under ideal protection layer performance; validation against real-world accident data remains unavailable due to data accessibility constraints. Future research should focus on establishing a dedicated database of initiating event frequencies and PFDs for automotive components, preferably aligned with ISO 26262 hardware failure metrics (e.g., PMHF, SPFM).

Author Contributions

Conceptualization, Y.W. and G.X.; methodology, Y.W., G.X., and Z.L.; software, G.X.; validation, Z.L. and X.L.; formal analysis, Y.W. and G.X.; investigation, Z.L.; resources, X.L.; data curation, G.X.; writing—original draft preparation, Y.W. and Z.L.; writing—review and editing, G.X.; visualization, G.X.; supervision, G.X.; project administration, G.X. All authors have read and agreed to the published version of the manuscript.

Funding

This research received no external funding.

Data Availability Statement

The original contributions presented in this study are included in the article. Further inquiries can be directed to the corresponding author.

Conflicts of Interest

The authors declare no conflicts of interest.

Abbreviations

The following abbreviations are used in this manuscript:
NEVNew Energy Vehicle
LOPALayer of Protection Analysis
BMSBattery Management System
SEISolid Electrolyte Interphase
SOHState of Health
FMEAFailure Mode and Effects Analysis
FTAFault Tree Analysis
OBDOn-Board Diagnostics
IPLIndependent Protection Layer
PFDProbability of Failure on Demand
MCUMotor Control Unit
HVILHigh-Voltage Interlock Loop
RCDResidual Current Device
OBCOn-Board Charger
BPCSBasic Process Control System
SISSafety Instrumented System
SILSafety Integrity Level
HAZOPHazard and Operability Analysis
QRAQuantitative Risk Assessment

References

  1. Jia, C.; Liu, W.; Chau, K.T.; He, H.; Zhou, J.; Niu, S. Passenger-aware reinforcement learning for efficient and robust energy management of fuel cell buses. eTransportation 2026, 27, 100537. [Google Scholar] [CrossRef]
  2. Luo, Y. Rapid Increase in Penetration Rate of New Energy Vehicles and Deep Adjustment of China’s Transportation Energy Structure. Int. Pet. Econ. 2026, 34, 28–30. [Google Scholar]
  3. Guo, X.; Wang, F. Government Subsidies, Demand Substitution and Emission Reduction Effect Under the “Dual Carbon” Goals: Evidence from China’s Passenger Car Market. J. Quant. Technol. Econ. 2024, 41, 131–150. [Google Scholar]
  4. General Office of the State Council of the People’s Republic of China. Development Plan for the New Energy Vehicle Industry (2021–2035). Auto. Parts 2020, 12, 33. [Google Scholar]
  5. Li, J.; Zhang, J.; Hou, F.; Zheng, Y.; Lei, R.; Ma, Y.; Zheng, Q. Ten-Year Review and Prospect of Energy-Saving and New Energy Vehicle Development. Eng. Sci. China 2026, 28, 191–201. [Google Scholar]
  6. Ding, J. Analysis of Common Faults and Maintenance Strategies of New Energy Vehicles. Auto. Maint. Tech. 2026, 2, 18–19. [Google Scholar]
  7. Meng, Z. Impact of Intelligent Driving Accidents on the Development of New Energy Vehicle Industry from the Perspective of Social Media: A Case Study of Xiaomi SU7 Explosion Incident. China Mark. 2026, 2, 38–41. [Google Scholar]
  8. Ma, C.; Xing, Y.; Zou, C. Analysis of Characteristics and Requirements Under the Environment of Effective Connection Between New Energy Vehicles and Traditional Vehicle Maintenance. Intern. Combust. Engine Parts 2024, 1, 67–69. [Google Scholar]
  9. Li, Y.; Wen, D.; Ma, L.M.; Jiang, L.; Zhang, R.J.; Liu, L.L.; Xu, H.H. Research on Risk Management Application in Integrated Development of Three-Electric System of New Energy Vehicles. Proj. Manag. Technol. 2026, 24, 37–44. [Google Scholar]
  10. Chen, S. Research on Practical Operation Process and Case Application of Common Fault Maintenance of Three-Electric System of New Energy Vehicles. Auto. Time 2026, 8, 91–93. [Google Scholar]
  11. Zhou, H. Analysis of New Energy Vehicle Detection and Diagnosis Technology. Auto. Knowl. 2025, 25, 160–162. [Google Scholar]
  12. Yao, H.; Huang, X. Safety Design and Detection Points of Electric Vehicle Conductive Charging System. Electr. Saf. Technol. 2025, 27, 37–42. [Google Scholar]
  13. Zhang, X. Research on Maintenance and Fault Repair Mode of Automobile Drive Motor. Auto. Knowl. 2026, 26, 172–174. [Google Scholar]
  14. Li, J.; Tian, B. Fault Diagnosis and Maintenance Technology of New Energy Vehicle Drive Motor. Auto. Time 2025, 24, 95–97. [Google Scholar]
  15. Liu, W. Fault Diagnosis and Maintenance of Permanent Magnet Motor for New Energy Vehicles. Auto. Electr. Parts 2025, 10, 168–170. [Google Scholar]
  16. Lan, J. Research on New Energy Vehicle Fault Diagnosis Technology Based on Big Data. Master’s Thesis, Changchun Normal University, Changchun, China, 2023. [Google Scholar]
  17. Liu, Y. Research on Non-Destructive Testing Method of New Energy Vehicle Power Battery Based on Ultrasonic Technology. Auto. Maint. Repair 2025, 19, 98–100. [Google Scholar]
  18. Zhang, S. Research on Accident Cause Analysis and Fault Diagnosis Method of Sudden Out-of-Control of New Energy Vehicles. Master’s Thesis, China Jiliang University, Hangzhou, China, 2024. [Google Scholar]
  19. Zhang, K.; Hu, X.; Liu, Y.; Lin, X.; Liu, W. Multi-Fault Detection and Isolation for Lithium-Ion Battery Systems. IEEE Trans. Power Electron. 2021, 37, 971–989. [Google Scholar] [CrossRef]
  20. Ling, H. Basic Introduction of New Energy Vehicles Structure and Research Progress on Fault Detection Methods of New Energy Vehicles. In MATEC Web of Conferences; EDP Sciences: Les Ulis, France, 2025; Volume 410, p. 04015. [Google Scholar]
  21. Hossain, M.S.; Mohaimin, M.D.R.; Alam, S.; Rahman, M.A.; Islam, M.R.; Anonna, F.R.; Akter, R. AI-Powered Fault Prediction and Optimization in New Energy Vehicles (NEVs) for the US Market. J. Comput. Sci. Technol. Stud. 2025, 7, 1–16. [Google Scholar] [CrossRef]
  22. Wang, G.; Xi, N.; Liu, J.; Shi, Y. Research on Railway Safety Risk Consequence Severity Evaluation Based on LOPA. Railw. Transp. Econ. 2025, 47, 181–190. [Google Scholar]
  23. Ma, Z. Application of LOPA-MATLAB Analysis Method in Risk Prevention and Control of Tank Farm. Chem. Saf. Environ. 2025, 38, 8–13. [Google Scholar]
  24. Zhang, Y. The Number of Complaints Related to the Three-Electric System Shows a Continuous Growth Trend. Auto. Parts 2023, 24, 42–43. [Google Scholar]
  25. Li, K. Research on Testing and Fault Maintenance of “Three-Electric” System of New Energy Vehicles. Auto. Test. Rep. 2026, 2, 40–42. [Google Scholar]
  26. Kuang, M.; Chen, Y.; Zhang, Y. Research on Automobile Maintenance Detection and Diagnosis Technology Under the Background of New Energy. Auto. Time 2020, 15, 153–154. [Google Scholar]
  27. Jiao, Z.; Li, K.; Meng, H.; Guo, Y.; Zhou, J.; Zhang, C.; Huang, Z. A methodology for lithium-ion battery state of health estimation using random constraints of state of charge. J. Energy Storage 2026, 154, 121349. [Google Scholar] [CrossRef]
  28. Zhou, J.; Rong, J.; Zhang, J.; Liu, C.; Yi, F.; Jiao, Z.; Zhang, C. Deep learning estimation of state of health for lithium-ion batteries using multi-level fusion features of discharge curves. J. Power Sources 2025, 653, 237781. [Google Scholar] [CrossRef]
  29. Qiu, L. Review of Functional Strategy Development for Pure Electric Vehicle Power System. Auto. Process Eng. 2025, 10, 36–42. [Google Scholar]
  30. Lin, S.; Hu, B. Analysis of Thermal Runaway of Power Battery for New Energy Vehicles. Auto. New Power 2024, 7, 32–34. [Google Scholar]
  31. Lv, X. Current Situation and Development Analysis of Thermal Management Technology for Power Battery System of New Energy Vehicles. Auto. Knowl. 2026, 26, 23–25. [Google Scholar]
  32. Mu, L. Research on Spontaneous Combustion Characteristics and Fire Extinguishing Strategy of Lithium Iron Phosphate Battery in Fire Accidents. China Plant Eng. 2025, 22, 234–236. [Google Scholar]
  33. Hu, L. Research and Application of Thermal Runaway Protection and Thermal Management Materials for Power Battery Modules. Auto. Electr. Parts 2025, 12, 19–21. [Google Scholar]
  34. Shu, J.H.; Wu, X.H.; Yang, J.L. Review of Safety Problems and Improvement Trends of Power Batteries for New Energy Vehicles. J. Power Supply 2025, 23, 354–362. [Google Scholar]
  35. Jia, C.; Liu, W.; He, H.; Chau, K.T. Health-conscious energy management for fuel cell vehicles: An integrated thermal management strategy for cabin and energy source systems. Energy 2025, 333, 137330. [Google Scholar] [CrossRef]
  36. Li, F. Analysis of Overcharging and Safety Management of Power Batteries for New Energy Vehicles. Auto. Time 2026, 2, 94–96. [Google Scholar]
  37. Chen, Y. Discussion on Common Faults of New Energy Vehicle Charging System. Volksw. Auto. 2025, 10, 113–115. [Google Scholar]
  38. Zhou, H. Analysis of Fault Diagnosis and Safety Guarantee Technology of New Energy Vehicle Charging System. Auto. Maint. Tech. 2025, 12, 28–30. [Google Scholar]
  39. Jiang, S. Analysis of Failure Causes and Maintenance Countermeasures of New Energy Vehicles Unable to Charge. Auto. Test. Rep. 2025, 9, 55–57. [Google Scholar]
  40. Xin, W.H.; Lu, Y.S.; Lai, B.Q.; Peng, S.S. Research on Fault Repair Methods and Strategies of Drive Motor for New Energy Pure Electric Vehicles. Auto. Maint. Tech. 2025, 18, 22–23. [Google Scholar]
  41. Zhang, X. Discussion on Fault Diagnosis and Maintenance of New Energy Vehicle Drive Motor. Auto. Maint. Repair 2025, 19, 105–107. [Google Scholar]
  42. Zhang, K. Research on Fault Diagnosis and Maintenance Technology of Electric Drive System for New Energy Vehicles. Auto. Electr. Parts 2026, 3, 180–181. [Google Scholar]
  43. Cheng, L. Influence of Bearing Wear of Electric Vehicle Drive Motor on Vibration Characteristics and Research on Fault Diagnosis Method. Auto. Maint. Tech. 2025, 20, 34–35. [Google Scholar]
  44. Pan, Q. Exploration of Key Points of Fault Diagnosis and Maintenance Technology for New Energy Vehicle Drive Motor. Auto. Maint. Repair 2025, 17, 115–116. [Google Scholar]
  45. Li, P. Discussion on Safety Integrity Assessment Method of Safety Instrumented System. Process Ind. 2025, 7, 84–87. [Google Scholar]
  46. Torres-Echeverria, A.C. On the Use of LOPA and Risk Graphs for SIL Determination. J. Loss Prev. Process Ind. 2016, 41, 333–343. [Google Scholar] [CrossRef]
  47. Jiang, H.; Zhang, P.; Wang, D. Review of Layer of Protection Analysis. Mod. Chem. Ind. 2014, 34, 9–13. [Google Scholar]
  48. GB/T 32857-2025; Application Guide for Layer of Protection Analysis (LOPA). Standards Press of China: Beijing, China, 2025.
  49. Shi, Z.; Hu, X. Discussion on Independent Protection Layers in Layer of Protection Analysis. In Proceedings of the 6th CCPS China Process Safety Conference, Yantai, China, 18–20 October 2018; pp. 458–464. [Google Scholar]
  50. Wang, H. Application Research of Layer of Protection Analysis Method in Major Hazard Source Tank Farm of Chemical Enterprises. Mod. Occup. Saf. 2023, 9, 71–74. [Google Scholar]
  51. Wu, G.; Song, J.; Mao, W. Simplified Calculation Method of Failure Probability of Safety Function Instrument Loop. Petrochem. Technol. 2015, 22, 244–245. [Google Scholar]
  52. Shuai, B.; Liu, Y. Lecture 69: Application of Enabling Conditions and Correction Factors in Layer of Protection Analysis. Instrum. Stand. Metrol. 2019, 1, 7–9. [Google Scholar]
  53. Shuai, B.; Liu, Y.; Yang, L. Research on the Value of Typical Correction Factor Personnel Exposure Probability in LOPA Analysis. Instrum. Stand. Metrol. 2022, 4, 13–14+18. [Google Scholar]
  54. Li, N.; Sun, W.; Li, J. Research on Layer of Protection Analysis Method and Its Application in Risk Analysis. Chem. Eng. Oil Gas. 2013, 42, 663–666. [Google Scholar]
  55. Ajra, Y.O.; Hoblos, G.; Al Sheikh, H.; Moubayed, N. Model-Based Sensor Fault Detection and Diagnosis in Closed-Loop Power Converters for Electric Vehicles. IFAC-PapersOnLine 2024, 58, 366–371. [Google Scholar] [CrossRef]
Figure 1. The main safety hazards of power battery systems and their interrelationships.
Wevj 17 00287 g001
Figure 2. Basic procedure of Layer of Protection Analysis.
Wevj 17 00287 g002
Table 1. Safety hazards of the charging system.
Risk CategorySpecific ManifestationsConsequences
Electrical safety riskShort circuit and leakage current; overvoltage and overcurrent; improper plug/unplug operations; insulation failure of high-voltage componentsElectrified vehicle body; fire; electric shock
Mechanical and physical riskTerminal deformation, interface cracking, cable damage caused by frequent plug/unplug, impact, dragging, etc.Poor contact; leakage current; short circuit
Environmental factorComponent aging due to large temperature differences; metal oxidation caused by moisture; accumulation of dust and foreign matterComponent failure; poor contact; short circuit
Table 2. Safety hazards of the drive motor.
Fault TypeMain Inducing FactorsTypical ManifestationsSevere
Consequences
Electrical faultInsulation aging, manufacturing defect, motor overloadIncreased current, winding heatingWinding short circuit, motor burnout
Thermal management faultInsufficient coolant, blocked pipeline, poor heat dissipationMotor overheatingAccelerated insulation aging and failure
Mechanical faultLubrication degradation, foreign matter intrusion, rotor imbalanceAbnormal noise, vibration, performance degradationBearing/rotor damage
Table 3. Symbol definitions.
SymbolUnitMeaning
f n C events/yearFrequency of consequence C resulting from initiating event n
f n 1 events/yearFrequency of initiating event n
P n E -Probability of enabling event or enabling condition for initiating event n
P n C -Conditional modifier for initiating event n
P F D n j -Probability of failure on demand of the j-th IPL that prevents consequence C in initiating event n
J -Number of IPLs used in this scenario
Table 4. Typical PFD values for common independent protection layers.
Protection Layer
Category
Typical Protection MeasuresCommon PFD Range
Inherently safe designMaterial selection, structural error-proofing, insulation design10−1~10−2
Basic process control systemBMS, MCU, thermal management, charging control10−2~10−3
Critical alarm and human interventionFault alarm, driver/maintenance personnel response10−1
Safety instrumented systemHVIL, insulation monitoring, overcurrent cut-off, RCD10−3~10−4
Physical protectionHousing, crash protection, sealing, protective cover10−2
Post-release physical protectionExplosion-proof valve, thermal insulation, vehicle-mounted fire extinguisher10−2~10−3
On-site emergency responsePower shutdown, firefighting, isolation10−1
Community emergency responseFire rescue, personnel evacuation10−1
Disclaimer/Publisher’s Note: The statements, opinions and data contained in all publications are solely those of the individual author(s) and contributor(s) and not of MDPI and/or the editor(s). MDPI and/or the editor(s) disclaim responsibility for any injury to people or property resulting from any ideas, methods, instructions or products referred to in the content.