Article

A Microchannel Liquid Cold Plate for Cooling Prismatic Lithium-Ion Batteries with High Discharging Rate: Full Numerical Model and Thermal Flows

1
School of Civil and Environmental Engineering, Hunan University of Technology, Zhuzhou 412007, China
2
School of Power and Mechanical Engineering, Wuhan University, Wuhan 430072, China
*
Author to whom correspondence should be addressed.
World Electr. Veh. J. 2026, 17(4), 196; https://doi.org/10.3390/wevj17040196
Submission received: 28 February 2026 / Revised: 4 April 2026 / Accepted: 6 April 2026 / Published: 8 April 2026
(This article belongs to the Section Storage Systems)

Abstract

The thermal safety and longevity of lithium-ion batteries are critically constrained by excessive temperature rise and spatial thermal non-uniformity, particularly during high-rate discharges. Most existing numerical investigations rely on simplified heat generation models that fail to capture the spatiotemporal heterogeneity of electrochemical heat sources, leading to compromised predictive accuracy. To address this deficiency, this study develops a comprehensive three-dimensional electrochemical–thermal coupled framework, integrating the Newman pseudo-two-dimensional (P2D) electrochemical model with conjugate heat transfer and laminar flow dynamics. The predictive robustness of this framework is rigorously validated against experimental data across multiple discharge rates (3 C and 5 C). The validated model is then deployed to evaluate a water-cooled microchannel cold plate designed for prismatic L i M n 2 O 4 /graphite cells under a demanding 5 C discharge. A systematic parametric investigation is conducted to quantify the effects of ambient temperature (293–343 K), microchannel number (2–6), and coolant inlet velocity (0.1–0.6 m/s) on the maximum battery temperature ( T m a x ) and temperature difference ( Δ T ). Results demonstrate that the proposed system exhibits exceptional environmental robustness: over a 50 K ambient temperature span, T m a x increases by merely 2.0 K, remaining safely below the 323 K industry limit. Densifying the channel count from 2 to 6 further reduces T m a x by 1.55 K and narrows Δ T to 4.25 K, successfully satisfying the strict 5 K temperature uniformity standard. Furthermore, the thermal benefit of elevating inlet velocity exhibits a pronounced diminishing-return trend governed by the asymptotic reduction in bulk coolant temperature rise, dictating a critical trade-off against the quadratically escalating pumping power. Ultimately, these findings provide robust theoretical guidelines for the rational design of safe and energy-efficient battery thermal management systems.

1. Introduction

Driven by the global imperative to mitigate greenhouse gas emissions and decouple from fossil fuel reliance, electric vehicles (EVs) have emerged as a transformative alternative in the transportation sector [1]. Among various electrochemical energy storage technologies, lithium-ion batteries (LIBs) have solidified their position as the predominant power source for modern EVs, owing to their high gravimetric and volumetric energy densities, low self-discharge rates, and superior cycle life [2,3,4]. Nevertheless, the electrochemical performance, degradation kinetics, and operational safety of LIBs are profoundly sensitive to their operating temperatures [5]. It is well documented in the recent literature that the optimal thermal envelope for LIBs lies strictly between 15 °C and 50 °C, and the maximum spatial temperature difference (ΔT) within a battery module is typically constrained to approximately 5 °C to meet established thermal safety standards [6,7,8]. Deviation from these thresholds invariably accelerates parasitic side reactions at the solid electrolyte interphase (SEI), promotes lithium plating, exacerbates capacity fade, and in severe cases, triggers catastrophic thermal runaway [9]. Crucially, these thermal bottlenecks are drastically amplified during the current industry push towards extreme fast charging or high-rate discharging scenarios (e.g., 5 C), where intense and spatially heterogeneous heat is generated within extremely short time scales. Consequently, developing a high-performance Battery Thermal Management System (BTMS) capable of efficiently dissipating peak heat loads and maintaining thermal homogeneity is of paramount importance.
Over the past decade, diverse BTMS strategies have been developed, broadly classified into air, phase change material (PCM), heat pipe, liquid, and hybrid cooling approaches. While air cooling offers structural simplicity, its inherently low convective heat transfer coefficient renders it inadequate for managing the substantial heat generated under high C-rate conditions [10]. PCM-based systems exploit latent heat absorption to achieve excellent passive temperature uniformity; however, their intrinsically low thermal conductivity necessitates complex enhancement matrices (e.g., expanded graphite or metal foams) [11,12,13], inevitably incurring severe volumetric and gravimetric penalties. Heat pipe cooling provides high effective thermal conductivity, yet its integration with large-format cells remains challenging due to geometric constraints and orientation sensitivity [14]. In contrast, indirect liquid cooling—particularly employing microchannel cold plates—has decisively established itself as the industry standard for high-energy-density EV packs. This dominance is attributed to the high specific heat capacity of liquid coolants and the highly compact, scalable architecture of cold plate assemblies [15,16].
Considerable research has been dedicated to optimizing the geometric configuration and thermo-hydraulic performance of liquid cold plates. Huo et al. [17] developed a 3D thermal model to investigate the effects of channel quantity and flow direction, concluding that densifying the channels substantially reduces the peak battery temperature. Patil et al. [18] demonstrated that the judicious geometric optimization of Z-shaped channels can simultaneously minimize the coolant-side pressure drop and enhance spatial temperature uniformity. Furthermore, recent reviews by Zhao et al. [19] and Patil et al. [20] critically synthesized advancements in channel topology, emphasizing that while complex flow paths (e.g., serpentine, bifurcated, or biomimetic geometries) can markedly improve convective heat transfer, they inevitably introduce massive hydraulic resistance. Thus, navigating the fundamental trade-off between thermal dissipation efficacy and parasitic pumping power consumption remains a persistent challenge in cold plate design.
Despite these structural advancements, a fundamental methodological deficiency persists across the majority of existing numerical studies. Specifically, most 3D computational fluid dynamics (CFD) simulations rely on simplified, macroscopic heat generation models—most notably the Bernardi equation—which often oversimplify the battery cell as a spatially uniform and temporally averaged volumetric heat source [21]. While computationally expedient, this lumped approach fundamentally fails to capture the complex spatiotemporal heterogeneity of internal heat generation driven by electrochemical reactions, ionic transport, and electronic conduction. This deficiency becomes particularly pronounced under extreme 5 C high-rate discharge conditions, where steep lithium-ion concentration gradients develop, and localized overpotentials surge dramatically [22]. Consequently, utilizing lumped thermal models often leads to significant inaccuracies in predicting localized hotspots, resulting in under-designed or potentially unsafe cold plate structures.
Crucially, the limitations of simplified models are further exacerbated in large-format prismatic cells, which currently dominate modern EV architectures through Cell-to-Pack (CTP) and Cell-to-Body (CTB) integration technologies [23]. Compared to their small-format cylindrical counterparts (e.g., 18,650 or 21,700), prismatic cells possess significantly larger electrode surface areas and extended in-plane heat conduction paths. These geometric traits, coupled with inherent electrochemical non-uniformities, inevitably induce severe spatial temperature gradients. Recently, commendable progress has been made in modeling such complex multiphysics. For instance, Magri et al. [24] successfully developed an electrochemical–thermal coupled model using the pseudo-2D approach to precisely capture the transient thermal behavior and localized gradients of a prismatic lithium-ion battery under various discharge cycles. Yet, comprehensive investigations that integrate such a rigorous electrochemical–thermal coupled model with a detailed 3D conjugate heat transfer analysis of microchannel cold plates—particularly under extreme fast-discharging scenarios (e.g., 5 C)—remain conspicuously scarce.
To bridge these critical research gaps, this study proposes a tailored microchannel liquid cold plate BTMS engineered for high-power prismatic lithium-ion batteries under demanding high-rate (5 C) discharge conditions. The principal contributions and novelties are summarized as follows:
(1) A robust, comprehensive three-dimensional (3D) electrochemical–thermal coupled framework is established by integrating the Newman pseudo-two-dimensional (P2D) model with a 3D conjugate heat transfer and laminar flow model. This approach overcomes the inherent blind spots of lumped heat generation models, enabling the high-fidelity prediction of spatially resolved heat generation and local thermal hotspots.
(2) Based on this coupled framework, a systematic parametric study is conducted to quantify the independent and synergistic impacts of critical operating parameters—namely, ambient temperature, microchannel quantity, and coolant inlet velocity—on the maximum battery temperature and spatial thermal gradients.
(3) The underlying thermo-hydraulic mechanisms governing the cooling performance are thoroughly elucidated, with a particular emphasis on the fundamental trade-off between thermal mitigation efficacy and hydrodynamic resistance. The derived mechanistic insights provide robust theoretical guidelines for the rational design of safe, energy-efficient, and wide-temperature-range BTMS for advanced prismatic battery packs.

2. Materials and Methods

2.1. Physical Model and Geometry Description

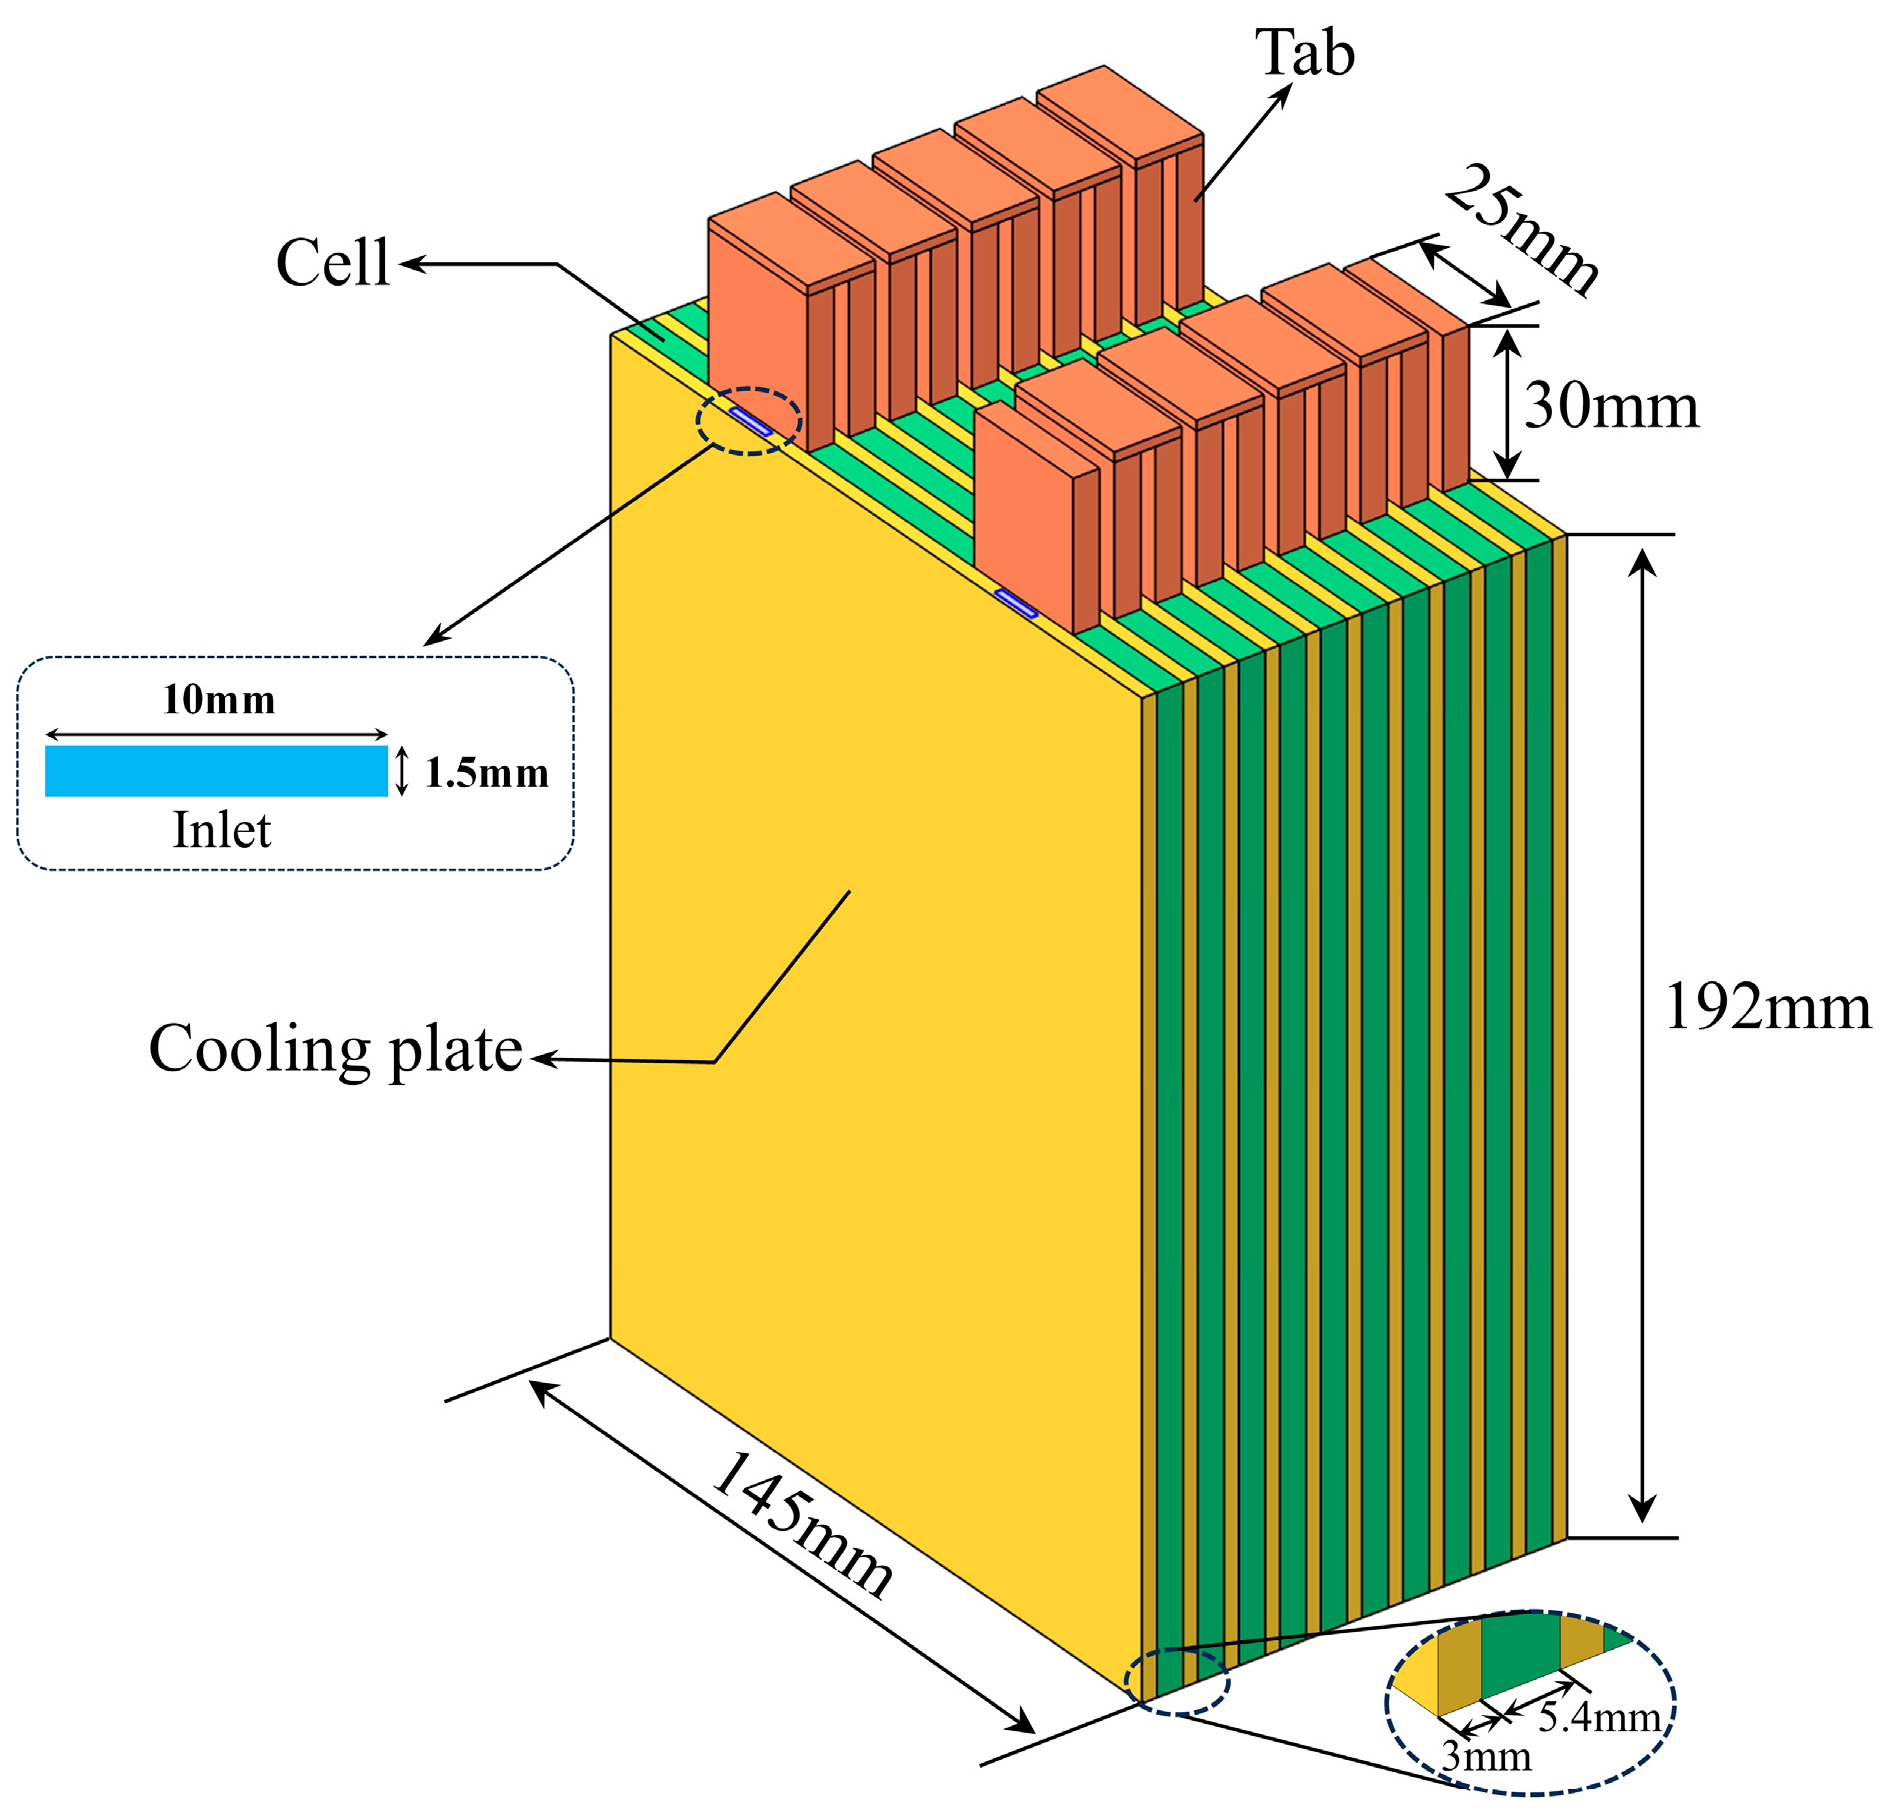
The present study investigates a battery module consisting of ten large-format prismatic lithium-ion cells electrically connected in series. The electrochemical couple employs lithium manganese oxide (LiMn2O4) as the cathode active material and graphite (C6) as the anode active material [25]. The three-dimensional geometric configuration of the battery module and the integrated liquid cooling system is schematically illustrated in Figure 1. Each individual prismatic cell has external dimensions of 192 mm (height) × 145 mm (width) × 5.4 mm (thickness). The key electrochemical specifications and physical parameters of the battery cell are summarized in Table 1. The cell features a nominal capacity of 14.6 Ah and a nominal voltage of 3.7 V, with an operational voltage window ranging from a lower cutoff of 3.0 V to an upper cutoff of 4.3 V.
To effectively mitigate the severe thermal accumulation anticipated during high-rate (5 C) discharge operations, a sandwich-structured indirect liquid cooling system was specifically designed. In this configuration, each prismatic cell is tightly sandwiched between two aluminum alloy cold plates, forming an alternating cell-cold plate-cell stacked assembly. This intimate contact arrangement is adopted to minimize the interfacial thermal contact resistance and establish a short, efficient conductive heat transfer path from the battery surface to the internal coolant. Each cold plate has a thickness of 3 mm and incorporates internal rectangular microchannels with a cross-sectional width of 10 mm and a depth of 1.5 mm. The electrical interconnection between adjacent cells is achieved through copper busbars with a thickness of 2 mm. Deionized water is selected as the cooling medium owing to its high specific heat capacity and wide availability. The comprehensive thermophysical properties of all constituent materials—including the battery cell (with anisotropic thermal conductivity), electrode active materials, current collector metals, cold plate material, and coolant—are detailed in Table 2.
To render the numerical simulation tractable while preserving the essential physics, the following simplifying assumptions are adopted:
(a) The battery cell is treated as a homogeneous solid domain with anisotropic thermal conductivity. As listed in Table 2, the in-plane thermal conductivity (kx = ky = 28 W/(m·K)) is two orders of magnitude higher than the through-plane (thickness direction) thermal conductivity (kz = 0.28 W/(m·K)), reflecting the layered internal structure of the electrode-separator assembly. This anisotropy is critical for accurately capturing the in-plane heat spreading and through-plane thermal resistance.
(b) The aluminum cold plate material is assumed to be homogeneous and isotropic.
(c) The coolant (water) is treated as an incompressible Newtonian fluid with constant thermophysical properties evaluated at the inlet temperature.
(d) Thermal contact resistance between the battery surface and the cold plate is neglected, assuming ideal thermal bonding.
(e) Natural convection and radiation heat losses from the external surfaces of the module to the ambient environment are considered negligible compared to the dominant forced convective cooling by the liquid coolant.
The simulation models a constant current discharge process at a rate of 5 C for a total duration of 720 s. The coolant enters the microchannels at an inlet mass flow rate of 15 × 10−3 kg/s. Based on the channel hydraulic diameter and the inlet flow conditions, the Reynolds number (Re) is calculated to be approximately 419.79. Since this value is well below the critical laminar-turbulent transition threshold (Re < 2300), the coolant flow is confirmed to be in the laminar regime; accordingly, the laminar flow model is adopted for all simulations. A zero-gauge-pressure boundary condition is imposed at the channel outlets.

2.2. Mathematical Model

2.2.1. Electrochemical Model

Building upon the electrochemical principles derived from Newman’s porous electrode theory [26], the Butler–Volmer equation is employed to describe the electrochemical reaction kinetics at the interface of the solid particles and the electrolyte in both the positive and negative electrodes. The local transfer current density, j n , is given by:
j n = j 0 e x p α a F R T η e x p α c F R T η
where j 0 is the exchange current density (A⋅m−2); η represents the local overpotential (V); α a and α c denote the anodic and cathodic charge transfer coefficients, respectively, both typically set to 0.5; F is the Faraday constant (96,485 C⋅mol−1); and R is the universal gas constant (8.314 J⋅mol−1⋅K−1). The expression for the exchange current density is defined as follows:
j 0 = F k 0 ( c l ) α a ( c s , m a x c s , s u r f ) α a ( c s , s u r f ) α c
where k 0 represents the electrochemical reaction rate constant; c s , m a x is the maximum solid-phase lithium-ion concentration; c s , s u r f is the local lithium-ion concentration at the particle surface; and c l is the lithium-ion concentration in the liquid electrolyte phase.
The charge conservation in the solid phase (electrodes) and the liquid phase (electrolyte) is governed by Ohm’s law, expressed as follows:
i s = σ s e f f Φ s
i l = σ l e f f Φ l + 2 σ l e f f R T F ( 1 t + ) ( 1 + l n f ± l n c l ) l n c l
where i s and i l represent the solid-phase electronic current density and liquid-phase ionic current density, respectively; Φ s and Φ l denote the solid-phase and liquid-phase potentials, respectively; σ s e f f and σ l e f f are the corresponding effective electronic and ionic conductivities; and t + is the lithium-ion transference number.
The mass conservation of lithium ions within the solid spherical active particles is described by Fick’s second law [27]:
c s t = D s r 2 r ( r 2 c s r )
where c s is the solid-phase lithium-ion concentration; D s is the solid-state diffusion coefficient; and r is the radial coordinate of the spherical particles. Correspondingly, the mass conservation of lithium ions in the liquid phase, based on the concentrated solution theory, is given by:
ε l c l t = ( D l e f f c l ) + 1 t + F a s j n
D l e f f = D l ε l b r u g g
where ε l is the volume fraction of the liquid phase (porosity); c l is the lithium-ion concentration in the electrolyte; t + is the transference number of lithium ions; F is the Faraday constant; a s represents the specific interfacial area (note that a s is zero in the separator region); j n is the pore wall flux density; and D l e f f denotes the effective diffusion coefficient in the electrolyte, which is corrected by the Bruggeman relationship with the tortuosity exponent b r u g g [28].

2.2.2. Thermal Model

The three-dimensional transient energy conservation equation coupling the heat transfer and the electrochemical heat generation of the lithium-ion battery is formulated as:
ρ C p T t = ( k T ) + q t o t
The terms from left to right represent the transient heat accumulation, the conductive heat transfer, and the total volumetric heat generation rate ( q t o t ), respectively. Within the battery core region, the local heat generation predominantly originates from the intricate electrochemical processes, which include reversible entropic heat ( q r e v ), activation polarization heat ( q a c t ), and Ohmic heat ( q o h m ):
q r e v = a s j n T U e q T
q a c t = a s j n ( Φ s Φ l U e q )
q o h m = σ s e f f ( Φ s ) 2 + σ l e f f ( Φ l ) 2 + 2 σ l e f f R T F ( 1 t + ) ( 1 + l n f ± l n c l ) ( l n c l ) Φ l
where U e q T is the entropy coefficient. Note that the total heat generation in the core active zone is the sum of these three components ( q t o t _ c o r e = q r e v + q a c t + q o h m ).
Furthermore, Joule heating occurs in the positive and negative tabs (terminals) due to electronic resistance. The volumetric Ohmic heat generation rate in the tab domains ( q t a b ) is calculated by:
q t a b = ( I t a b A t a b ) 2 1 σ t a b
where I t a b is the current passing through the tab; A t a b is the cross-sectional area of the tab (width of 25 mm and thickness of 0.6 mm); and σ t a b is the electrical conductivity of the tab material (aluminum for the positive tab and copper for the negative tab). Based on the properties, the volumetric heat generation rates for the positive and negative tabs under the specified operating condition are determined to be 2.05 × 10⁵ W/m3 and 1.29 × 10⁶ W/m3, respectively.

2.3. Numerical Solution and Model Verification

2.3.1. Numerical Implementation

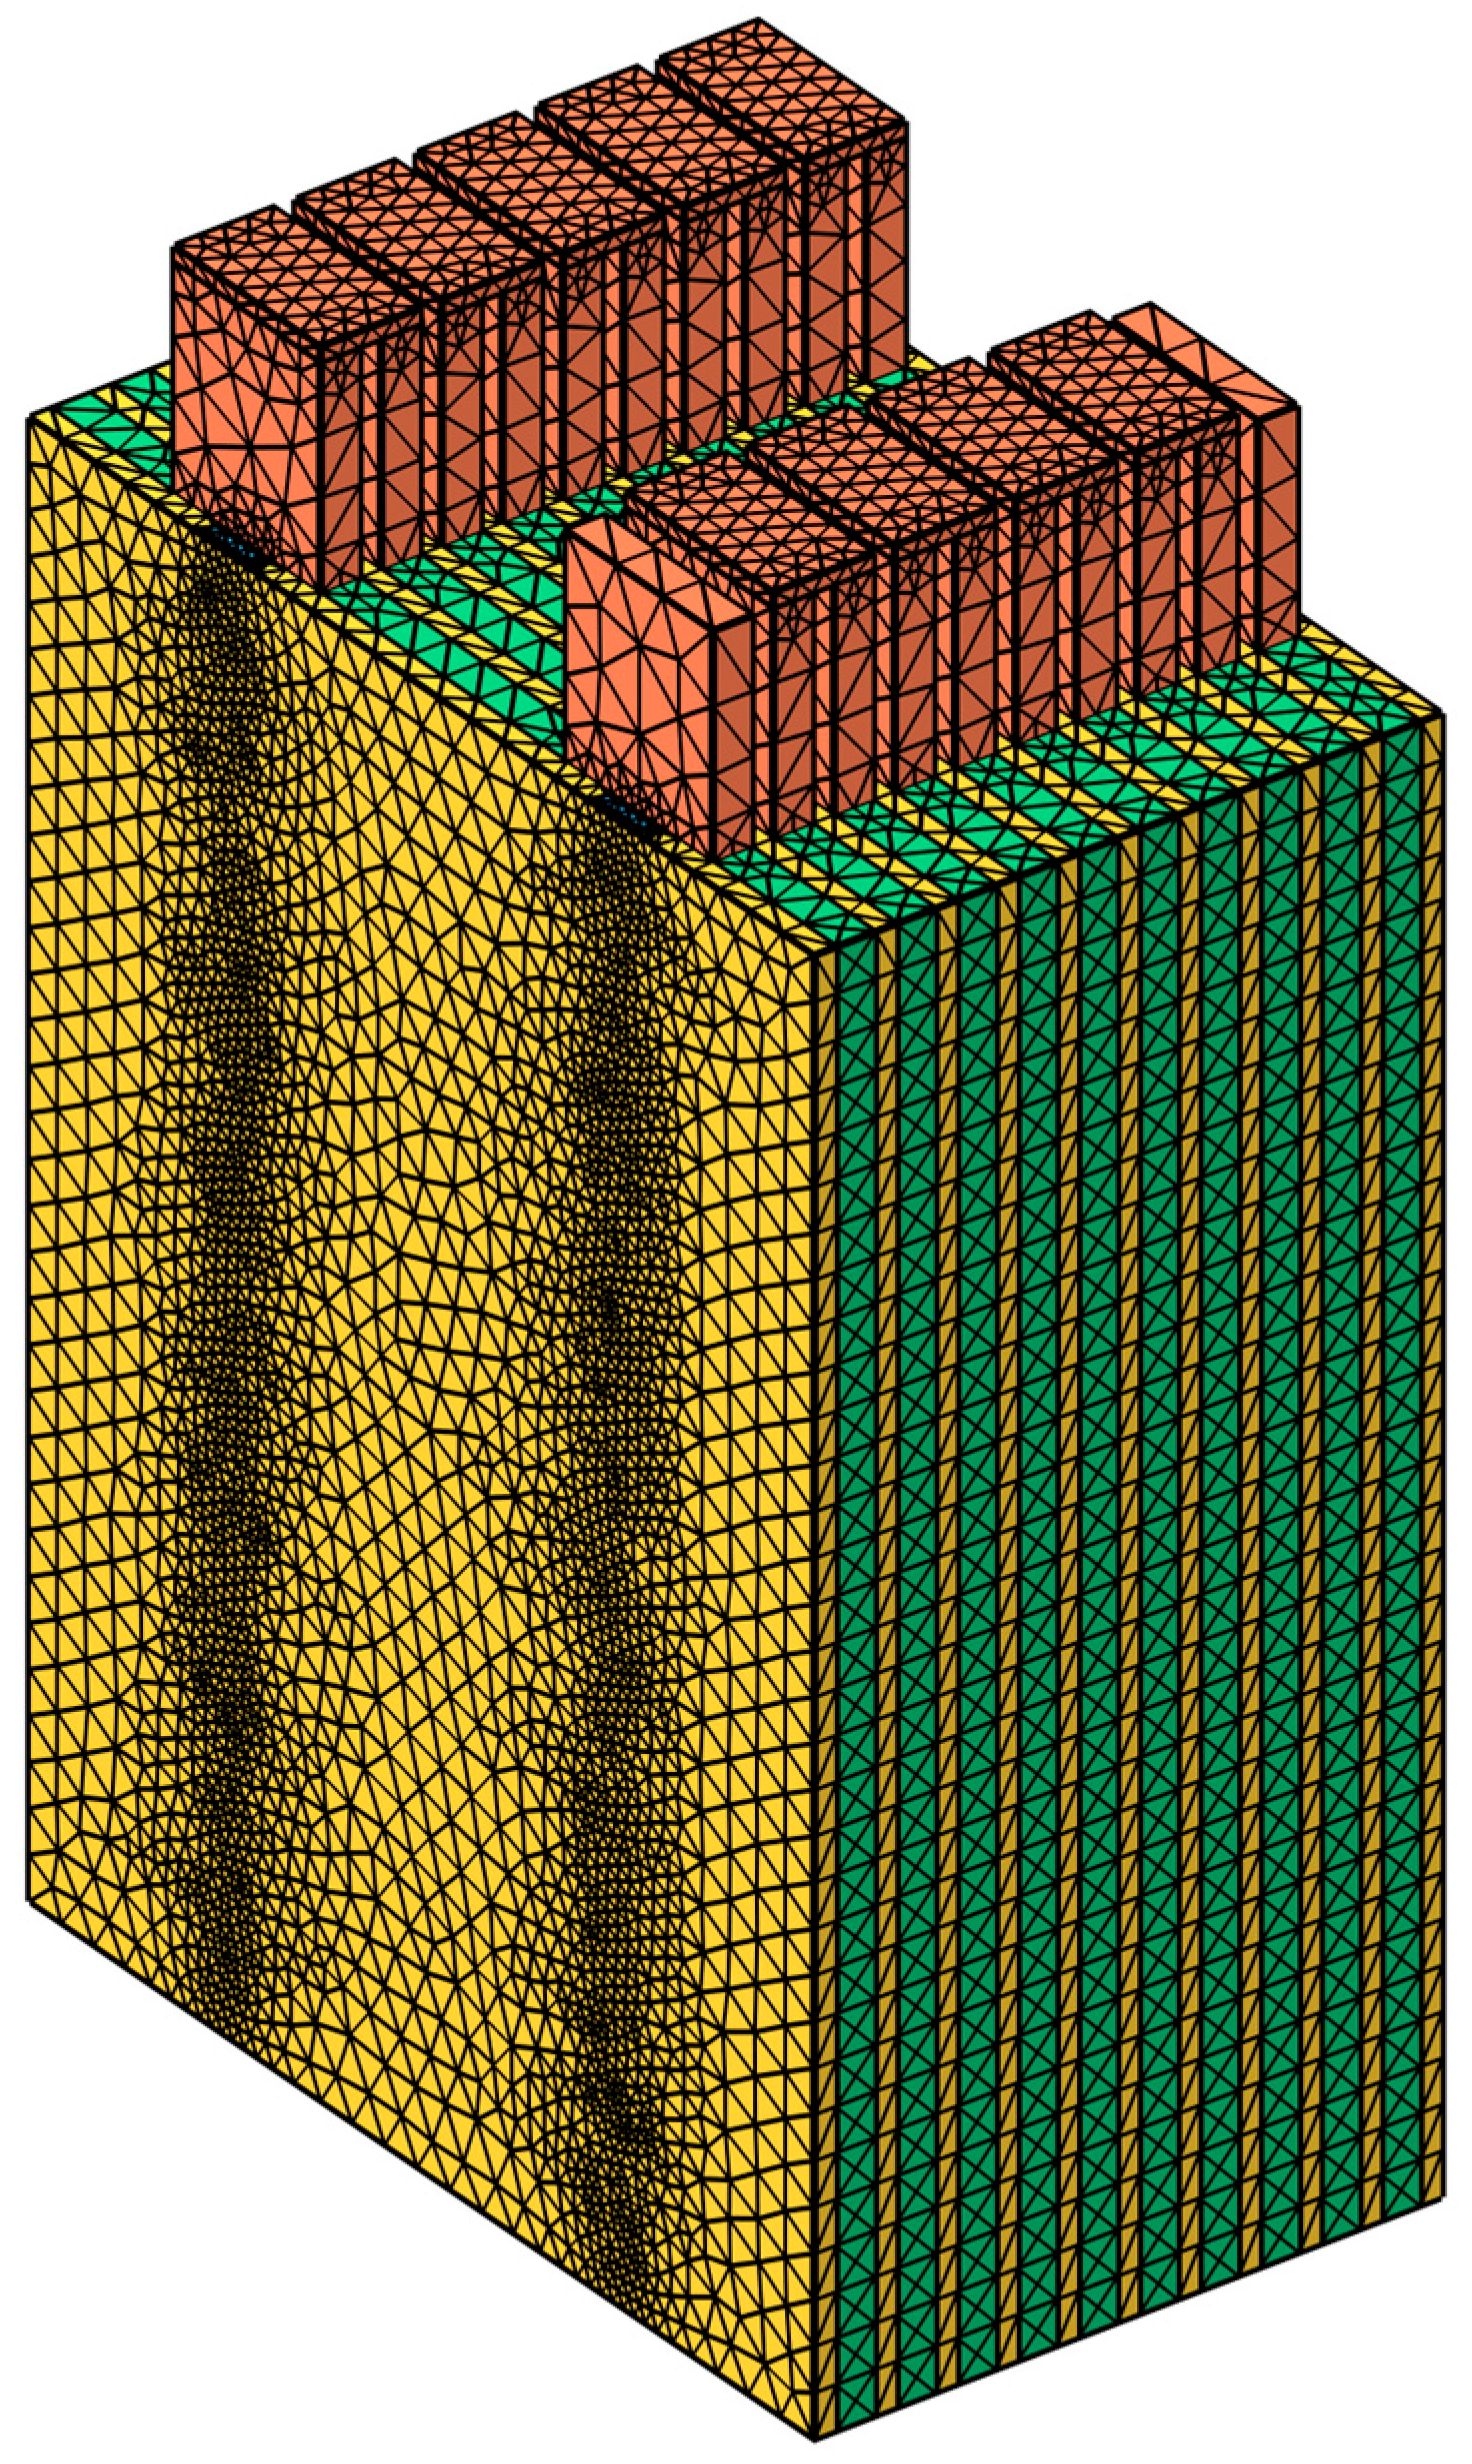
The three-dimensional coupled electrochemical–thermal numerical simulations were performed using the commercial CFD code ANSYS Fluent 2021 R2. The physical geometry construction and subsequent computational mesh generation were executed utilizing SpaceClaim and Fluent Meshing, respectively—both of which are integrated modules within the ANSYS software suite. To appropriately handle the complex geometric interfaces, an unstructured mesh with localized refinement was employed. A representative visualization of the generated computational grid is illustrated in Figure 2.
As depicted, dense inflation layers and refined grid cells were specifically applied within and adjacent to the internal microchannels to accurately resolve the steep hydrodynamic and thermal gradients in the boundary layers. Conversely, relatively coarser grids were assigned to the solid battery domains to optimize computational efficiency without compromising solution accuracy.
To bridge the spatial scale disparity between the 1D P2D electrochemical model and the 3D CFD thermal domain, the Multi-Scale Multi-Dimensional battery module provided by ANSYS Fluent was utilized. In this hierarchical coupling architecture, the 3D battery domain is discretized into macroscopic CFD grid cells. At each macroscopic time step and within each local 3D cell, the MSMD module automatically calls the 1D P2D sub-model to compute the local electrochemical kinetics and internal resistance based on the local temperature. The resulting volumetric heat generation is then mathematically mapped back as a source term into the 3D energy equation. Simultaneously, the 3D CFD solver computes the conjugate heat transfer and fluid flow to update the macroscopic temperature field, which is subsequently fed back to the 1D electrochemical sub-model for the next iteration. This robust two-way coupling enables the high-fidelity resolution of spatiotemporal thermal heterogeneity.
While traditional lumped heat source models (e.g., the Bernardi equation) are generally sufficient for low C-rate scenarios, they become inadequate under the 5 C discharge conditions investigated in this study. At such high discharge rates, severe non-linear activation polarizations and internal species diffusion limitations dominate the battery’s physical behavior. Lumped models, relying on simplified or constant internal resistances, inherently fail to capture these dynamic polarizations and the resulting highly non-uniform spatio-temporal heat generation. By explicitly resolving the fundamental electrochemical governing equations, the employed 1D + 3D coupled framework ensures high-fidelity predictions of both the transient thermal field and the dynamic electrochemical voltage response. This level of accuracy is essential for a rigorous evaluation of the microchannel cooling performance.
The governing equations were solved employing a pressure-based, segregated solver with the SIMPLE algorithm for pressure–velocity coupling. Second-order upwind schemes were adopted for the spatial discretization of both the momentum and energy equations to minimize numerical diffusion. The convergence criteria were set such that the normalized residuals for the continuity equation fell below 10−4, while those for the energy equation were required to decrease below 10−6.

2.3.2. Grid and Time-Step Independence Study

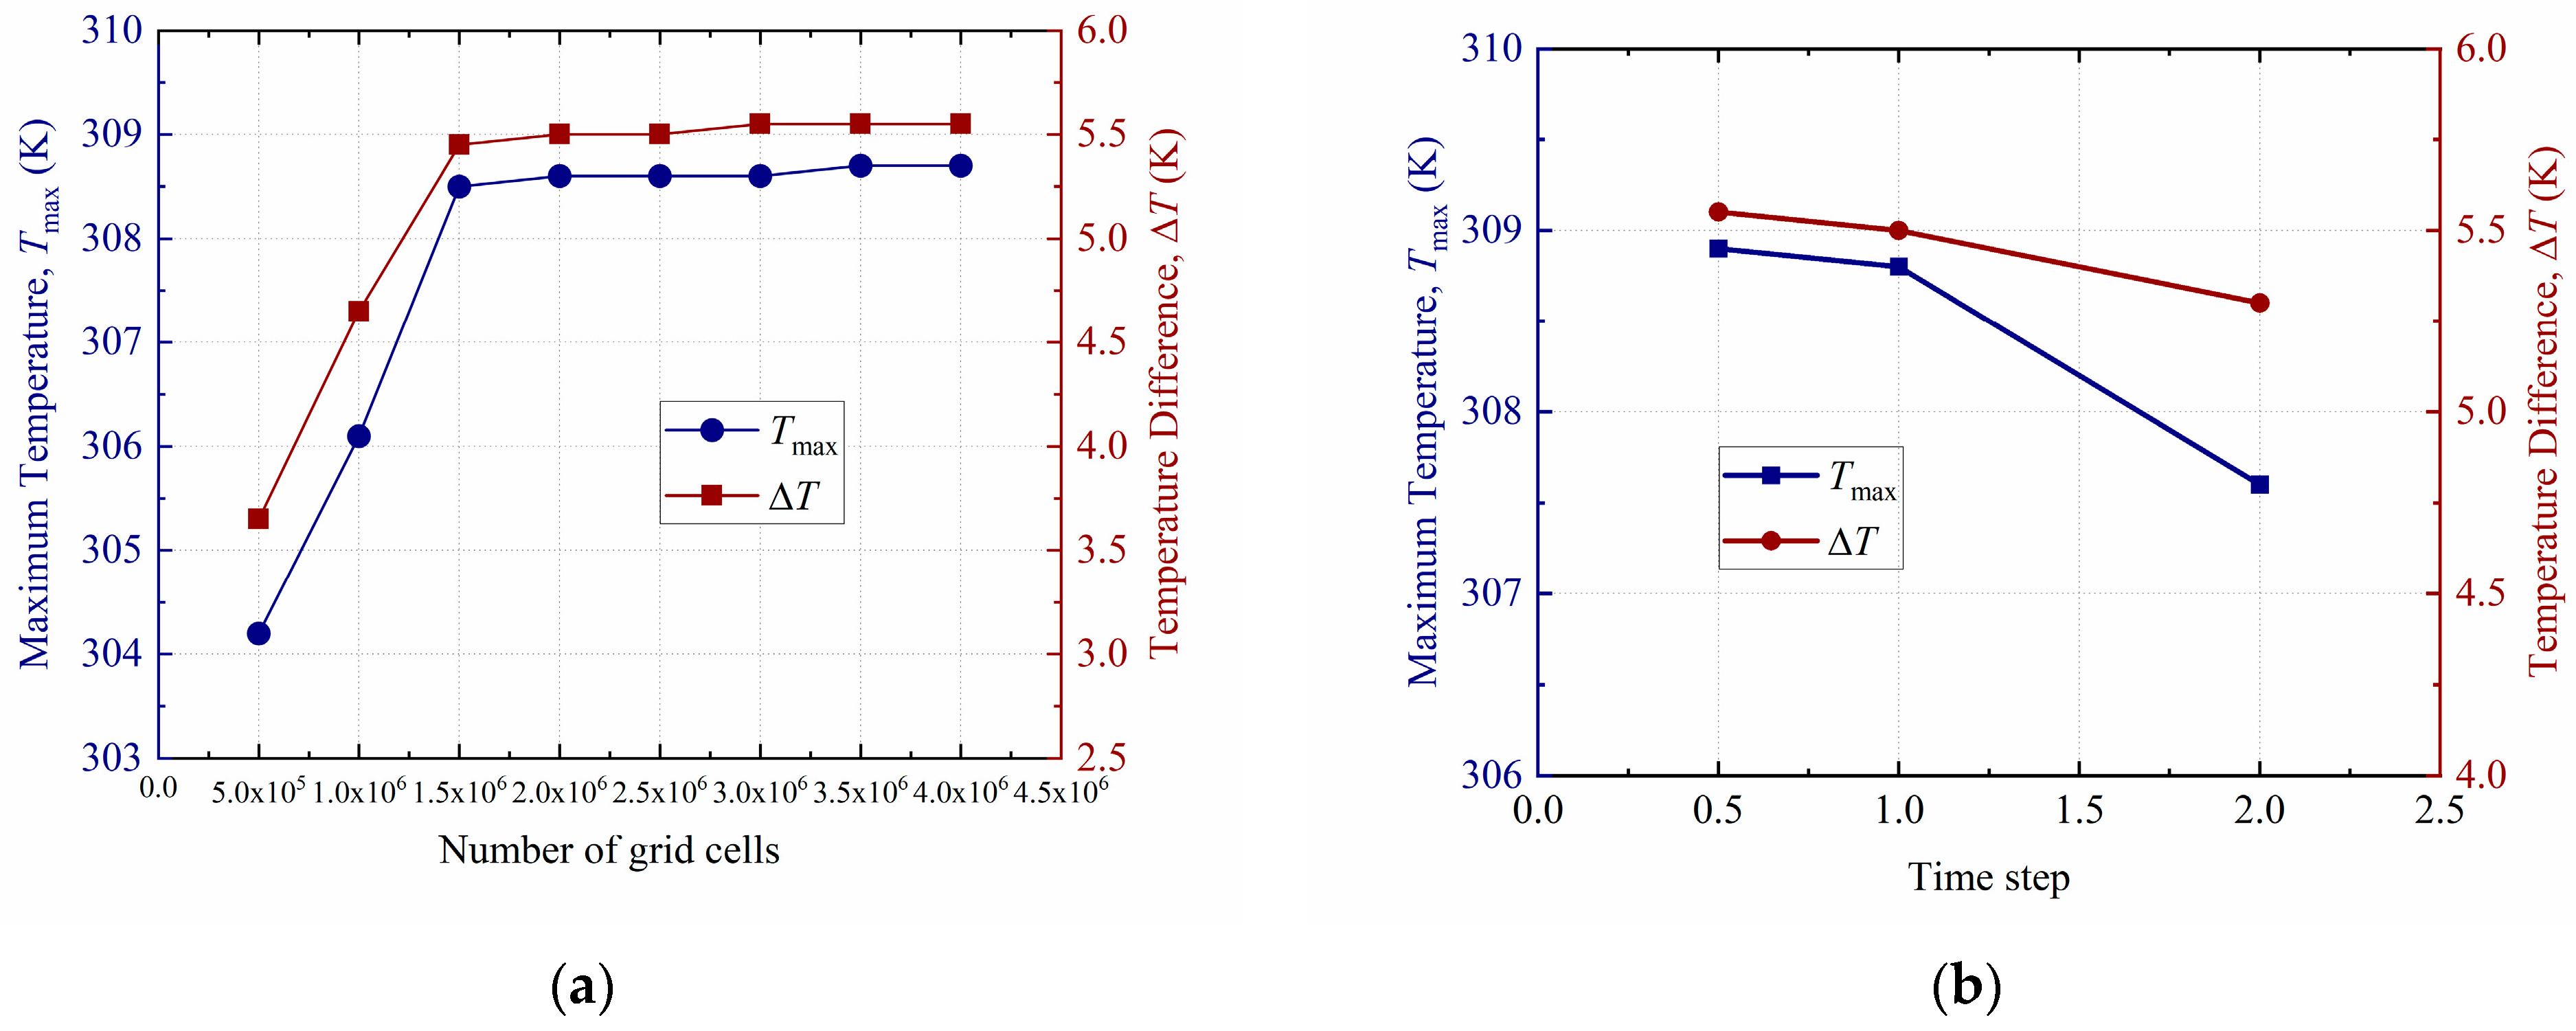
To ensure that the numerical results are independent of the spatial discretization, a rigorous grid independence study was conducted. Eight mesh configurations with progressively increasing cell counts, ranging from 5 × 10 5 to 4 × 10 6 elements, were systematically evaluated. The maximum battery temperature (Tmax) and the maximum temperature difference ( Δ T ) at the end of the discharge cycle were selected as the monitored variables. As summarized in Figure 3a, both Tmax and Δ T exhibit a monotonic convergence trend with increasing grid density. Notably, when the grid count exceeds 2.5 × 10 6 , the monitored variables become virtually invariant. Specifically, the absolute difference in Tmax between the 3 × 10 6 and 4 × 10 6 element configurations is less than 0.05 K, while Δ T remains identical. Consequently, a computational grid comprising approximately 3 × 10 6 hexahedral cells was adopted for all subsequent simulations, representing an optimal balance between computational accuracy and efficiency.
Furthermore, a rigorous time-step independence test was performed. As illustrated in Figure 3b, reducing the time step from 2.0 s to 1.0 s leads to a noticeable correction in the transient temperature prediction. However, further refining the time step to 0.5 s yields negligible temperature variations (with an absolute temperature deviation of less than 0.1 K). To achieve an optimal balance between transient solution fidelity and computational efficiency, a time step of 1.0 s was selected for all transient computations.

2.3.3. Model Validation

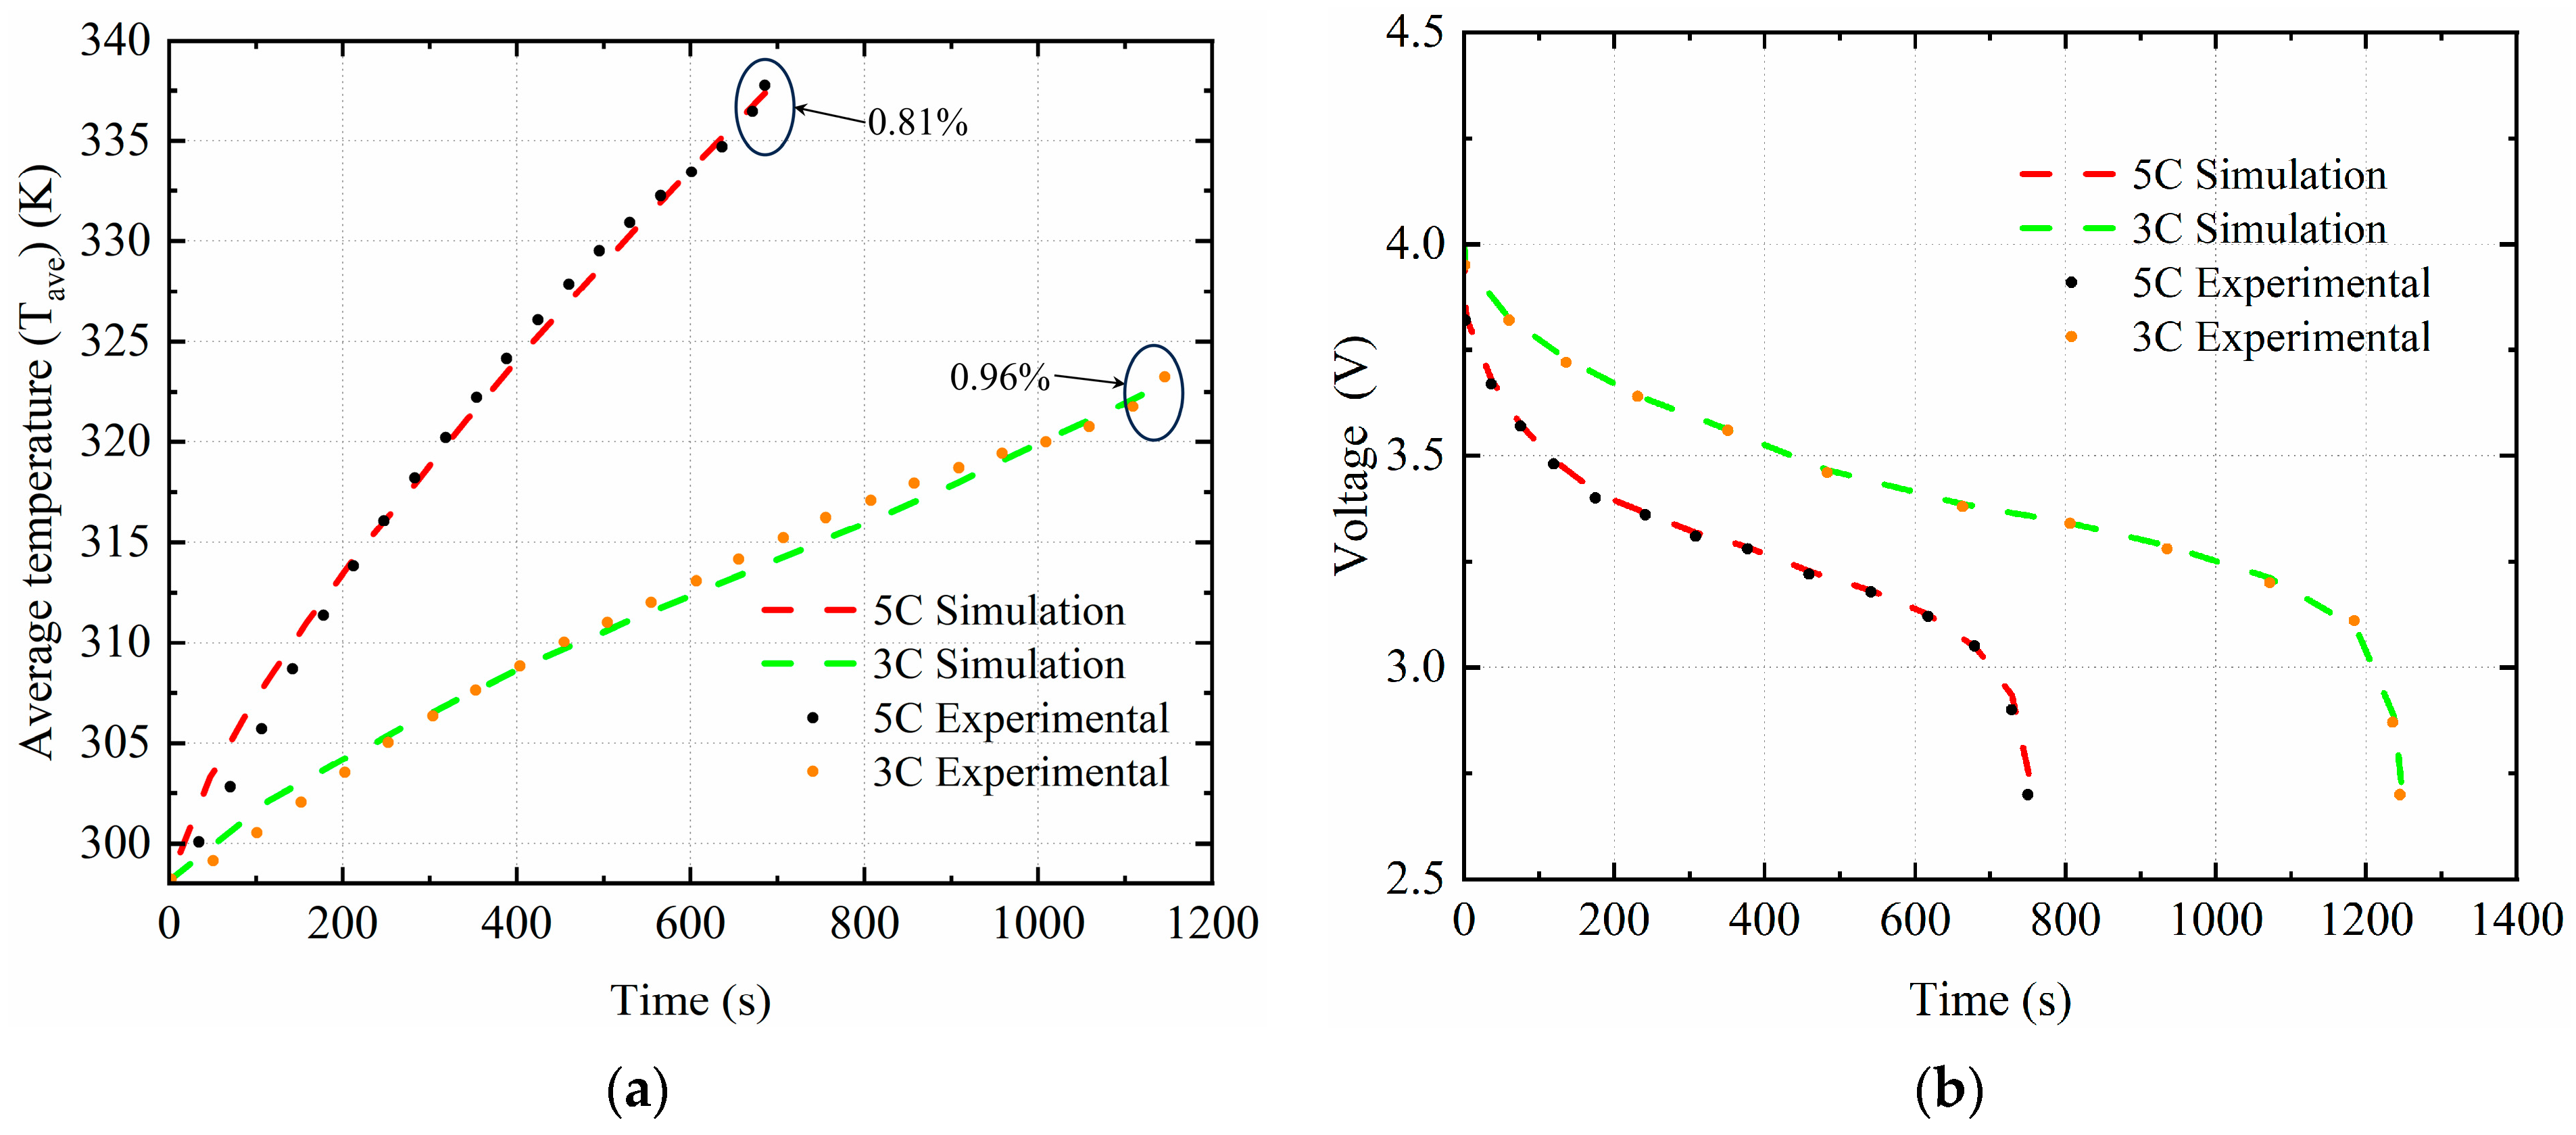
To establish the credibility and predictive robustness of the proposed comprehensive framework, the numerical results were rigorously validated against experimental data [29] under multiple operating conditions. As presented in Figure 4a, the simulated transient average temperature profiles closely track the experimental measurements [29] at both 5 C and 3 C discharge rates. For a rigorous assessment of the model’s predictive accuracy, the relative error was calculated using the transient temperature rise. Under an initial temperature of 298 K, the experimental and simulated peak temperatures at the 5 C rate are 337.74 K and 337.42 K, respectively, yielding a relative temperature rise error of only 0.81%. Similarly, at the 3 C rate, the experimental and simulated peak temperatures are 323.00 K and 323.24 K, respectively, corresponding to a relative error of merely 0.96%.
Furthermore, Figure 4b demonstrates that the simulated voltage–time curves successfully capture the electrochemical polarization characteristics, showing excellent agreement with the experimental discharge profiles across different C-rates. The fact that the maximum relative error in temperature rise is strictly constrained below 1.0% under extreme thermal loads firmly validates the high fidelity of the coupled electrochemical–thermal model, justifying its application in subsequent parametric investigations.
While the employed Newman P2D model demonstrates high accuracy overall, it is acknowledged that under extreme high-rate discharges (e.g., beyond 5 C), the model may encounter inherent limitations, such as difficulties in perfectly resolving severe localized electrolyte depletion or extreme lithium concentration gradients within the solid particles. Nevertheless, as evidenced by the validation results, the current coupled framework retains sufficient fidelity to evaluate the macroscopic thermal–hydraulic performance of the cold plate design reliably.

3. Results and Discussions

3.1. Comparison of Battery Temperature Distribution Under Different Ambient Temperatures

To systematically evaluate the environmental adaptability and thermal robustness of the proposed battery thermal management system (BTMS), the thermal performance of the battery module was comprehensively investigated under a wide range of ambient temperatures (Tamb), spanning from 293 K to 343 K at intervals of 10 K [30]. Within this numerical framework, Tamb defines the initial temperature of the battery module prior to discharge. To simulate an active vehicle thermal management system, the coolant inlet temperature is fixed at 300 K across all ambient conditions. This temperature range was deliberately selected to encompass typical operating scenarios encountered in practical electric vehicle applications, from mild climate conditions (293 K) to extreme high-temperature environments (343 K). For this comparative analysis, the cooling structure was configured with a fixed 2-channel layout and subjected to a demanding 5 C constant current discharge rate.
As the simulations focus on a single transient discharge cycle (e.g., 720 s), long-term degradation mechanisms such as SEI growth and lithium plating are omitted. Additionally, previous studies [31] have demonstrated that using temperature-independent thermophysical properties for a brief discharge period introduces a relative error of less than 2%, validating this simplification.
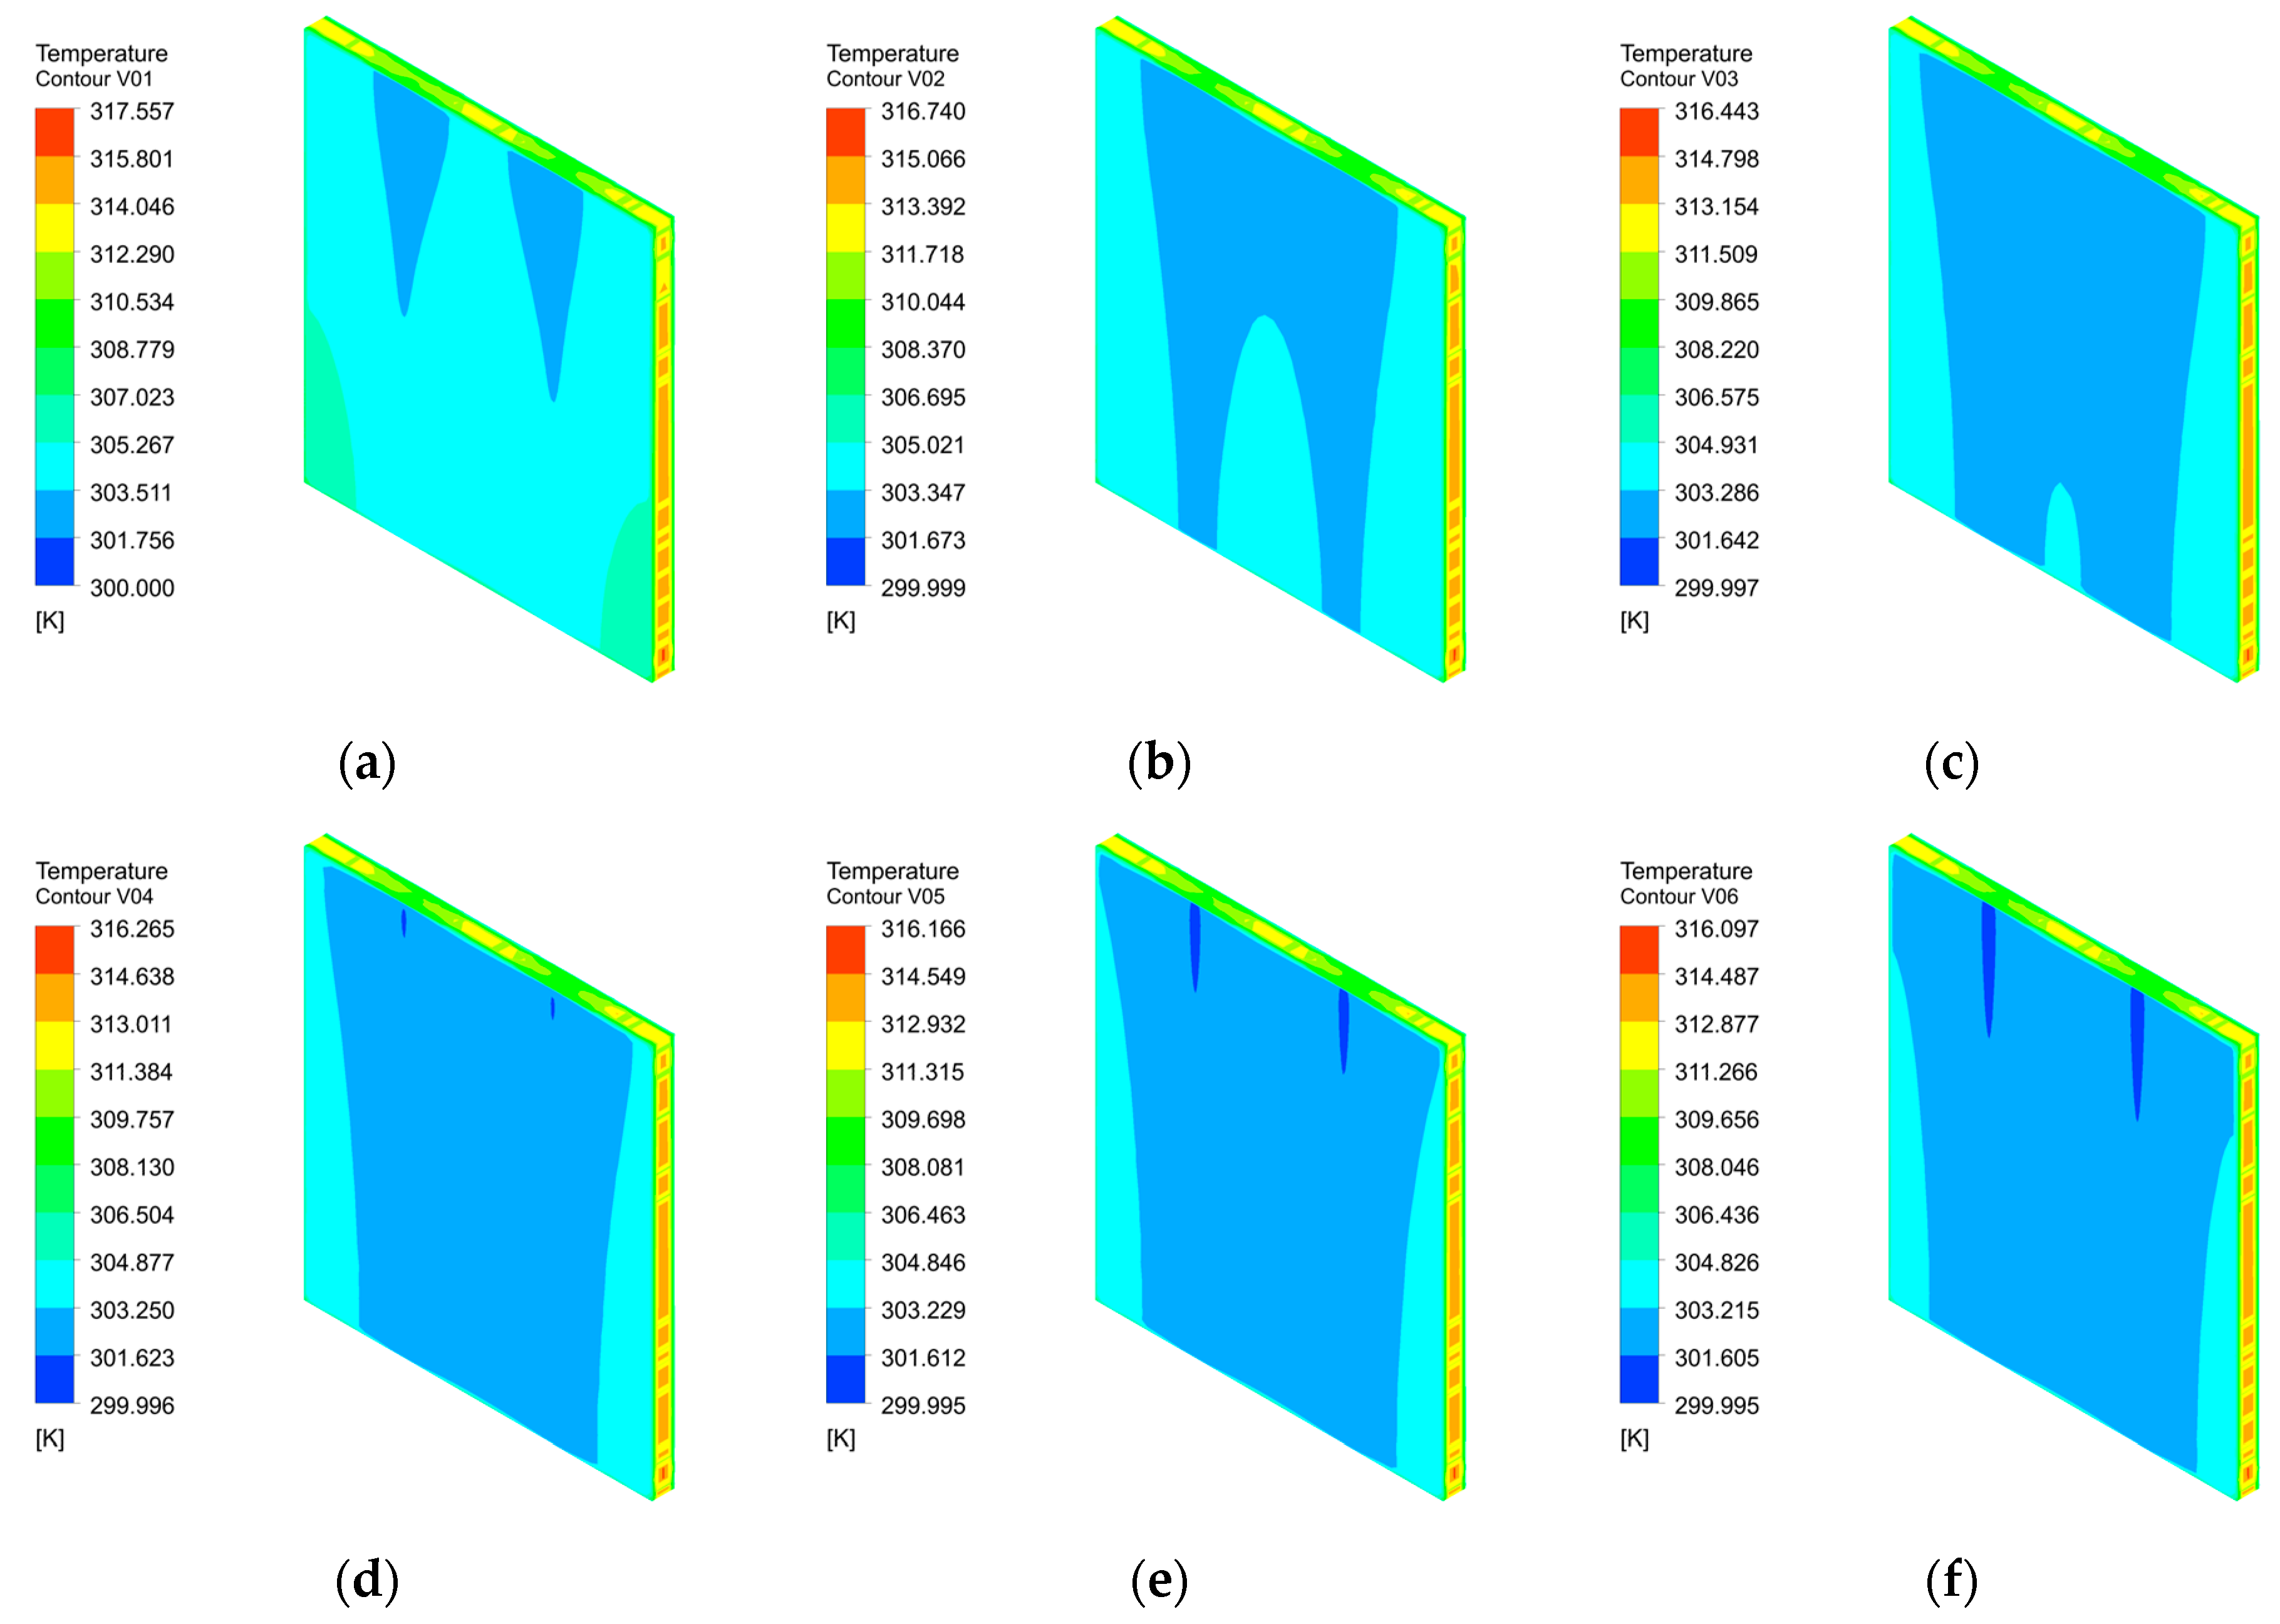
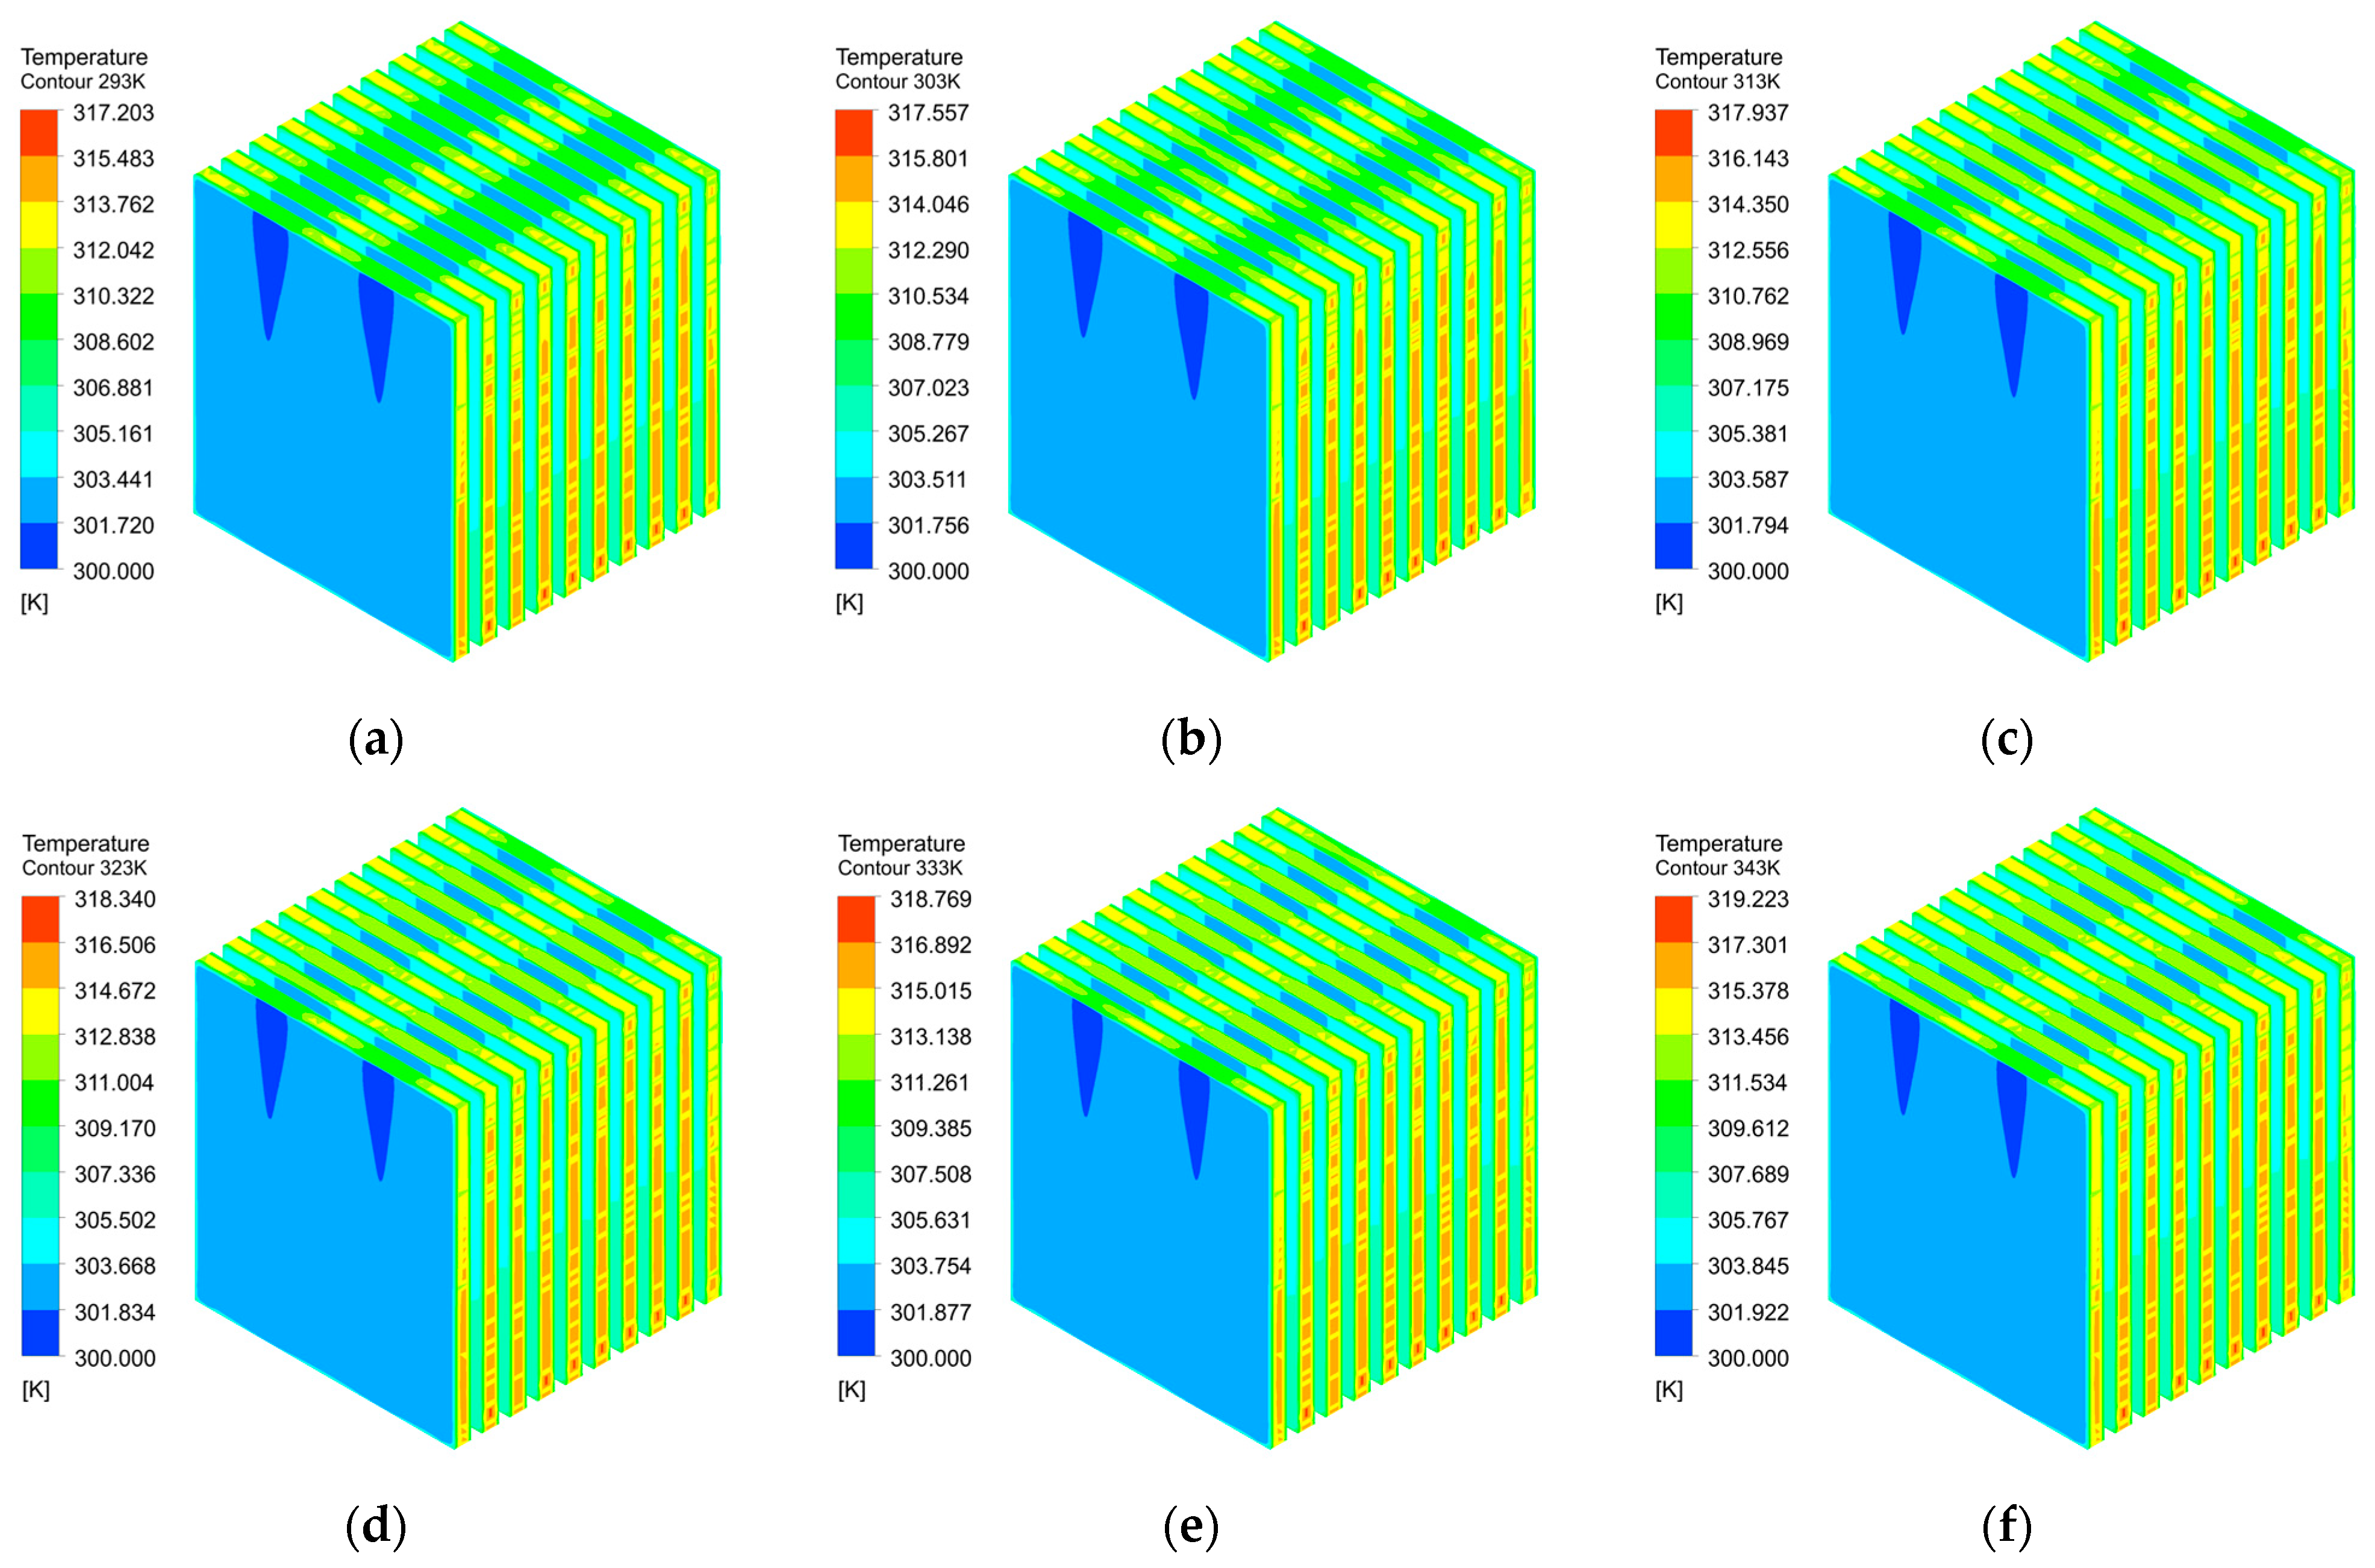
Figure 5 presents the three-dimensional temperature contours of the battery module captured at the end of the discharge cycle under six different ambient conditions. Several noteworthy observations can be drawn from these contour plots. First, across all ambient temperature cases, the overall temperature distribution pattern within the battery module remains qualitatively consistent: the highest temperatures are concentrated in the central region of the cells, which is farthest from the cooling channels, while the regions adjacent to the mini-channel cold plates exhibit noticeably lower temperatures due to the direct convective heat extraction by the coolant. This spatial distribution pattern confirms that the mini-channel liquid cooling structure effectively establishes a favorable temperature gradient directed from the cell interior toward the cooling surfaces. Second, as the ambient temperature progressively increases from 293 K to 343 K, the high-temperature zones (represented by the warm-colored regions) gradually expand in spatial extent, indicating a progressive weakening of the overall heat dissipation capacity. Nevertheless, even under the most extreme ambient condition of 343 K, the temperature field remains relatively uniform without any pronounced localized hot spots, demonstrating the inherent thermal regulation capability of the proposed cooling architecture.
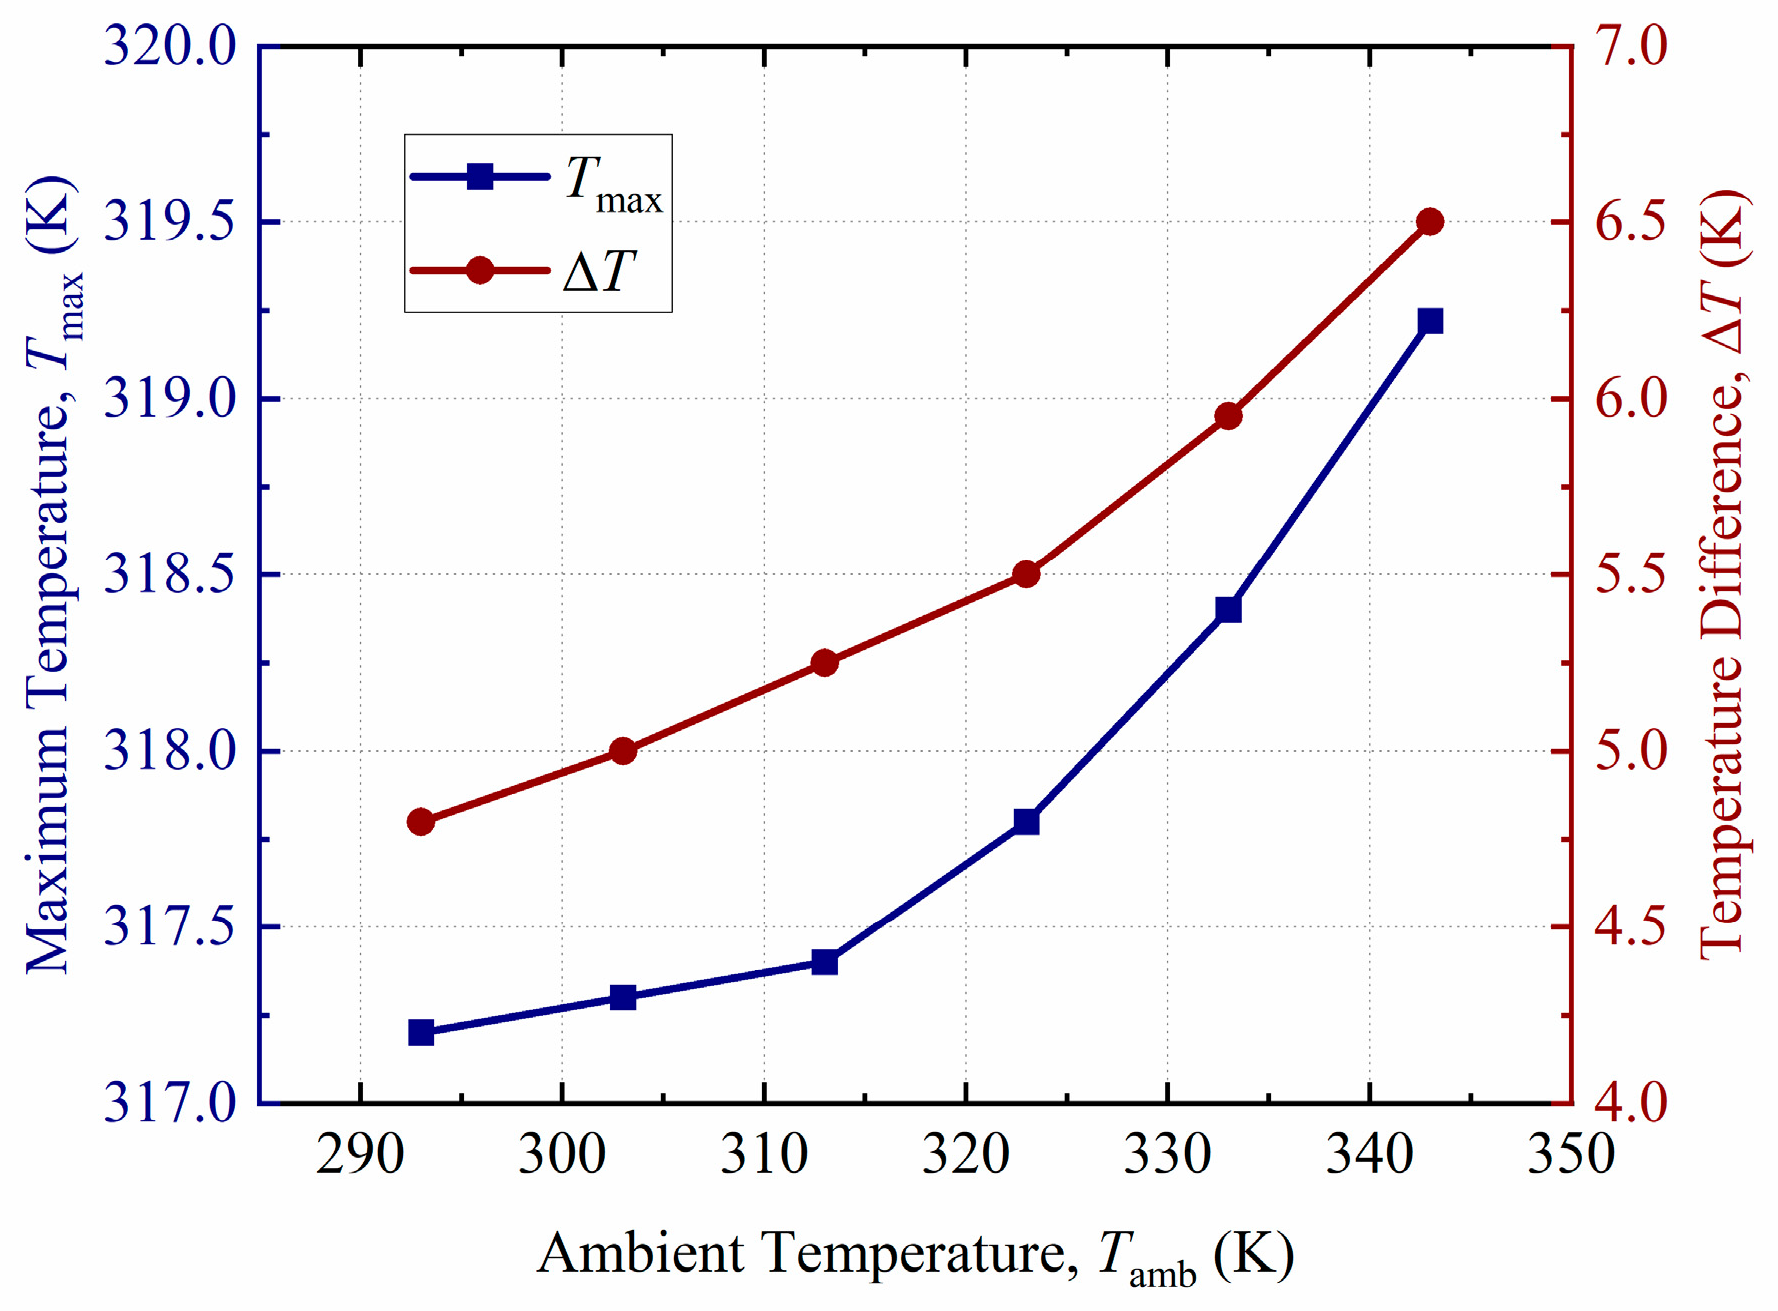
Figure 6 quantitatively summarizes the variations in the Tmax and the ΔT as a function of ambient temperature. As Tamb increases from 293 K to 343 K, both Tmax and ΔT exhibit a monotonically increasing trend. Specifically, under standard ambient conditions (Tamb = 293 K), Tmax is maintained at 317.2 K with a ΔT of approximately 4.8 K, indicating excellent thermal control performance. When the ambient temperature rises to the extreme condition of 343 K, Tmax increases to 319.2 K and ΔT expands to 6.5 K. Over the entire 50 K span of ambient temperature variation, the total increment in Tmax is merely 2.0 K, while ΔT increases by only 1.7 K, reflecting the strong thermal buffering effect of the liquid cooling system against external environmental disturbances.
It is worth noting that the rate of increase in both Tmax and ΔT is not strictly linear but exhibits a discernible acceleration at elevated ambient temperatures, particularly beyond Tamb = 323 K. This non-linear behavior can be attributed to the reduction in the driving temperature difference between the coolant and the battery surface at higher ambient temperatures, which diminishes the convective heat transfer efficiency and consequently weakens the cooling effectiveness. Despite this trend, the maximum battery temperature across all investigated conditions remains well below the widely recognized safety threshold of 323 K (50 °C), and the temperature non-uniformity is consistently maintained within 7 K, which is far below the commonly accepted upper limit of 10 K for ensuring balanced electrochemical performance and preventing accelerated degradation among cells. Although the spatial temperature difference reaches 6.5 K at an ambient temperature of 343 K, slightly exceeding the 5 K target, it remains well below the 10 K limit necessary to maintain electrochemical balance and prevent accelerated cell degradation. These results collectively demonstrate that the proposed BTMS possesses excellent environmental adaptability and is capable of providing reliable and effective thermal protection for the battery module across a broad spectrum of ambient operating conditions.

3.2. Comparison of Battery Temperature Distribution Under Different Microchannel Numbers

To systematically investigate the influence of cooling channel density on the thermal regulation performance of the proposed BTMS, the number of microchannels embedded within the cold plate was varied from 2 to 6, while all other geometric and operating parameters were held constant. Importantly, to decouple the overlapping influences of channel count and coolant flow rate, the inlet velocity for each individual microchannel was strictly maintained at 0.1 m/s across all cases. Consequently, the total volumetric flow rate supplied to the liquid cooling system scaled linearly with the number of parallel channels. The ambient temperature was maintained at 303 K, and the battery module was subjected to a demanding 5 C constant current discharge rate to ensure a sufficiently high thermal load for meaningful comparison.
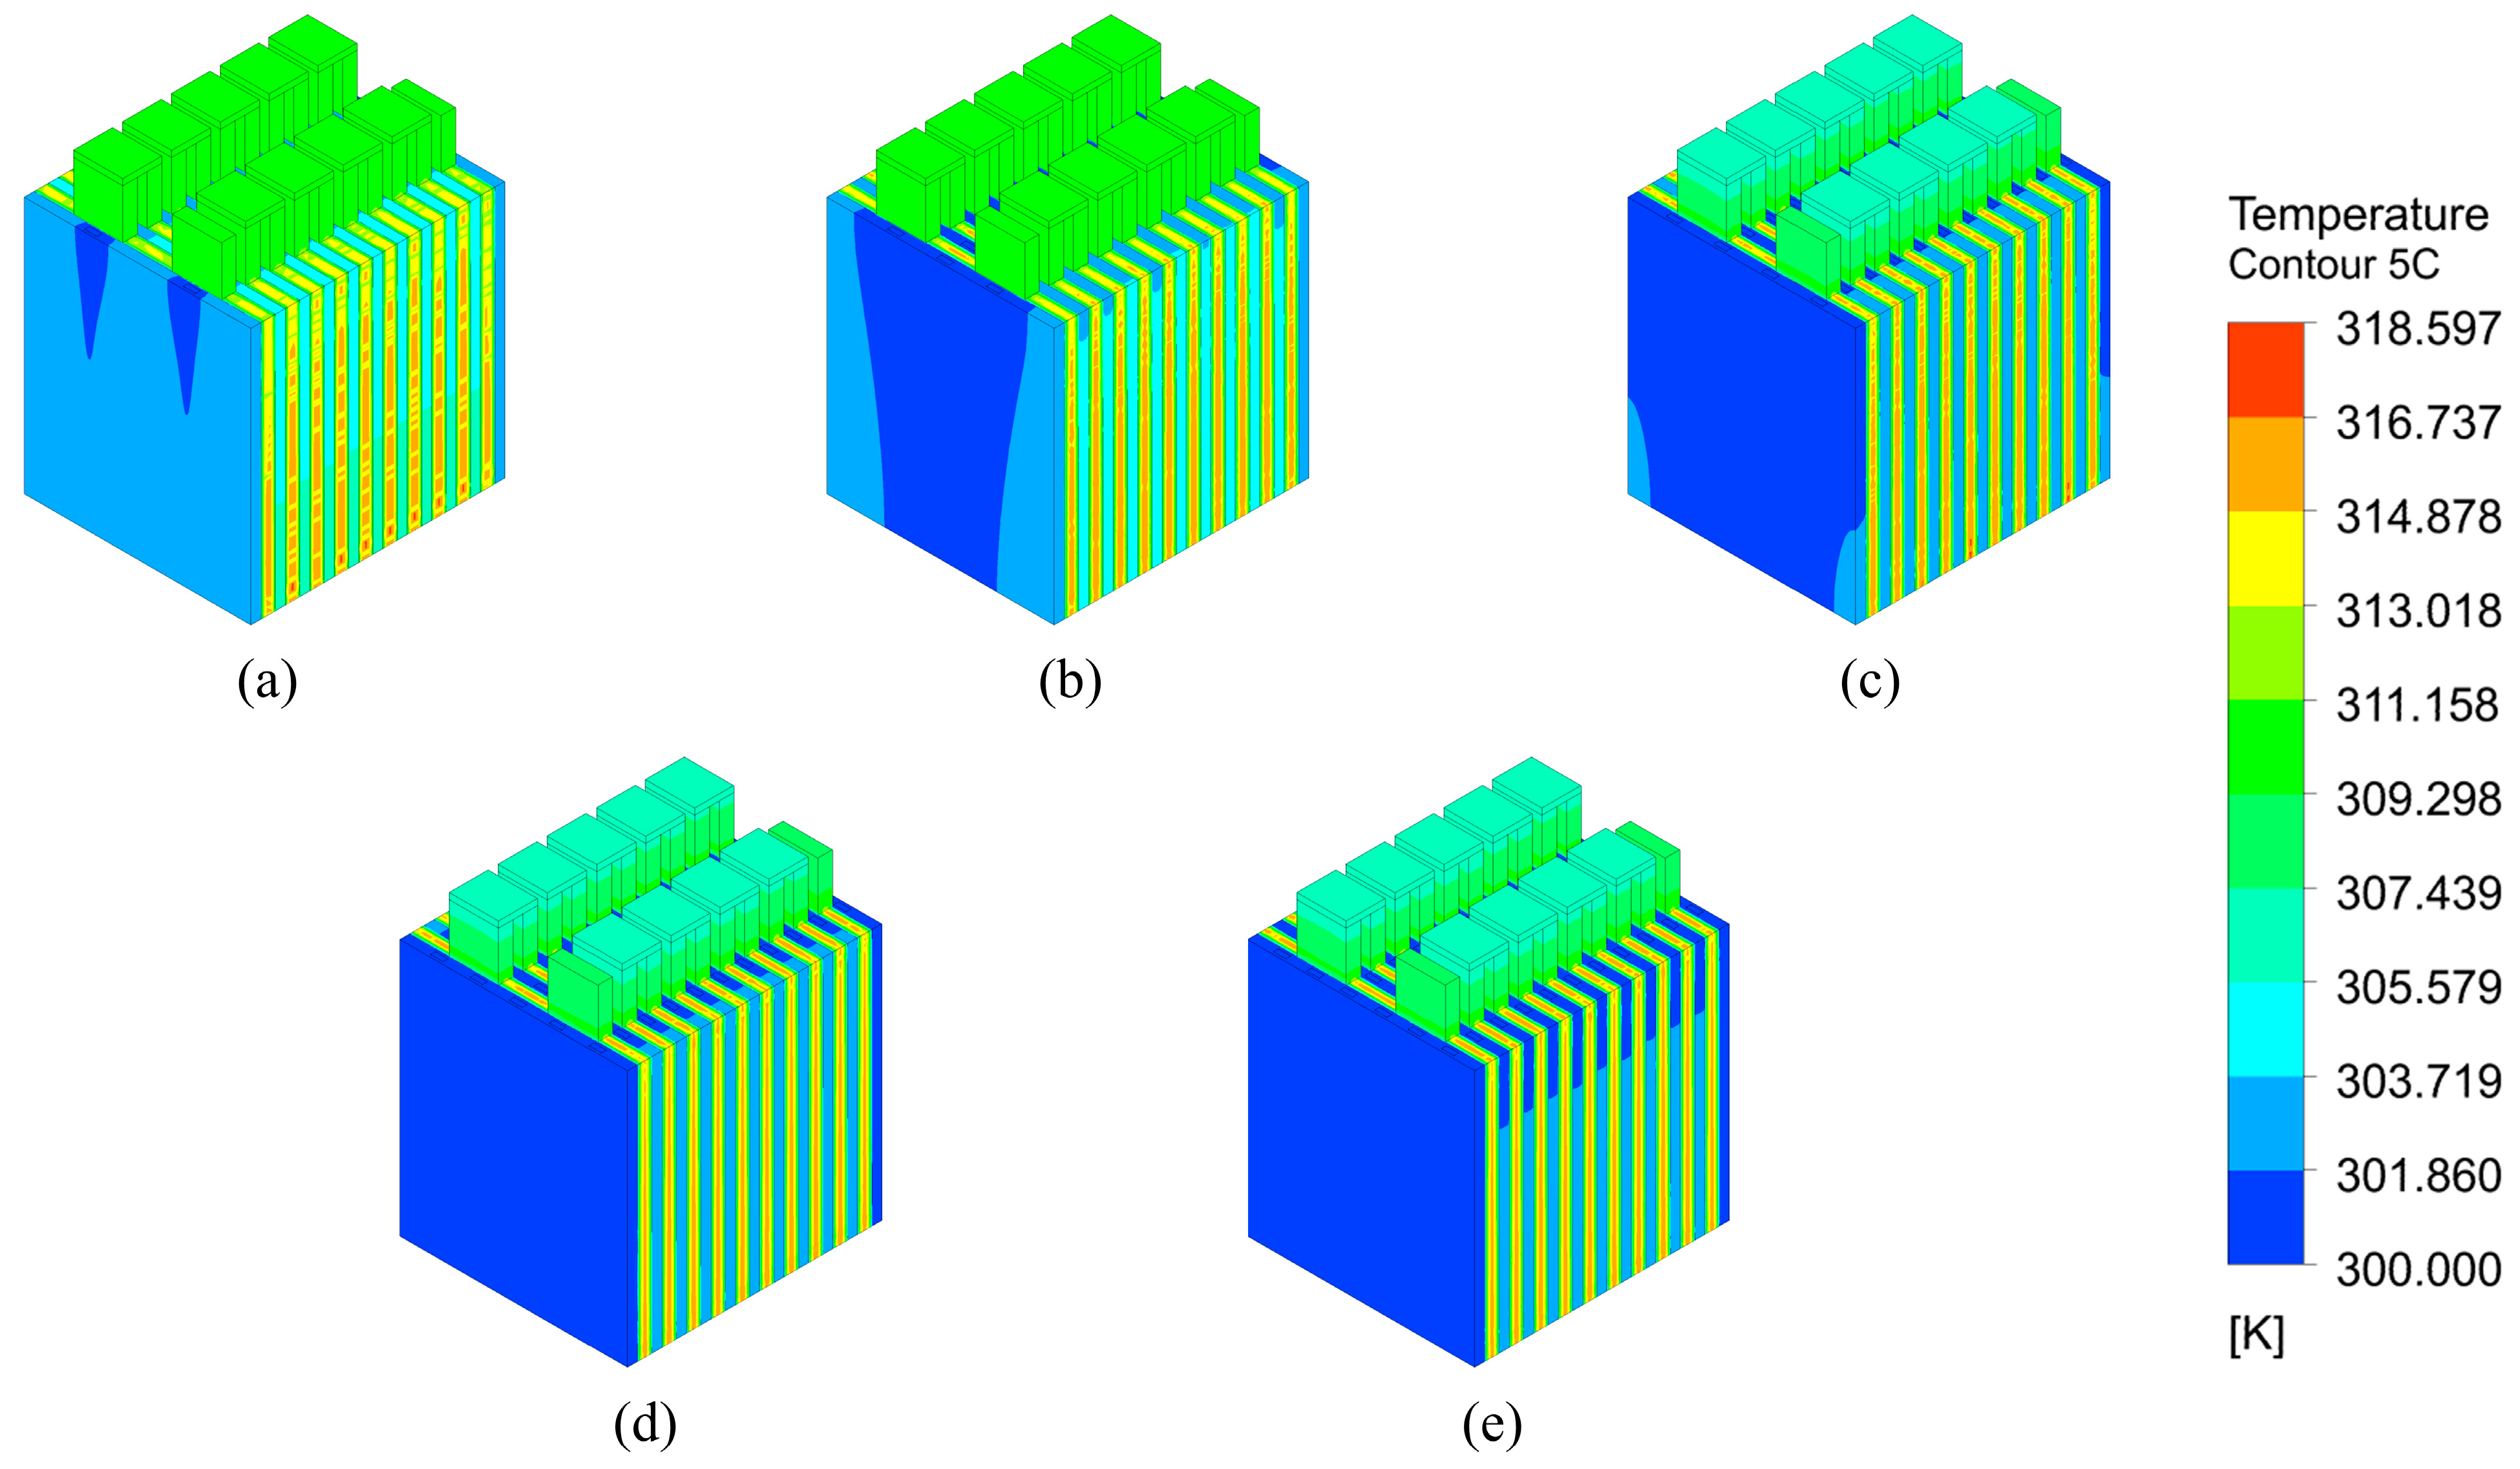
Figure 7 presents the three-dimensional temperature contours of the battery module captured at the end of the 5 C discharge cycle for configurations with 2, 3, 4, 5, and 6 cooling channels, respectively. These contour plots provide an intuitive and qualitative visualization of the spatial thermal field, enabling a direct assessment of the thermal regulation efficacy associated with each channel configuration. As clearly observed in Figure 7a, the 2-channel configuration exhibits pronounced localized high-temperature zones—indicated by the red and orange regions—concentrated predominantly in the interstitial areas between adjacent cooling channels. This thermal pattern suggests that the sparse channel arrangement fails to provide sufficient convective heat extraction in these thermally stagnant zones, resulting in significant heat accumulation and a highly non-uniform temperature field. As the number of microchannels progressively increases from 2 to 6 (Figure 7a–e), a marked and systematic thermal evolution is observed: the high-temperature regions diminish substantially in both magnitude and spatial extent, and the overall temperature distribution transitions towards a considerably more homogeneous state. Notably, in the 5-channel and 6-channel configurations (Figure 7d,e), the temperature field becomes predominantly blue-toned, with only marginal temperature gradients visible across the battery surfaces, indicating that the cooling capacity has approached a level sufficient to effectively suppress nearly all localized thermal accumulation.
The progressive enhancement in thermal performance with increasing channel count can be attributed to two synergistic physical mechanisms. First, increasing the number of channels significantly expands the total effective heat transfer surface area between the cold plate and the battery cells, thereby augmenting the overall convective heat dissipation capacity. Second, a denser channel arrangement substantially shortens the conductive heat transfer path from the internal heat generation core of the battery to the nearest coolant channel, effectively reducing the local thermal resistance [32]. The combined effect of these two mechanisms ensures that the internally generated heat is more rapidly and uniformly extracted, thereby mitigating the thermal hotspots that are prevalent in configurations with fewer channels.
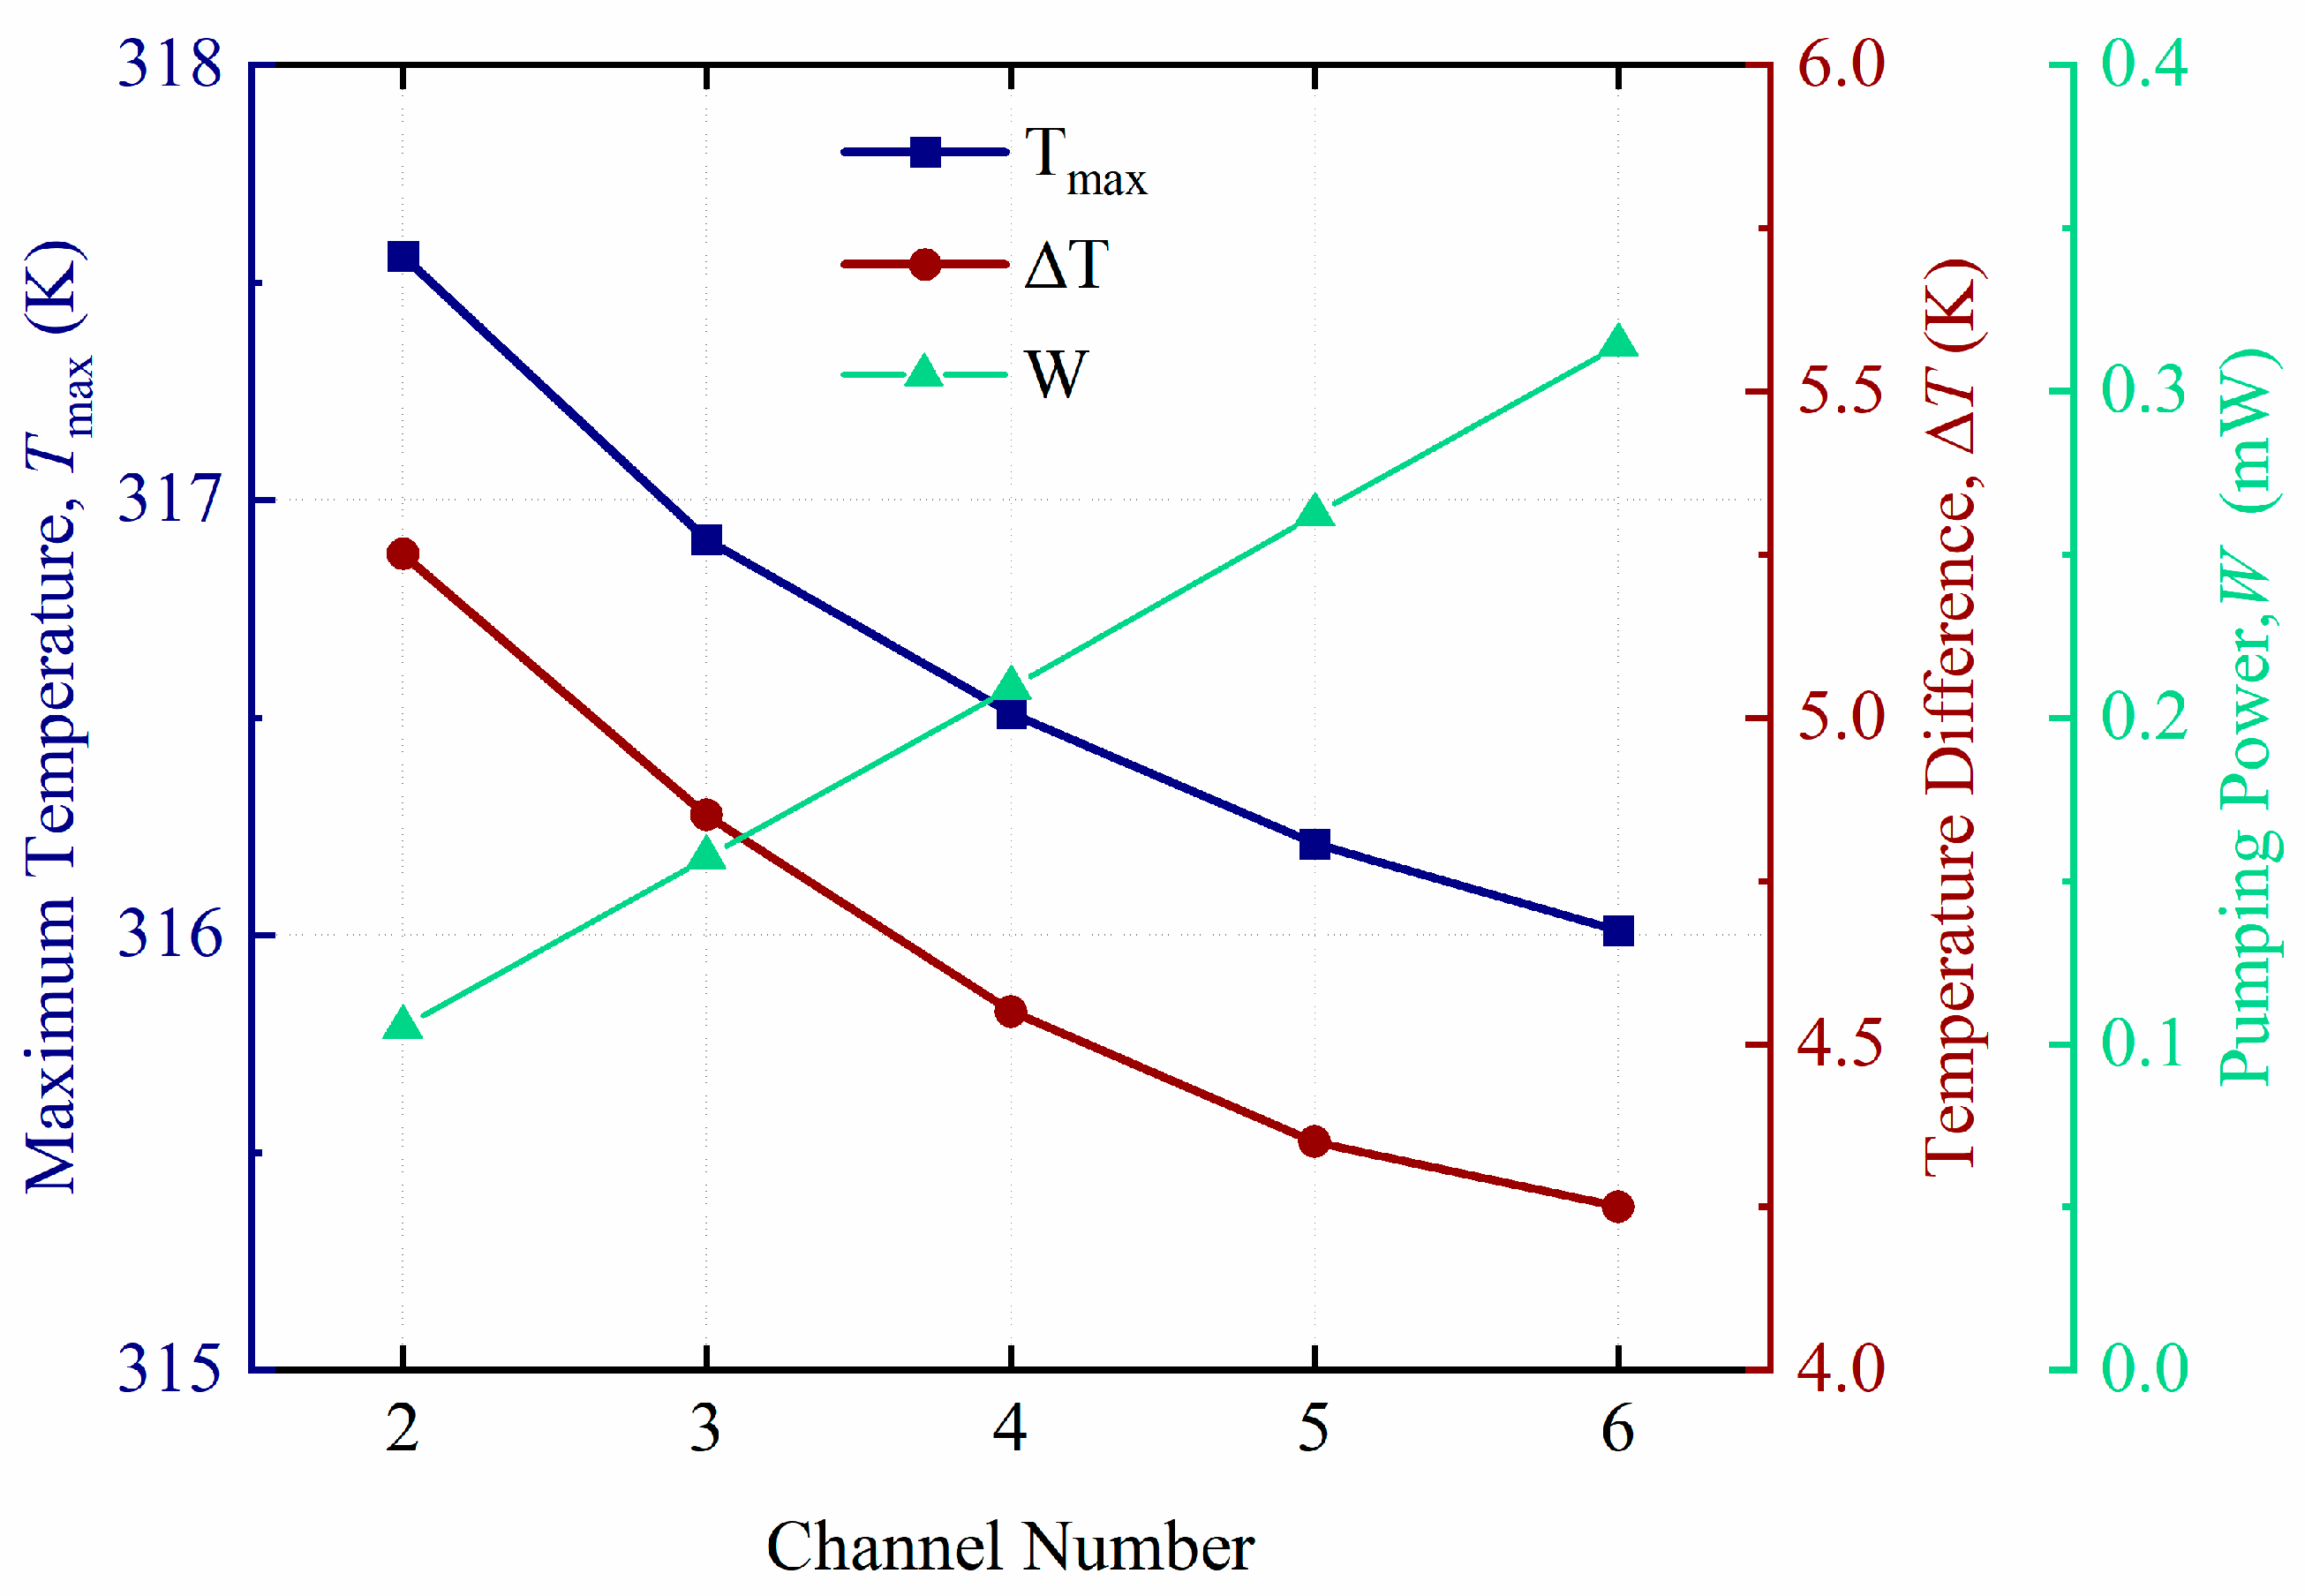
To comprehensively evaluate the trade-off between thermal enhancement and the associated hydraulic penalty, Figure 8 presents the terminal maximum temperature ( T m a x ), the maximum temperature difference ( Δ T ), and the pumping power consumption ( W ) as functions of the channel number.
Under the 2-channel baseline configuration, the system exhibits a fundamental cooling capacity, resulting in a peak T m a x of 317.56 K and a Δ T of 5.25 K at the end of discharge. According to recent studies [8], a spatial temperature difference of approximately 5 K is generally considered acceptable and satisfies established thermal safety standards for lithium-ion batteries. Thus, the 2-channel design serves as a valid functional baseline. Nevertheless, operating near this upper limit provides a limited thermal safety margin. In contrast, the 6-channel configuration demonstrates markedly superior thermal suppression capability, limiting the peak T m a x to 316.01 K and narrowing Δ T to 4.25 K. This reduction of 1.55 K in T m a x and 1.00 K in Δ T significantly enhances the spatial thermal uniformity, thereby providing a more robust thermal environment to preserve electrochemical consistency among cells.
Furthermore, as depicted in Figure 8, the hydraulic penalty associated with adding microchannels was quantitatively evaluated. Because the inlet velocity per channel is fixed at 0.1   m / s , the frictional pressure drop across the parallel microchannels remains relatively stable. However, the linear increment in the total volumetric flow rate causes the parasitic pumping power to scale proportionally, rising from 0.105   m W for the 2-channel design to 0.314   m W for the 6-channel configuration. Given the negligible absolute hydraulic penalty ( 0.314   m W ) at this moderate flow rate, the 6-channel configuration provides an optimal balance, effectively widening the thermal safety margin without introducing significant parasitic energy consumption.

3.3. Effect of Coolant Inlet Velocity on Thermal–Hydraulic Performance

To further optimize the operating parameters of the proposed liquid cooling system, the influence of coolant inlet velocity ( V i n ) on the coupled thermal–hydraulic response of the battery module was systematically investigated. In this parametric study, the cooling structure was fixed with the 2-channel configuration. Consistent with the active thermal regulation strategy described previously, the coolant (water) was introduced at a constant, regulated inlet temperature of 300 K. The inlet velocity was varied over a broad range from 0.1 m/s to 0.6 m/s at increments of 0.1 m/s, corresponding to a Reynolds number range of approximately 260–1560. This range remains well within the laminar flow regime ( R e < 2300 ) and represents practical liquid cooling system operating conditions. The battery module was subjected to a 5 C constant-current discharge rate throughout all cases to maintain a demanding thermal load for comparative evaluation.
Figure 9 presents the temperature contours of the battery module at the end of the 5 C discharge process under six different coolant inlet velocities. A progressive improvement in the thermal field is clearly discernible as V i n increases. At a low inlet velocity of V i n = 0.1   m / s (Figure 9a), the temperature contour reveals extensive warm-colored regions spanning a significant portion of the battery surface, with T m a x reaching 317.56 K. This elevated temperature indicates that the convective heat removal capacity is insufficient to cope with the intense heat generation, resulting in substantial thermal energy retention. As V i n is progressively increased to 0.2 m/s and 0.3 m/s (Figure 9b,e), a noticeable contraction of the high-temperature zones is observed, accompanied by a visible expansion of the low-temperature regions adjacent to the cooling channels. When V i n is further elevated to 0.6 m/s (Figure 9f), T m a x is effectively suppressed to 316.10 K, yielding a net temperature reduction of 1.46 K compared to the 0.1 m/s baseline.
However, a critical observation emerges from the quantitative comparison: the relationship between V i n and T m a x is distinctly non-linear. The most substantial temperature reduction occurs during the initial velocity increment from 0.1 m/s to 0.2 m/s, where T m a x decreases by 0.82 K. In contrast, the subsequent increment from 0.5 m/s to 0.6 m/s yields a marginal reduction of only 0.07 K. This pronounced diminishing marginal thermal benefit is primarily governed by the bulk coolant temperature rise along the channel. According to the principle of energy conservation, the temperature increase in the coolant stream from inlet to outlet is inversely proportional to its mass flow rate. As V i n increases, the enhanced mass flow rate effectively suppresses the coolant temperature rise, thereby maintaining a larger driving temperature difference between the battery surface and the coolant. However, this improvement is inherently asymptotic: as the flow rate becomes sufficiently large, the coolant outlet temperature approaches the 300 K inlet temperature, and the battery temperature converges toward a theoretical lower limit dictated by the convective heat transfer resistance.
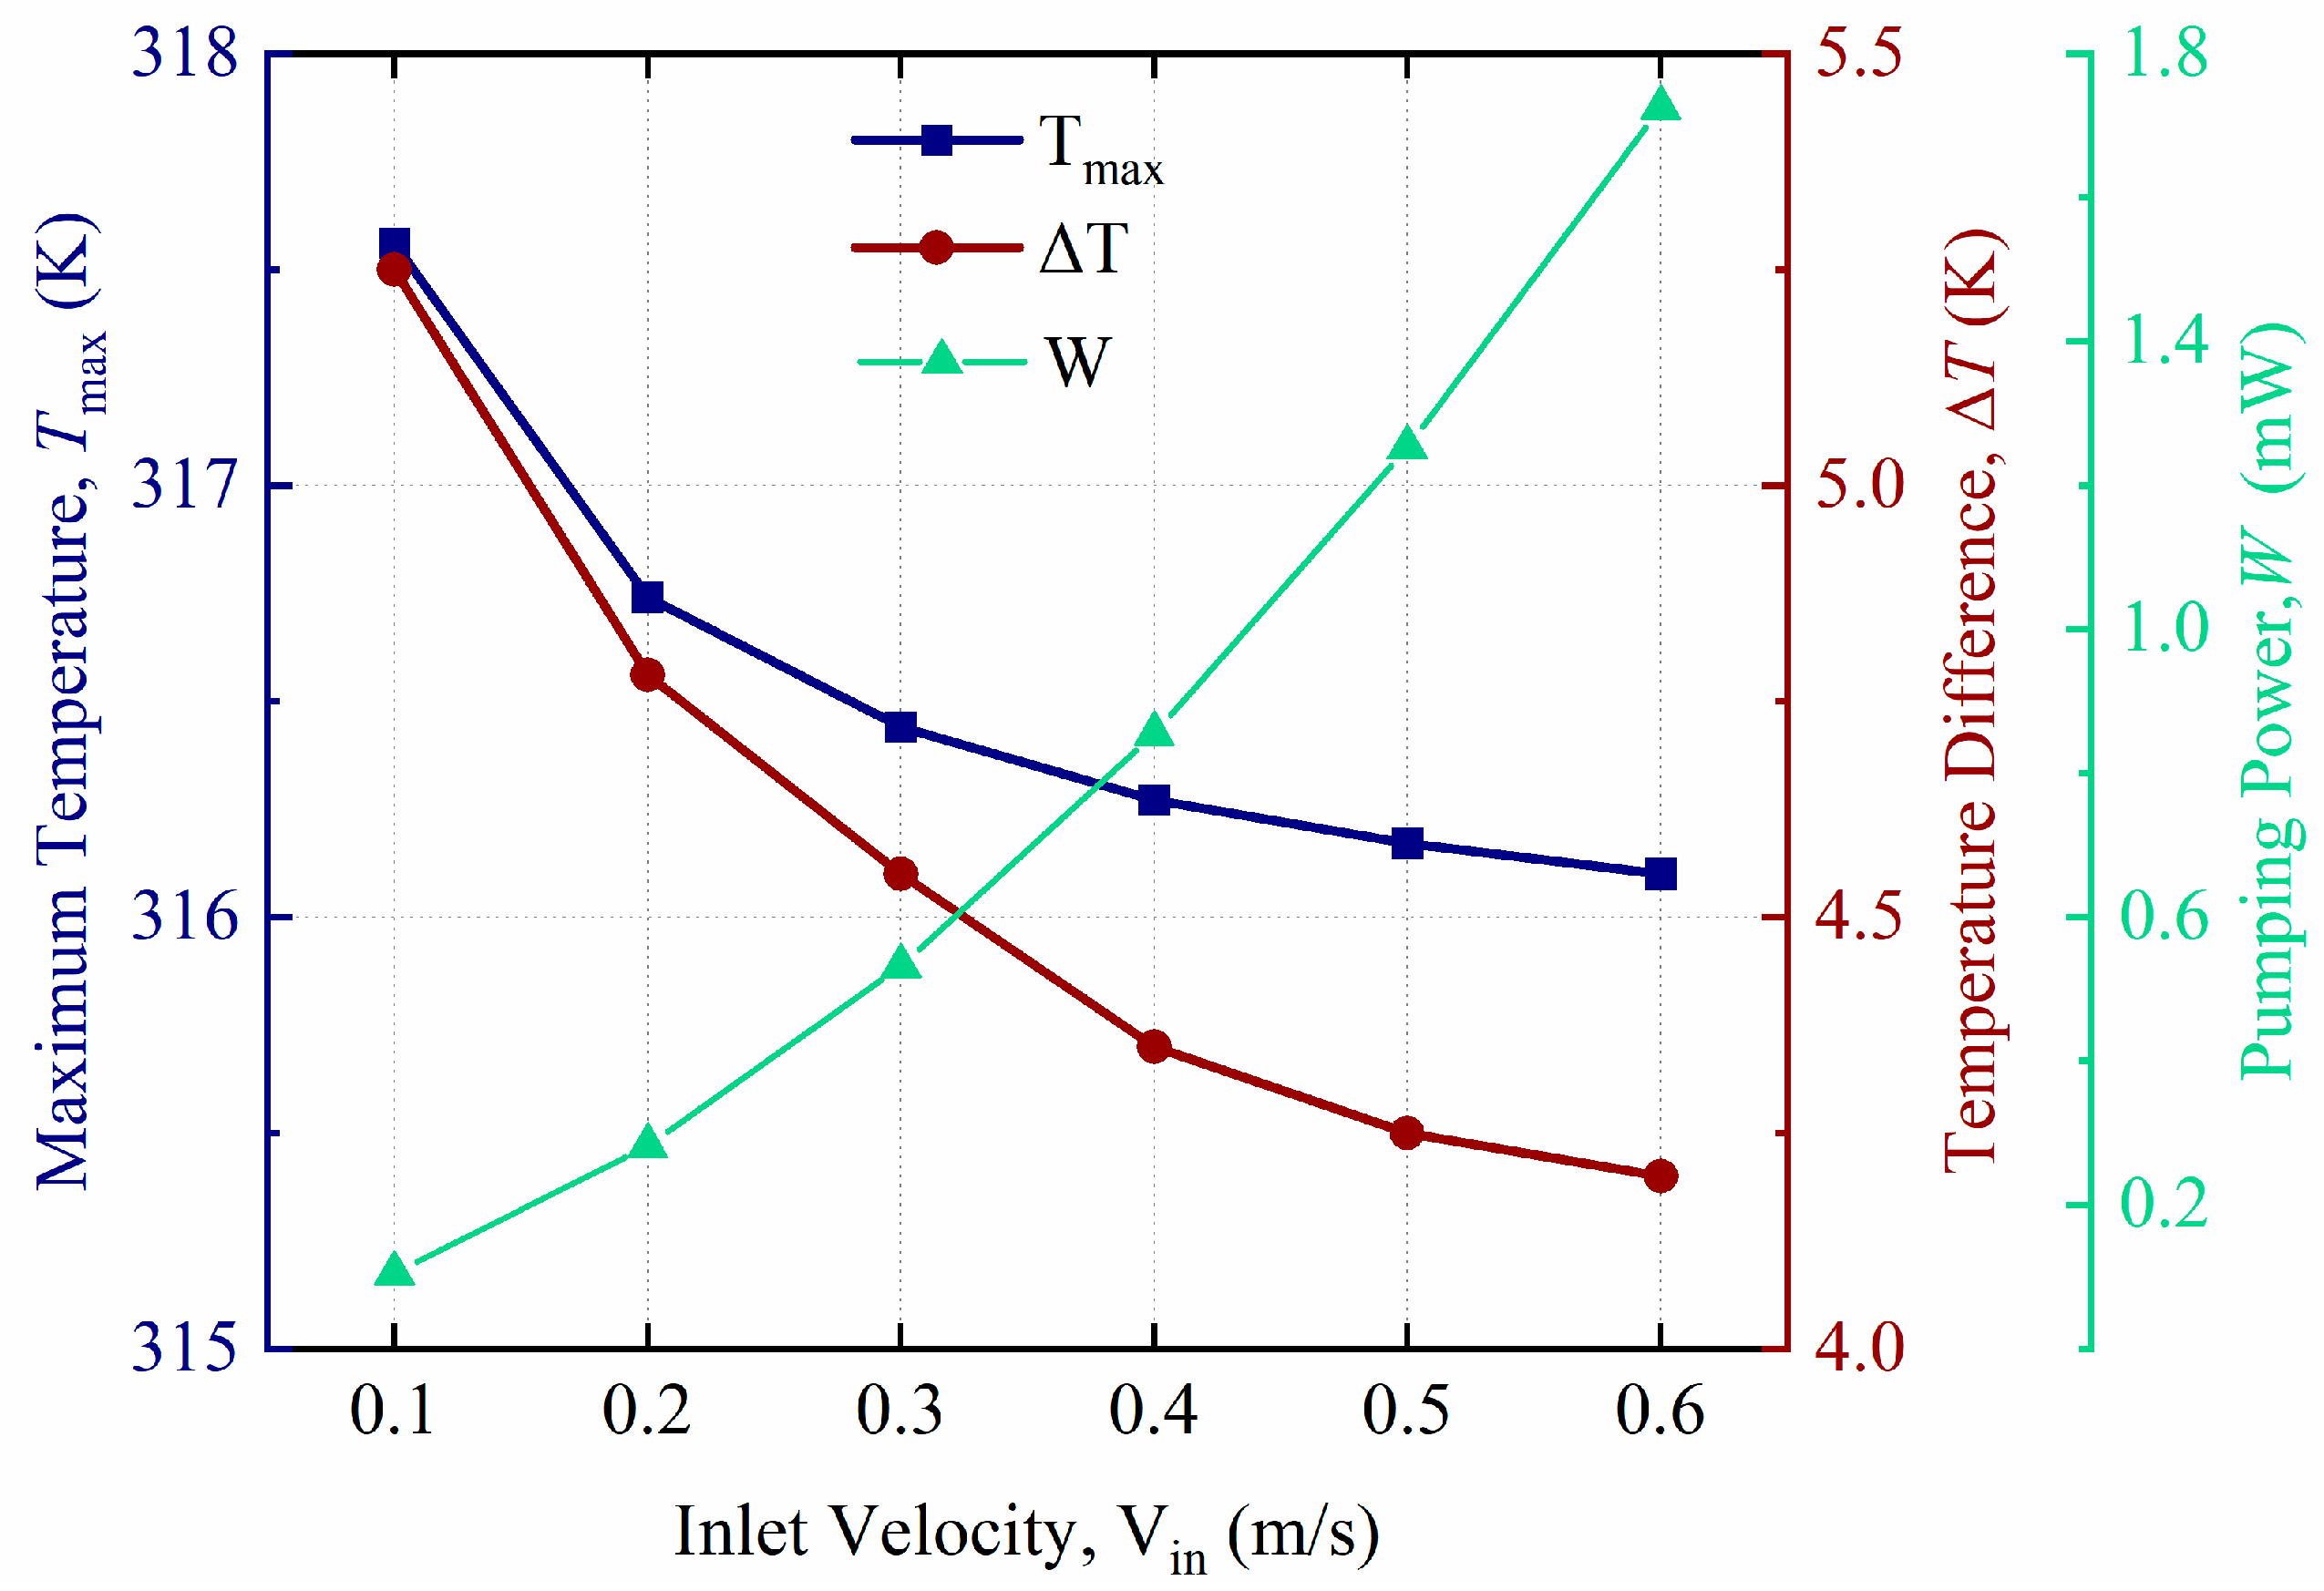
To quantitatively evaluate the inherent conflict between this diminishing thermal enhancement and the escalating hydraulic penalty, Figure 10 presents the terminal T m a x , Δ T , and pumping power consumption ( W ) as functions of the inlet velocity. As extracted from the numerical results, elevating V i n from 0.1 m/s to 0.6 m/s progressively narrows the spatial temperature difference ( Δ T ) from 5.25 K to a highly uniform 4.20 K. Simultaneously, this velocity increase causes the actual frictional pressure drop ( Δ P ) across the microchannels to rise from 34.89 Pa to 95.83 Pa. Consequently, the parasitic pumping power ( W = Δ P × Q ) escalates from 0.105 mW to 1.725 mW. Theoretically, for fully developed laminar internal flow, the pressure drop scales linearly with velocity ( Δ P V i n ), causing the required pumping power to scale quadratically ( W V i n 2 ). The CFD-derived power curve perfectly aligns with this theoretical near-quadratic escalation.
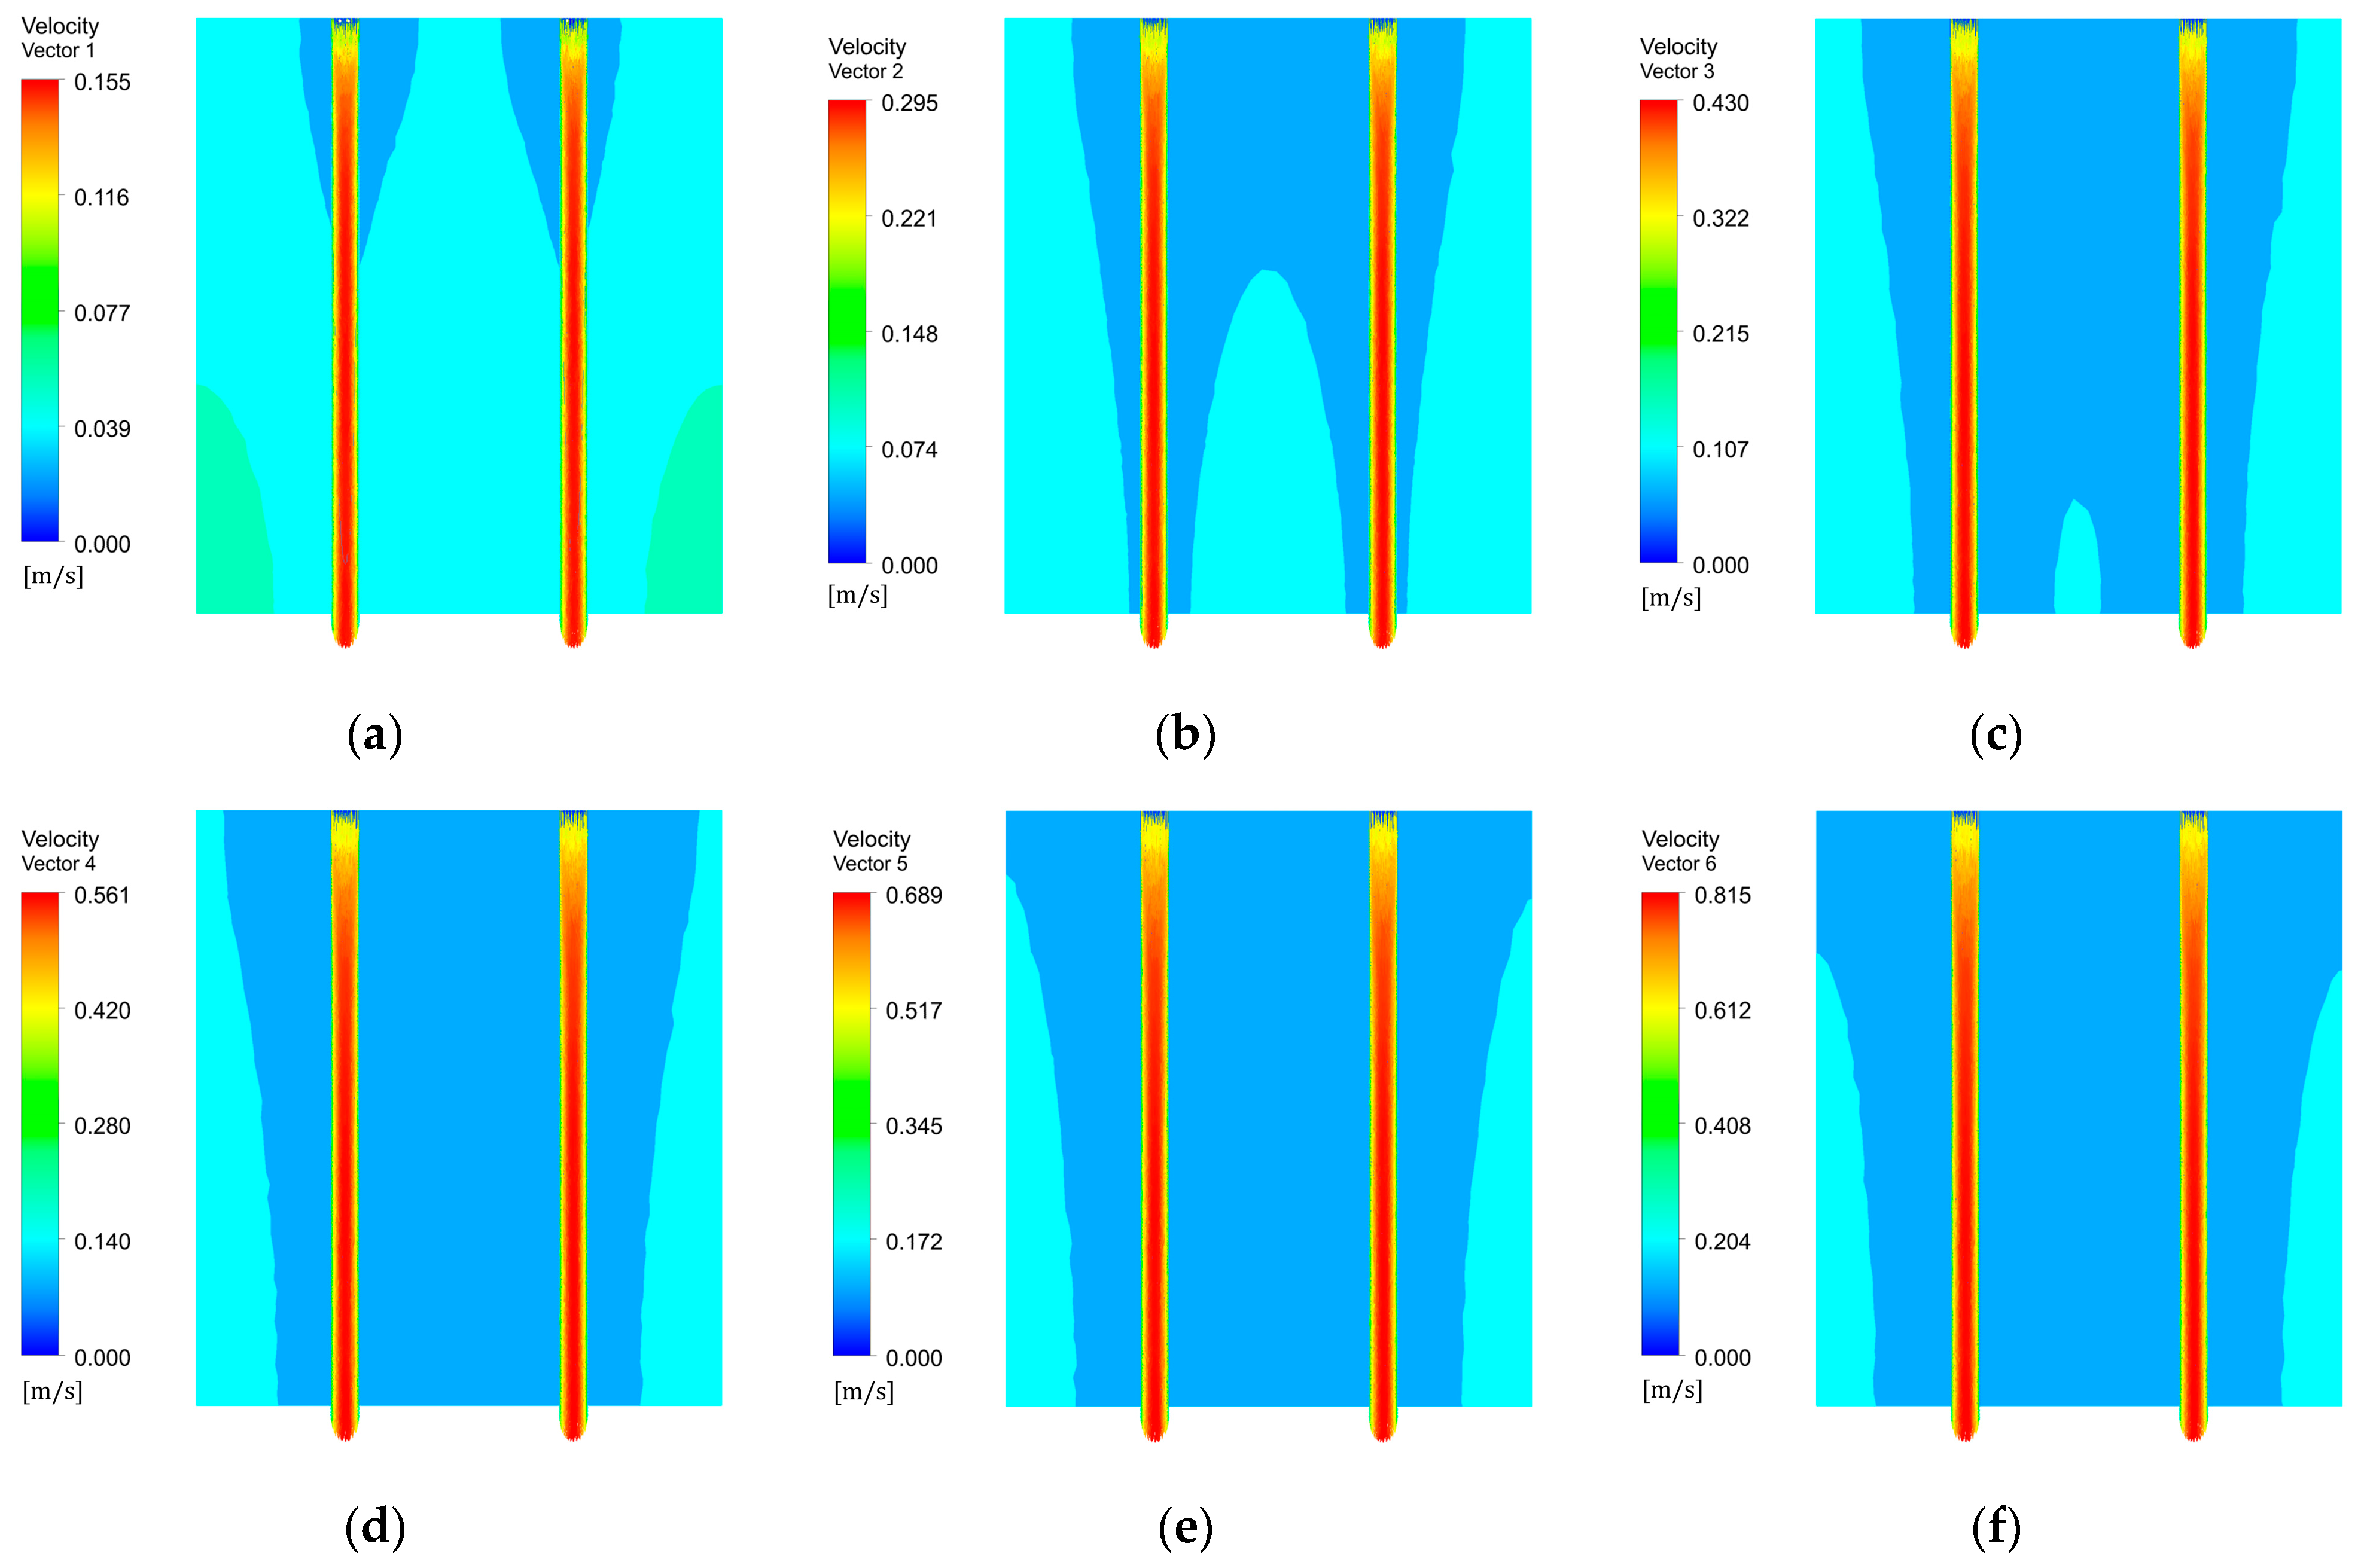
To elucidate the underlying hydrodynamic mechanisms, Figure 11 presents the internal velocity contours within the cooling microchannels across the investigated inlet velocities. Across all cases, the velocity contours exhibit a characteristic parabolic-like profile consistent with laminar boundary layer development. A quantitative examination reveals that at V i n = 0.1   m / s , the peak core velocity reaches 0.155 m/s (a 55% amplification relative to the inlet). As V i n increases to 0.6 m/s, the peak core velocity rises to 0.815 m/s (a 35.8% amplification). The decreasing relative amplification ratio at higher velocities indicates a longer hydrodynamic entry length, meaning the flow is less fully developed at the monitored cross-sections. Furthermore, the steeper near-wall velocity gradients at higher V i n (Figure 11d–f) directly translate into enhanced wall shear stress and the aforementioned elevated pressure losses.
The coupled thermal–hydraulic analysis presented above underscores the importance of operational optimization. While high flow rates marginally improve cooling, the quadratic increase in pumping power consumption imposes a strict practical limit. Based on Figure 10, an optimal coolant inlet velocity of 0.2 m/s to 0.3 m/s is highly recommended, as it captures the majority of the available temperature reduction and ensures Δ T falls safely below the 5 K threshold, while maintaining the pumping power at an exceptionally low level (below 0.6 mW). Ultimately, determining this optimal thermo-hydraulic balance is not only vital for ensuring immediate battery safety but also aligns with broader sustainability goals. Efficient thermal management directly prolongs the operational lifespan of the battery cells, thereby supporting the sustainable lifecycle management of battery-related metals and reducing electronic waste generation [33].

4. Conclusions

In this study, a comprehensive three-dimensional electrochemical–thermal coupled numerical framework was developed to evaluate and optimize a microchannel liquid cold plate for prismatic lithium-ion batteries under a demanding 5 C discharge rate. By integrating the Newman pseudo-two-dimensional (P2D) model with conjugate heat transfer and laminar flow fluid dynamics, the spatiotemporal heterogeneity of internal heat generation was accurately captured. Based on the systematic parametric investigations and thermo-hydraulic trade-off analyses, the principal conclusions are drawn as follows:
(1) The 1D + 3D coupled modeling framework demonstrates exceptional predictive fidelity. Validated against experimental measurements at both 3 C and 5 C discharge rates, the maximum relative error for transient temperature rise is strictly constrained below 1.0%. Furthermore, the model successfully captures severe non-linear activation polarizations under high C-rates, overcoming the inherent limitations of traditional lumped heat source models.
(2) Under active thermal regulation with a constant coolant inlet temperature of 300   K , the proposed liquid cooling system exhibits robust environmental adaptability. When the initial ambient soaking temperature varies across a broad 50   K span ( 293   K to 343   K ), the maximum battery temperature ( T m a x ) experiences a marginal increment of only 2   K , remaining consistently below the strict 323   K thermal safety threshold.
(3) Increasing the microchannel density significantly widens the thermal safety margin. Transitioning from the 2-channel baseline to a 6-channel configuration suppresses the spatial temperature difference ( Δ T ) from a marginally acceptable 5.25   K down to a highly uniform 4.25   K . Crucially, this vital enhancement in electrochemical consistency is achieved at a negligible parasitic pumping power penalty of 0.314   m W .
(4) The optimization of coolant inlet velocity unveils a critical thermo-hydraulic trade-off. Elevating the flow rate yields distinctly diminishing marginal thermal returns—governed asymptotically by the bulk coolant temperature rise—while triggering a near-quadratic escalation in parasitic pumping power. An optimal inlet velocity range of 0.2   m / s to 0.3   m / s is identified, which captures the vast majority of achievable cooling benefits while maintaining exceptional energy efficiency, thereby supporting the sustainable lifecycle management of battery systems.


Author Contributions

Conceptualization, C.L. and F.-Y.Z.; methodology, C.L.; software, C.L. and Y.-X.Z.; validation, D.-W.Y., C.-P.M. and S.-X.Z.; formal analysis, C.L. and Y.-X.Z.; investigation, C.-P.M. and S.-X.Z.; resources, F.-Y.Z.; data curation, D.-W.Y.; writing—original draft preparation, C.L.; writing—review and editing, F.-Y.Z.; visualization, C.L.; supervision, F.-Y.Z.; project administration, F.-Y.Z.; funding acquisition, F.-Y.Z. All authors have read and agreed to the published version of the manuscript.

Funding

This research was funded by the financial supports of the Provincial Key R & D Program of Hunan (Grant NO. 2024AQ2011, Hunan University of Technology), Russia Science Foundation-Natural Science Foundation of China Cooperation (RSF-NSFC Grant NO. W2412062, Wuhan University), National Key R & D Program of China (Grant NO. 2022YFC3801600, Wuhan University), Provincial Key R&D Program of Hubei (Grant NO. 2024BAB097, Wuhan University).

Data Availability Statement

The original contributions presented in this study are included in the article material. Further inquiries can be directed to the corresponding author.

Conflicts of Interest

The authors declare no conflicts of interest.

Abbreviations

The following abbreviations are used in this manuscript:
BTMSBattery Thermal Management System
CFDComputational Fluid Dynamics
CTBCell-to-Body
CTPCell-to-Pack
EVsElectric Vehicles
LIBsLithium-Ion Batteries
P2DPseudo-Two-Dimensional
PCMPhase Change Material
SEISolid Electrolyte Interphase
VinCoolant Inlet Velocity
TmaxMaximum Battery Temperature
ΔTMaximum Temperature Difference
TambAmbient Temperature

References

  1. Ahmad, F.; Iqbal, A.; Ashraf, I.; Marzband, M.; Khan, I. Optimal Location of Electric Vehicle Charging Station and Its Impact on Distribution Network: A Review. Energy Rep. 2022, 8, 2314–2333. [Google Scholar] [CrossRef]
  2. Mathiyalagan, K.; Shin, D.; Lee, Y.-C. Difficulties, Strategies, and Recent Research and Development of Layered Sodium Transition Metal Oxide Cathode Materials for High-Energy Sodium-Ion Batteries. J. Energy Chem. 2024, 90, 40–57. [Google Scholar] [CrossRef]
  3. Jan, W.; Khan, A.D.; Iftikhar, F.J.; Ali, G. Recent Advancements and Challenges in Deploying Lithium Sulfur Batteries as Economical Energy Storage Devices. J. Energy Storage 2023, 72, 108559. [Google Scholar] [CrossRef]
  4. Yadlapalli, R.T.; Alla, R.R.; Kandipati, R.; Kotapati, A. Super Capacitors for Energy Storage: Progress, Applications and Challenges. J. Energy Storage 2022, 49, 104194. [Google Scholar] [CrossRef]
  5. Li, W.; Bao, Z.; Gao, Q.; Du, Q.; Jiao, K. Investigation of Novel Pulse Preheating Strategies for Lithium-Ion Batteries at Subzero Temperature Based on a Multi-Level CFD Platform. eTransportation 2024, 19, 100307. [Google Scholar] [CrossRef]
  6. Chen, K.; Zhang, Z.; Wu, B.; Song, M.; Wu, X. An Air-Cooled System with a Control Strategy for Efficient Battery Thermal Management. Appl. Therm. Eng. 2024, 236, 121578. [Google Scholar] [CrossRef]
  7. Ma, S.; Jiang, M.; Tao, P.; Song, C.; Wu, J.; Wang, J.; Deng, T.; Shang, W. Temperature Effect and Thermal Impact in Lithium-Ion Batteries: A Review. Prog. Nat. Sci. Mater. Int. 2018, 28, 653–666. [Google Scholar] [CrossRef]
  8. Shehabaz, S.M.D.; Gugulothu, S.K.; Muthyala, R.; Barmavatu, P. Design and Multiobjective Optimization of Fin-Assisted Air-Cooled BTMS for 21 700 Lithium-Ion Cylindrical Cells Using CFDRSM Integration. Energy Storage 2026, 8, e70358. [Google Scholar] [CrossRef]
  9. Siruvuri, S.D.V.S.S.V.; Budarapu, P.R. Studies on Thermal Management of Lithium-Ion Battery Pack Using Water as the Cooling Fluid. J. Energy Storage 2020, 29, 101377. [Google Scholar] [CrossRef]
  10. Lin, X.-W.; Zhou, Z.-F.; Yin, J.; Zhu, X.-G.; Shi, M.-Y.; Chen, B. A Comparative Investigation of Two-Phase Immersion Thermal Management System for Lithium-Ion Battery Pack. J. Clean. Prod. 2024, 434, 140472. [Google Scholar] [CrossRef]
  11. Liu, F.; Wang, J.; Liu, Y.; Wang, F.; Yang, N.; Liu, X.; Liu, H.; Li, W.; Liu, H.; Huang, B. Performance Analysis of Phase Change Material in Battery Thermal Management with Biomimetic Honeycomb Fin. Appl. Therm. Eng. 2021, 196, 117296. [Google Scholar] [CrossRef]
  12. Chen, H.; Tang, Y.-F.; Zhou, Y.-X.; Wang, W.-W.; Tan, Z.-C.; Yao, Y.-H.; Zhao, F.-Y. Steady and Transient Sensitivity Investigations on a Passive Battery Thermal Management System Coupling with Phase Change Materials and Heat Pipes: Full Numerical Modeling and Orthogonal Tests. J. Energy Storage 2023, 73, 109054. [Google Scholar] [CrossRef]
  13. Zhou, Y.-X.; Chen, H.; Liu, C.; Zhao, F.-Y.; Wang, W.-W.; Guo, J.-H. Thermal Management of Lithium-Ion Batteries Using a Circular Honeycomb PCM Structure. Int. J. Heat Mass Transf. 2025, 246, 127090. [Google Scholar] [CrossRef]
  14. Tran, M.-K.; Mevawalla, A.; Aziz, A.; Panchal, S.; Xie, Y.; Fowler, M. A Review of Lithium-Ion Battery Thermal Runaway Modeling and Diagnosis Approaches. Processes 2022, 10, 1192. [Google Scholar] [CrossRef]
  15. Cui, H.C.; Shi, C.Y.; Yu, M.J.; Zhang, Z.K.; Liu, Z.C.; Liu, W. Optimal Parameter Design of a Slot Jet Impingement/Microchannel Heat Sink Base on Multi-Objective Optimization Algorithm. Appl. Therm. Eng. 2023, 227, 120452. [Google Scholar] [CrossRef]
  16. Liu, J.; Chen, H.; Huang, S.; Jiao, Y.; Chen, M. Recent Progress and Prospects in Liquid Cooling Thermal Management System for Lithium-Ion Batteries. Batteries 2023, 9, 400. [Google Scholar] [CrossRef]
  17. Huo, Y.; Rao, Z.; Liu, X.; Zhao, J. Investigation of Power Battery Thermal Management by Using Mini-Channel Cold Plate. Energy Convers. Manag. 2015, 89, 387–395. [Google Scholar] [CrossRef]
  18. Patil, S.R.; Lokavarapu, B.R.; Thaliyanveedu, H.K. Optimization of Battery Cooling System Used in Electric Vehicles. J. Energy Storage 2023, 58, 106299. [Google Scholar] [CrossRef]
  19. Zhao, G.; Wang, X.; Negnevitsky, M.; Li, C. An Up-to-Date Review on the Design Improvement and Optimization of the Liquid-Cooling Battery Thermal Management System for Electric Vehicles. Appl. Therm. Eng. 2023, 219, 119626. [Google Scholar] [CrossRef]
  20. Suresh Patil, M.; Seo, J.-H.; Lee, M.-Y. A Novel Dielectric Fluid Immersion Cooling Technology for Li-Ion Battery Thermal Management. Energy Convers. Manag. 2021, 229, 113715. [Google Scholar] [CrossRef]
  21. Xiong, M.; Wang, N.; Li, W.; Garg, A.; Gao, L. Study on the Heat Dissipation Performance of a Liquid Cooling Battery Pack with Different Pin-Fins. Batteries 2023, 9, 44. [Google Scholar] [CrossRef]
  22. Weng, S.; Zhang, X.; Yang, G.; Zhang, S.; Ma, B.; Liu, Q.; Liu, Y.; Peng, C.; Chen, H.; Yu, H.; et al. Temperature-Dependent Interphase Formation and Li+ Transport in Lithium Metal Batteries. Nat. Commun. 2023, 14, 4474. [Google Scholar] [CrossRef] [PubMed]
  23. Bukya, M.; Meenakshi Reddy, R.; Doddipatla, A.R.; Kumar, R.; Mathur, A.; Gupta, M.; Garimella, A. Electro-Thermal Performance Evaluation of a Prismatic Battery Pack for an Electric Vehicle. High Temp. Mater. Process. 2024, 43, 20220311. [Google Scholar] [CrossRef]
  24. Magri, L.; Sequino, L.; Ferrari, C. Simulating the Electrochemical-Thermal Behavior of a Prismatic Lithium-Ion Battery on the Market under Various Discharge Cycles. Batteries 2023, 9, 397. [Google Scholar] [CrossRef]
  25. Widyantara, R.D.; Zulaikah, S.; Juangsa, F.B.; Budiman, B.A.; Aziz, M. Review on Battery Packing Design Strategies for Superior Thermal Management in Electric Vehicles. Batteries 2022, 8, 287. [Google Scholar] [CrossRef]
  26. Dao, T.-S.; Vyasarayani, C.P.; McPhee, J. Simplification and Order Reduction of Lithium-Ion Battery Model Based on Porous-Electrode Theory. J. Power Sources 2012, 198, 329–337. [Google Scholar] [CrossRef]
  27. Clerici, D.; Mocera, F.; Somà, A. Analytical Solution for Coupled Diffusion Induced Stress Model for Lithium-Ion Battery. Energies 2020, 13, 1717. [Google Scholar] [CrossRef]
  28. Tjaden, B.; Cooper, S.J.; Brett, D.J.; Kramer, D.; Shearing, P.R. On the Origin and Application of the Bruggeman Correlation for Analysing Transport Phenomena in Electrochemical Systems. Curr. Opin. Chem. Eng. 2016, 12, 44–51. [Google Scholar] [CrossRef]
  29. Hosseinzadeh, E.; Genieser, R.; Worwood, D.; Barai, A.; Marco, J.; Jennings, P. A Systematic Approach for Electrochemical-Thermal Modelling of a Large Format Lithium-Ion Battery for Electric Vehicle Application. J. Power Sources 2018, 382, 77–94. [Google Scholar] [CrossRef]
  30. Saeedipour, S.; Gharehghani, A.; Rabiei, M.; Andwari, A.M.; Mehranfar, S.; Reche, C.M.; Rabiei, N. Efficient BTMS for Lithium-Ion Batteries: A Study on PCM/Metal Foam, Heat Pipe, and Microchannel Integration. Transp. Eng. 2025, 20, 100330. [Google Scholar] [CrossRef]
  31. Dong, T.; Wang, Y.; Cao, W.; Zhang, W.; Jiang, F. Analysis of Lithium-Ion Battery Thermal Models Inaccuracy Caused by Physical Properties Uncertainty. Appl. Therm. Eng. 2021, 198, 117513. [Google Scholar] [CrossRef]
  32. Buidin, T.I.C.; Mariasiu, F. Battery Thermal Management Systems: Current Status and Design Approach of Cooling Technologies. Energies 2021, 14, 4879. [Google Scholar] [CrossRef]
  33. Fathy, M.A.; Abdelbasir, S.M.; Hassan, S.S.; Kamel, A.H.; Rayan, D. Mechanochemical Activation for Lead Extraction from Spent Cathode Ray Tube. J. Mater. Cycles Waste Manag. 2021, 23, 1090–1101. [Google Scholar] [CrossRef]
Figure 1. Geometric model of lithium-ion battery module.
Wevj 17 00196 g001
Figure 2. Three-dimensional computational mesh of the integrated prismatic battery module and microchannel liquid cold plate.
Wevj 17 00196 g002
Figure 3. Verification of numerical accuracy: (a) grid independence study and (b) time-step independence study.
Wevj 17 00196 g003
Figure 4. Comparison of simulated and experimental results for (a) average battery temperature and (b) terminal voltage at 3 C and 5 C discharge rates.
Wevj 17 00196 g004
Figure 5. Temperature contours of the battery module at the end of discharge under different ambient temperatures: (a) Tamb = 293 K; (b) Tamb = 303 K; (c) Tamb = 313 K; (d) Tamb = 323 K; (e) Tamb = 333 K; and (f) Tamb = 343 K.
Wevj 17 00196 g005
Figure 6. Variations in maximum battery temperature and maximum temperature difference under different ambient temperatures.
Wevj 17 00196 g006
Figure 7. Temperature contours of the battery module with different numbers of cooling channels: (a) 2 channels; (b) 3 channels; (c) 4 channels; (d) 5 channels; and (e) 6 channels.
Wevj 17 00196 g007
Figure 8. Effect of the microchannel number on the maximum battery temperature, temperature difference, and associated pumping power consumption.
Wevj 17 00196 g008
Figure 9. Temperature contours of the battery module at the end of discharge under different coolant inlet velocities: (a) Vin = 0.1 m/s; (b) Vin = 0.2 m/s; (c) Vin = 0.3 m/s; (d) Vin = 0.4 m/s; (e) Vin = 0.5 m/s; and (f) Vin = 0.6 m/s.
Wevj 17 00196 g009
Figure 10. Effect of the coolant inlet velocity on the maximum battery temperature, temperature difference, and associated pumping power consumption.
Wevj 17 00196 g010
Figure 11. Velocity contours within the cooling microchannels under different coolant inlet velocities: (a) Vin = 0.1 m/s; (b) Vin = 0.2 m/s; (c) Vin = 0.3 m/s; (d) Vin = 0.4 m/s; (e) Vin = 0.5 m/s; and (f) Vin = 0.6 m/s.
Wevj 17 00196 g011
Table 1. Physical parameters of lithium-ion battery.
ParameterValues
Size (mm)192 × 145 × 5.4
Nominal capacity (Ah)14.6
Positive electrode materialLiMn2O4
Negative electrode materialGraphite
Rated voltage (V)3.7
Minimum termination voltage (V)3.0
Maximum termination voltage (V)4.3
Table 2. Thermophysical properties of the constituent materials used in the numerical model.
MaterialsDensity (kg/m3)Specific Heat (J/(kg·K))Thermal Conductivity (W/(m·K))
Battery2551.71100kx = ky = 28, kz = 0.28
Graphite15007005
LiMn2O425007005
Copper8978381387.6
Aluminum2719871202.4
Air1.20510050.0259
Water998.241820.6
Disclaimer/Publisher’s Note: The statements, opinions and data contained in all publications are solely those of the individual author(s) and contributor(s) and not of MDPI and/or the editor(s). MDPI and/or the editor(s) disclaim responsibility for any injury to people or property resulting from any ideas, methods, instructions or products referred to in the content.