1. Introduction
The transition of the traditional automotive industry toward new energy vehicles has become a shared trend in the global automotive sector. According to the International Energy Agency’s (IEA) report Global Electric Outlook 2023, global electric vehicle sales exceeded 10 million units in 2022 and approached 14 million units in 2023, demonstrating strong growth momentum. It also represents a crucial strategic initiative for nations worldwide to address energy crises and global climate change while advancing the green and low-carbon transformation of their economies and societies. As the world’s largest automotive market, China entered the new energy vehicle sector as early as the late 1990s. It views this as a crucial strategic opportunity to narrow the technological and industrial gap with developed nations in the automotive industry [
1]. According to data from the International Organization of Motor Vehicle Manufacturers (OICA) and the China Association of Automobile Manufacturers, China’s automobile production exceeded 30.16 million units in 2023, marking the 14th consecutive year the country has ranked first globally. Of this total, production and sales of new energy vehicles reached 9.587 million and 9.495 million units, respectively, representing year-over-year increases of 35.8% and 37.9%, with a market share of 31.6%. Driven by the “Made in China 2025” strategy, China’s new energy vehicle industry has experienced rapid development, with its overall level gradually approaching that of developed countries [
2]. After experiencing policy-driven explosive growth, China’s new energy vehicle industry is now at a critical crossroads, transitioning from “scale expansion” to “high-quality development”. Despite China’s introduction of multiple policies over the years to continuously promote the expansion and upgrading of the new energy vehicle industry, the sector still faces certain challenges amid its rapid growth. On the one hand, the traditional physical agglomeration model faces challenges such as rising land costs and worsening congestion, with diminishing marginal returns becoming increasingly evident. On the other hand, regional market fragmentation caused by administrative barriers hinders synergistic efficiency across the industrial chain, leading to innovation silos [
3]. This makes it difficult to effectively carry out cross-regional joint research on key core technologies. The issues of being “large but not strong” and “comprehensive but not specialized” continue to constrain the high-quality development of the industry. Faced with increasingly fierce global competition and complex supply chain environments, relying solely on traditional approaches of accumulating factors and expanding physical space is no longer sustainable. Industries urgently need to explore new organizational models to break through the dual constraints of geography and resources.
As the new wave of technological revolution and industry transformation accelerates, the world is undergoing a profound and widespread digital transformation [
4]. New-generation information technologies, represented by cloud computing, big data, artificial intelligence, and algorithmic technologies, are reshaping the organizational methods and spatial forms of economic activities. Virtual agglomeration, as a new spatial organization distinct from traditional geographic linkages, has emerged in response to the digital economy wave. It leverages digital networks to establish seamless connections across regions and among multiple entities, creating network effects that facilitate the optimized integration and efficient utilization of external resources [
5]. The emergence of network synergies is dismantling the diseconomies of scale inherent in traditional management, spurring the rapid rise of platform economies [
6]. Knowledge sharing and circulation processes have accelerated significantly; technological means have enabled the granular segmentation of production factors and processes into smaller units, facilitating more flexible and efficient combinations and allocations [
7]. Digitalization of information has expanded the scope of production and transactions while reducing search and transaction costs. Enterprises utilize data aggregation and processing technologies to achieve global optimization of resource allocation, extending production activities into the global cyberspace [
8]. The rise of virtual agglomeration has provided new pathways for industries to adapt and thrive in the digital economy era [
9], increasingly becoming a vital driving force for the transformation, upgrading, and high-quality development of China’s new energy vehicle industry. It is important to recognize that the digital transformation process itself presents challenges related to energy consumption; in the early stages, energy demand and consumption typically increase due to the expansion of data centers, network infrastructure, and computing needs [
10]. By optimizing resource allocation, improving operational efficiency, and empowering smart energy management systems, virtual agglomeration may offer a viable path for reconciling digital transformation with sustainable energy consumption [
11]. The tension between the energy demands driven by digitalization and the need for sustainable development also underscores the importance of virtual agglomeration for the high-quality development of the new energy vehicle industry.
Against this backdrop, how does virtual agglomeration influence the high-quality development of China’s new energy vehicle industry? What mediating mechanisms exist between the two? Does the impact of virtual agglomeration on the high-quality development of the new energy vehicle industry exhibit threshold effects? Does the regional innovation environment play a moderating role in this process? Are there regional heterogeneities in their influence, such as variations in digital infrastructure levels and temporal factors? Answering these questions will help clarify the relationship between virtual agglomeration and the high-quality development of the new energy vehicle industry. This, in turn, will facilitate the formulation of more rational industry support policies and more scientific innovation strategies, thereby assisting the new energy vehicle industry in overcoming development bottlenecks. Such insights hold significant theoretical and practical value.
The marginal contributions of this paper include: First, it expands the scope of application of the theory of virtual agglomeration to strategic emerging industries, reveals the mechanisms through which non-spatially constrained agglomeration influences the new energy vehicle industry, and addresses the shortcomings of traditional frameworks for analyzing geographic agglomeration. Second, existing literature primarily focuses on the impact of geographic agglomeration on single dimensions such as the innovation capacity and corporate performance of the new energy vehicle industry. This study constructs a comprehensive evaluation system that incorporates industry input intensity, output intensity, social drivers, and sustainability, and empirically examines the impact of virtual agglomeration on the high-quality development of the new energy vehicle industry, thereby enriching relevant theoretical research. Finally, in light of t the intensified global competition in the new energy vehicle industry and the current predicament of China’s industry being “big but not strong”, the findings of this study can provide policymakers with actionable decision-making criteria and practical guidance for formulating targeted measures tailored to the specific characteristics of different regions and stages of development.
The remainder of this paper is structured as follows:
Section 2 presents a literature review using an analytical approach, examining existing studies on industry agglomeration, virtual agglomeration and the new energy vehicle industry, while identifying gaps in current research.
Section 3 outlines the theoretical framework and research hypotheses through a deductive approach.
Section 4 describes data sources, the measurement of variables and econometric methodologies.
Section 5 systematically presents the empirical test results of the model.
Section 6 discusses the empirical results using inductive reasoning.
Section 7 summarizes the recommendations, research limitations and future prospects.
2. Literature Review
2.1. Industry Agglomeration
Industry agglomeration is an important spatial organizational form of regional economic development; the formation and development of industry agglomeration theory can be traced back to Marshall’s theory of industrial districts, proposed in the late 19th century [
12], This theory explains how spatial proximity generates synergistic economic benefits for firms within a region through mechanisms such as labor pools, the sharing of intermediate goods, and knowledge spillovers [
13]. Building on this, Jacobs further proposed the concept of diverse externalities, emphasizing that the clustering and convergence of different industries can effectively promote the reconfiguration of knowledge and cross-industry innovation [
14]. In the 1990s, Porter introduced the concept of industry agglomeration in The Competitive Advantage of Nations formally [
15], positioning it as a regional development strategy and laying the groundwork for subsequent research on industry agglomeration. Since the 21st century, related research has gradually diverged into two levels: industry and regional. At the industry level, Rosenthal noted that the geographic agglomeration of firms within the same industry can enhance productivity through three primary pathways: shared labor markets, shared intermediate inputs, and knowledge spillovers [
16]. At the regional level, Martin’s analysis of French manufacturing microdata indicated that industry spatial concentration is positively associated with productivity. However, these agglomeration effects remain largely localized, exhibiting limited spillovers across regions [
17]. Aforementioned studies on traditional geographic agglomeration emphasize resource concentration in specific physical locations, which generates externalities through sharing, matching, and learning mechanisms [
18], yet it may also induce congestion effects and rent-seeking behavior, adversely affecting long-term industry development [
19]. With technological progress and globalization, the distance between people has been infinitely shortened [
20], marking the “demise of distance” as a defining feature of the digital era [
21], and network externalities, dominated by “flow spaces” are gaining precedence over agglomeration externalities constrained by “place spaces” [
22]. Network externalities enable firms to leverage digital platforms, overcoming geographical limitations and facilitating collaboration, communication and resource sharing. This reduces efficiency losses resulting from uneven resource distribution [
23] and enhances industry competitiveness. Against this backdrop, virtual agglomeration has emerged as a new form of industrial organization in the digital space.
2.2. Virtual Agglomeration
Virtual agglomeration, derived from Wilson’s concept of cyberspace [
24], was first proposed in 1997 by the EU-SACFA research consortium of seven universities. It refers to cross-industry firms forming virtual consortia in cyberspace to share market opportunities [
25]. From different research perspectives, studies on virtual agglomeration have yielded diverse findings that intersect with and complement traditional research on industry agglomeration. Overall, existing research on virtual agglomeration focuses on two main areas: the theoretical implications of virtual agglomeration and quantitative analysis. Conceptually, Sumita et al. defined virtual agglomeration from the dispersion and technological dependency, describing it as an organizational form where geographically dispersed entities exchange information based on shared technologies [
26]. Zerwas similarly argued that industry virtual agglomeration involves key players in industry chains concentrating in online spaces, driven by digitalization and intelligent transformation [
27]. Although definitions vary in wording, their core meanings remain consistent and support further discussion of key characteristics. Soete indicated that virtual agglomeration has transformed traditional production and distribution models, forming complex systems composed of network modules [
28]. Such systems are typically open, inclusive [
29] and cross-spatial, enabling participants to engage in large-scale, low-cost and long-distance collaborative production and transactions [
30].
Research on the role and functions of virtual agglomeration in application fields is also continuously expanding and improving. Romano et al. highlighted that virtual agglomeration breaks through spatial constraints, redefines economic activity boundaries, and facilitates the efficient circulation of production factors across wider regions [
31]. Vakola and Wilson similarly argued that virtual agglomeration enables real-time collaboration and resource sharing, reducing transaction costs and improving production efficiency [
32]. Kohtamäki et al. further confirmed that virtual agglomeration helps reduce various costs, including information search, negotiation, and performance monitoring [
33]. From a global value chain perspective, Sturgeon emphasized that virtual agglomeration enables firms to integrate more deeply into global knowledge networks and technological systems, strengthening their capacity for technology acquisition and innovation [
34]. Peráček and Kaššaj analyzed the impact of digital connectivity and public administration on spatial organization from a European perspective, noting that digital infrastructure frameworks such as Industry 4.0, artificial intelligence, and autonomous driving are reshaping the development pathways of smart cities. They expanded the research perspective on advanced forms of virtual agglomeration in the digital context and their impact on industrial spatial layout [
35]. Davis and Dingel provided empirical evidence that regions with higher levels of virtual agglomeration are associated with greater patenting efficiency and shorter new product development cycles than traditional agglomeration areas [
36]. This suggests that virtual agglomeration extends and upgrades conventional geographically based agglomeration. As a salient feature of the digital economy, the mechanisms and development pathways of virtual agglomeration have attracted sustained attention. Azar and Ciabuschi reported that virtual agglomeration promotes industry innovation by facilitating inter-firm knowledge sharing and technology diffusion [
37]. From a lean manufacturing perspective, virtual agglomeration strengthens supply chain collaboration to help firms move toward zero inventory and just-in-time production thereby improving resource utilization efficiency and market responsiveness [
38]. Furthermore, from the perspective of economic security, the study by Ivančík and Dušek indicated that coordinated investment and policy interventions in strategic sectors can effectively mitigate systemic risks and enhance supply chain resilience. This perspective provides theoretical support for understanding the role of virtual agglomeration in enhancing competitiveness and strategic resilience within strategic emerging industries such as new energy vehicles [
39].
Virtual agglomeration does not represent a disruption of traditional industrial clustering, but rather its extension and evolution into the digital space. Compared to traditional geographic agglomeration, virtual agglomeration exhibits significant differences and comparative advantages: First, in terms of spatial dimensions, traditional agglomeration is constrained by physical boundaries, which can easily lead to “crowding effects” such as rising land costs and environmental pollution. Virtual agglomeration, however, breaks through these geographic constraints, enabling cross-regional, networked, and borderless agglomeration based on digital platforms, with marginal costs approaching zero; Second, in terms of factor mobility and collaboration, traditional agglomeration relies on face-to-face knowledge spillovers and the dissemination of tacit knowledge, whereas virtual agglomeration, through digital technologies, drastically reduces information search and transaction costs, enabling upstream and downstream sectors of the industrial chain to achieve matching and synergy with exceptional efficiency. This evolution from the physical to the virtual space represents a major trend in the transformation of industrial organizational forms in the digital economy era.
2.3. Research Related to the Development of the New Energy Vehicle Industry
Given its notable potential for energy conservation and emission reduction, the new energy vehicle industry has become a focal point of global industry and academic research [
40]. Consequently, studies on China’s new energy vehicle industry has expanded, aiming to analyze its development trends, identify key issues, and explore sustainable pathways. A large body of research suggests that the government’s differentiated policies were the key driver behind the early boom in China’s new energy industry. For example, Li identified the key obstacles facing the new energy vehicle industry and proposed countermeasures [
41]. Furthermore, Zhang and Hu assessed the strengths, weaknesses, opportunities, and threats of China’s new energy vehicle industry, and proposed recommendations for enhancing its competitiveness [
42]. In recent years, due to diversified policy support, China’s new energy vehicle industry has rapidly grown into the world’s largest market [
43]. Michaela Kendall noted that environmental factors are one of the primary drivers behind the Chinese government’s vigorous promotion of this industry [
44]. Yuan et al. conducted a critical assessment of China’s new energy vehicle policy framework and proposed constructive solutions for its future development [
45]. Zhang analyzed 175 new energy vehicle policies implemented in selected Chinese regions between 2006 and 2016 using policy dependency mapping. The findings revealed that national-level policy objectives prioritized improving air quality, conserving fossil fuels, and revitalizing the automotive industry. In contrast, local policies focused more on developing charging infrastructure networks and addressing prominent regional challenges [
46].
In addition, numerous scholars have conducted in-depth research on other factors influencing the development of the new energy vehicle industry. For example, Dargay et al. examined the impact of key factors such as vehicle ownership, GDP, and population structure on industrial development [
47]. Meng’s research indicates that factors such as R&D investment, technological innovation capacity, market size, financial support, and human resources have a positive impact on industrial development [
48]. Hu employed a gravity model to demonstrate that carbon emission levels, GDP, and distance are the primary factors influencing the trade potential of China’s new energy vehicles in Belt and Road countries, with China exhibiting significant trade potential in this sector [
49], providing valuable insights for industry internationalization. Zulfiqar et al. took Pakistan as an example to explore opportunities related to the development of charging infrastructure, the design of financial subsidies, and industrial synergy, providing an important international comparative perspective for understanding strategies for promoting the new energy vehicle industry under different institutional environments and market conditions [
50].
Existing research has thoroughly demonstrated the necessity of developing the new energy vehicle industry and has examined the impact of various factors on individual indicators such as industry performance, innovation capacity, and export trade. However, few studies have incorporated multidimensional indicators into a unified framework to comprehensively assess the level of high-quality development in the new energy vehicle industry. Furthermore, current research primarily adopts the perspective of traditional industry agglomeration, and the mechanisms through which virtual agglomeration—an emerging form of industrial organization—influences the new energy vehicle industry have not yet received sufficient attention. However, the new energy vehicle industry is characterized by a long industrial chain, rapid technological iteration, and high demands for collaboration. These characteristics create a strong need for knowledge sharing across geographical boundaries and real-time supply chain coordination. In this context, exploring how virtual agglomeration can restructure the industrial chain and address the shortcomings of traditional geographical agglomeration is of great significance for promoting the high-quality development of this industry.
2.4. Summary and Research Gaps
Existing research provides a foundation for understanding the evolution of industry organization forms in the digital economy, but discussions surrounding virtual agglomeration and its impact on the new energy vehicle industry remain insufficient. On the one hand, although the theoretical implications, characteristics, and mechanisms of virtual agglomeration have been preliminarily elucidated, related analyses remain predominantly normative or descriptive in nature. There is a lack of quantitative empirical analysis targeting specific industries, particularly research on virtual agglomeration within the new energy vehicle industry. On the other hand, while prior research on the new energy vehicle industry has examined its development necessity and factors influencing single indicators such as industry performance, innovation capacity, and export trade, few studies have established a comprehensive, multidimensional evaluation system to assess overall high-quality development. Moreover, as an emergent organizational form, the role and mechanism of virtual agglomeration in fostering this development remain underexplored. Overall, existing literature primarily analyzes the industry through traditional lenses such as geographic agglomeration or technological investment. However, systematic empirical evidence on how platform-based agglomeration shapes the high-quality development of the new energy vehicle industry remains sparse. In light of this, this study constructs a multidimensional evaluation system for the high-quality development of the new energy vehicle industry and empirically investigates the impact and mechanisms of virtual agglomeration, aiming to expand the research boundaries of virtual agglomeration and offer theoretical and policy insights for advancing the high-quality development of the new energy vehicle industry.
5. Empirical Result and Analysis
5.1. Benchmark Regression
Table 4 reports the benchmark regression results of VA on the Nevd. Column (1) presents the estimation results including only core explanatory variables, while Columns (2)–(6) progressively incorporate control variables. All regressions control for fixed effects of individual and time to eliminate the influence of unobservable individual heterogeneity and time trends as much as possible.
The regression results indicate that the coefficients for VA are positive across all columns and pass statistical tests at the 1% significance level. Regarding overall model performance, the R2 values for each regression column exceeded 0.91. The model’s explanatory power steadily increased with the sequential inclusion of control variables, indicating good fit and robustness of the regression results. These findings demonstrate that, after controlling for relevant influencing factors, VA exerts a stable promotional effect on the Nevd, preliminarily validating Hypothesis 1 of this study.
5.2. Mechanism Analysis
To further reveal the underlying mechanism through which VA influences the Nevd, this study introduces Tech_Market and CIM as mediating variables. It tests whether VA promotes the Nevd by stimulating technological market vitality and fostering collaborative innovation magnitude. Columns (1) to (6) of
Table 5 presents the mechanism test results.
In the baseline regression without mediating variables in Column (1), the regression coefficient for VA on Nevd is 0.161, significant at the 1% level. This indicates that VA directly promotes the Nevd, providing a foundation for testing the mediating effect. Column (2) demonstrates the impact of VA on Tech_Market, with a coefficient of 0.024, significant at the 10% level. This indicates that VA enhances Tech_Market by reducing information asymmetry and transaction costs. Column (3) incorporates the mediating variable Tech_Market into the baseline model. The results show that the Tech_Market coefficient is 0.934 and significant at the 1% level, indicating that increased Tech_Market drives high-quality industrial development and partially mediates the relationship between VA and Nevd. That is, VA enhances Nevd indirectly by boosting the vitality of the technology transaction market.
Column (5) indicates that VA has a positive effect on CIM, demonstrating that VA mitigates spatio-temporal constraints on collaborative R&D by establishing digital collaboration networks, thereby improving knowledge sharing and joint R&D efficiency among innovation entities. Column (6) shows that CIM also promotes Nevd, suggesting that knowledge integration and technological breakthroughs achieved through joint R&D can directly enhance industrial technological capabilities and competitiveness. This highlights the crucial role of VA in fostering network effects within collaborative innovation. Overall, VA indirectly promotes the Nevd through enhancing technology market activity and accelerating collaborative innovation, thereby validating Hypothesis 2.
5.3. Threshold Effect
Given that the relationships among economic variables are often non-linear, the impact of VA on Nevd may exhibit threshold effects. Building upon the linear model presented earlier, this study employs the level of virtual agglomeration as a threshold variable and utilizes Hansen’s panel threshold regression model [
71] for empirical testing to identify potential threshold effects. The results of the threshold effect test are presented in
Table 6.
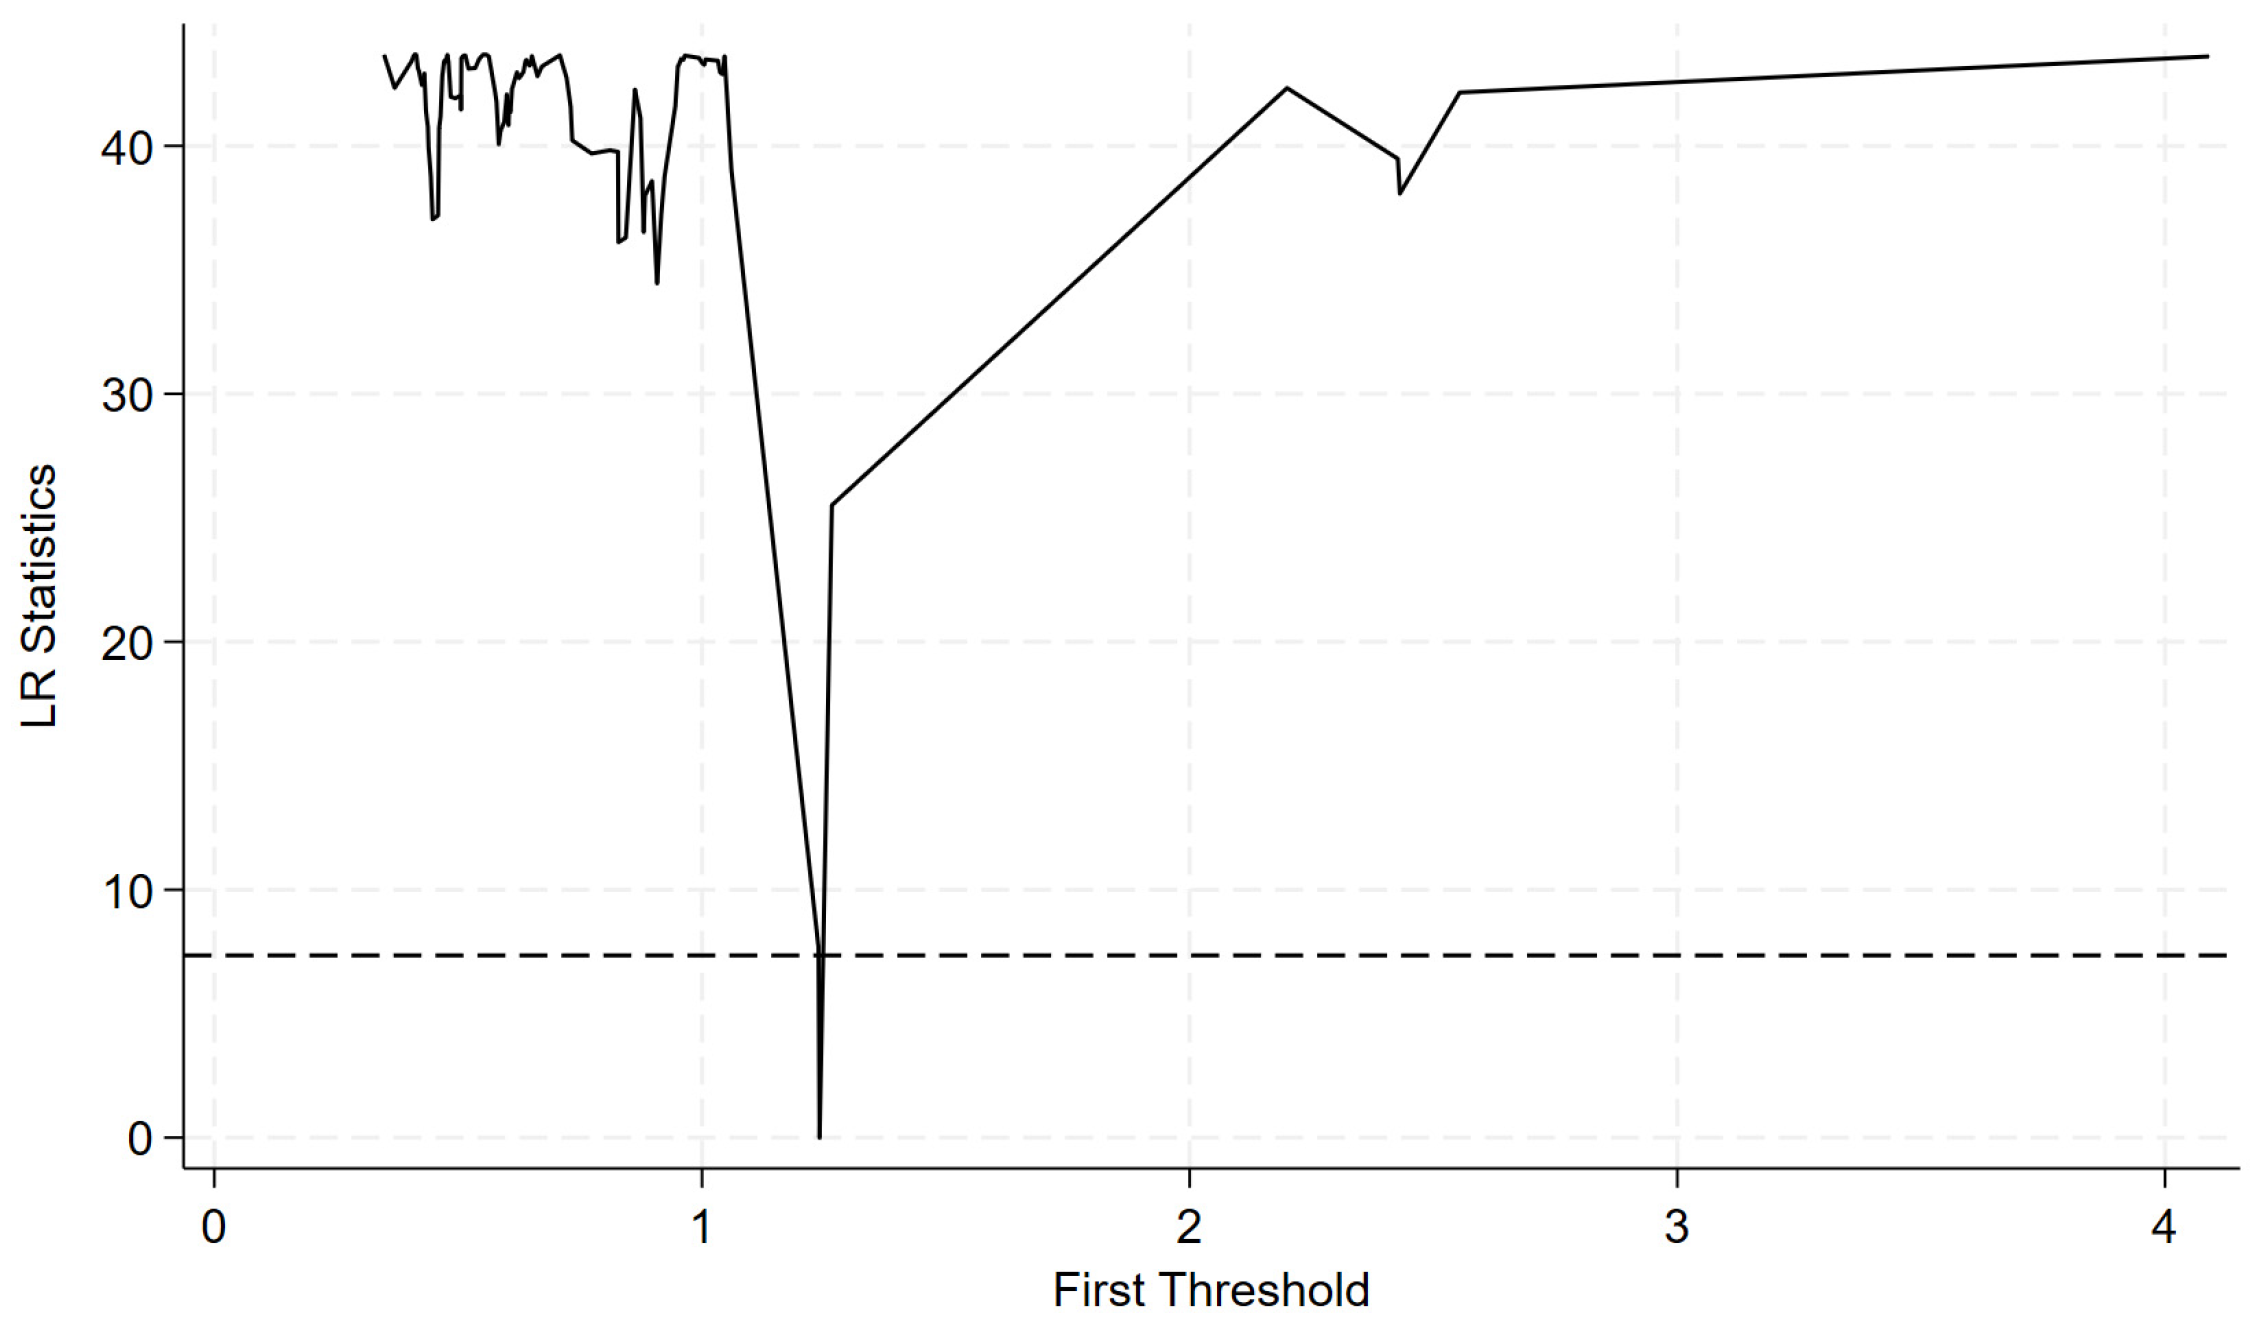
The threshold effect test results indicate that the F-value for the single threshold test is 45.52, which is significant at the 1% level. This value is substantially higher than the 1% critical value (27.3468), confirming the presence of a significant single threshold effect. In the dual-threshold test, the F-value for the second threshold is 7.70 with a p-value of 0.3675, failing to pass the 10% significance level test. This indicates no dual threshold exists within the sample interval. Therefore, this study adopts the single-threshold model to analyze the nonlinear effects of virtual agglomeration.
Figure 3 reveals a distinct “V”-shaped pattern near the threshold value, with the lowest point corresponding to the virtual agglomeration level representing the threshold estimate value. When the LR statistic falls below the horizontal dashed line, that is, the critical value at the 5% significance level, the corresponding interval constitutes the 95% confidence interval of the threshold estimate value. The graphical results show that the LR curve drops significantly near the threshold value and crosses the critical line, further confirming the existence of the threshold effect.
Based on this, this paper analyzes the threshold regression results in
Table 7, revealing that the threshold value for virtual agglomeration is 1.2411. When the level of virtual agglomeration falls below the threshold value (VA ≤ 1.2411), the coefficient of VA’s impact on the Nevd is 0.066 and fails to pass the significance test. It indicates that at a low level of VA, its promotional effect on the Nevd is not pronounced. However, when the VA level exceeds the threshold (VA > 1.2411), the coefficient of VA rises to 0.249 and becomes statistically significant at the 1% level. This indicates that the promotional effect of VA on the Nevd significantly intensifies beyond the threshold, exhibiting distinct phased and nonlinear characteristics.
From an economic perspective, the establishment and operation of VA typically involve high fixed costs and initial investments. At lower levels of agglomeration, the limited number of participants and insufficient network connectivity density prevent the full realization of network effects, knowledge spillovers, and collaborative innovation effects, thereby weakening their capacity to drive the development of the new energy vehicle industry. As the level of VA continues to rise, the number of platform nodes and the strength of connections increase. Metcalfe’s Law suggests that the worth of the network scales with the square of its users. This leads to a marked improvement in the efficiency of knowledge and information flow, thereby strengthening technology diffusion, innovation collaboration, and industrial chain cooperation. Ultimately, this generates a promotional effect on the Nevd.
In summary, the impact of VA on the Nevd is not linearly increasing but exhibits a threshold effect. Only when the level of VA reaches a certain critical threshold can its promotional role in Nevd be fully unleashed through network effects and knowledge spillover mechanisms. Hypothesis 3 is thus validated.
5.4. Moderating Effects of Regional Innovation Environment
The results of the moderation effect are shown in column (7) of
Table 5. The coefficient for VA is 0.103, significant at the 1% level, suggesting that VA continues to promote the Nevd even after controlling for the moderating variable. The coefficient for the Innov is also significantly positive at the 1% level, indicating that it exerts a positive influence on the Nevd. The interaction coefficient between VA and Innov (VA × Innov) is 0.354 and significant at the 1% level, indicating that the Innov exerts a positive moderating effect on the promotion of Nevd through VA. Specifically, in regions with a stronger innovation atmosphere and more concentrated innovation resources, VA exerts a stronger promotional effect on the Nevd. Hypothesis 4 is thus validated.
5.5. Robustness Tests
To minimize the possible effects arising from sample outliers, measurement biases in variables and omission of key control variables on conclusions, this study conducted robustness tests on the results using 1% winsorization [
72], replacing the dependent variable [
73], add control variable [
74], replacing explanatory variables [
74] and one-period lag [
75].
5.5.1. 1% Winsorization
Two-tailed 1% tail trimming is applied to the primary continuous variables to eliminate the interference of extreme observations on the regression outcomes, ensuring conclusions remain unaffected by anomalous samples. Based on this adjustment, the benchmark regression model is re-estimated, with results presented in Column (1) of
Table 8.
5.5.2. Replacing the Dependent Variable
In benchmark regression, this paper employs the entropy weight method to measure the level of high-quality development in the new energy vehicle industry. Although the entropy weight method can mitigate biases arising from subjective weighting to some extent, its results may still be influenced by indicator selection and weighting methodologies. To this end, principal component analysis (PCA) is applied to perform dimensionality reduction on the existing 13 indicators. A composite index for the high-quality development of the new energy vehicle industry is then reconstructed as a substitute indicator for the dependent variable. Regression analysis is re-conducted under the same model settings, with the results shown in Column (2) of
Table 8.
5.5.3. Add Control Variables
In the benchmark regression model, this paper has controlled for several key factors influencing the Nevd. Regional industrial structure differences may also exert impacts on the Nevd by affecting resource allocation efficiency, factor mobility, and technological upgrading pathways. Therefore, this study further introduces the industrial structure upgrading index as an additional control variable. This indicator measures the ratio of tertiary industry value-added to secondary industry value-added, capturing the degree of regional industrial structure upgrading from traditional manufacturing to high-end industries. While maintaining the model specification, sample scope, and fixed effects unchanged, the baseline model was re-estimated. The regression results are shown in Column (3) of
Table 8.
5.5.4. Replacing Explanatory Variables
To test the robustness of the baseline regression results, this paper re-measures the level of VA using alternative indicators. Drawing on the research by Shen et al. [
76], we construct a virtual agglomeration index that comprehensively considers both the degree of industry agglomeration and digital infrastructure. Calculate the degree of industry agglomeration in each region using location entropy, and then multiply this value by the weight of Internet ports. The specific formula is
. This index provides a more comprehensive reflection of the overall characteristics of virtual agglomeration. The results of the re-estimation, conducted with the model specifications remaining unchanged, are presented in Column (4) of
Table 8.
5.5.5. One-Period Lag
Given that the impact of VA on the Nevd may be subject to a time lag, this paper employs the one-period lagged VA index as an explanatory variable to conduct a robustness test. This approach aligns with the dynamic adjustment patterns of economic activity and, to some extent, mitigates endogeneity issues arising from reverse causality. With all other control variables, fixed effects, and the sample scope held constant, the model is re-estimated, and the regression results are presented in column (5) of
Table 8.
The results consistently demonstrate significant positive effects, confirming the robustness of the conclusion that VA positively promotes the Nevd.
5.6. Heterogeneity Analysis
5.6.1. Temporal Heterogeneity
The manifestation of virtual agglomeration effects is not static but deeply dependent on the technological infrastructure and macro-policy environment upon which it relies. To examine the dynamic evolution of virtual agglomeration’s impact on the high-quality development of the new energy vehicle industry and identify the moderating role of major policy shocks, this study uses the 2020 national policy white paper explicitly proposing the “new infrastructure” strategy as a dividing point. The sample period is divided into two phases: 2018–2019 (pre-policy) and 2020–2023 (policy implementation), with separate regression analyses conducted for each.
The regression results are shown in columns (1) and (2) of
Table 9. The coefficient for VA exhibits a fundamental shift across the two phases. During 2018 to 2019, VA’s coefficient is −0.062 and significant at the 5% level. This indicates that in the early stages of digital infrastructure development, the costs of establishing and coordinating virtual agglomeration may temporarily exceed the network benefits generated, exerting a slight inhibitory effect on industrial development. However, from 2020 to 2023, the coefficient for VA shifted to 0.223, highly significant at the 1% level. This suggests that with the implementation and advancement of the “New Infrastructure” policy, bottlenecks in digital infrastructure have been effectively alleviated. Consequently, the network effects, knowledge spillovers, and collaborative innovation potential of virtual agglomeration have been fully unleashed, promoting the high-quality development of the new energy vehicle industry.
5.6.2. Regional Heterogeneity
Digital infrastructure serves as the critical physical foundation for information flow, online collaboration, and data-driven empowerment. Its development level directly constrains the operational efficiency and scope of virtual agglomeration. Therefore, based on the average level of digital infrastructure across provinces during the sample period, this study groups the sample into “low-level regions” and “high-level regions” for separate regression analysis. The estimation results are presented in columns (3) and (4) of
Table 9.
The estimated coefficient for VA is 0.1109 in low-level areas and rises to 0.2781 in high-level areas; both are statistically significant at the 5% level, with the latter coefficient being approximately 2.5 times that of the former. This disparity indicates that the promoting effect of VA on the Nevd is highly dependent on the sophistication of regional digital infrastructure. A well-established digital foundation facilitates cross-regional information flow and resource sharing, thereby amplifying the network effects of virtual agglomeration. Conversely, in regions with weak infrastructure, its enabling role cannot be effectively realized, and its marginal contribution is constrained.
5.7. Endogeneity Tests
Given the potential bidirectional causal relationship between VA and NEVD, this study uses the total volume of postal and telecommunications services in each province in 1984 as an instrumental variable to test for endogeneity [
77]. The current development of virtual agglomeration is closely linked to a region’s early telecommunications infrastructure; moreover, as a historical variable, it is unlikely to be directly influenced by current dynamics in the new energy vehicle industry, thereby satisfying the requirements for correlation and exogeneity of an instrumental variable.
Table 10 presents the results of the endogeneity test conducted using 2SLS. The first-stage regression results show that the coefficient of the instrumental variable (IV) is 1.044 and is highly significant at the 1% level, indicating a robust and statistically significant strong correlation between the instrumental variable and the endogenous variable of interest (VA). The Kleibergen–Paap rk LM statistic is 26.579 (
p = 0.000), rejecting the null hypothesis of insufficient model identification. The Kleibergen–Paap rk Wald F statistic is 44.38, which is far greater than the critical value (16.38) for the Stock-Yogo weak identification test, confirming that there is no weak instrument problem. The coefficient of the VA in Stage 2 is 0.0542 and is significantly positive at the 5% level, which is consistent with the results of the baseline regression, indicating that the findings of this study are not driven by endogeneity bias.