1. Introduction
In 2018, the Intergovernmental Panel on Climate Change (IPCC) stated that the world must limit global warming to 1.5 °C to achieve the goal of net-zero greenhouse gas (GHG) emissions by the mid-21st century [
1]. China has pledged to strive toward peak CO
2 emissions by 2030 and achieve carbon neutrality by 2060 [
2]. Electric vehicles (EVs) are considered an important pathway for carbon reduction in the transportation sector [
3]. A series of policies, such as subsidies, the dual-credit policy, and trade-in programs, have been implemented, effectively promoting the robust growth of the electric vehicle industry [
4,
5,
6]. In 2024, the production and sales of EVs in China reached 12.89 million and 12.87 million, respectively [
7], accounting for 70.4% of the global market [
8]. China firmly retains its position as the world’s largest market for EVs [
9]. With the rapid development of the EV market, the power battery industry is also experiencing remarkable growth. The total installed capacity of EV batteries in China reached 548.4 GWh in 2024 [
10]. China’s exports of power batteries have also been growing rapidly. In 2024, the export volume of batteries reached 133.7 GWh, marking a year-on-year increase of 5% [
10]. The European Union and other regions are counted as some of the primary markets for Chinese power batteries [
11].
Carbon emissions over the life cycle of power batteries account for approximately 40% to 60% of those of electric vehicles [
12,
13]. As a result, the management of battery carbon footprint (CF) has become a hot topic in recent years. The European Commission released the EU Battery Regulation (2023/1542), which came into effect in August 2023. It is the first regulation to mandate carbon footprint disclosure and limits as part of its requirements. This regulation stipulates that EV batteries entering the EU market from 2027 must provide a comprehensive life cycle CF statement and meet graded carbon intensity thresholds by 2030 [
14]. This paradigm shift in policy is compelling manufacturers to accelerate innovations in low-carbon technologies. China has also been actively promoting the carbon management of power batteries and has achieved remarkable progress. In June 2024, 15 departments, including the Ministry of Ecology and Environment (MEE), issued a plan, giving priority to focusing on lithium batteries to formulate carbon footprint accounting rules and a carbon label certification system [
15]. In July of the same year, the General Office of the State Council issued a document requiring the formulation of carbon accounting rules for relevant products [
16].
In recent years, research on the CF of EV batteries has advanced significantly, providing a comprehensive understanding of key aspects critical for sustainable battery development. Comparative studies have quantified the lifecycle CF of mainstream battery chemistries, revealing substantial differences. For example, it is reported that in China, NCM battery production in 2020 emitted 111 kg CO
2-eq/kWh across raw material extraction, assembly, and recycling, compared to 64 kg CO
2 eq/kWh for LFP batteries [
17]. Emerging technologies like sodium-ion batteries (SIBs) and solid-state batteries (SSBs) are also under scrutiny, noting generally lower emissions for SIBs than lithium-ion batteries (LIBs) at the manufacturing stage [
18]. However, recent research showed that cradle-to-gate emissions vary widely depending on electrode configurations, with LIBs emitting 58–92 kg CO
2-eq/kWh, SIBs 75–87 kg CO
2-eq/kWh, and SSBs 88–130 kg CO
2-eq/kWh [
19]. Regarding phase-specific CF contributions, studies have identified the material preparation stage as the primary emitter, accounting for over 95% of LIB lifecycle emissions [
20]. Energy-intensive processes like vacuum drying (over 40% of manufacturing emissions) and coating also contribute significantly. The regional electricity mix affects usage-phase emissions, with China’s 2020 thermal power grid resulting in 154.1 kg CO
2-eq/kWh during battery operation. Recycling holds great potential, as remanufacturing with recycled materials reduces emissions by 51.8% compared to virgin production, and hydrometallurgical recycling currently shows the lowest CF [
21]. Key drivers of CF variability have been elucidated, including material provenance, where recycled materials offer substantial savings, and energy density improvements, which explain 85% of the 39% lower global warming potential of NCM 811 compared to NCM 111 [
22]. Manufacturing process innovations, such as closed-loop recycling systems, and regional energy mix characteristics, with the potential for up to 48% emission reduction using green electricity [
23], also play crucial roles. Overall, these findings have established a solid foundation for developing technology-specific, scenario-aware CF evaluation frameworks to guide the sustainable evolution of EV battery technologies. Meanwhile, studies from Europe and North America have also identified cathode chemistry, energy density, and regional electricity carbon intensity as the core determinants of EV battery carbon footprints, further verifying the global universality of these influencing factors [
24,
25,
26].
Despite some research progress in CFs of EV batteries, research gaps remain: (a) the battery data sources utilized in current research often focus on a limited number of battery samples, resulting in a lack of large-scale, comprehensive, and systematic investigations across different regions. In international studies that include China, researchers typically analyze the country as a whole, neglecting provincial-level differences [
17,
27]. (b) While some studies do refine their focus to the provincial level within China, they often consider factors such as materials and production locations without thoroughly examining the internal relationships between battery performance indicators, such as energy density [
28].
This paper aims to fill these gaps by analyzing China’s EV battery industry through extensive data collection and standardized analytical methods. The main contributions of this paper are summarized as follows:
- (1)
Actual battery data from over 100 battery cells of best-selling EV models in China were utilized, representing more than 50% of the market share. Using life cycle analysis (LCA) and regression analysis methods, CF accounting and influencing factor analysis models were established for EV batteries in China. These models quantitatively analyze the composition and key factors affecting the cell-level CF.
- (2)
Based on the latest provincial electricity carbon intensity data in China, regional disparities in electricity carbon intensity are incorporated into the battery LCA analysis. The regression analysis further examines how regional electricity carbon intensity affects the overall CF of EV batteries.
- (3)
Based on the descriptive analysis of these 100 battery cell CF results, a regression analysis was conducted on the influence of battery cell cathode types, energy density, and regional electricity carbon intensity on the battery cell CFs, and the statistical analysis conclusion was obtained.
The remaining content of this paper is structured as follows:
Section 2 provides a comprehensive overview of the data.
Section 3 introduces the LCA research method, detailing the definition of objectives and scope, which includes the system boundaries, unit selection, and data requirements.
Section 4 calculates CFs and analyzes the environmental impact factors of cells based on different material systems and energy densities.
Section 5 interprets and summarizes the findings, offering policy suggestions to support effective implementation.
2. Data
To enhance the representativeness of the research conclusions, the China Automotive Multi-source Fusion Basic Database was utilized, which was developed by Automotive Data of China Co., Ltd., to provide high-resolution data support for EV battery CF calculations. This comprehensive database integrates information on over 1200 battery systems from mainstream EV models produced and sold within China. Corresponding EV sales account for more than 90% of the EV market. The database encompasses detailed fields including vehicle information linked to each battery type (e.g., vehicle category, model, powertrain type, production details), battery pack specifications (e.g., supplier, production date, capacity, energy, size, configuration), and cell-level data (e.g., cell supplier, chemistry, model, capacity, energy, quantity, size). Additionally, the database provides granular component information for cells, such as the mass of cathode, anode, electrolyte, and materials like copper, aluminum, steel, plastics, insulators, and binders.
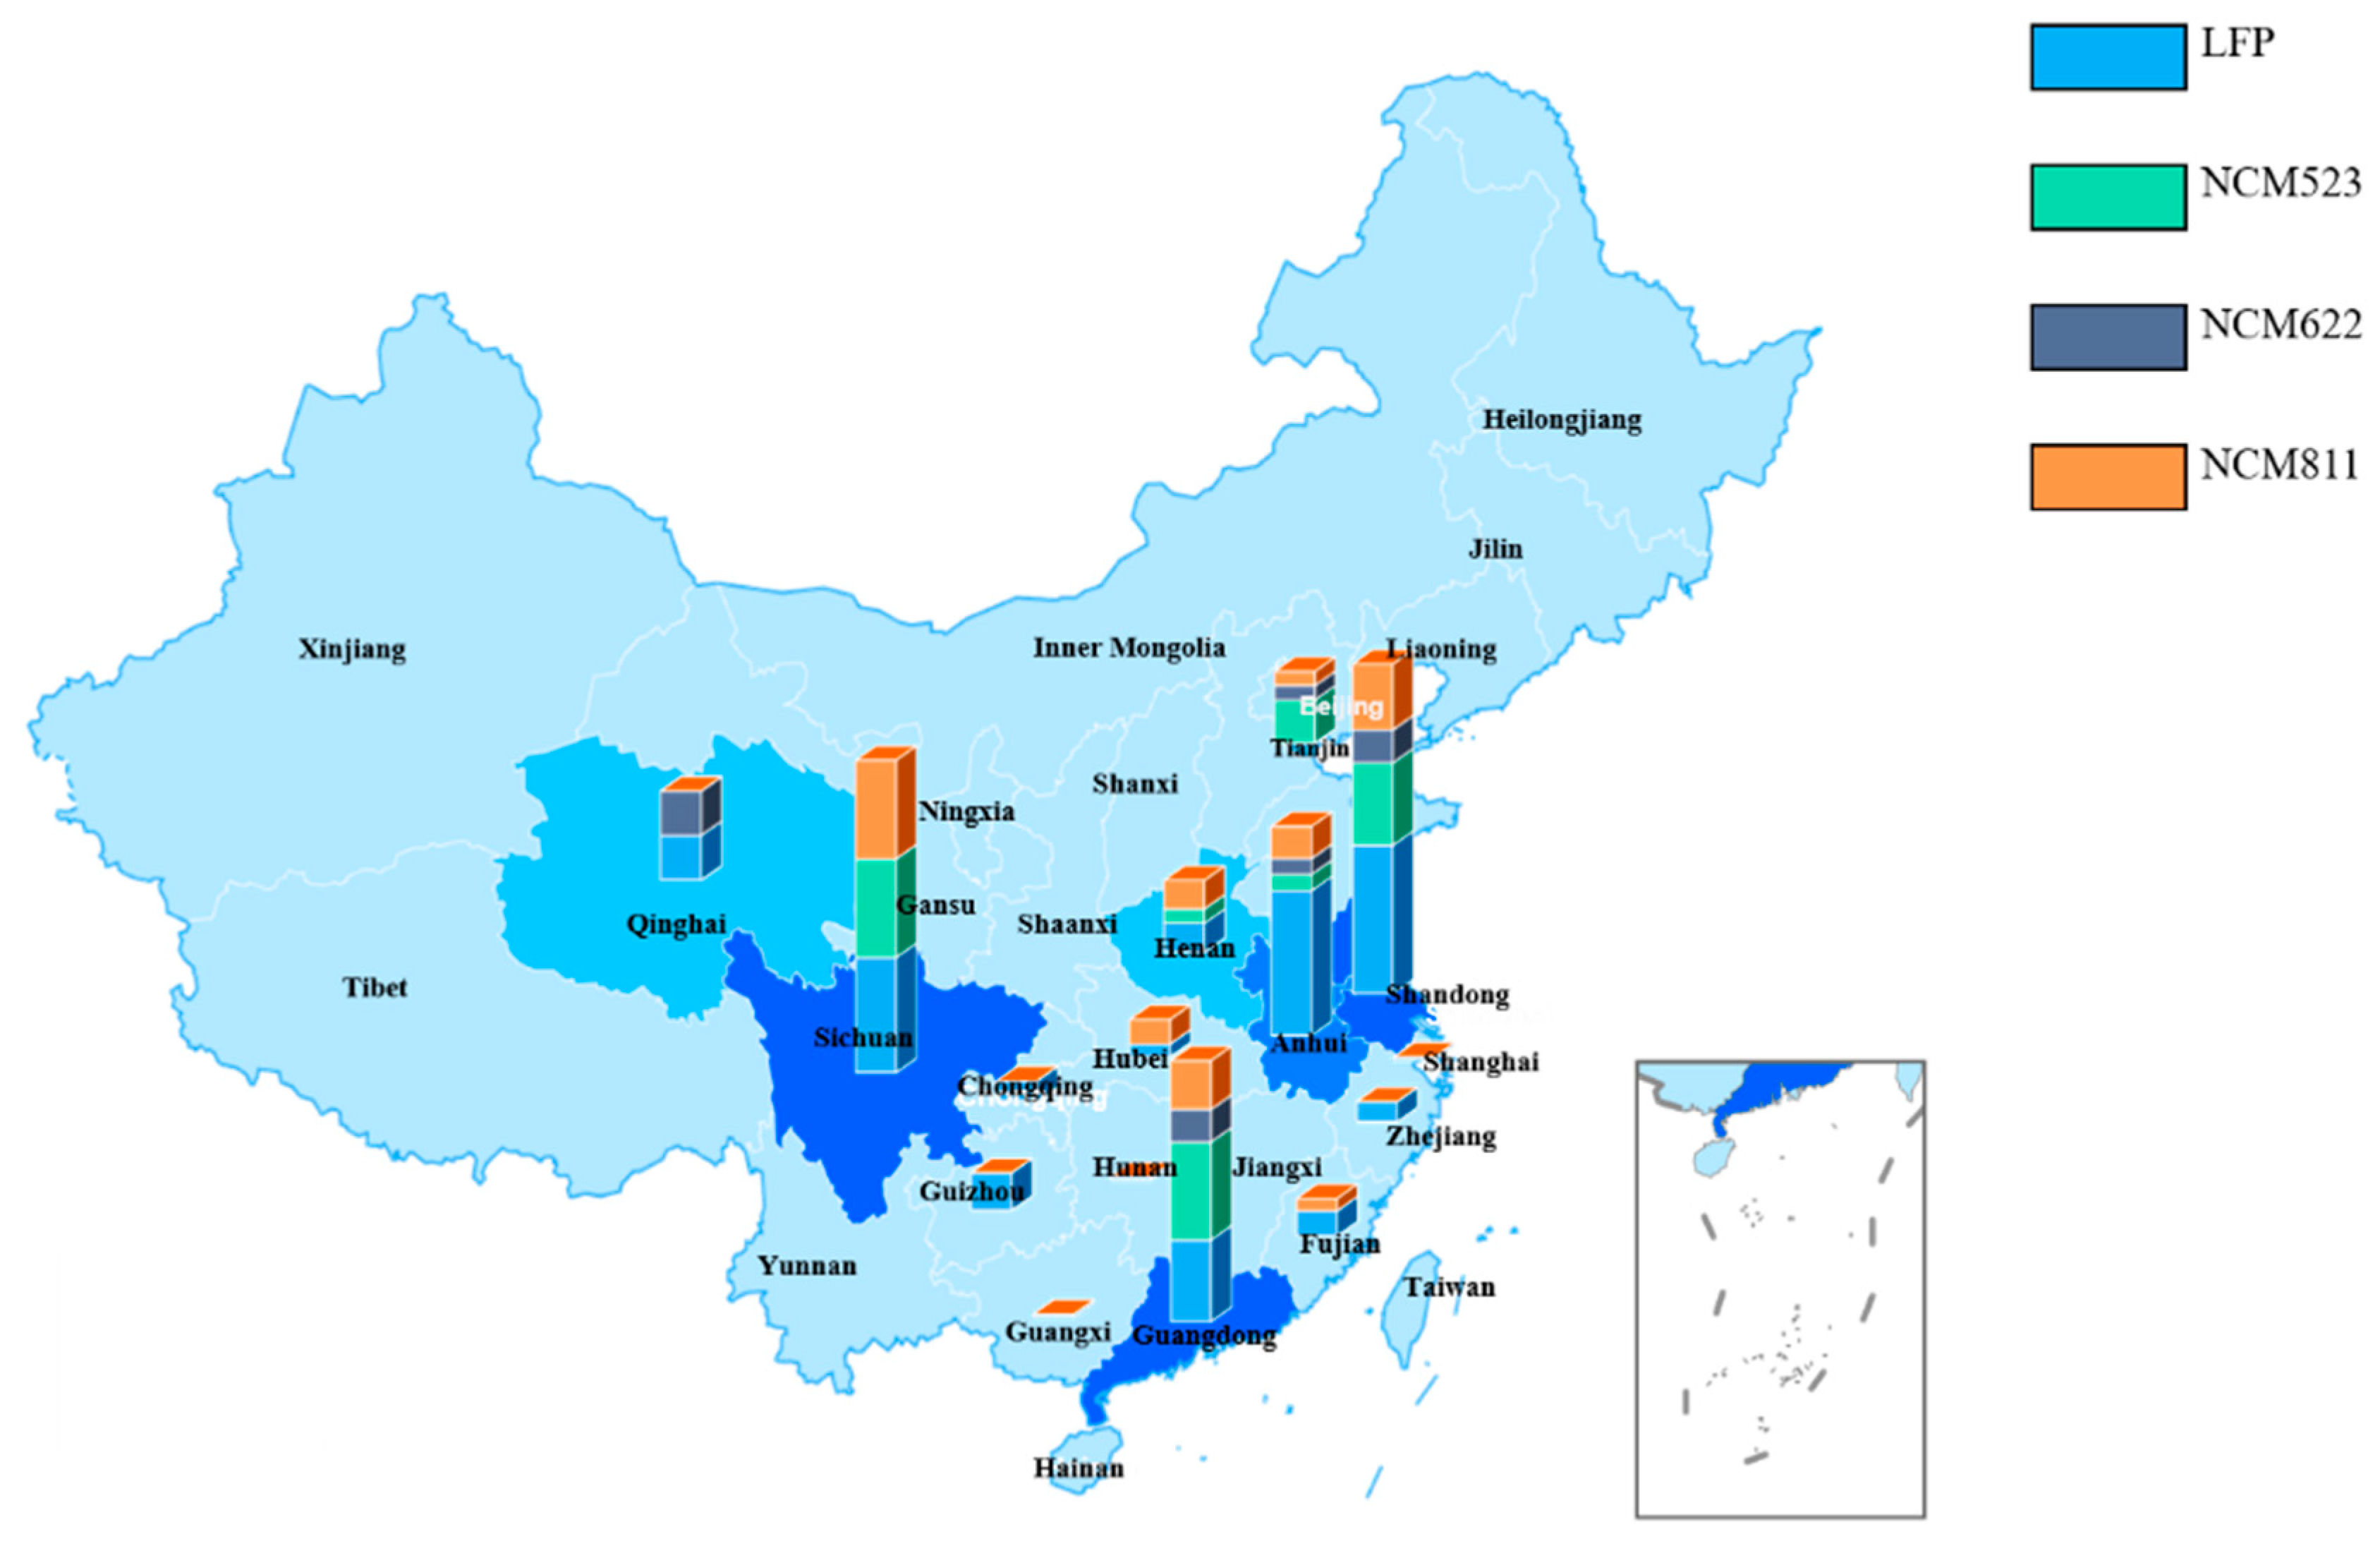
Based on the high-resolution data provided by the aforementioned multi-source fusion database, 100 mainstream battery cells were screened and selected as samples from the database based on the sales volume of EVs in the past two years, taking into account the diversity of cathode types. The sales volume of EVs utilizing these battery cells used in this study has exceeded 50% of the market share for EVs in China over the past two years. The cell component data are all derived from real-world information. The samples include major battery types such as the LFP and NCM series (including NCM523, NCM622, and NCM811), which account for 48%, 22%, 9%, and 21% of the total samples, respectively. As illustrated in
Figure 1, the cell production regions are predominantly concentrated in the Yangtze River Delta (Jiangsu, Anhui, and Zhejiang), the Pearl River Delta (Guangdong), and the Southwest region (Sichuan and Chongqing). Jiangsu Province leads with 20 samples (20%), followed closely by Sichuan Province with 19 samples (19%). In terms of specific battery cell types, LFP battery cells are primarily produced in Anhui (nine samples), Sichuan (seven samples), and Qinghai (three samples). In contrast, high-nickel NCM battery cells (NCM811) are chiefly concentrated in Sichuan (six samples), Jiangsu (four samples), and Hubei (two samples), reflecting the differentiated technological layout within the regional industrial chain.
The samples include leading EV and battery cell brands in China. Battery cell power ranges from 0.02 kWh to 1.04 kWh, with masses ranging from 0.072 kg to 4.25 kg. The energy density of the cells spans from 135.81 Wh/kg to 338.24 Wh/kg. LFP cells have an average power of 0.37 kWh, an average mass of 2.04 kg, and an average energy density of 179.81 Wh/kg. In contrast, NCM cells average 0.39 kWh in power, 1.74 kg in mass, and 222.42 Wh/kg in energy density, 23.70% higher than LFP cells. Among the NCM category, NCM523 cells have an average power of 0.36 kWh, a mass of 1.71 kg, and an energy density of 206.50 Wh/kg. NCM622 cells show an average power of 0.30 kWh, a mass of 1.40 kg, and an energy density of 207.11 Wh/kg. NCM811 cells exhibit an average power of 0.46 kWh, a mass of 1.92 kg, and an energy density of 245.66 Wh/kg. The energy densities of NCM523, NCM622, and NCM811 are 15%, 15%, and 37% higher than those of LFP cells.
Based on the material composition data of EV battery cells, the materials required for manufacturing battery cells can be categorized into 14 types: cathode active materials, graphite, LiPF6, ethylene carbonate (EC), dimethyl carbonate (DMC), aluminum, copper, polyvinylidene difluoride (PVDF), anode adhesive, insulator, polypropylene (PP), polyethylene (PE), polyethylene terephthalate (PET), and steel. To ensure the conciseness of results, the three electrolyte components (LiPF6, EC, and DMC) are grouped as electrolytes. Cathode active materials and PVDF are grouped as cathode materials; graphite and anode adhesives are grouped as anode materials; PP, PE, and PET are grouped as plastics for the subsequent analysis.
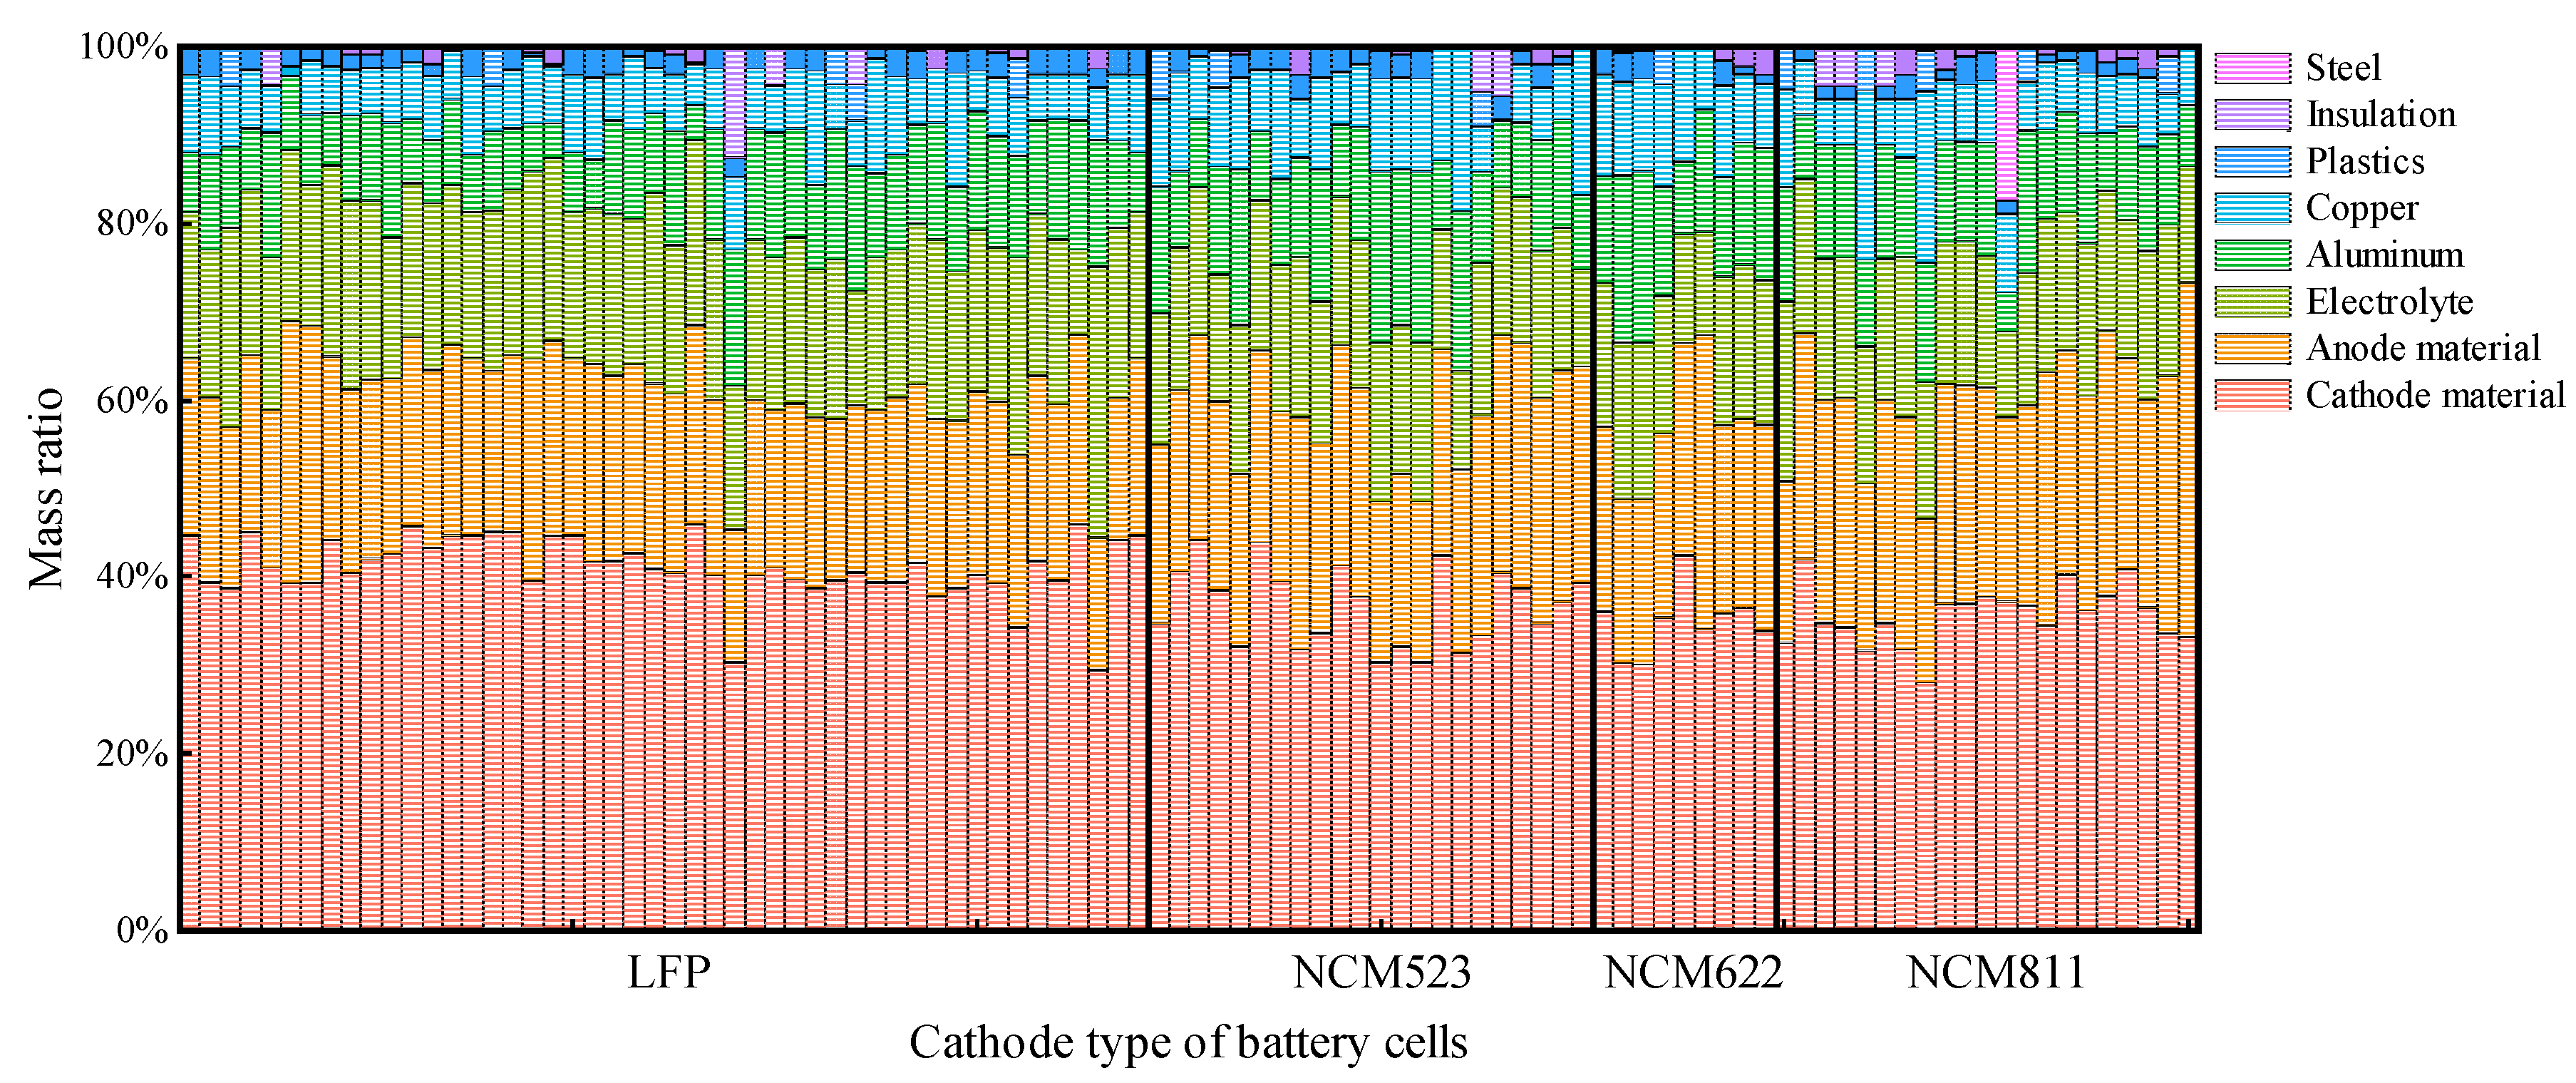
The material compositions of the sample cells are presented in
Figure 2. In the material composition of battery cells, cathode materials constitute the largest proportion, followed by anode materials and then electrolytes. For LFP and NCM cells, the average mass ratios of cathode materials are 41% and 36%, respectively. The NCM variants, NCM523, NCM622, and NCM811, exhibit average mass ratios of 37%, 35%, and 36%, respectively. Meanwhile, the average mass ratios of anode materials for LFP and NCM cells are 20% and 24%, respectively. Within the NCM cell series, the average mass ratios of the anode materials are 23% for NCM523, 22% for NCM622, and 25% for NCM811. Moreover, in LFP and NCM cells, the average mass proportions of electrolyte are 18% and 16%, respectively. For the NCM series, the average mass proportions of electrolytes for NCM523, NCM622, and NCM811 are all 16%, indicating that the electrolyte proportion in NCM cells remains relatively consistent.
The average proportions of aluminum in LFP and NCM cells are 10% and 12%, respectively. Within the NCM series, the average aluminum mass ratios for NCM523, NCM622, and NCM811 are 12%, 14%, and 11%, respectively, reflecting variability among different cell types. Moreover, the mass ratio of copper is less than that of aluminum, with proportions of 7% in LFP cells and 9% in NCM cells. In the NCM series, the average copper mass ratios are 9%, 10%, and 8% for NCM523, NCM622, and NCM811, respectively. Additionally, the mass proportion of plastic is approximately 2% across the board. The average proportions of plastic in both LFP and NCM cells are 2%. The mass proportions of the insulator are about 1% in both LFP and NCM cells. Finally, the mass proportion of steel is less than 1%.
In calculating the cell CFs, the most recent regional electricity power CO
2 emission factors released by the Ministry of Ecology and Environment of China were utilized [
29]. Regional electricity carbon intensity primarily influences the energy input component of the CF associated with cell production. It is assumed that the contribution of material components to the battery cell CF remains constant across different regions. This hypothesis posits that the CF of battery materials changes independently of the production location. This assumption is bolstered by the fact that the material supply chain is globally distributed [
30].
4. Results and Discussion
This section systematically analyzes and discusses the carbon footprints of different power battery cells through two logically sequential stages. The first stage (
Section 4.1,
Section 4.2,
Section 4.3) presents and describes the macroscopic statistical patterns based on the cradle-to-gate carbon footprint results of 100 cell samples, including a comparison of footprints across different chemical systems and a decomposition of contributions by material components. Building on these findings, the second stage (
Section 4.4) shifts toward attribution analysis and driver identification, using an econometric model to quantitatively analyze the key influencing factors and their relative importance that underlie the observed variations.
4.1. Carbon Footprint of Different Cell Types
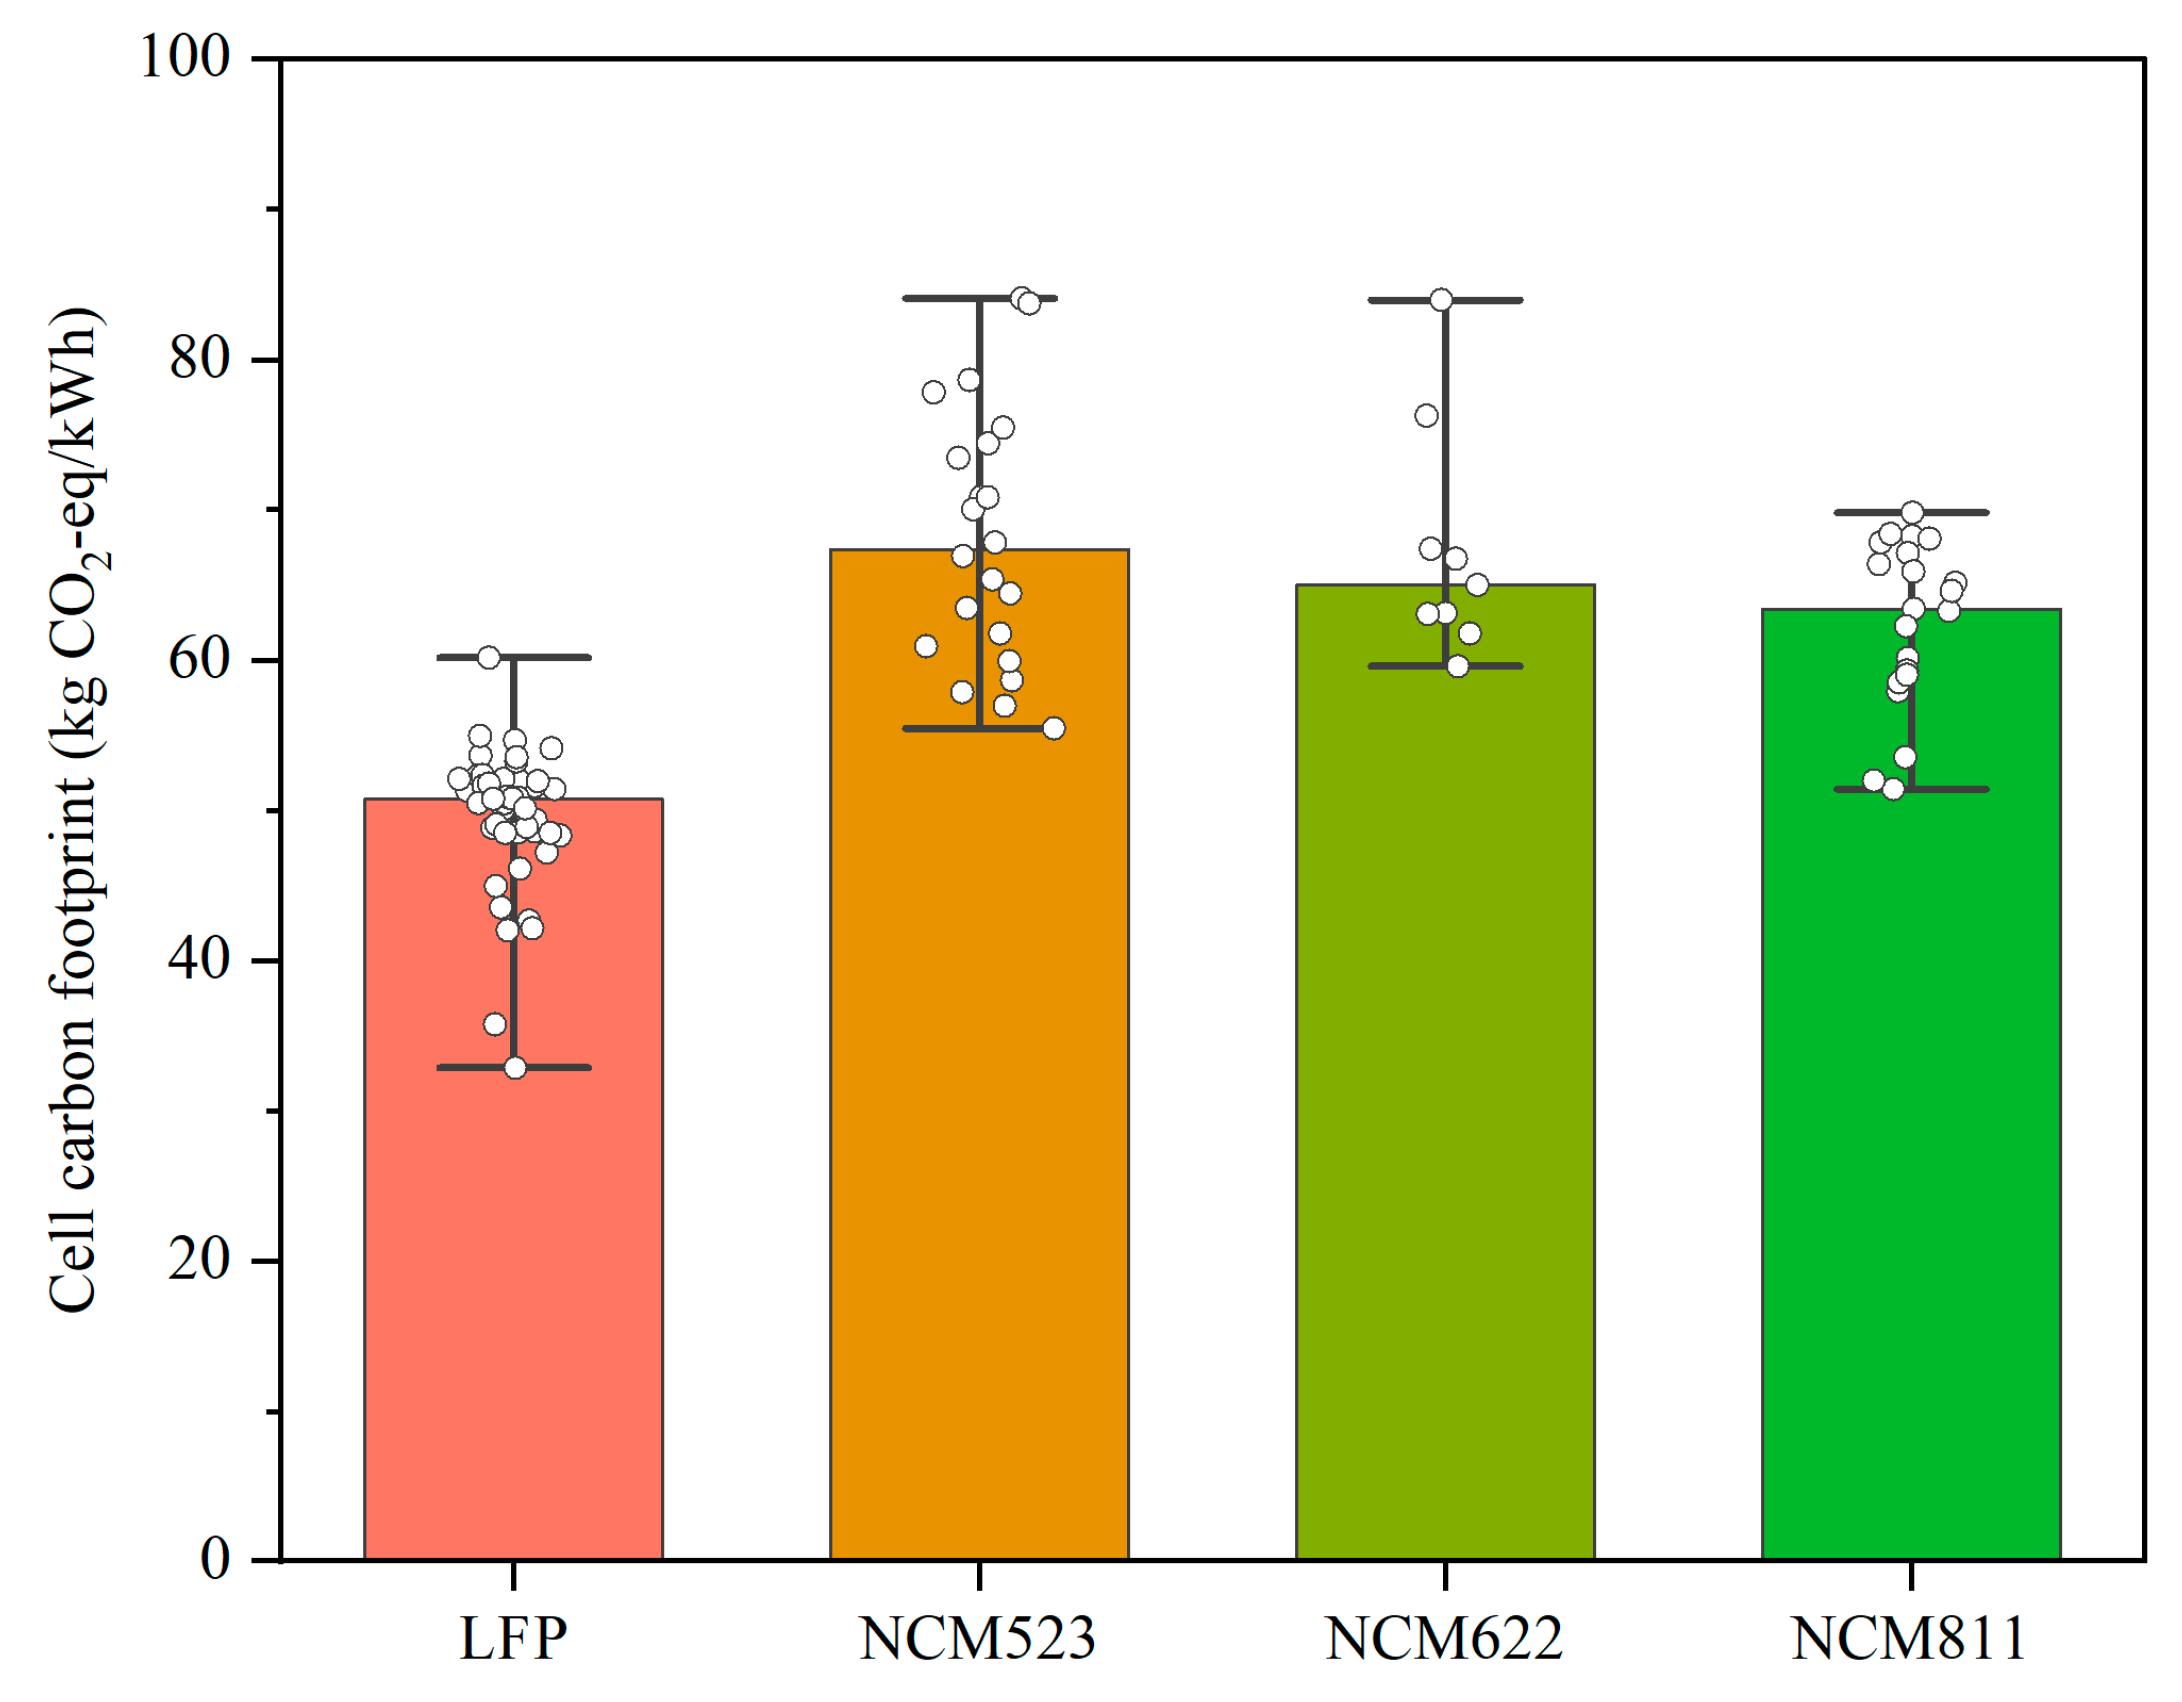
The 100 battery cells’ CFs are shown in
Figure 3. Bars indicate median values, positive and negative errors show the minimum and maximum value, and the in-between cell CF values are shown as a scatter. The CFs of LFP cells range from 32.89 to 60.17 kg CO
2-eq/kWh, with a median value of 50.48 kg CO
2-eq/kWh, whereas NCM series cells exhibit a CF ranging from 51.42 to 84.06 kg CO
2-eq/kWh. Within the NCM series, the CFs for the NCM523, NCM622, and NCM811 cells are as follows: NCM523 ranges from 55.45 to 84.06 kg CO
2-eq/kWh, with a median value of 68.93 kg CO
2-eq/kWh, NCM622 ranges from 59.58 to 83.95 kg CO
2-eq/kWh, with a median value of 65.01 kg CO
2-eq/kWh, and NCM811 ranges from 51.42 to 63.41 kg CO
2-eq/kWh, with a median value of 50.74 kg CO
2-eq/kWh.
We also calculate the weighted average CF of four battery cell types using the sales volumes of the corresponding models in the sample over the past two years as weights. The results indicate that the LFP cell has a weighted average CF of 49.42 kg CO
2-eq/kWh. For the NCM variants, the weighted average CFs are 65.16 kg CO
2-eq/kWh for NCM523, 64.86 kg CO
2-eq/kWh for NCM622, and 63.08 kg CO
2-eq/kWh for NCM811. The NCM811 CF result is consistent with prior analyses of battery life-cycle assessments [
21,
36].
4.2. Decomposition of Cell Carbon Footprint by Material Component
Existing research indicates that the battery cell CFs are primarily influenced by the material used [
35]. Therefore, the CFs of the various battery material components have been analyzed.
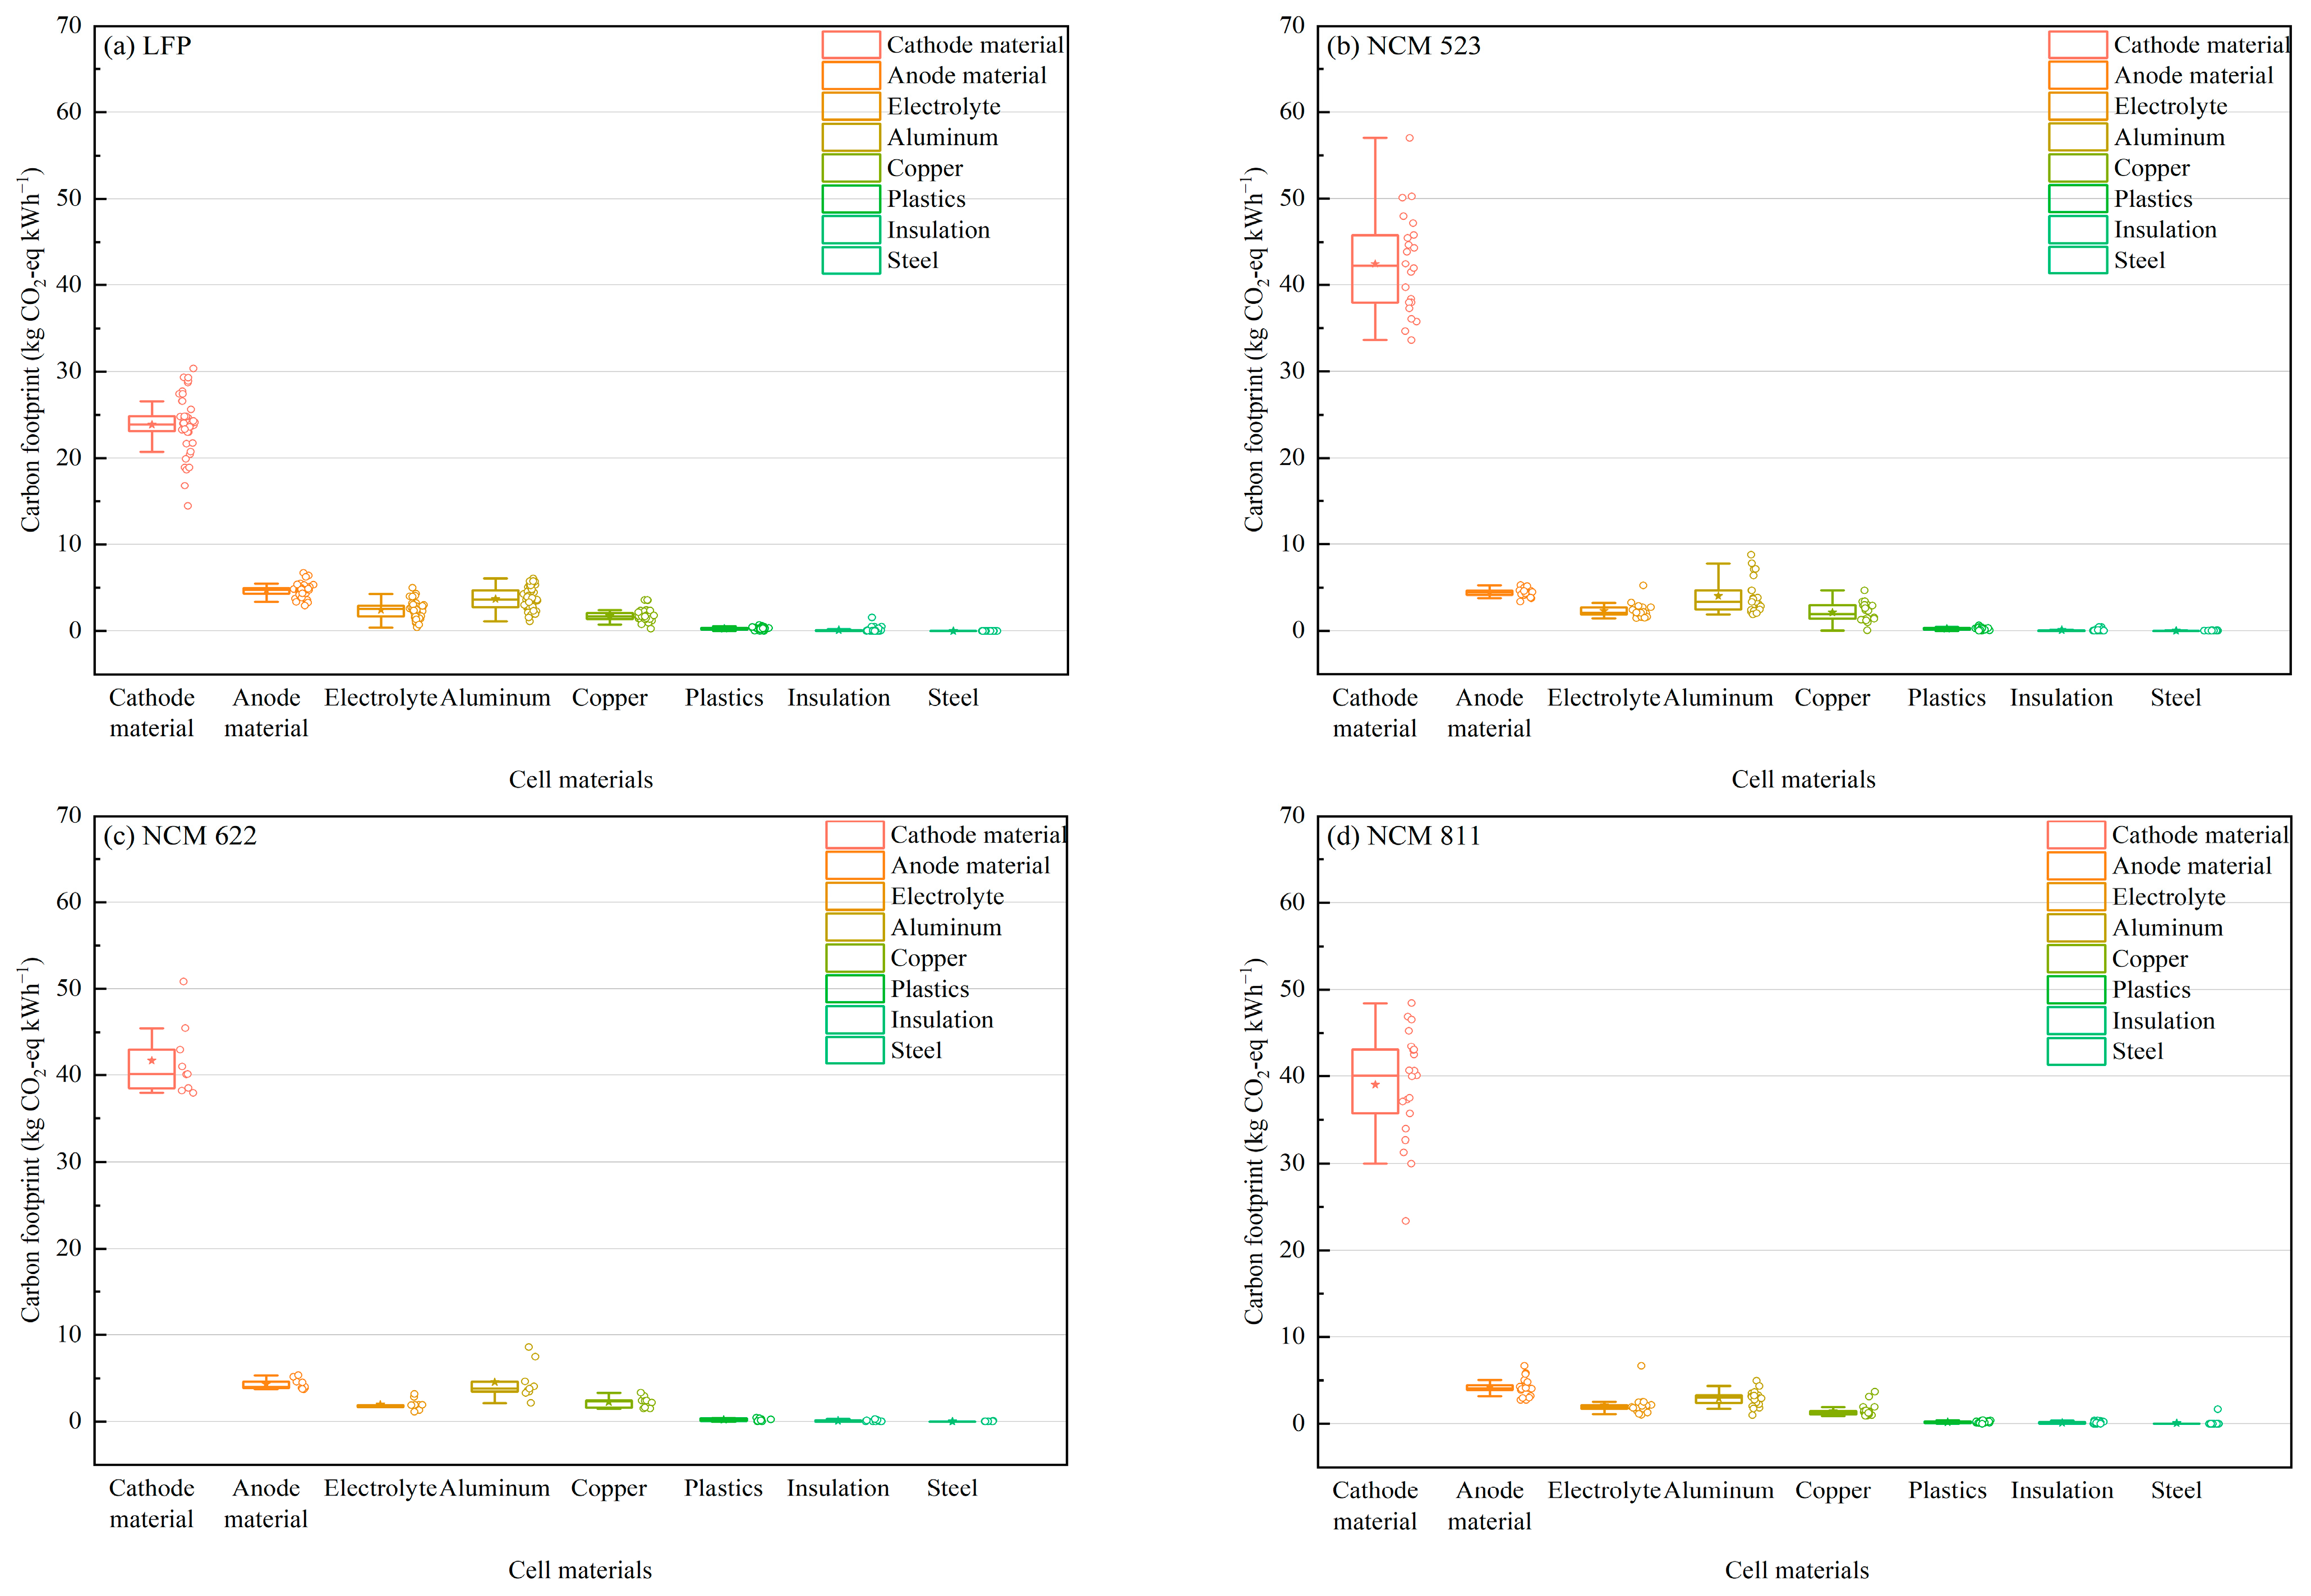
Figure 4 illustrates the CFs of each material component across the four types of cells. The scatter points represent the actual data distribution, while the box plot showcases the distribution characteristics of the sample data.
Among the four types of cells, the cathode material, anode material, electrolyte, aluminum, and copper exhibit higher CFs, with the cathode material having the highest CF. For LFP cells, the CF of the cathode material ranges from 14.43 to 30.35 kg CO2-eq/kWh, with a median value of 23.33 kg CO2-eq/kWh, while for NCM cells, the ranges rise from 23.39 to 57.02 kg CO2-eq/kWh. Within the NCM series, the cathode material CFs for NCM523, NCM622, and NCM811 cells are as follows: NCM523 ranges from 33.62 to 57.02 kg CO2-eq/kWh, with a median value of 41.70 kg CO2-eq/kWh, NCM622 ranges from 37.92 to 50.81 kg CO2-eq/kWh, with a median value of 40.09 kg CO2-eq/kWh, and NCM811 ranges from 23.39 to 48.44 kg CO2-eq/kWh, with a median value of 40.06 kg CO2-eq/kWh. In addition to the main cathode materials, anode materials, electrolytes, aluminum, and copper consistently contribute significant CFs across different cell types, with minimal variation between them. The CF of anode material ranges from 2.73 to 6.71 kg CO2-eq/kWh, with a median value of 4.51 kg CO2-eq/kWh, the CF of electrolyte ranges from 0.42 to 6.65 kg CO2-eq/kWh, with a median value of 2.15 kg CO2-eq/kWh, the CF of aluminum ranges from 1 to 8.80 kg CO2-eq/kWh, with a median value of 3.49 kg CO2-eq/kWh, and copper has a CF that ranges from 0.05 to 4.68 kg CO2-eq/kWh, with a median value of 1.56 kg CO2-eq/kWh.
In contrast, the CFs of other materials are low. This is attributed to their percentage in the overall cell material composition, as some materials play a minor role in the cell’s functioning. Consequently, to effectively reduce the overall CFs of battery cells, it is crucial to focus on the material consumption and processing technologies for the cathode material, anode material, electrolyte, aluminum, and copper.
4.3. Contribution of Battery Material Components to Cell Carbon Footprint
In this part, the specific composition of the cell CFs is analyzed to explore how both the material composition and the energy input contribute to the cell CF. The CF compositions of 100 cells are calculated according to cell type, and the results are presented in
Figure 5.
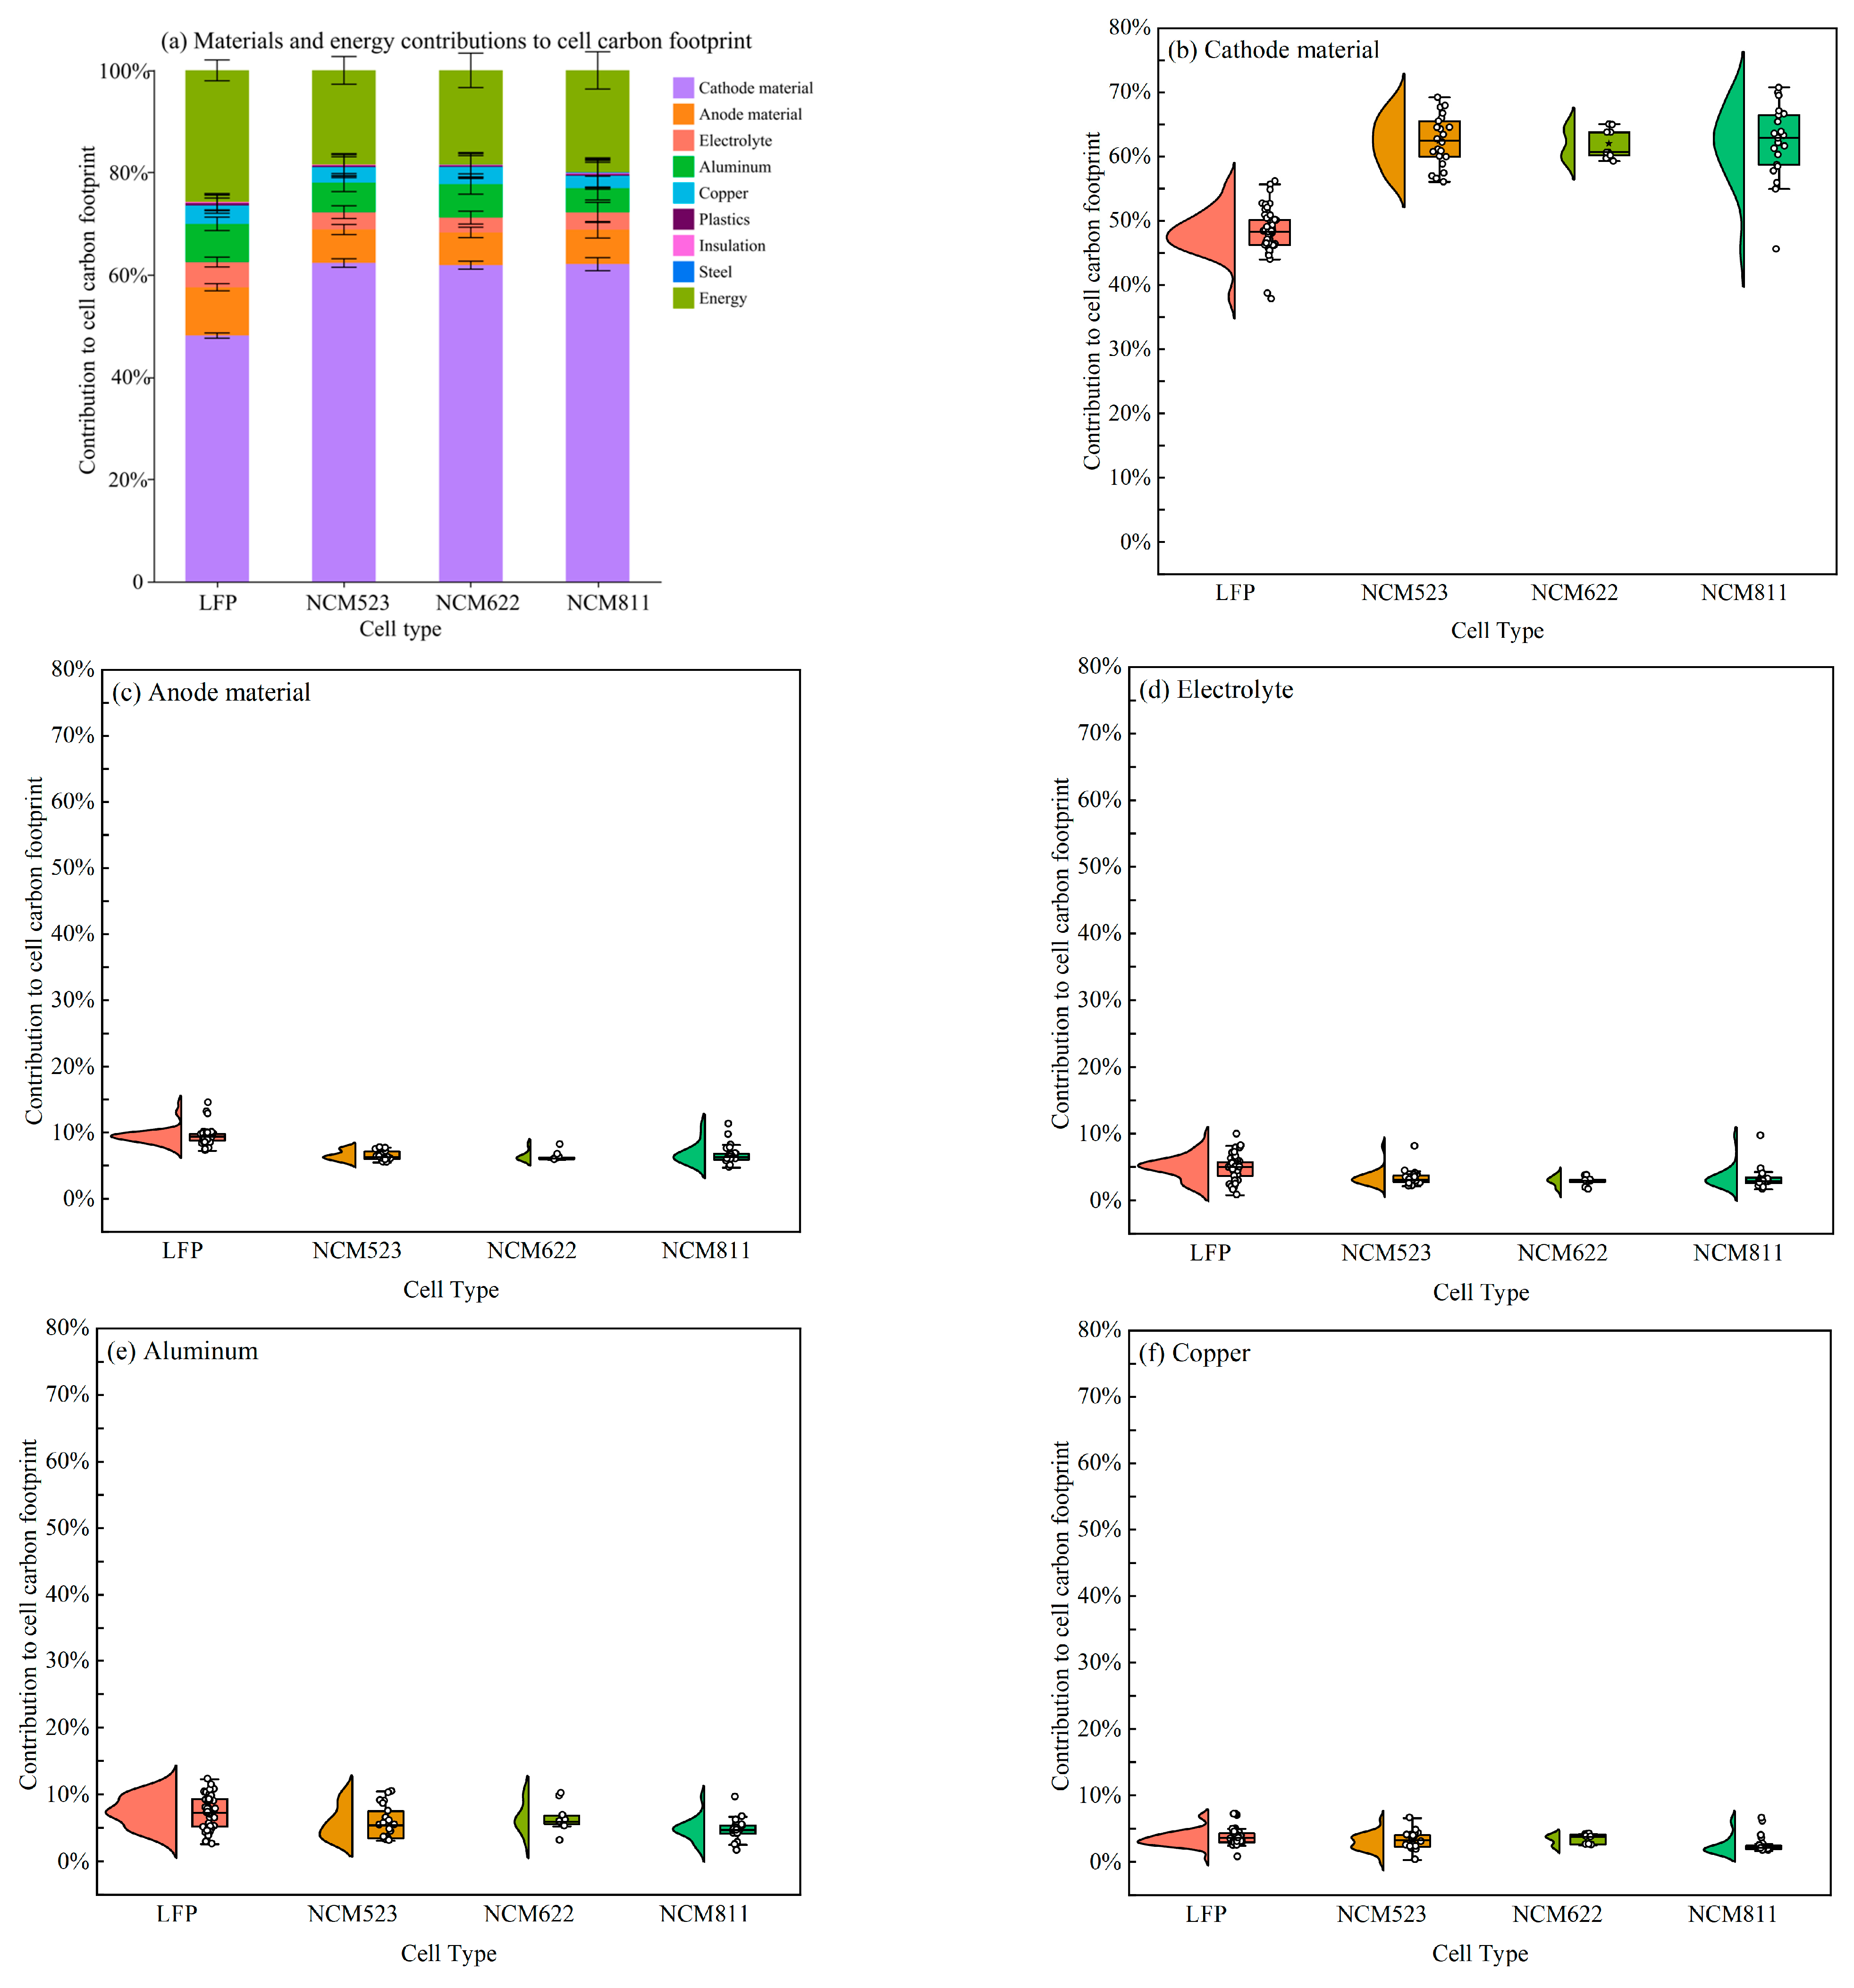
Figure 5a summarizes the average contribution of each material component and energy input across the four cell types to the CF. To further investigate the contributions of materials to the CF,
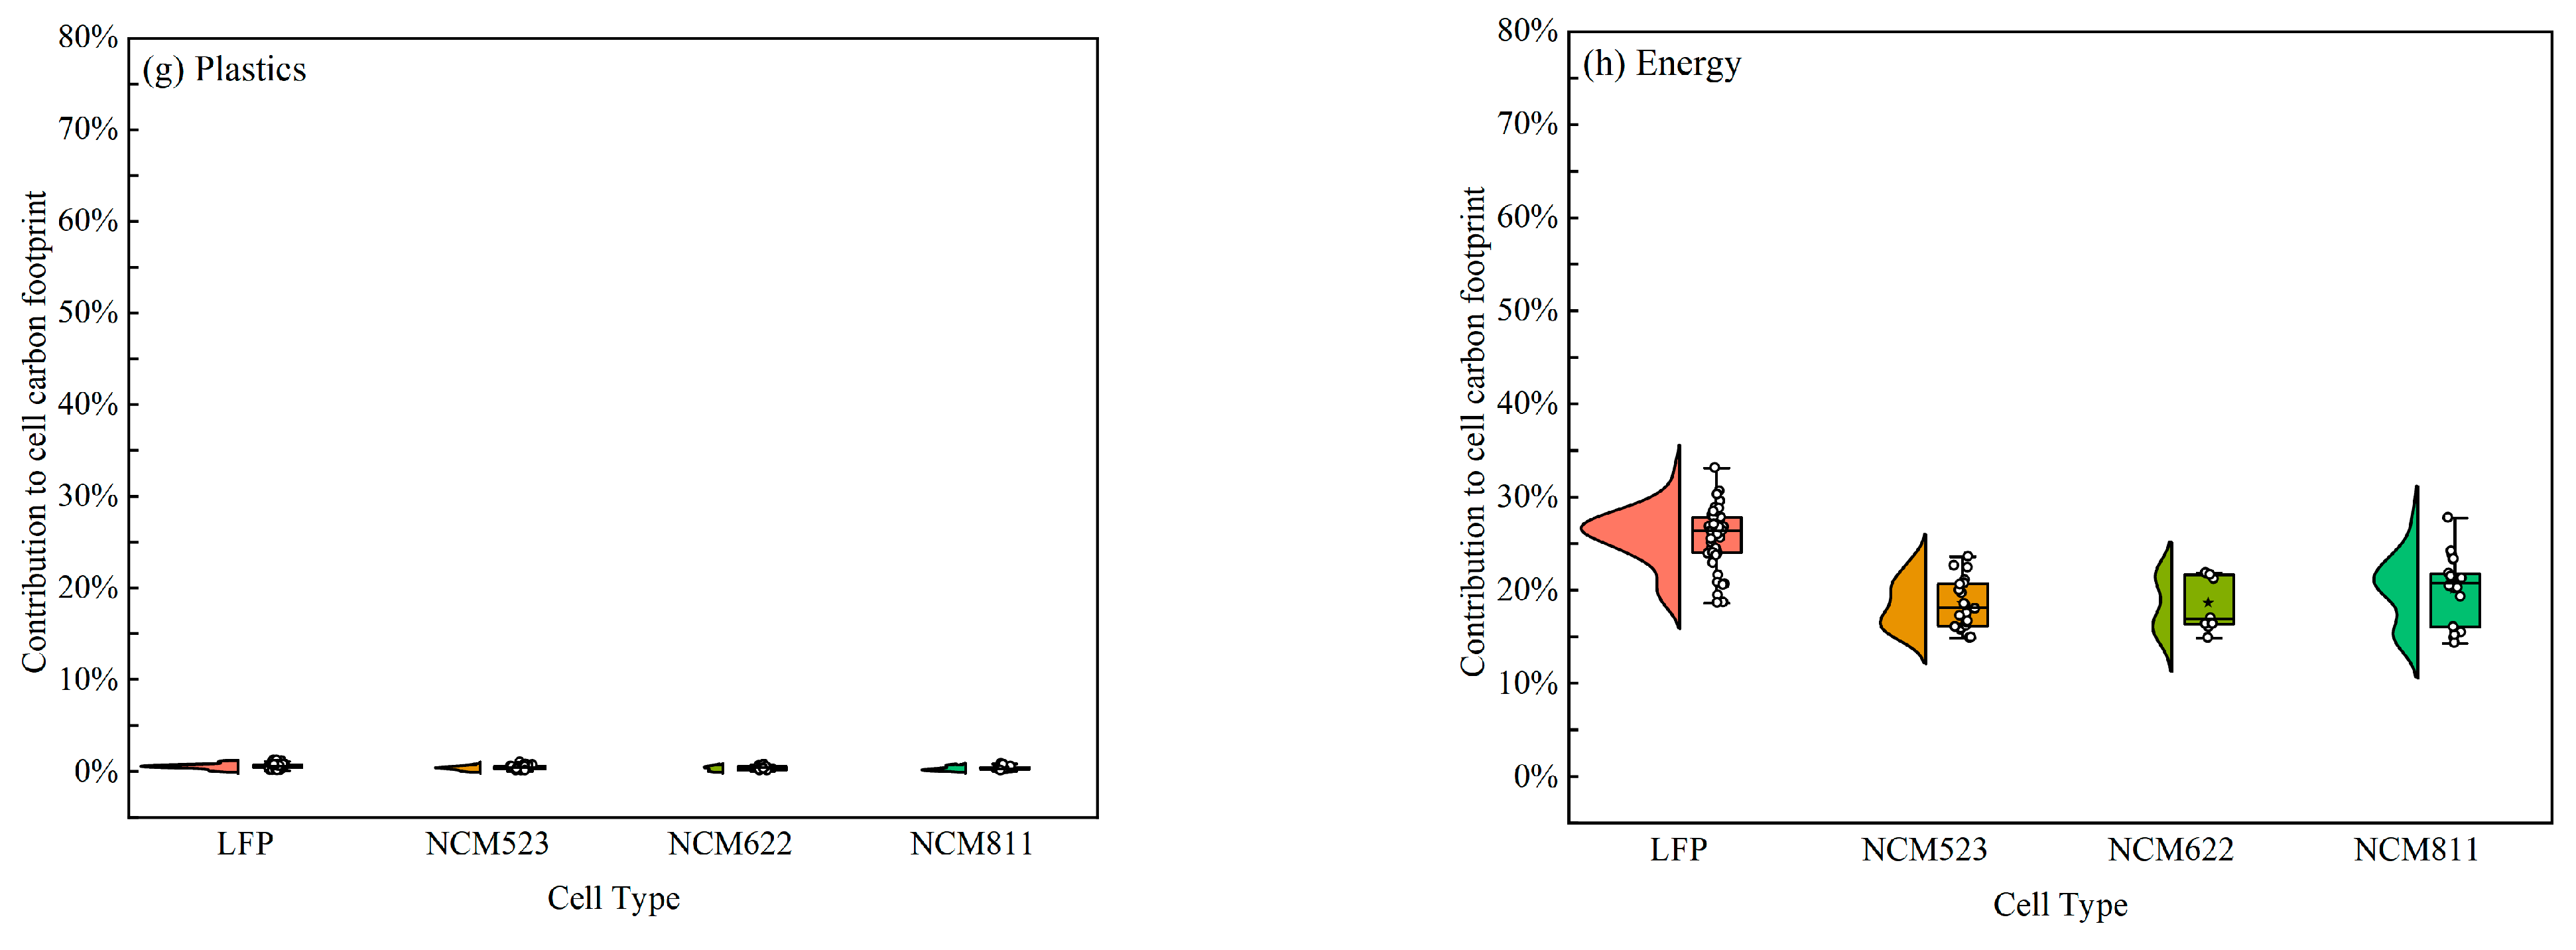
Figure 5b–h detail the contributions of each material. These figures encompass the statistics on the contributions of cathode materials, electrolytes, structural metals, auxiliary materials, and energy consumption to cell CFs. Given the minimal contribution of insulators and steel to the overall cell CF, their respective impacts were deemed insignificant and therefore excluded from the detailed CF contribution analysis. This comprehensive analysis provides key insights into the pathways for decarbonizing cell manufacturing.
The contribution of cathode materials to the CF of LFP cells is lower than that of NCM series cells. In LFP cells, cathode materials account for approximately 48% of the CF (standard error: 0.51%), with values ranging from 38% to 56%. In contrast, NCM cells average about 62% in contribution (standard errors are 0.83%, 0.78% and 1.28% for NCM523, NCM622, and NCM811, respectively). The contributions among the three NCM types show minimal variation. NCM523 ranges from 56% to 69%, and NCM622 fluctuates slightly, ranging from 59% to 65%, while NCM811 exhibits greater variability, with contributions from 45% to 71%. Overall, the contribution of cathode materials to the CF is 22% lower in LFP cells compared to NCM cells. These findings suggest that reducing the CF of cathode materials will have a more pronounced impact on NCM cells compared to LFP cells.
The contribution of anode material to the CF of LFP cells is higher than that of NCM series cells. In LFP cells, anode materials account for approximately 9% of the CF (standard error: 0.19%), with sample values ranging from 7% to 15%. In contrast, anode materials contribute about 7% to the CF in NCM cells (standard errors are 0.15%, 0.24%, and 0.34% for NCM523, NCM622, and NCM811, respectively). Contributions among the three NCM types differ notably: NCM523 and NCM622 show slight fluctuations, ranging from 6% to 8%, while NCM811 exhibits greater variability, with contributions from 5% to 11%. Overall, the contribution of graphite to the CF in LFP cells is 29% higher than in the NCM system.
The contribution of electrolyte to the CF of LFP cells is higher than that of NCM series cells, with notable differences among the three NCM types. In LFP cells, electrolyte accounts for approximately 5% of the CF (standard error: 0.27%), with sample values ranging from 1% to 10%. In contrast, the contribution of electrolyte in NCM cells is about 3% (standard errors are 0.26%, 0.23%, and 0.36% for NCM523, NCM622, and NCM811, respectively). Among the NCM cell types, contributions vary significantly: NCM523 and NCM811 exhibit fluctuations of 2% to 8% and 2% to 10%, respectively, while NCM622 shows slight variability, ranging from 2% to 4%. Overall, the contribution of electrolyte to the CF in LFP cells is 67% higher than in the NCM system.
The contribution of aluminum to the CF of LFP cells is significantly greater than that of NCM series cells. In LFP cells, aluminum contributes approximately 7% to the overall CF (standard error: 0.35%), with sample values ranging from 3% to 12%. In contrast, the contribution of aluminum in NCM cells is about 6%, 7%, and 5% for NCM523, NCM622, and NCM811, respectively (standard errors are 0.52%, 0.74%, and 0.36%, respectively). Among the three NCM types, aluminum’s contribution is relatively similar, with NCM523 and NCM622 sample values ranging from 3% to 11% and 3% to 10.%, respectively. And the NCM811 sample’s values range from 2% to 10%. Overall, the contribution of aluminum to the CF in LFP cells is 17% higher than in NCM cells.
The contribution of copper to the CF of LFP cells is greater than that of NCM series cells. In LFP cells, copper contributes approximately 4% to the overall CF (standard error: 0.17%), with values ranging from 1% to 7%. In contrast, the contribution of copper in NCM cells is about 3% (standard errors are 0.28%, 0.25% and 0.30% for NCM523, NCM622, and NCM811, respectively). Within the three NCM cell types, copper’s contribution varies significantly. NCM622 and NCM811 show minimal fluctuation, ranging from 2% to 4% and 1% to 6%, respectively. Conversely, NCM523 exhibits substantial variability, fluctuating from 0% to 6%. Overall, the contribution of copper to the CF in LFP cells is 33% higher than that in NCM cells.
The contribution of plastics to the CF of LFP is higher than that of the NCM series cells. In LFP cells, the plastics contribute approximately 1% to the overall CF (standard error is 0.04%), with values ranging from 0% to 1%. In contrast, the plastics’ contribution in NCM cells is about 0.3% (standard error is 0.05%). For the three NCM cell types, the contributions are relatively consistent, ranging from 0% to 1%.
The contribution of energy to the CF of LFP cells significantly differs from that of NCM series cells. In LFP cells, energy accounts for approximately 26% of the overall CF (standard error: 0.45%), with sample values ranging from 19% to 33%. In contrast, energy contributes about 18% to the CF in NCM523 and NCM622 cells (standard errors: 0.56% and 0.98%, respectively) and contributes about 20% to the NCM811 CF (standard error: 0.79%). Notably, among the three NCM cell types, the energy contribution is relatively larger and shows minimal fluctuation in NCM523 (15% to 24%) and NCM622 (15% to 22%), while the NCM811 cell exhibits greater variability, ranging from 14% to 28%. Overall, the energy contribution to the CF in LFP cells is 37% higher than in NCM cells.
4.4. Analysis of Influencing Factors of Battery Cell CF
This study employs a stepwise regression approach for variable selection. The rationale for this choice is twofold: first, to efficiently identify the core set of variables that have explanatory power for the battery CF from a broader pool of potential variables; second, to prevent interference from irrelevant variables, thereby ensuring a more parsimonious and robust model. The criterion for a variable to enter the model was a
p-value of < 0.10, and the criterion for its removal was a of
p-value > 0.15. By systematically adding independent variables, including cathode type, cell energy density, and regional electricity carbon intensity, an optimal model demonstrating goodness of fit was achieved. STATA 17 software has been employed to perform regression analysis on the Chinese EV battery cell carbon footprint influencing factor analysis model. The results are detailed in
Table 2.
As illustrated in
Table 2, the incremental addition of independent variables to the model results in an increase in the goodness of fit from 0.87 to 0.95. This improvement indicates a significant enhancement in the model’s capacity to explain the factors influencing the cell CF. The overall model successfully passes the F-test, thereby rejecting the null hypothesis that posits the independent variables included have no effect on the CF [
41]. Furthermore, the regression coefficients associated with the independent variables are statistically significant, confirming that all three independent variables, including cathode type, cell energy density, and regional electricity carbon intensity, are indeed influential factors regarding the cell CF.
The results of the multicollinearity test for the respective variables and the heteroscedasticity test for the model are presented in
Table S1 and Table S2, respectively. These results indicate that the model does not exhibit serious multicollinearity or heteroscedasticity issues, and the residuals of the model are in accordance with a normal distribution, underscoring the robustness and reliability of the model outcomes. In conclusion, these results support the use of cathode type, energy density, and energy intensity as influencing factors in the regression analysis of the cell CF. The robustness test results are detailed in
Supplementary Tables S3 and S4. In
Table S3, alternative fixed effects specifications and standard error clustering methods yield nearly identical coefficients for the core explanatory variables. In
Table S4, additional tests, including winsorization, log transformation, and exclusion of the dominant firm, confirm the main findings. The results consistently support the robustness of the baseline conclusions.
According to
Table 2, the coefficient of the cathode type is 21.92, which is significant at the 1% level. This result indicates that the NCM cell CF is 21.92 kg CO
2-eq/kWh higher than that of LFP cells on average. This finding demonstrates that the cathode type significantly impacts the battery cell CF; this effect is primarily linked to the sourcing of cathode materials and the respective manufacturing processes involved. LFP batteries predominantly utilize materials such as iron, phosphorus, and lithium [
42], which exhibit relatively straightforward extraction and processing methods associated with low carbon emissions. Furthermore, the manufacturing processes for LFP battery cathodes are well-established [
43], leading to high production efficiency. Conversely, NCM cathode materials generally comprise nickel, cobalt, and manganese. The extraction and processing of these metals necessitate high energy inputs, particularly due to energy-intensive procedures such as high-temperature sintering [
44], resulting in elevated energy consumption during production [
36]. The average life-cycle carbon emissions of LFP cathodes and NCM cathodes in China are approximately 9.8 t CO
2/t and 24.8 t CO
2/t, respectively [
45]. Because the carbon footprint of LFP cathode material is lower than that of NCM cathode materials, the LFP cell CF is lower than that of NCM cells.
The coefficient for energy density is −0.16, which is significant at the 1% level. For every 1 Wh/kg increase in battery cell energy density, the battery cell CF decreases by 160 g CO
2-eq/kWh. This indicates that battery cell energy density exerts a substantial influence on the CF. Existing research supports that increases in energy density are advantageous for mitigating the battery CF [
18]. A higher energy density allows for greater energy storage within the same mass, thereby reducing the amount of material required per kWh of battery cell capacity [
22]. Given that the material acquisition stage contributes the most to the overall battery cell CF [
20], decreasing the material mass per kWh can effectively lead to a reduction in CFs.
The coefficient for energy intensity is 6.38, which is significant at the 5% level. This finding indicates that for every 1 kg CO
2-eq/kWh increase in regional energy carbon intensity, the battery cell CF increases by 6.38 kg CO
2-eq/kWh. As detailed in
Section 4.3, the contribution of energy input to the cell CF ranges between 14% and 33%. These results underscore that energy input during the production process is a significant contributor to the CF of the battery cell. These conclusions are consistent with relevant studies in Europe and North America [
24,
25,
26]. Consequently, reducing region energy carbon intensity could substantially lower the CF of the battery cell.
5. Conclusions and Policy Recommendations
This study systematically analyses the full-life-cycle carbon footprint of power batteries for electric vehicles in China. By constructing the Chinese EV battery cell carbon footprint influencing factor analysis model and integrating it with the EverBatt model, quantitative assessments are carried out on 100 mainstream battery cell models, which account for more than 50% of the market share. The research reveals the key impact mechanisms of material systems, energy density, and regional energy carbon intensity on carbon footprint. The innovation of this study lies in its first-time analysis, based on real-world data, of the differential contribution characteristics of LFP and NCM batteries: The weighted average carbon footprint of LFP batteries is 49.42 kg CO2-eq/kWh, significantly lower than that of the NCM series (65.16/64.86/63.08 kg CO2-eq/kWh for NCM523/622/811, respectively). Among them, cathode materials are the most significant influencing factor, contributing 48% to the carbon footprint of LFP batteries and 62% to NCM batteries. Regression analysis further shows that for every 1 Wh/kg increase in battery energy density, the carbon footprint decreases by 160 g CO2-eq/kWh; for every 1 kg CO2-eq/kWh increase in regional electricity carbon intensity, the battery carbon footprint increases by 6.38 kg CO2-eq/kWh accordingly. These findings provide methodological support for the refined calculation of the carbon footprint of power batteries and reveal the key paths for the low-carbon transformation of the battery industry from the dimensions of material selection, energy efficiency, and production location.
This study proposes three strategic policy recommendations to advance low-carbon battery production. First, prioritize technological innovation and material system optimization by incentivizing R&D in high-energy-density technologies (e.g., solid-state batteries) through tax credits and subsidies, while capitalizing on the inherent low-carbon advantages of LFP batteries in raw material sourcing and manufacturing to accelerate their adoption and reduce per-unit carbon footprints. Second, enhance regional energy transitions by establishing cross-provincial carbon trading markets and green power quota systems, with targeted efforts to decarbonize electricity grids in high-emission provinces. When considering geographical adjustments for energy-intensive production, a comprehensive assessment that factors in supply chain clustering and logistical efficiency is essential to ensure net carbon reductions. Additionally, relocate energy-intensive NCM battery production to hydropower-rich southwestern regions to mitigate indirect manufacturing emissions. Third, develop a standardized carbon footprint classification framework for power batteries, led by government initiatives to implement transparent carbon labeling aligned with battery types. Such a system would foster industry-wide material and process innovation, offering actionable insights for manufacturers’ technological upgrades, consumer decision-making, and regulatory oversight. These recommendations provide critical pathways for establishing China’s low-carbon EV standards and strengthening its global competitiveness in sustainable mobility.
This study has the following main limitations: First, the “cradle-to-gate” system boundary excludes the use and end-of-life phases, which may underestimate the decarbonization potential achievable through material recycling, particularly for NCM batteries. Second, the influence of cell formats (e.g., prismatic, cylindrical, pouch) on production processes was not differentiated, potentially introducing uncertainty in the assessment of manufacturing-phase carbon footprint. Third, the exclusion of energy-intensive auxiliary materials like NMP, based on the 1% mass cut-off rule, could result in a minor underestimation of the carbon footprint for NCM batteries. Fourth, the application of uniform emission factors for key metals such as lithium and nickel does not reflect variations associated with different resource sources, which may affect the precise evaluation of the environmental performance of specific supply chains. A recent study covering major production routes in China reports that the carbon footprint of battery-grade lithium carbonate can vary widely, from 6.3 to 36.8 t CO
2e/t Li
2CO
3, depending on the source (e.g., brine, spodumene, or lepidolite) [
46,
47]. This highlights the significant range of potential impacts that different supply chains can entail. Future research will refine the analytical framework through three key improvements: establishing a full life cycle assessment model, systematically collecting cell process parameters and auxiliary material inventory data, and developing a geography- and technology-specific material database. By continuously enhancing both the model and its data foundation, this will advance power battery carbon footprint research toward greater comprehensiveness and precision.