Article

Tire Contact Pressure Distribution and Dynamic Analysis Under Rolling Conditions

College of Vehicle and Traffic Engineering, Henan University of Science and Technology, Luoyang 471003, China
*
Author to whom correspondence should be addressed.
World Electr. Veh. J. 2025, 16(9), 525; https://doi.org/10.3390/wevj16090525
Submission received: 1 August 2025 / Revised: 27 August 2025 / Accepted: 3 September 2025 / Published: 16 September 2025
(This article belongs to the Section Vehicle Management)

Abstract

Tire contact imprint characteristics and pressure distribution directly affect their lateral mechanical characteristics under rolling conditions, which are the key influencing factors for vehicle handling stability. Based on the nonlinear finite element method, an explicit dynamic model of radial tires is established using Abaqus, and its contact process is simulated through phased load transfer and kinematic inversion. The modified mathematical model of contact pressure distribution is introduced from the geometric evolution law of contact imprint and the nonlinear characteristics of contact pressure distribution. The corrected lateral force and aligning torque and contact imprint behavior are analyzed. The results show that in the low roll-angle range, with the increase in the roll angle, the contact imprint shrinks asymmetrically, the pressure center shifts to the outer shoulder of the roll direction, and the lateral force and aligning torque show linear growth characteristics. At the critical value ±8°, the growth rate is significantly slowed down due to the stress saturation effect of the shoulder area. The research analyzes the evolution mechanism of the lateral mechanical characteristics of the contact imprint geometry and pressure distribution drive tires under roll conditions, providing theoretical support for vehicle handling stability optimization and tire structure design.

1. Introduction

The study of the mechanical properties of tires under rolling conditions is key to revealing the nature of vehicle lateral dynamic stability [1,2]. The asymmetric deformation of the contact imprint caused by the roll angle and the dynamic migration of the pressure distribution [3] directly determine the nonlinear generation mechanism of the roll force and the aligning torque. This asymmetric contact imprint and its accompanying pressure distribution offset are essentially a direct representation of the mechanical behavior of the carcass–pavement coupling system [4,5]. Therefore, modeling lateral force and aligning torque based on tire contact pressure distribution under rolling conditions allows for a more accurate characterization of mechanical performance within the contact patch. This approach is essential for improving lateral stability and provides a key theoretical foundation for optimizing tire structural design.
The contact characteristics and mechanical behavior of tires under rolling conditions have been extensively studied [6,7,8]. Regarding contact pressure distribution, research on semi-steel radial tires [9,10] indicates that the contact patch width changes significantly under low loads, while the overall offset of pressure distribution is reduced under high loads. However, the influence of roll angle on pressure distribution remains insufficiently explored. Zang L G et al. [11] incorporated the nonlinear and large-deformation behavior of rubber materials [12], demonstrating that as the roll angle increases, the maximum contact stress rises and the stress at the tread center becomes notably non-uniform.
In terms of mechanical properties, Romano L et al. [13] introduced three improved brush models for rectangular contact areas based on similarity principles [14]. Their results suggest that lateral stiffness primarily governs changes in lateral force, while the peak factor determines aligning torque variations. Nevertheless, the interaction between roll angle and vertical load under severe conditions such as high loads and large roll angles was not adequately considered. Yin H F et al. [15] simulated lateral roll bias using a developed implicit solver and observed that under high loads, the peak crossover in the lateral force curve underscores strongly nonlinear mechanical behavior. Despite these advances, there remains a lack of in-depth mechanistic analysis and precise quantification of how specific contact features—such as pressure distribution morphology and gradient changes—directly affect key mechanical properties, including lateral force and aligning torque.
In light of existing research limitations, this study develops an explicit nonlinear finite element model to investigate the mechanical response of tires under rolling conditions based on contact characteristics. By correlating contact pressure distribution with patch morphology and incorporating pressure gradient features, we model lateral force and aligning torque to establish a functional relationship between pressure distribution and key mechanical responses. Furthermore, a three-dimensional response surface of aligning torque with respect to characteristic pressure distribution parameters and vertical load is constructed. The analysis of variation patterns provides critical insights into the correlation between tire contact behavior and mechanical properties under rolling conditions.

2. Materials and Methods

2.1. Establishment of the Finite Element Model

The 205/55R16 radial tire is widely used on the market due to its high compatibility and cost-effectiveness. Based on its actual cross-sectional dimensions, a solid model including main crown grooves and sidewall profiles was constructed in CAD software. The simplified tire cross-section was discretized using HyperMesh to create a fully quadrilateral-dominant mesh. The circumferential direction was uniformly divided into 140 segments, and the two-dimensional sectional mesh was rotated around a specified axis to generate a three-dimensional finite element model of the tire (as shown in Figure 1). The element type was set as C3D8R (8-node linear brick elements with reduced integration), resulting in a total of 54,340 elements. The structured mesh exhibited high quality, with a Jacobian ratio above 0.7, warpage less than 4°, and an aspect ratio below 1.8. Convergence was ensured with relative errors of both the Residual Norm and the Energy Norm strictly controlled within 1 × 10⁻⁶, meeting the requirements for high-precision solutions.
Since the rubber material exhibits strong material nonlinearity, geometric nonlinearity and contact nonlinearity, the tire volume does not change during compression, and the Yeoh constitutive model can well describe the superelastic mechanical proper-ties of rubber [16], so the Yeoh constitutive model is use. The Yeoh constitutive model is used. The Yeoh equation can be expressed as follows:
U = C 10 I 1 3 C 20 I 1 3 2 C 30 I 1 3 3
In Equation (1), U is the strain energy per unit of reference volume; C 10 is the initial shear modulus of the rubber material; C 20 is the softening parameter modulus of the rubber material; C 30 is the hardening parameter modulus; and I 1 is the strain first invariant.
This study is primarily aimed at identifying fundamental mechanical trends while avoiding the introduction of confounding variables resulting from road surface effects. Therefore, a rigid–flexible contact approach was selected to simulate the interaction between the ground and the tire. The penalty method and hard contact with Coulomb friction were applied in the normal and tangential directions, respectively. A friction coefficient of 0.85 was adopted, consistent with international standards (SAE J267, ISO 8349) for dry asphalt. To avoid non-convergence due to excessive contact stiffness, the road was fully fixed while the tire was displaced downward by 5 mm during loading.
To simulate the tire’s accelerated rolling process, an explicit dynamic analysis incorporating phased load transfer and kinematic inversion was adopted as follows. Step 1. Infiltration: Apply 0.25 MPa uniform tire pressure in the inner cavity of the rim, and use axisymmetric boundary conditions to constrain the circumferential displacement. The tire expands to a free state through static solution. The radius increment of the tire after inflatable is ΔR ≈ 2.2%. Step 2. Inflatable pressure: Press the tire vertically to the rigid road surface, apply a 4000 N vertical load, and constrain all degrees of freedom at the reference point of the rim except the vertical displacement. Step 3. Acceleration: Fix all degrees of freedom of the rim, and accelerate the driving road surface uniformly at 0 m/s to 16.7 m/s within 0.2 s. Step 4. Inflatable speed: Keep the road surface speed constant for 16.7 m/s, while the duration is 0.5 s, to extract steady-state rolling data, and set energy output monitoring to verify quasi-static conditions. A flowchart of the analysis steps is shown in Figure 2.

2.2. Validation of Finite Element Models

To validate the tire finite element model and ensure simulation accuracy, experimental tests were conducted following the GB/T 23663–2009 standard. A GT-LT-5000 comprehensive tire strength testing machine was used for this purpose. The tire was mounted on a standard rim and inflated to the rated pressure of 0.25 MPa. It was then stabilized under constant-temperature conditions before testing.
The tire was installed on the testing machine and subjected to a rated load of 4000 N. The force–displacement curve was automatically recorded during the test. Based on the recorded data, the necessary performance parameters were calculated.
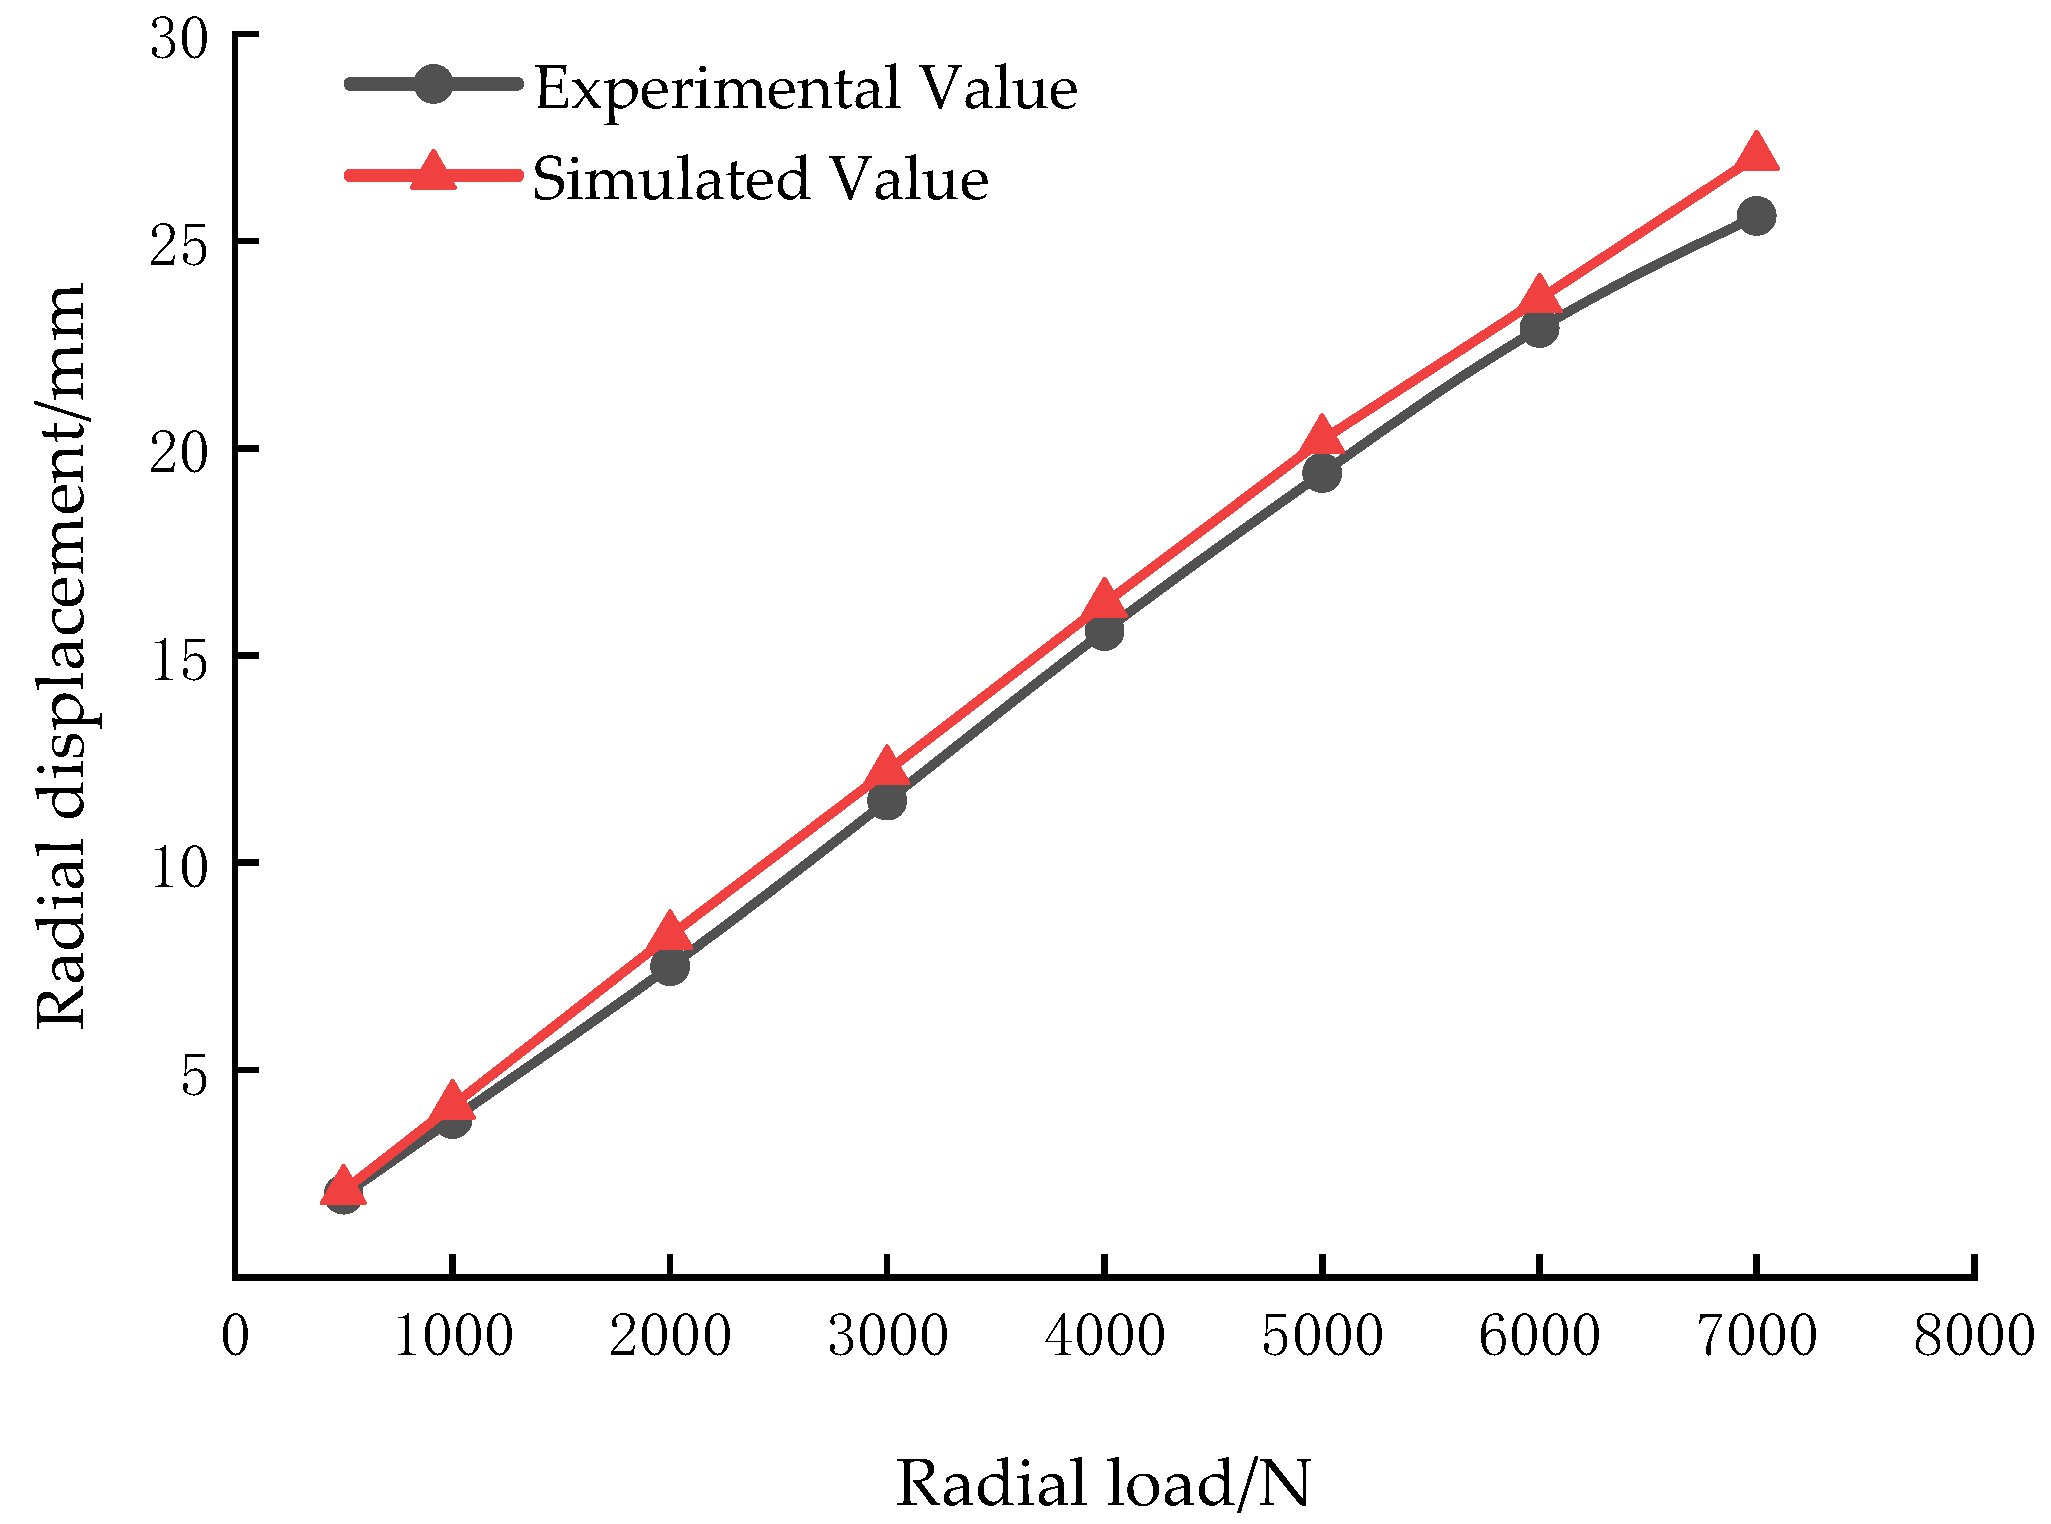
The same test parameters were used in Abaqus software to simulate the contact blot (as shown in Table 1), and the tire radial stiffness simulation results (as shown in Figure 3) were as follows.
The comparative analysis of experimental results [17] and simulation values showed that the maximum simulation relative error of the length and width of the contact imprint was 4.51%; the simulation curve of tire displacement under different radial loads was basically consistent with the experimental data; and the change trend was consistent.
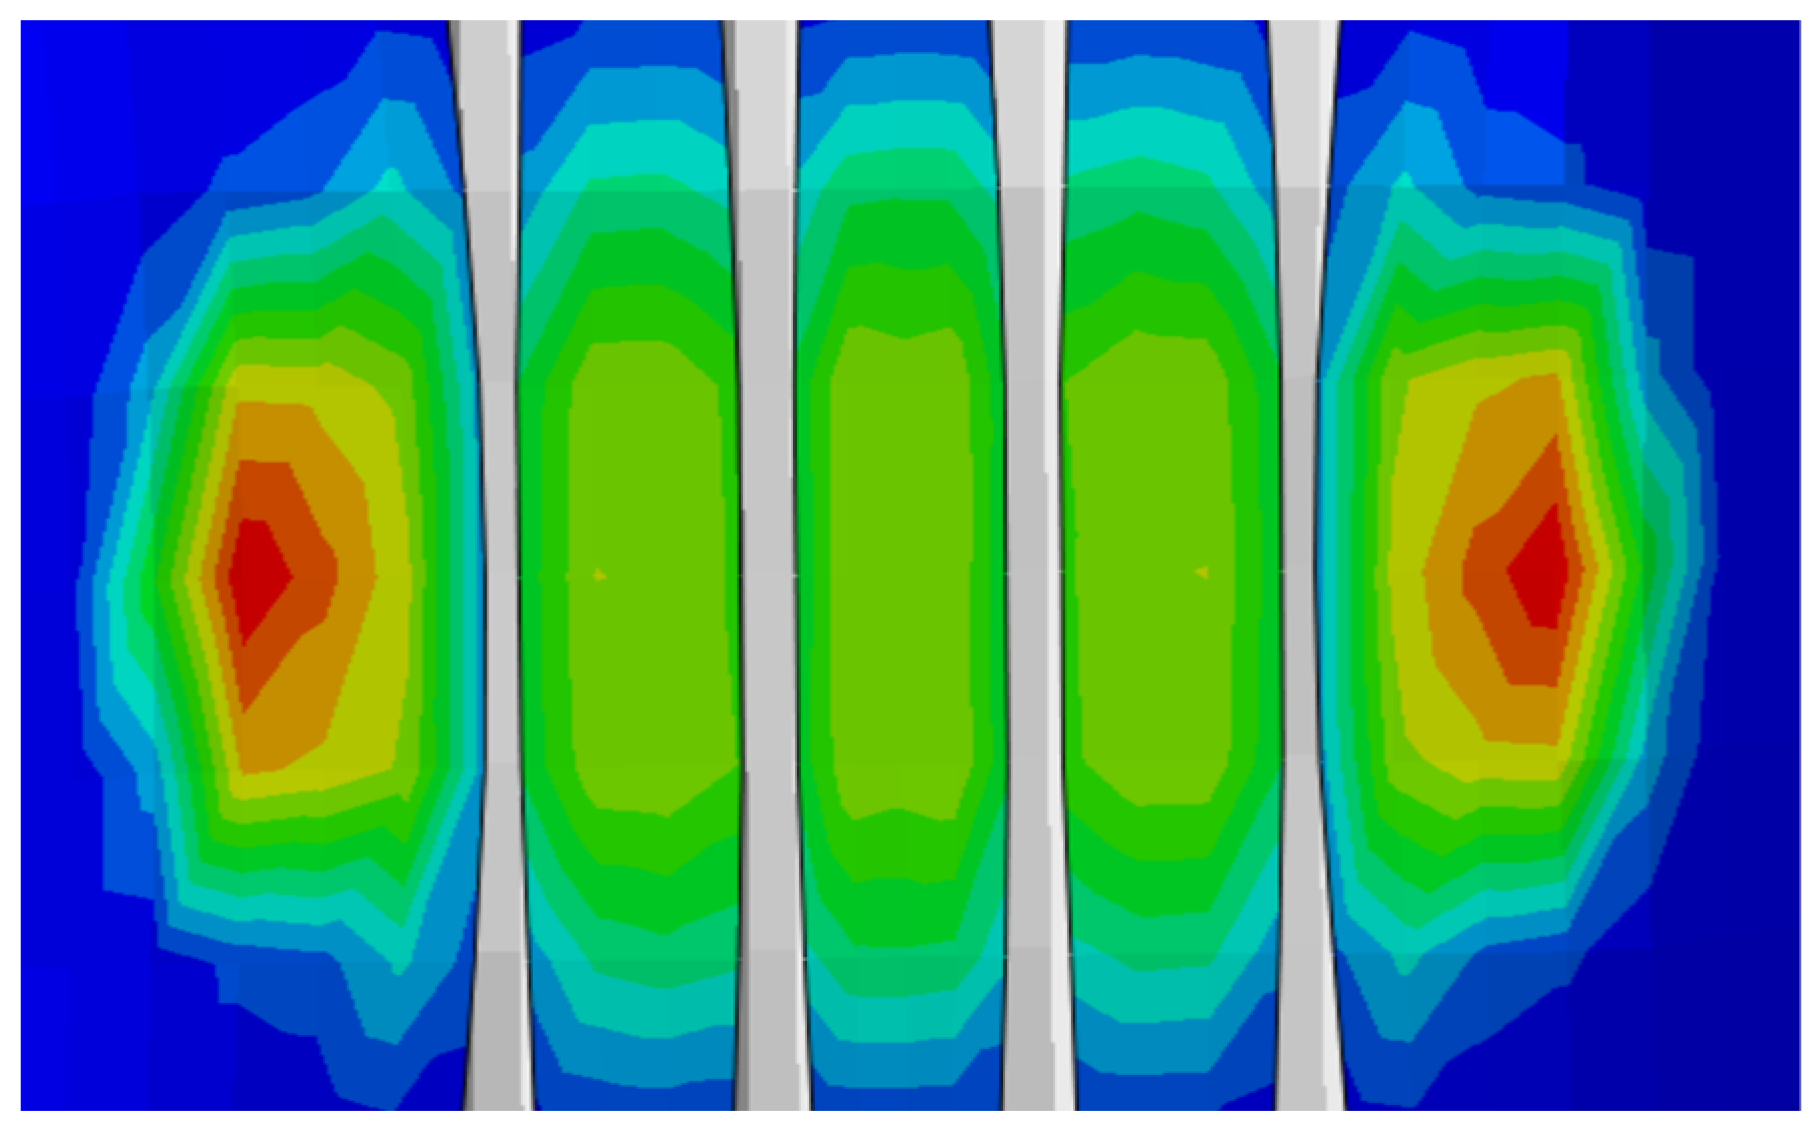
The contact patch of the tire under steady-state rolling conditions is analyzed (as shown in Figure 4). Higher stress concentrations are observed in the shoulder and crown regions, and the contact patch exhibits a symmetrical distribution, which is consistent with actual experimental observations [18].
Based on the above results, the established finite element model has a high simulation accuracy for the 205/55 R16 radial tire, which meets the requirements for engineering simulation analysis.

3. Results

The roll angle is the rotation angle of the tire about its forward direction axis during movement. It is an important parameter for measuring the stability and handling of the vehicle [19,20]. For contact characteristics, it mainly affects the distribution of contact imprints and the magnitude of contact reaction forces.
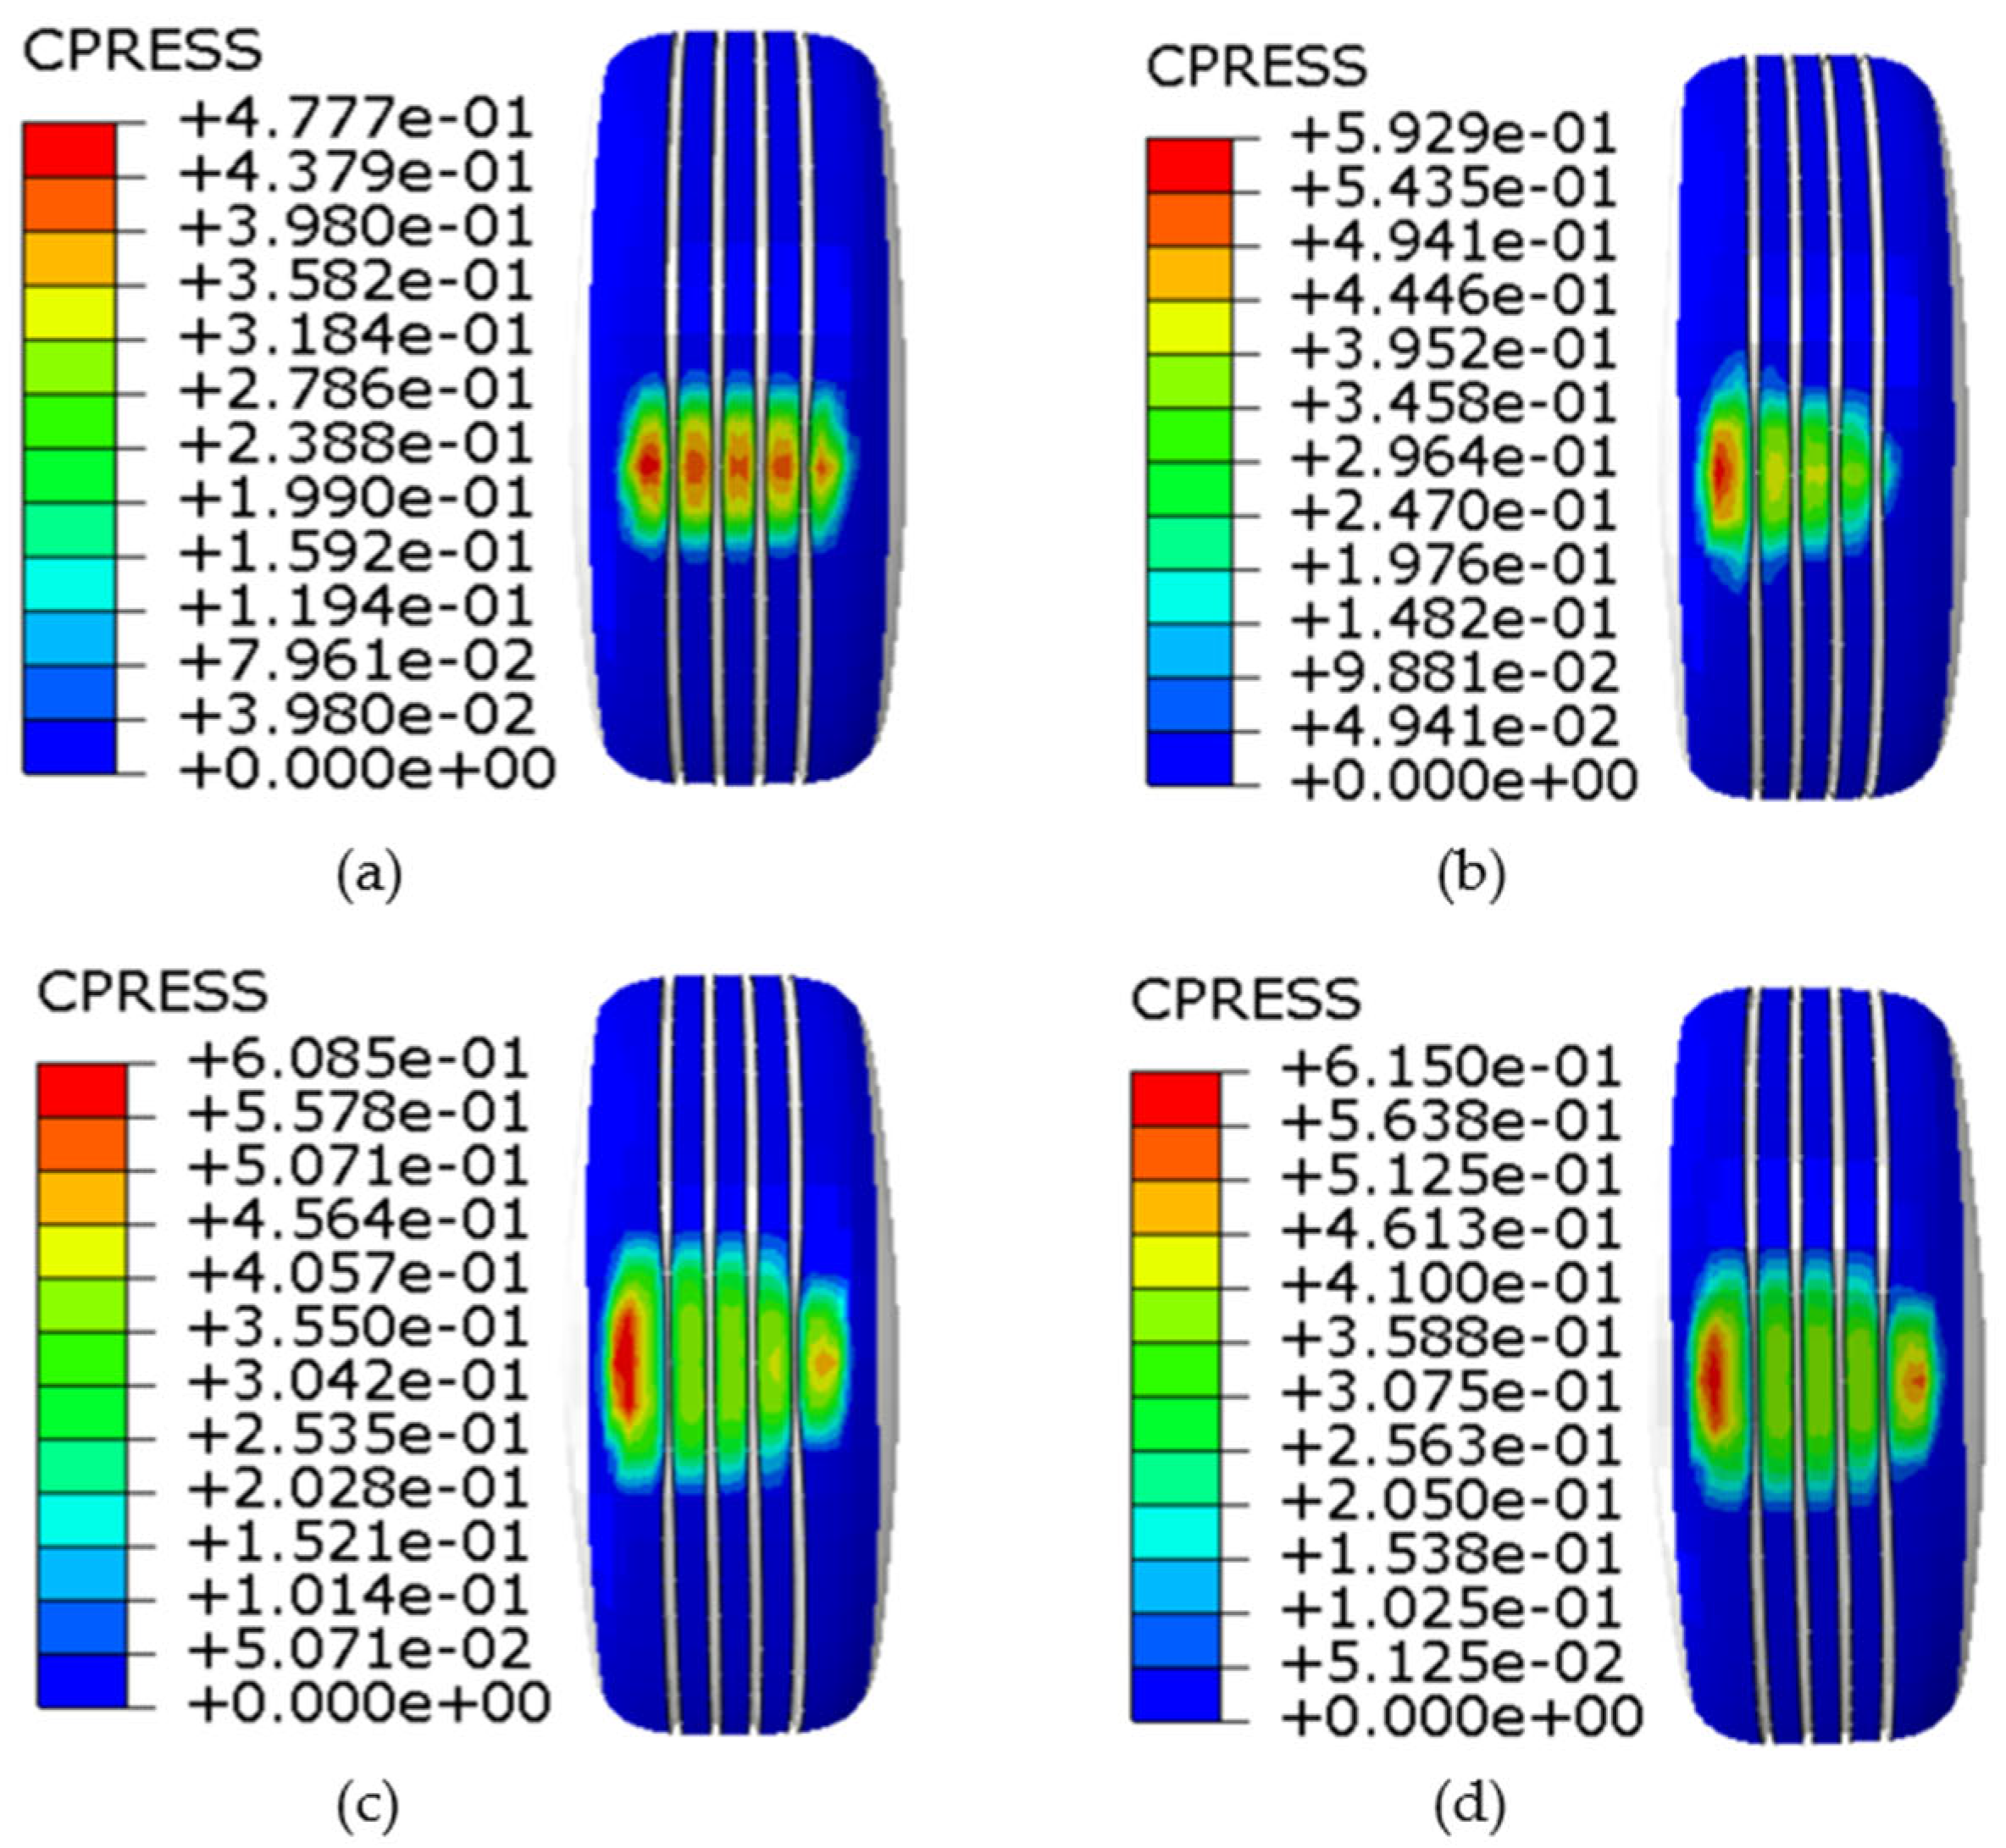
Figure 5 is a cloud diagram of contact imprints and contact reaction force and roll angle changes under tire roll conditions (the inflating pressure is 0.25 Mpa; the vertical load is 4000 N). As can be seen from Figure 4, as the roll angle continues to increase, the contact pattern between the tire and the contact changes significantly. The geometry of its contact area gradually evolves from the initial approximately rectangular distribution to the trapezoid. This change in geometric form originates from the intensification of the asymmetry of the contact area in the tilt direction; the contact reaction force distribution in the contact area also significantly shifts toward the side of the tilt of the vehicle body. It is worth noting that the distribution of contact reaction forces is no longer uniform, but shows a significant centralization trend in the edge area on one side of the tilt direction. This is because the contact area degenerates from the symmetrical support on both sides to the unilateral support, and the reaction force range is limited to the residual triangular area.
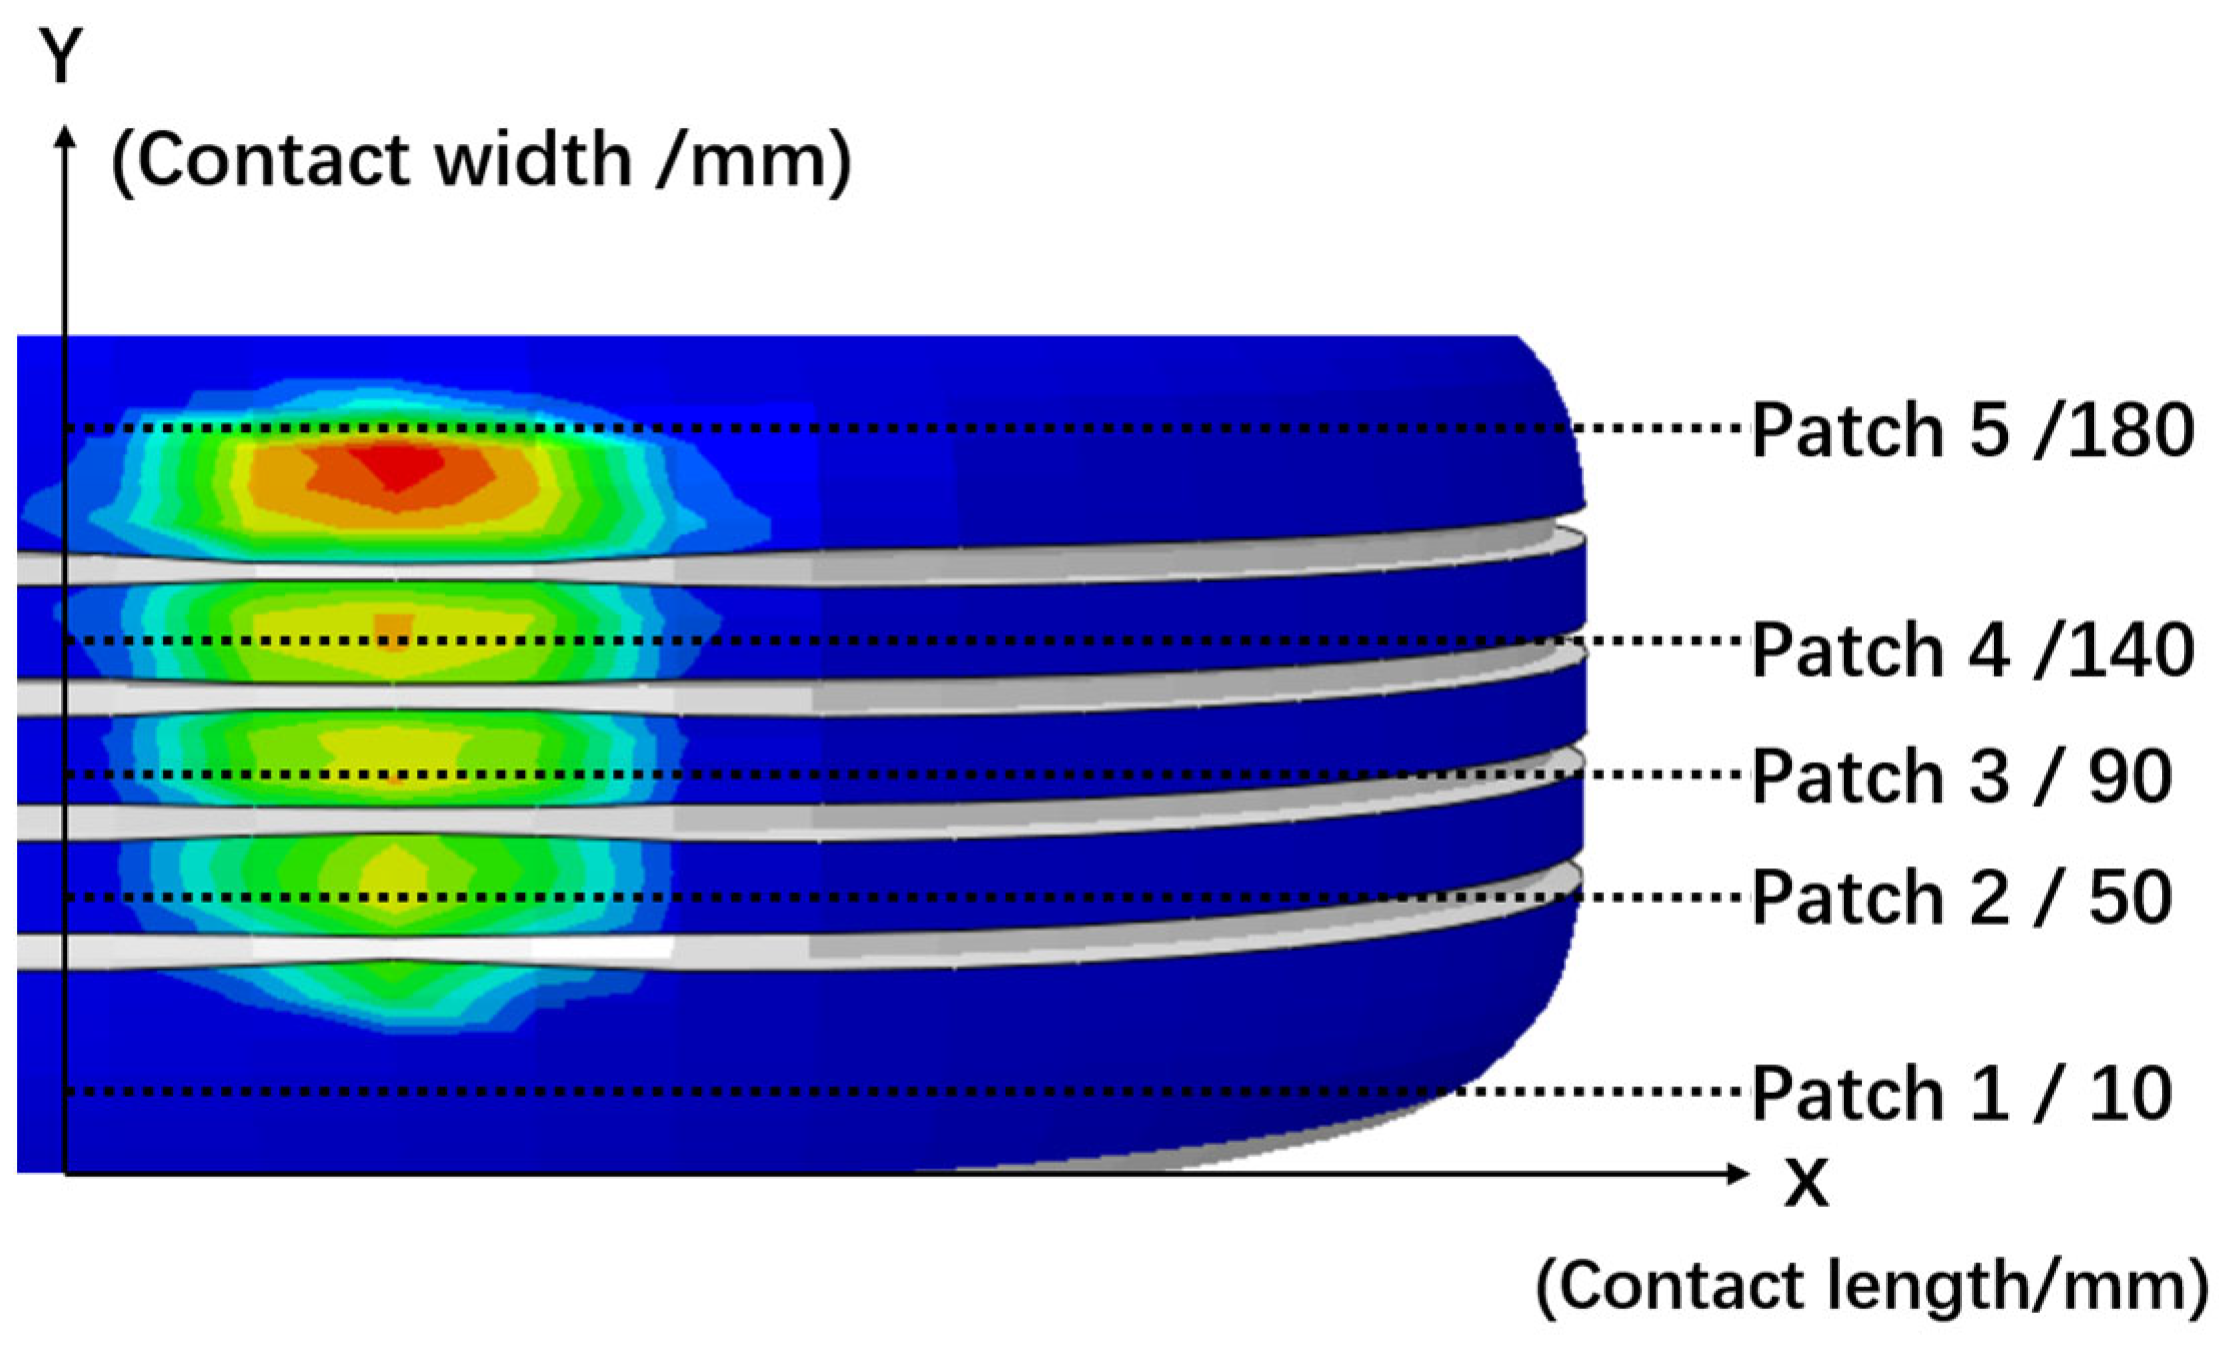
In order to facilitate further intuitive and in-depth analysis of the correlation of contact behavior in different areas of the tire, five measurement lines were set up along the tire transverse pattern, and the tire rolling direction was defined as the positive direction of the x-axis, while the left side of the rolling direction was the positive direction of the y-axis (as shown in Figure 6).
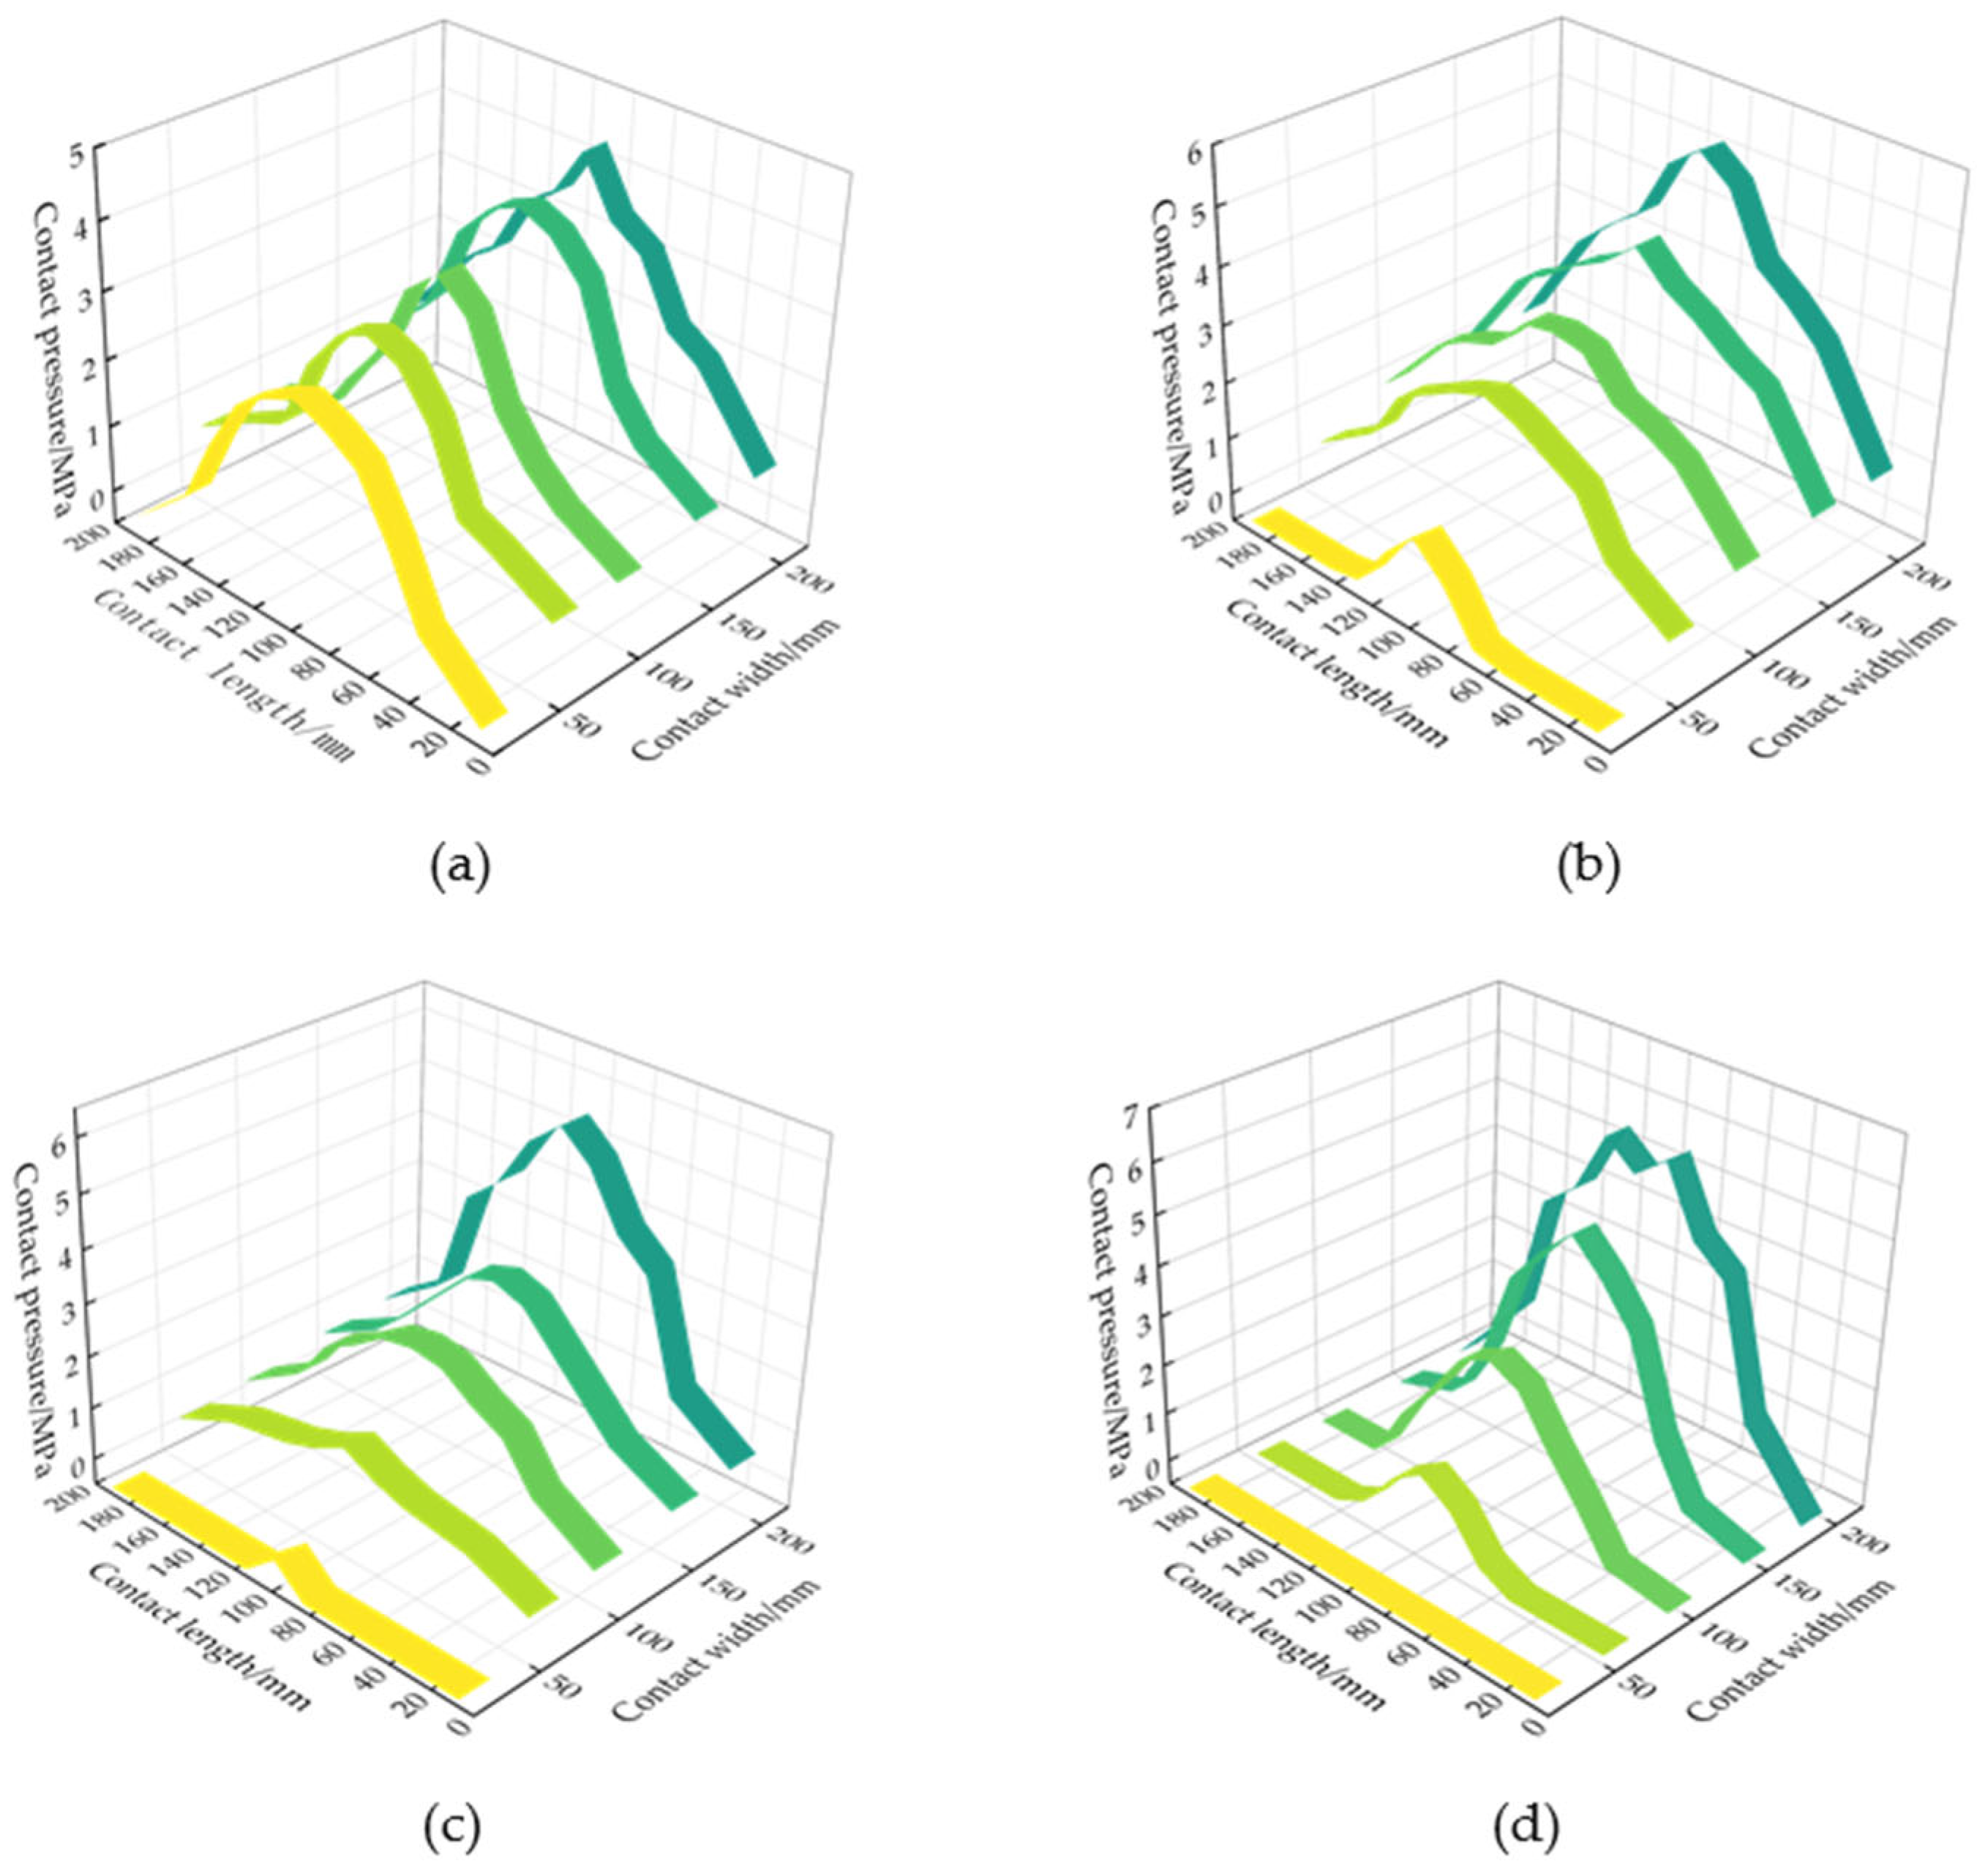
For the four roll angle conditions of 2°, 4°, 6°, and 8°, the contact reaction force and its corresponding contact position data were extracted, respectively. Based on this, a three-dimensional distribution of contact pressure versus position was plotted (Figure 7). Along the length direction, the contact reaction force shows a strictly symmetric distribution, with peaks consistently located at the geometric center of the contact patch. This symmetry arises from the axial uniformity of the tread pattern and the cord structure, resulting in a load distribution that is symmetric about the center under vertical loading. In the width direction, the contact reaction shifts outward toward the shoulder regions with increasing distance from the center, leading to a gradual asymmetry in pressure distribution and a noticeable stress concentration in the shoulder areas.
As the roll angle increases, the contact reaction force at the inner side decreases linearly and approaches zero at 8°, resulting in a loss of inner support function. Meanwhile, the reaction forces at the five outer contact points gradually increase. At a roll angle of 8°, a new bimodal distribution emerges, with peaks symmetrically aligned about the midpoint of the contact patch. This spatial redistribution results from the upward arching of the crown region during the transition of the contact imprint from a trapezoidal to a triangular shape. Load transfer toward both shoulders, combined with carcass deformation and moment rebalancing, leads to these complex alterations in contact reaction forces.
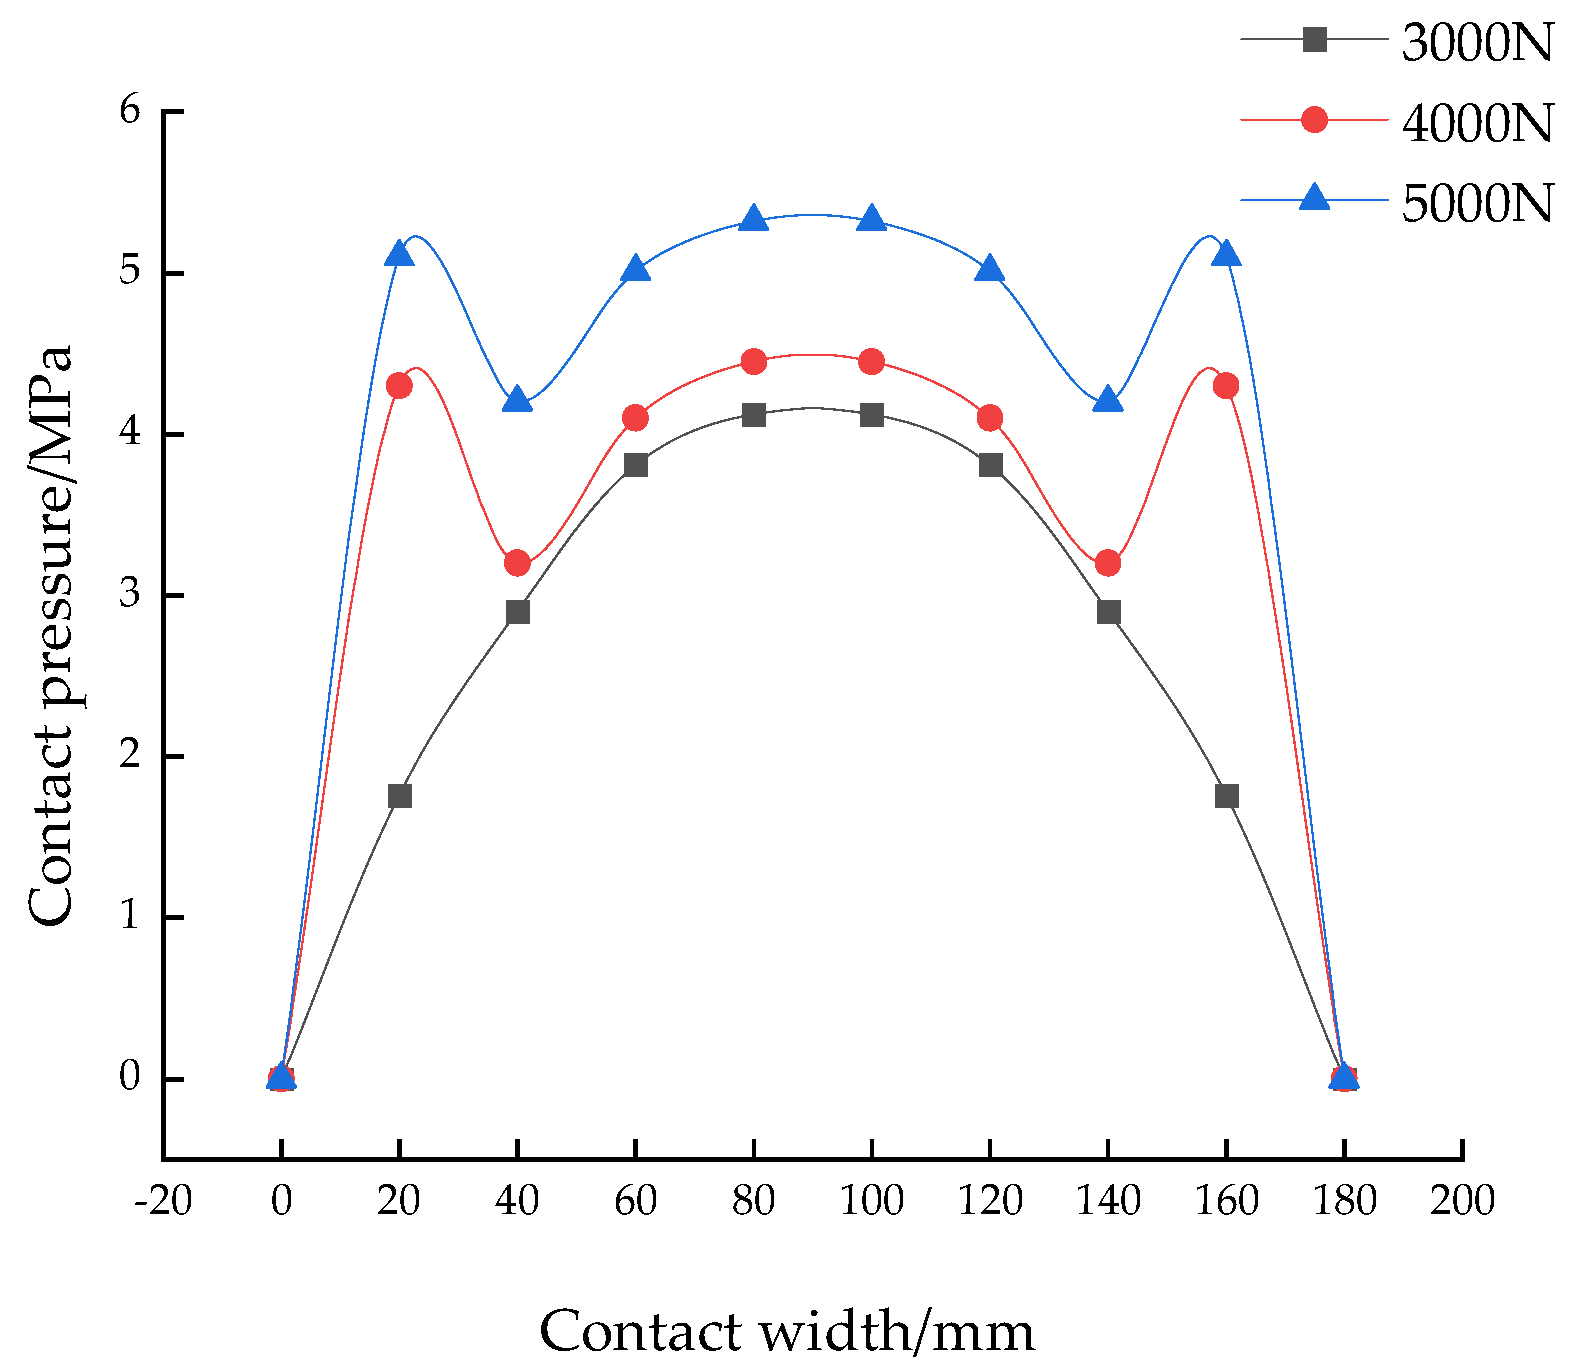
When the tire roll angle is zero (as shown in Figure 8), the pressure distribution in the contact imprint exhibits symmetrical characteristics, and the pressure in the central region and the bilateral shoulder region is concentrated, forming a significant local pressure peak, while in the transition zone between the crown and shoulder, the pressure is relatively low. With the increase in vertical load, the pressure concentration effect of the crown and shoulder zones is significantly weakened, and the raised bimodal features in the initial distribution gradually flatten. At this time, the contact pressure distribution shows a trend of homogenization, the peak pressure decays, the pressure gradient in the transition zone decreases, and the uniformity of the pressure distribution is improved.
Based on the rolling conditions of inflation pressure of 0.25 MPa and vertical load of 4000 N shown in Figure 9, as the roll angle increases, the tire contact pressure distribution shows a significant nonlinear evolution, and the pressure curve of the initial symmetric distribution degenerates into a strong skew peak in the rolling direction. The center of the pressure distribution is offset to the shoulder of the rolling side, and the peak pressure shows a super-linear increase. This is due to the redistribution of superimposed vertical loads, which induces dynamic shift and concentration of the contact pressure distribution.

4. Mechanical Response Under Rolling Conditions

4.1. Lateral Force

The lateral force is derived from the lateral shear deformation of the tread rubber. When the roll angle γ is present, the relative orientation of the tread unit within the contact mark changes, inducing lateral shear strain. From the concept of the friction circle, we can see that the maximum shear stress is limited by the product of vertical pressure and friction coefficient, and this shear deformation generates lateral force. Therefore, the lateral tilt force is the integral of the shear stress on the entire contact imprint:
F y = q y ( x , y ) d x d y
q y ( x , y ) = G ε y
ε y = κ γ γ y
In the above equation, q y is the shear stress, G is the tread rubber shear modulus, ε y is the transverse shear strain, κ γ is the strain lateral geometric coefficient, γ is the roll angle, and y is the longitudinal coordinate of the contact impression.
In the case of rolling with roll angle γ, the vertical pressure distribution in the tire contact mark exhibits non-uniform characteristics, and the pressure center of the pressure is shifted to the outside of the mark for the negative roll angle. The systematic asymmetry of this pressure distribution and its significant spatial gradient lead to the failure of traditional models based on the uniform pressure assumption. Therefore, the construction of a modified lateral force model must introduce a distribution function that accurately characterizes this asymmetric pressure field.
Based on the parabolic model [21], the baseline pressure distribution in the absence of lateral sway is satisfied:
p 0 ( x ) = 3 F z 2 L W 1 2 x L 2
In Equation (5), p 0 is the vertical pressure distribution without lateral sway, x is the lateral coordinate of the contact imprint, F z is the vertical load without lateral sway, L is the tire contact half-length, and W is the tire contact half-width. The presence of roll angle γ induces lateral offset of vertical loads in tire contact imprints, and the pressure distribution state characterized by the modified model at any point can be expressed as follows:
p z ( x , y ) = p 0 1 + k ξ y W 1 2 x L 2
In Equation (5), k ξ is the pressure-offset coupling coefficient, reflecting the impedance effect of carcass cord layer stiffness on the lateral migration of the load. In fact, the measured stiffness range is [0.75–0.85] [22]. At this point, the pressure center offset can be expressed as follows:
ξ = 1 F z y p z ( x , y ) d x d y
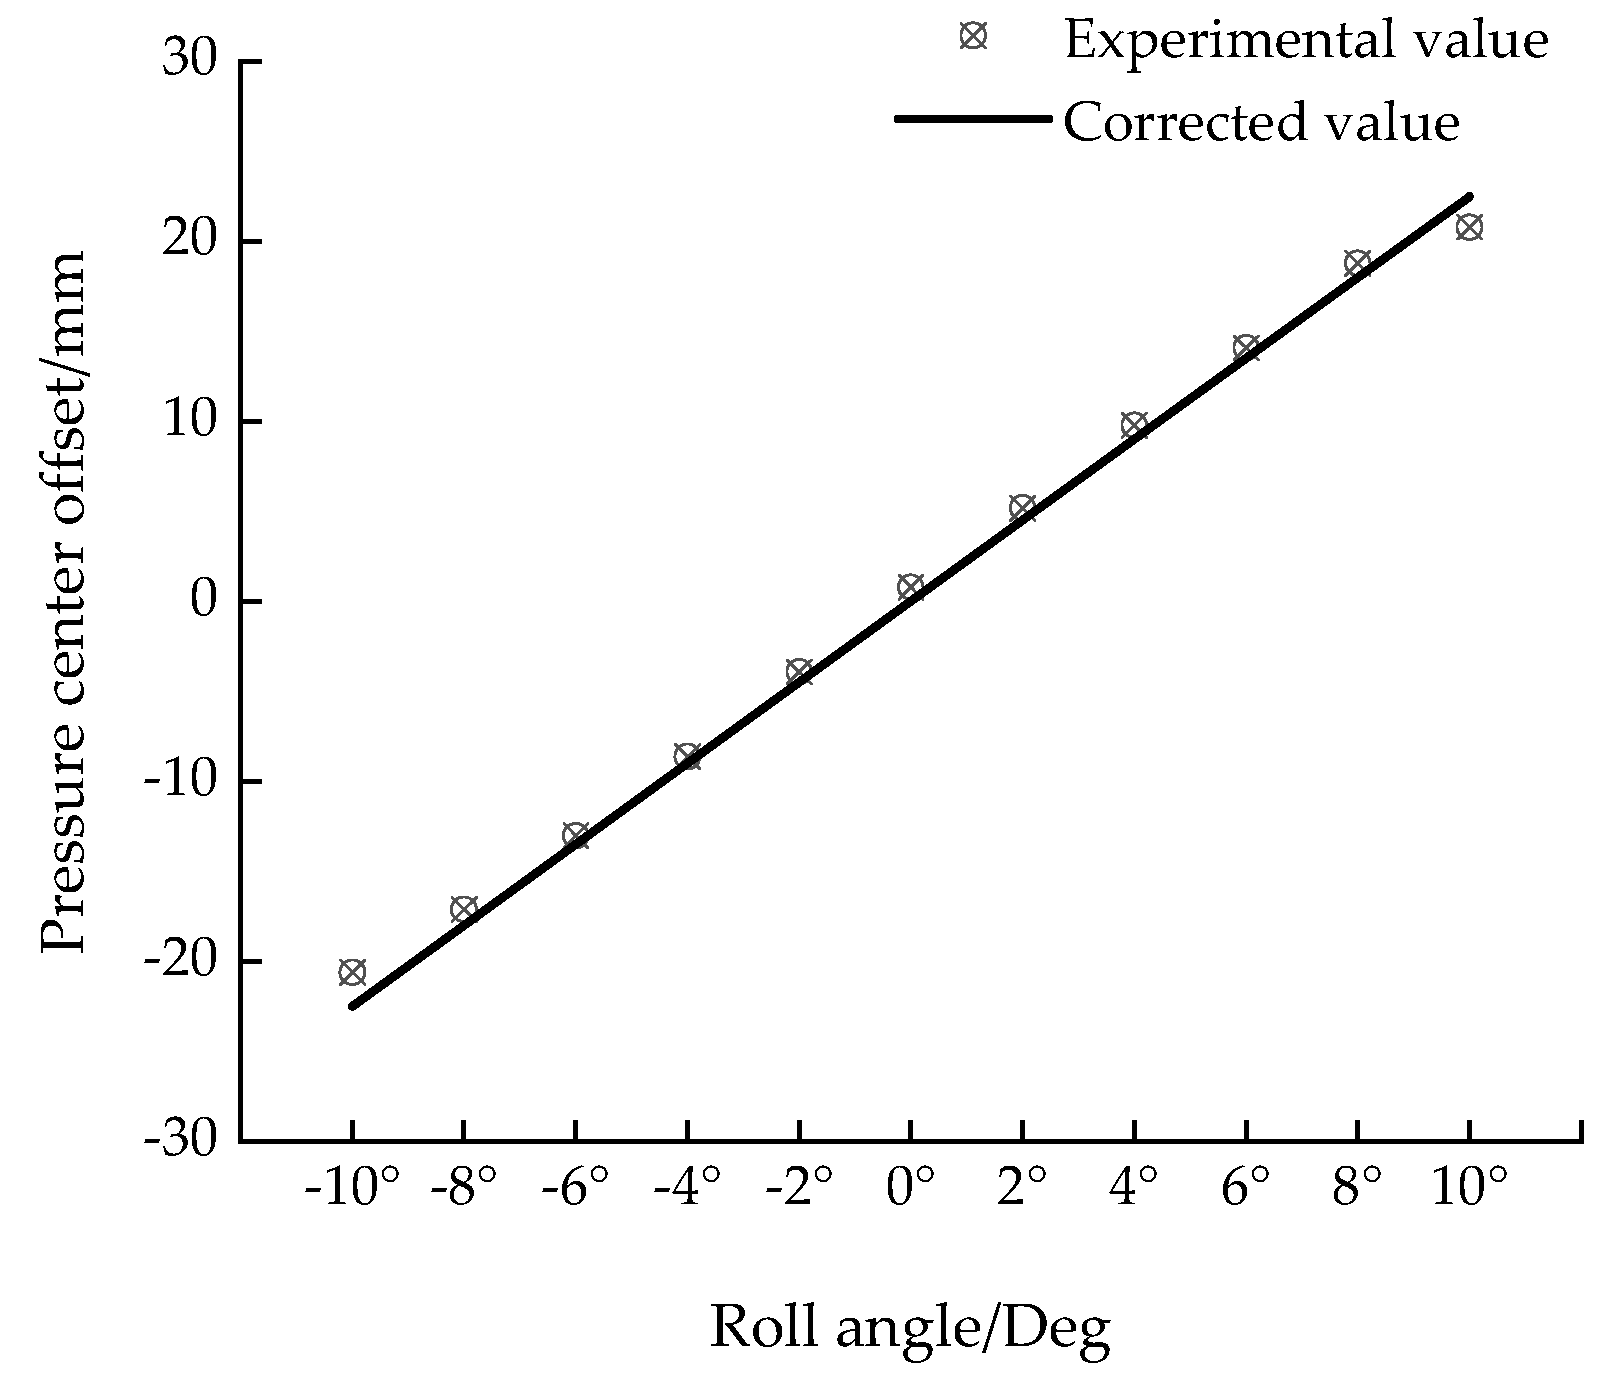
The corrected pressure center offset and the experimental value comparison of the finite element simulation are shown in Figure 10. The results show that the calculation results of the pressure center offset have good consistency with the experimental value in the low-roll-angle domain; but the growth slope of the experimental value is significantly reduced near the critical roll angle (about ±10°). This phenomenon originates from the pressure-offset coupling coefficient set in Equation (6) that remains constant and the pressure center offset is not constrained by the boundary effect. When the roll angle exceeds the critical range, the correction model fails because the contact blotting saturation effect is not considered, resulting in a significant deviation in the evolution rate of the calculated value from the experimental value.
The corrected lateral force is
F y γ = μ γ y R y p z ( x , y ) d x d y
R y = R + y sin ( γ )
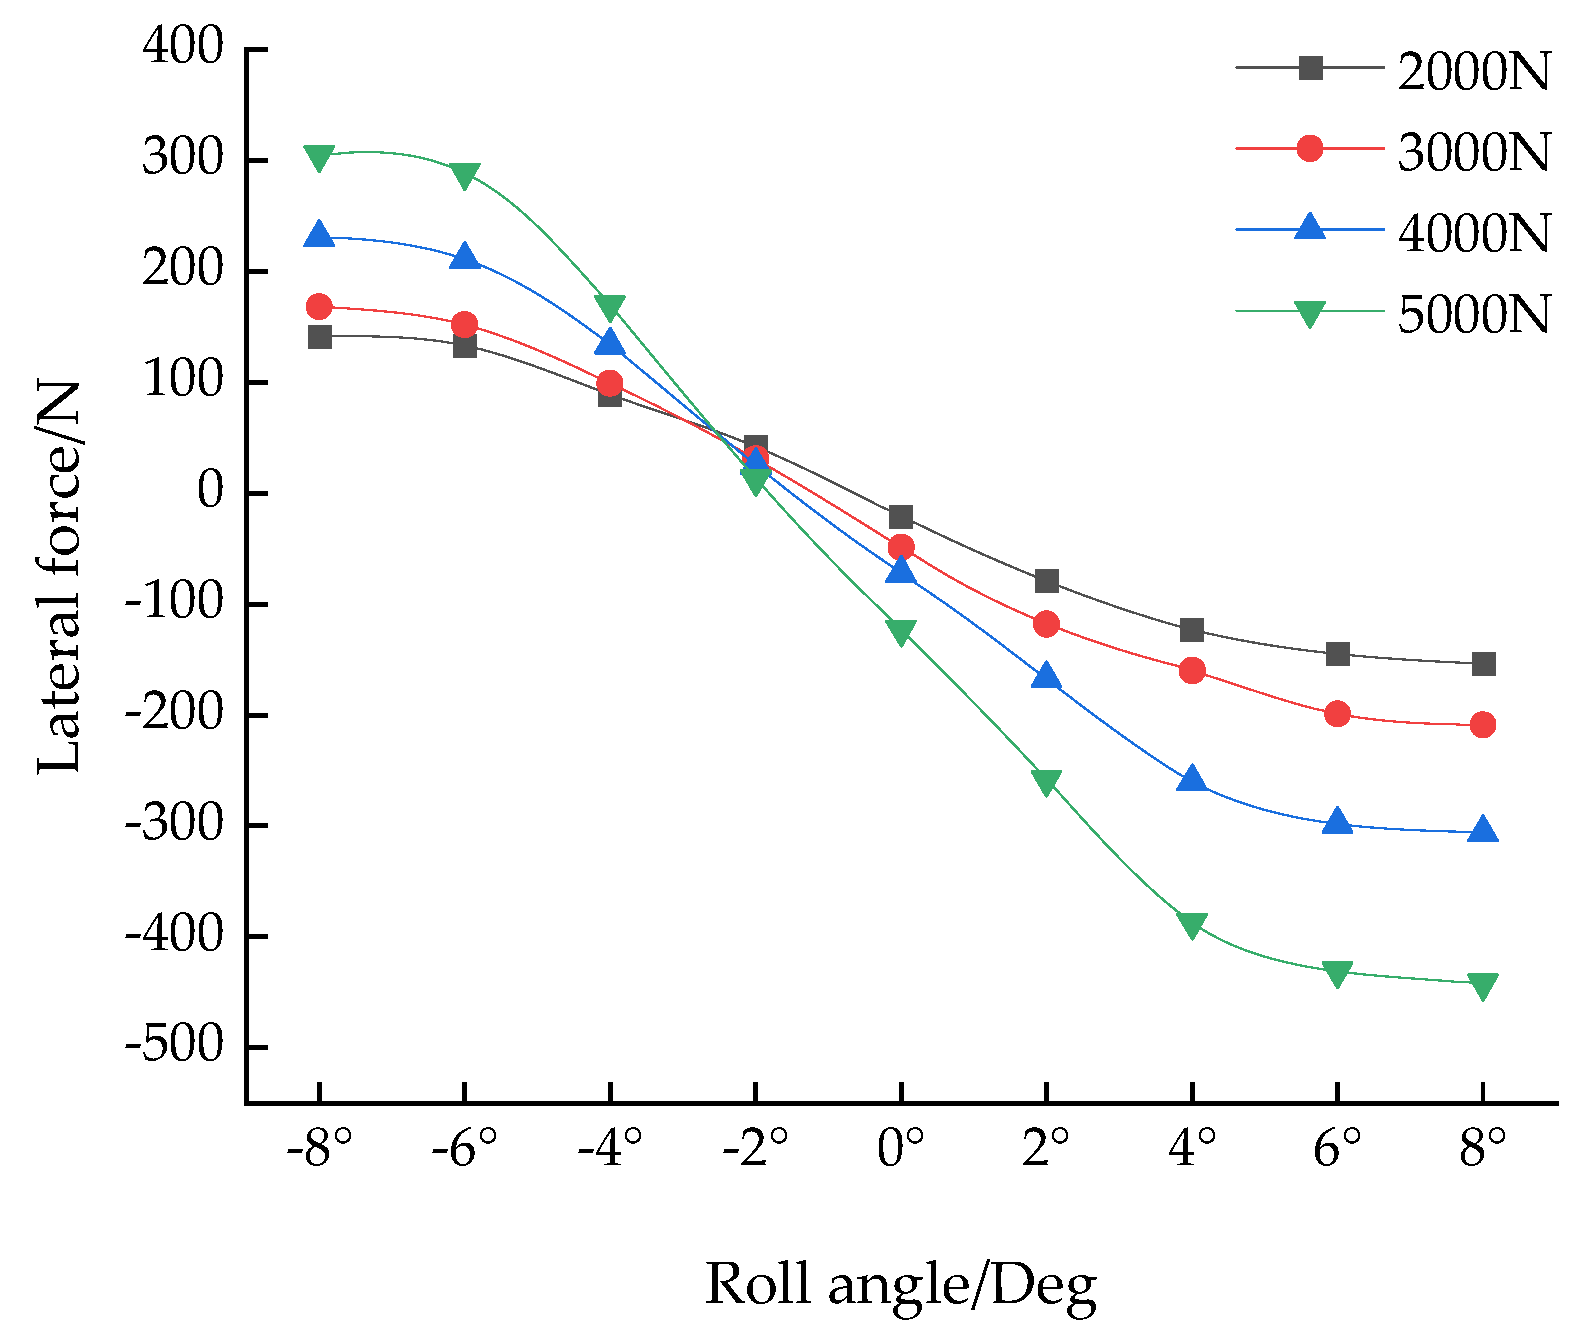
In Equation (8), μ γ is the roll friction coefficient, indicating the friction strength attenuation characteristics of the tire–pavement interface, and R y is the effective radius of the tire. For the rolling condition with the inflation pressure set to 0.25 MPa, the tire lateral force and rolling angle change can be obtained from Formula (8), and the relationship curve between the lateral force and rolling angle is drawn, as shown in Figure 11.
According to the experimental results, an increase in vertical load leads to a significant enhancement of the roll-induced lateral force at the same roll angle. Furthermore, the sensitivity of the lateral force to the roll angle rises with a greater vertical load, indicating that vertical load amplifies the roll effect. In the low-load range, the lateral force increases nearly linearly with the roll angle. However, under high-load conditions, the growth curve gradually exhibits a saturation trend, particularly at larger roll angles where the rate of increase levels off. This saturation behavior is primarily attributed to the saturation of the pressure center offset resulting from asymmetric pressure distribution. Furthermore, the friction limit serves as a physical constraint that restricts the maximum achievable lateral force. These findings reveal the nonlinear coupling relationship between the contact pressure distribution and the tread deformation behavior in tires.

4.2. Aligning Torque

The roll angle creates a non-uniform pressure distribution within the tire contact blot, causing lateral twisting and deformation of the tread rubber, thus generating lateral force that is directed toward the slant bottom. It is worth noting that, since the distribution of pressure on the contact blot is not uniform in the direction of the tire rolling and the maximum pressure region is usually biased towards the rear of the blot, the point of action of these lateral friction forces on the contact blot is not located at the geometric center, but rather there is a backward offset. The longitudinal offset of the lateral force action point relative to the central plane of the tire generates an aligning torque that resists the tire rolling posture. The corrected aligning torque is
M z γ = y p z ( x , y ) d x d y
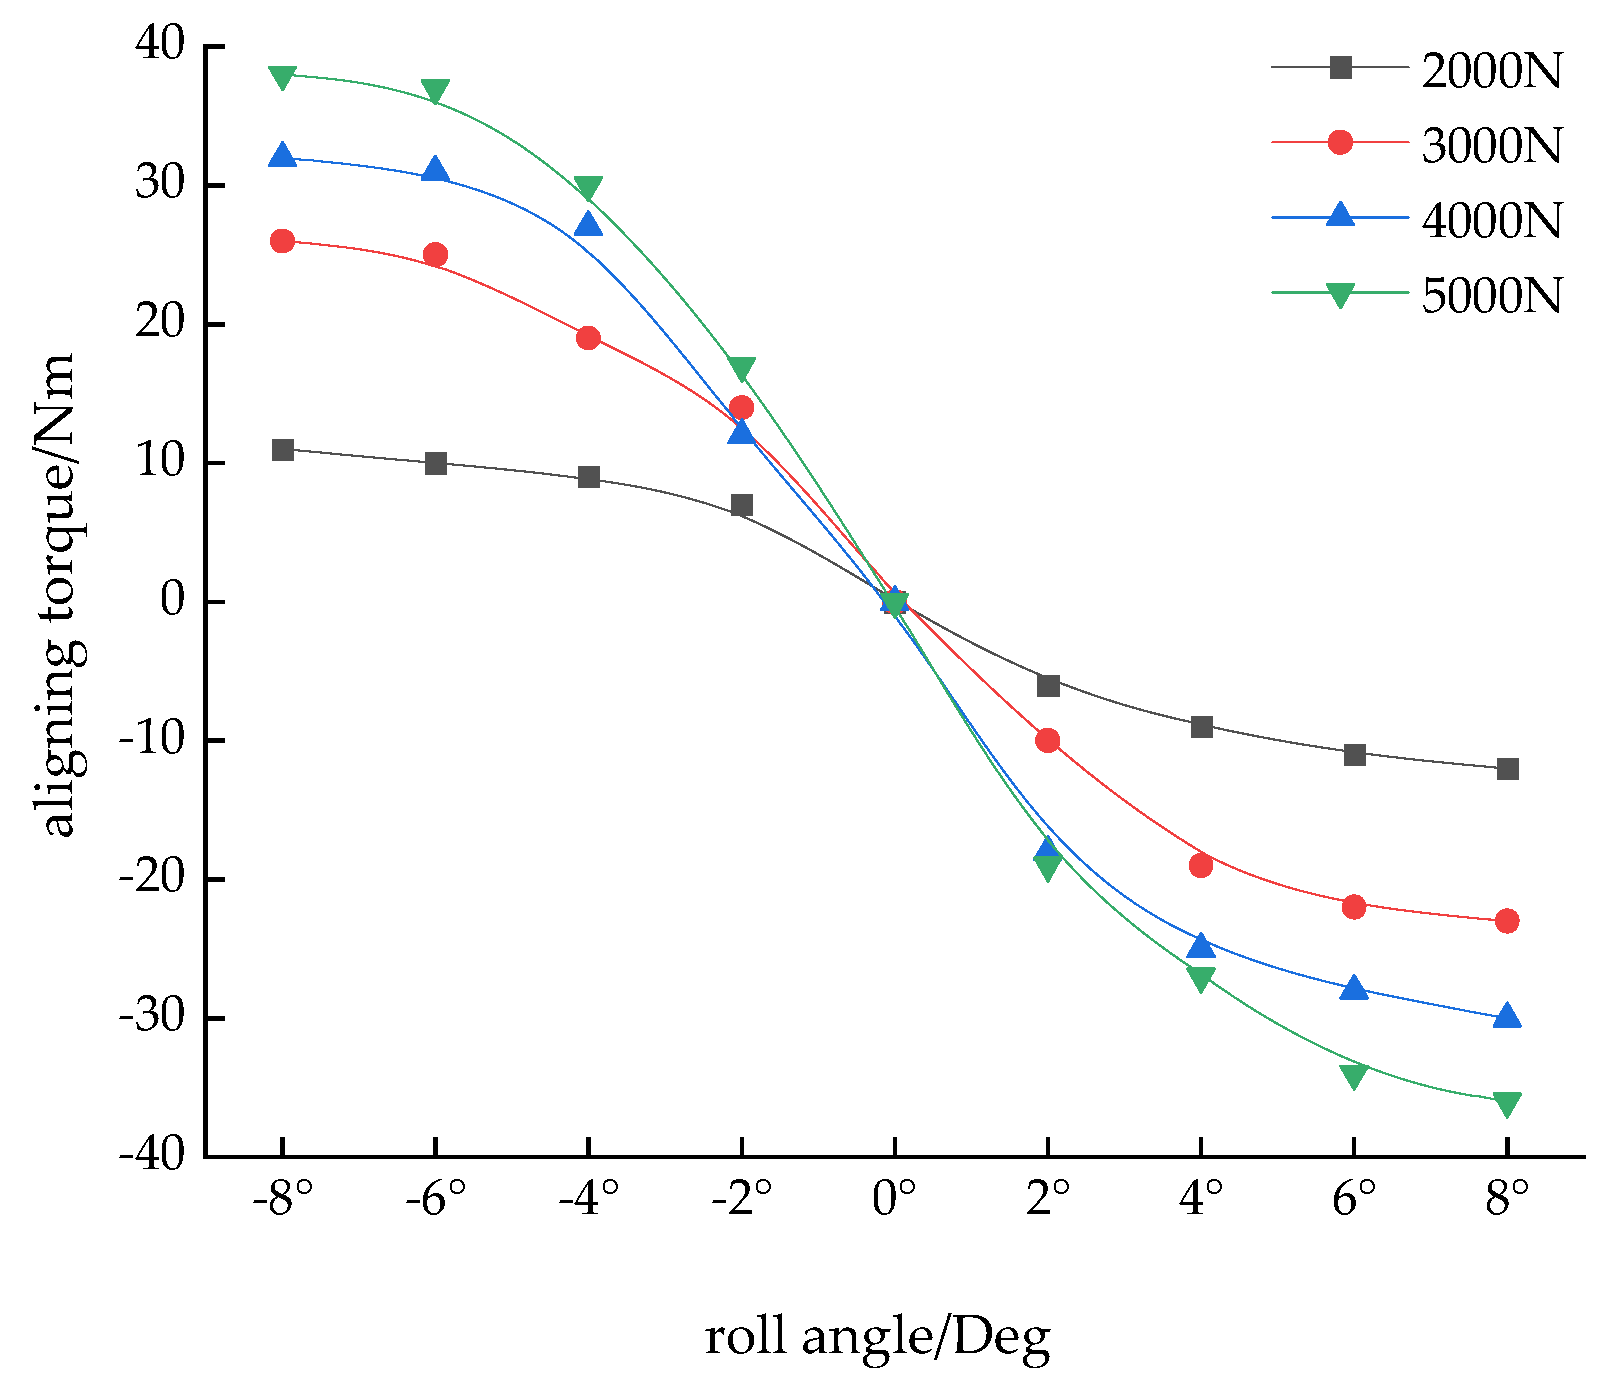
Vertical load is the core physical parameter that determines aligning torque. It affects the longitudinal position offset of the lateral force synergistic force action point in the contact area through the geometric evolution of the tire contact imprint and the contour characteristics of the normal pressure distribution. In-depth analysis of the aligning torque–rolling angle characteristic curve of the rolling back under different vertical loads (as shown in Figure 12) shows that the aligning torque in the low-rolling-angle range approximately linearly increases with the rolling angle. However, when the roll angle reaches the critical value of ±8°, the growth rate slows down sharply and approaches saturation. The essence of this saturation phenomenon lies in the three-dimensional deformation of the joint area caused by excessive roll angle and vertical load, which causes the pressure center to shift excessively to the outside of the shoulder area, until it finally reaches the effective working boundary of the tread [23].
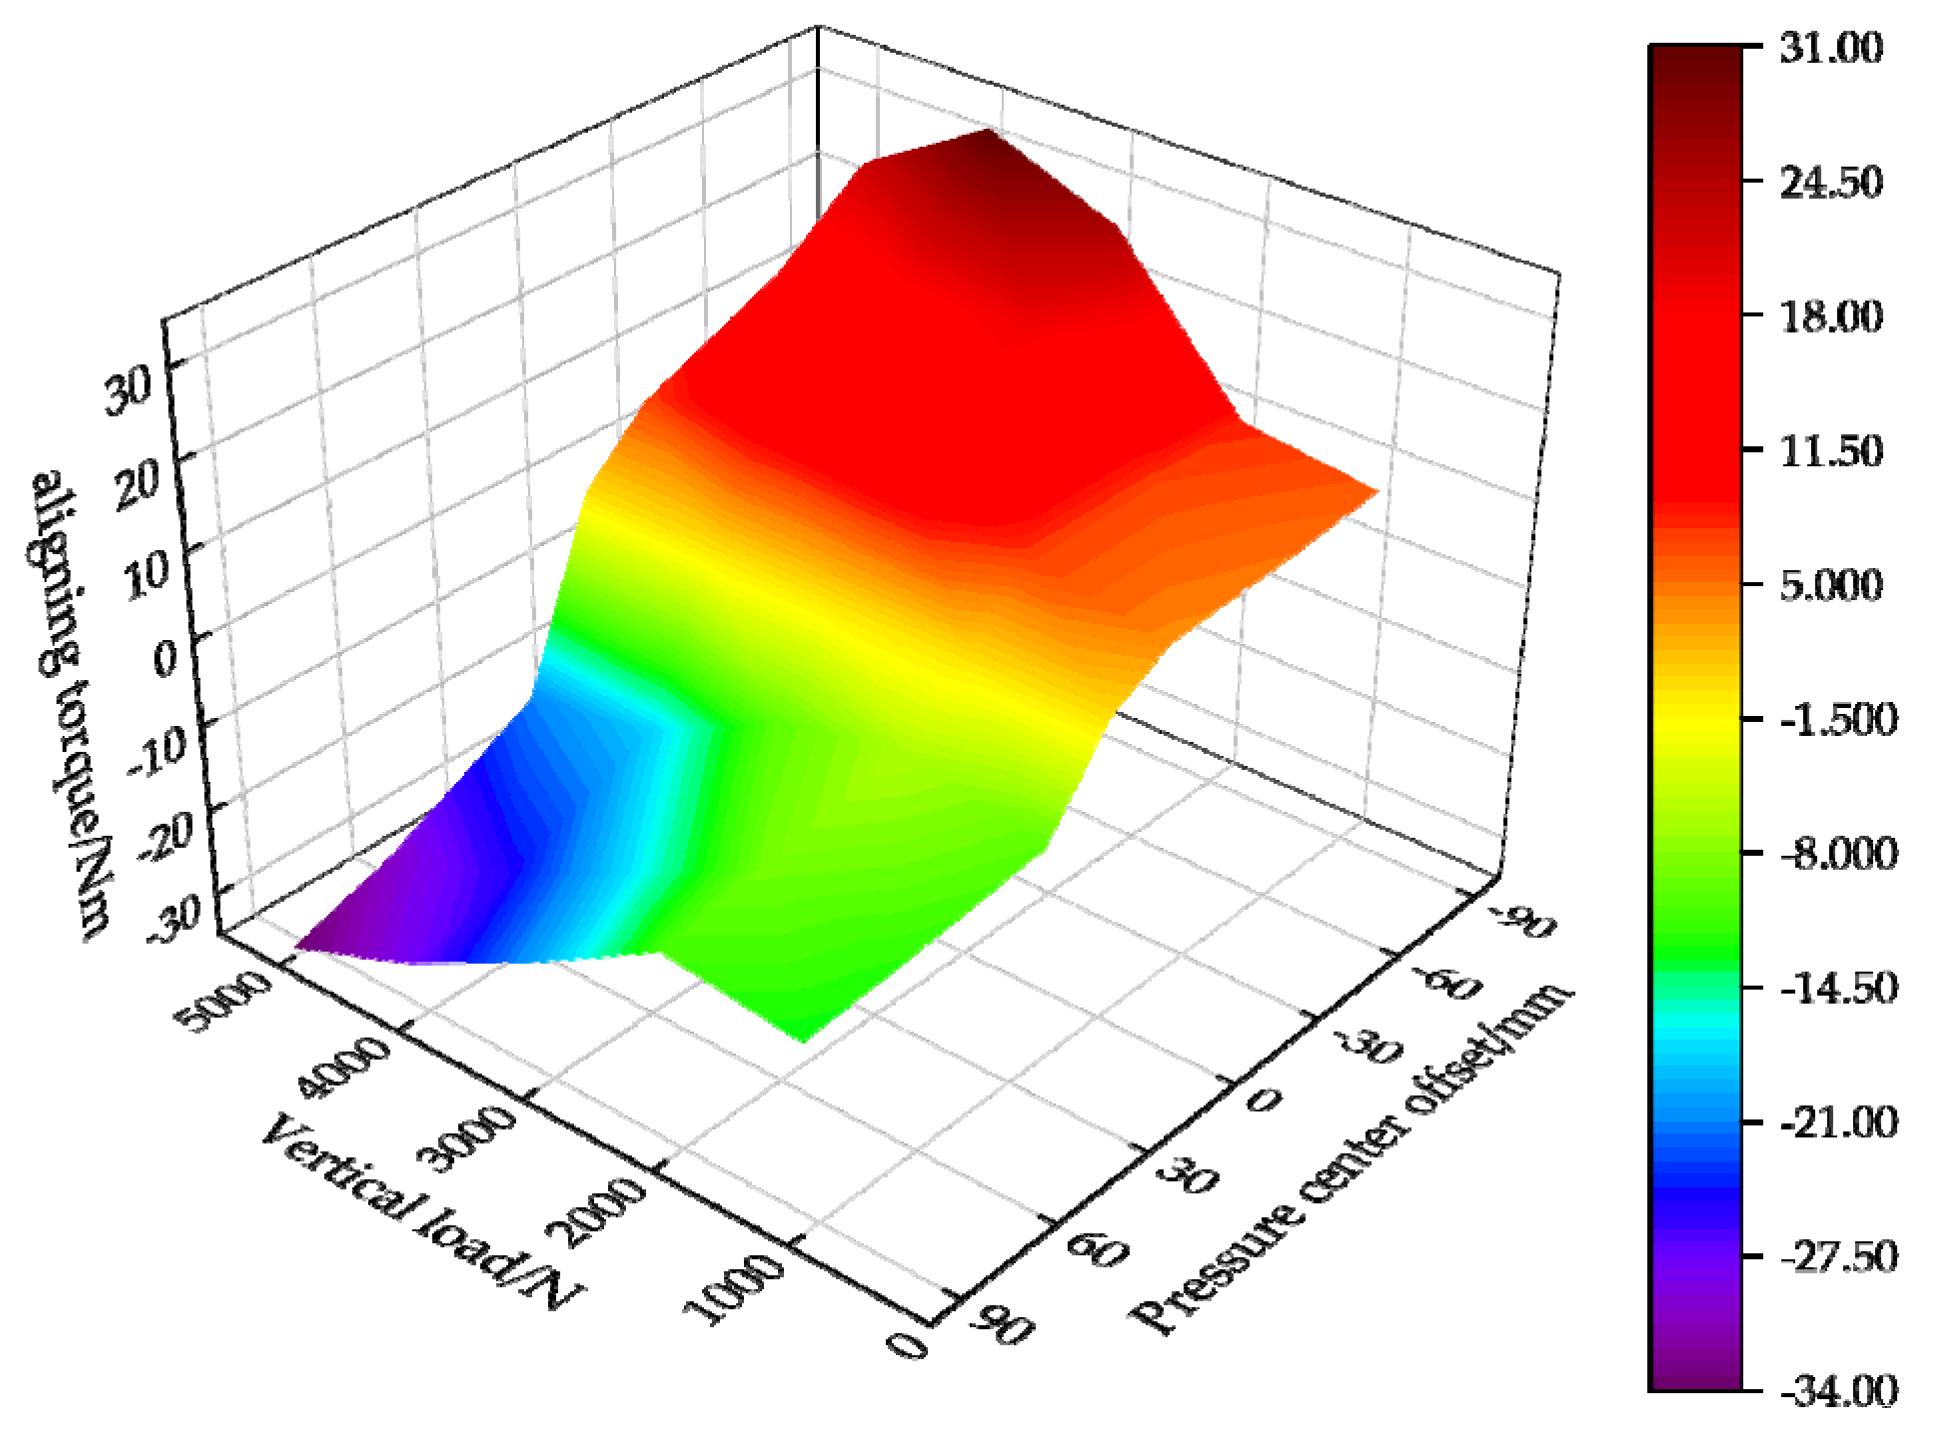
In order to further explore the distribution and change trend of the aligning torque, the three-dimensional response surface of the roll back with respect to the pressure distribution and vertical load is drawn as shown in Figure 13.
The results show that the aligning torque is strongly positively correlated with the longitudinal offset of the contact imprint pressure center. For every 0.1 times increase in the offset, the aligning torque is increased by 23–57%. It is worth noting that the vertical load directly enhances the lateral force and promotes further outward movement of the pressure center, and the two work together to increase the aligning torque under a high load of 5 kN by 175% compared with that under a 3 kN load.

5. Discussion

Based on the morphology and pressure distribution of the tire contact patch under rolling conditions, this study develops a corrected model for lateral force and aligning torque. The dynamic response characteristics are systematically analyzed, leading to the following conclusions:
(1) As the roll angle increases, the contact patch exhibits asymmetric contraction: the crown contact area decreases, while the shoulder contact expands outward. The pressure peak shifts toward the roll direction. The contact pressure shows a positive yet saturating correlation with the roll angle, reaching saturation at around 8°. At 10°, a complex bimodal pressure distribution emerges. Higher vertical loads enhance the contact pressure, reflecting their regulatory role in pressure distribution.
(2) The lateral force always acts opposite to the roll direction—positive roll generates inward force and negative roll produces outward force—with its magnitude positively correlated with the roll angle. This effect is more pronounced under increased vertical load, which amplifies the pressure gradient and friction boundary, enhancing the mechanical sensitivity.
(3) The aligning torque arises from the combined effect of contact imprint deformation and lateral force distribution. The roll angle induces asymmetric imprint restructuring, shifting the pressure peak laterally and increasing the lever arm of the lateral force. Vertical load simultaneously strengthens the lateral force and shifts the pressure center outward, resulting in a linear increase in aligning torque. When the roll angle is ≥8°, the contact imprint collapses to the unilateral triangular area, and the concentration of shoulder pressure causes the local shear stress to exceed the friction boundary and triggers the whole-region slip, resulting in the stagnation of moment growth.

Author Contributions

Conceptualization, X.M.; methodology, X.M.; software, Y.W.; validation, Y.W. and H.Y.; formal analysis, X.M.; investigation, X.M.; resources, Y.W.; data curation, Y.W.; writing—original draft preparation, Y.W.; writing—review and editing, X.M.; visualization, H.Y.; supervision, H.Y.; project administration, H.Y. All authors have read and agreed to the published version of the manuscript.

Funding

This research received no external funding.

Data Availability Statement

The original contributions presented in this study are included in the article. Further inquiries can be directed to the corresponding author.

Conflicts of Interest

The authors declare no conflicts of interest.

References

  1. Ricco, M.; Percolla, A.; Rizzo, G.C.; Zanchetta, M.; Tavernini, D.; Dhaens, M.; Geraerts, M.; Vigliani, A.; Tota, A.; Sorniotti, A. On the model-based design of front-to-total anti-roll moment distribution controllers for yaw rate tracking. Veh. Syst. Dyn. 2020, 60, 569–596. [Google Scholar] [CrossRef]
  2. Liu, Z.; Ma, C.; Gao, Q.; Ma, D.; Liu, S. Study on intelligent tyre force estimation algorithm based on strain analysis. Adv. Mech. Eng. 2024, 16. [Google Scholar] [CrossRef]
  3. Zhou, S.; Chen, L.; Li, Y.; Sun, P.; Su, G.; Meng, J. Study on the influence of different tire cord structures on tire grounding characteristics. J. Eng. Fibers Fabr. 2022, 17. [Google Scholar] [CrossRef]
  4. Sun, Y.; Li, B.; Bei, S.Y. Tire force analysis considering the characteristics of stress distribution in grounding area. J. Jiangsu Inst. Technol. 2024, 30, 60–72. [Google Scholar]
  5. Ricco, M.; Zanchetta, M.; Rizzo, G.C.; Tavernini, D.; Sorniotti, A.; Chatzikomis, C.; Velardocchia, M.; Geraerts, M.; Dhaens, M. On the Design of Yaw Rate Control via Variable Front-to-Total Anti-Roll Moment Distribution. IEEE Trans. Veh. Technol. 2019, 69, 1388–1403. [Google Scholar] [CrossRef]
  6. Liang, C.; Shan, M.; Wang, G.; Zhu, D.; Chen, X. A method for tire wet grip performance evaluation based on grounding characteristics. Proc. Inst. Mech. Eng. Part D J. Automob. Eng. 2021, 236, 109–117. [Google Scholar] [CrossRef]
  7. Meng, J.-L.; Sun, P.-F.; Zhou, S.-T.; Li, Y.; Chen, L.-W.; Mao, R. Study on the influence of belt angle on tire grounding characteristics under longitudinal slip conditions. J. Eng. Fibers Fabr. 2024, 19. [Google Scholar] [CrossRef]
  8. Romano, L. Advanced Brush Tyre Modelling; Springer Nature: Dordrecht, The Netherlands, 2022; ISBN 9783030984342. [Google Scholar]
  9. Zhang, S.P.; Chen, Y.X.; Zhou, H.C.; Zhang, W.; Liu, Y.; Shi, H.P. Study on the factors affecting the asymmetric characteristics of radial tire grounding region under lateral inclination. J. Chongqing Univ. Technol. Nat. Sci. 2023, 37, 56–62. [Google Scholar]
  10. Xie, Y.; Yang, Q. Tyre–pavement contact stress distribution considering tyre types. Road Mater. Pavement Des. 2018, 20, 1899–1911. [Google Scholar] [CrossRef]
  11. Zang, L.G.; Wang, X.Y.; Wang, Z.; Li, Y.W. Grounding characteristics of non-pneumatic tires under side dumping conditions. J. Chongqing Univ. Technol. Nat. Sci. 2021, 35, 49–55. [Google Scholar]
  12. Liu, Z.; Liu, Y.; Gao, Q. In-plane flexible ring modeling and a nonlinear stiffness solution for heavy-load radial tires. Mech. Syst. Signal Process. 2022, 171. [Google Scholar] [CrossRef]
  13. Romano, L.; Bruzelius, F.; Jacobson, B. Brush tyre models for large camber angles and steering speeds. Veh. Syst. Dyn. 2020, 60, 1341–1392. [Google Scholar] [CrossRef]
  14. Huang, T.; Gao, Q.H.; Liu, Z.H.; Wang, D. Study on nonlinear characteristics and model modification of heavy-duty radial tires. J. Huazhong Univ. Sci. Technol. Nat. Sci. Ed. 2021, 49, 42–46. [Google Scholar]
  15. Yin, H.F.; Lu, D.; Min, H.T.; Wu, H.D.; Zhang, Y.D. Study on the effect of lateral inclination angle on the mechanical characteristics of tire deflection. Automot. Eng. 2025, 47, 342–355. [Google Scholar]
  16. Yao, X.; Wang, Z.; Ma, L.; Miao, Z.; Su, M.; Han, X.; Yang, J. Temperature Dependence of Rubber Hyper-Elasticity Based on Different Constitutive Models and Their Prediction Ability. Polymers 2022, 14, 3521. [Google Scholar] [CrossRef] [PubMed]
  17. Wu, X. Research on the Design of Carcass and Tread Structure to Reduce the Rolling Resistance of Tires; Jiangsu University: Zhenjiang, China, 2018. [Google Scholar]
  18. Liu, H. Research on the Effect of Radial Tire Tread Partition Variability on Tire Stiffness; Jiangsu University: Zhenjiang, China, 2022. [Google Scholar]
  19. Xiao, F.; Hu, J.; Jia, M.; Zhu, P.; Deng, C. A novel integrated control framework of AFS, ASS, and DYC based on ideal roll angle to improve vehicle stability. Adv. Eng. Inform. 2022, 54. [Google Scholar] [CrossRef]
  20. Lin, F.; Wang, S.; Zhao, Y.; Cai, Y. Research on autonomous vehicle path tracking control considering roll stability. Proc. Inst. Mech. Eng. Part D J. Automob. Eng. 2020, 235, 199–210. [Google Scholar] [CrossRef]
  21. Sun, P.; Feng, G.; Zhou, S.; Qiu, C.; Fan, J. Experimental Analysis of Radial Tire Stiffness and Grounding Characteristics. IOP Conf. Ser. Mater. Sci. Eng. 2019, 677, 022111. [Google Scholar] [CrossRef]
  22. Zheng, B.; Huang, X.; Ma, J.; Hong, Z.; Chen, J.; Zhao, R.; Zhu, S.; Heidarzadeh, A. Evaluation on Distribution Characteristics of Pore Water Pressure within Saturated Pavement Structure Based on the Proposed Tire-Fluid-Pavement Coupling Model. Adv. Mater. Sci. Eng. 2022, 2022, 1–12. [Google Scholar] [CrossRef]
  23. Tang, C.Y.; Pan, L.; Li, J.H.; Zhang, M.L. Vehicle path tracking control considering stability boundary and lateral stability. J. Northeast. Univ. Nat. Sci. Ed. 2024, 45, 1123–1134. [Google Scholar]
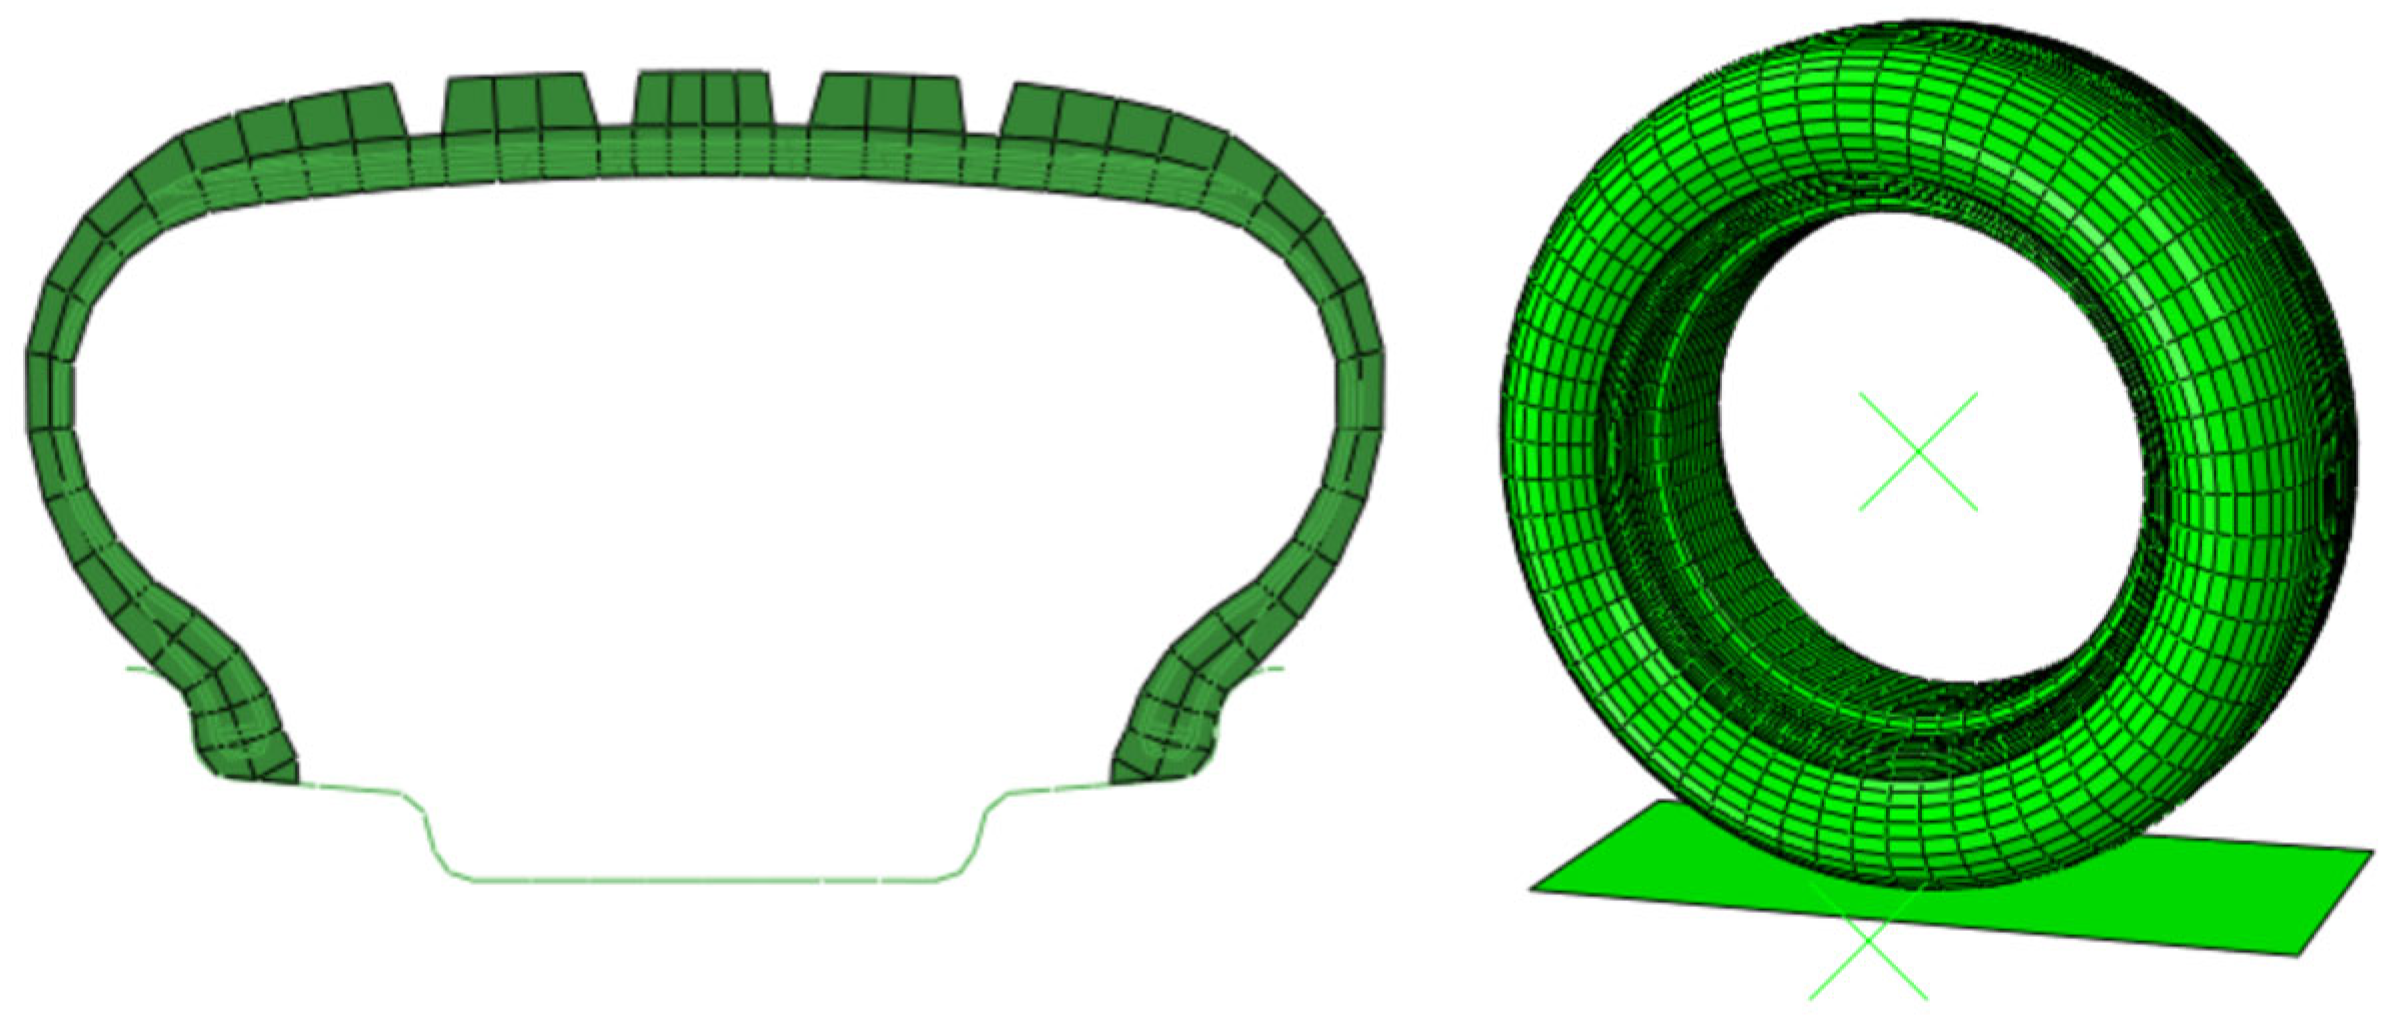
Figure 1. Finite element model of the 205/55 R16 radial tire.
Wevj 16 00525 g001
Figure 2. Flowchart of the phased load transfer analysis step.
Wevj 16 00525 g002
Figure 3. Relationship between tire radial displacement and vertical load.
Wevj 16 00525 g003
Figure 4. Contact patch of a tire under steady-state rolling conditions.
Wevj 16 00525 g004
Figure 5. Contact stress and patch contour plots at various roll angles under rolling conditions. (a) A roll angle of 2°; (b) a roll angle of 4°; (c) a roll angle of 6°; and (d) a roll angle of 8°.
Wevj 16 00525 g005
Figure 6. Schematic diagram of contact imprinting path in rolling conditions.
Wevj 16 00525 g006
Figure 7. Relationship diagram between contact stress and contact patch variation. (a) A roll angle of 2°; (b) a roll angle of 4°; (c) a roll angle of 6°; (d) a roll angle of 8°.
Wevj 16 00525 g007
Figure 8. Contact pressure distribution under different vertical loads.
Wevj 16 00525 g008
Figure 9. Contact pressure distribution at different roll angles.
Wevj 16 00525 g009
Figure 10. Relationship between the shift in the pressure center and the roll angle.
Wevj 16 00525 g010
Figure 11. Characteristic relationship between lateral force and roll angle variation.
Wevj 16 00525 g011
Figure 12. Characteristic relationship between aligning torque and roll angle variation.
Wevj 16 00525 g012
Figure 13. Three-dimensional response surface of aligning torque.
Wevj 16 00525 g013
Table 1. Geometric parameters of the contact imprint.
ItemContact Width/mmContact Length/mm
Experimental Value169.02149.11
Simulated Value177.45154.47
Relative Error4.51%3.24%
Disclaimer/Publisher’s Note: The statements, opinions and data contained in all publications are solely those of the individual author(s) and contributor(s) and not of MDPI and/or the editor(s). MDPI and/or the editor(s) disclaim responsibility for any injury to people or property resulting from any ideas, methods, instructions or products referred to in the content.