Article

Optimal Air Gap Magnetic Flux Density Distribution of an IPM Synchronous Motor Using a PM Rotor Parameter-Stratified Sensitivity Analysis

1
Shandong Tangjun Ouling Automobile Manufacturing Co., Ltd., Zibo 255000, China
2
School of Transportation and Vehicle Engineering, Shandong University of Technology, Zibo 255049, China
*
Author to whom correspondence should be addressed.
World Electr. Veh. J. 2025, 16(9), 508; https://doi.org/10.3390/wevj16090508
Submission received: 30 July 2025 / Revised: 28 August 2025 / Accepted: 4 September 2025 / Published: 10 September 2025

Abstract

In addressing the challenges posed by the numerous rotor structure parameters and the difficulty in analyzing the air gap magnetic field distribution in interior permanent magnet (IPM) motors, and to enhance the performance of automotive IPM synchronous motors, this paper proposes a multi-objective optimization method based on sensitivity stratification. Firstly, sensitivity analysis is conducted on the positional and shape parameters of the rotor permanent magnets (PMs), and the parameters are stratified according to their sensitivity levels. Subsequently, distinct analysis and optimization methods are applied to parameters of different strata for dual-objective optimization, which aims to increase the amplitude of the air gap flux density and reduce its total harmonic distortion (THD). Moreover, the waveform of the air gap flux density is analyzed to propose a targeted arrangement of magnetic isolation slots, thereby further optimizing the magnetic field distribution. Meanwhile, the demagnetization conditions and influencing factors of the PMs under overload are analyzed to enhance their demagnetization resistance and determine the final structural parameters. Simulation results indicate that, with the application of the proposed optimization method, the fundamental amplitude of the air gap flux density is increased by 0.035 T and THD is decreased by 9.9% when the proposed optimization method is applied. This verifies the effectiveness and feasibility of the method.

1. Introduction

PM motors offer advantages such as high efficiency, high energy density, simple control, and easy maintenance, leading to their widespread use in home appliances, vehicles, high-end equipment, advanced manufacturing, and the new energy industry [1,2,3,4]. However, torque ripple can restrict their application in scenarios requiring high-precision control. Suppressing torque ripple through the motor’s intrinsic structural design is an effective approach. Nevertheless, IPM motors with combined poles face challenges due to the flexible arrangement of PMs, numerous structural parameters, and complex optimization processes, which collectively increase design difficulty.
A significant corpus of research has been conducted by scholars on the optimization of interior combined magnetic pole motors, with notable results being achieved. Reference [5] proposes an iterative Taguchi method that eliminates parameters with minimal impact on motor performance compared to the traditional Taguchi method and employs smaller interval-level values for iterative optimization. Reference [6] introduces a normalized Gaussian network method, which combines multiple Gaussian functions into a network to generate output synchronous reluctance motor topologies and optimizes network weights using genetic algorithms. Reference [7] employs Latin hypercube sampling to construct a surrogate model relating optimization variables and multiple objectives, followed by optimization using the NSGA-II algorithm. References [8,9] similarly employ Latin hypercube sampling with a Kriging-based surrogate model and apply the MOPSO (Multi-Objective Particle Swarm Optimization) algorithm for parameter optimization. References [10,11] establish a BP neural network surrogate model based on finite element analysis and perform multi-objective optimization using the NSGA-II algorithm.
Iterative optimization methods face uncertainty in iteration counts, leading to increased workload for high iterations. Surrogate model-based methods often experience significant accuracy degradation as the number of optimization variables increases, limiting their application to scenarios with few variables. Additionally, relying solely on designers’ experience to select optimization variables often fails to comprehensively consider parameter interactions.
This paper analyzes a 5 kW drive motor with a 27-slot stator structure, providing a multi-objective optimization method based on sensitivity stratification. Multiple parameters of the rotor structure are stratified through sensitivity analysis, with different analysis and optimization methods applied to parameters at different strata. The waveform of the air gap magnetic flux density is analyzed to propose a targeted arrangement of magnetic isolation slots. The demagnetization of permanent magnets under overload conditions is also investigated to enhance their demagnetization resistance. Finally, the effectiveness of the optimization method is verified through simulation and experiments, presenting the improved performance of the optimized motor. The structure of the combined magnetic pole motor is shown in Figure 1, and its main parameters are listed in Table 1.

2. Analysis of Air Gap Flux Density and Parametric Sensitivity Modeling

Assuming the initial phase of the rotor magnetomotive force (MMF) is zero, the air gap MMF generated by the PMs can be expressed as a Fourier series:
F r ( α , t ) = u = 1 F u cos u p α ω e t
where u is the harmonic order of the PM MMF, u = 1,2,3, …, Fu is the harmonic amplitude of the u-th MMF, p is the number of pole pairs, α is the rotor mechanical position angle, and ωe is the electrical angular velocity.
The MMF generated by the stator winding is expressed as
F s ( α , t ) = v F v cos ( ω e t ± v α )
where v is the harmonic coefficient.
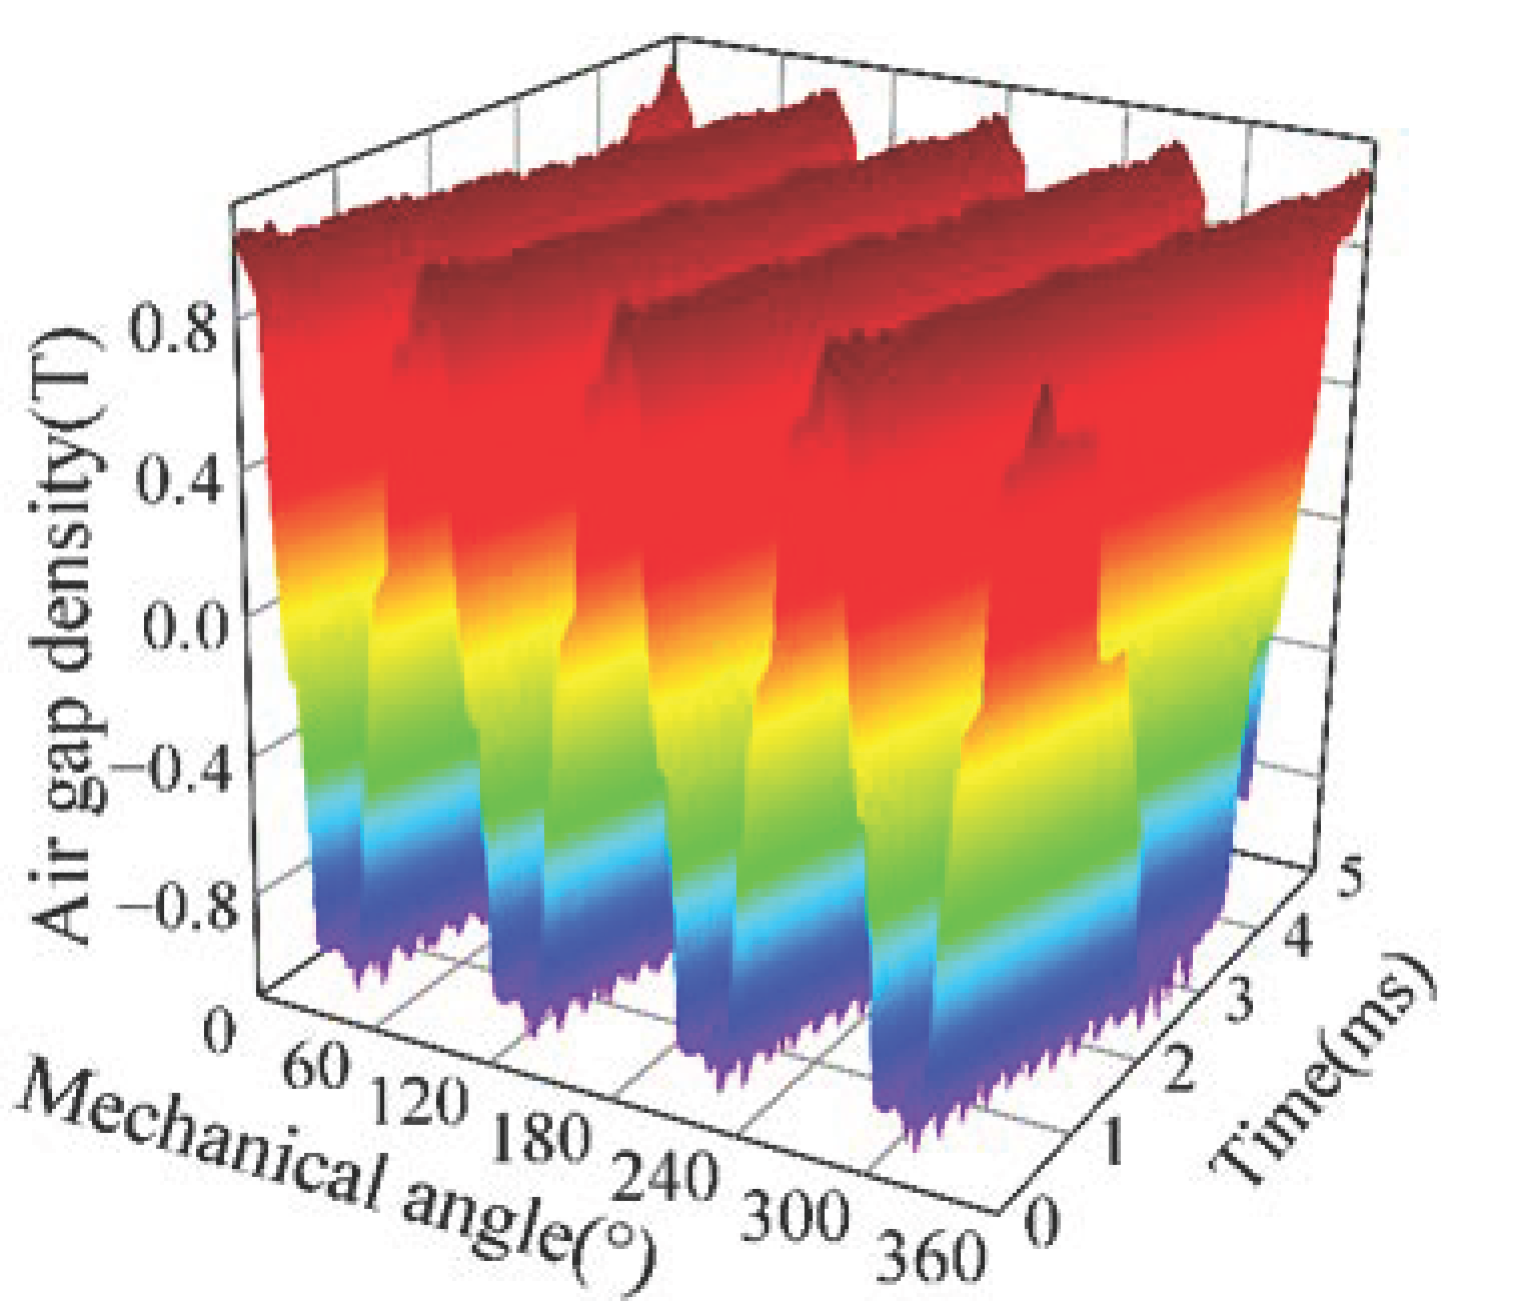
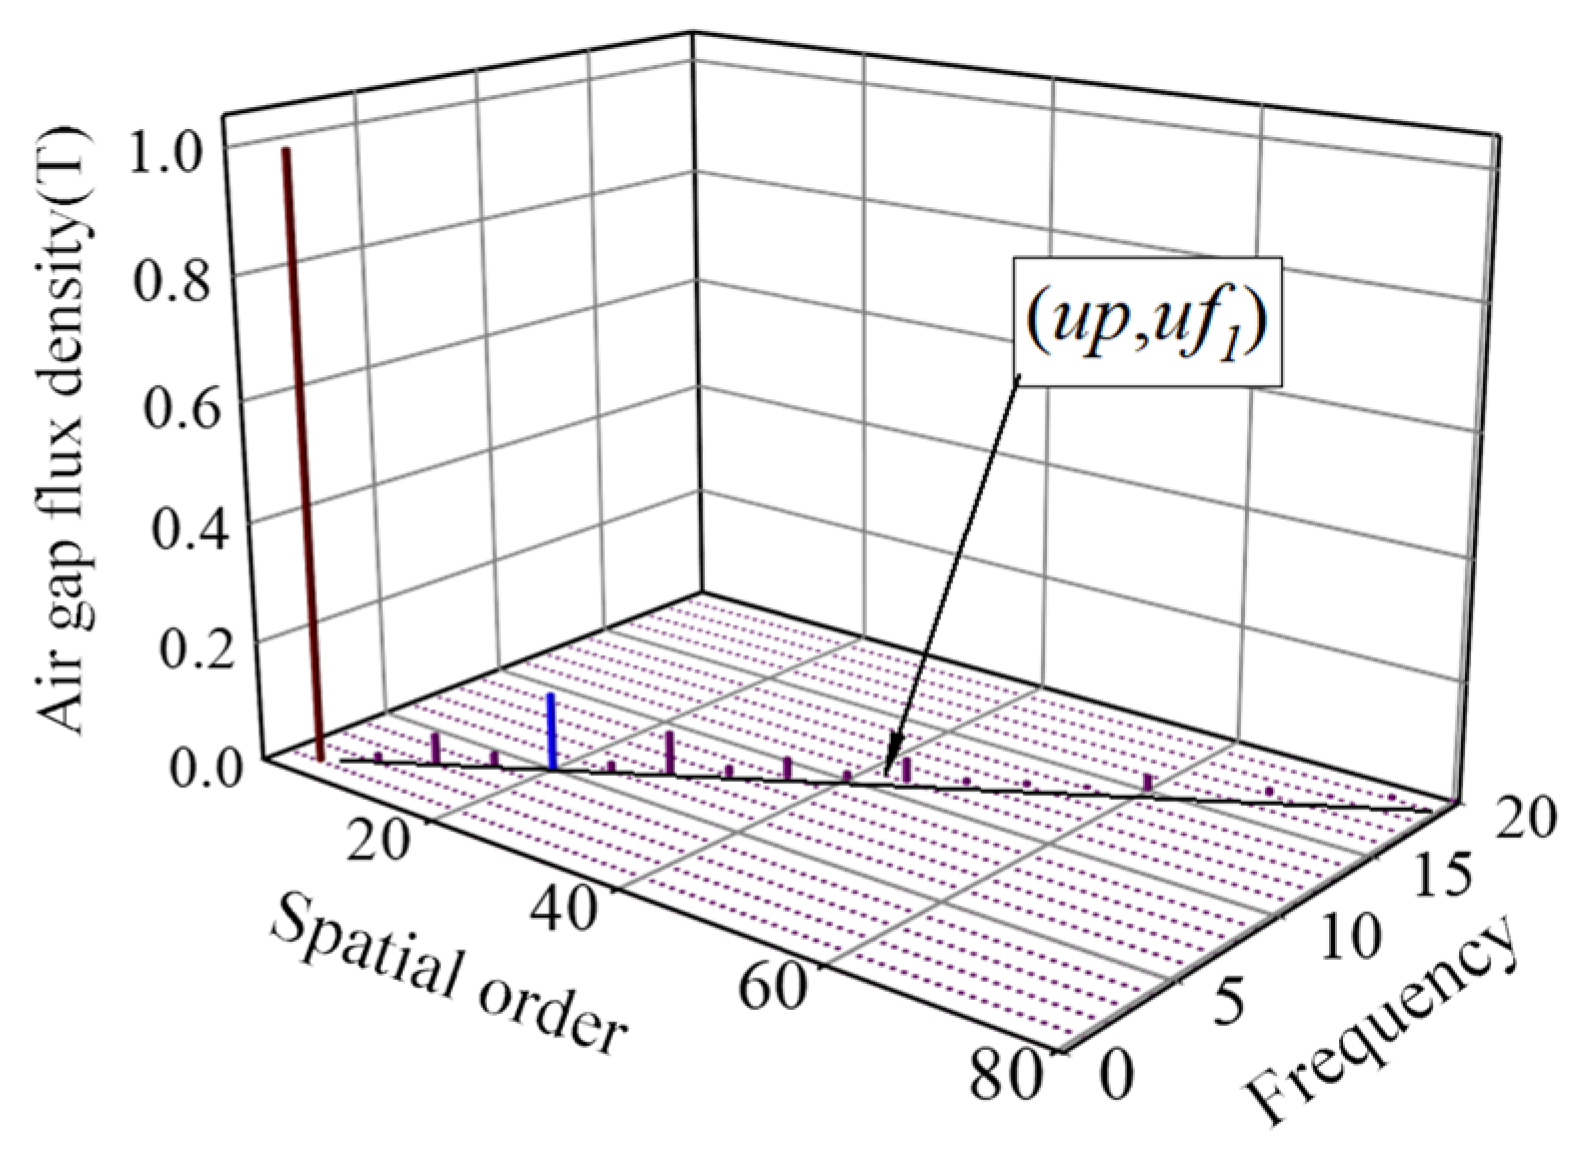
Through finite element simulation of a slotless stator model, the spatio-temporal distribution of the air gap flux density generated by the PMs is obtained, and its two-dimensional Fourier decomposition results are shown in Figure 2 and Figure 3, respectively.
Analysis of Figure 3 reveals that the rotor MMF primarily generates harmonics with a spatial order of up and a corresponding time frequency of uf1, corresponding with Equation (1).

2.1. Analysis of Air Gap Flux Density

According to the superposition principle, the resultant air gap MMF under load operation comprises the MMF produced by the load current in the stator windings and the MMF due to the rotor PMs [12,13,14]. Consequently, the air gap flux density is expressed as
B ( α , t ) = [ F s ( α , t ) + F r ( α , t ) ] Λ g ( α ) = B s t a t o r ( α , t ) + B r o t o r ( α , t )
Equation (3) indicates that the load air gap flux density is composed of the armature reaction component produced by the stator windings and the PM excitation component produced by the rotor PMs. Based on Equations (1) and (2), the expressions for these components are respectively derived as
B s t a t o r ( α , t ) = v F v λ 0 cos ( ω e t ± v α + γ ) + n v F v λ n cos ω e t ± v α ± n Q s α + γ
B r o t o r ( α , t ) = u F u λ 0 cos u α ω e t + n u F u λ n cos u α ω e t ± n Q s α
where Qs is the number of stator slots, γ is the harmonic phase angle of the ν-th harmonic, λ0 is the constant component of air gap permeance, and λn is the amplitude of the n-th air gap permeance harmonic.

2.2. Model and Main Parameters

The values of the optimization variables are interdependent. For instance, an excessively large angle for the second V-shaped PM combined with an excessively small angle for the first V-shaped PM may cause interference; if the length of a V-shaped PM is too long, it will encroach upon the space reserved for the flux barrier. Therefore, each variable has feasible ranges constrained by geometry. Based on the geometric constraints illustrated in Figure 4 and the relative positioning of the PMs, the feasible ranges for each variable were determined as listed in Table 2.
In PM motor design, both the amplitude of the air gap flux density and its THD are critical performance indices. The amplitude reflects the air gap flux, affecting the motor’s power density and indicating the effective utilization of the rotor PMs. The THD characterizes the non-ideal characteristics of the motor’s magnetic field, including waveform distortion and harmonic content. A higher THD leads to additional energy losses, reduced efficiency, and impacted operational stability and reliability. High harmonic content may increase vibration and noise, compromise electromagnetic compatibility, and interfere with other devices. Therefore, this paper selects the amplitude of the air gap flux density and its THD as the optimization objectives.
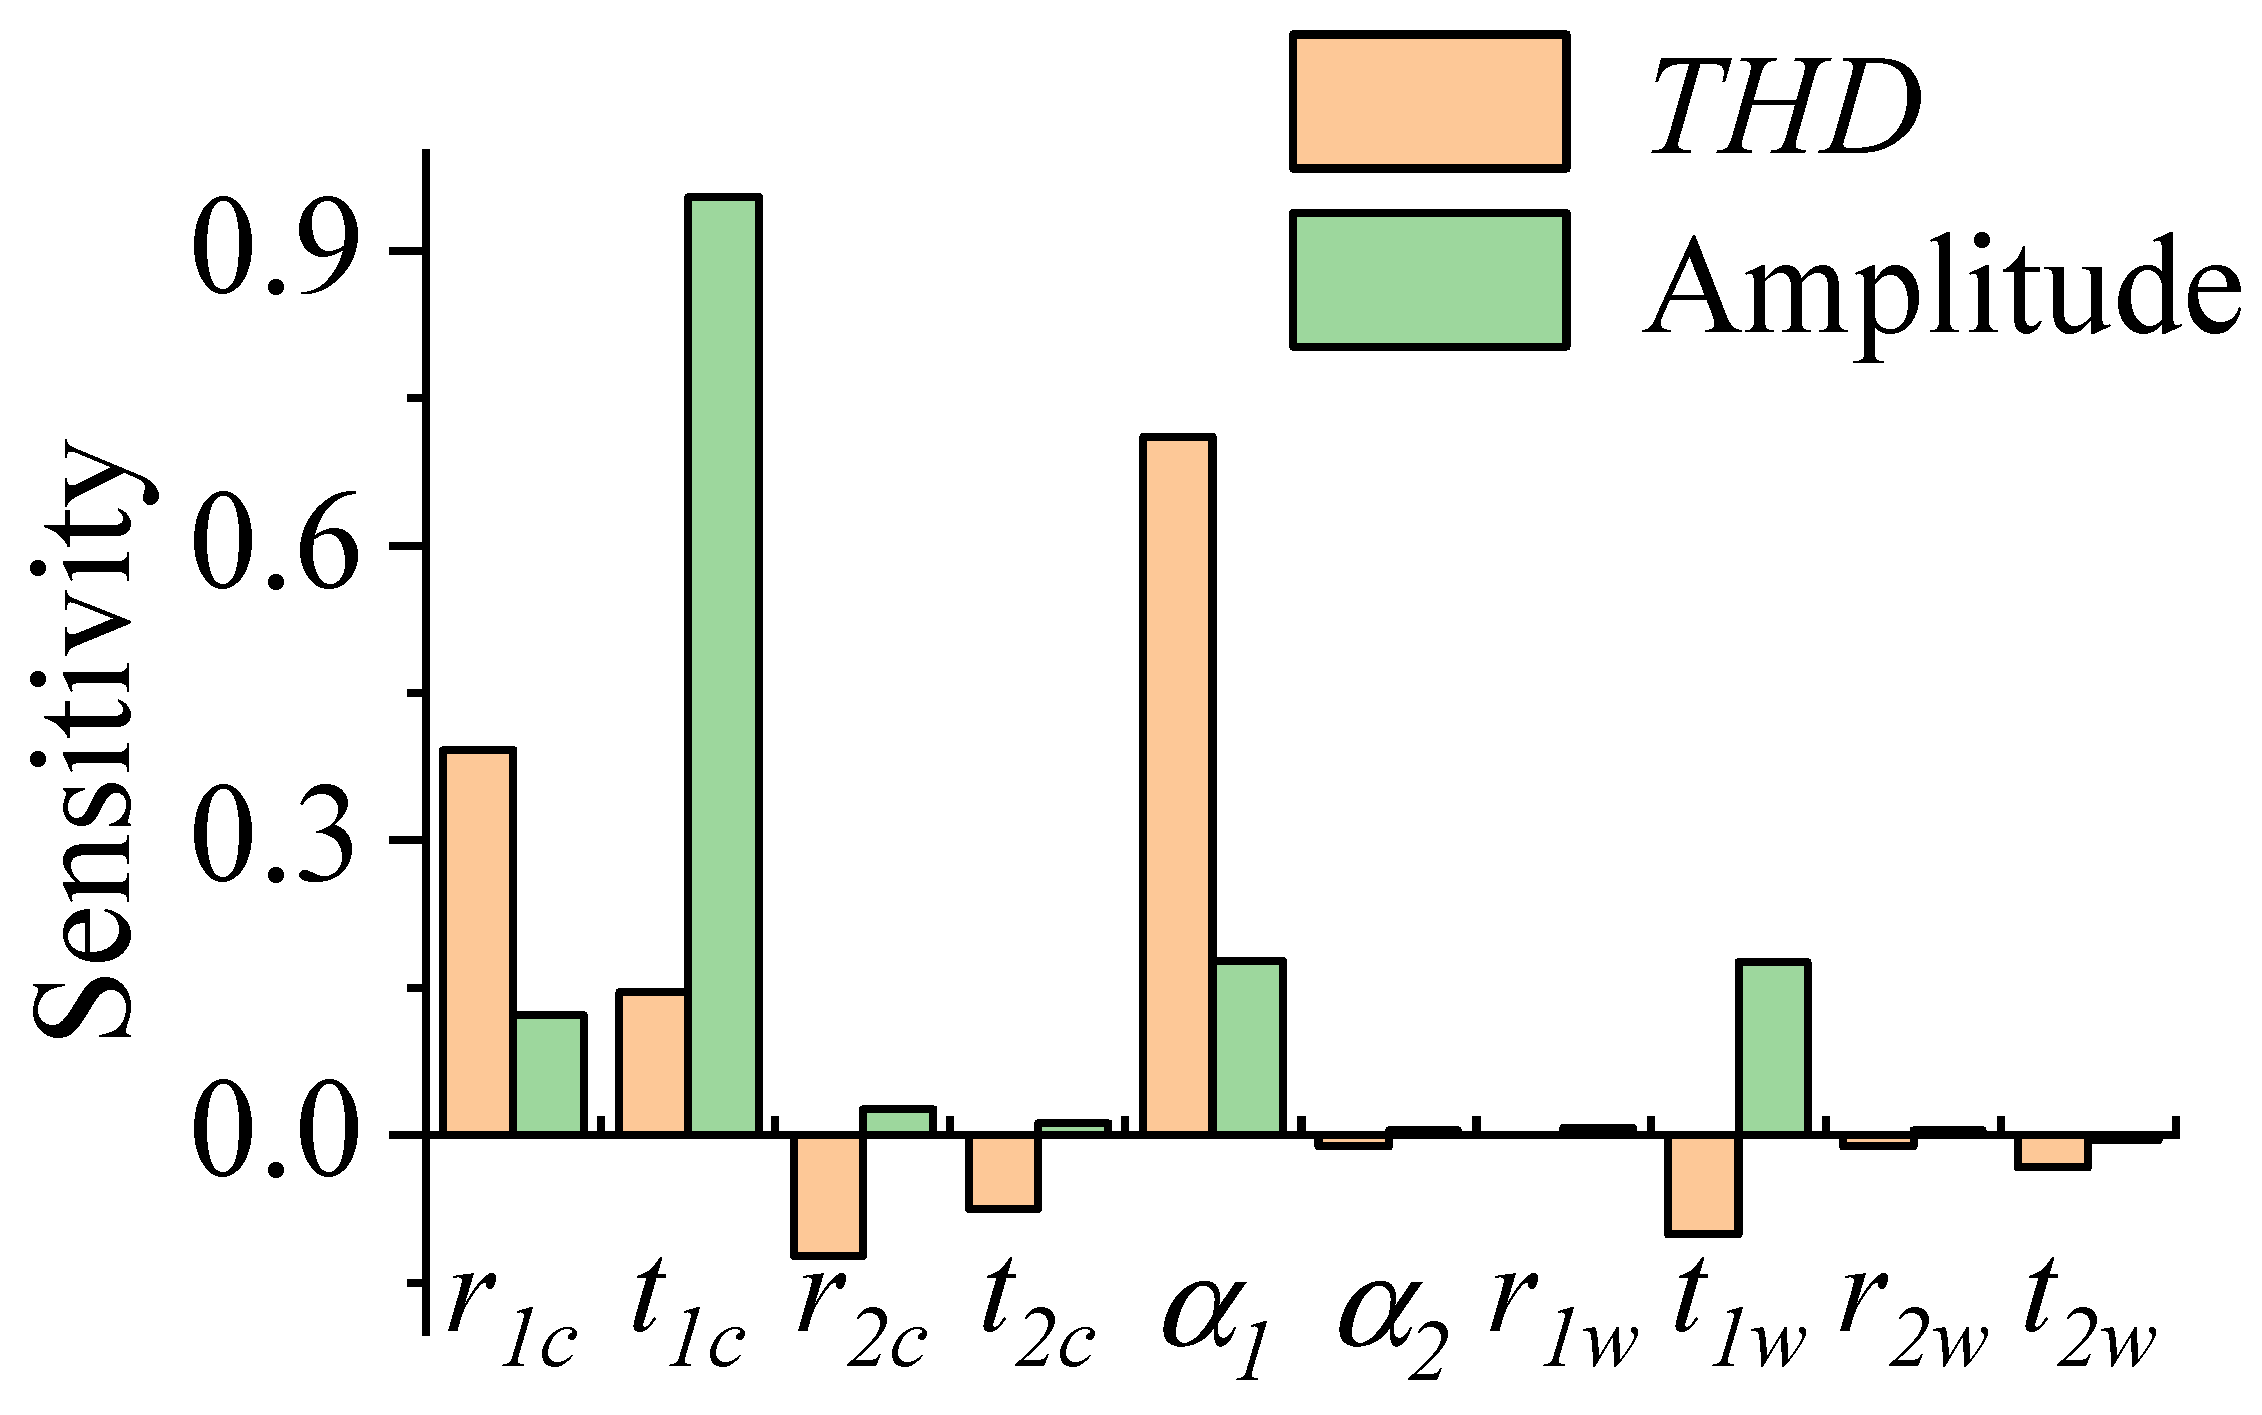
A surrogate model was developed to capture the relationship between optimization variables and objectives [15,16,17]. This model was used to analyze the sensitivity of each optimization variable. The simulation setup employed a modified Latin hypercube sampling method with a sample size of 300, including 100 cross-validation points. The fitting methods selected were polynomial fitting, moving least squares fitting, and isotropic Kriging. The importance of all parameters was preserved without variable screening, and the target Prognostic Coefficient of Performance was set to 0.9. The sensitivity of each parameter to the air gap flux density fundamental amplitude and THD is shown in Figure 5.
As shown in Figure 5, the sensitivity of each PM dimension parameter to the fundamental amplitude is positive, suggesting that increasing PM length generally increases the amplitude. Among all variables, t1c exhibits the highest sensitivity to the fundamental amplitude, while the sensitivity of all others is less than 0.2. Specifically, r1c, α1, and t1w exhibit significantly higher sensitivity to the fundamental amplitude than the remaining variables. The first V-shaped PM has a notable impact on THD, as the sensitivity of its length and included angle to THD both exceed 0.2. t1c, r2c, t2c, and t1w show significantly higher sensitivity to the air gap flux density than other variables.
Based on this analysis, the lowest sensitivity variables α2, r1w, r2w, and t2w are selected as first-layer optimization variables. Their values are determined by the optimal parameter combinations identified through sensitivity analysis of the metamodel. r2c, t2c, and t1w are chosen as the second-layer optimization variables; a sweep method analyzes how their values affect the objectives to determine optimized values. α1, t1c, and r1c are selected as third-layer optimization variables. Due to their high sensitivity to both amplitude and THD, and their mutual interaction, the Taguchi method is adopted for combinatorial optimization. The values determined for the first-layer variables by the metamodel are α2 = 63°, r1w = 3.2 mm, r2w = 2.2 mm, t2w = 2.2 mm.

2.3. Second-Layer Parameter Scanning

2.3.1. Influence of the Second V-Shaped PM

To analyze the effects of the second-layer variables r2c, t2c, and t1w on the fundamental amplitude and THD, the sum of the absolute values of their sensitivities to the two objectives is compared. In ascending order, these sums correspond to t2c, r2c and t1w. Their influence patterns are investigated in this order.
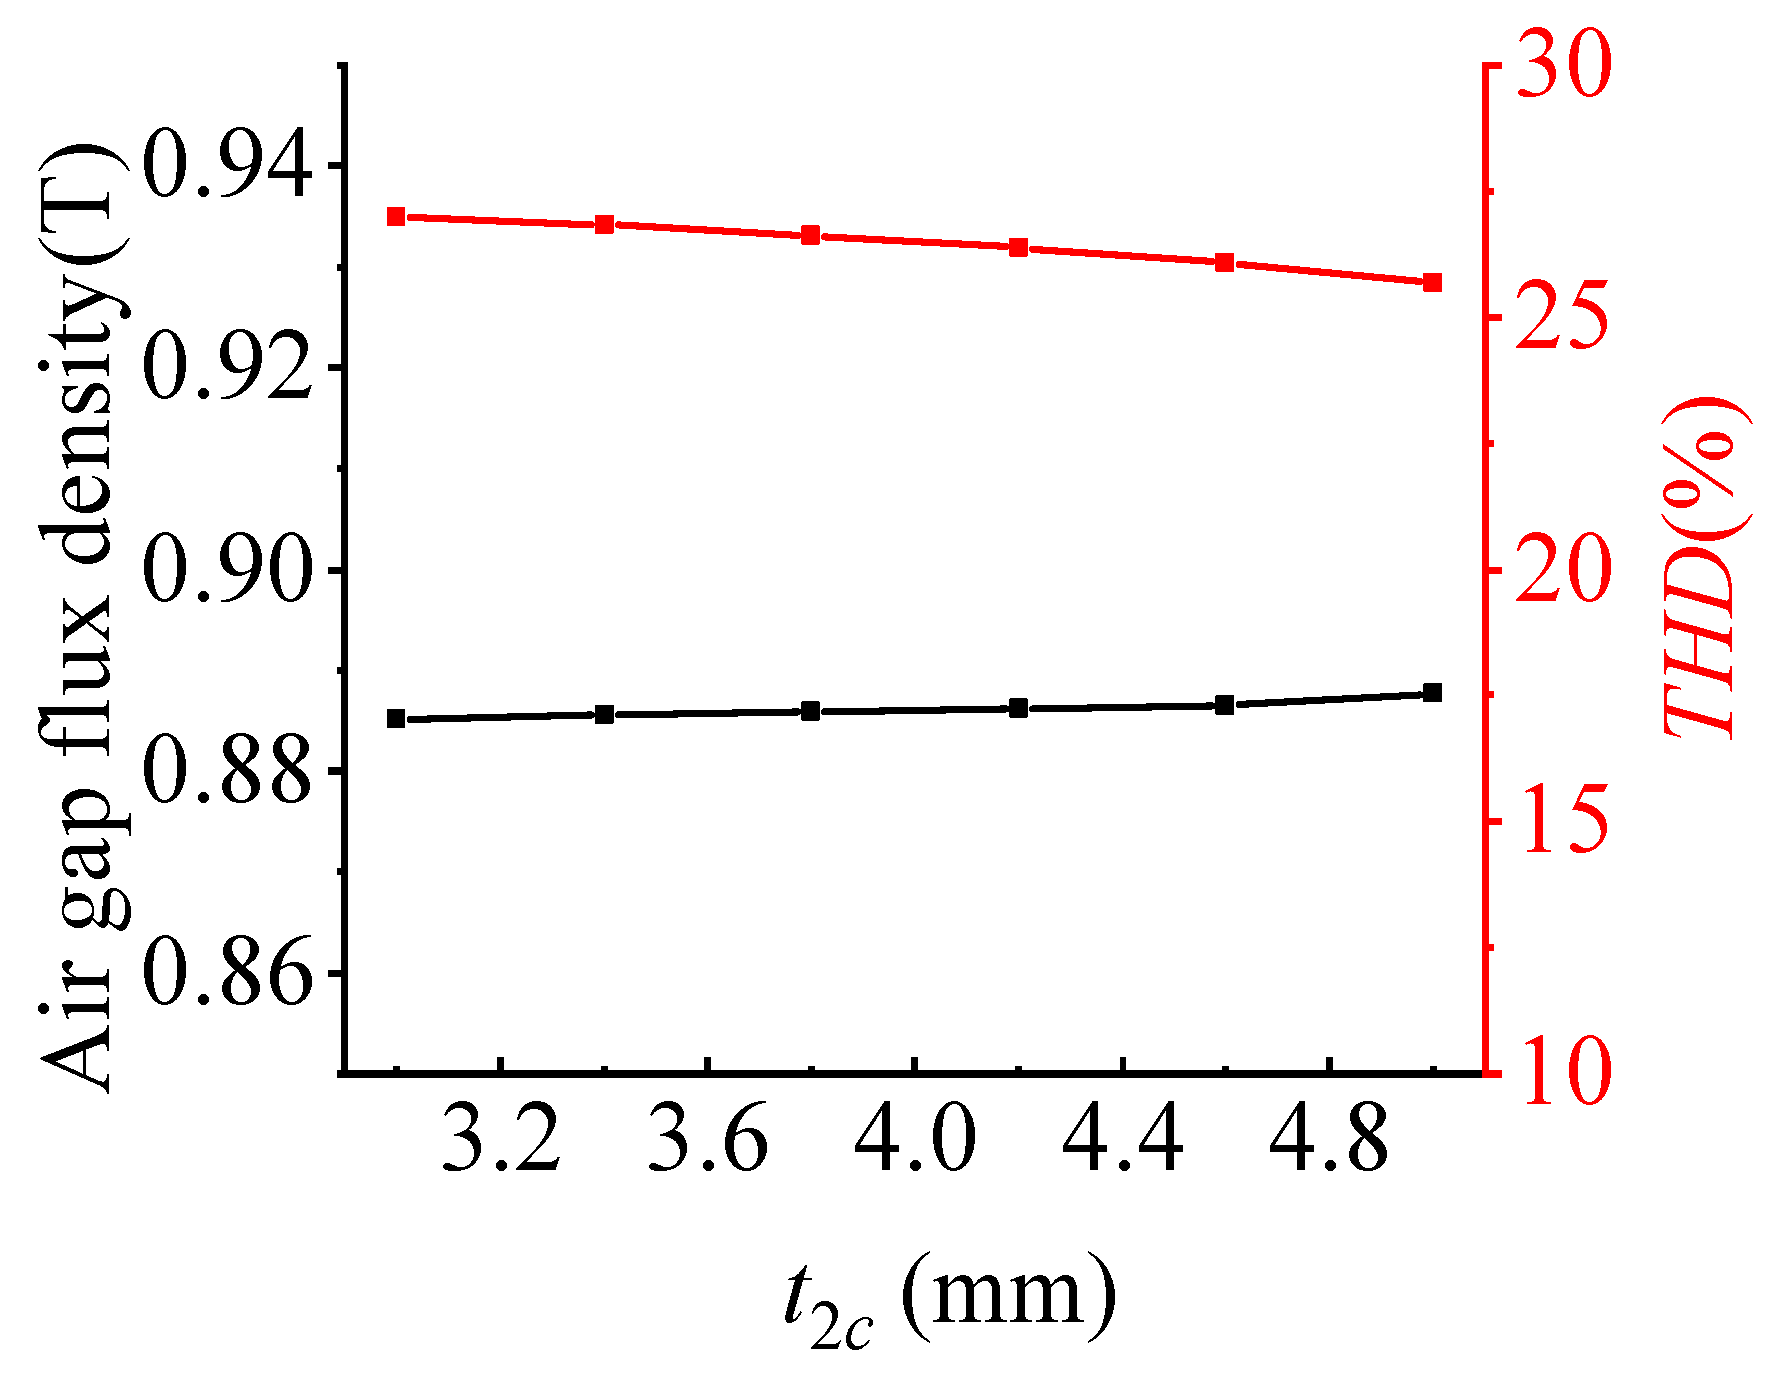
The primary role of the second V-shaped PM is to increase the maximum air gap flux density of its corresponding pole, compensating for the recess at the pole center caused by the non-uniform field distribution of the first V-shaped PM. A longer second V-shaped PM increases this maximum density. The influence of t2c on the objectives is shown in Figure 6.
From Figure 6, based on magnetic flux equality in N and S poles, the increase in maximum flux density at the pole center is achieved by a reduction in density near the peak. As t2c increases, the fundamental amplitude rises slightly and the THD decreases slightly, though changes are minimal. Considering these factors, t2c is selected as 4.8 mm.

2.3.2. Influence of the Second Radial PM

The second radial PM serves as the flux source that elevates the zero-zone of the air gap flux density to both sides in the rotor structure of the combined magnetic pole motor. Therefore, the greater the length r2c of the second radial PM, the more magnetic flux it provides, and the larger the shift of the air gap flux density zero-zone to both sides. Meanwhile, the effective radial magnetic flux in the air gap also increases. The influence patterns of the second radial PM length r2c on the fundamental amplitude of the air gap flux density and its THD are shown in Figure 7.
The second radial PM serves as the flux source that elevates the zero-zone of the air gap flux density towards both sides in the combined pole structure. Therefore, a greater length r2c provides more magnetic flux, leading to a larger shift of the zero-zone and an increase in effective radial flux. The influence of r2c on the objectives is shown in Figure 7.
From Figure 7, as r2c increases, both the fundamental amplitude and THD increase. Therefore, selection requires balancing both objectives. After comprehensive consideration, r2c is selected as 8 mm.

2.3.3. Influence of the First V-Shaped PM

The first V-shaped PM serves as the main flux source. In surface-mounted PM motors, the relationship between air gap flux and PM thickness can be approximated as ϕ h m / ( h m + g s ) , where hm is the PM thickness and gs is the air gap length, exhibiting an inflection point around hm ≈ 5gs. For interior PM motors, factors like complex magnetic paths, leakage flux, core saturation, and non-uniform distribution due to multi-PM poles make an analytical expression difficult. However, the relationship between the main PM thickness t1w and air gap flux follows a similar trend to surface motors, reaching an inflection point.
The influence patterns of t1w on the objectives, obtained via finite element simulation, are shown in Figure 8.
From Figure 8, t1w significantly impacts the air gap flux density. As t1w increases, the fundamental amplitude continuously increases, exhibiting a pattern similar to surface motors. With an air gap of 0.5 mm, the inflection point occurs around t1w ≈ 2.5 mm (5 times the air gap). The THD decreases slightly with increasing t1w. From an electromagnetic performance perspective, a larger t1w is beneficial. However, considering PM utilization efficiency, an excessively large width yields diminishing returns. After comprehensive consideration, t1w is selected as 2.6 mm.

3. High-Sensitivity Parameter Optimization Based on Taguchi Method

3.1. Non-Standard Orthogonal Experimental Design

The high-sensitivity variables identified through stratification are key to motor performance. However, due to the mutual influence and interdependence among optimization variables, traditional optimization strategies that scan single variables struggle to simultaneously optimize the values of other variables. Furthermore, optimizing each variable individually requires extensive simulations, increasing time and design cycles. Therefore, this paper employs the Taguchi method, suitable for multi-variable, multi-level optimization, for the high-sensitivity parameters [18,19].
For the three high-sensitivity variables, α1 has a sensitivity to THD exceeding 0.7, while t1c has sensitivity to the fundamental amplitude exceeding 0.9. Therefore, more levels are defined for these two variables: α1 and t1c are divided into 9 levels, and r1c into 6 levels. The variables and their levels are listed in Table 3.
After defining objectives and variable levels, an orthogonal experimental scheme was designed [20]. Using the orthogonal array “L81(93)” and modifying one factor to 6 levels resulted in a suitable non-standard orthogonal matrix. This matrix requires only 54 finite element analyses for the three factors (6, 9, and 9 levels). The finite element software was configured with the matrix values, and the no-load air gap flux density amplitude and THD were obtained for each combination. Part of the matrix and results are shown in Table 4.

3.2. Result Analysis and Parameter Selection

The mean values of the two objectives for each variable level were calculated. For variable A, the mean value at level i is
Q m A i = 1 m i = 1 m q A i
where Q(mAi) is the mean value of variable A at level i, m is the number of parameters at that level, and qAi is the performance index value for that specific combination.
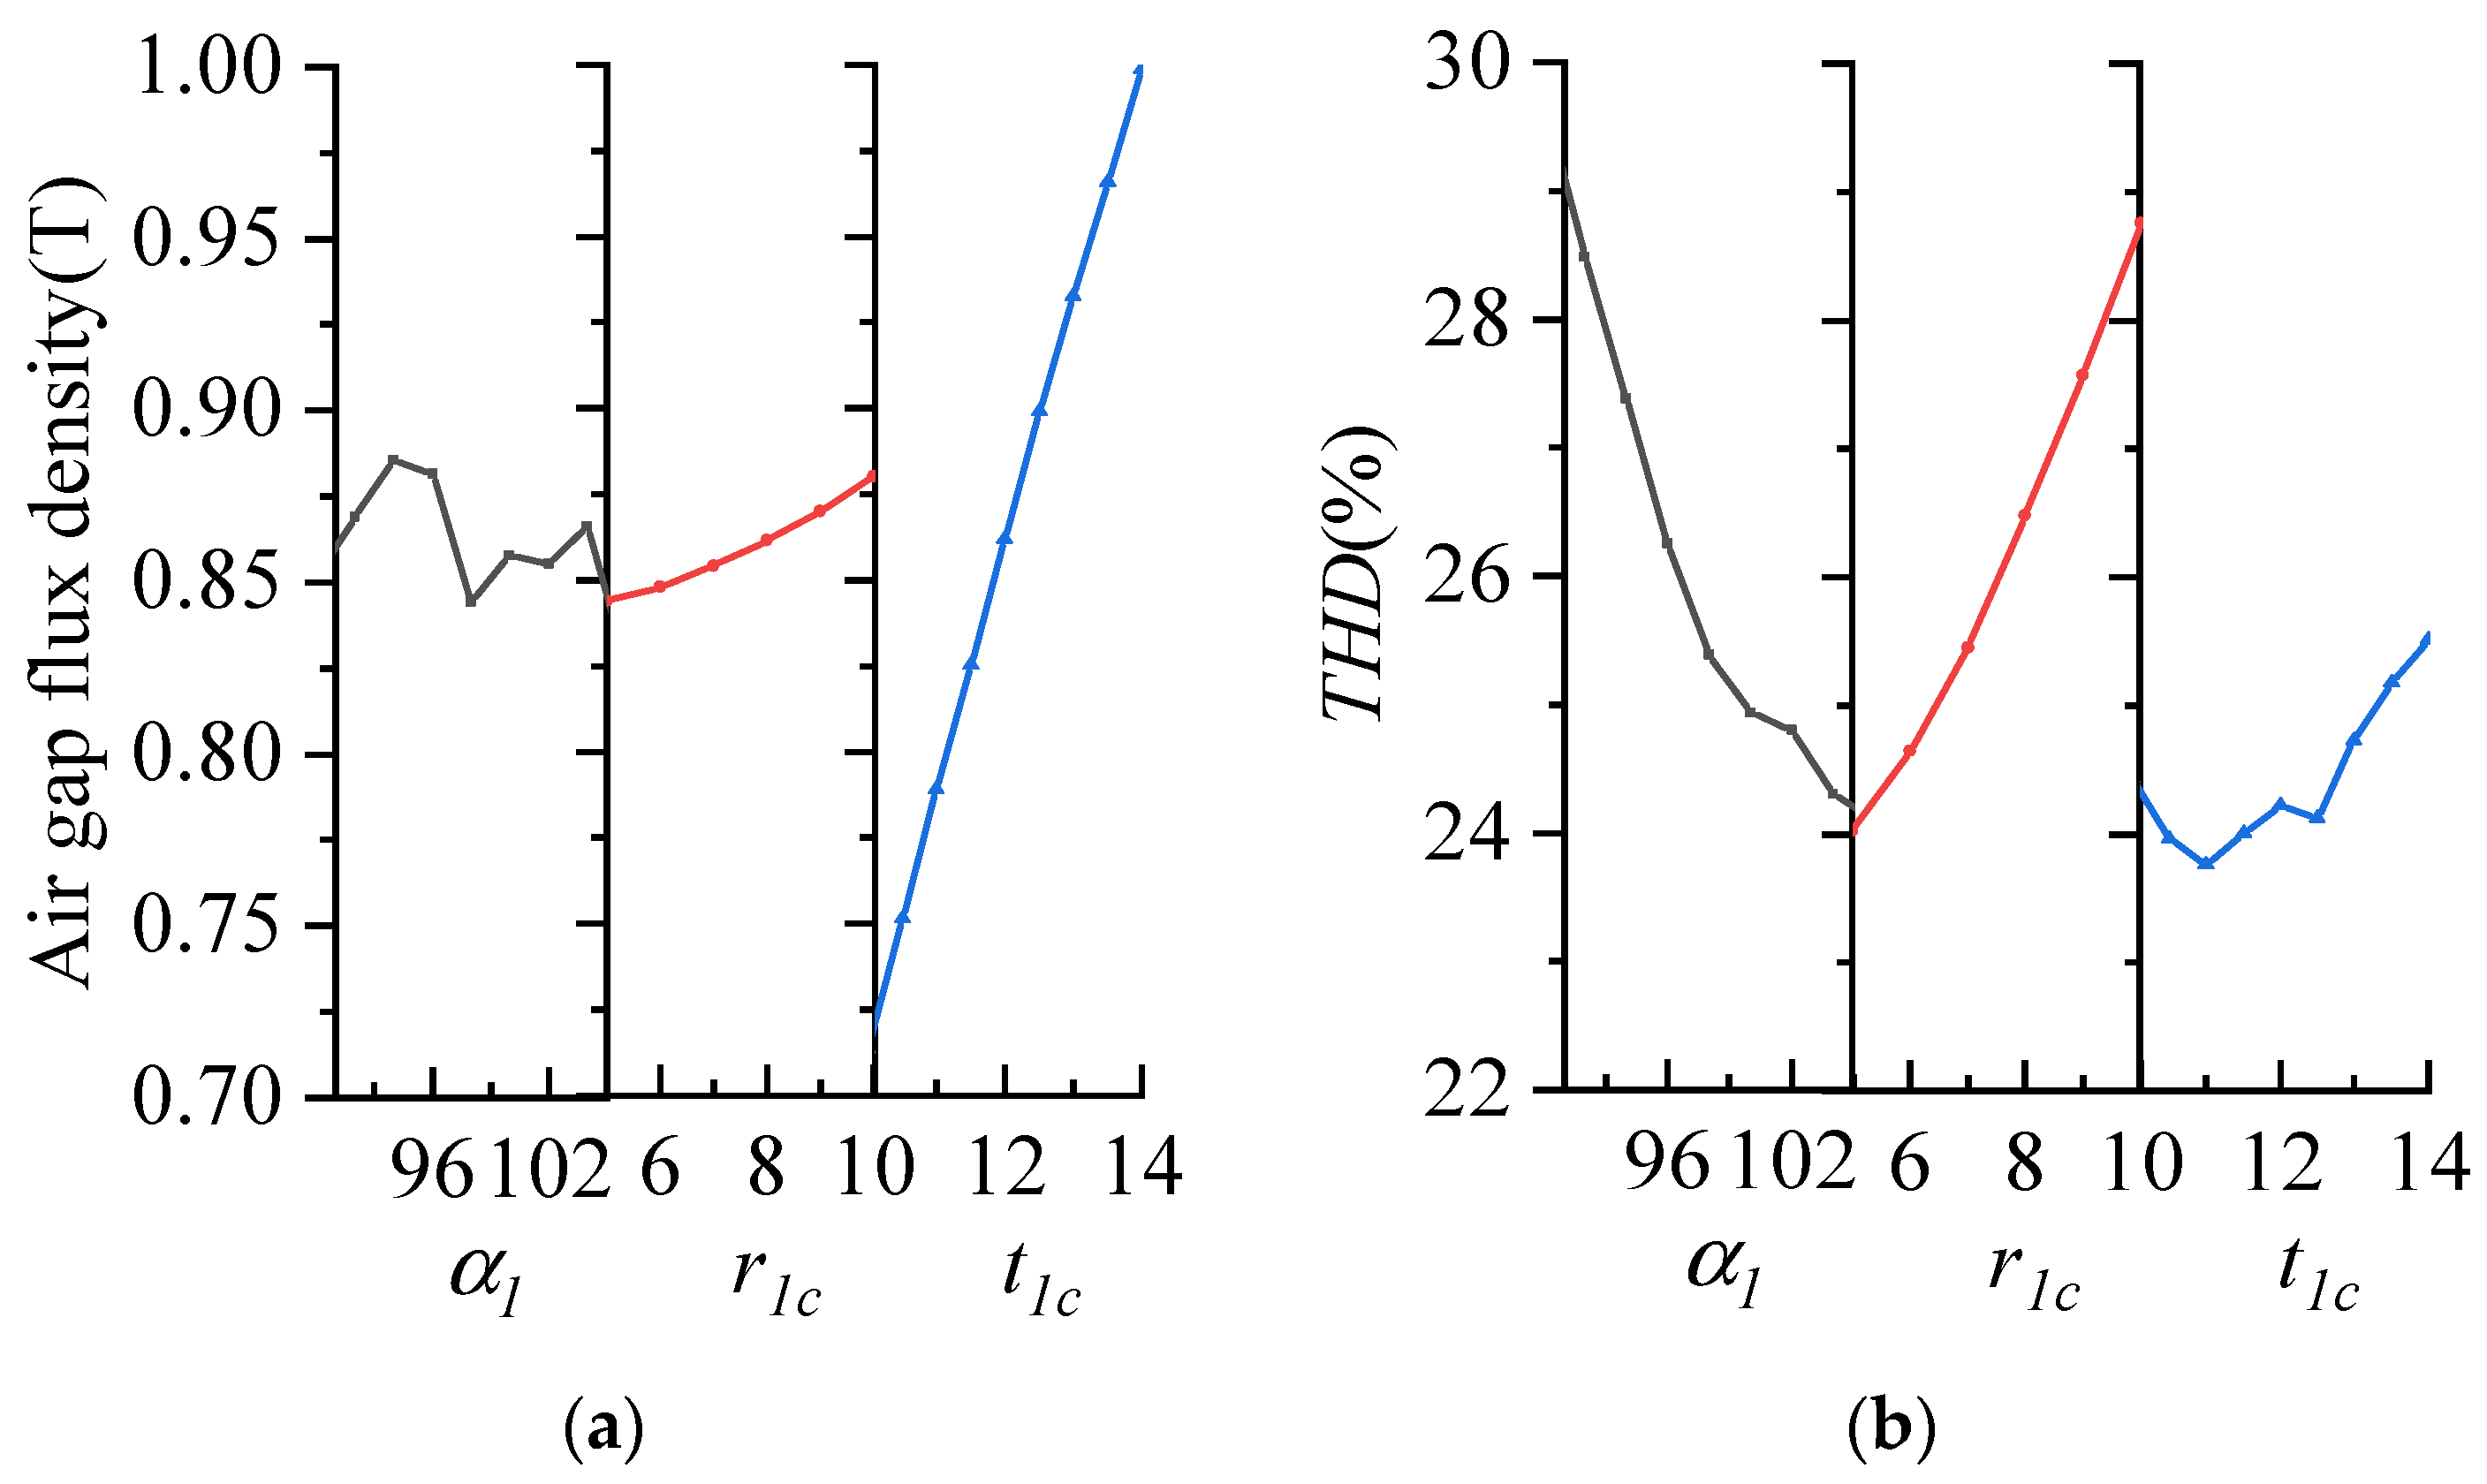
The effects of each variable on the amplitude and THD are shown in Figure 9a,b, respectively.
From Figure 9, the length of the first V-shaped PM t1c has the greatest influence on the fundamental amplitude, while its included angle (α1) has the most significant impact on THD. For the fundamental amplitude, the optimal combination is α1 = 94°, r1c = 10 mm, t1c = 14 mm. For THD, the optimal combination is α1 = 106°, r1c = 5 mm, t1c = 11 mm. The optimal combinations conflict. Therefore, variance and contribution analyses are required to determine the influence proportion of each variable and find the best compromise.
The variance of optimization objective p with respect to variable A is
S A p = 1 m i = 1 m ( Q m A i Q p ¯ ) 2
where SAP is the variance, QmAi is the mean objective value at level i of A, and Q p ¯ is the overall mean of objective p.
The variances and contributions for the two objectives are shown in Table 5.
From Table 5, variation in t1c has the greatest influence on both amplitude and THD, with a slightly larger impact on amplitude. Combining variance and contribution analyses, the optimized level combination is α1 = 106°, r1c = 5 mm, t1c = 14 mm.
A comparison of parameters before and after optimization is shown in Table 6.

3.3. Optimization of Magnetic Isolation Slots and Thickness of the First V-Shaped PM

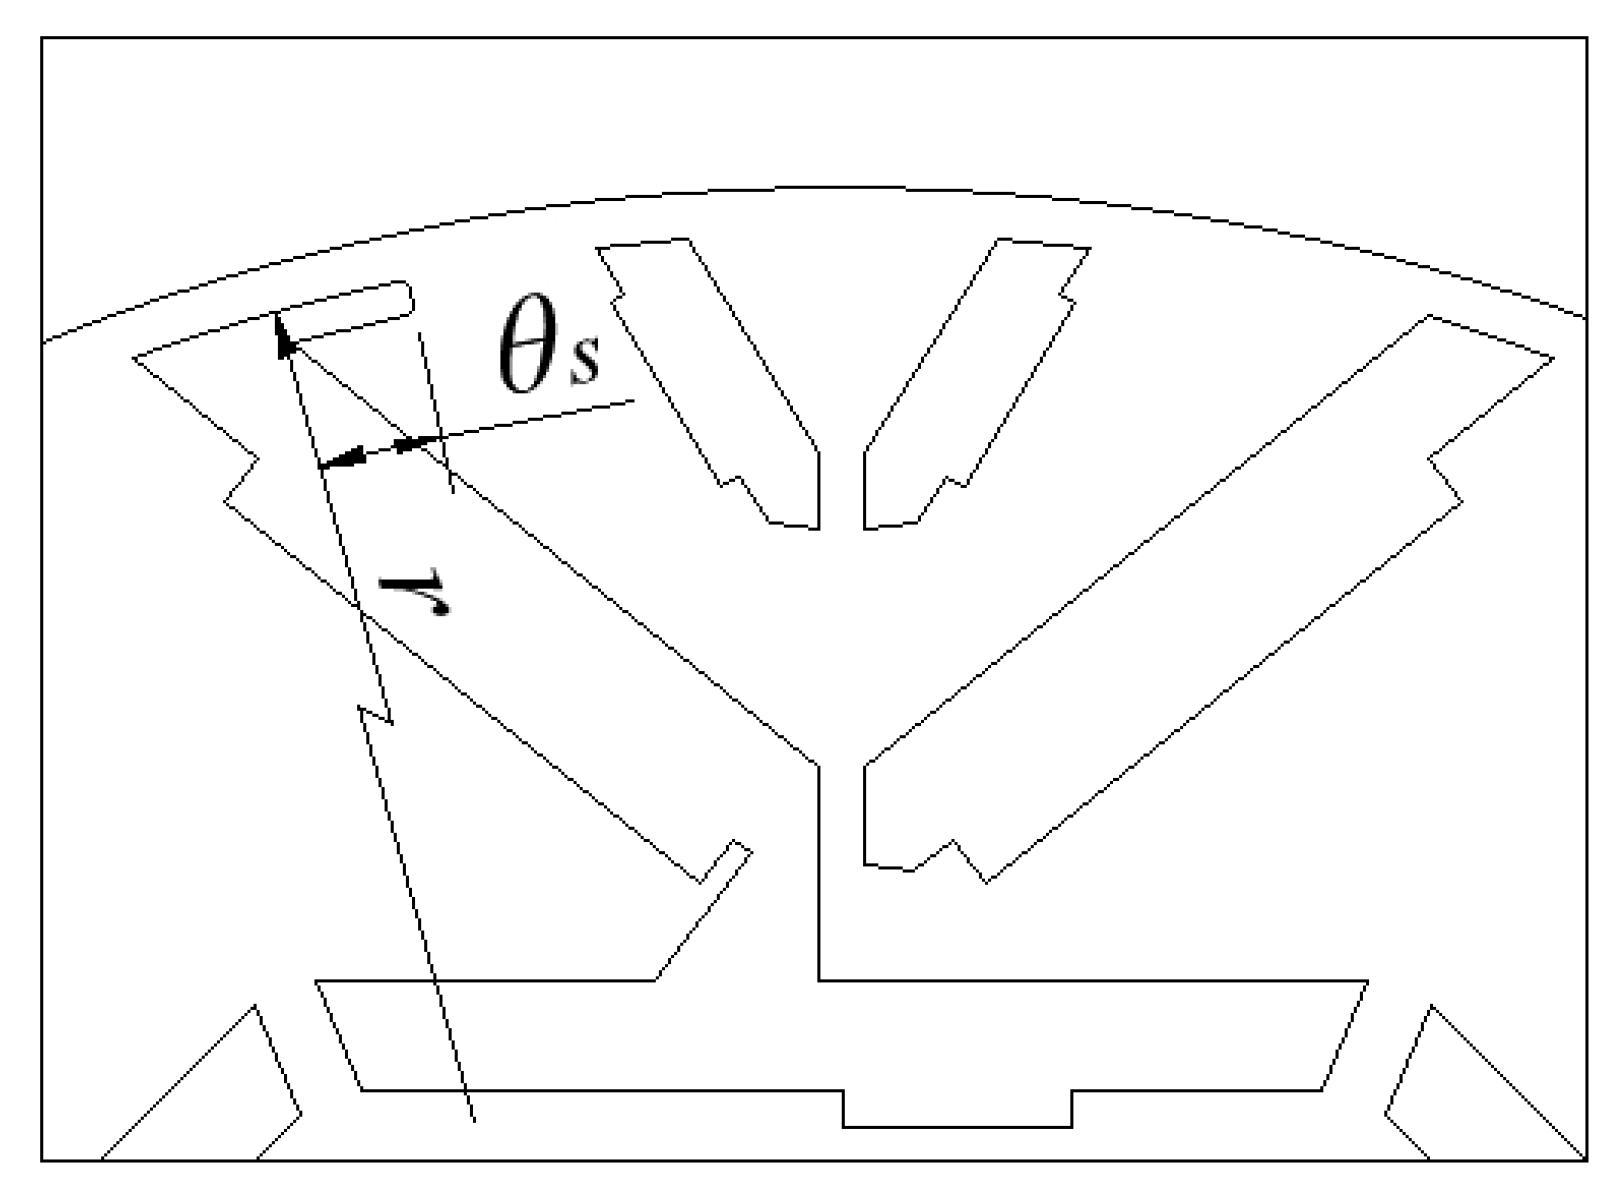
After dual-objective optimization combining sensitivity stratification and the Taguchi method, the fundamental amplitude and THD were improved, but further optimization was possible. By analyzing the structure, a method of adding flux barriers was proposed. The barrier location is shown in Figure 10.
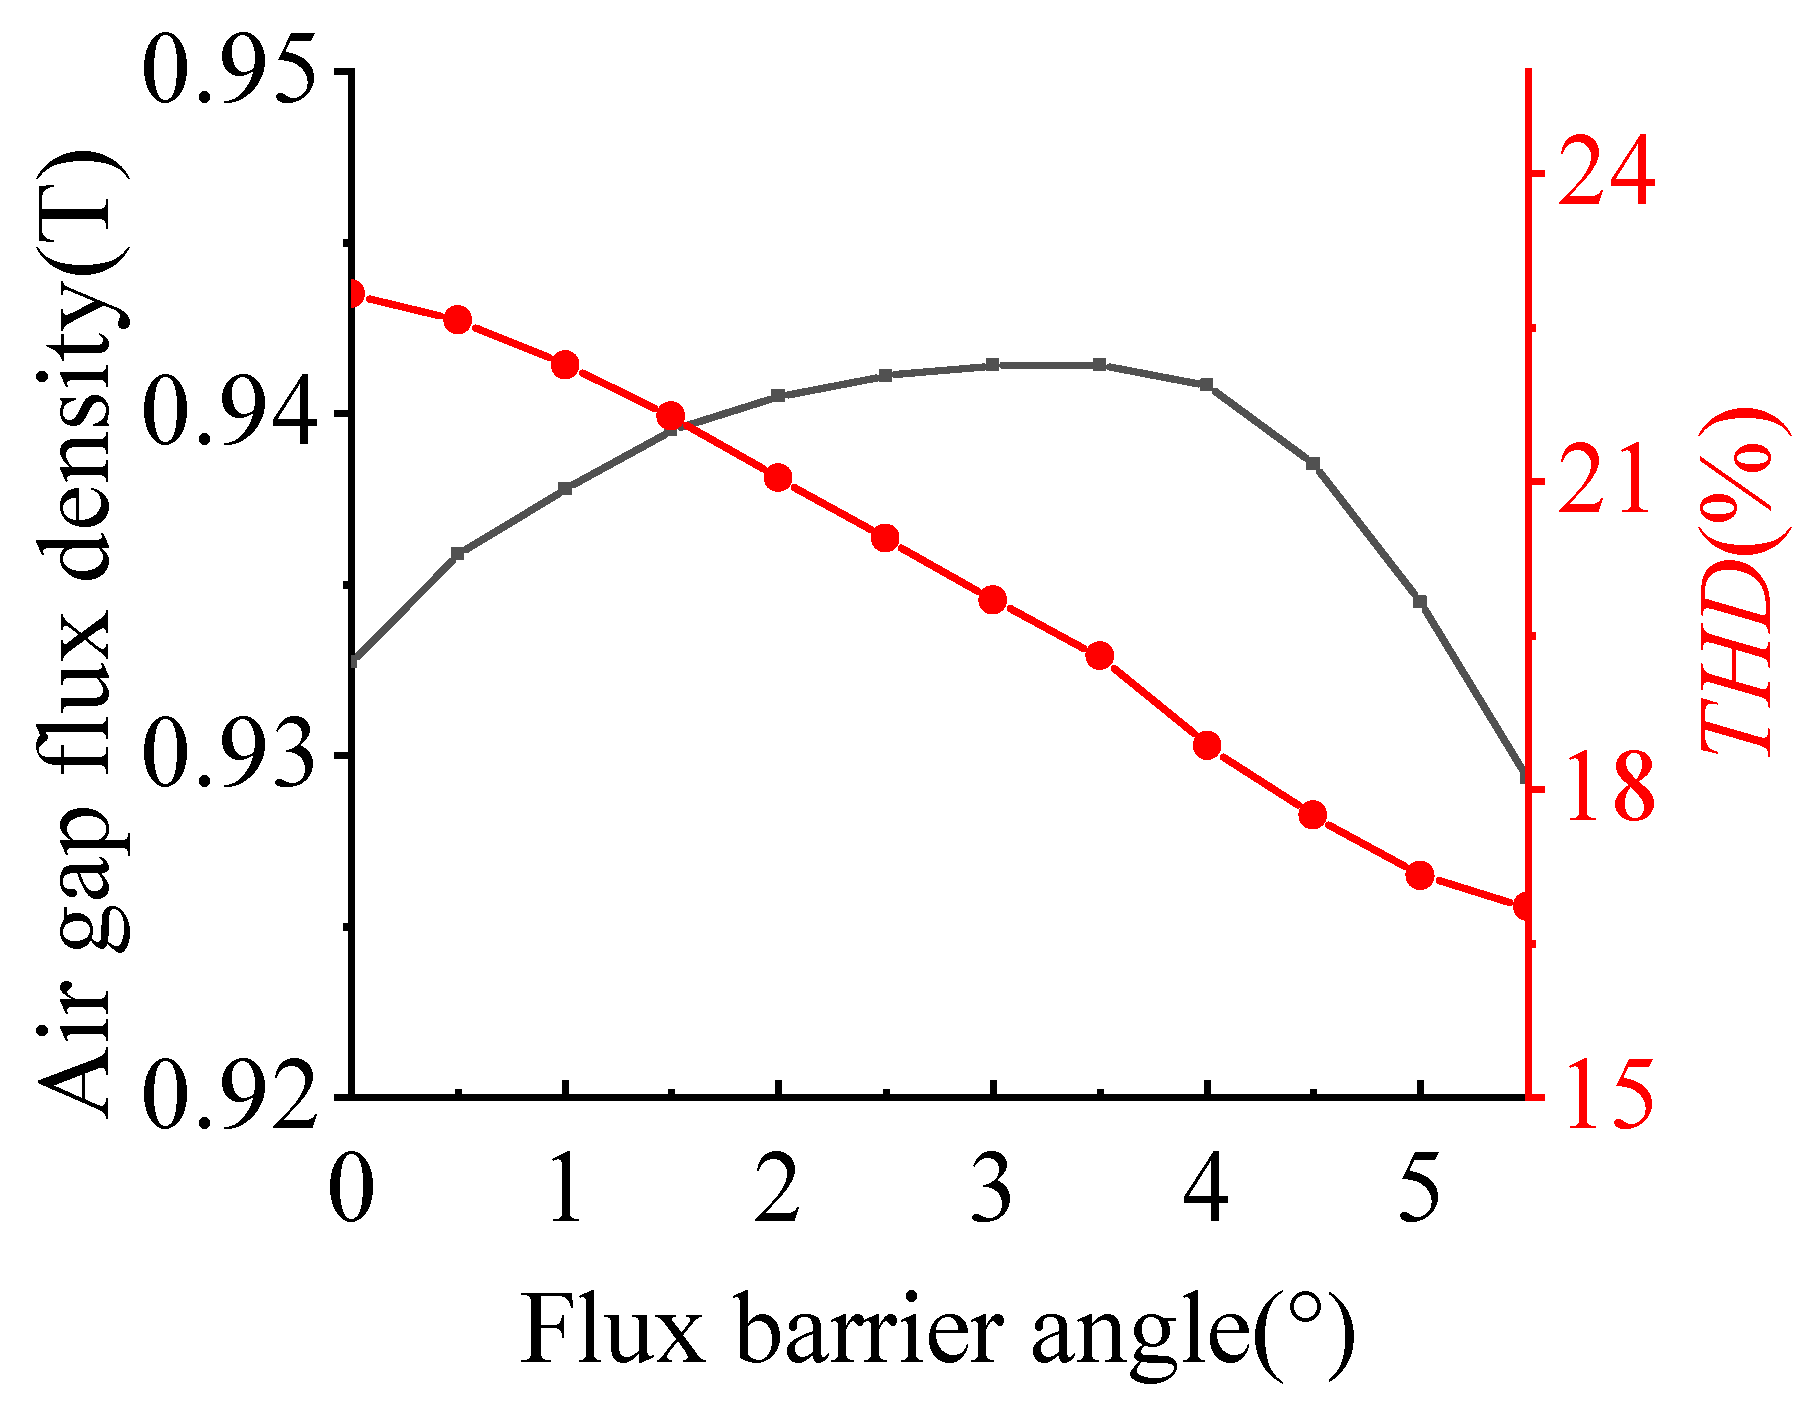
Scanning the barrier position parameter θ s yielded its influence on the objectives, as shown in Figure 11.
From Figure 11, it can be seen that as the flux barrier protrusion angle increases, the fundamental wave amplitude of the air gap flux density first increases and then decreases, reaching a maximum value between 3° and 4°. In contrast, the harmonic distortion rate of the air gap flux density continually decreases with the increase in the protrusion angle. Through comprehensive consideration, the optimal flux barrier protrusion angle is selected as 3.5°.
Drive PM motors typically require 2–3 times the overload capacity. Therefore, the demagnetization resistance of the combined pole motor under torque overload was analyzed [21,22,23]. Demagnetization simulation results at different loads are shown in Figure 12.
From Figure 12, under 3 × load, local demagnetization occurs in the first V-shaped PM. The minimum residual flux density is ~0.7 times the original value, with maximum demagnetization near the V-bottom magnetic bridge. As load increases, the demagnetized area and rate increase. Analysis shows the resultant field strength is stronger in the left half of the first V-PM, with a larger demagnetizing component. Increasing the PM thickness t1w in the magnetization direction enhances demagnetization resistance. Demagnetization recovery curves for the most vulnerable point under different t1w and loads are shown in Figure 13.
From Figure 13, increasing t1w improves demagnetization resistance. At t1w = 3.2 mm, the recovery curve at 4 × load reaches the inflection point, indicating resistance. At t1w = 3.6 mm, the curve at 5 × load exceeds the inflection point, providing resistance close to 5 × load. At 4.0 mm, resistance for 5 × load is achieved. Balancing demagnetization resistance and cost, t1w is selected as 3.6 mm.

4. Comparison of Electromagnetic Characteristics and Test

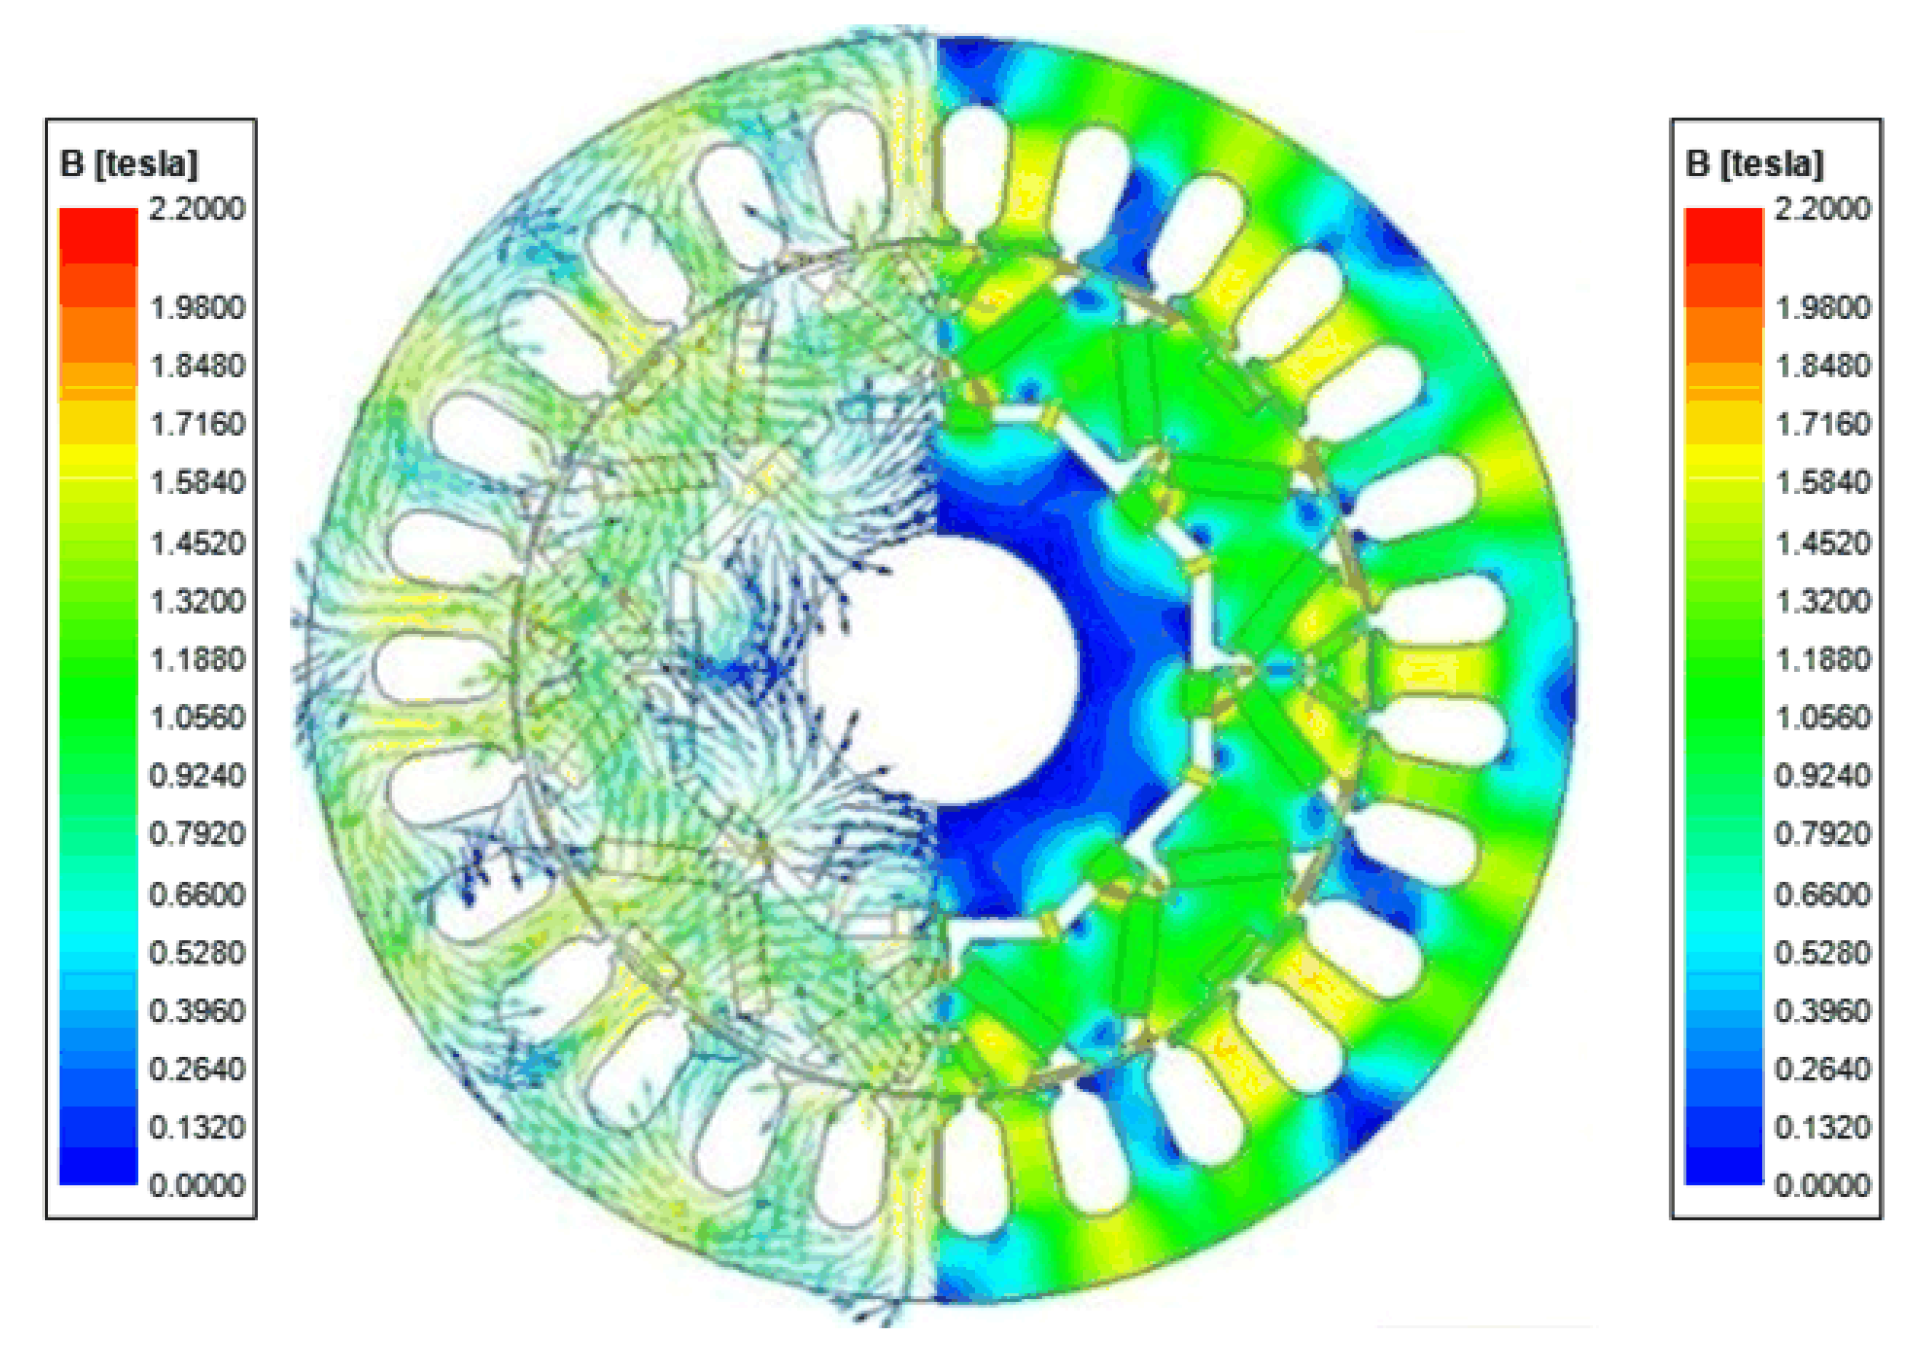
After optimization via sensitivity stratification and Taguchi method for high-sensitivity variables, the static magnetic field distribution of the motor is shown in Figure 14. The left side of the figure illustrates the magnetic field distribution within the motor’s stator and rotor, while the right side displays the magnetic density cloud map of various components of the stator and rotor.
From Figure 14, the areas with higher magnetic density in the motor are concentrated at the magnetic barriers at the ends of the permanent magnets and at the junctions between magnetic poles. The magnetic density at the magnetic barrier near the outer circumference of the rotor reaches 2.1 T, leading to magnetic saturation in that area, which indirectly restricts the path of the magnetic field. No magnetic saturation is observed anywhere in the stator, with the maximum magnetic density being around 1.5 T.
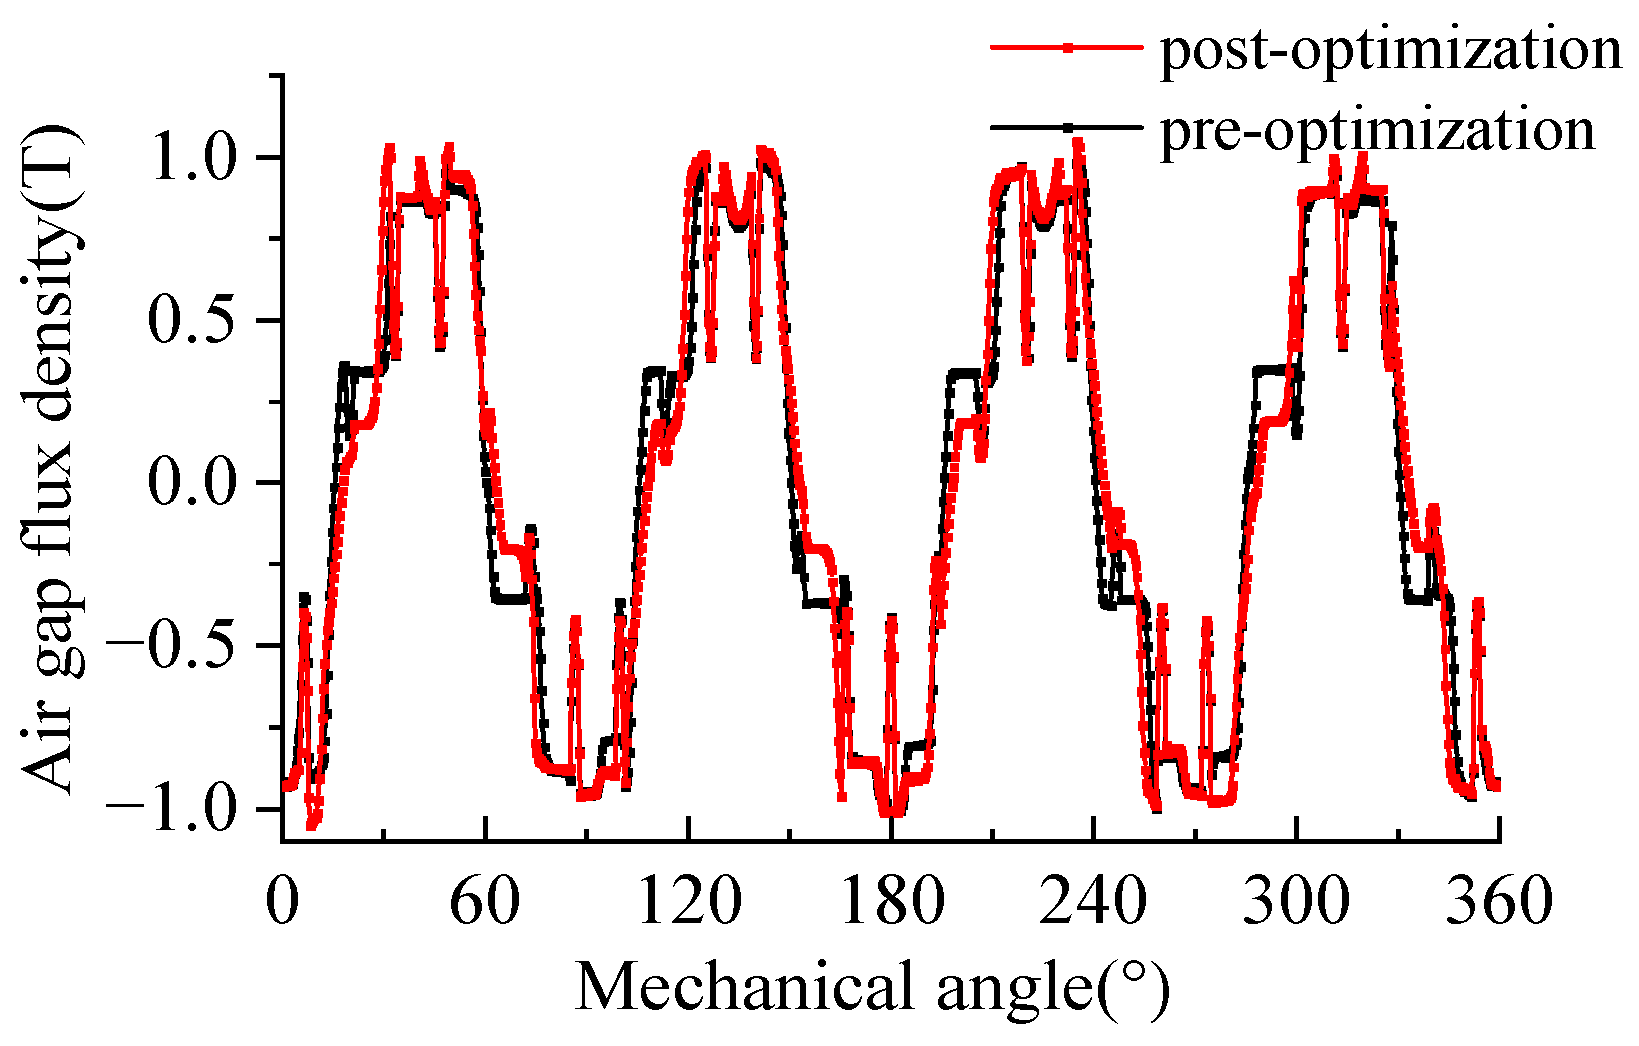
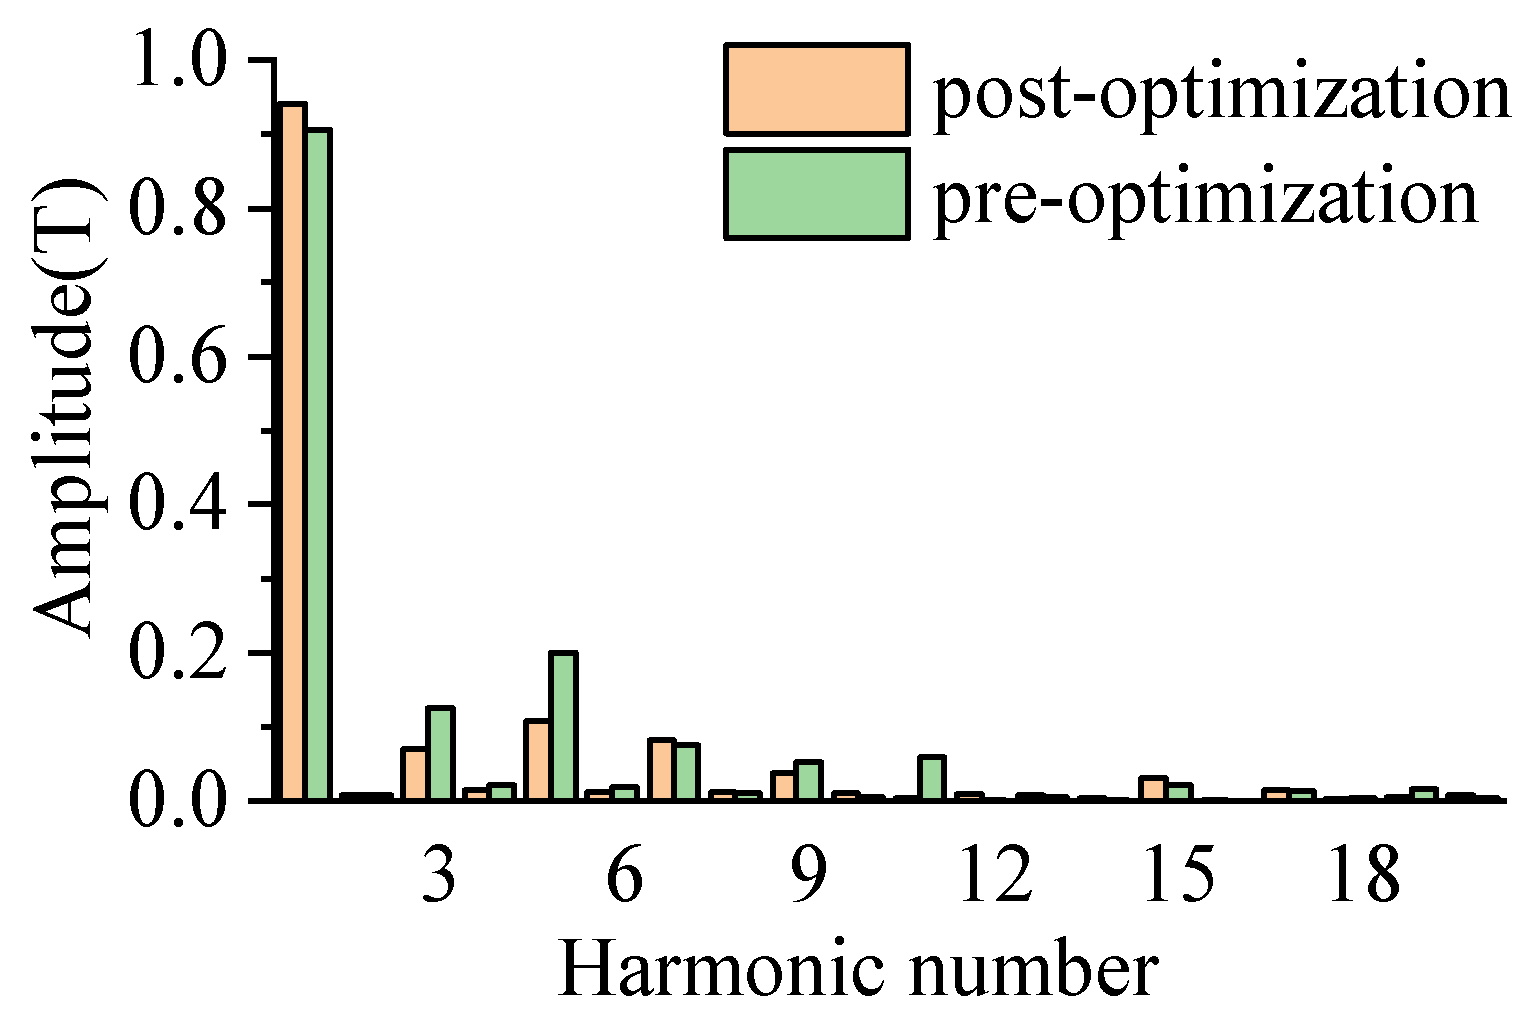
To evaluate the air gap flux density amplitude and its THD of the motor after optimization via sensitivity stratification and Taguchi method for high-sensitivity variables, a finite element simulation is used to establish the optimized model and compare it with the pre-optimization model. The comparison of air gap flux density waveforms pre- and post-optimization is shown in Figure 15, and the harmonic decomposition comparison of the air gap flux density is shown in Figure 16.
As shown in Figure 15 and Figure 16, the fundamental amplitude increased from 0.906 T to 0.941 T. The third-harmonic amplitude decreased slightly, the fifth decreased significantly, and the seventh remained largely unchanged. The THD dropped from 29.2% to 19.3%.
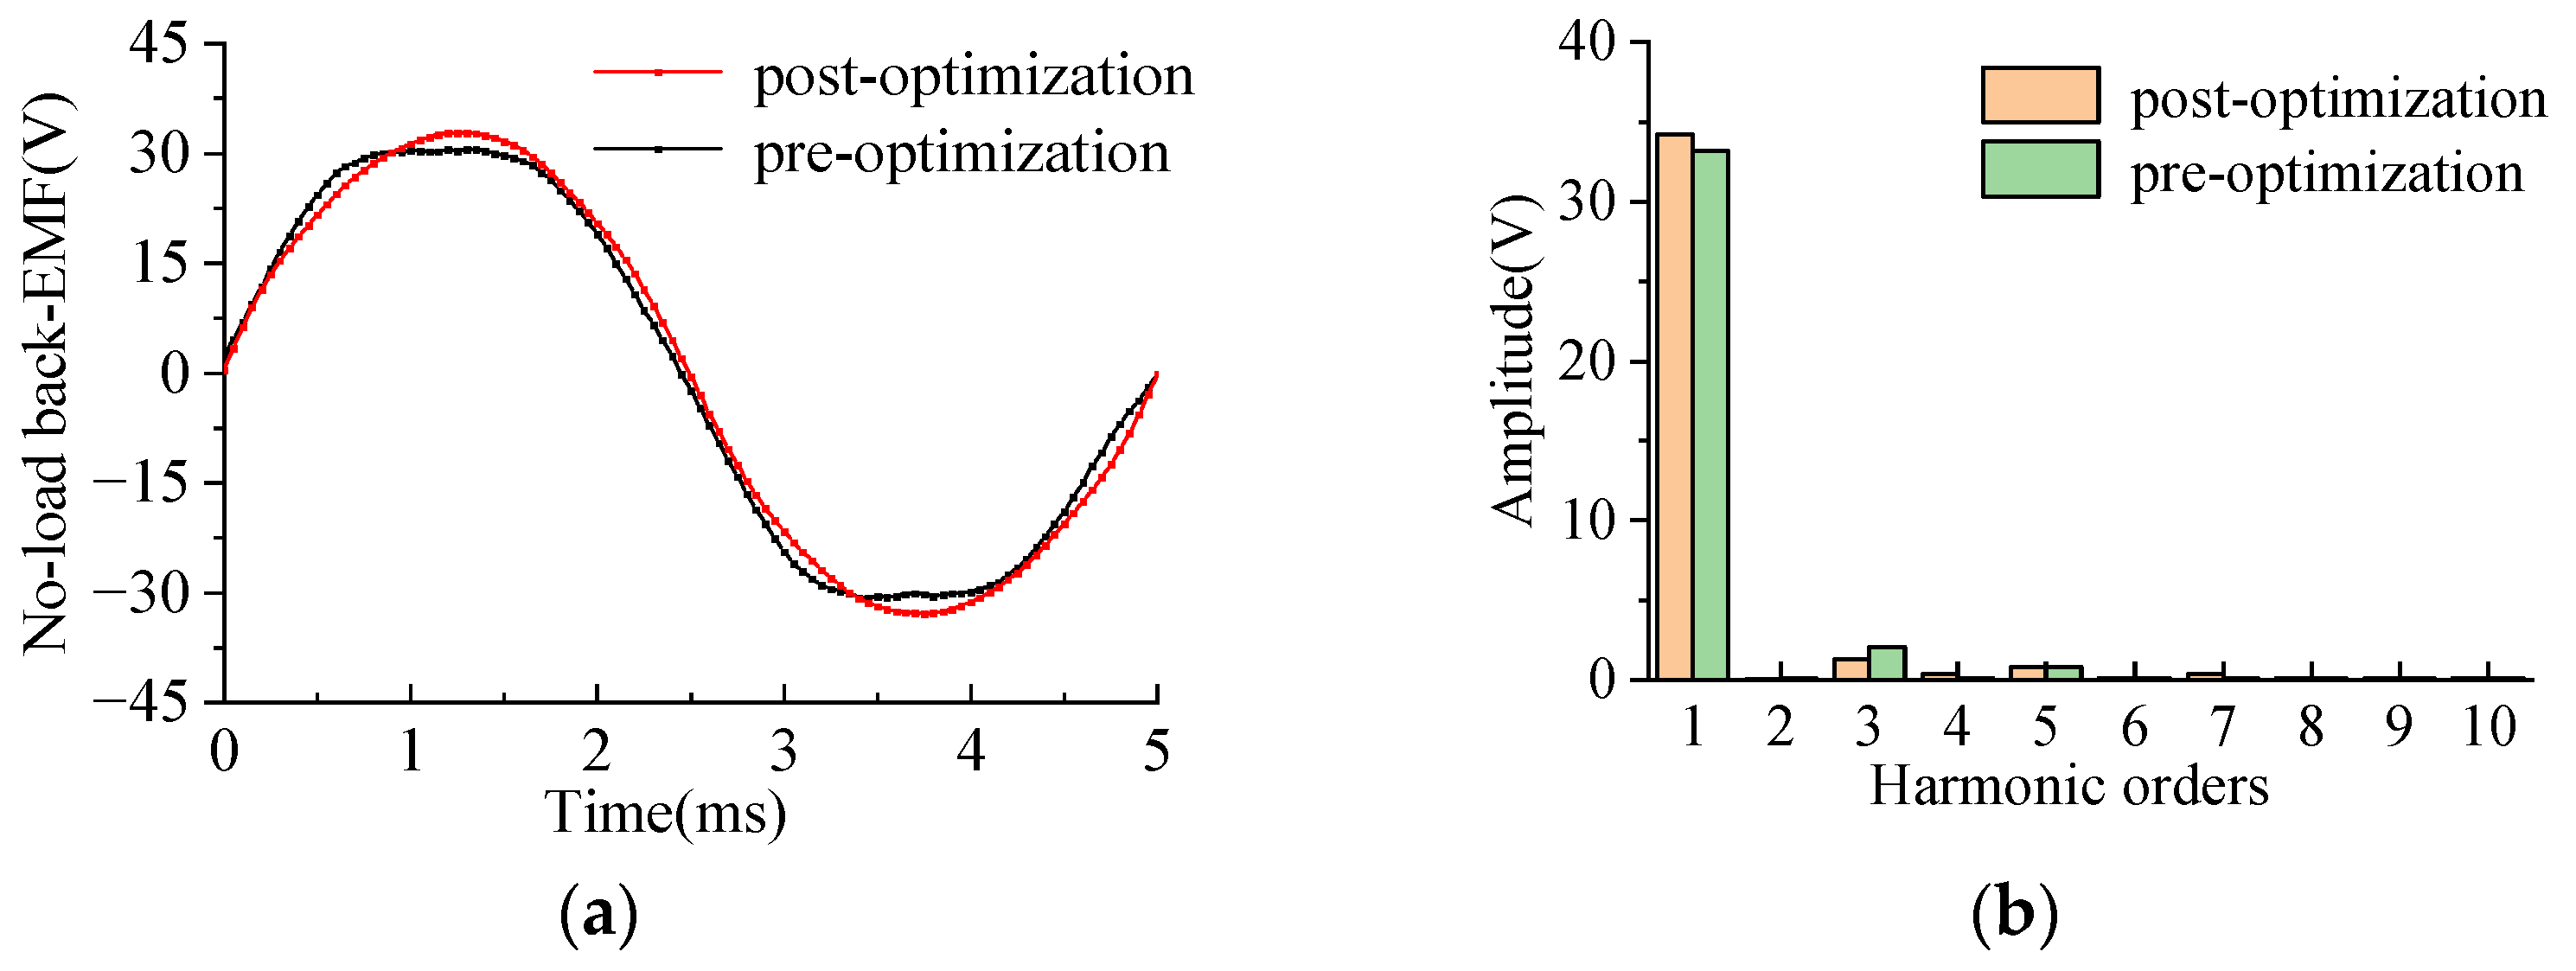
A comparative analysis of the no-load back electromotive force (back-EMF) and cogging torque was conducted. The back-EMF waveforms and harmonic distributions are shown in Figure 17a,b.
From Figure 17, the peak no-load back-EMF increased from 30.8 V to 33.2 V. The fundamental amplitude rose from 33.18 V to 34.21 V. The third harmonic decreased from 2.0 V to 1.3 V, while the fifth remained similar. The back-EMF THD reduced from 6.57% to 4.76%. The optimized back-EMF exhibits improved sinusoidal characteristics, enhancing control performance.
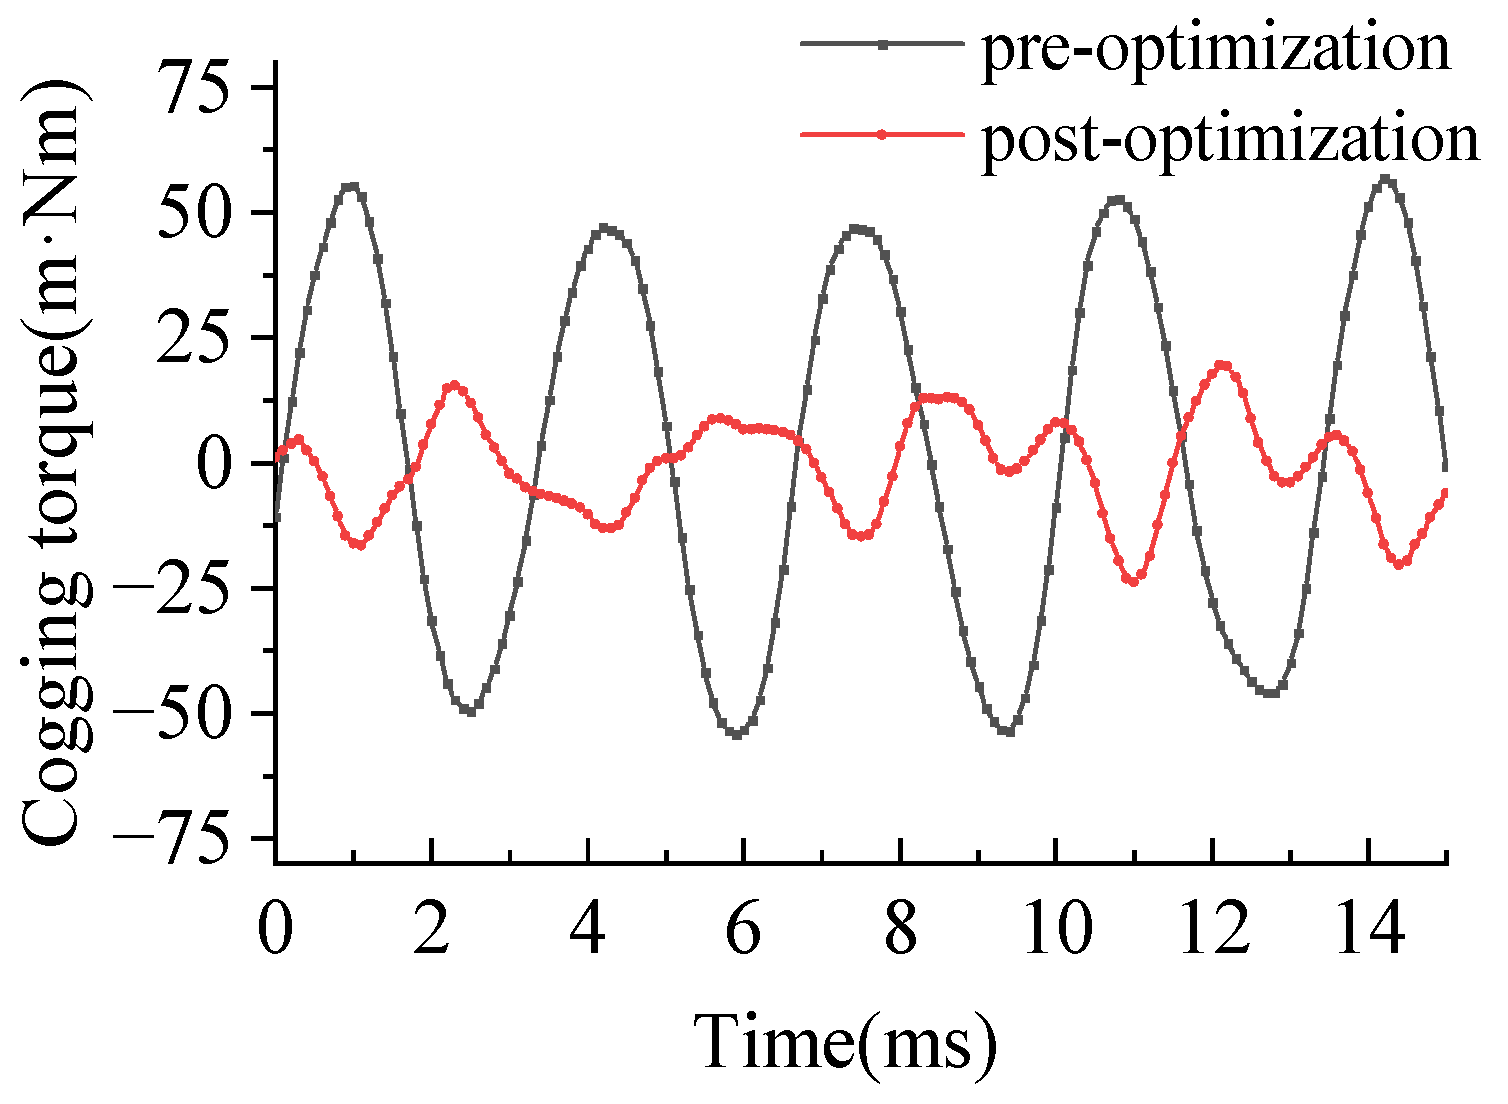
The cogging torque curves are compared in Figure 18.
The peak-to-peak cogging torque decreased from 111.3 mN·m to 46.0 mN·m. The optimized cogging torque was significantly reduced, minimizing output torque ripple and reducing vibration and noise.
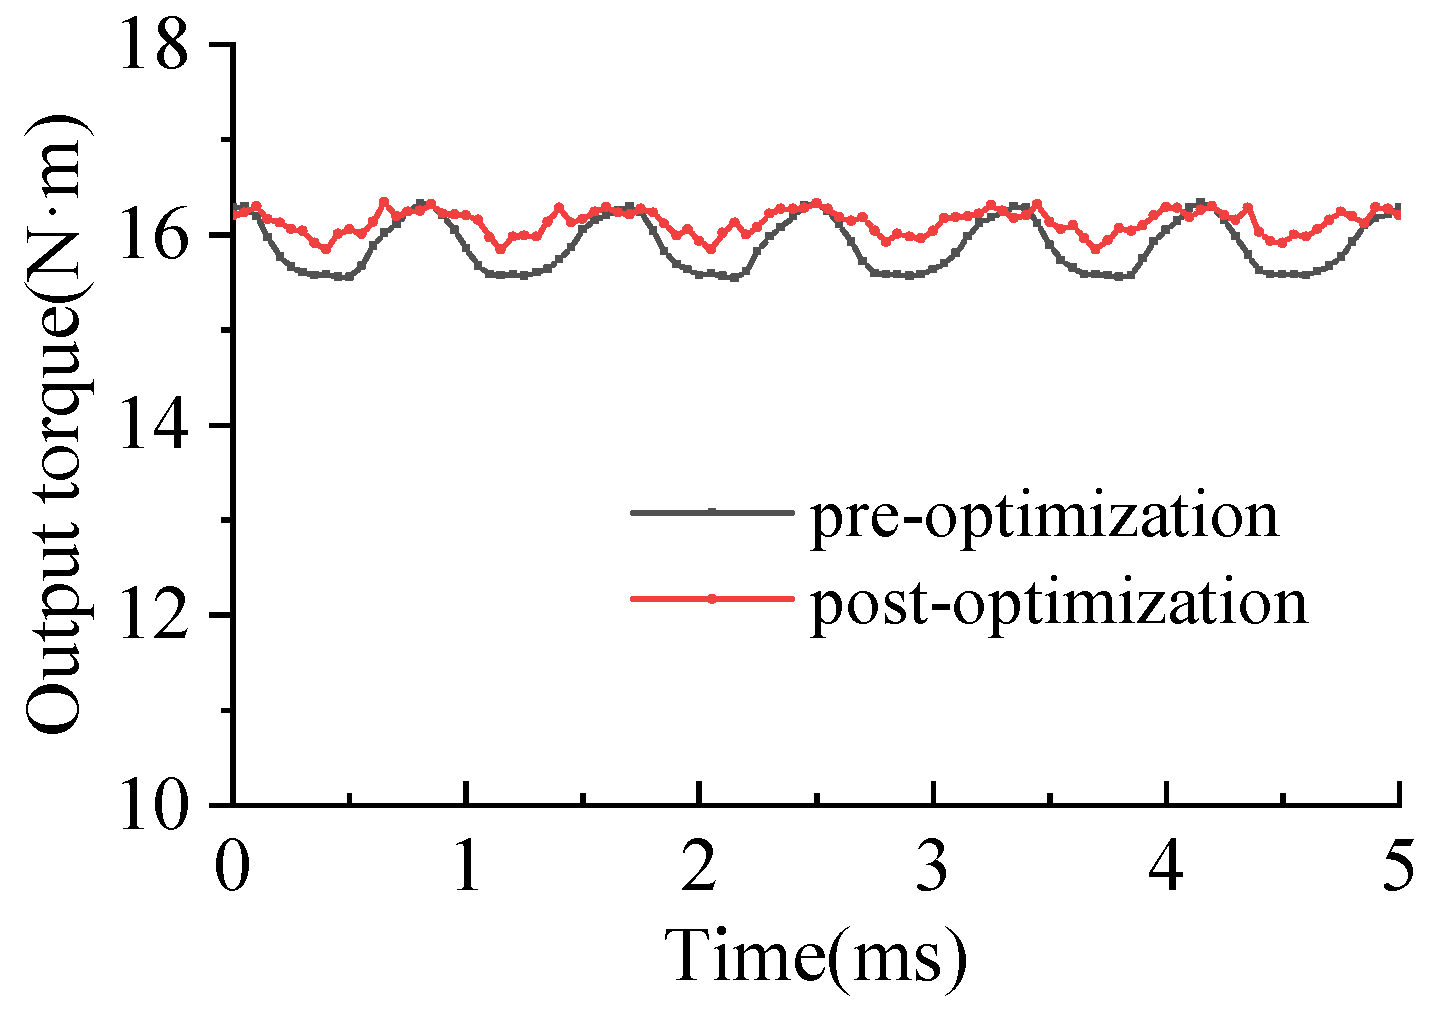
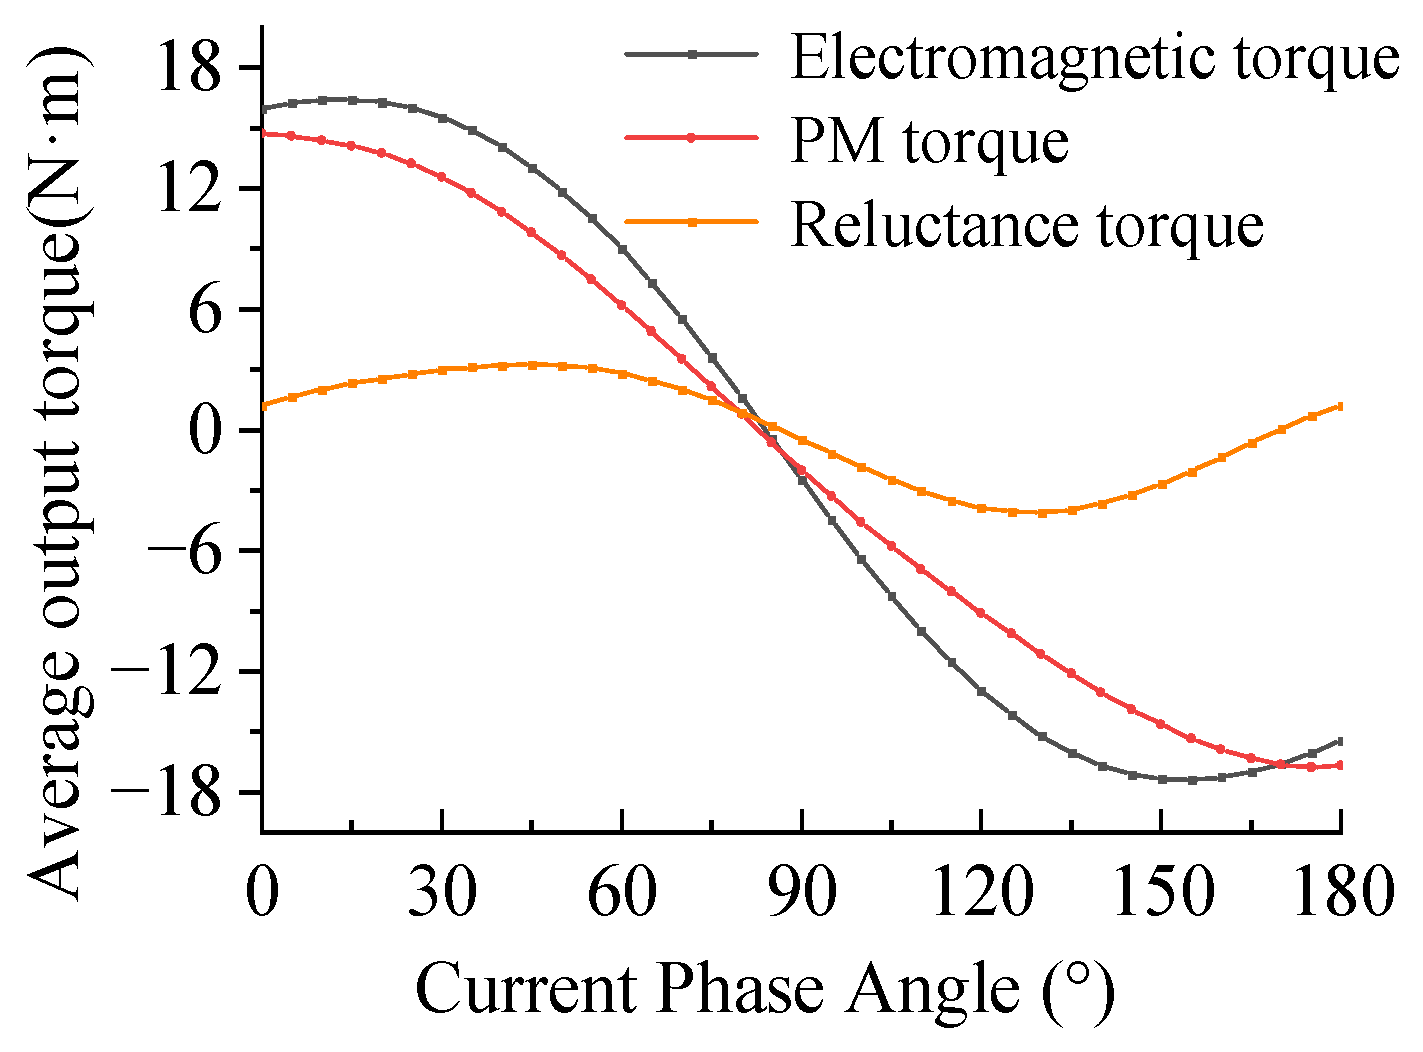
Output torque is critical for drive motors. Torque under rated conditions pre- and post-optimization is shown in Figure 19. Due to unequal d-q axis inductances, the output torque includes a reluctance component. The composition of average output torque at rated phase current and different current phase angles is shown in Figure 20.
As shown in Figure 19, the average output torque increased from 15.8 N·m to 16.2 N·m, and torque ripple decreased from 5.0% to 3.1%, indicating superior output characteristics.
The unipolar asymmetry of the rotor permanent magnets and the positioning design of magnetic isolation barriers create asymmetric d-q axis magnetic paths. Consequently, as shown in Figure 20, the reluctance torque at zero current phase angle is non-zero. The reluctance torque curve exhibits an 8° leftward shift compared to conventional unipolar symmetric designs. The current phase angle for maximum torque is smaller than in symmetrically poled motors, which reduces d-axis demagnetization current and mitigates irreversible demagnetization risks in PMs.
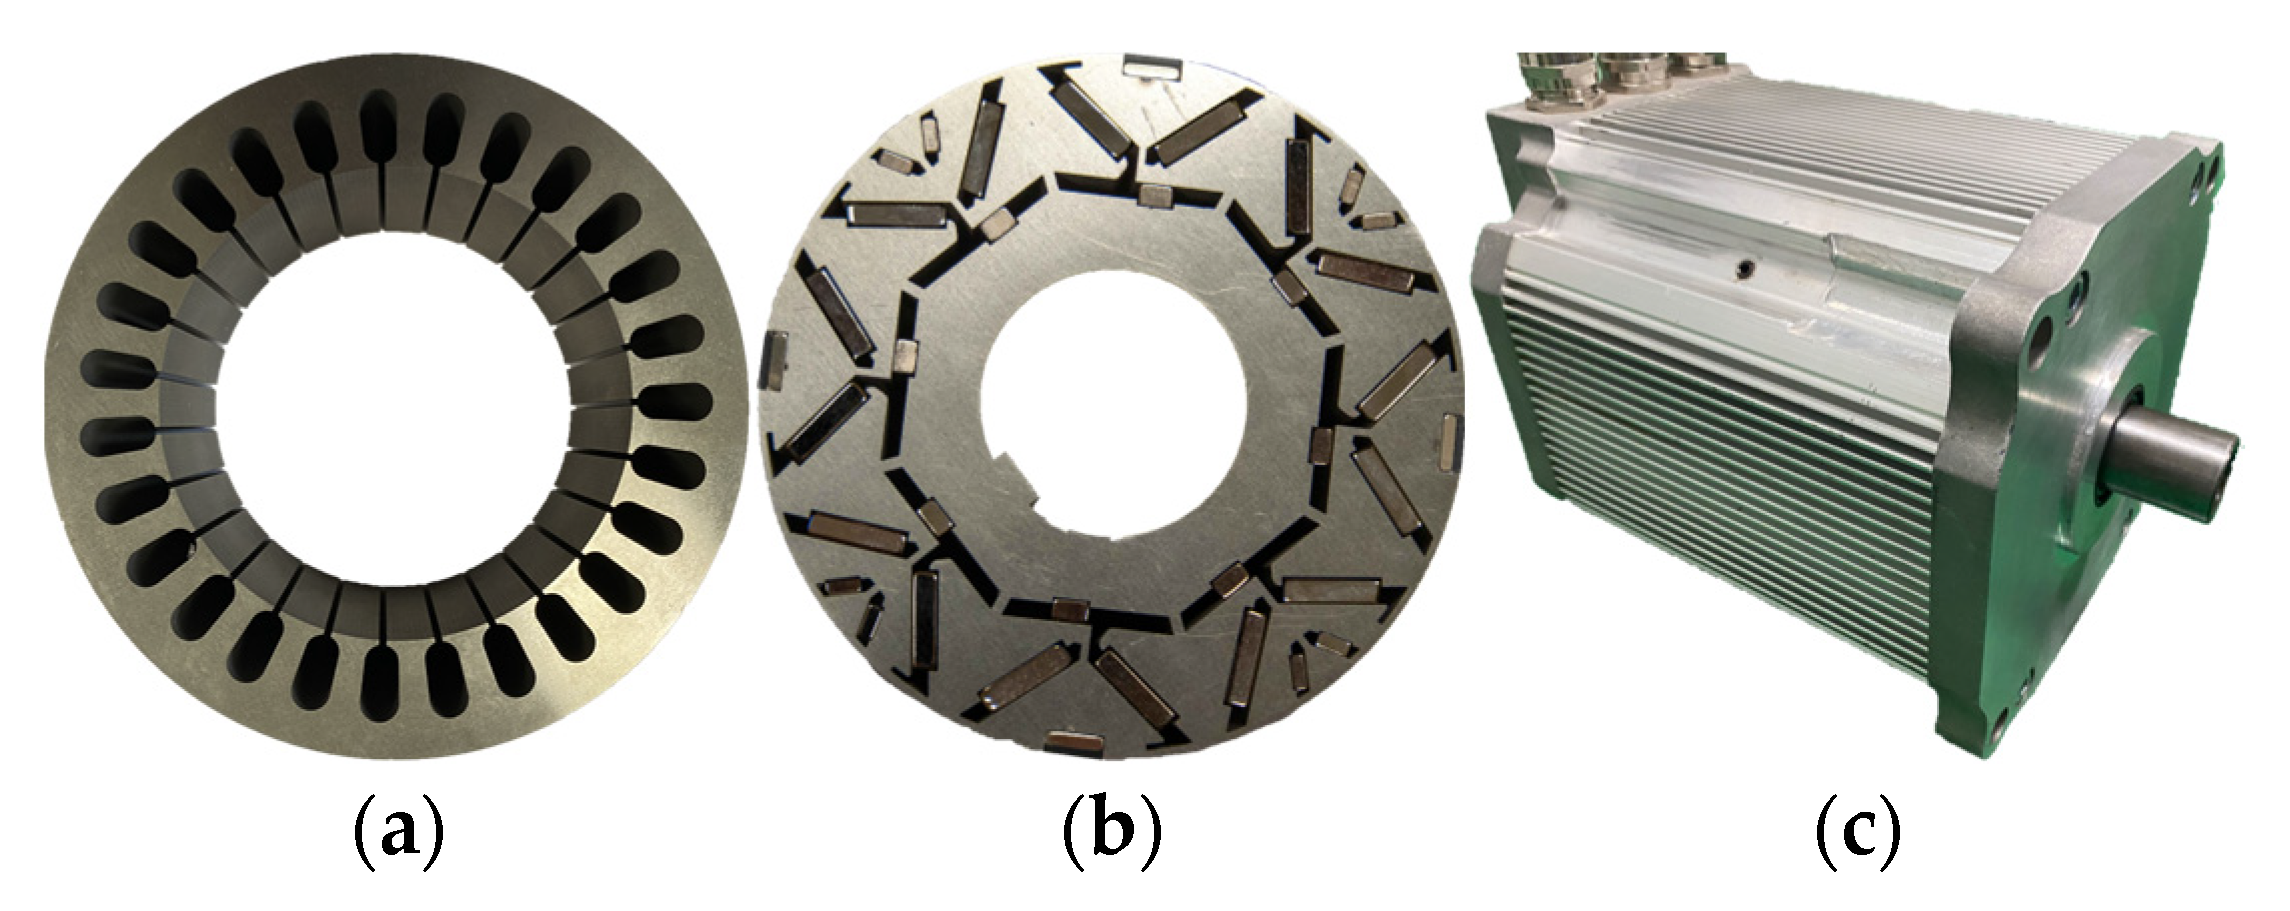
Based on the optimized dimensions, a 5 kW, 72 V, 3000 r/min, 3-phase, 8-pole, 27-slot combined pole drive motor was prototyped. Physical diagrams of the stator, rotor, and prototype are shown in Figure 21.

4.1. The Cogging Torque Test

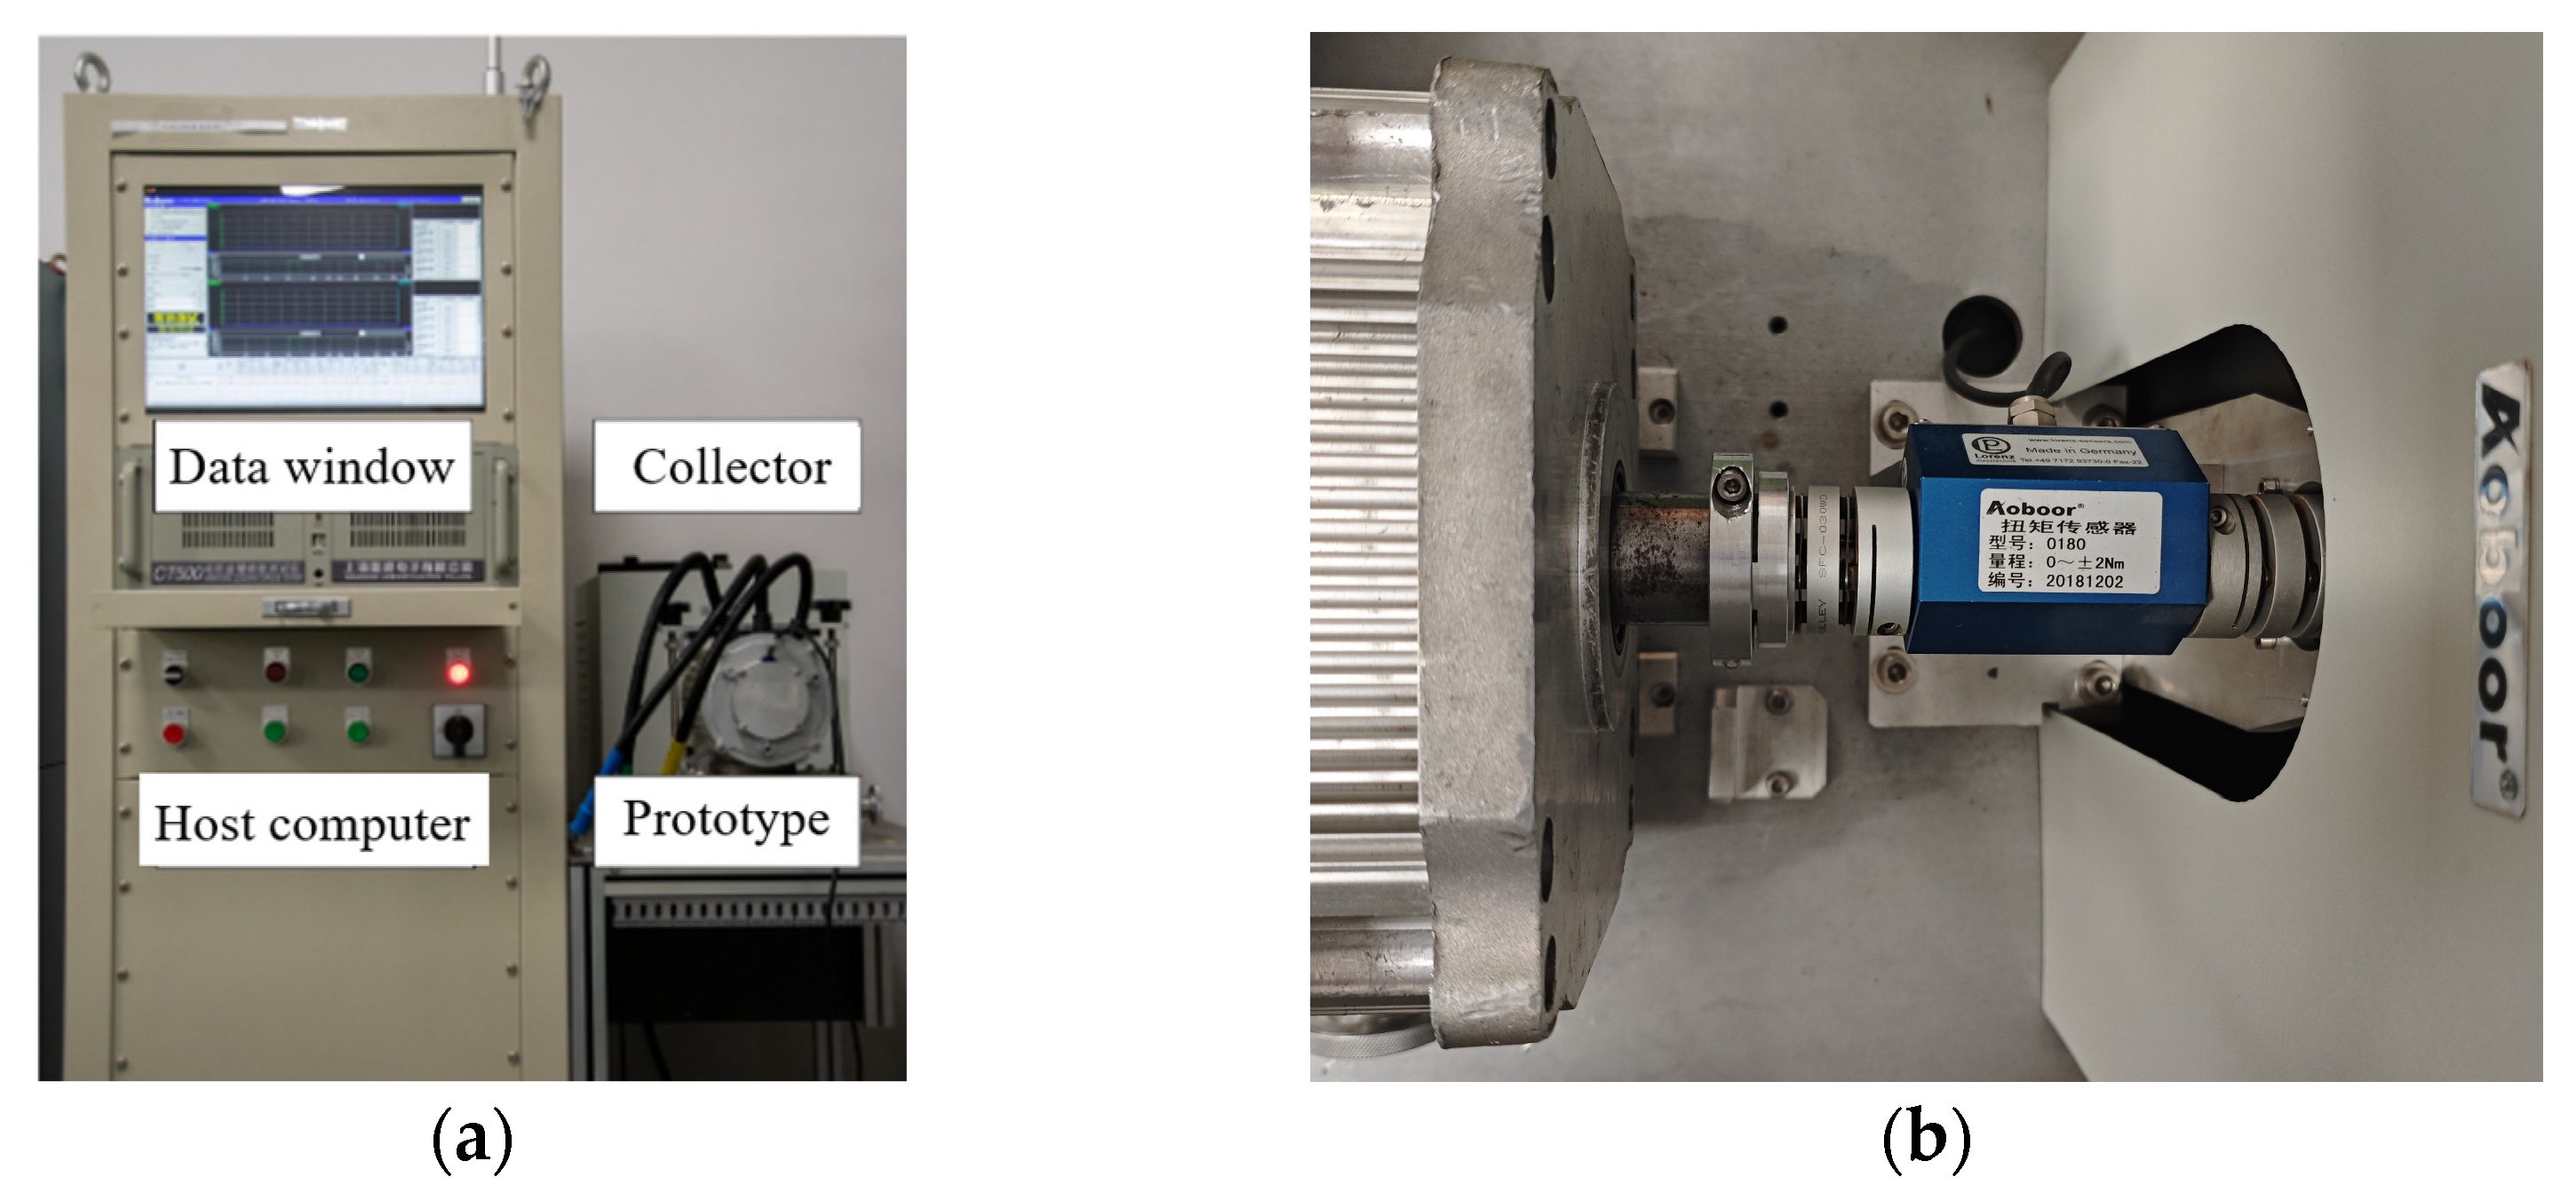
The cogging torque of the combined magnetic pole drive motor was tested using the CT500-type cogging torque meter. During the test, the prototype is coaxially mounted with the sensor, and the tester drives the prototype to rotate. The testing equipment adopts adaptive separation technology and signal feature amplification technology, which can extract the cogging torque signal from the frictional torque and inertial torque. The test steps are as follows: calibration and zero adjustment, installation of the tested motor, adjustment of coaxiality, fixation and locking, forward and reverse rotation of the motor, and obtaining cogging torque data by using the upper computer. The cogging torque test platform of the combined magnetic pole motor is shown in Figure 22.
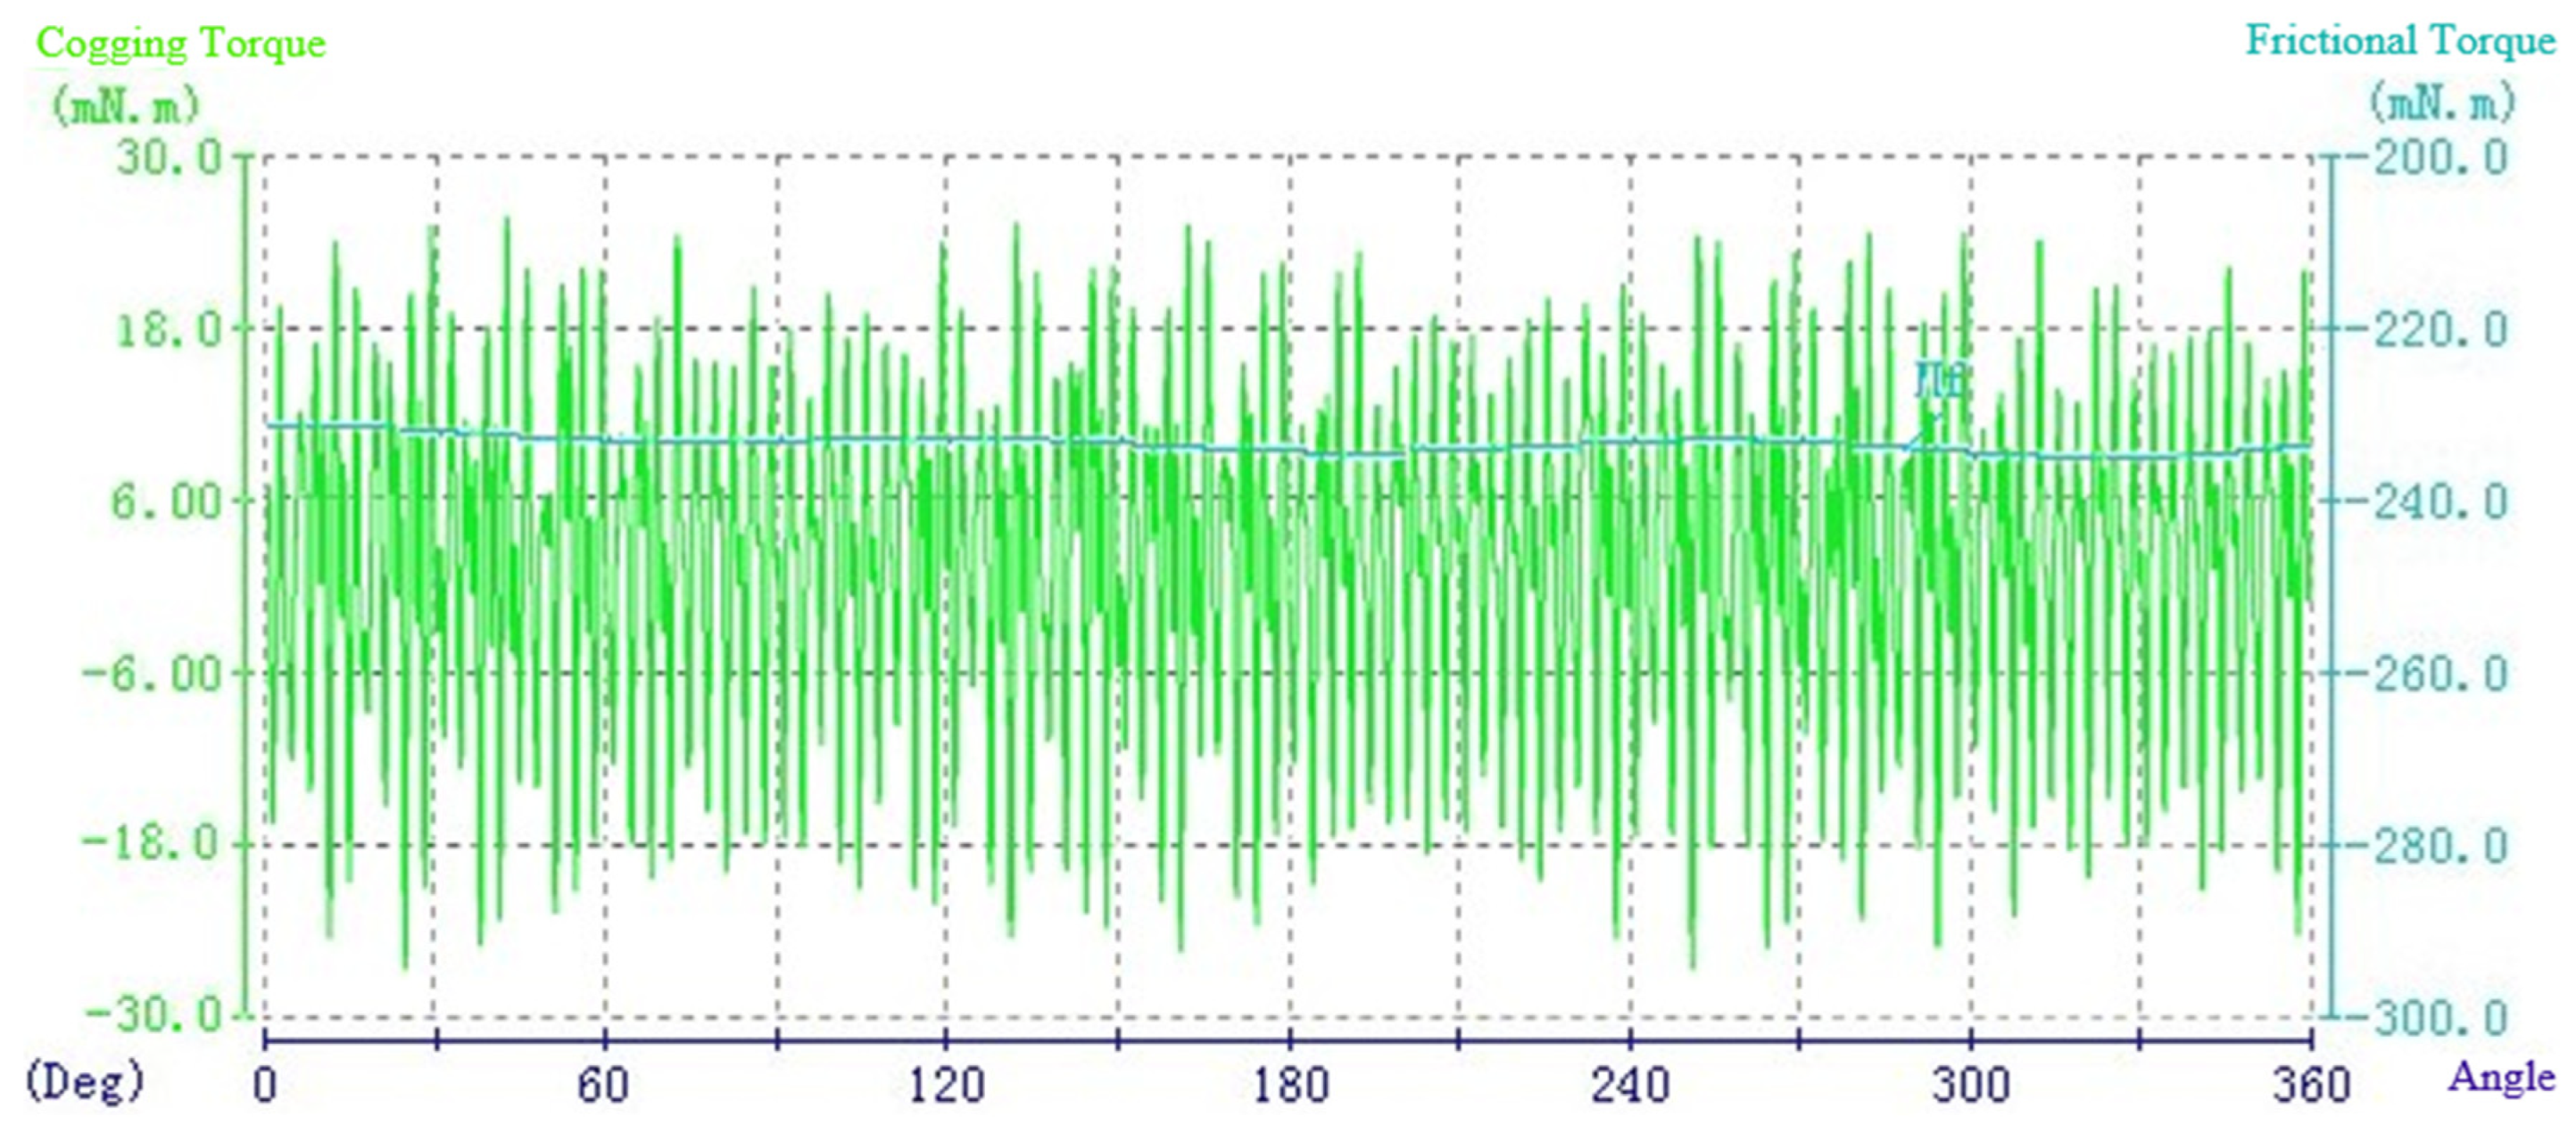
The measured cogging torque curve is shown in Figure 23.
Figure 23 illustrates the relationship between the cogging torque and the corresponding fractional torque of the motor as a function of rotor angle during operation. The green waveform in the graph represents the cogging torque, and the blue waveform represents the fractional torque. From the graph, it can be observed that the peak-to-peak difference of the measured cogging torque is approximately 54 mNm, slightly higher than the results from simulation analysis. This might be due to reasons such as the smaller peak-to-peak difference of cogging torque for the 8-pole 27-slot structure, excessive number of cycles, or lower testing accuracy.

4.2. No-Load Back Electromotive Force Test

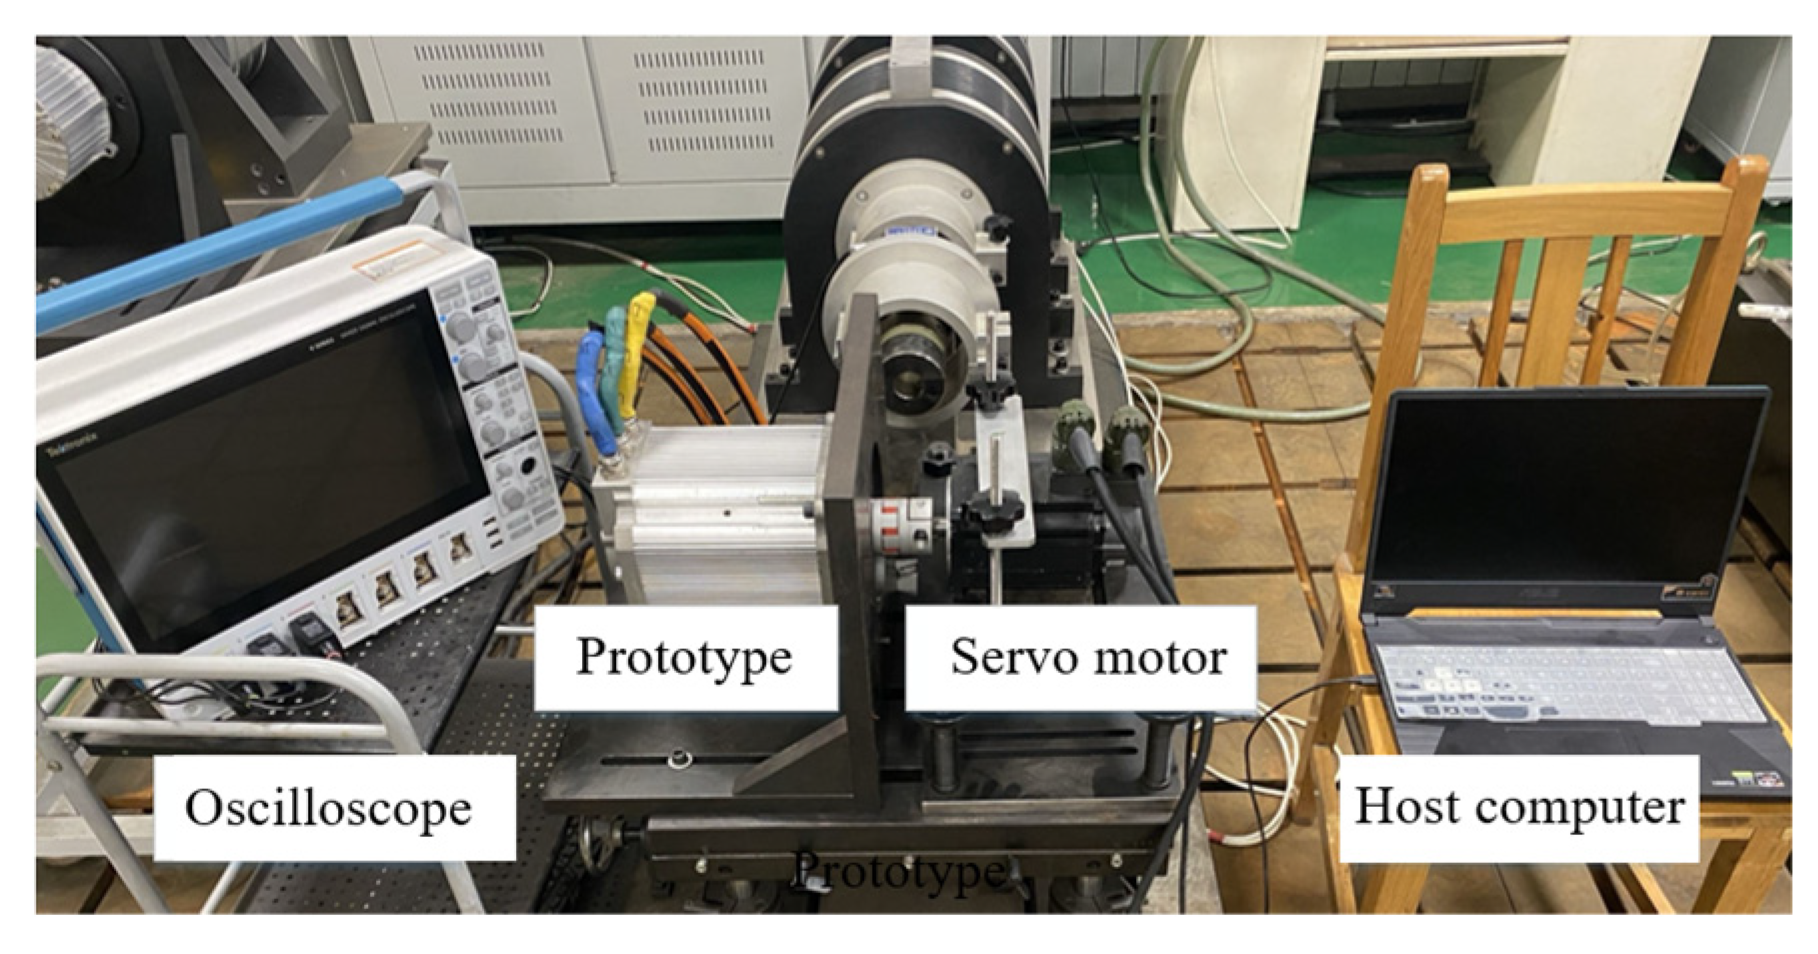
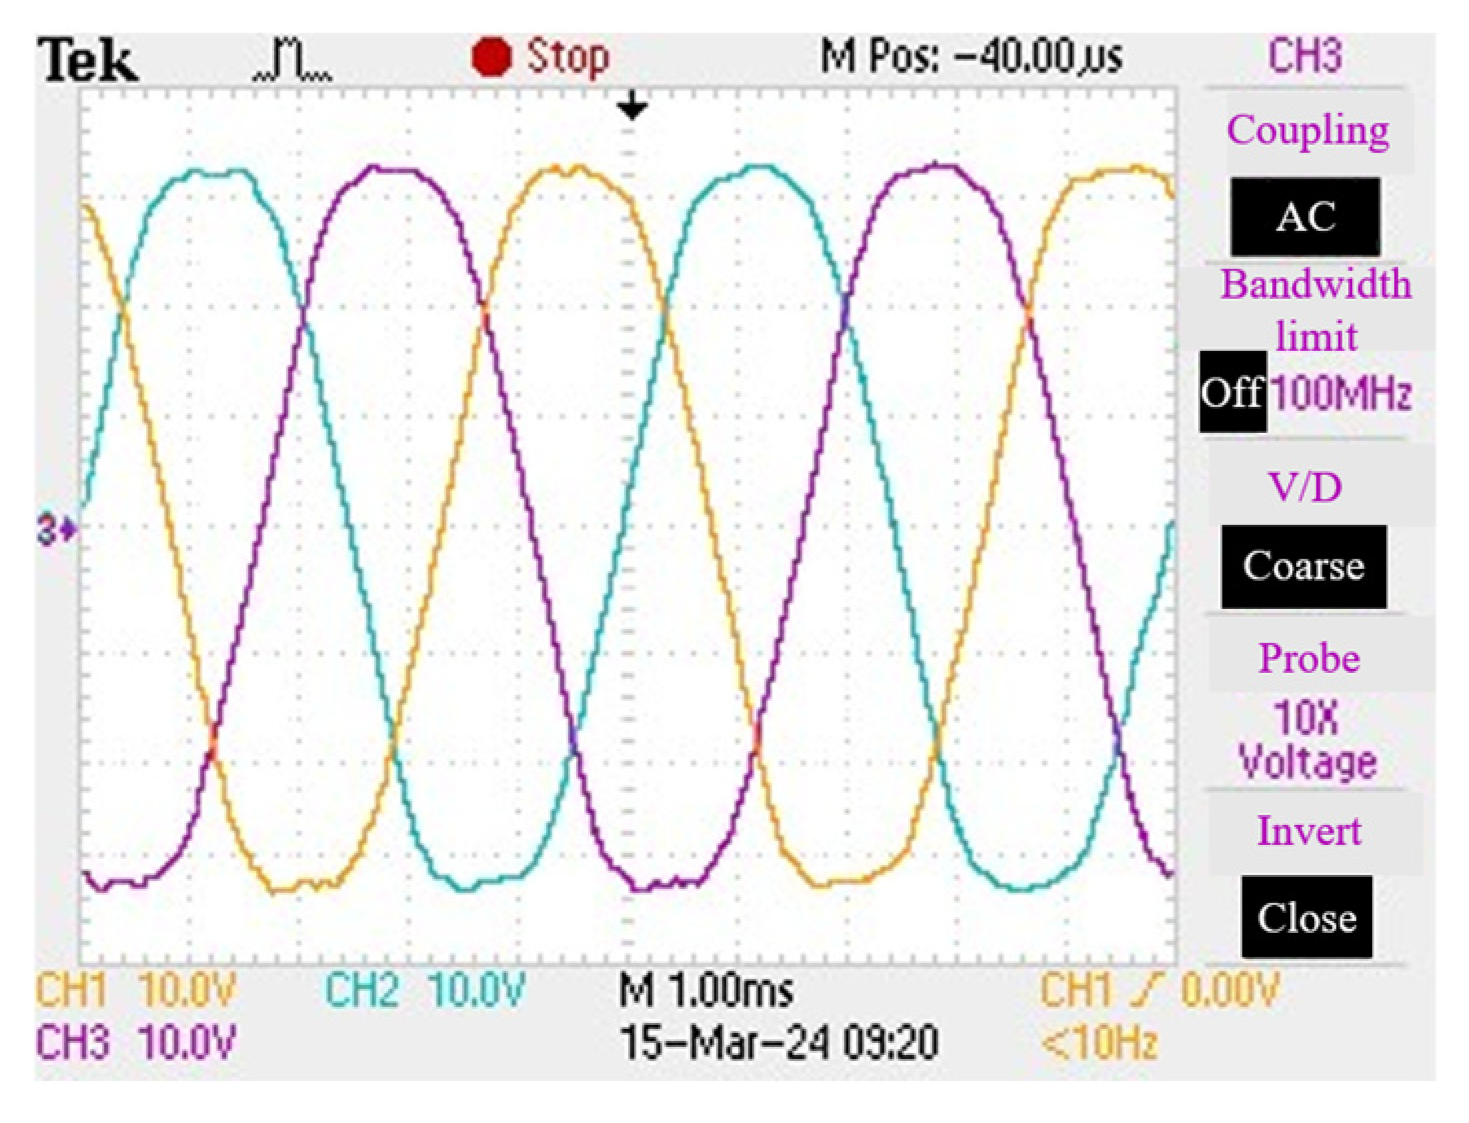
The no-load back-EMF test for the prototype is performed using the drag method. During the experiment, a servo motor with a rated speed of 3000 r/min and a rated torque of 6.5 N·m is employed as the power source. The prototype under test and the servo motor are coaxially installed and fixed separately. The three-phase winding terminals of the prototype are directly connected to an oscilloscope, whose data output end is linked to the upper computer. The prototype is driven to rotate by the servo motor. The no-load back-EMF test platform for the combined magnetic pole drive motor is shown in Figure 24, and the no-load back-EMF waveform of the motor at the rated speed is illustrated in Figure 25.
From Figure 25, it can be seen that the maximum value of the three-phase no-load back-EMF is approximately 32 V, slightly lower than the 33.2 V obtained from the simulation analysis. Fourier analysis of the experimentally obtained no-load back-EMF curve yields a THD of 4.81%, which may be attributed to a larger magnetic leakage of the PMs caused by machining errors than that considered in the simulation. The experimental results are generally consistent with the finite element analysis results, verifying the rationality of the previous analysis.

4.3. Output Characteristic Test

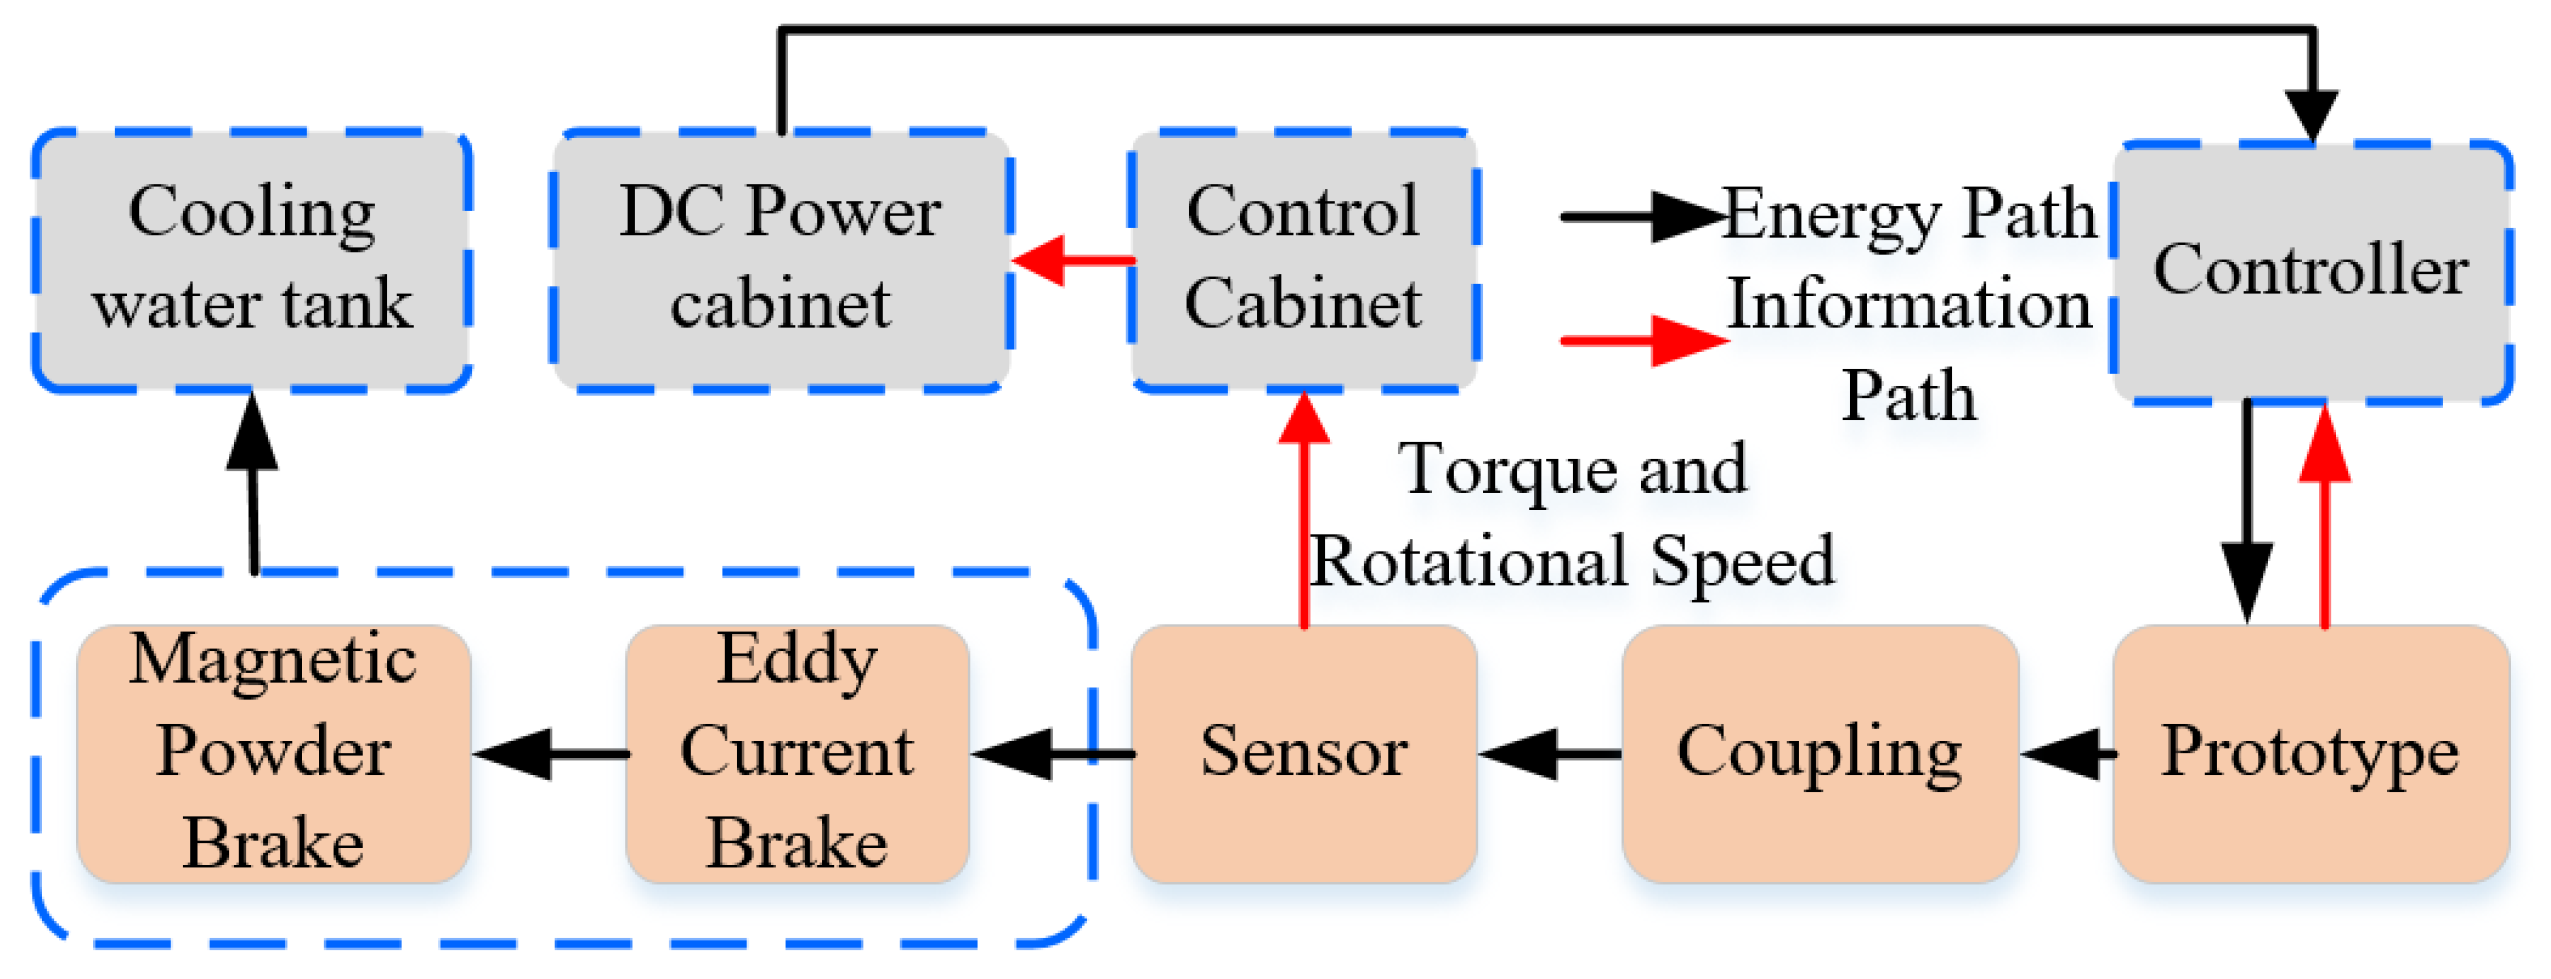
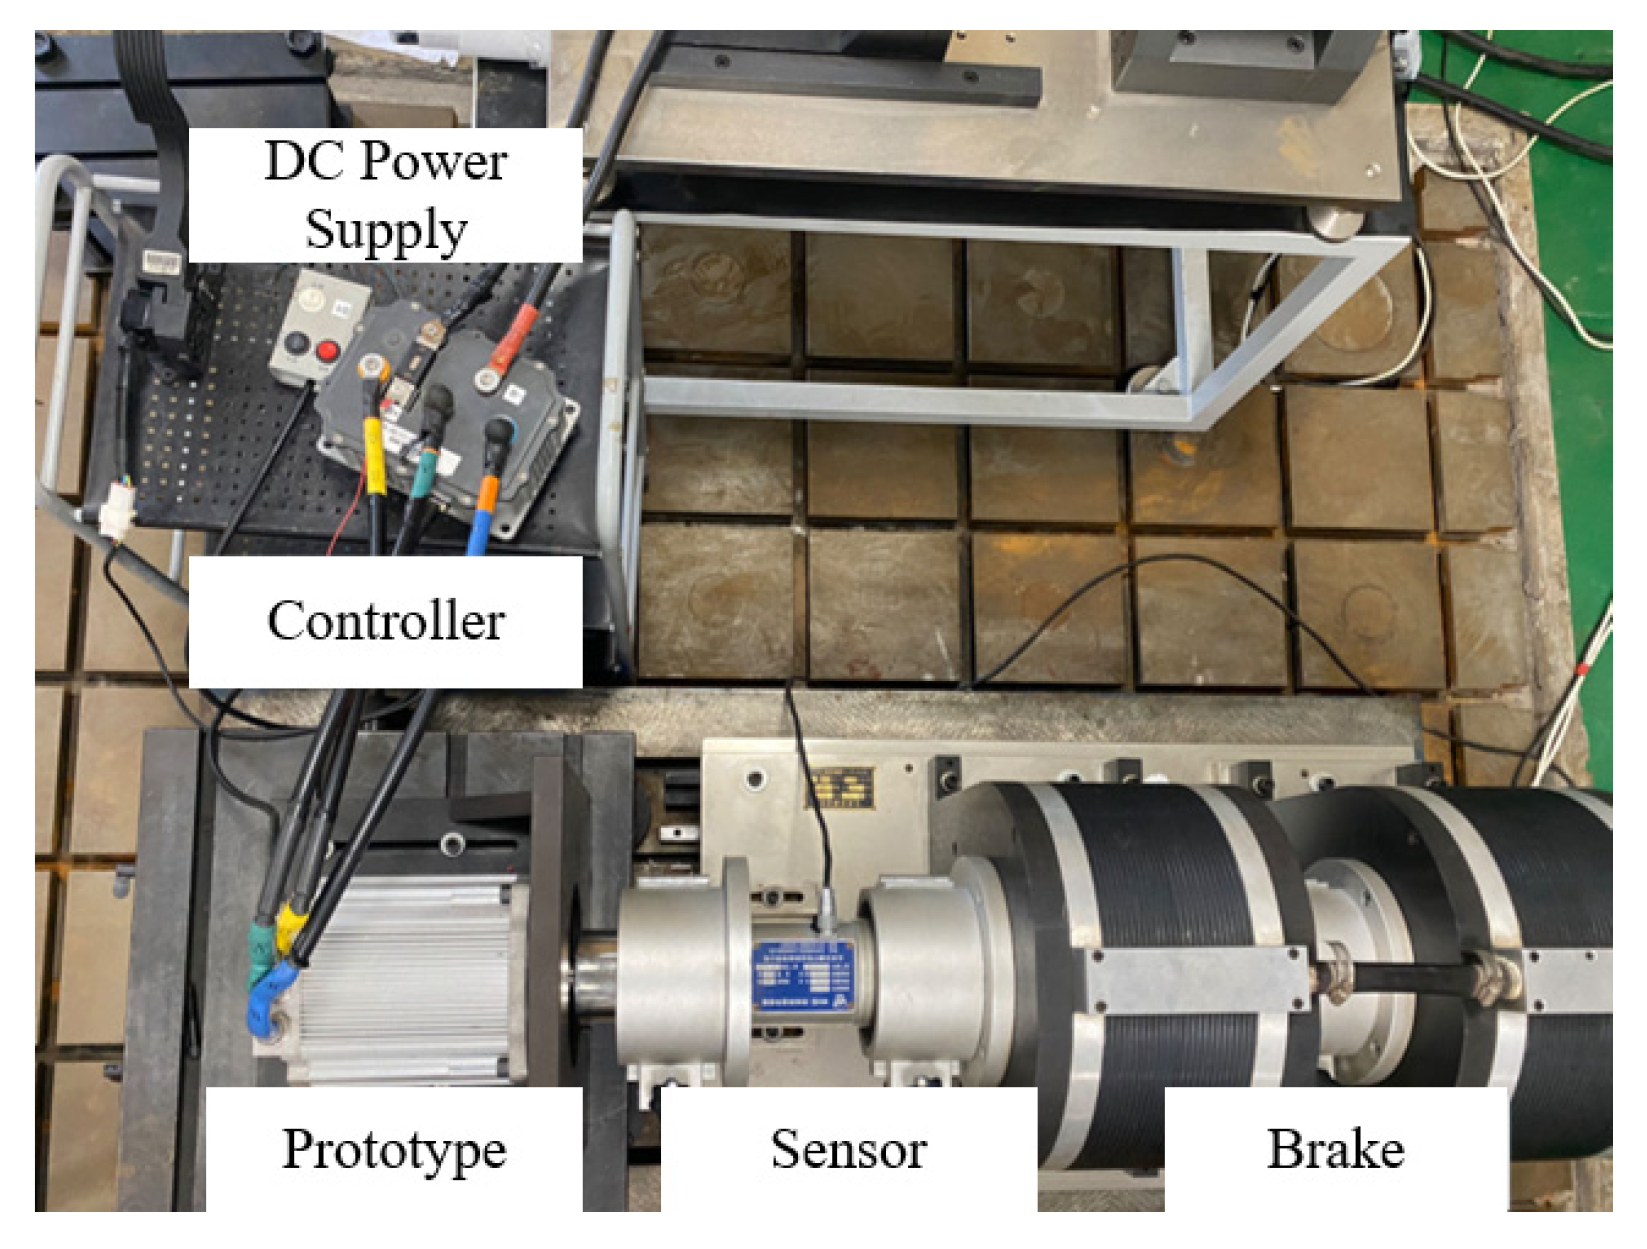
The torque–speed performance test of the combined magnetic pole drive motor was conducted using the back-to-back test method. The test platform comprises a DC power cabinet, control cabinet, motor controller, sensors, a brake, and a water tank, among other equipment. The brake consists of an eddy current brake and a magnetic particle brake connected in series to generate a stable simulated load. The control cabinet can process torque and speed information and display it in real time. A block diagram of the test principle is shown in Figure 26.
The test bench was set up according to the schematic diagram for the torque–speed test of the combined magnetic pole motor. The prototype was installed on the test stand and connected to the controller. The armature current was controlled using an accelerator pedal. The prototype was connected to the sensor via coupling, and the axial alignment between the prototype output shaft and the sensor shaft was adjusted to ensure concentricity and reduce mechanical vibration during rotation. The safety cover was tightened, and the brake was connected to the cooling water tank. The torque–speed test platform for the combined magnetic pole motor is shown in Figure 27.
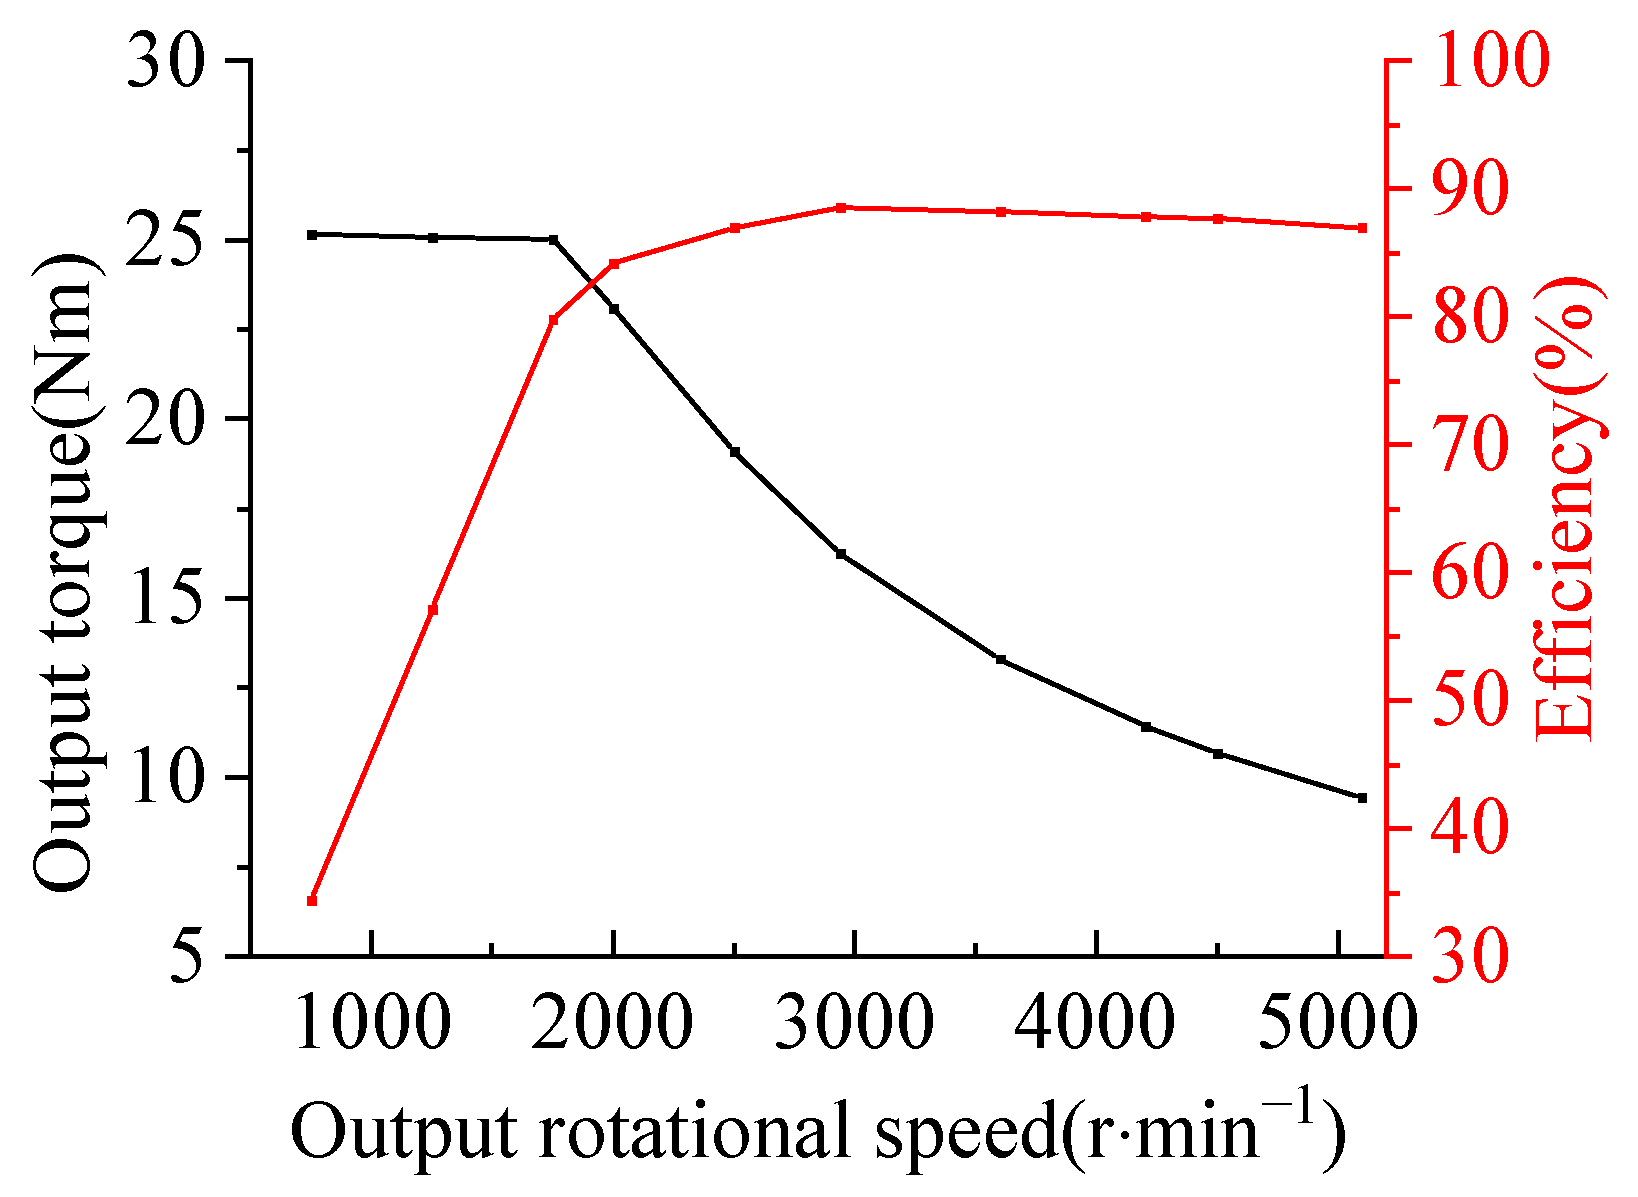
The DC power cabinet supplied a stable 72 V DC power source to the motor controller. The control cabinet could monitor the DC bus current, allowing the input power during motor operation to be determined. The torque and speed data during rotation were fed from the sensor to the control cabinet, enabling the actual output power of the motor to be known. By controlling the value of the DC bus current, the output torque of the motor was regulated. The motor speed was gradually increased. Upon reaching the rated power, the braking torque was continuously reduced by the control cabinet, decreasing the simulated load and allowing the motor speed to rise further. The resulting torque–speed output characteristic curve of the motor is shown in Figure 28.
An overload output capability test was conducted on the combined magnetic pole drive motor by maintaining the DC bus voltage around 72 V and the speed around 3000 r·min−1. Several output characteristic points of the motor under rated voltage were obtained, as listed in Table 7.
As shown in Figure 28, under rated input current, the combined magnetic pole drive motor can still output a torque of 10 Nm at 5000 r·min−1. As shown in Table 7, the output efficiency at the rated point is 88.5%, the maximum efficiency reaches 89.5% with a corresponding output torque of 18.2 Nm, the maximum output power can reach 9112 W, and a torque of 32.4 Nm can be output.

4.4. Simulation Analysis of Motor Losses

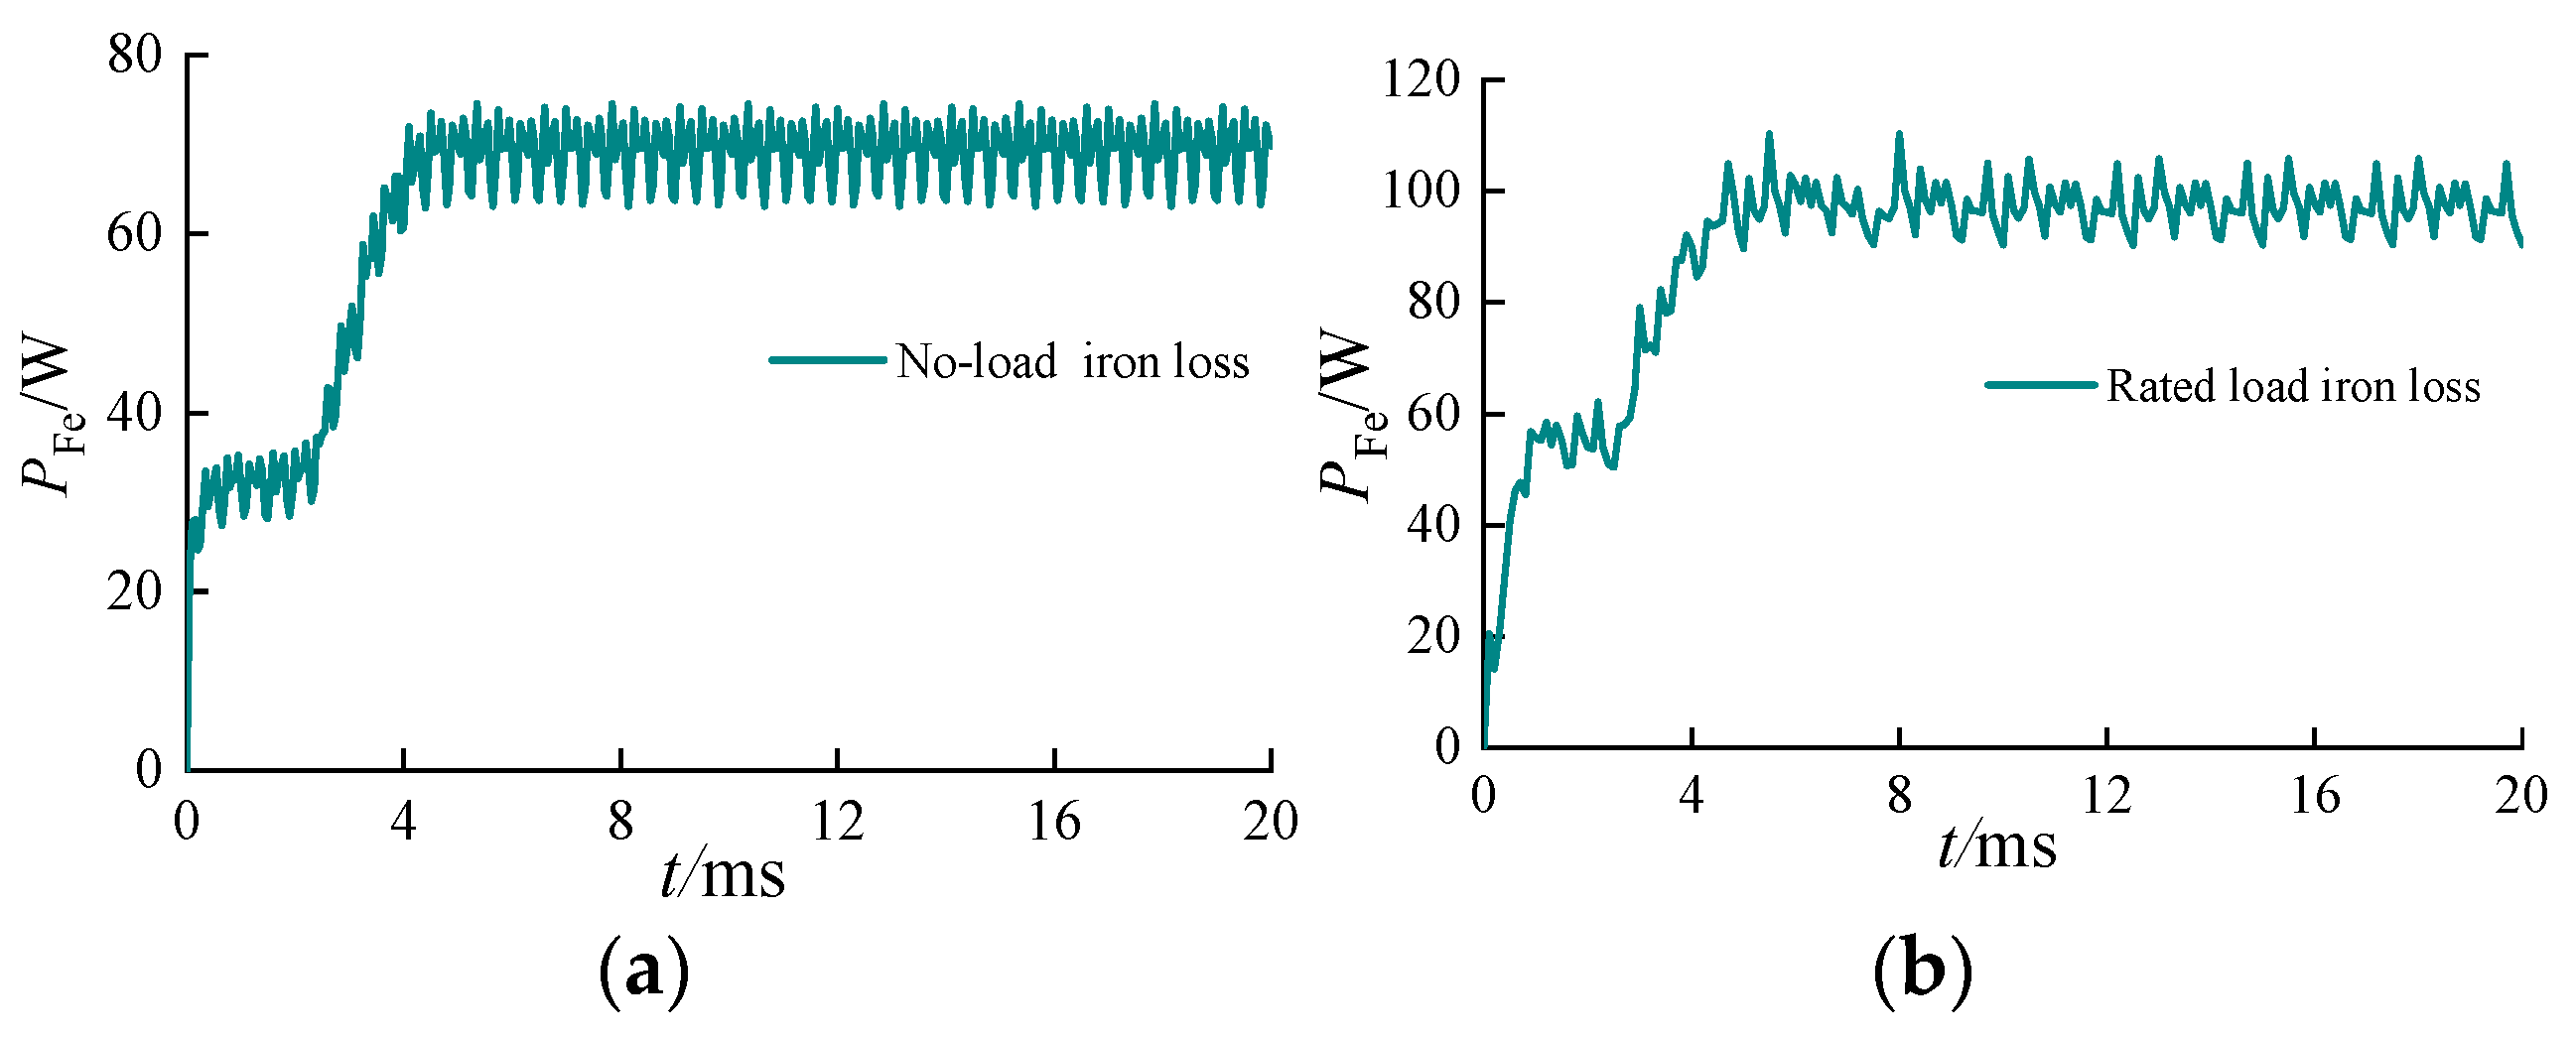
The iron loss curves of the motor under no-load and rated load conditions are shown in Figure 29.
As shown in Figure 29, the average no-load iron loss of the motor is approximately 70 W, while the average rated iron loss is approximately 90 W. The iron loss under rated conditions shows a slight increase compared to no-load iron loss, which meets the motor design requirements.
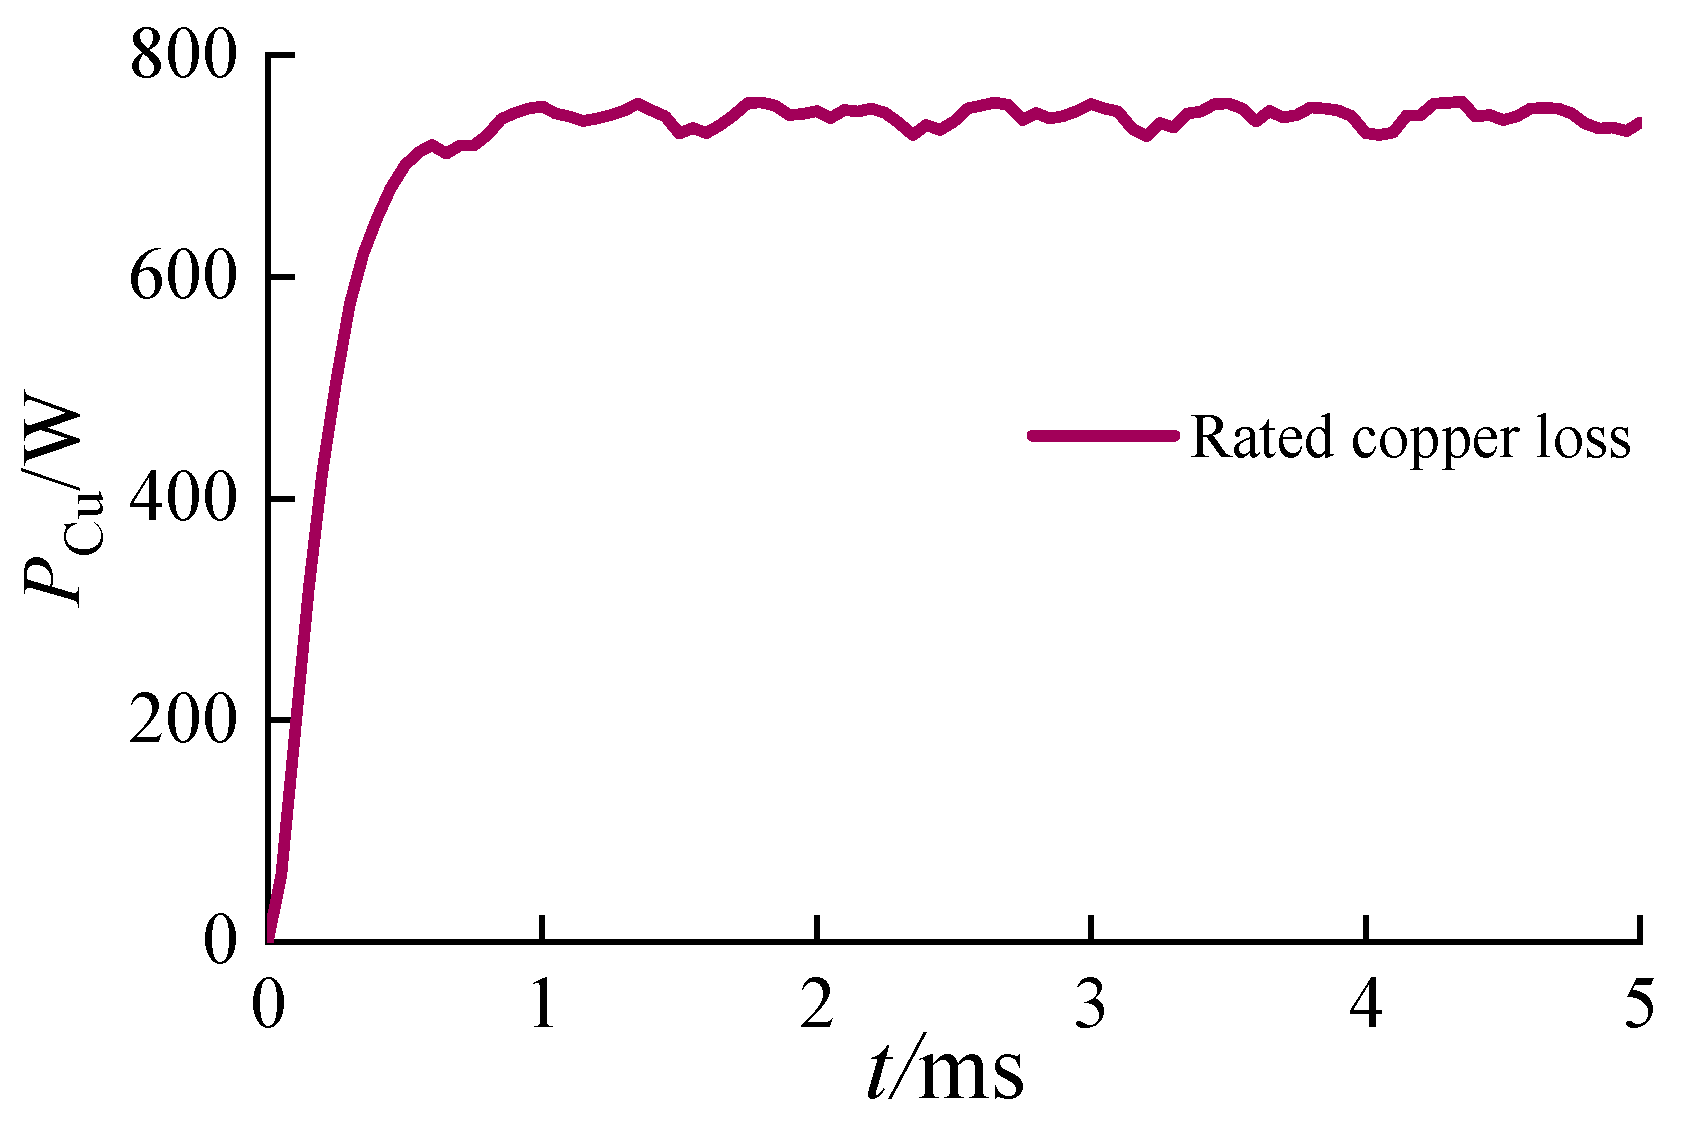
Copper losses account for the largest proportion among all types of losses in motors. Excessive copper losses directly increase the motor’s temperature rise. Finite element analysis yields the copper loss output under rated load conditions, as shown in Figure 30.
As shown in Figure 30, the copper loss output of the motor remains relatively stable under rated load, approximately 700 W. Copper loss is significantly greater than iron loss, validating the theoretical analysis that copper loss constitutes the largest proportion of total losses. The copper loss of the motor meets the requirements for stable operation, confirming the rationality of the armature winding design.

4.5. Test of Map Diagram of Motor Efficiency

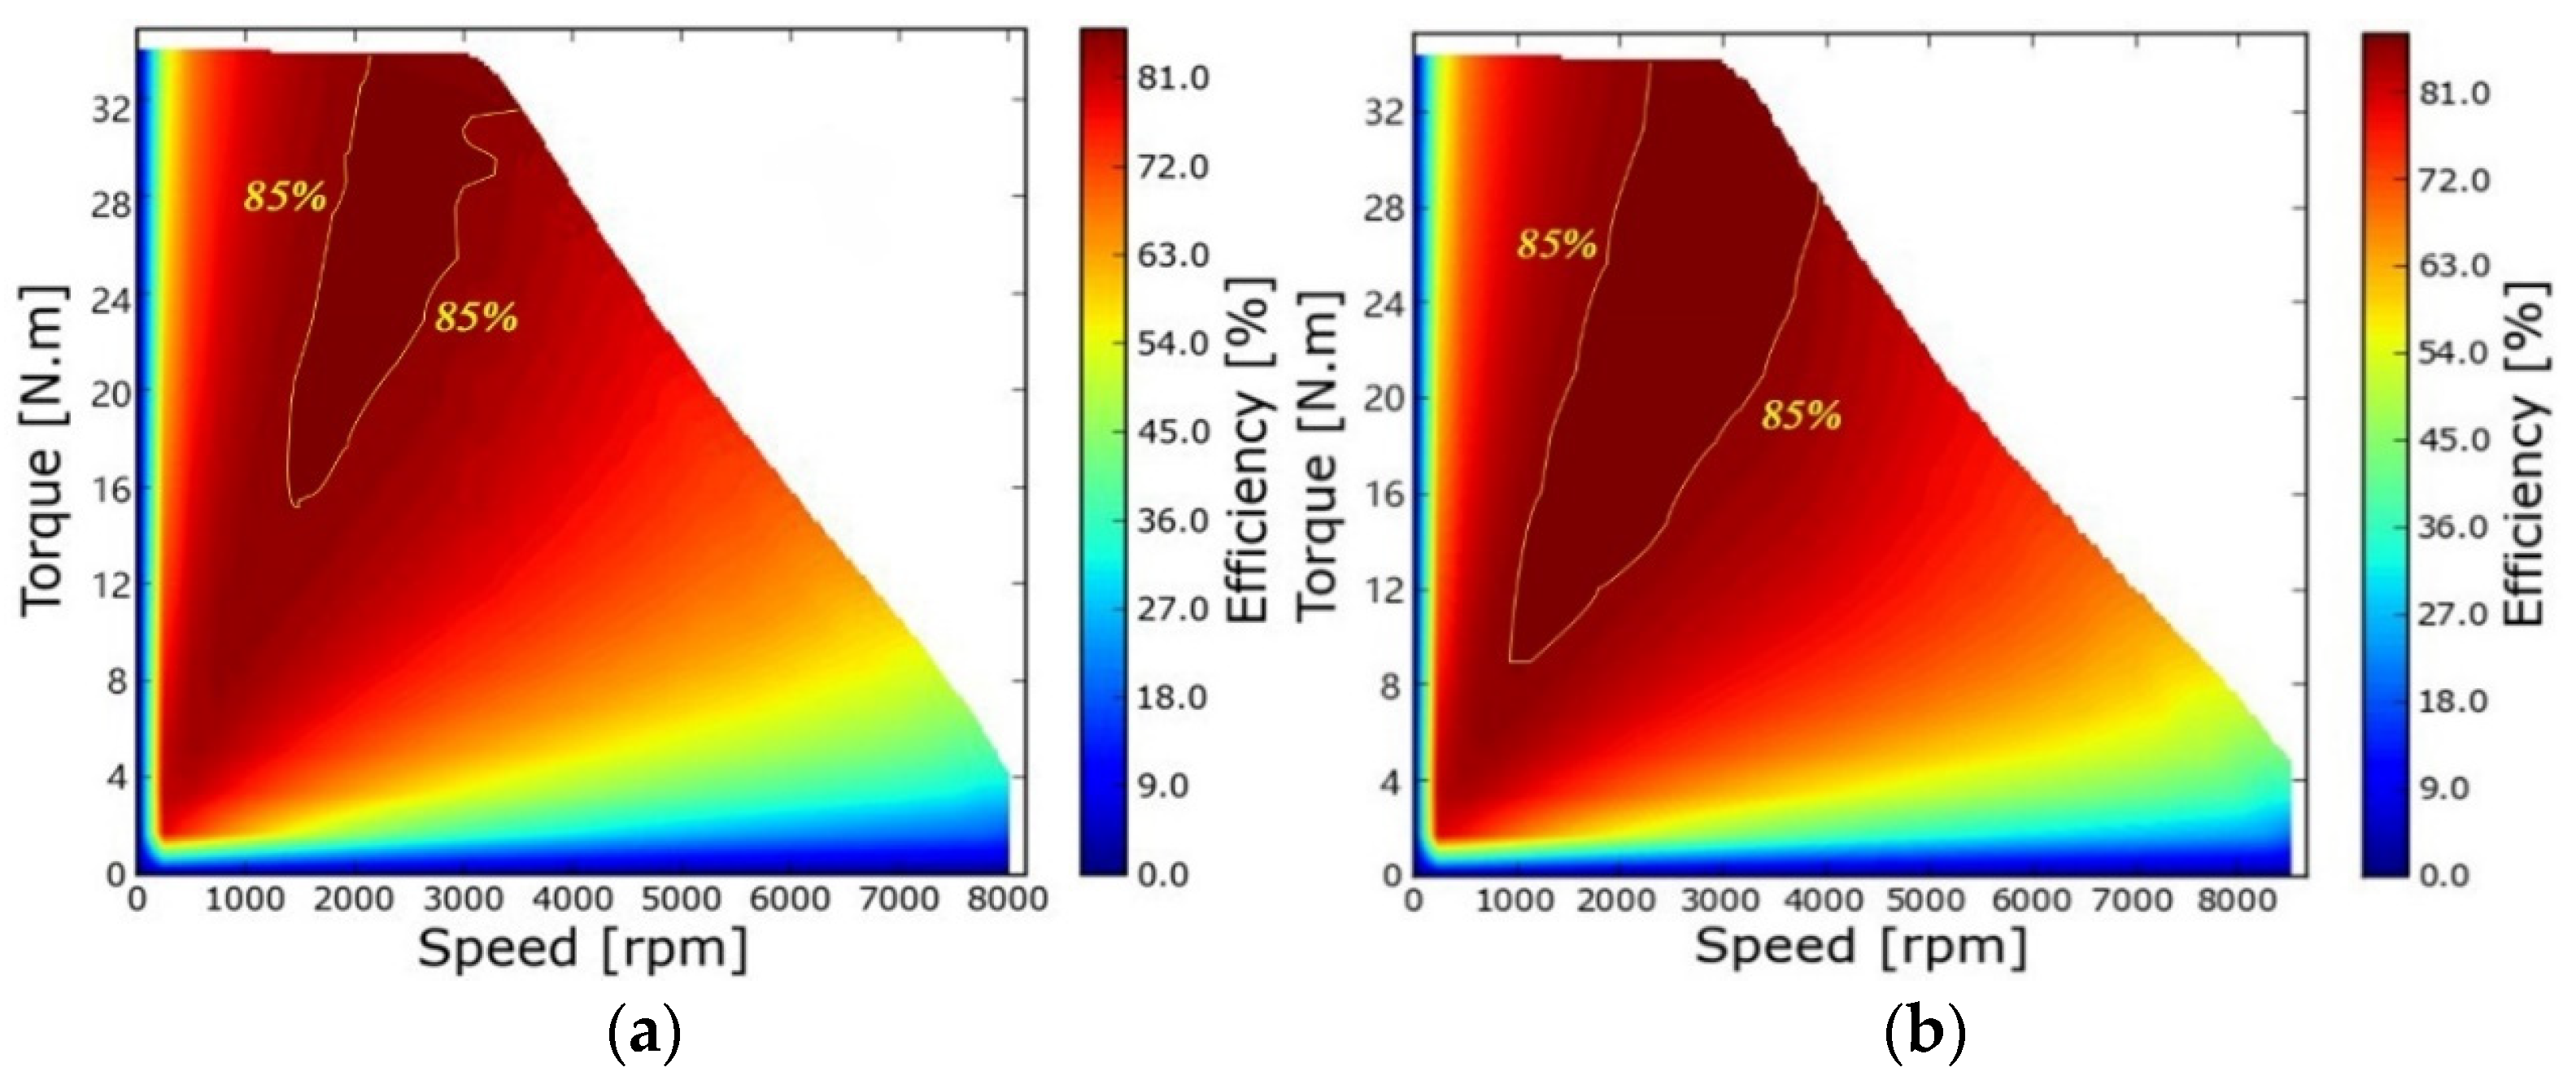
The efficiency maps of the motor before and after optimization under different output characteristics are shown in Figure 31. Comparative analysis reveals that the optimized motor exhibits a broader range of high-efficiency operation. The area with efficiency greater than 85% for the pre-optimized motor is 22.6%, while for the optimized motor, it increases to 33.8%. This demonstrates that through a series of optimizations, the motor achieves improved overall efficiency under complex working conditions.

5. Conclusions

This study establishes a sensitivity-stratified optimization method for enhancing electromagnetic performance in IPM synchronous motors. Applied to a 5 kW IPM motor with combined magnetic poles, the methodology systematically addresses multi-parameter interdependencies and magnetic field complexity. Key contributions and findings are summarized as follows:
(1) Novel stratified optimization method
A three-tiered sensitivity hierarchy (low/medium/high) was implemented for ten rotor design parameters:
 •
Low-sensitivity parameters (α2, r1w, r2w, t2w) were resolved via metamodel prediction, eliminating unnecessary iterations;
 •
Medium-sensitivity variables (r2c, t2c, t1w) underwent parametric sweeping to identify Pareto-optimal values;
 •
High-sensitivity parameters (α1, t1c, r1c) were optimized using a non-standard Taguchi orthogonal array (L81(93), reducing simulation cases by 70% versus full-factorial approaches while resolving cross-variable couplings.
This structure circumvents accuracy degradation in conventional surrogate models (>15 variables) and reduces computational load by >60%.
(2) Electromagnetic performance enhancements
Implementation of the optimized parameters yielded a 13.1% reduction in air gap flux density THD with a fundamental amplitude increase of 3.9%. Harmonic suppression was demonstrated by a fifth-harmonic amplitude decrease of 42.5%. Introduction of a 3.5° magnetic barrier protrusion angle further minimized flux distortion while maximizing fundamental amplitude. Demagnetization resistance improved from 3× to 5× rated load by increasing the magnetization-direction thickness of the primary V-PM to 3.6 mm, balancing NdFeB material usage and reliability. Torque ripple reduced by 38% with 2.5% higher average torque under rated conditions. Cogging torque attenuation of 58.7% was achieved.
(3) Verification of optimization effects
Prototype testing confirmed a fundamental back-EMF amplitude of 32 V (93% agreement with FEA predictions) with maintained low total harmonic distortion, while the asymmetric d-q axis magnetic paths enabled non-zero reluctance torque at zero current phase angle, shifting the maximum torque angle by 8° and thereby reducing demagnetization risk.

Author Contributions

Conceptualization, J.Z. and W.H.; Methodology, Y.G., S.H. and H.G.; Software, X.Z. and Y.L.; Validation, J.Z., W.H. and Y.G.; Formal Analysis, S.H. and X.Z.; Investigation, H.G. and Y.L.; Data Curation, Y.G. and S.H.; Writing—Original Draft, J.Z., W.H. and S.H.; Writing—Review & Editing, X.Z., Y.L. and J.Z.; Visualization, W.H. and Y.G.; Supervision, X.Z. and H.G.; Project Administration, H.G. and Y.L. All authors have read and agreed to the published version of the manuscript.

Funding

This research was funded by the National Natural Science Foundation of China, grant numbers 52275261 and 52305267, and the Natural Science Foundation of Shandong Province, grant number ZR2023QE010.

Data Availability Statement

The data are available from the authors upon reasonable request.

Conflicts of Interest

Author Jun Zhang was employed by the company Shandong Tangjun Ouling Automobile Manufacturing Co., Ltd. The remaining authors declare that the research was conducted in the absence of any commercial or financial relationships that could be construed as a potential conflict of interest.

References

  1. Tian, G.; Zhang, H.; Feng, Y.; Jia, H.; Zhang, C.; Jiang, Z. Operation patterns analysis of automotive components remanufacturing industry development in China. J. Clean. Prod. 2017, 164, 1363–1375. [Google Scholar] [CrossRef]
  2. Zahra, A.; Rahmat-Allah, H.; Soodabeh, S. Energy management considering simultaneous presence of demand responses and electric vehicles in smart industrial grids. Sustain. Energy Technol. Assess. 2021, 45, 101127. [Google Scholar] [CrossRef]
  3. Zhang, S.; Guo, S. Analytical Magnetic Field Method of Permanent Magnet Synchronous Machine Considering Step-Skewed Magnets and Magnetic Slot Wedge. Trans. China Electr. Soc. 2019, 34, 11–22. [Google Scholar] [CrossRef]
  4. Shao, N.; Zhu, L.; Luo, X.; Huang, Z. Analytical Methods for Optimal Rotor Step-Skewing To Minimize Cogging Torque in Permanent Magnet Motors. In Proceedings of the 2019 22nd International Conference on Electrical Machines and Systems (ICEMS), Harbin, China, 11–14 August 2019; pp. 1–5. [Google Scholar] [CrossRef]
  5. Tan, L.; Wang, Y.; Xiao, W.; Cui, J.; Zhou, Y.; Ren, C.; Guo, J.; Zhen, D. Design and Optimization of Submersible Permanent Magnet Synchronous Motor with External Rotor and Integrated Pump. Small Spec. Electr. Mach. 2023, 51, 30–39. [Google Scholar] [CrossRef]
  6. Zhao, H. Topology Optimization of Synchronous Reluctance Motor Based on Standardized Gaussian Network. Henan Sci. Technol. 2023, 42, 12–16. [Google Scholar] [CrossRef]
  7. Li, S.; Shuai, K.; Sun, L.; Wang, J. Multi-objective Optimization Design of Ferrite Permanent Magnet Assisted Synchronous Reluctance Motor. Micromotors 2023, 56, 14–20. [Google Scholar] [CrossRef]
  8. Wang, Y.; Ding, W.; Yang, N.; Li, J. Parameter Optimization of Stator Auxiliary Groove of Permanent Magnet Motor Using Surrogate. J. Nanjing Inst. Technol. Nat. Sci. Ed. 2023, 21, 44–50. [Google Scholar] [CrossRef]
  9. Li, J.; Zhu, S.; Yang, N.; Wang, Y. Noise Optimization of Octagonal Enclosure of Door Motors Based on Surrogate Method. J. Nanjing Inst. Technol. Nat. Sci. Ed. 2023, 21, 68–73. [Google Scholar] [CrossRef]
  10. Wang, X.; Cheng, Y. Multi Objective Optimization of Structural Parameters of Interior Permanent Magnet Vernier Wheel Hub Motor. Small Spec. Electr. Mach. 2024, 52, 20–25. [Google Scholar] [CrossRef]
  11. Xu, Z.; Cheng, H.; Su, J.; Li, C.; Cheng, Y. Multi-Objective Optimization of Partitioned-Primary Permanent Magnet Linear Motor. Small Spec. Electr. Mach. 2025, 53, 7–13. [Google Scholar] [CrossRef]
  12. Zuo, S.; Liu, X.; Yu, M.; Wu, X.; Zhang, G. Numerical Prediction and Analysis of Electromagnetic Vibration in Permanent Magnet Synchronous Motor. Trans. China Electr. Soc. 2017, 32, 159–167. [Google Scholar] [CrossRef]
  13. Luo, C.; Zhao, S.; Qiu, X.; Yang, X. Research on Electromagnetic Excitation Force Weakening of PMSM Based on Stator Auxiliary Slot. Micromotors 2024, 57, 1–7. [Google Scholar] [CrossRef]
  14. Song, T. Electromagnetic Vibration and Noise Characteristics and its Suppression of Permanent Magnet Synchronous Motor used for Electric Vehicles. Ph.D. Thesis, Beijing Jiaotong University, Beijing, China, 2022. [Google Scholar] [CrossRef]
  15. Zhao, X.; Niu, S.; Fu, W. Sensitivity Analysis and Design Optimization of a New Hybrid-Excited Dual-PM Generator with Relieving-DC-Saturation Structure for Stand-Alone Wind Power Generation. IEEE Trans. Magn. 2020, 56, 1–5. [Google Scholar] [CrossRef]
  16. Liu, X.; Wan, D.; Huang, S.; Cui, H. Parametric Sensitivity Analysis and Torque Characteristic Optimization of the PMSM with Non-uniformly Partitioned Halbach Array. In Proceedings of the 2021 IEEE 4th International Electrical and Energy Conference (CIEEC), Wuhan, China, 28–30 May 2021; pp. 1–6. [Google Scholar] [CrossRef]
  17. Gao, F.; Gao, J.; Li, M.; Yao, P.; Song, Z.; Yang, K.; Gao, H. Optimization Design of Halbach Interior Permanent Magnet Synchronous Motor Based on Parameter Sensitivity Stratification. J. Xi’an Jiaotong Univ. 2022, 56, 180–190. [Google Scholar] [CrossRef]
  18. Zhang, Y.; Gao, W.; Shi, Q.; Meng, Q.; Du, G. Optimization Design of Dual-Redundancy Permanent Magnet Synchronous Motor Based on Improved Iterations Taguchi Method. Trans. China Electr. Soc. 2022, 38, 2637–2647. [Google Scholar] [CrossRef]
  19. Pan, Y. Multi-objective Optimization Design of Interior Permanent Magnet Synchronous Motor Based on Combined Surrogate Model. Ph.D. Thesis, East China Jiaotong University, Nanchang, China, 2023. [Google Scholar] [CrossRef]
  20. Gu, Y.; Gu, D.; Feng, L.; Zhang, W.; Li, K.; Mao, R. Multi-objective preference optimization of yokeless axial-flux wind generator. Electr. Mach. Control 2023, 27, 148–156. [Google Scholar] [CrossRef]
  21. Xie, Y.; Jiang, J.; Cai, W.; Ren, S.; Sun, C. Demagnetization Failure of Surface-Mounted High-Speed Permanent Magnet Synchronous Motor and Local Infiltration of Heavy Rare Earth. Electr. Mach. Control 2024, 28, 44–53. [Google Scholar] [CrossRef]
  22. Liu, Y. Research on Demagnetization Mechanism and Anti-Local Demagnetization Optimization of Permanent Magnets in Permanent Magnet Synchronous Motors. Ph.D. Thesis, Harbin University of Science and Technology, Harbin, China, 2023. [Google Scholar]
  23. Xie, Y.; Sun, C.; Cai, W.; Ren, S.; Jiang, J. Demagnetization Mechanism and Local Infiltration of Heavy Rare Earth for Permanent Magnet Synchronous Motors in Electric Vehicles. Electr. Mach. Control 2024, 28, 75–83. [Google Scholar] [CrossRef]
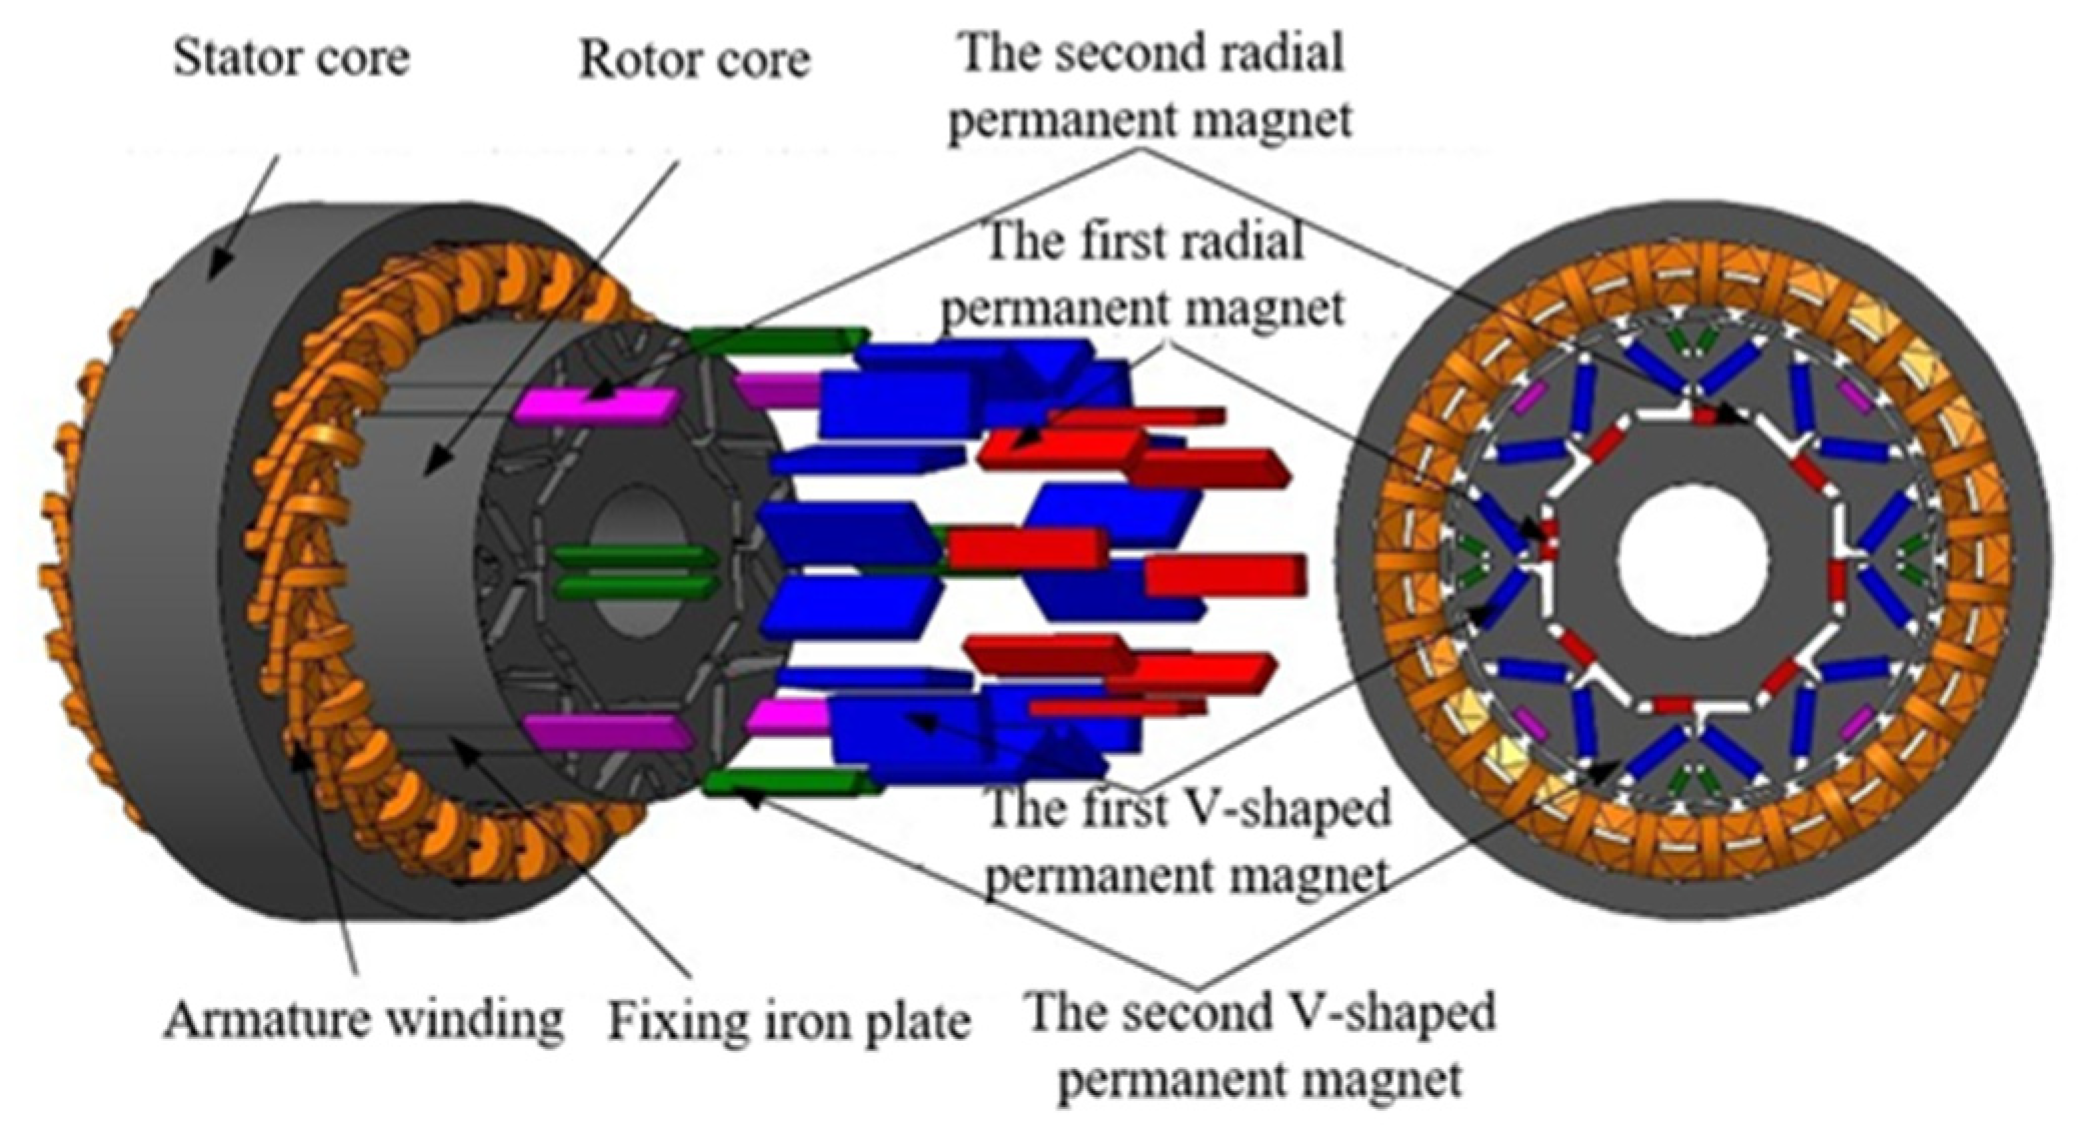
Figure 1. Structure of the combined magnetic pole motor.
Wevj 16 00508 g001
Figure 2. Spatio-temporal distribution of rotor air gap flux density.
Wevj 16 00508 g002
Figure 3. Harmonic distribution of rotor air gap flux density.
Wevj 16 00508 g003
Figure 4. Schematic diagram of each optimization variable.
Wevj 16 00508 g004
Figure 5. Sensitivity of each variable to the optimization objectives.
Wevj 16 00508 g005
Figure 6. Influence of the second V-shaped PM length t2c on optimization objectives.
Wevj 16 00508 g006
Figure 7. Influence of the second radial PM length r2c on optimization objectives.
Wevj 16 00508 g007
Figure 8. Influence of the first V-shaped PM width t1w on optimization objectives.
Wevj 16 00508 g008
Figure 9. Influence of high-sensitivity variables on optimization objectives. (a) Influence on fundamental wave amplitude; (b) influence on THD.
Wevj 16 00508 g009
Figure 10. Flux barrier location diagram.
Wevj 16 00508 g010
Figure 11. Influence of flux barrier protrusion angle on air gap flux density.
Wevj 16 00508 g011
Figure 12. PM demagnetization cloud images at different loads: (a) 3 × load; (b) 4 × load; (c) 5 × load.
Wevj 16 00508 g012
Figure 13. Demagnetization recovery curves vs. magnetization direction thickness t1w: (a) 3.2 mm; (b) 3.6 mm; (c) 4.0 mm.
Wevj 16 00508 g013
Figure 14. Static magnetic field distribution of motor.
Wevj 16 00508 g014
Figure 15. Air gap flux density waveform comparison.
Wevj 16 00508 g015
Figure 16. Harmonic decomposition of air gap flux density.
Wevj 16 00508 g016
Figure 17. Comparison of no-load back-EMF. (a) Waveform curve; (b) harmonic distributions.
Wevj 16 00508 g017
Figure 18. Cogging torque comparison.
Wevj 16 00508 g018
Figure 19. Rated output torque comparison.
Wevj 16 00508 g019
Figure 20. Torque composition at different current phase angles.
Wevj 16 00508 g020
Figure 21. Physical diagrams of stator, rotor and prototype: (a) 27-slot stator core; (b) 8-pole rotor core; (c) prototype.
Wevj 16 00508 g021
Figure 22. Combined magnetic pole motor cogging torque test platform. (a) Cogging torque test platform; (b) prototype installation.
Wevj 16 00508 g022
Figure 23. Combined magnetic pole motor cogging torque curve.
Wevj 16 00508 g023
Figure 24. Combined pole motor no-load back-EMF test platform.
Wevj 16 00508 g024
Figure 25. Experimental waveform of no-load back-EMF.
Wevj 16 00508 g025
Figure 26. Experimental schematic for torque–speed testing of combined magnetic pole motors.
Wevj 16 00508 g026
Figure 27. Experimental schematic for torque–speed testing of combined pole motor.
Wevj 16 00508 g027
Figure 28. Combined pole motor torque–speed characteristic curve.
Wevj 16 00508 g028
Figure 29. Motor iron core loss curve diagram. (a) No-load iron loss; (b) rated load iron loss.
Wevj 16 00508 g029
Figure 30. Rated copper loss waveform of motor.
Wevj 16 00508 g030
Figure 31. The efficiency maps of the motor. (a) Post-optimization; (b) pre-optimization.
Wevj 16 00508 g031
Table 1. Parameters of the combined magnetic pole motor.
Parameter Name/UnitValue
Rated Power/kW5
Rated Line Voltage/V72
Rated Speed/r·min−13000
Rated Torque/Nm16
Stator Inner Diameter/mm97
Air Gap Length/mm0.5
Table 2. Resign variables and ranges.
SymbolVariable NameValue RangeUnit
r 1 w First radial PM width2~4mm
r 1 c First radial PM length5~10mm
r 2 w Second radial PM width2~3mm
r 2 c Second radial PM length4~8mm
α 1 First V-shaped PM included angle80~110°
t 1 w First V-shaped PM width2~3.4mm
t 1 c First V-shaped PM length10~14mm
t 2 w Second V-shaped PM width2~2.5mm
t 2 c Second V-shaped PM length3~5mm
α 2 Second V-shaped PM included angle60~90°
Table 3. Value of each level for the high-sensitivity optimization variables.
Parameterα1r1ct1c
Level 190510
Level 292610.5
Level 394711
Level 496811.5
Level 598912
Level 61001012.5
Level 7102-13
Level 8104-13.5
Level 9106-14
Table 4. Orthogonal experimental table design and partial results.
Serial No.α1 (°)r1c (mm)t1c (mm)Fundamental Amplitude (T)THD
11045120.8363160.209758
21065100.6817180.196844
31009100.7245520.266451
4987100.7073990.243277
51027110.7764530.225925
6946120.8585840.25555
71028130.9282880.252764
50102911.50.8296960.256099
5194710.50.7513220.26077
52967120.8620930.250752
5396613.50.9624780.261571
5494912.50.9162290.280312
Mean Value0.8596650.26152
Table 5. Variances and contributions of each variable for the optimization objectives.
Optimization VariablesOn Fundamental AmplitudeOn Distortion Rate
Variance%Variance%
α10.0003030903.370.0003465734.20
r1c0.0001558591.650.0002694133.27
t1c0.00853384594.980.00763039892.53
Table 6. Comparison of parameters before and after optimization.
SymbolValue RangePost-Optimization ValueUnit
r1w2~43.2mm
r1c5~105mm
r2w2~32.2mm
r2c4~88mm
α180~110106°
t1w2~3.42.6mm
t1c10~1414mm
t2w2~2.52.2mm
t2c3~54.8mm
α260~9063°
Table 7. Rated voltage output characteristic points of the combined magnetic pole motor.
Characteristic PointVoltage
(V)
Current (A)Input Power
(W)
Torque
(Nm)
Speed
(R·min−1)
Output Power (W)Efficiency
(%)
No-load point72.4610.93792.41.33235440.355.6
Rated point72.3978.03564916.32938500088,5
Max efficiency point72.3685.48618618.22906553889.5
Max output power pt72.24143.510,36032.42686911288.0
Max torque point72.24143.510,36032.42686911288.0
End point72.24143.510,36032.42686911288.0
Disclaimer/Publisher’s Note: The statements, opinions and data contained in all publications are solely those of the individual author(s) and contributor(s) and not of MDPI and/or the editor(s). MDPI and/or the editor(s) disclaim responsibility for any injury to people or property resulting from any ideas, methods, instructions or products referred to in the content.