Article

Design of Coordinated EV Traffic Control Strategies for Expressway System with Wireless Charging Lanes

1
School of Innovation and Entrepreneurship, Zhejiang Fashion Institute of Technology, Ningbo 315211, China
2
Nottingham University Business School China, University of Nottingham Ningbo China, Ningbo 315100, China
3
Nottingham Ningbo China Beacons of Excellence Research and Innovation Institute, University of Nottingham Ningbo China, Ningbo 315100, China
*
Author to whom correspondence should be addressed.
World Electr. Veh. J. 2025, 16(9), 496; https://doi.org/10.3390/wevj16090496
Submission received: 10 July 2025 / Revised: 16 August 2025 / Accepted: 29 August 2025 / Published: 1 September 2025

Abstract

With the development of dynamic wireless power transfer (DWPT) technology, the introduction of wireless charging lanes (WCLs) in traffic systems is seen as a promising trend for electrified transportation. Though there has been extensive discussion about the planning and allocation of WCLs in different situations, studies on traffic control models for WCLs are relatively lacking. Thus, this paper aims to design a coordinated optimization strategy for managing electric vehicle (EV) traffic on an expressway network, which integrates a corridor traffic flow model with a wireless power transmission model. Two components are considered in the control objective: the total energy increased for the EVs and the total number of EVs served by the expressway, over the problem horizon. By setting the trade-off coefficients for these two objectives, our model can be used to achieve mixed optimization of WCL traffic management. The decisions include metering of different on-ramps as well as routing plans for different groups of EVs defined by origin/destination pairs and initial SOC levels. The control problem is formulated as a novel linear programming model, rendering an efficient solution. Numerical examples are used to verify the effectiveness of the proposed traffic control model. The results show that with the properly designed traffic management strategy, a notable increase in charging performance can be achieved by compromising slightly the traffic performance while maintaining overall smooth operation throughout the expressway system.

1. Introduction

Internal combustion engine vehicles (ICEVs) have long dominated the global transportation landscape, accounting for approximately 95% of total transport energy consumption worldwide [1,2]. While ICEVs have significantly contributed to the development of modern mobility systems, their dependence on liquid fossil fuels has led to pressing concerns, including the rapid depletion of non-renewable resources, elevated greenhouse gas emissions, and adverse environmental and socio-economic impacts [3,4].
In response, electric vehicles (EVs) have emerged as a promising alternative, driven by declining battery costs, advancements in energy storage technologies, and proactive government policies such as subsidies and preferential licensing [5]. Worldwide EV sales topped 17 million in 2024, rising by more than 25%, and just the additional 3.5 million cars sold in 2024 compared to 2023 outnumber total EV sales in 2020 [6]. According to Rietmann et al. [7], the global EV stock is projected to exceed 440 million units by 2035, comprising 42.5% of the total vehicle fleet.
However, technological barriers remain a critical bottleneck to the widespread adoption of EVs [8]. Chief among them is the inadequacy of charging infrastructure, which contributes to range anxiety—the fear that a vehicle may not reach its destination before depleting its battery, coupled with concerns over insufficient public charging facilities and lengthy charging durations ([9]. Although improvements in battery capacity and charging efficiency are actively being pursued, attention has increasingly shifted toward the development of flexible and user-friendly charging methods.
In general, EV charging technologies are categorized into three types: conductive charging, battery swapping, and wireless charging [10]. Conductive charging, the most widely adopted, necessitates a physical cable connection between the vehicle and the power source. However, it faces several drawbacks, including grid instability [11], lack of standardization [12], and potential grid overloads due to uncoordinated charging behaviors [13]. Battery swapping offers a faster solution, allowing depleted batteries to be replaced within minutes without requiring the driver to disembark. Nevertheless, widespread implementation is hindered by challenges in standardizing battery specifications across manufacturers and the high capital investment needed for both infrastructure and battery inventories [14,15].
Wireless charging, particularly inductive power transfer, has gained traction for its ability to transmit power without physical connectors via electromagnetic induction between transmitter and receiver coils [16]. In EV applications, this method involves converting high-frequency alternating current into direct current for battery charging, with compensation capacitors employed to mitigate flux leakage [17]. A more advanced variation, inductively coupled power transfer, is increasingly being integrated into modern EV designs. Wireless charging is further divided into static and dynamic modes [18]. Static wireless charging occurs when vehicles are stationary, typically in parking areas. While safer than conventional methods, it still requires extensive infrastructure and does not adequately address long charging durations. In contrast, dynamic wireless charging (DWC) enables in-motion energy transfer via embedded transmitter coils in dedicated road segments—known as wireless charging lanes (WCLs). This configuration allows EVs to replenish their batteries while driving, thereby extending range, reducing battery size and weight, and minimizing charging downtime [19,20].
Despite current challenges related to system cost and energy transfer efficiency, DWC is widely regarded as a viable long-term solution. Moreover, DWC lays the foundation for intelligent traffic systems by synergizing emerging technologies such as internet of vehicles and smart grid infrastructure [21]. As WCL deployment gains momentum, its integration within large-scale road networks, especially expressways, presents both opportunities and challenges. While significant research has been conducted on the spatial allocation and technical configuration of WCLs, conventional traffic control models largely focus on vehicle flow regulation and overlook critical factors such as EVs’ state-of-charge (SOC) and routing planning. This gap hinders the effective coordination between WCL infrastructure and real-time traffic dynamics.
Accordingly, this study proposes an enhanced traffic control model tailored for expressway systems equipped with WCLs. Specifically, we analyse a multi-access expressway, which represents a typical network in urban traffic corridors. By incorporating EV-specific parameters into the control logic, the model aims to optimize energy transfer, coordinate routing plans for different groups of EVs, and thus support the operation and scalability of dynamic wireless charging infrastructure.
The remainder of this paper is organized as follows: Section 2 reviews related literature on WCL deployment and EV traffic management; Section 3 defines the problem and formulates the coordinated traffic control model; Section 4 reports the results of numerical examples; and Section 5 summarizes key conclusions and future research directions.

2. Related Works

The optimal allocation of WCLs has become one of the most extensively researched topics in the application of DWC for EVs. This problem is commonly formulated as a linear programming model aimed at achieving one or more objectives, such as: (1) minimizing social costs; (2) maximizing either the total electrical energy delivered to EVs or the number of vehicles served by WCLs; and (3) optimizing battery size or charging power [21]. Jang [22] classified WCL allocation models into two main types based on their modelling scope: (1) micro-allocation models and (2) macro-allocation models.
Micro-allocation models focus on determining the optimal WCL layout along a specific or predetermined vehicle route. Given a known route, EV speed and energy consumption curves can be derived based on traffic flow predictions. These models are valuable for route planners in deciding where to place WCL segments along a route [22]. The typical objective is to minimize social costs, including both fixed and variable WCL infrastructure expenses. Constraints generally include lower and upper bounds for the vehicle’s SOC during travel—the lower bound typically corresponds to the initial SOC, while the upper bound refers to the desired SOC upon exiting the segment [23].
Micro-allocation models are often applied to public transportation systems. Ko and Jang [24], for example, developed an optimization-based method to determine the placement of WCLs and the battery size for electric buses operating on a single route in a closed environment. This was successfully applied to the online electric vehicle (OLEV) system, developed by the Korea Advanced Institute of Science and Technology. Key decision variables include route layout, total WCL segment count, and bus battery capacity. These variables must balance battery size against the number and length of charging segments due to their negative correlation. The goal is to minimize total investment while satisfying operational constraints.
Building on Ko and Jang’s work [24], subsequent models introduced refinements. Jang et al. [25] discretized the route into multiple short segments to simplify optimization. Jeong et al. [26] incorporated battery life into cost calculations, noting its significant impact in long-term planning. However, real-world systems often require multi-route considerations, especially in congested urban areas. Addressing this, Hwang et al. [27] extended the single-route model to a shared WCL system across multiple routes and validated it using data from the OLEV Gumi project. Liu and Song [28] addressed uncertainties in energy consumption and travel time, proposing a robust optimization model that balances cost with system resilience under various scenarios.
Schwerdfeger et al. [23] extended micro-allocation models to long-haul electric trucks. Their model employed continuous variables to minimize deployment costs while satisfying SOC requirements for origin-destination pairs. The solution of a mixed-integer linear programming problem formulated was applied to Germany’s A7 expressway, which indicated that only 35% of the 963 km route—primarily central high-traffic segments—required electrification. The study also suggested using overhead lines to supplement battery charging and reduce infrastructure costs.
Macro-allocation models explore the broader impact of WCLs on traffic systems. Unlike micro models, they treat traffic flow distribution as an endogenous variable affected by WCL placement [21]. These models often use network-level approaches to minimize total social costs, including WCL infrastructure and travel time. Constraints include SOC requirements as well as travel and charging delays. Some macro models also incorporate route choice behavior, modelling how WCL availability influences driver routing decisions. Below are some representative examples.
Fuller [29] investigated whether WCLs can effectively reduce range anxiety among EV users traveling on California expressways. Assuming a driving range of 160 miles, the study modelled charging coverage as a link-based uncapacitated set covering problem. Results showed that a 626-mile WCL system, coupled with static charging stations and dynamic charging at 40 kW, enabled seamless intercity travel. DWC was also found to be more cost-effective than increasing battery capacity alone. Wang et al. [30] proposed a WCL deployment model balancing energy supply and demand across regions. It incorporated the effect of traffic lights on charging and EV operability, using real-world data from various city zones. The results indicated that installing WCLs only at high-traffic intersections may not always be optimal. He et al. [5] developed an allocation model accounting for the impact of WCL installation on road capacity and driver route choice. Since WCLs may cause more frequent lane changes, road capacity can drop. Their objective was to maximize the number of EVs served. The model was tested on the Nguyen-Dupuis and Sioux Falls networks, showing the non-negligible adverse effects of WCL deployment.
While extensive literature exists on optimizing WCL placement, such as the abovementioned, much fewer studies have touched upon traffic operations on WCLs, and with varied focuses. For example, He et al. [31] designed a car-following model and lane-changing rule of EV based on which each EV’s micro driving behavior in a two-lane system with a WCL is explored. Li et al. [32] proposed a novel charging demand forecasting model considering system disruptions to support real-time traffic management. Even fewer studies have discussed traffic control strategies on WCLs. However, traditional expressway control techniques, such as ramp metering, link control, and driver guidance systems [33], primarily address flow regulation without considering SOC or the coordination of routing plans of EVs. A recent work by Liu et al. [34] proposed a model predictive control model for ramp metering on WCLs, but the decisions lack flexibility in the sense that each EV must stick to its predetermined origin-destination pairs. Therefore, this study focuses on developing a flexible coordinated EV traffic control model tailored for expressway systems with properly deployed WCLs. Our problem differs from Liu et al. [34] in that: (1) a more realistic DWPT facility layout and a more refined EV energy profiles are considered; (2) we consider both decisions of ramp metering and routing plans of EVs to fully coordinate the traffic and charging demand of different groups of EVs in WCL operation.

3. Problem Definition and Model Formulation

Figure 1 illustrates the operating principle of an expressway segment with a WCL under an advanced traffic control system that can be implemented with the support of technologies like AI and cloud computing. As an EV enters the expressway from an on-ramp, the roadside control system will record its entry and upload the SOC information to the cloud, which will receive updated SOC information of the vehicle for each highway segment until it leaves the expressway. The computing center (i.e., the cloud) will issue real-time control instructions to EVs via the roadside control system based on the carrying capacity of the WCL and the latest SOC of EVs traveling on the charging lane. In the discussion of this paper, the control instructions are mainly aimed at those EVs that have not yet entered the expressway from the on-ramps. More specifically, the traffic system determines whether to allow the entry of each EV that is waiting or approaching each on-ramp and issues a command.

3.1. Basic Considerations

In the rest of the paper, the advanced traffic control system will be discussed based on the WCL-deployed expressway shown in Figure 1. The model to be developed for coordinated traffic volume management and route planning is based on solving a linear optimization problem to weigh the relationship between the following two measures: (1) the number of EVs entering the expressway (expressway traffic model); and (2) the total energy received by EVs on the WCL (wireless power transmission model), and eventually to maximise their combination (wireless charging lane traffic control model). Since the advanced traffic control system covered in this paper is a preliminary quantitative analysis of the WCL on the future expressway, the composition of the expressway structure, the operation mode of the traffic control system, and the behavior of EVs in receiving and consuming energy are required to be defined. Below are the basic considerations or assumptions for the modelling and analysis of the coordinated traffic control problem:
  • The entire expressway is equipped with WCLs and is composed of a set of segments, each contains an on-ramp at the beginning and an off-ramp at the end. The traffic demand for the expressway consists of only EVs, each of which will enter the WCL from an on-ramp and leave via an off-ramp that is no further than the destination off-ramp of the very EV, a piece of information known to the control system based on real-time communication when the vehicle approaches the system.
  • Roadside control systems are installed at the on-ramp, off-ramp, and end of each highway segment to record the information about the entry and exit of EVs as well as their SOC information. These systems are connected to the computing center with two-way information transfer, including (1) each roadside control system uploads all recorded information to the cloud for data analysis, and (2) the cloud sends traffic management information to each roadside control system. The control instructions received are then sent by the roadside control system to each EV passing by it.
  • All EVs have the same battery size but several groups of initial SOC levels (e.g., low and high with 20% and 50% of the battery capacity, respectively). Each group of EVs with specific initial SOC levels has a minimum requirement for the number of WCL segments to travel after entering the system. For example, low initial SOC may be required to stay in the WCL throughout, as they are at risk of failing to reach the destination without charging. EVs with high initial SOC may be required to stay in the WCL only for the first segment where they enter the system.
  • All EVs travel at a stable speed on the expressway after entering from an on-ramp and before exiting via an off-ramp, which can be achieved via onboard cruise control. Cruise control is a function that enables drivers to maintain the vehicle at a set speed without controlling the accelerator pedal when the vehicle speed exceeds 40 km/h [35]. Currently, many EVs already have the function of adaptive cruise control (ACC) on board, an advanced driver assistance system that adds the functionality that controls the distance between the vehicle and the preceding vehicle in addition to cruise control [36]. With the effect of ACC, EVs can keep the same speed in the charging lane, simultaneously identifying and minimizing the probability of a crash as soon as an accident occurs in the preceding vehicle. However, EVs may experience typical speed variation in ramp merging, entering, or leaving the expressway system.
  • EVs are charged for the entire duration of driving on the WCL, with the amount of energy charged proportional to the time spent in the WCL [29]. This is reasonable since the DWPT facility is normally evenly distributed along the WCL, and the energy replenished is commonly assumed to be proportional to the recharging time [37]. Furthermore, the energy received by EVs is only related to the power received by its secondary coil from the primary coil embedded in the WCL and the time duration of energy transmission by the DWPT system [38].

3.2. Notation

Table 1 lists the main notations used to define the model in the next subsection.

3.3. Model Formulation

The previous section shows the fundamental settings of the advanced traffic control system applied to an expressway containing a WCL studied in this paper. In this section, the traffic model and the energy transmission model will be formulated to support the optimization model for traffic control on WCL, considering both traffic and energy performance measures.

3.3.1. Expressway Traffic Model

In this paper, we extend the idea of ramp metering [33,34,39] to managing the number of EVs entering the expressway, considering the possibility of coordinating routing plans affected by their initial SOC types. For generality, we consider the dynamic control strategy where the traffic demand for each on-ramp and off-ramp combination, as well as the traffic volume that is allowed to enter each on-ramp for each group of EVs, can both change over time periods.
We first describe the traffic flow model by starting with expressing the total number of vehicles passing the end of expressway segment s during period p , N s p . To this end, the following quantities are first introduced for all origin o { 1 , , S } and all segment s { 1 , , S } with o s :
p o s = T o s / T ,
where T is the length of each time period. It is easy to infer that N s p changes its value up to s times during period p . To this end, a new parameter N s p x is introduced based on N s p , where x denotes the number of times such a change may occur, which takes value in { 1 , , s + 1 } . In general, N s p x can be formulated as a piecewise function:
N s p x = o = 1 s N o s p p o s                                                                                             x = 1 , o = s + 2 x s N o s p p o s + 1 + o = 1 s + 1 x N o s p p o s       2 x s , o = 1 s N o s p p o s + 1                                                                                 x = s + 1 .                      
With (2), the dynamic evolution of the traffic volume within a period can be modelled. Similarly, by the definition of N d p o u t and the layout of the expressway system, we can express N d p o u t as
N d p x o u t = o = 1 d N o d p p o d N o ( d + 1 ) p p o d                                                                                                                                                                   x = 1 , o = d + 2 x d N o d p p o d + 1 N o ( d + 1 ) p p o d + 1 + o = 1 d + 1 x N o d p p o d N o ( d + 1 ) p p o d         2 x d , o = 1 d N o d p p o d + 1 N o ( d + 1 ) p p o d + 1                                                                                                                                               x = d + 1 .
Now we derive the traffic performance measure in our control model. It can be deduced by our basic assumption (a) that the cumulative demand is equal to the cumulative exit flow, as all EV demand for access to the expressway will eventually be satisfied over sufficiently long periods, i.e.,
p = 1 P o = 1 S Q o p = p = 1 P d = 1 S N d p o u t .
The goal of traditional expressway traffic modelling is to avoid driveway congestion and to minimise the time all drivers spend in the system, including waiting near the on-ramp if any. Mathematically, this total travel time can be expressed as:
T · p = 1 P N p ,
where T is the time interval, N p is the total number of vehicles on the expressway during period p , which is in correlation with the cumulative demand quantity and the cumulative exit flow, i.e.,
N p = N p 1 + o = 1 S Q o ( p 1 ) d = 1 S N d ( p 1 ) o u t = N 0 + p = 1 p 1 o = 1 S Q o p d = 1 S N d p o u t .
Combining the two equations above, we obtain another expression for total travel time as
T · p = 1 P N 0 + p = 1 p 1 o = 1 S Q o p d = 1 S N d p o u t ,
where N 0 is the initial state of the expressway, which is independent of the operation in the traffic control model, like Q o p . Thus, minimizing the total travel time is equivalent to maximizing the weighted exit flow according to the period of occurrence, i.e.,
T · p = 1 P p = 1 p 1 d = 1 S N d p o u t = T · p = 1 P P p + 1 · d = 1 S N d p o u t ,
which indicates that as an EV leaves the expressway earlier, the less queuing time plus passing time it spends, thus it is a reasonable measure of traffic control.

3.3.2. Wireless Power Transmission Model

Wireless power transmission aims to charge the EV’s battery to increase range and to maximise the total electrical energy received from the DWPT system by EVs travelling on the WCL. Figure 2 illustrates the DWPT charging system with a segmented transmitter array considered in this model as a “combination scheme” [38], in which multiple consecutive coils are connected to one power source, forming a power transfer segment. This configuration type combines the main advantages of other types of segmented DWPT systems: (1) segmenting the power supply to the array to reduce the power loss of the system; (2) reduced coil self-inductance and sensitivity of the system to the change in coil parameters, leading to improved stability; and (3) low maintenance costs. Furthermore, this type is suitable for large-scale applications [38].
Mathematically, let E o d i n c be the electrical energy increase of an EV which enters and leaves the WCL system from on-ramp o and off-ramp d , respectively. The quantity E o d i n c can be measured as a function of the energy received from interacting with the coil by traveling on the WCL segments between on-ramp o and off-ramp d , denoted by E o d r e c , and the energy consumed between on-ramp o and off-ramp d , denoted by E o d c o n . Let η represent the efficiency of the battery charge, which can theoretically exceed 90% at maximum [40]. Then, naturally, we have
E o d i n c = η · E o d r e c E o d c o n             o 1 , , S , d o , , S .
Suppose the EV receives E s t x electrical energy from the DWPT system on expressway segment s with a duration of t s t x . Then, the energy received, E o d i n c , can be determined as follows:
E o d r e c = o s d E s t x , E s t x = p t x t s t x ,
t s t x = N s t a · N t c · L t c V s , N s t a = L s L t a ,
E o d r e c = o s d E s t x , E s t x = p t x t s t x .
The above derivation (10)–(12) shows that the energy received by an EV is proportional to the time it passes on the DWPT system, where p t x represents the power in kWh transferred by the DWPT system to the receiver coil in the EV. For t s t x , it can be further derived as a function related to the number of segmented transmitter arrays in a section, N s t a , the number of transmitter coils in a segmented transmitter array, N t c , the length of a transmitter coil embedded under the expressway, L t c , and the EV travel speed. The maximum N s t a that can be placed in an expressway segment can be obtained by comparing the length of an expressway segment with the length of a power transmission segment, L t a , which is composed of the length of a transmitter coil, L t c , the distance between adjacent coils of one array, L c c , and the distance between the rearmost coil in a segmented transmitter array and the frontmost coil in the latter array, L a a , as shown in Figure 2.
As for the energy consumption E o d c o n , the speed profile of the EV (i.e., possible speed variations during ramp merging) needs to be counted, since the power of electricity consumption is a function of both speed and acceleration and road grade [41,42]. In the expressway setting with overall smooth traffic, vehicle speed change typically happens near the ramps due to merging traffic. Let E s , 0 c o n be the energy consumed by traveling throughout segment s with stable speed, E o , i n c o n be the energy consumed in addition to E s , 0 c o n due to speed variation when the EV enters the expressway from the on-ramp o , and E d , o u t c o n be the energy consumed in addition to E s , 0 c o n due to speed variation when the EV leaves the system via off-ramp d . Thus, we can express E o d c o n as:
E o d c o n = E o , i n c o n + E d , o u t c o n + o s d E s , 0 c o n .
When EV’s speed is constant, the energy consumed can be assumed proportional to the travel distance, let p s , 0 be the power at constant speed V s on segment s in kW, so,
E s , 0 c o n = p s , 0 L s / V s .
Ideally, both E o , i n c o n and E d , o u t c o n can be derived based on the battery in-use data and the trajectory data from typical highway driving cycles of an EV. Conceptually, they can be expressed as:
E o , i n c o n = t = 0 t o , i n p o , i n ( t ) d t ; E d , o u t c o n = t = 0 t d , o u t p d , o u t ( t ) d t ,
where t s , i n and t s , o u t are the lengths of time an EV spends in merging traffic entering and leaving the system at segment s , respectively; p o , i n ( t ) and p d , o u t ( t ) are the power of an EV at time t during entering the system from on-ramp o and leaving via off-ramp d , both are functions of EV speed and accelerations. Wu et al. [42] derived the empirical relations between EV power and speed/acceleration in the context of freeway driving using real data, showing that the power can be fitted by a proper piecewise linear function of speed, while the impact of acceleration is almost linear when it is between −5 and 5 ft/sec2 and stays almost the same outside this range.
Therefore, setting the total increased electrical energy for those EVs on the WCL due to wireless charging during the entire studied period can be expressed as:
p = 1 P o = 1 S 1 s = o S 1 ( N o s p N o s + 1 p ) E o s i n c + N S S p E S S i n c ·
Intuitively, a larger traffic performance measure (8) and a larger energy performance measure (16) are both desirable. Therefore, our WCL traffic control model will combine these two components as a single maximization problem, which will be introduced in the next subsection.

3.3.3. The WCL Traffic Control Model

Now we are ready to present the expressway traffic control model with WCLs. First, the decision variables will be a set of ramp metering decisions as well as routing variables for the EVs approaching each on-ramp; these decisions are critical to coordinate the traffic flow from different system accesses. More specifically, the controller needs to decide how many EVs enter each on-ramp o S at each period of time p P , N o p i n , as well as how many EVs with initial SOC type i I enter the expressway from on-ramp o S during period p P and will pass the end of segment s S , N i o s p i n . As stated in our assumption (c), we introduce the type of initial SOC, indexed by i , for distinguishing between different initial energy status among the EV population. For example, we can use i = 1 to represent a high initial SOC level and conversely i = 2 a low initial SOC level. Note that variables N o p i n and N i o s p i n are naturally linked through the following relationship:
N o p i n = s = o S N o s p = p = 1 S i = 1 I N i o s p                       o S , p P ·
The objective of our WCL traffic control model is an integration of the two components mentioned in Section 3.3.1 and Section 3.3.2 to balance both the traffic and energy performances. Specifically, the objective is to maximize the weighted sum of the time-weighted number of vehicles served as defined in (8) and the total increased electric energy of the EVs as defined in (16). Mathematically, the control problem is formulated as follows.
maximize   α p = 1 P P p + 1 · d = 1 S N d p o u t   + β p = 1 P o = 1 S 1 s = o S 1 ( N o s p N o s + 1 p ) E o s i n c + N S S p E S S i n c ·
subject to Equations (2), (3), (9), and (17), and
N o s p R o s p N o p i n       s 1 , , S ,     p 1 , , P , o { 1 , , s } ,
p = 1 p s = o S N i o s p p = 1 p Q i o p i 1 , , I ,   o 1 , , S , p { 1 , , P } ,
N s p x C s     s 1 , , S ,     p 1 , , P , x { 1 , , s + 1 } .
N i o p   N i o p m i n   i 1 , , I ,   o 1 , , S , p { 1 , , P } ,
N i o s p R o s p = N i o s p R o ( s + 1 ) p   i f   o s < s i o m i n N i o s p R o s p N i o s p R o ( s + 1 ) p   i f   s i o m i n s < S         i 1 , , I , o 1 , , S 1 ,   p 1 , , P
N i o s p 0         s 1 , , S ,   p 1 , , P , i 1 , , I ,   o 1 , s .
In the objective function (18), α and β are two positive weights chosen by the traffic operator, which will be referred to as ‘trade-offs’ in the rest of the paper. The allocation of trade-offs α and β will determine the priority among the two components in the objective. When the two components have comparable magnitude (as in the case of our numerical example), one can simply set α + β = 1 .
In the above model, constraint (19) defines the allowable values that N o s p / N o p i n can take, which is bounded by the expected demand ratio R o s p    by our assumption (a). Constraint (20) states that the total number of EVs with any specific initial SOC type that are served by an on-ramp up to any time point does not exceed the accumulated demand of this type of EVs for entering the same on-ramp up to that time. Constraint (21) specifies that all traffic volume values for each expressway segment are less than the corresponding vehicle carrying capacity for that segment. Constraint (22) specifies the minimum number of EVs with a certain initial SOC type to be serviced at each on-ramp, alleviating the uneven distribution of service levels (i.e., the proportion of EVs served) and the waste of charging resources. To ensure a fair minimum service level for each group of EVs, one may set N i o p m i n to be a common proportion of Q i o p for all i { 1 , , I } . Constraint (23) reflects that for EVs with the same initial SOC type and come from the same on-ramp in a period, as the number of expressway segments passed increases, the number of EVs on the expressway (normalized by the corresponding passing ratio) is nonincreasing in general but is constant through segment s i o m i n (as a result of assumption (c)). Here s i o m i n is the index of the segment that an EV with initial SOC type i entering the expressway from on-ramp o must at least pass through if no further than its destination off-ramp. Generally, we set s i o m i n larger for groups i with lower SOC, indicating that the controller will prioritize EVs with lower SOC levels for longer use of WCLs when potential total demand exceeds WCL capacity, e.g., an EV with a higher SOC level will be commanded to leave the WCL sooner, e.g., after surpassing only one or two segments, when traffic flow on some downstream segment approaches its capacity. Constraint (24) requires that the decision variables are all non-negative.
Now we discuss the complexity of the above maximization problem (18). First note that the set of variables { N i o s p } can be viewed as the decision variables, so there are I S 2 P that many decision variables. It is easy to see that the objective function (18) is linear in these decision variables because of relationship (3). Furthermore, it can be verified that all the constraints can be translated to linear constraints in these decision variables, and there are totally O ( I S P + S 2 P ) constraints excluding the nonnegativity constraints (13). Therefore, the above problem is a linear programming problem whose size increases only linearly in I and P and quadratically in S , which can be solved efficiently and has good scalability, meriting potential for practical application.
We also remark that for efficient computation, our current model is made simple by assuming fixed entry/exit plans per vehicle, which are usually subject to error due to system disruptions. In real implementation, a closed-loop control logic must be adopted to account for real-time situations such as incidents that may affect problem input, such as EV demand profile and road capacity. At each period, the controller will update the parameters and recompute the decision variables for P time periods ahead, and only the decision variables for the next period will be implemented, after which a new planning problem will be revealed and solved. This is essentially a rolling horizon approach, as adopted in many traffic control scenarios [43].

4. Numerical Example

In this section, the WCL traffic control model presented in Section 3 is applied to the example analysis. The input parameters for the numerical example are first defined, then some numerical results of the traffic control model are obtained by solving the linear programming model and compared with the model with consideration of only traffic performance or energy performance. Finally, the impact of trade-offs and charging efficiency on the WCL traffic control model is discussed.

4.1. Parameter Setting

For testing the performance of the developed WCL traffic control model in daily traffic conditions, we study a hypothetical 60-km long expressway with seven segments, whose lengths are (in km): L 1 = 5 , L 2 = L 3 = L 4 = 10 , L 5 = 5 , L 6 = 8 , and L 7 = 12 . The solution will be simulated over a 3-h period, consisting of six 30-min time periods. These settings of the expressway system are extended with reference to the example from Papageorgiou [44], considering the need for vehicle charging. The other parameters used in our numerical experiment are:
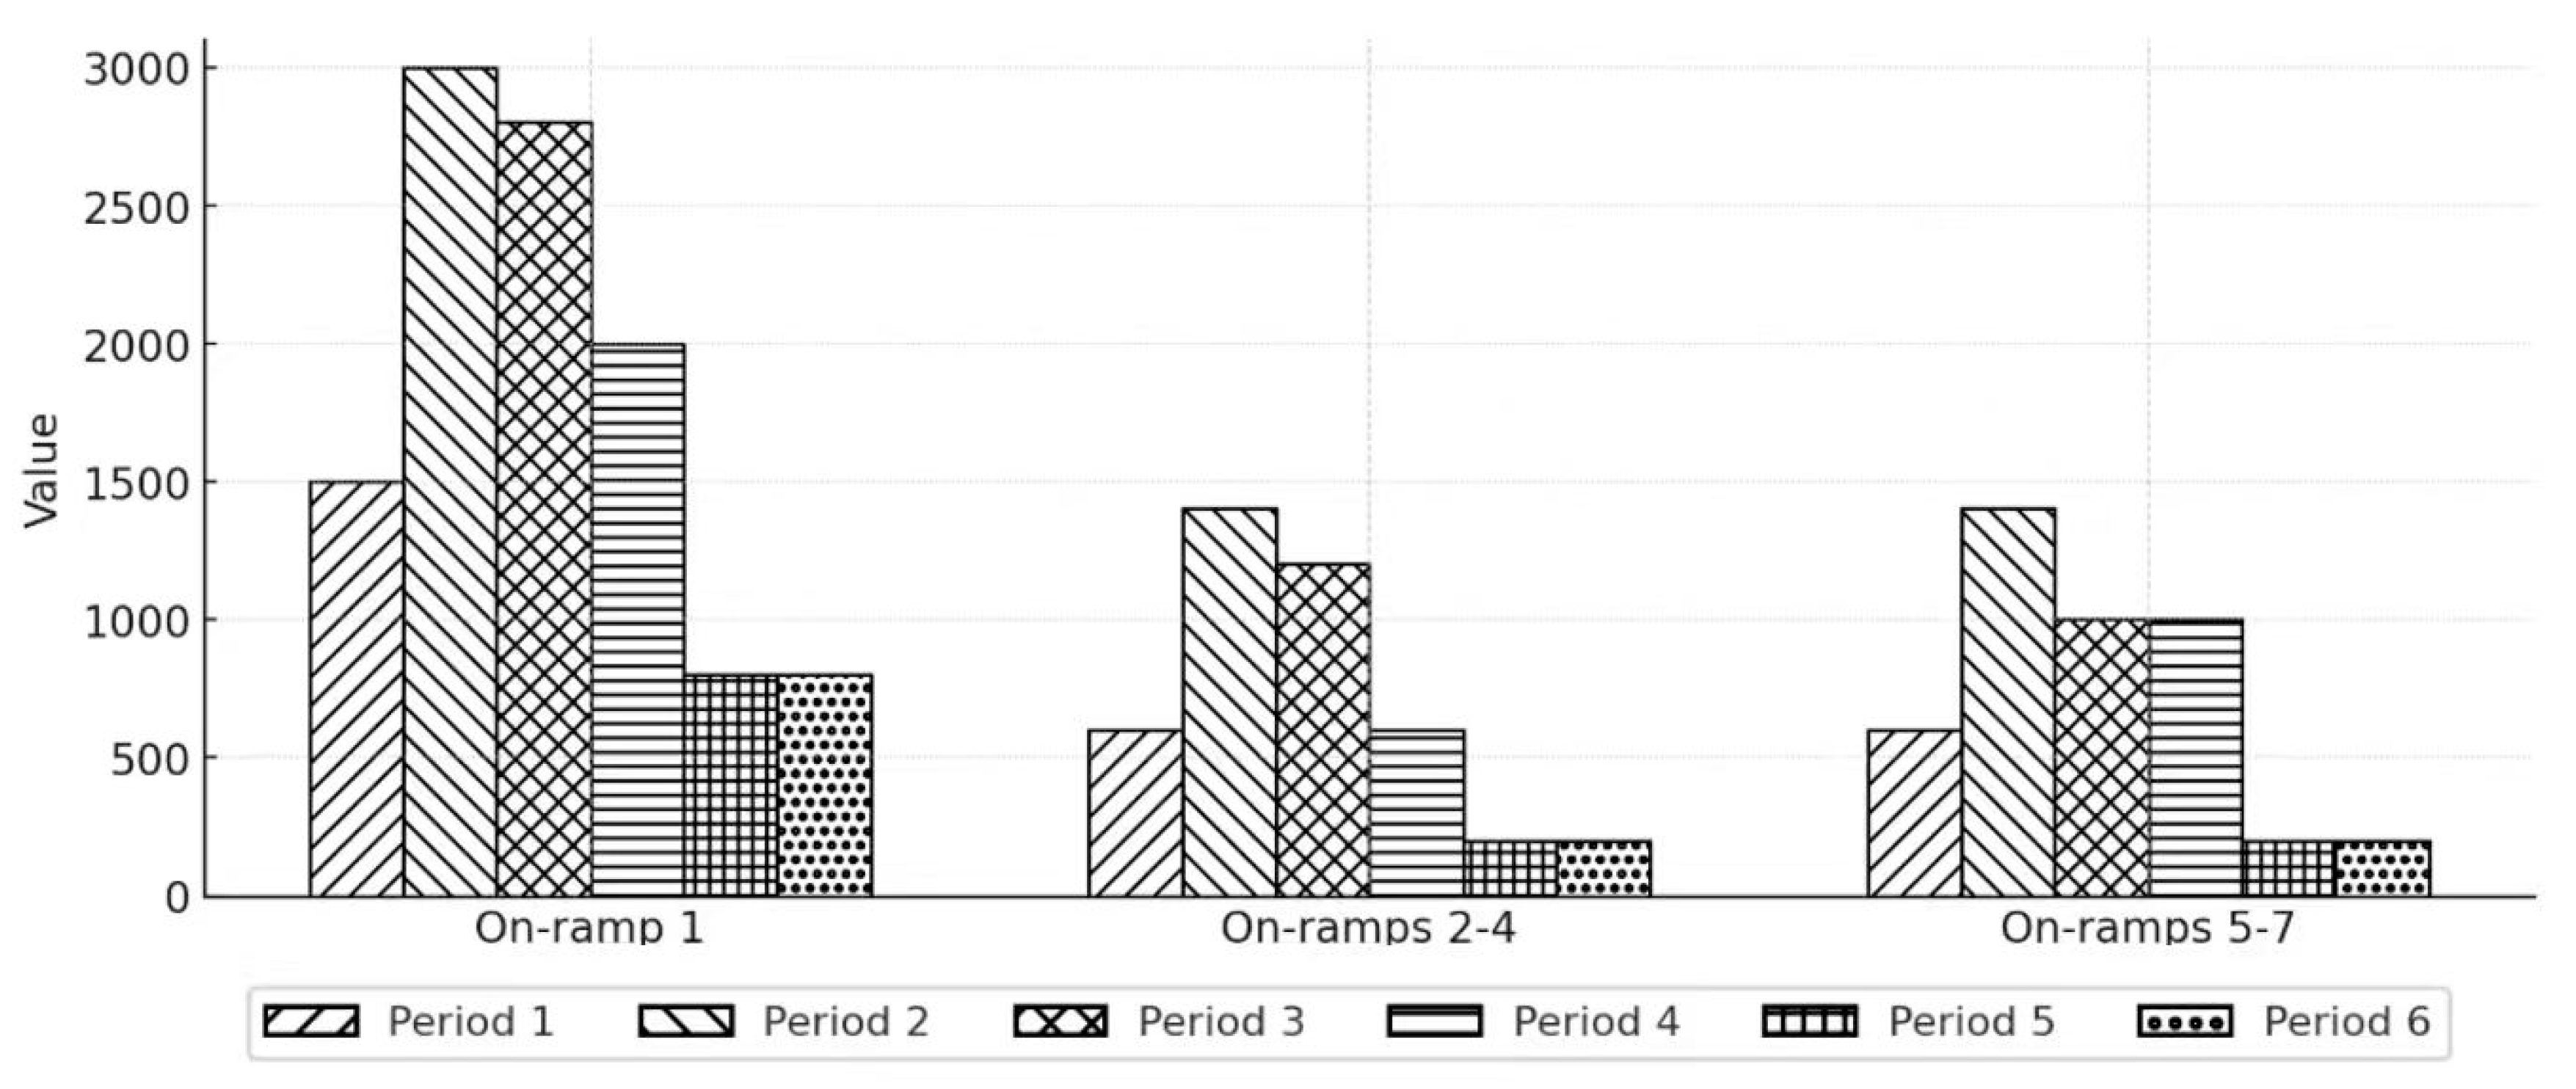
  • Traffic demand: referring to the assumption by Papageorgiou [44], the demand profile for seven on-ramps over six time periods is given in Figure 3, which shows that demand peaks rapidly in the second period and decreases significantly in the fifth period, reflecting the process of change in actual traffic flows from peak to off-peak periods. Demand from high initial SOC vehicles and demand from low initial SOC vehicles are shared in 50% at each on-ramp of each period.
  • Origin-destination ratio: the values of the vehicle passing ratios for seven on-ramps on seven segments are given in Table 2 For simplicity, the ratios remain constant over the six time periods in this example.
  • Vehicle carrying capacity of the WCL: capacity for all segments is taken to be 3300 veh/h due to the setting of one WCL.
  • Vehicle speed: travel speed of 80 km/h on the expressway mainline, which is less than the current speed limit for expressways (~100 km/h), given the need for EV charging. Though EVs may experience speed variation during ramp merging, the speed of an EV after entering or before exiting the mainline is assumed to be 80 km/h.
  • Vehicle battery capacity: battery capacity for all EVs is set at 55 kWh according to the average battery capacity data from the IEA [45].
  • Initial SOC types: we consider two groups of SOC levels to illustrate the usage and insights of our model: those with low SOC levels (20%) and those with high SOC levels (50%). The demand for the two groups is equal at every on-ramp. This setting considers the statistics that most stationary charging events of EVs started with 20~80% SOC, and the most frequent starting SOC levels are 50~60% [46], and the fact that range anxiety can be reduced with DWC.
  • Charging efficiency:  η is set at 80%, referring to the summary of Bi et al. [47] on the current practical dynamic wireless charging efficiency.
  • EV energy consumption:  p s , 0 is set at 10.4 kW (or equivalently per distance consumption of 0.13 kWh/km) in reference to the simulation results for five popular vehicle models (Nissan Leaf S, Renault Zoe R110, Kia Niro, Hyundai IONIQ, and BMW i3) by Sagaria et al. [48]. Note that this value is also close to the data samples generated by Wu et al. (2015) [42]. We use E o , i n c o n = 0.04 kWh and E d , o u t c o n = 0.01 kWh based on the consumption rate data by Wu et al. [42] and the assumption that the EV has an acceleration/deceleration of about 4 ft/sec2 [49] with a duration of about 7 s, a speed increase/decrease of 20 km/h.
  • Power transmitted by the DWPT system: the receiver coil can receive energy up to p t x = 40 kW from the transmitter coil based on the setting by García-Vázquez et al. [38].
  • Minimum entry flow and passing-through segment: the minimum number of EVs with both initial SOC levels to be serviced is set to be 10% of the corresponding demand, i.e., N i o p m i n = 0.1 Q i o p . Parameter s i o m i n is simply set as S and o for EVs with low and high SOC levels, respectively, to reflect their different charging needs and how our controller prioritizes between EVs with high and low initial SOC levels.
  • DWPT layout: the layout is referenced to García-Vázquez et al. [38], which is based on one of the layouts proposed by Transport Research Laboratory [50]. This configuration provides a power transfer segment with a total length of L t a = 39 m, each consisting of three coils with length L t c = 8   m spaced by a gap L c c = 5 m. The distance between segments is the same as the gap, L a a = 5 m. Recall that these DWPT layout parameters are depicted as in Figure 2.

4.2. Model Analysis

Based on the setup in Section 4.1, the energy available to EVs on the WCL for each segment can be calculated, as shown in Table 3 The WCL on the whole seven-segment expressway can provide 16.31 kWh of electricity for EVs, dynamically increasing the driving range by about 16%, given the power loss of 7.85 kWh over the entire route, including ramp merging.
The trade-offs α and β are both set to 0.5 as the initial value to reflect the equilibrium mode of the traffic control model. Table 4 shows the planning solutions for the model with a maximum value of 139,980.5 for the objective function (7); however, since the two components, i.e., the time-weighted number of EVs served by the expressway and the sum of the power increase of all the EVs, have different units, these two components will be discussed separately.
For the traffic service part, the time-weighted number of EVs served by the expressway obtained by the solution is 137,295 veh/h. Table 4 gives the optimal results for every on-ramp at every period under the WCL traffic control model. In contrast to Table 2, the numbers of EVs serviced by on-ramps 1~4 all fall short of demand during peak periods, with response rates of 60–80% for most demands and less than 50% for the lowest. The remaining unmet demand begins to move onto the expressway on a large scale from the off-peak period. For on-ramps 5~7, the vehicle demand response rate only performs poorly in the period bridging the peak and off-peak due to the arrival of peak traffic from the preceding on-ramps. Table 5 divides the values in Table 4 into two parts, representing the numbers for EVs with an initial SOC of 20% and 50% respectively. It can be noticed that more EVs with an initial SOC of 50% are being served at earlier times, which is reasonable considering that they are likely to leave the WCL midway to add more EVs to be served.
For the energy charging part, the total increased energy value of the EVs obtained by the solution is 142,666 kWh, enabling a total number of 3284 EVs with an initial SOC of 20% to be fully charged. Table 6 reflects the proportions of EVs with an initial SOC of 50% driving on the WCL, which are more than half for almost all expressway segments and all periods. This guarantees that EVs with a high initial SOC will also receive sufficient electrical energy under the developed control system; otherwise, it would be pointless for them to enter this expressway. Besides, a problem can be identified from Table 6 concerning the allocation of resources to EVs travelling on the same segment but entering from different on-ramps. For instance, only 45% of EVs entering from on-ramp 5 travel on the WCL in segments 6 and 7, much less than the proportion from on-ramps 1~4 in that segment, an imbalance that causes the WCL to be unfairly utilized for vehicles with a higher SOC. This problem can be a direction for future research in the optimization of WCL traffic control models.
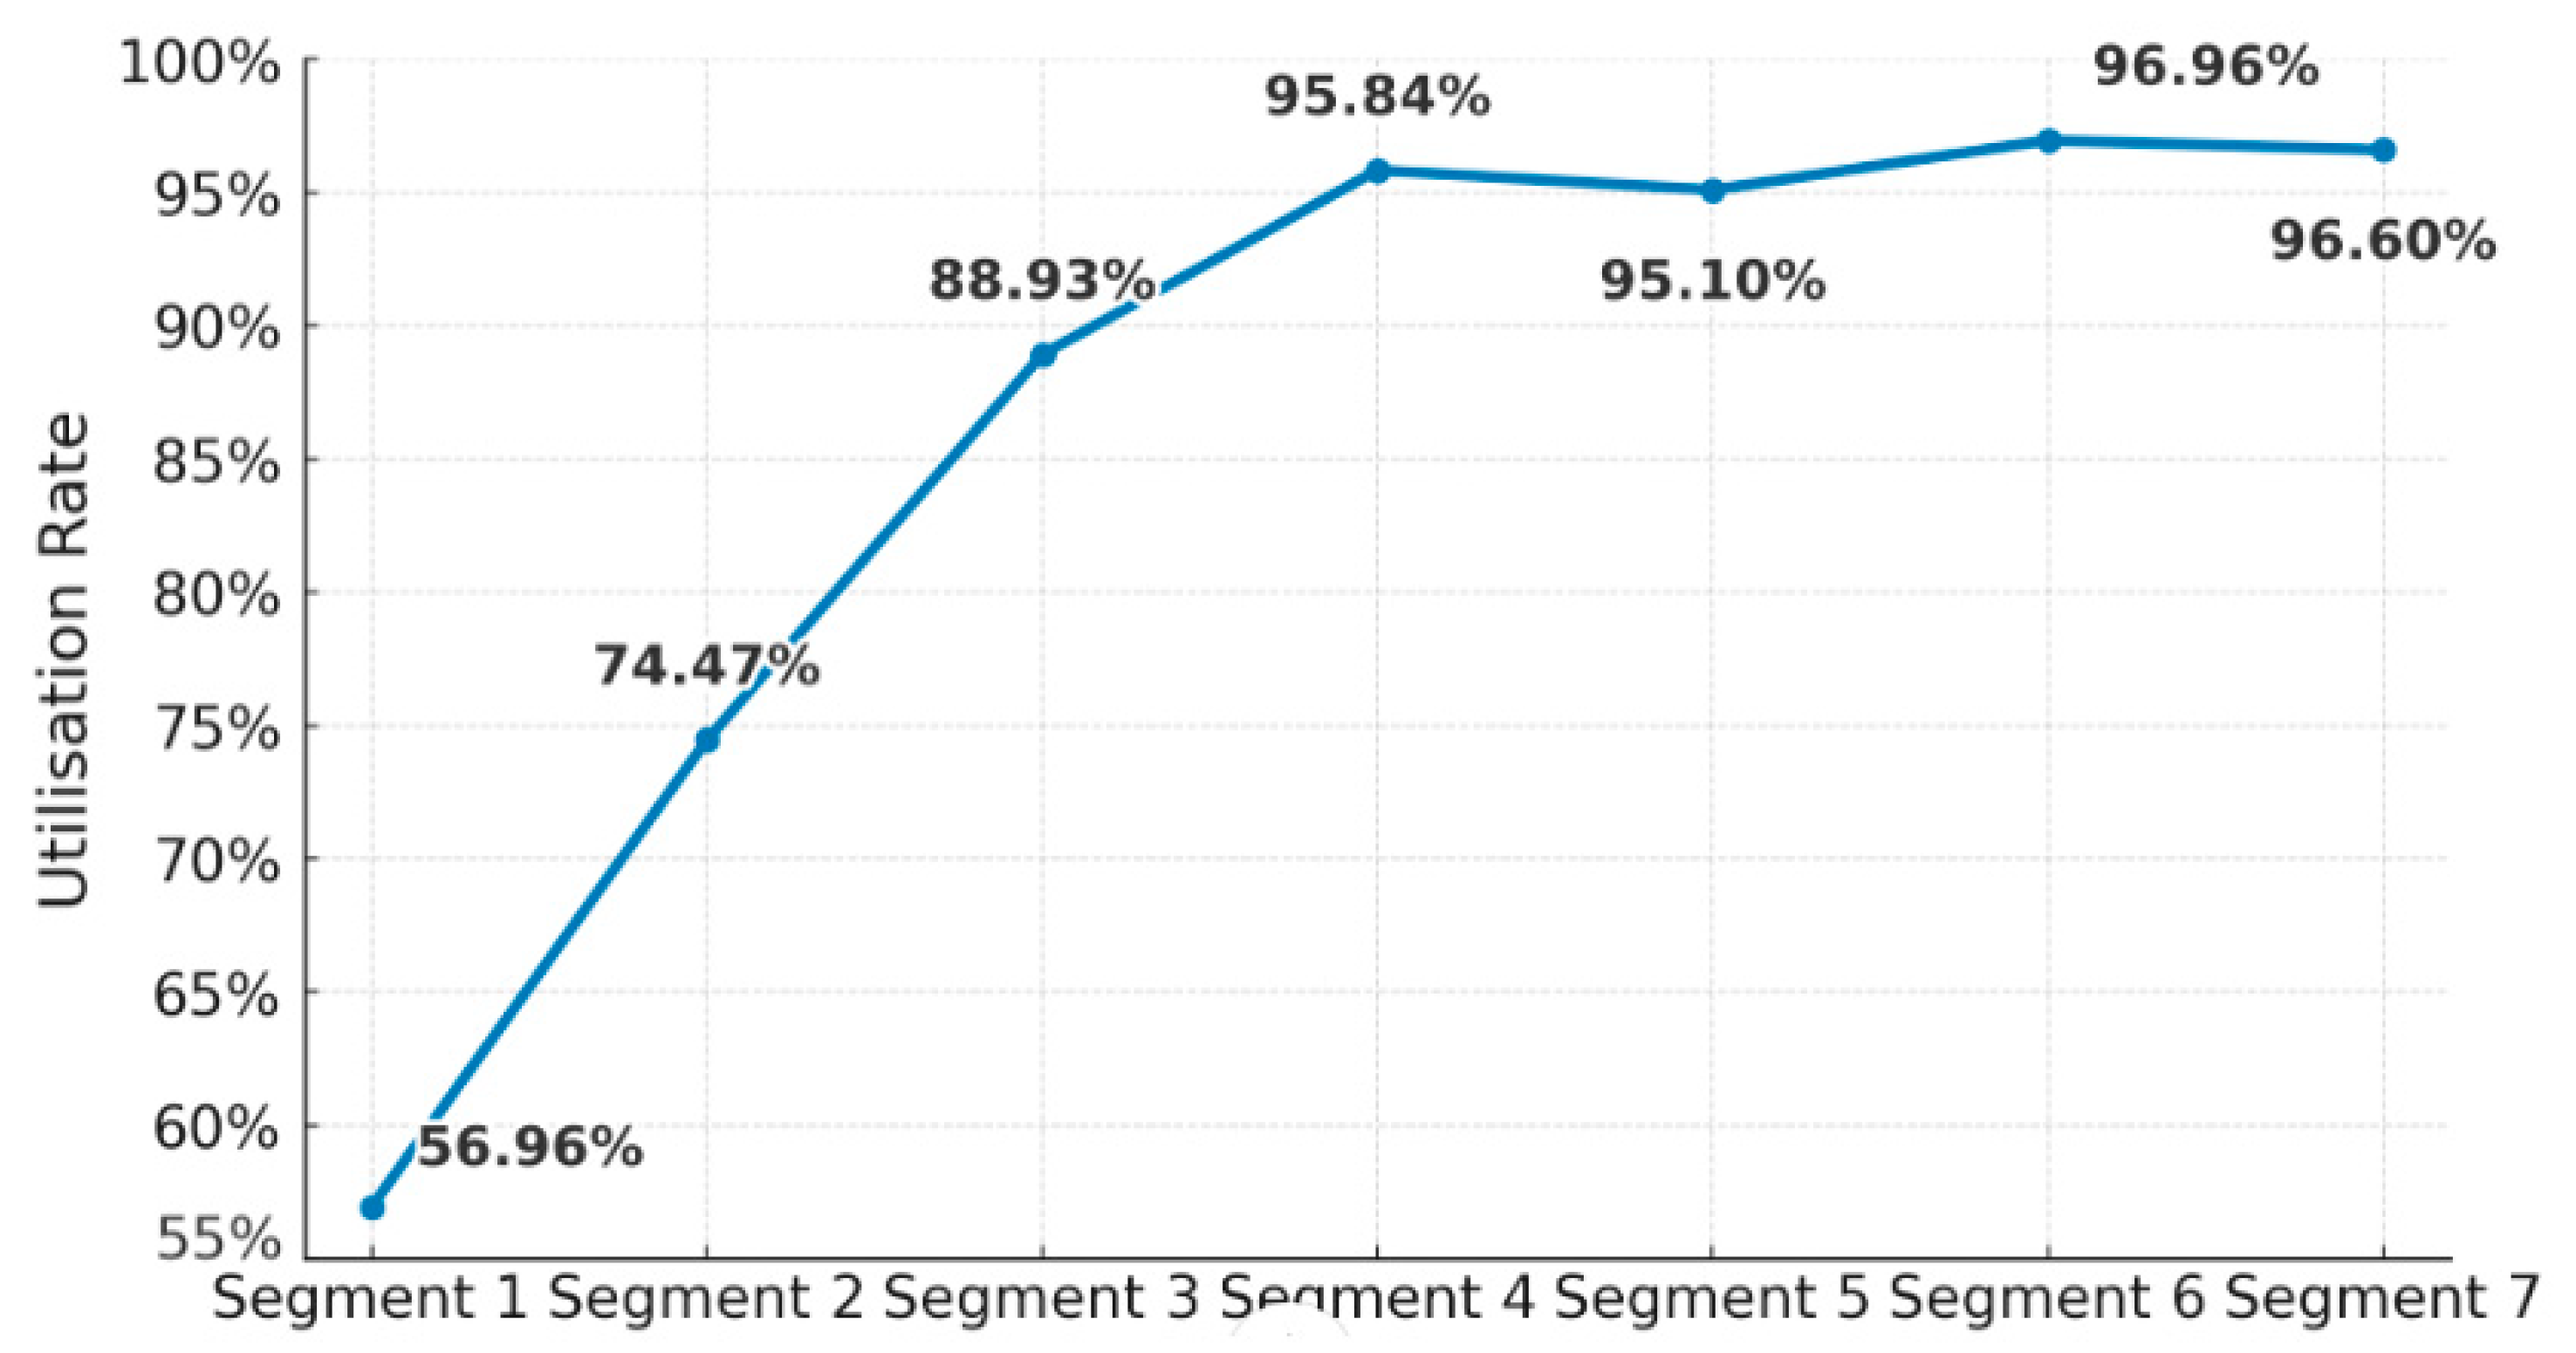
Figure 4 gives the WCL occupancy rate for each segment, which can be obtained by comparing the actual traffic flow and the carrying capacity of the segment during the same period, and it can be concluded that: (1) For segments 1~3, the rate of WCL use is significantly lower in periods 1 and 6 than in other periods, due to insufficient traffic volumes at the beginning of the expressway operation and during off-peak periods; (2) For segments 4~7, they all achieve rates of over 85% when the expressway is in steady operation (i.e., periods 2~6) and even approach 100% for several periods, demonstrating that our solutions make full use of the WCL. To further obtain the actual utilization rate of WCL in each segment, the mean values of periods 2~5 (representing stable operation) are compared, as shown in Figure 5. We can see that the rate steadily increases from less than 60% in segment 1 to nearly 90% in segment 3 and remains above 95% in segments 4~7.
To further verify the proposed coordinated control model, it is worthwhile comparing the solutions of the basic setting when α = β = 0.5 to the more extreme cases with α = 1 and β = 0 (traffic input maximization problem) and with α = 0 and β = 1 (energy charging maximization problem).
Note that this comparison also serves as a ‘benchmark’ to our control model, as we have not found any other method that addressed the same WCL traffic control problem as we defined in Section 3.3.3 (with strictly positive weights α and β ). In particular, the case with α = 1 and β = 0 corresponds to the popular model-based traffic control strategy, which can serve as a representative of the traditional control strategy that only considers traffic performance.
Table 7 shows the planning solutions for the three models, comparing in terms of the two components in the objective function, which reflects the comprehensiveness of the developed traffic control model, reaching over 90% of the optimal solution when only one of the single components is to be maximized. However, when either α or β takes the extreme value of 1, the performance in terms of the objective other than the one that is optimized is significantly worse compared to the best possible value. Especially when α = 1 , the electrical energy received by all the EVs is only 67.2% of that under the optimal solution when the total energy is charged the single objective to be maximized.
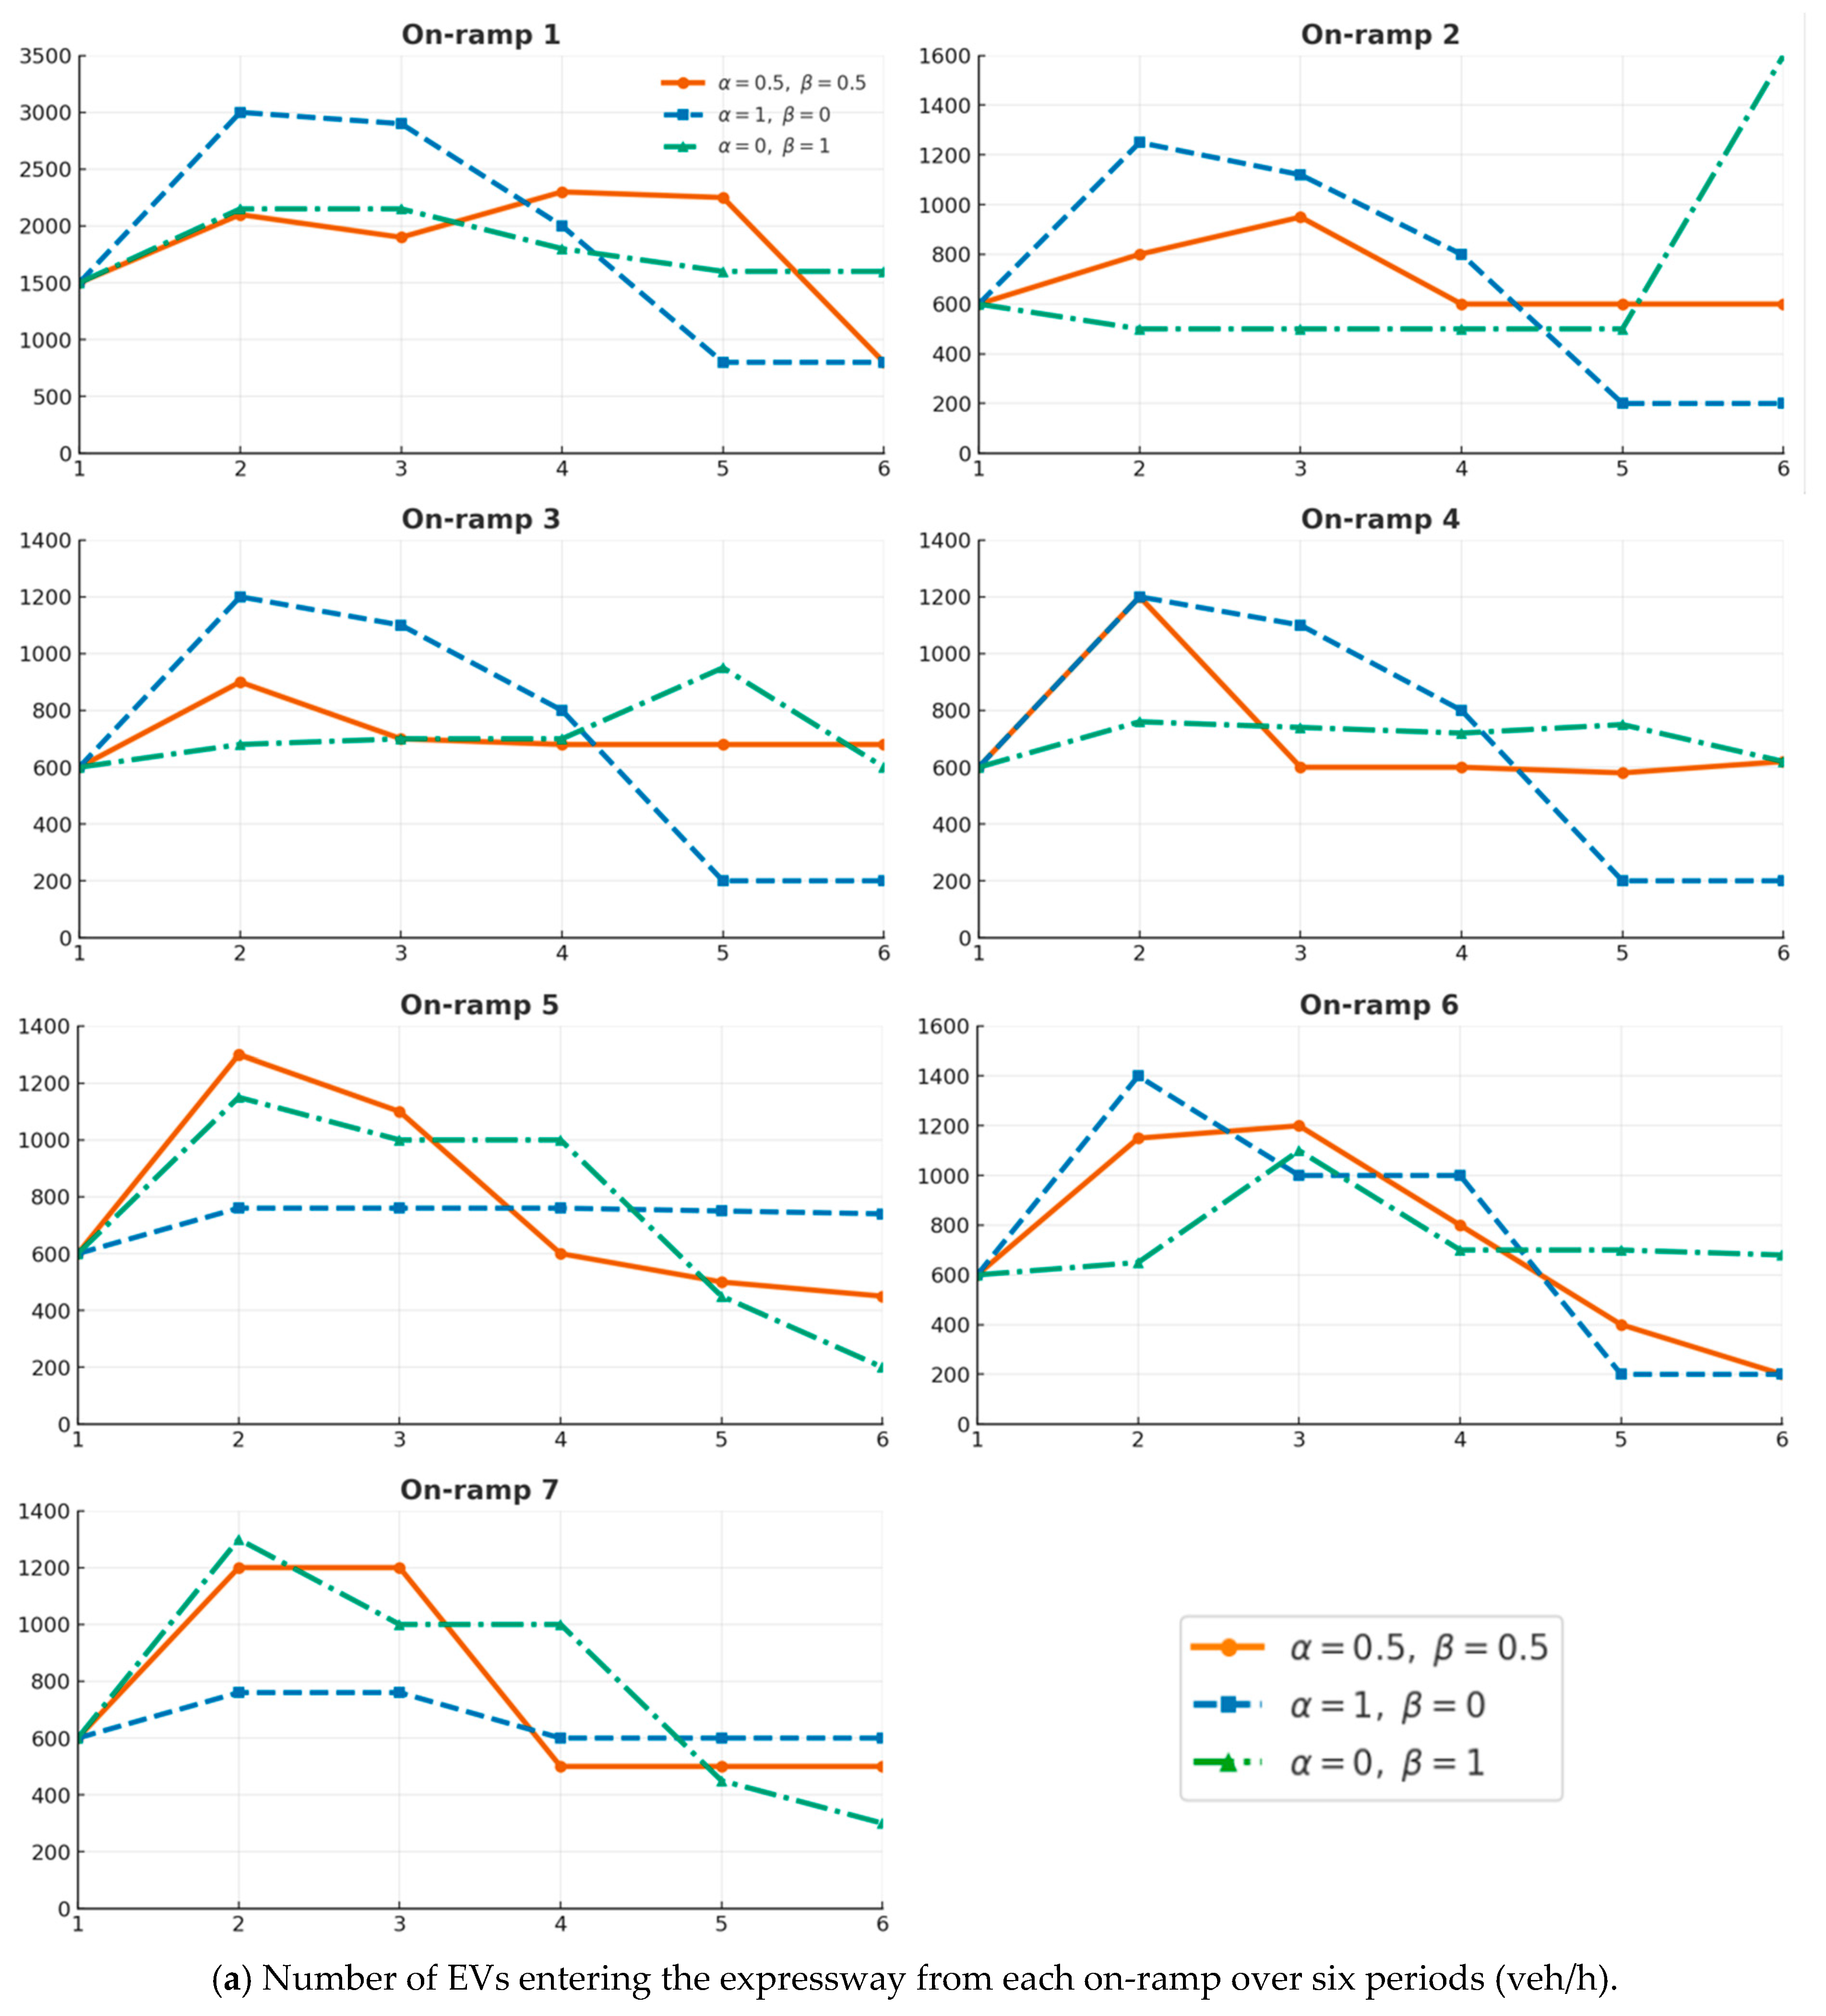
Figure 6 further compares the results of the three models. Specifically, Figure 6a,b focus on comparing the on-ramp traffic inputs, while Figure 6c compares the WCL utilisation rates under steady operation. We can see from Figure 6a that when α = 1 , the vehicle input curve at each on-ramp is similar to the demand curve, meeting close to 90% of the demand even during peak hours, which is achieved by the traffic control system issuing commands to all EVs with a high initial SOC to switch to the GL at the first opportunity. Although this allows more EVs to be served in time, it is unacceptable for all EVs with a high initial SOC to receive energy only on the segment where they enter. When β = 1 , the vehicle input curve has little fluctuation between periods 1~5, which can lead to a polarisation of service. For the EVs whose needs are first responded to, they enjoy a significant amount of charging time without facing queuing times, whereas other EVs need to suffer excessive queuing times consequently. While the vehicle input curve of the WCL traffic control model lies mostly between the above two models, it remedies their respective limitations. Figure 6c shows that when α = 1 , the WCL utilisation rate for segments 2~7 is markedly lower than the other two scenarios, which is also consistent with the conclusion drawn in Figure 6b. Moreover, the usage rates for each segment under the WCL traffic control model are slightly different from the optimal solution when only energy charging is optimized, even higher in segments 2~4, reflecting nearly no loss of trade-offs in the charging part. Overall, the proposed WCL traffic control model with trade-offs α = 0.5 and β = 0.5 performs well in terms of both traffic and energy services, particularly giving a near-optimal solution in the energy part.

4.3. Impact of Trade-Offs

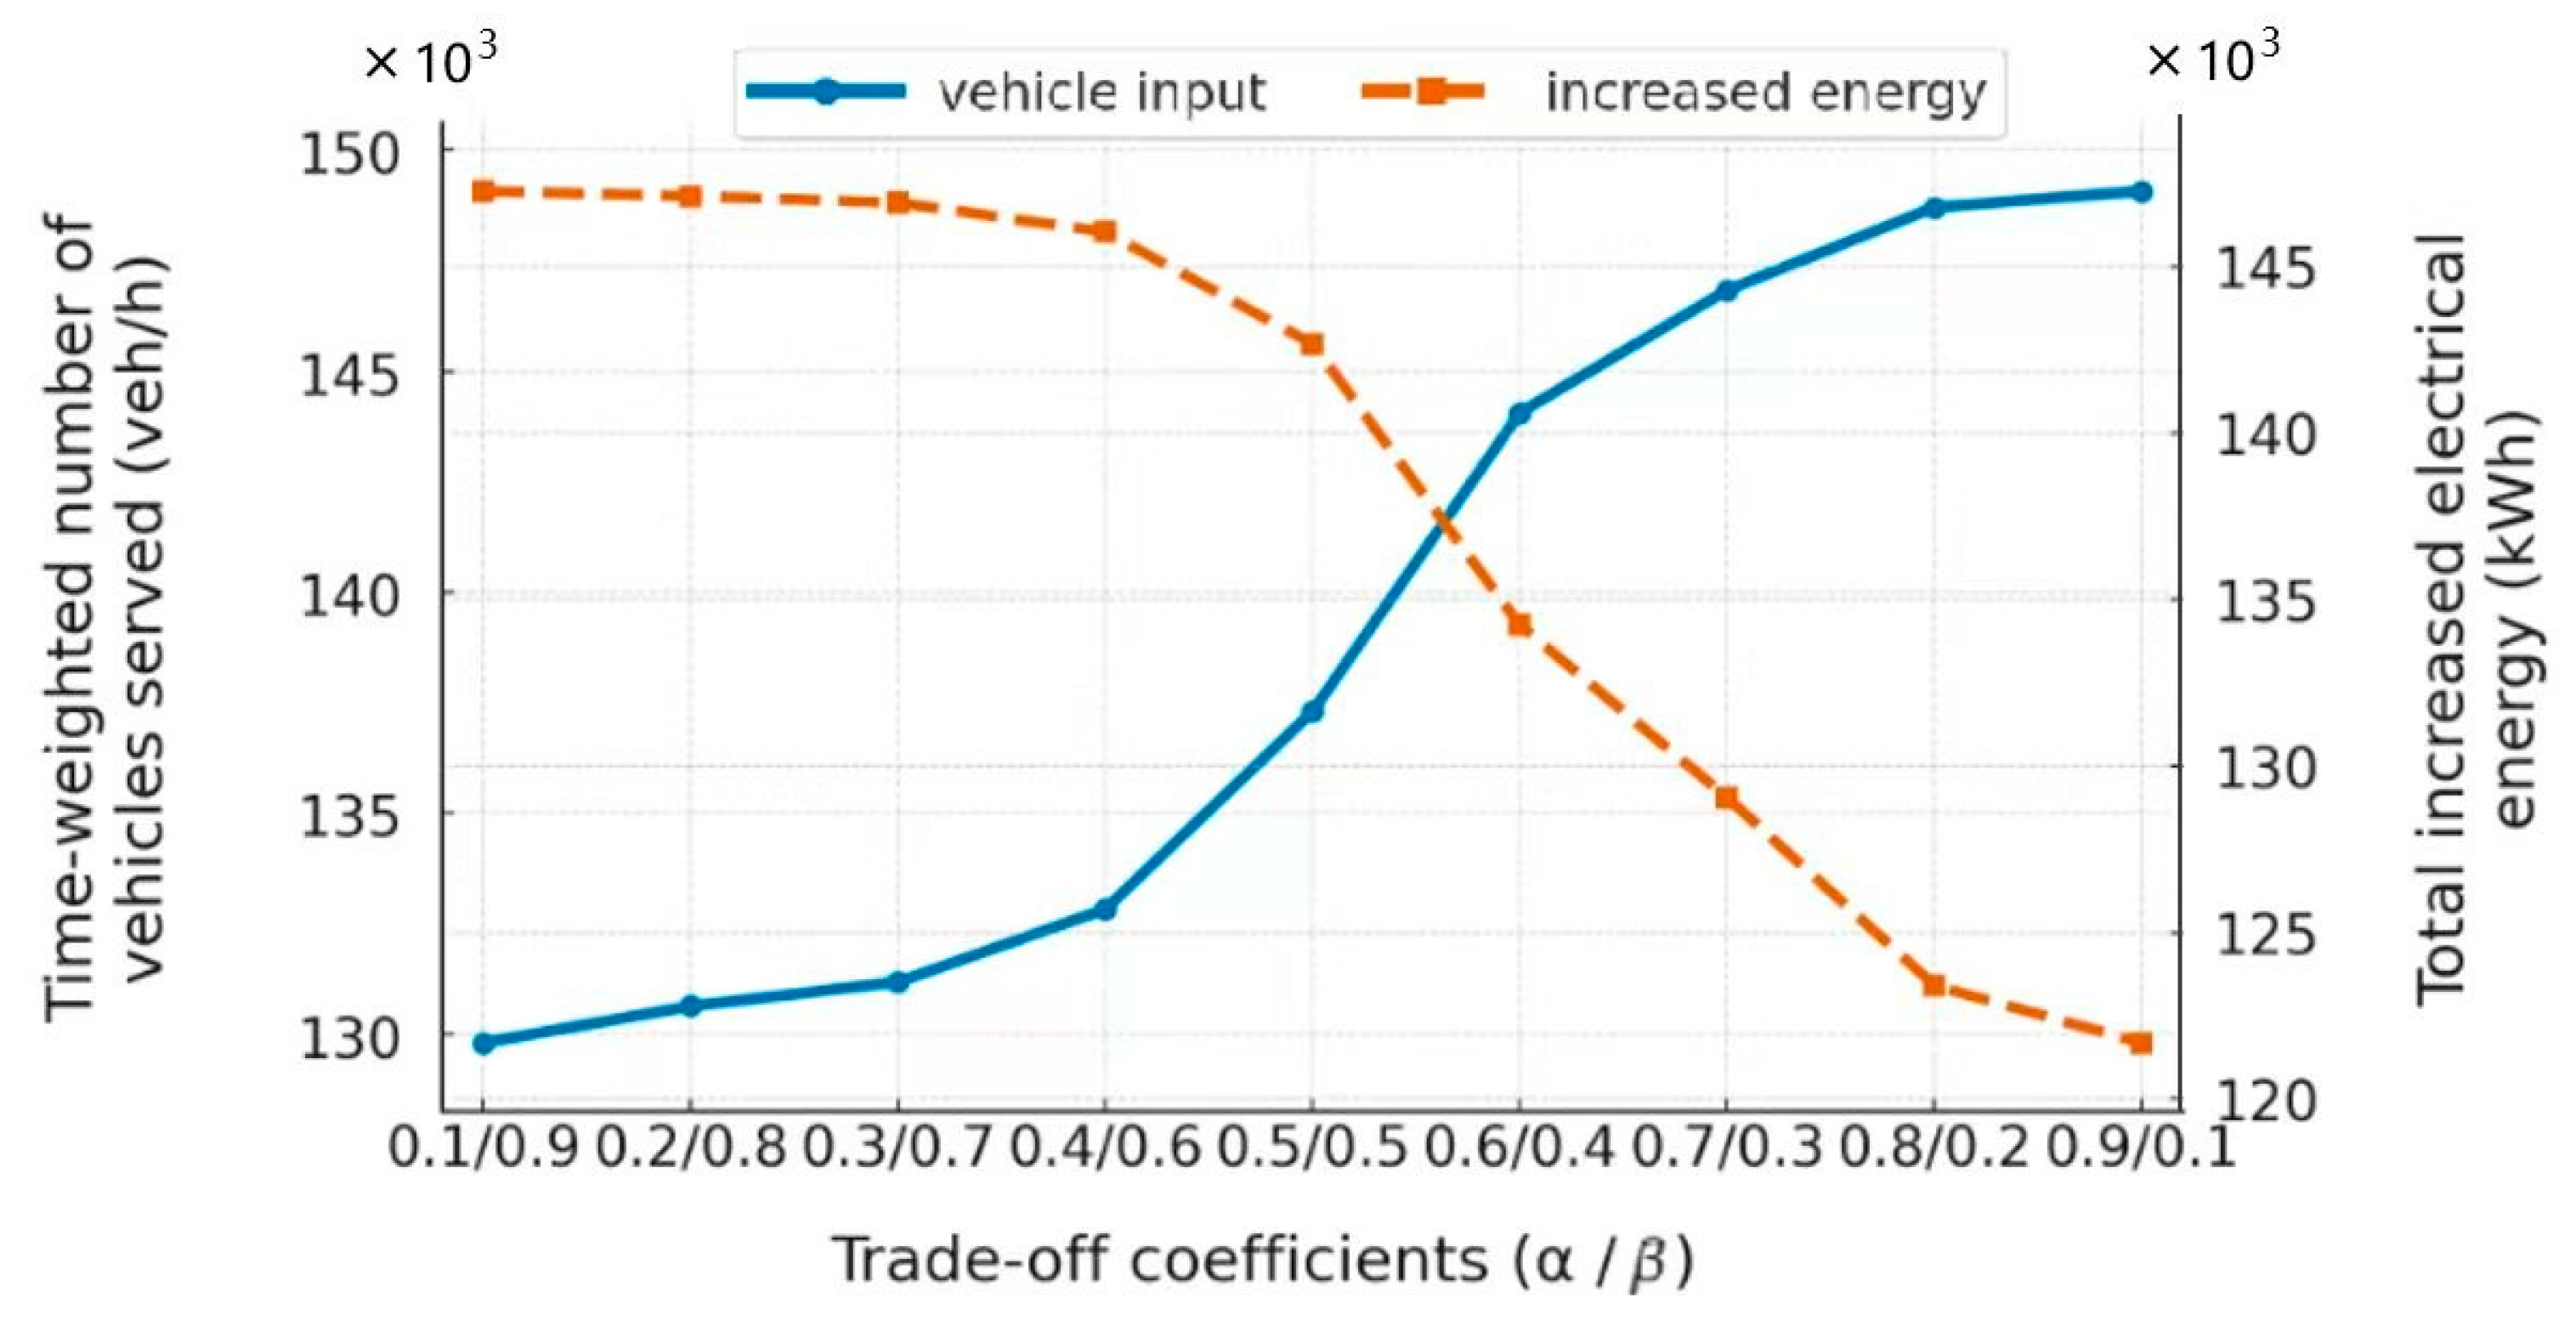
To further explore the impact of the trade-offs (i.e., values of α and β ) on the developed model, we set α and β to one decimal place between 0.1 and 0.9, resulting in eight new schemes for comparison. Table 8 gives the values of the two components in the objective function of the optimal planning solutions for nine cases of trade-offs, including the basic case α = β = 0.5 , all of which achieve a better balance between the two parts of the objective function compared to the extreme case, even in the scenarios with α = 0.1 and β = 0.1 . Figure 7 plots the two components’ values over difference trade-offs, which indicates that the time-weighted number of vehicles served is negatively correlated with the amount of electricity received by all EVs, and the relationship between the two can be divided into three phases: (1) Both curves remain relatively stable when α / β takes values of 0.1/0.9, 0.2/0.8 and 0.3/0.7; (2) Both curves have a clear increasing/decreasing trend when α / β takes values of 0.4/0.6, 0.5/0.5 and 0.6/0.4; and (3) the increasing of the vehicle input curve is significantly slower than the decreasing of the increased energy curve when α / β takes values of 0.7/0.3, 0.8/0.2 and 0.9/0.1. In other words, the trade-offs have little impact on the model when α 0.3 and β 0.7 , while the trade-offs hurt the model when α 0.7 and β 0.3 , which can also be confirmed by Table 8 that compares the model solutions to the best possible one in terms of the value of the single component achieved by α = 1 or β = 1 . In summary, the trade-offs α and β for the developed WCL traffic control model are recommended to be between 0.3 and 0.7 in this example.

4.4. Impact of Charging Efficiency

The charging efficiency is set to 80% in this example, which in theory can reach over 90%. The increase in charging efficiency will enable all EVs to get more electrical energy on the expressway; however, the magnitude of this improvement in terms of the electrical energy received by EVs and the effect it will have on the vehicle input is unknown. If the charging efficiency improvement has an excessive negative influence on the vehicle input, a lower charging efficiency on the WCLs would be a more balanced option. To study the specific impacts of increased/decreased charging efficiency on the above unknown scenarios, seven additional efficiency values (i.e., 60%, 65%, 70%, 75%, 85%, 90%, and 95%) are selected for comparison with the current 80% efficiency value.
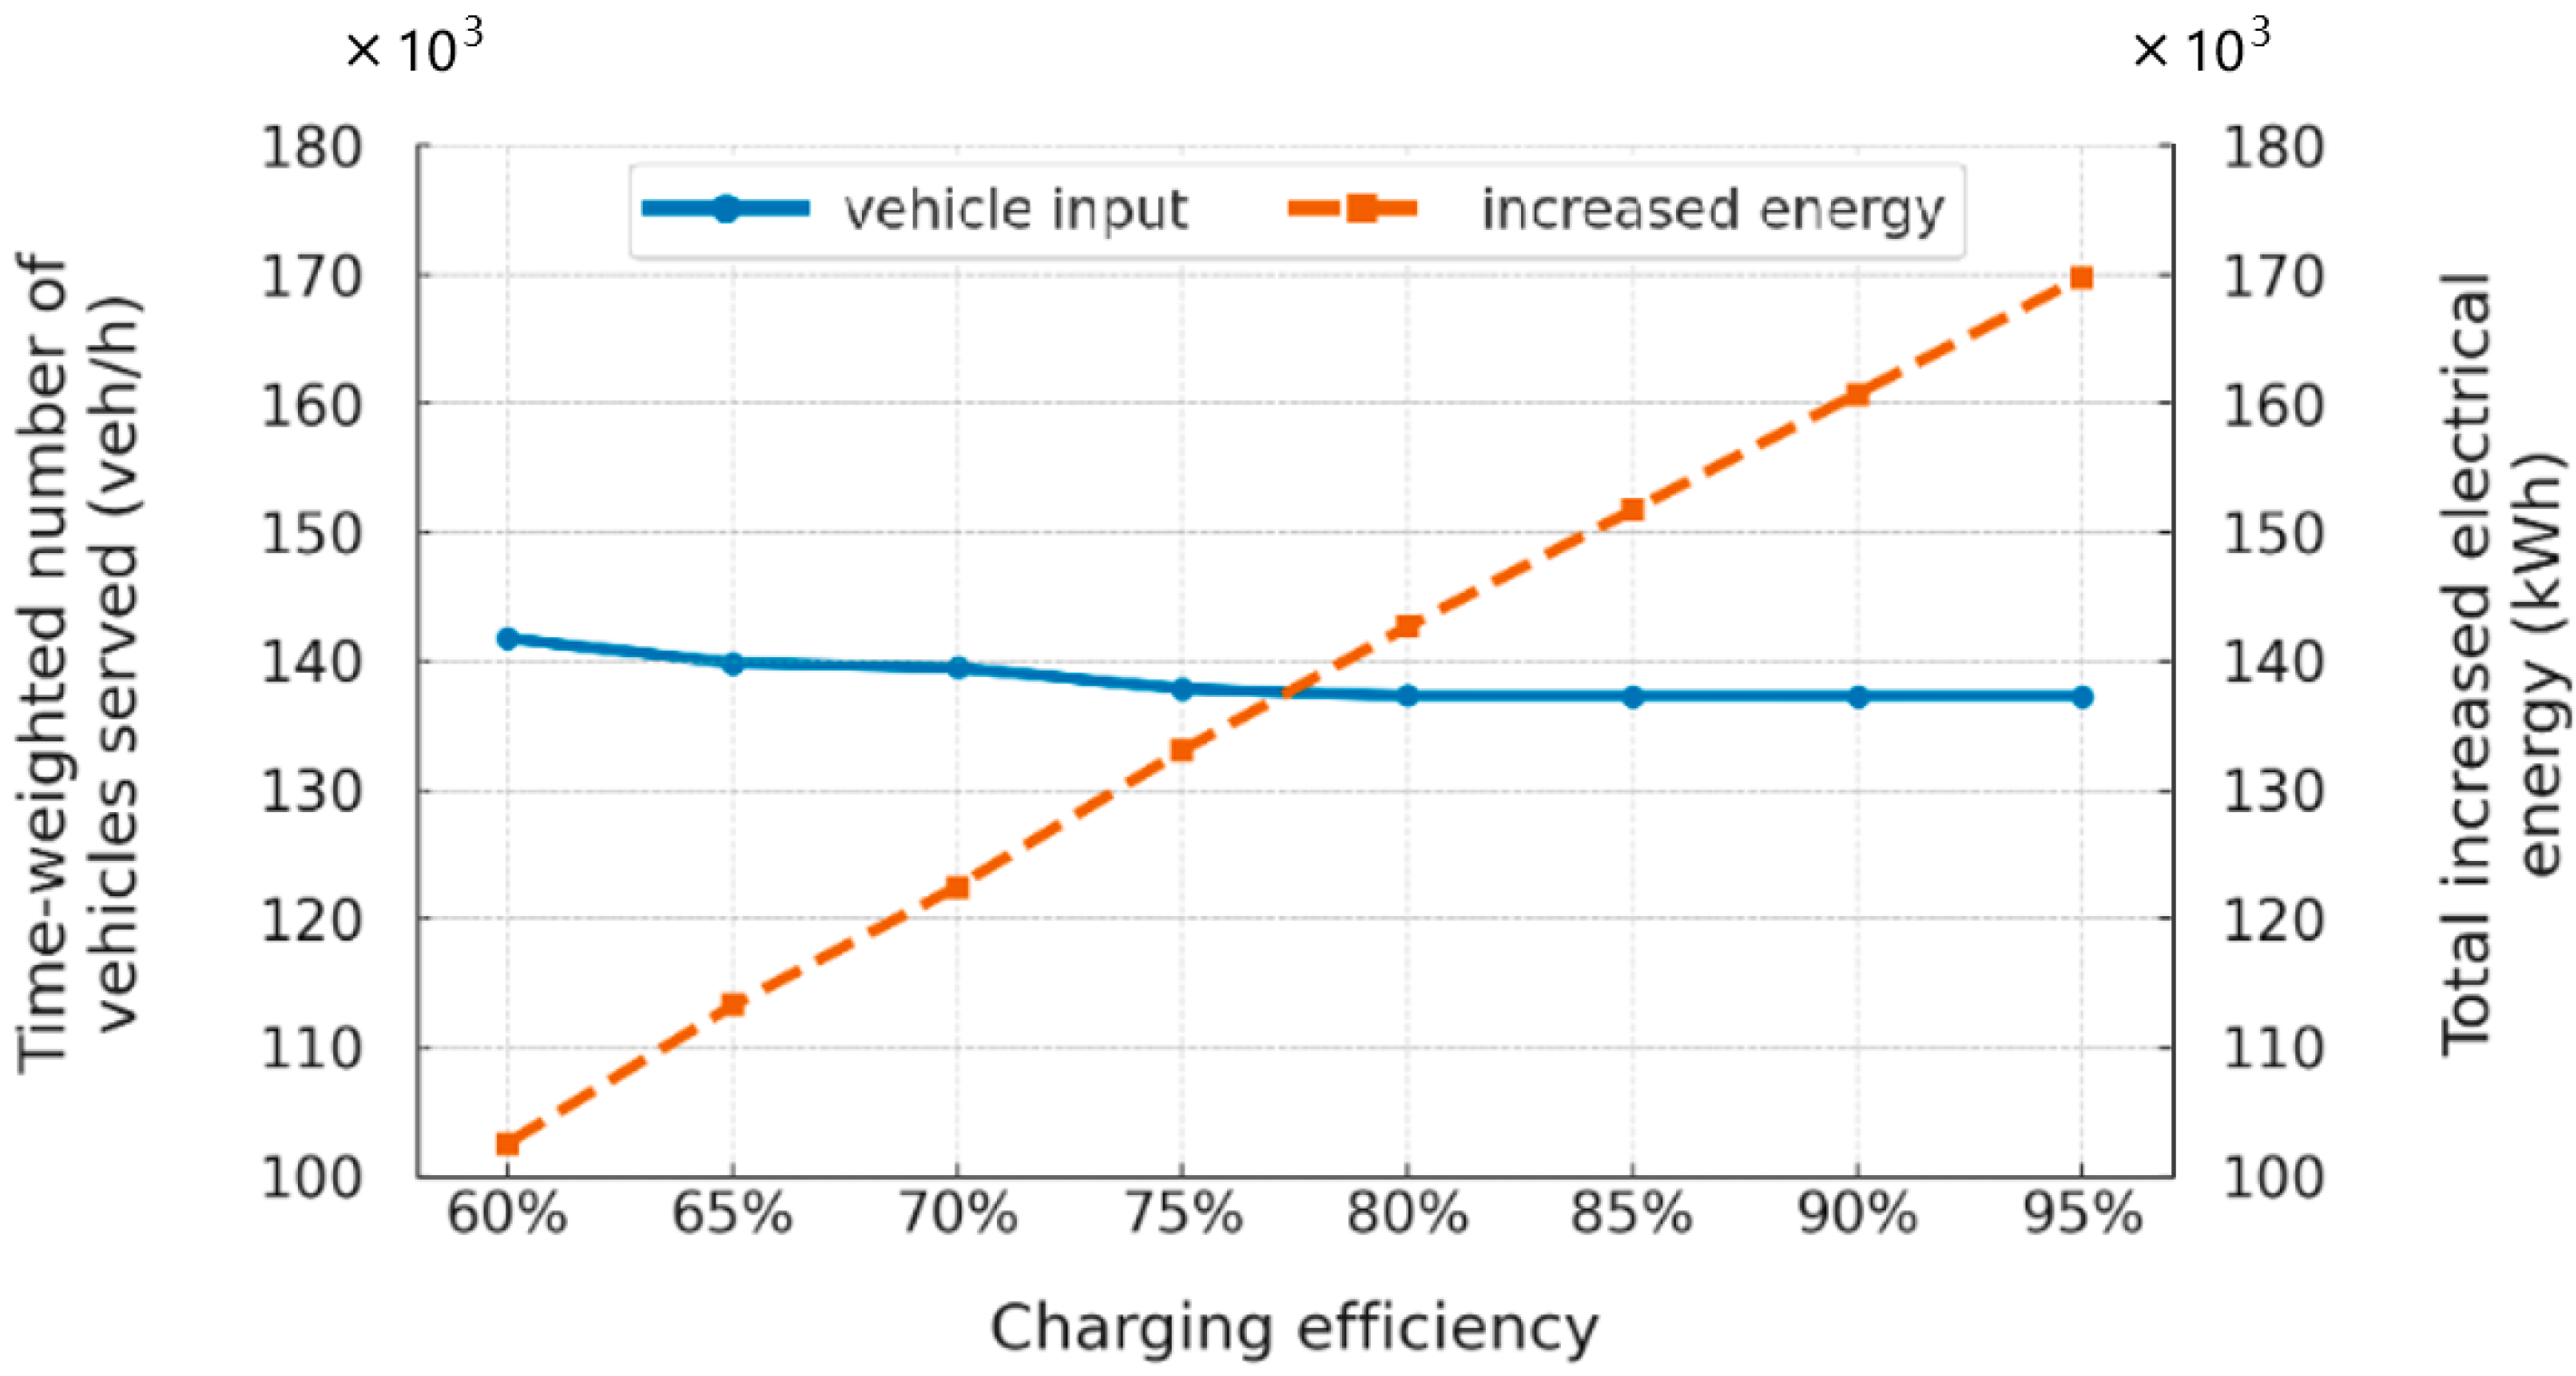
Table 9 gives the model outputs (i.e., value of the two components of the optimal objective value) at eight charging efficiencies, which were also plotted in Figure 8. The results lead to the following answers about the above questions: (1) The time-weighted number of vehicles served remains stable at all efficiencies and is barely affected by changes in charging efficiency over 75%; (2) Every 5% improvement in charging efficiency translates into an additional 9000 kWh of power for all EVs on WCL, which allows for an extra 204 EVs with an initial SOC of 20% to be fully charged. Therefore, research on charging efficiency improvements has a positive impact on the developed model.

5. Conclusions and Future Work

This paper proposes a novel EV traffic control model for an expressway system with WCL and multiple accesses. By coordinating the traffic inputs at different on-ramps and among different groups of EVs with varied initial SOC levels along the system, the constructed model maximizes the weighted sum of total energy received by EVs and the number of EVs using the expressway, with two adjustable trade-off coefficients to achieve flexible mixed optimization of WCL traffic control management. The model is formulated as a linear programming problem and thus can be efficiently solved for real-time applications. The proposed model also considers several realistic aspects, such as time- and spatial-variant traffic demand, energy profile change due to ramp merging, as well as the intermittent layout of the transmitter coil for wireless charging.
Numerical analysis shows that when traffic control management focuses on expressway usage, the total energy received by EVs exhibits a significantly higher downward trend than the upward trend of the number of EVs using the expressway, especially when the corresponding coefficient is greater than 0.7. On the contrary, when more emphasis is placed on the energy aspect, the total energy increase of the EVs performs at a level comparable to that under pure optimization of the energy performance, reaching over 99% of the latter, when the corresponding coefficient is at least 0.6. Therefore, the two trade-off coefficients are recommended to vary between 0.3 and 0.7 in our example. We also find that the increase in charging efficiency will not intensify the trade-off in the proposed traffic control model, improving the total energy received by EVs without harming the number of EVs using the expressway.
There can be plenty of future research to improve this topic, mainly considering the model simplifications in this paper. For example, more refined SOC distributions can be used based on National Household Travel Survey or EV-project datasets, and vehicle speed profiles can be calibrated from EV trajectory data, particularly when the EV enters and leaves the WCL. Such data ideally should be source from real deployed WCL systems, hopefully can be realized soon. Our model also ignores the momentary misalignment between the EV and the coil due to the EV’s lane-changing maneuvers, particularly at the merging areas near on-/off-ramps. Based on vehicle trajectory data, we may introduce extra charging power reduction at certain locations where such misalignment is frequent (in a similar manner as we modified the energy consumption rate in (13)). These would improve the accuracy of the predicted energy profile of the EVs and thus the robustness of the control model. Similarly, general-purpose lanes (GPLs) that are likely to go along with the WCL can be explicitly modelled, which may lead to more interesting insights since the speed of EVs on these GPLs will be generally higher than on the WCL, as they will not be charged on such lanes. Another natural extension is to consider uncertainty stemming from various disruptions such as incidents, EVs’ deviation from the command, or even cyberattacks [32]. However, efficient and robust control algorithms need to be designed to tackle nonlinearity and uncertainty.
In terms of the optimization problem for EV traffic control, the settings for queuing time cost and constraints on maximum queue length are ignored. However, drivers will not wait unconditionally to enter the expressway, instead making flexible choices depending on their respective time costs and the queue length at the on-ramp. For example, EVs with a high initial SOC will prefer to drive to an on-ramp without a queue to enter the expressway. Enforcing maximum queue lengths can effectively reduce waiting times, reduce EVs’ rerouting, and even optimize the proportion of demand at each on-ramp in the first place. Moreover, additional constraints for fairness among different groups of EVs can be introduced, such as the one proposed by Tan and Gao [43] in a dynamic tolling setting. Finally, we may extend our work to include cost/infrastructure limits and grid-aware scenarios. For example, we can explore the problem that optimizes coil density jointly with the operational goals, considering budget constraints for WCL installation and maintenance to find the most cost-beneficial plan in the long run. Besides, the interaction of WCL operation with upstream power-grid constraints (e.g., transformer loading, voltage profiles) may be considered. To this end, recent open-source tools such as V2Sim [51] can be applied to co-simulate traffic and grid impacts, and a simulation optimization framework may be utilized for a larger-scale management problem.

Author Contributions

Conceptualization, Y.Z., Y.H. and Z.T.; methodology, Y.H. and Z.T.; software, Y.H.; validation, Y.Z. and Y.H.; formal analysis, Y.Z. and Z.T.; investigation, Y.Z. and Y.H.; writing—original draft preparation, Y.H.; writing—review and editing, Y.Z. and Z.T.; visualization, Y.Z.; supervision, Z.T.; project administration, Z.T.; funding acquisition, Y.Z. All authors have read and agreed to the published version of the manuscript.

Funding

This paper is partially supported by Zhejiang Provincial Philosophy and Social Sciences Planning Project (No. 24SSHZ062YB).

Data Availability Statement

No new data were created or analyzed in this study. Data sharing is not applicable to this article.

Conflicts of Interest

The authors declare no conflicts of interest.

Abbreviations

The following abbreviations are used in this manuscript:
DWPTdynamic wireless power transfer
WCLwireless charging lane
EVelectric vehicle
ICEVinternal combustion engine vehicle
DWCdynamic wireless charging
SOCstate-of-charge
OLEVonline electric vehicle
ACCadaptive cruise control
GPLgeneral-purpose lane

References

  1. Leach, F.; Kalghatgi, G.; Stone, R.; Miles, P. The scope for improving the efficiency and environmental impact of internal combustion engines. Transp. Eng. 2020, 1, 100005. [Google Scholar] [CrossRef]
  2. Liu, Z.; Song, J.; Kubal, J.; Susarla, N.; Knehr, K.W.; Islam, E.; Nelson, P.; Ahmed, S. Comparing total cost of ownership of battery electric vehicles and internal combustion engine vehicles. Energy Policy 2021, 158, 112564. [Google Scholar] [CrossRef]
  3. Colmenar-Santos, A.; Linares-Mena, A.-R.; Borge-Diez, D.; Quinto-Alemany, C.-D. Impact assessment of electric vehicles on islands grids: A case study for Tenerife (Spain). Energy 2017, 120, 385–396. [Google Scholar] [CrossRef]
  4. Towoju, O.A. Fuels for Automobiles: The Sustainable Future. J. Energy Res. Rev. 2021, 7, 8–13. [Google Scholar] [CrossRef]
  5. He, J.; Yang, H.; Tang, T.-Q.; Huang, H.-J. Optimal deployment of wireless charging lanes considering their adverse effect on road capacity. Transp. Res. Part C Emerg. Technol. 2020, 111, 171–184. [Google Scholar] [CrossRef]
  6. IEA. Trends in Electric Car Markets. 2024. Available online: https://www.iea.org/reports/global-ev-outlook-2025/trends-in-electric-car-markets-2 (accessed on 10 June 2025).
  7. Rietmann, N.; Hügler, B.; Lieven, T. Forecasting the trajectory of electric vehicle sales and the consequences for worldwide CO2 emissions. J. Clean. Prod. 2020, 261, 121038. [Google Scholar] [CrossRef]
  8. Un-Noor, F.; Padmanaban, S.; Mihet-Popa, L.; Mollah, M.N.; Hossain, E. A Comprehensive Study of Key Electric Vehicle (EV) Components, Technologies, Challenges, Impacts, and Future Direction of Development. Energies 2017, 10, 1217. [Google Scholar] [CrossRef]
  9. Wu, F.; Sioshansi, R. A stochastic flow-capturing model to optimize the location of fast-charging stations with uncertain electric vehicle flows. Transp. Res. Part D Transp. Environ. 2017, 53, 354–376. [Google Scholar] [CrossRef]
  10. Arif, S.M.; Lie, T.T.; Seet, B.C.; Ayyadi, S.; Jensen, K. Review of Electric Vehicle Technologies, Charging Methods, Standards and Optimization Techniques. Electronics 2021, 10, 1910. [Google Scholar] [CrossRef]
  11. Dharmakeerthi, C.; Mithulananthan, N.; Saha, T. Impact of electric vehicle fast charging on power system voltage stability. Int. J. Electr. Power Energy Syst. 2014, 57, 241–249. [Google Scholar] [CrossRef]
  12. Habib, S.; Khan, M.M.; Abbas, F.; Sang, L.; Shahid, M.U.; Tang, H. A Comprehensive Study of Implemented International Standards, Technical Challenges, Impacts and Prospects for Electric Vehicles. IEEE Access 2018, 6, 13866–13890. [Google Scholar] [CrossRef]
  13. Yang, Y.; Zhang, W.; Niu, L.; Jiang, J. Coordinated charging strategy for electric taxis in temporal and spatial scale. Energies 2015, 8, 1256–1272. [Google Scholar] [CrossRef]
  14. Li, T.; Zhang, J.; Zhang, Y.; Jiang, L.; Li, B.; Yan, D.; Ma, C. An Optimal Design and Analysis of a Hybrid Power Charging Station for Electric Vehicles Considering Uncertainties. In Proceedings of the IECON 2018—44th Annual Conference of the IEEE In-dustrial Electronics Society, Washington, DC, USA, 21–23 October 2018; pp. 5147–5152. [Google Scholar] [CrossRef]
  15. Martínez-Lao, J.; Montoya, F.G.; Montoya, M.G.; Manzano-Agugliaro, F. Electric vehicles in Spain: An overview of charging systems. Renew. Sustain. Energy Rev. 2017, 77, 970–983. [Google Scholar] [CrossRef]
  16. Covic, G.A.; Boys, J.T. Inductive Power Transfer. Proc. IEEE 2013, 101, 1276–1289. [Google Scholar] [CrossRef]
  17. Cirimele, V.; Diana, M.; Freschi, F.; Mitolo, M. Inductive Power Transfer for Automotive Applications: State-of-the-Art and Future Trends. IEEE Trans. Ind. Appl. 2018, 54, 4069–4079. [Google Scholar] [CrossRef]
  18. Lukic, S.; Pantic, Z. Cutting the Cord: Static and Dynamic Inductive Wireless. IEEE Electrif. Mag. 2013, 1, 57–64. [Google Scholar] [CrossRef]
  19. Jansuwan, S.; Liu, Z.; Song, Z.; Chen, A. An evaluation framework of automated electric transportation system. Transp. Res. Part E Logist. Transp. Rev. 2021, 148, 102265. [Google Scholar] [CrossRef]
  20. Duarte, G.; Silva, A.; Baptista, P. Assessment of wireless charging impacts based on real-world driving patterns: Case study in Lisbon, Portugal. Sustain. Cities Soc. 2021, 71, 102952. [Google Scholar] [CrossRef]
  21. Tan, Z.; Liu, F.; Chan, H.K.; Gao, H.O. Transportation systems management considering dynamic wireless charging electric vehicles: Review and prospects. Transp. Res. Part E Logist. Transp. Rev. 2022, 163, 102761. [Google Scholar] [CrossRef]
  22. Jang, Y.J. Survey of the operation and system study on wireless charging electric vehicle systems. Transp. Res. Part C Emerg. Technol. 2018, 95, 844–866. [Google Scholar] [CrossRef]
  23. Schwerdfeger, S.; Bock, S.; Boysen, N.; Briskorn, D. Optimizing the electrification of roads with charge-while-drive technology. Eur. J. Oper. Res. 2022, 299, 1111–1127. [Google Scholar] [CrossRef]
  24. Ko, Y.D.; Jang, Y.J. The Optimal System Design of the Online Electric Vehicle Utilizing Wireless Power Transmission Technology. IEEE Trans. Intell. Transp. Syst. 2013, 14, 1255–1265. [Google Scholar] [CrossRef]
  25. Jang, Y.J.; Jeong, S.; Ko, Y.D. System optimization of the On-Line Electric Vehicle operating in a closed environment. Comput. Ind. Eng. 2015, 80, 222–235. [Google Scholar] [CrossRef]
  26. Jeong, S.; Jang, Y.J.; Kum, D. Economic Analysis of the Dynamic Charging Electric Vehicle. IEEE Trans. Power Electron. 2015, 30, 6368–6377. [Google Scholar] [CrossRef]
  27. Hwang, I.; Jang, Y.J.; Ko, Y.D.; Lee, M.S. System Optimization for Dynamic Wireless Charging Electric Vehicles Operating in a Multiple-Route Environment. IEEE Trans. Intell. Transp. Syst. 2017, 19, 1709–1726. [Google Scholar] [CrossRef]
  28. Liu, Z.; Song, Z. Robust planning of dynamic wireless charging infrastructure for battery electric buses. Transp. Res. Part C Emerg. Technol. 2017, 83, 77–103. [Google Scholar] [CrossRef]
  29. Fuller, M. Wireless charging in California: Range, recharge, and vehicle electrification. Transp. Res. Part C Emerg. Technol. 2016, 67, 343–356. [Google Scholar] [CrossRef]
  30. Wang, T.; Yang, B.; Chen, C.; Guan, X. Wireless charging lane deployment in urban areas considering traffic light and regional energy supply-demand balance. In Proceedings of the 2019 IEEE 89th Vehicular Technology Conference (VTC2019-Spring), Kuala Lumpur, Malaysia, 28 April–1 May 2019; pp. 1–5. [Google Scholar]
  31. He, J.; Huang, H.-J.; Yang, H.; Tang, T.-Q. An electric vehicle driving behavior model in the traffic system with a wireless charging lane. Phys. A Stat. Mech. Its Appl. 2017, 481, 119–126. [Google Scholar] [CrossRef]
  32. Li, D.; Leung, M.-F.; Tang, J.; Wang, Y.; Hu, J.; Wang, S. Generative Self-Supervised Learning for Cyberattack-Resilient EV Charging Demand Forecasting. IEEE Trans. Intell. Transp. Syst. 2025, 3545577. [Google Scholar] [CrossRef]
  33. Papageorgiou, M.; Kiakaki, C.; Dinopoulou, V.; Kotsialos, A.; Wang, Y.; Diakaki, C. Review of road traffic control strategies. Proc. IEEE 2003, 91, 2043–2067. [Google Scholar] [CrossRef]
  34. Liu, F.; Tan, Z.; Chan, H.K.; Zheng, L. Ramp metering control on wireless charging lanes considering optimal traffic and charging efficiencies. IEEE Trans. Intell. Transp. Syst. 2024, 25, 11590–11601. [Google Scholar] [CrossRef]
  35. Xiao, C. Design and Research of Cruise Control System Based on Pure Electric Vehicle. Automot. Electr. Appl. 2020, 9, 13–18. [Google Scholar]
  36. Madhusudhanan, A.K. A method to improve an electric vehicle’s range: Efficient Cruise. Eur. J. Control. 2019, 48, 83–96. [Google Scholar] [CrossRef]
  37. Deflorio, F.P.; Castello, L.; Pinna, I.; Guglielmi, P. “Charge while driving” for electric vehicles: Road traffic modeling and energy assessment. J. Mod. Power Syst. Clean Energy 2015, 3, 277–288. [Google Scholar] [CrossRef]
  38. García-Vázquez, C.A.; Llorens-Iborra, F.; Fernández-Ramírez, L.M.; Sánchez-Sainz, H.; Jurado, F. Comparative study of dy-namic wireless charging of electric vehicles in motorway, highway and urban stretches. Energy 2017, 137, 42–57. [Google Scholar] [CrossRef]
  39. Tan, Z.; Gao, H.O. Traffic control for air quality management and congestion mitigation in complex urban vehicular tunnels. Transp. Res. Part C Emerg. Technol. 2015, 58, 13–28. [Google Scholar] [CrossRef]
  40. Trung, N.K.; Diep, N.T.; Venet, P. A Maximum Transfer Efficiency Tracking Method for Dynamic Wireless Charging Systems of Electric Vehicles. J. Electr. Comput. Eng. 2021, 2021, 1–10. [Google Scholar] [CrossRef]
  41. Tran, C.Q.; Keyvan-Ekbatani, M.; Ngoduy, D.; Watling, D. Dynamic wireless charging lanes location model in urban networks considering route choices. Transp. Res. Part C Emerg. Technol. 2022, 139, 103652. [Google Scholar] [CrossRef]
  42. Wu, X.; Freese, D.; Cabrera, A.; Kitch, W.A. Electric vehicles’ energy consumption measurement and estimation. Transp. Res. Part D Transp. Environ. 2015, 34, 52–67. [Google Scholar] [CrossRef]
  43. Tan, Z.; Gao, H.O. Hybrid model predictive control based dynamic pricing of managed lanes with multiple accesses. Transp. Res. Part B Methodol. 2018, 112, 113–131. [Google Scholar] [CrossRef]
  44. Papageorgiou, M. A new approach to time-of-day control based on a dynamic freeway traffic model. Transp. Res. Part B Methodol. 1980, 14, 349–360. [Google Scholar] [CrossRef]
  45. IEA. 2021. Top 5 barriers to EV adoption reported by EV100 member companies. Available online: https://www.iea.org/data-and-statistics/charts/top-5-barriers-to-ev-adoption-reported-by-ev100-member-companies (accessed on 20 July 2022).
  46. Smart, J.; Schey, S. Battery electric vehicle driving and charging behavior observed early in the EV project. SAE Int. J. Altern. Powertrains 2012, 1, 27–33. [Google Scholar] [CrossRef]
  47. Bi, Z.; Kan, T.; Mi, C.C.; Zhang, Y.; Zhao, Z.; Keoleian, G.A. A review of wireless power transfer for electric vehicles: Prospects to enhance sustainable mobility. Appl. Energy 2016, 179, 413–425. [Google Scholar] [CrossRef]
  48. Sagaria, S.; Neto, R.C.; Baptista, P. Modelling approach for assessing influential factors for EV energy performance. Sustain. Energy Technol. Assess. 2021, 44, 100984. [Google Scholar] [CrossRef]
  49. Yang, G.; Xu, H.; Tian, Z.; Wang, Z.; Zhao, Y. Acceleration Characteristics at Metered On-Ramps. Transp. Res. Rec. J. Transp. Res. Board 2015, 2484, 1–9. [Google Scholar] [CrossRef]
  50. Transport Research Laboratory. Feasibility Study: Powering Electric Vehicles on England’s Major Roads; Highways England Company: Birmingham, UK, 2015. [Google Scholar]
  51. Qian, T.; Fang, M.; Hu, Q.; Shao, C.; Zheng, J. V2Sim: An Open-Source Microscopic V2G Simulation Platform in Urban Power and Transportation Network. IEEE Trans. Smart Grid 2025, 16, 3167–3178. [Google Scholar] [CrossRef]
Figure 1. Schematic diagram of an expressway segment with an advanced traffic control system and WCL (adapted from Tan et al. [21]).
Wevj 16 00496 g001
Figure 2. Layout of the WCL and schematic plot of the length parameters in the DWPT system.
Wevj 16 00496 g002
Figure 3. Demand profile for EVs at different on-ramps.
Wevj 16 00496 g003
Figure 4. Comparison of WCL utilization rate across time periods on each segment.
Wevj 16 00496 g004
Figure 5. Mean utilisation rate of WCL over periods 2~5 on each expressway segment.
Wevj 16 00496 g005
Figure 6. Solution comparison under equal and extreme values of α and β .
Wevj 16 00496 g006aWevj 16 00496 g006b
Figure 7. Comparison of the two components in the optimal objective value under nine trade-offs.
Wevj 16 00496 g007
Figure 8. Comparison of model outputs at eight charging efficiencies.
Wevj 16 00496 g008
Table 1. Notations of the model.
Indices
s { 1 , , S } Index used for the expressway segments
o { 1 , , S } Index used for the origin on-ramps
d { 1 , , S } Index used for the destination off-ramps
p { 1 , , P } Index used for the time periods
i { 1 , , I } Index used for the initial SOC types of EVs
Variables and input parameters
Expressway traffic model
N p Total number of vehicles on the expressway during period p , [veh per hour, veh/h]
N o p i n Number of vehicles allowed to enter the expressway from on-ramp o  during period  p , [veh/h]
N o s p Number of vehicles allowed to enter the expressway from on-ramp o  during period p  and will pass the end of segment s , [veh/h]
N d p o u t Total number of vehicles leaving the expressway via off-ramp d  during period p , [veh/h]
N s p Total number of vehicles passing the end of the expressway segment s  during period p , [veh/h]
Q o p Total vehicle demand in period p  for entering the expressway from on-ramp o , [veh/h]
R o s p Ratio of vehicles entering the expressway from on-ramp o during period p  and will pass through the beginning of expressway segment s , with o s
C s Vehicle carrying capacity of expressway segment s , [veh/h]
L s Length of the expressway segment s , [kilometer, km]
t s Average travel time through the expressway segment s , [hour]
V s Average speed of an EV traveling on the expressway segment s , [kilometer per hour, km/h]
T o s Average travel time from on-ramp o  to the end of expressway segment s , with o s , [hour]
EV charging model
N i o s p Number of EVs with initial SOC type i  allowed to enter the expressway from on-ramp o  during period p  and will pass the end of segment s , [veh/h]
N i o p m i n The minimum number of EVs with initial SOC type i  required to enter the expressway from on-ramp o  during period p , [veh/h]
Q i o p Demand of EVs with initial SOC type i  in period p  for entering the expressway from on-ramp o , [veh/h]
s i o m i n The index of the segment that any EV with initial SOC type i  entering the expressway from on-ramp o  must at least pass through if no further than its destination off-ramp, which is generally bigger for a lower SOC level.
E s i n c Electrical energy increased by an EV on the expressway segment s , [kilowatt-hours, kWh]
E s r e c Electrical energy received by an EV on the expressway segment s , [kWh]
E s c o n Electrical energy consumed by an EV on the expressway segment s , [kWh]
E s , 0 c o n Electrical energy consumption of an EV by traveling throughout segment s  with stable speed, [kWh]
E s , i n c o n Electrical energy additional to E s , 0 c o n  consumed by an EV due to speed variation in merging traffic entering the system via the on-ramp at the start of segment s , [kWh]
E s , o u t c o n Electrical energy additional to E s , 0 c o n    consumed by an EV due to speed variation in merging traffic leaving the system via the off-ramp at the end of segment s , [kWh]
N s t a Total number of segmented transmitter arrays on expressway segment s
t s t x Time for the EV to receive electrical energy from the DWPT system on expressway segment s , [hour]
Table 2. Vehicle passing rates, R o s p for p = 1 , , 6 .
o1234567
s
1100%
290%100%
380%90%100%
470%80%90%100%
560%70%80%90%100%
650%60%70%80%90%100%
740%50%60%70%80%90%100%
Table 3. Electrical energy received and increased on expressway segments in kWh.
Energy received E 1 r x E 2 r x E 3 r x E 4 r x E 5 r x E 6 r x E 7 r x
1.543.073.073.071.542.463.68
Energy increased E 1 i n c E 2 i n c E 3 i n c E 4 i n c E 5 i n c E 6 i n c E 7 i n c
0.711.421.421.420.711.141.70
Table 4. Number of EVs entering the expressway under WCL traffic control model (veh/h).
o1234567
p
11500600600600600600600
221647708751230130011781200
31904967681580110012211183
42300621679580482796472
52230621681580481403472
6802621684630437202473
Table 5. Number of EVs with an initial SOC of 20% (50%) entering the expressway (veh/h).
o1234567
p
1750 (750)300 (300)300 (300)300 (300)300 (300)300 (300)300 (300)
2665 (1499)70 (700)499 (376)600 (630)600 (700)700 (478)500 (700)
31514 (390)422 (545)60 (621)520 (60)600 (500)500 (721)683 (500)
4290 (2010)591 (30)649 (30)32 (548)127 (355)500 (296)50 (422)
51829 (401)611 (10)10 (671)118 (462)471 (10)100 (303)442 (30)
6402 (400)106 (515)582 (102)530 (100)102 (335)100 (102)225 (248)
Table 6. Proportion of EVs with an initial SOC of 50% using the WCL by expressway segments.
o1234567
s
1100%
2100%100%
3100%100%100%
488%97%82%100%
568%42%86%67%100%
652%67%80%70%45%100%
759%52%70%70%45%42%100%
Table 7. Traffic and charging performances of three models (the percentage in parenthesis indicates the relative reduction compared to the best possible value among all three cases).
MeasureTime-Weighted Number of Vehicles Served (veh/h)Total Increased Electrical Energy (kWh)
Case
α = β = 0.5 137,295 (−7.9%)142,666 (−3.1%)
α = 1 ,   β = 0 149,078 (0%)99,017 (−32.8%)
α = 0 ,   β = 1 124,498 (−16.5%)147,303 (0%)
Table 8. Traffic and charging performances under nine cases of trade-offs (the percentage inside the parenthesis indicates the value relative to the best possible one, i.e., under α = 1 or β = 1 .
α β Time-Weighted Number of Vehicles Served (veh/h)Total Increased Electrical Energy (kWh)
0.10.9129,795 (87.07%)147,260 (99.97%)
0.20.8130,624 (87.62%)147,103 (99.86%)
0.30.7131,170 (87.99%)146,908 (99.73%)
0.40.6132,819 (89.09%)146,034 (99.14%)
0.50.5137,295 (92.10%)142,666 (96.85%)
0.60.4144,060 (96.63%)134,219 (91.12%)
0.70.3146,835 (98.50%)129,041 (87.60%)
0.80.2148,709 (99.75%)123,401 (83.77%)
0.90.1149,078 (100%)121,682 (82.61%)
Table 9. Model outputs at eight charging efficiencies.
Charging
Efficiency
Time-Weighted Number
of Vehicles Served (veh/h)
Total Increased Electrical
Energy (kWh)
60%141,741102,586
65%139,847113,263
70%139,473122,495
75%137,841133,071
80%137,295142,666
85%137,288151,691
90%137,286160,734
95%137,290169,769
Disclaimer/Publisher’s Note: The statements, opinions and data contained in all publications are solely those of the individual author(s) and contributor(s) and not of MDPI and/or the editor(s). MDPI and/or the editor(s) disclaim responsibility for any injury to people or property resulting from any ideas, methods, instructions or products referred to in the content.