Article

Fault Identification Method for Flexible Traction Power Supply System by Empirical Wavelet Transform and 1-Sequence Faulty Energy

1
College of Electrical Engineering, Southwest Jiaotong University, Chengdu 610032, China
2
CHN ENERGY Shuo Huang Railway Development Co., Cangzhou 062350, China
*
Author to whom correspondence should be addressed.
World Electr. Veh. J. 2025, 16(9), 495; https://doi.org/10.3390/wevj16090495
Submission received: 10 July 2025 / Revised: 20 August 2025 / Accepted: 24 August 2025 / Published: 1 September 2025

Abstract

The 2 × 25 kV flexible traction power supply system (FTPSS), using a three-phase-single-phase converter as its power source, effectively addresses the challenges of neutral section transitions and power quality issues inherent in traditional power supply systems (TPSSs). However, the bidirectional fault current and low short-circuit current characteristics degrade the effectiveness of traditional TPSS protection schemes. This paper analyzes the fault characteristics of FTPSS and proposes a fault identification method based on empirical wavelet transform (EWT) and 1-sequence faulty energy. First, a composite sequence network model is developed to reveal the characteristics of three typical fault types, including ground faults and inter-line short circuits. The 1-sequence differential faulty energy is then calculated. Since the 1-sequence component is unaffected by the leakage impedance of autotransformers (ATs), the proposed method uses this feature to distinguish the TPSS faults from disturbances caused by electric multiple units (EMUs). Second, EWT is used to decompose the 1-sequence faulty energy, and relevant components are selected by permutation entropy. The fault variance derived from these components enables reliable identification of TPSS faults, effectively avoiding misjudgment caused by AT excitation inrush or harmonic disturbances from EMUs. Finally, real-time digital simulator experimental results verify the effectiveness of the proposed method. The fault identification method possesses high tolerance to transition impedance performance and does not require synchronized current measurements from both sides of the TPSS.

1. Introduction

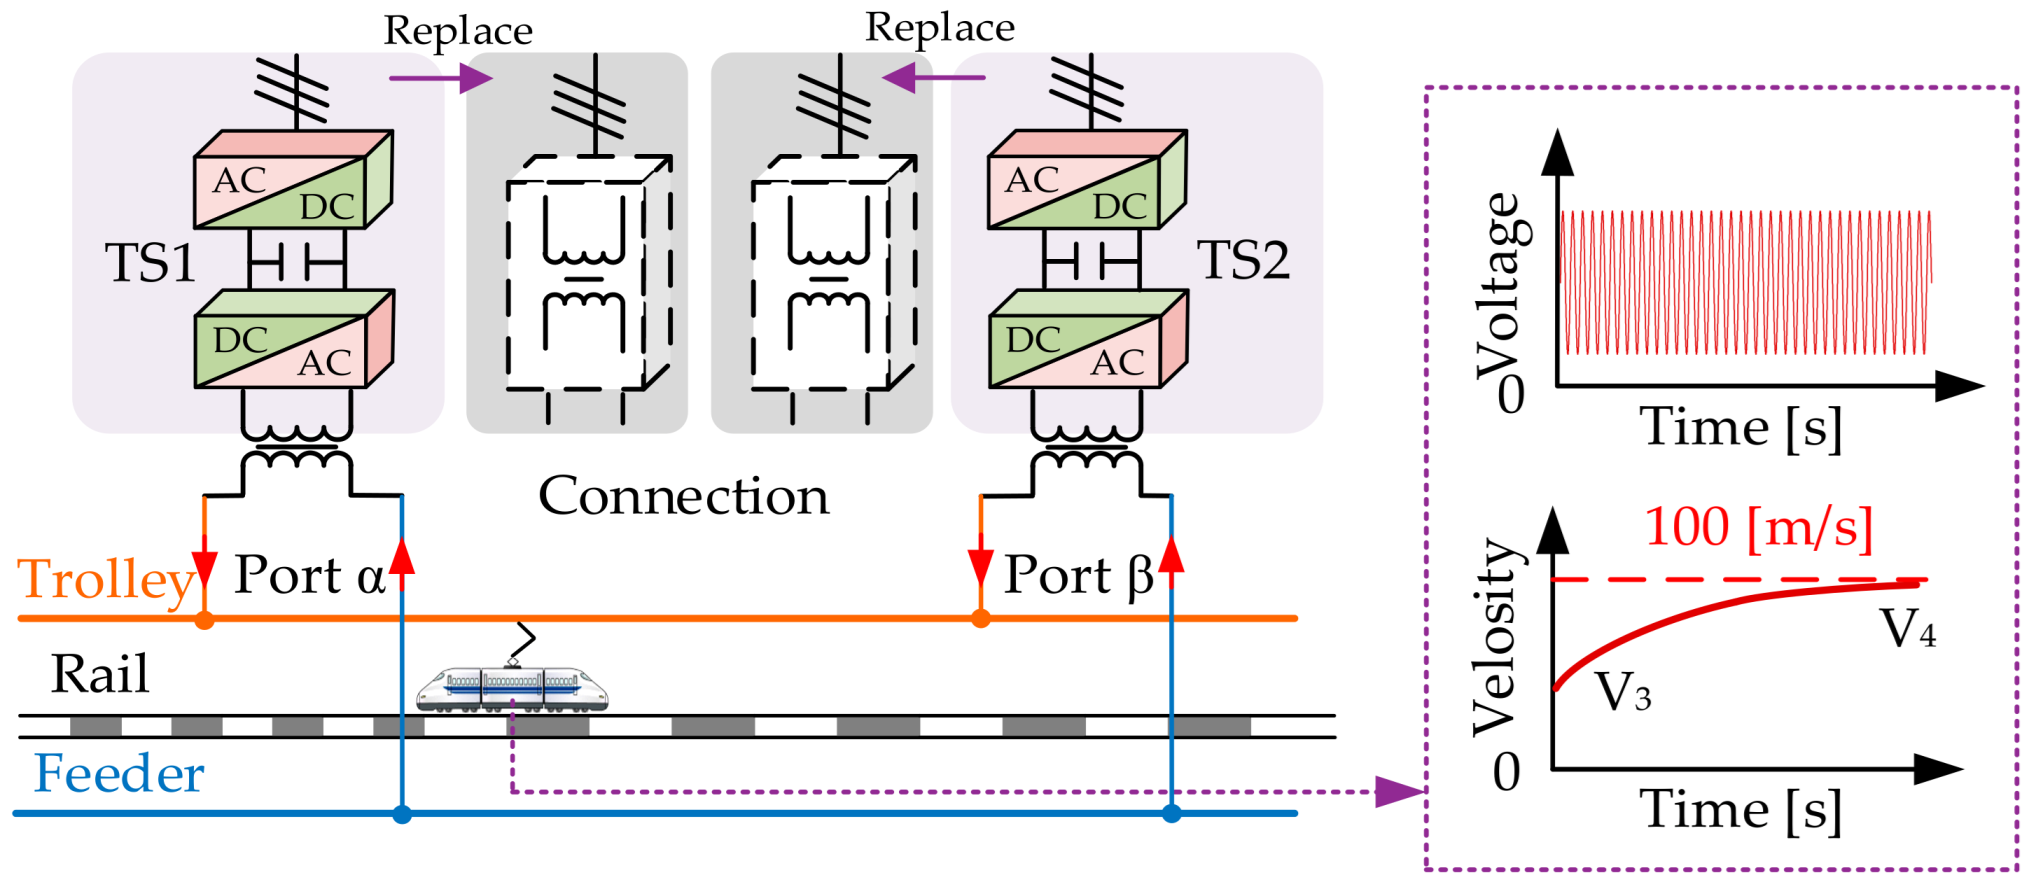
The 25 kV AC single-phase traction power supply system (TPSS) is widely used in many countries. However, challenges such as poor power quality, limited power supply capability and difficulties in traversing neutral sections significantly hinder the development of electrified railways [1]. For instance, approximately 5% of the Beijing–Shanghai Railway is designated as neutral sections. As shown in Figure 1, when the EMUs pass through these sections, the absence of power supply causes a temporary reduction in train speed [2]. With advancements in high-capacity power electronics technology, FTPSSs, incorporating AC–DC–AC converters within traction stations (TSs), has been proposed to eliminate neutral sections entirely, as shown in Figure 2. This allows EMUs to maintain constant speed throughout the journey. In addition, FTPSS effectively addresses several power quality issues, including negative sequence currents, low-power factors, and harmonic pollution [3,4,5]. Given these advantages, FTPSS demonstrates significant application potential. In China, it has already been implemented on the Beijing Daxing International Airport Express Line [6].
However, the conductor structure of the traction network is extensive, lacks redundancy, and is typically installed outdoors under harsh environmental conditions, making it susceptible to changing weather and seasonal changes. Moreover, due to continuous sliding contact with the pantograph, the traction network is subject to frequent vibrations, leading to a high incidence of conductor faults. Field statistics indicate that the fault frequency of the traction network is about 0.03 times per kilometer per year, which is 10 to 12 times higher than that of the power grid [7]. If such faults are not promptly identified and addressed, they can seriously affect the safe and stable operation of the TPSS and EMUs, potentially causing large-scale service interruptions [8]. The 2 × 25 KV FTPSS, which employs a parallel configuration of autotransformers (ATs) and traction networks, is widely used in China’s high-speed and heavy-haul railways due to its strong power supply capability, small circuit impedance, and extended transmission distance [9]. However, in this configuration, the use of parallel ATs increases the complexity of short-circuit reactance and introduces a nonlinear relationship with distance, rendering conventional distance protection ineffective. As a result, locating the faulted section becomes challenging. Additionally, due to the elimination of neutral sections in FTPSS, bidirectional short-circuit currents can flow through the fault point transition impedance [10]. When observed from the side of the traction substation (TS), the transition impedance may show inductive or capacitive reactance characteristics, further reducing the effectiveness of fault identification mechanisms [11].
Distance protection remains widely used in TPSS due to its ease of implementation and independence from synchronized data [12]. However, in FTPSS, its selectivity is compromised by the bidirectional nature of fault currents. An alternative method involves comparing the current ratio in the up-line and down-line directions at the TS [13]. However, if a fault occurs between autotransformer posts (APs), this method must be supplemented by directional overcurrent relays installed in the AP. Furthermore, overcurrent protection is often ineffective in FTPSS due to rapid current converter limiting or blocking actions triggered by converters [14]. Some researchers have proposed new protection schemes based on section-level differential and braking current analysis [15]. With the development of railway communication technology, a wide-area current-differential protection scheme based on the feeder current characteristic has also been developed [16]. However, the above fault identification methods rely heavily on multi-terminal synchronization data and require the laying of protection-specific optical fibers in FTPSS, making them expensive and technically demanding.
In related research on conventional power grids, fault feature-extraction-based methods have been widely employed to solve the short circuit fault identification problems and are considered promising for application in FTPSS [17]. Traveling wave-based methods are attractive due to their insensitivity to fault types, transition impedance, and line structures, and have been successfully used for fault detection in power transmission systems [18]. However, traveling waves in 2 × 25 KV FTPSS will be reflected on the AT, making their propagation paths complex and the wavefronts difficult to extract. In addition, the fault time–frequency component of zero-sequence current is obtained based on the wavelet transform method to construct a high-impedance fault detection criterion [19]. FTPSS operates as a single-phase AC system without zero-sequence currents. Moreover, this method must account for interference from EMUs and ATs. AI-based fault identification methods require a large amount of sample data for training, which are challenging to obtain in FTPSS [20,21,22].
In conclusion, existing research on fault identification in FTPSS is insufficient. Since the FTPSS directly supplies power to EMUs, their operational characteristics must be considered in any fault identification strategy. Fault feature-extraction-based methods show promise for identifying faults during transient events in the FTPSS [23].
Based on the above background, this paper presents a fault identification method based on EWT for 2 × 25 KV FTPSS, adept at accommodating various operational settings.
The key points are as follows:
(1)
A composite sequence network model based on the generalized symmetric component method is established, incorporating EMUs, faults and ATs. This model reveals three fault distribution characteristics in FTPSS. Meanwhile, one-sequence faulty energy signal significantly suppresses the effects of ATs, parallel wires, and noise, enhancing faulty feature clarity and enabling more accurate time-frequency analysis.
(2)
A fault identification method combining EWT and one-sequence faulty energy is proposed to directly distinguish the TPSS fault from the EMUs load. EWT is used to decompose 1-sequence faulty energy, while permutation entropy is introduced to select the fault component. The fault variance calculated by the selected fault component can identify the TPSS fault while avoiding interference from system disturbances such as excitation inrush current from AT, non-linear current from AC-DC-AC converters and EMUs harmonic current. The method does not require synchronization signals or low sampling rates, making it practical and easy to implement.
The results of this paper are as follows: Section 2 presents the power supply structure and simplified analysis of FTPSS, reveals the fault characteristics of 2 × 25 KV FTPSS, and gives a fault identification method based on EWT and one-sequence faulty energy. Section 3 provides simulation studies and semi-physical validation. Finally, conclusions are drawn in Section 4.

2. Fault Identification Method for FTPSS

2.1. Simplified Analysis of FTPSS Faults

In order to protect the devices, a current-limiting strategy is usually used to quickly limit the fault current in FTPSS [24]. Considering the influence of current limiting in the FTPSS, faults with low transition impedance that are insufficient to trigger current limiting are defined as metallic faults, while the remaining are categorized as non-metallic faults [25]. In the case of metallic faults, the fault current experiences a sharp rise before being swiftly constrained to the current limiting value. By contrast, non-metallic faults do not activate the current-limiting mechanism, and the resulting fault current exhibits characteristics similar to those of EMUs load current.
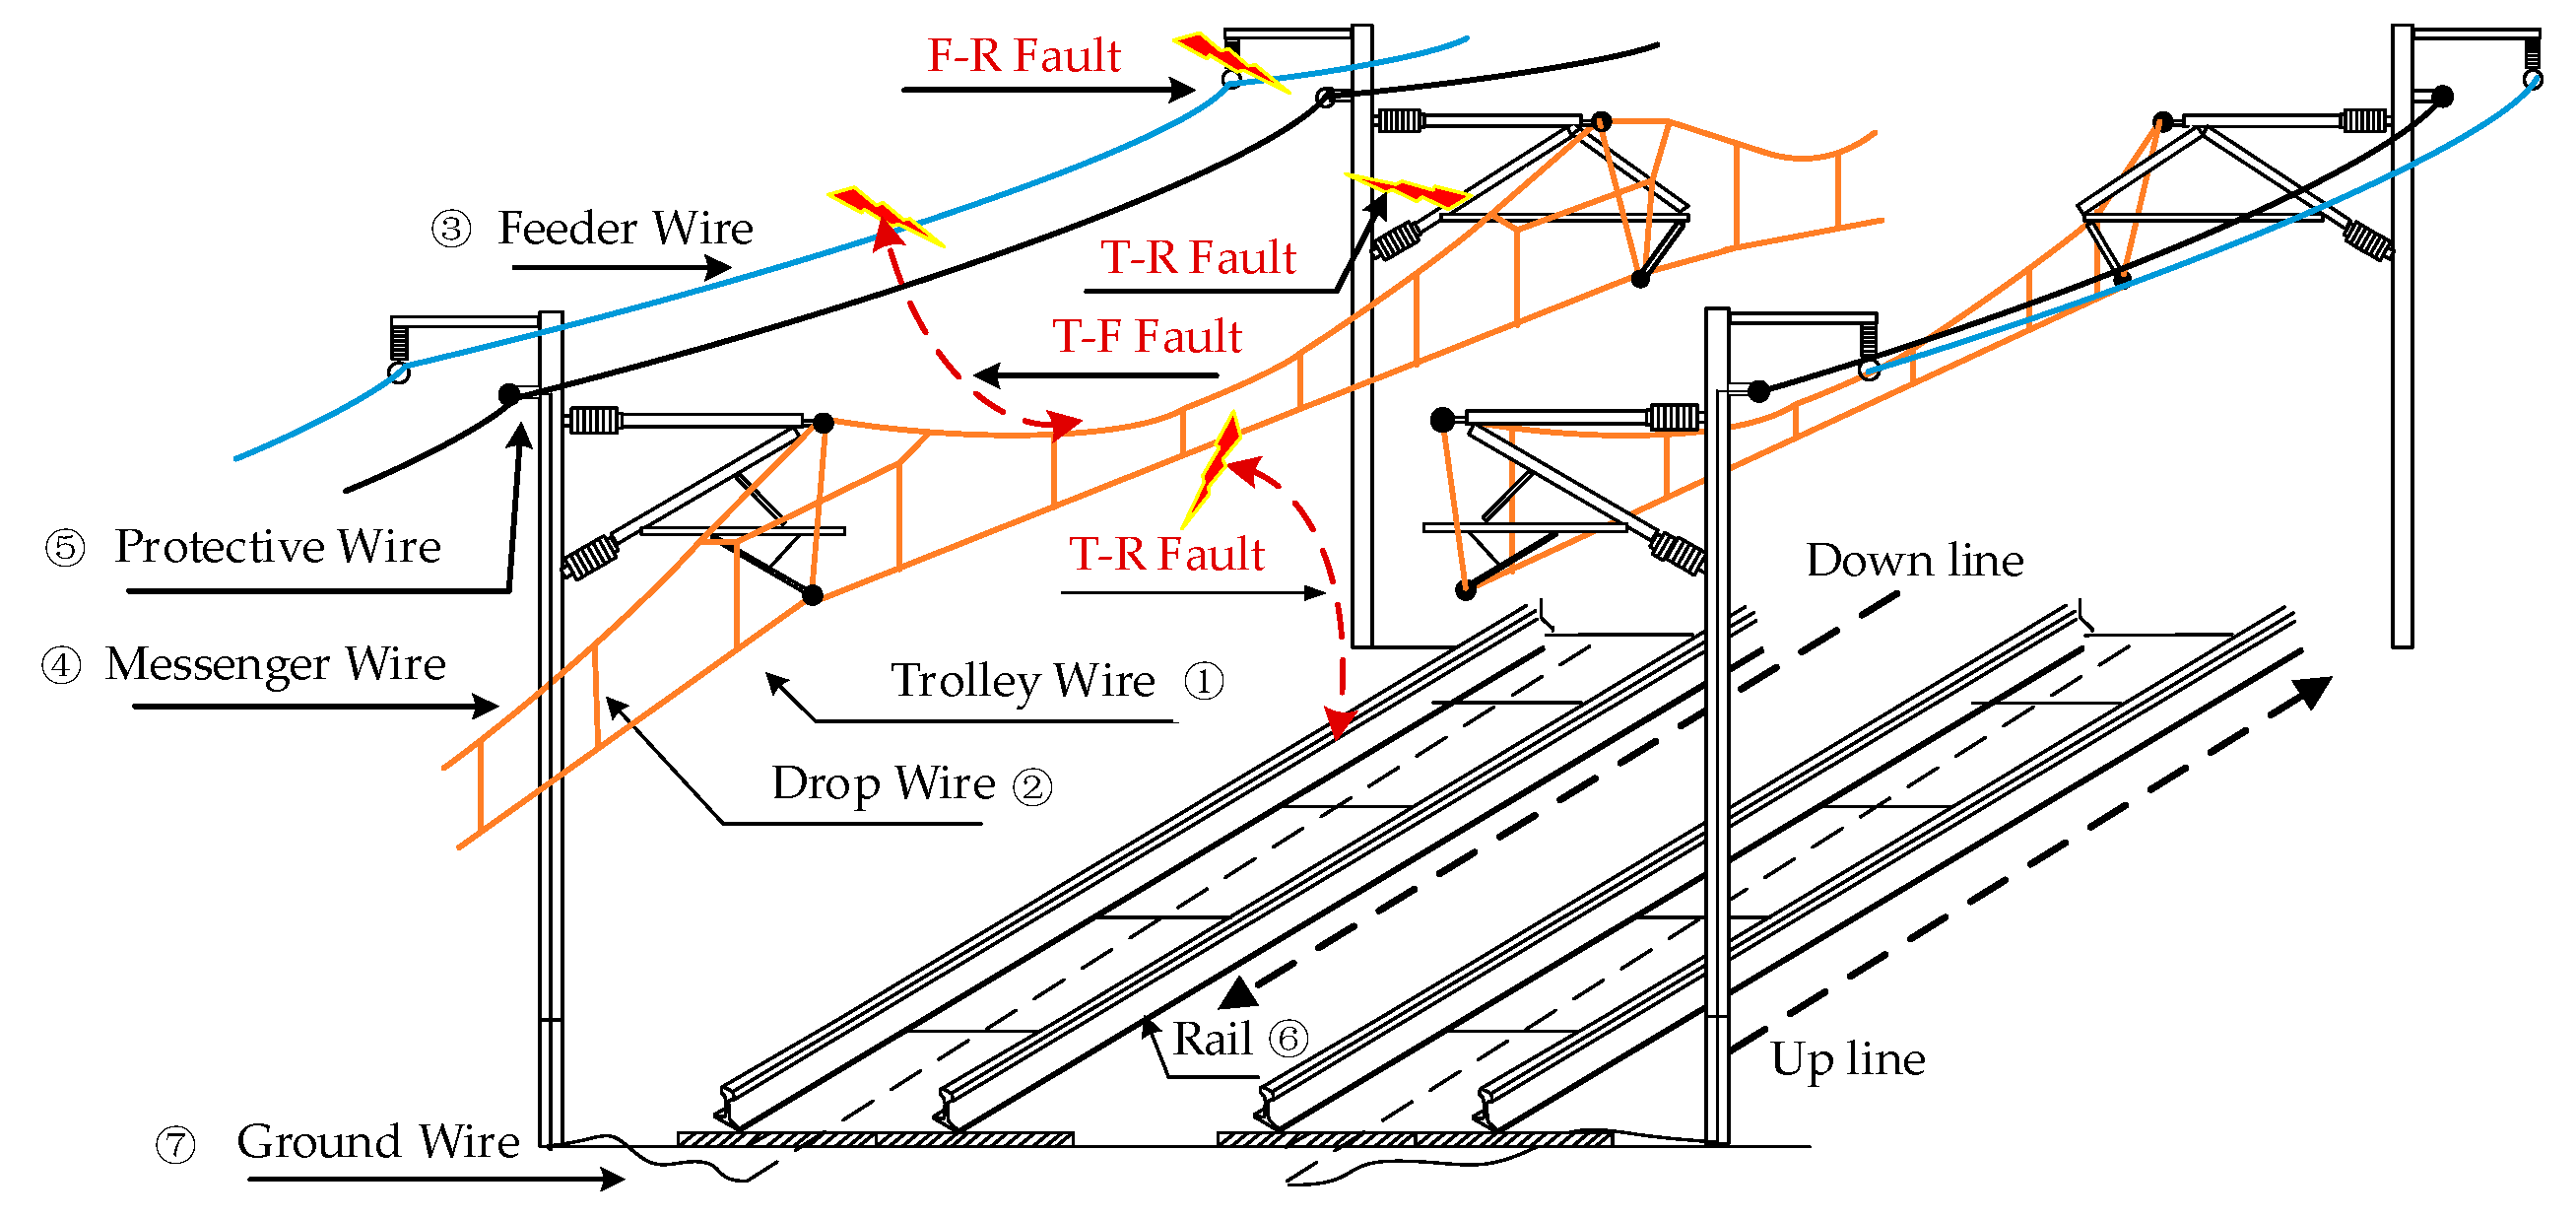
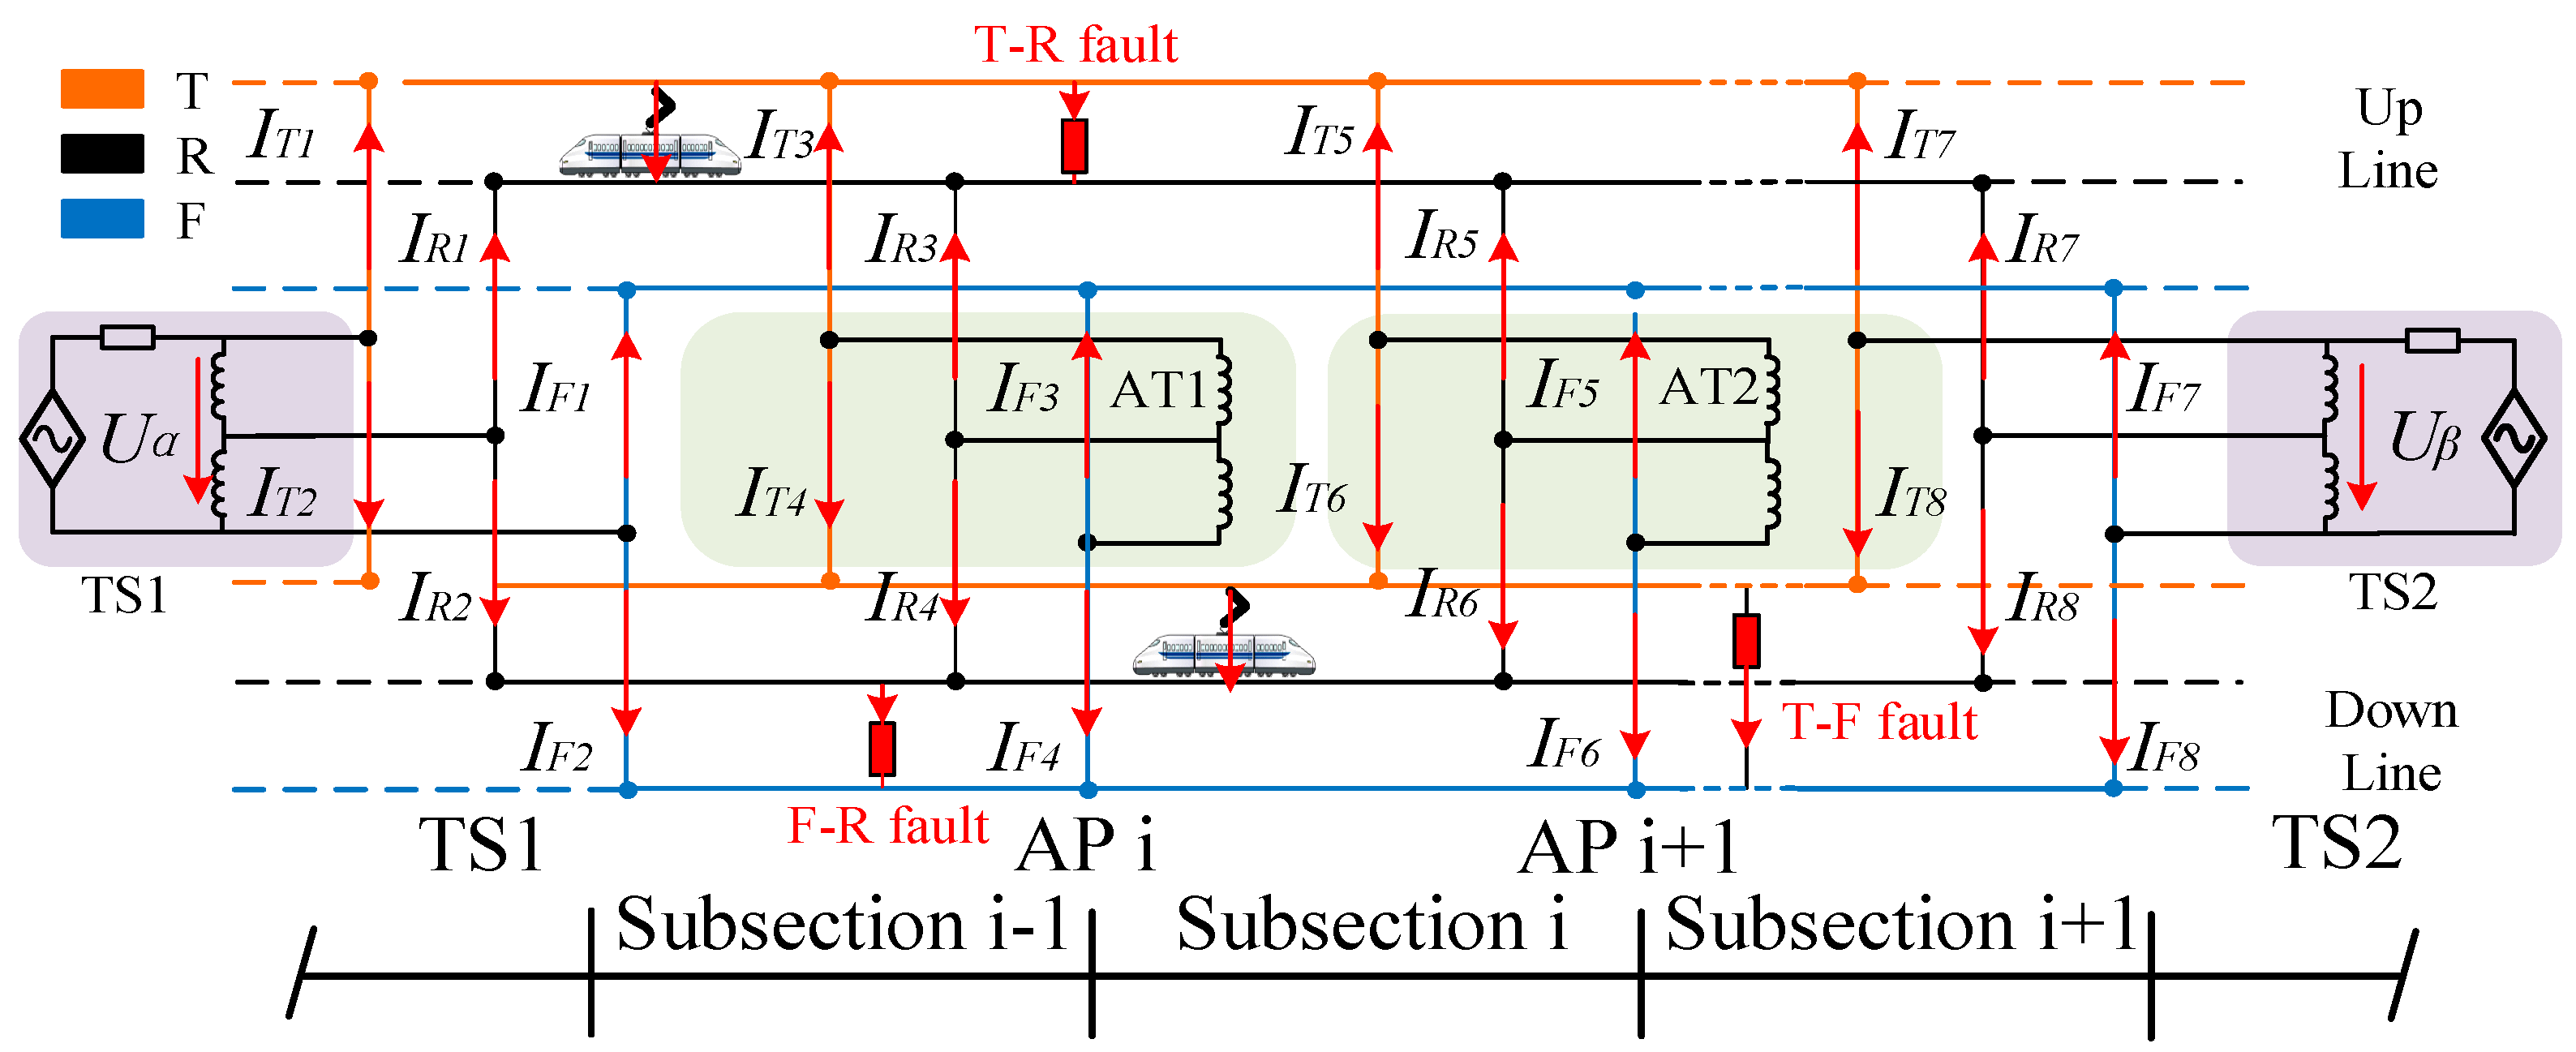
The FTPSS consists of seven types of conductors: trolley wire, feeder wire, protective wire, messenger wire, drop wire, ground wire and rail. The spatial arrangement of conductors in the FTPSS is shown in Figure 3. In order to simplify the fault analysis, multiple conductors with equal or similar electric potential can be combined into equivalent conductors using impedance merging techniques. For example, the contact wire of the traction network is suspended below the messenger wire via droopers spaced at intervals of 5~7.5 m; these can be merged into the conductor “T”. Since the protective wires, rails and ground wires are interconnected by cross-connecting lines or hollow coils, they can be equated to conductor “R”. Finally, the negative feeder is treated independently and represented as conductor “F”. Consequently, the original seven types of conductors in the traction network are reduced to three equivalent types of conductors. Therefore, faults in the traction network can be categorized into three types: T-R faults, F-R faults, and T-F faults [26]. After simplification, the FTPSS fault topology is obtained as shown in Figure 4, consisting of TS, AP, subsection, EMUs, and fault [27].

2.2. Composite Sequence Network Model

On the basis of the simplified traction network, the coupling relationships among conductors become complex due to the presence of parallel ATs and cross-connecting lines. This complexity necessitates decoupling calculations. In this paper, the generalized symmetric component method is employed to analyze the complex fault electrical components [3].
By applying the transformation matrix of the generalized symmetric component method, as shown in Equation (1), the original electrical quantity can be converted into four-sequence electrical quantities for fault analysis. M 4 is defined as the transformation matrix.
M 4 = 1 1 1 1 1 1 1 1 1 1 1 1 1 1 1 1
The up-line T wire, F wire, the down-line T wire, and F wire are designated as the four phases A, B, C, D of the traction network. According to the transformation matrix, the four phase currents I T 1 , I T 2 , I F 1 , I F 2 can be converted to the four sequence currents I α 0 3 of the formula, using the inverse matrix transformation. This relationship is expressed in Equation (2):
I α 0 I α 1 I α 2 I α 3 = M 4 1 I T 1 I F 1 I T 2 I F 2 = 1 4 I T 1 + I F 1 + I T 2 + I F 2 I T 1 I F 1 + I T 2 I F 2 I T 1 + I F 1 I T 2 I F 2 I T 1 I F 1 I T 2 + I F 2
As an example, in the power supply section between TSs, where the EMUs is operating in the up-line, the four sequence currents of the EMU are I E 0 3 , calculated as shown in Equation (3):
I E 0 I E 1 I E 2 I E 3 = M 4 1 I E 0 0 0 = 1 4 1 1 1 1 I E
Taking the T-R fault in the up-line as an example, its four-sequence current I f a u l t 0 3 is calculated in a manner similar to Equation (3), and the formula is shown in Equation (4).
I f a u l t 0 I f a u l t 1 I f a u l t 2 I f a u l t 3 = M 4 1 I E 0 0 0 = 1 4 1 1 1 1 I f a u l t
When a T-F fault occurs in the up-line, the current generated in the four-sequence network is different from that of a T-R fault. The corresponding transformation equation is shown in Equation (5).
I f a u l t 0 I f a u l t 1 I f a u l t 2 I f a u l t 3 = M 4 1 I f a u l t I f a u l t 0 0 = 1 2 0 1 0 1 I f a u l t
Furthermore, a composite sequence network model is illustrated in Figure 5.
As shown in Figure 5, Z w represents the impedance of the cross-connecting lines, and Z k denotes the impedance of AT. Z 0 3 and C 0 3 represent the sequence impedance and sequence capacitance of each sequence network, respectively. After applying the generalized symmetric component transformation, the 1-sequence network contains only 1-sequence power source and the fault point, without the AT or cross-connection lines. As a result, the 1-sequence currents are unaffected by the AT and cross-connection lines, making them highly effective for fault identification.

2.3. Signal Pre-Processing

By defining the section from TS1 to TS2 as a power supply unit, the 1-sequence component of the original signal of the fault current at both ends of the traction network can be expressed as:
i T S 1 1 ( t ) = 1 4 i T 1 ( t ) i F 1 ( t ) + i T 2 ( t ) i F 2 ( t ) ) i T S 2 1 ( t ) = 1 4 i T 3 ( t ) i F 3 ( t ) + i T 4 ( t ) i F 4 ( t ) )
Traditional traction power supply systems typically operate with a single power source. In contrast, FTPSS eliminates neutral section and provides dual-source power supply. However, the phase differences between the two power sources may lead to unbalanced currents, which can negatively impact fault identification. Hence, to eliminate errors caused by unbalanced currents and metered Gaussian white noise, the 1-sequence incremental current is calculated to identify the fault [28].
Defining the Δ i T S 1 1 ( t ) and Δ i T S 2 1 ( t ) are the 1-sequence components of the feeder incremental current signals of TS1 and TS2, respectively; T represent the duration of the industrial frequency two-period wave of the TPSS, which is 0.04 s. Furthermore, i T S 1 1 ( t T ) and i T S 2 1 ( t T ) are the 1-sequence components of the feeder current signals at the moment before the period T of TS1 and TS2, respectively, as shown in Equation (7):
Δ i T S 1 1 ( t ) = i T S 1 1 ( t ) i T S 1 1 ( t T ) Δ i T S 2 1 ( t ) = i T S 2 1 ( t ) i T S 2 1 ( t T )
Finally, the 1-sequence incremental current of TS1 is used as the fault current calculation and the 1-sequence faulty energy signal E 1 ( t ) is obtained by the calculation, as shown in Equation (8):
i 1 ( t ) = Δ i T S 1 1 ( t ) E 1 ( t ) = [ i 1 2 ( t ) min ( i 1 2 ( t ) ) ] [ max ( i 1 2 ( t ) min ( i 1 2 ( t ) ) ]
Finally, the E s e t ( t ) is the energy signal generated by the maximum load of the EMU.

2.4. Signal Decomposition Methods

EWT is a non-smooth signal processing method proposed by Gilles in 2013. It integrates the adaptive decomposition concept of EMD method with the compactly supported framework of wavelet transform theory, providing a new adaptive time–frequency analysis approach for signal processing. Compared with the EMD method, the EWT method can adaptively select the frequency band, effectively overcoming the modal aliasing problem caused by discontinuities in the signal’s time-frequency scale. Additionally, EWT is equipped with a complete and reliable mathematical theoretical foundation, exhibits low computational complexity, and addresses the over-envelope and under-envelope issues inherent in the EMD method. Due to these advantages, it has gained increasing popularity in the field of signal processing, particularly in fault diagnosis applications [29].
The FFT is applied to the discrete signal E 1 ( t ) to obtain its spectrum X ( ω ) . X ( ω ) at [0, π] can be divided into N consecutive segments, where the boundary Ω I of each segment is defined as:
Ω I = ( ω I + ω I + 1 ) / 2
where ω I and ω I + 1 are the frequencies corresponding to two neighboring spectral maxima.
According to the boundary definition, a wavelet filter bank is constructed, comprising a low-pass filter and N-1 band-pass filters. The scaling function ϕ 1 ( ω ) and the empirical wavelet function φ I ( ω ) are defined as follows:
ϕ 1 = 1 , ω ( 1 γ ) Ω 1 cos ( π 2 α ( γ , Ω 1 ) ( 1 γ ) Ω 1 < ω ( 1 + γ ) Ω 1 0 , o t h e r w i s e
φ I = 1 , ( 1 + γ ) Ω I < ω ( 1 γ ) Ω I cos π 2 α ( γ , Ω I + 1 ) , ( 1 γ ) Ω I + 1 < ω ( 1 + γ ) Ω I + 1 sin π 2 α ( γ , Ω I ) , ( 1 γ ) Ω I < ω ( 1 + γ ) Ω I 0 , o t h e r w i s e
where γ is defined to identify the parameters that do not overlap in two consecutive transitions, and α ( γ , Ω 1 ) is defined as follows:
α ( γ , Ω 1 ) = β ( ( 1 / 2 γ Ω I ) ( ω ( 1 γ ) Ω I ) )
where β ( x ) is an arbitrary function, defined as:
β ( x ) = 0 ,                 x 0 1 ,                 x 1 x 4 ( 35 84 x + 70 x 2 20 x 3 ) , x ( 0 , 1 )
The time–frequency component can be obtained:
W I ( t ) = f , φ I = f ( τ ) φ I ( τ t ) ¯ d τ

2.5. Signal Selection Method

Permutation entropy is a widely used metric for quantifying the complexity and randomness of one-dimensional time series. It offers great advantages in detecting abrupt processes in system dynamics [30]. In addition, it is characterized by strong noise robustness, high computational efficiency, and easy online monitoring [31]. For these reasons, it is used in this paper for the selection of characteristic time-frequency components. The basic principle of the algorithm is described as follows.
Given the time–frequency component W ( t ) , along with the time delay κ and the embedding dimension V, the phase space W of W ( t ) can be reconstructed as:
W = W 1   W j   W L = W ( 1 )           W ( 1 + κ ) W ( 1 + ( V 1 ) κ )         W ( j )             W ( j + κ ) W ( j + ( V 1 ) κ )         W ( L ) W ( L + κ ) W ( L + ( V 1 ) κ )
where 1 L l ( V 1 ) κ , j = 1 , 2 , , L , rearranges the values in the j t h phase space W j in ascending order, where j e is an indexed sequence of W j . The steps are as follows:
W j + ( j 1 1 ) κ W j + ( j e 1 ) κ
Thus, there are V ! possible patterns I for a V-tuple vector, where V ! denotes the factorial of V . Let P I denote its relative frequency. Then, the permutation entropy H of W ( t ) can be expressed in Equation (17):
H = ln ( V ! ) 1 j = 1 V ! P j ln ( P j )

2.6. Fault Detection Methods

The characteristic time–frequency components of a normal disturbance signal produce only stable, decaying oscillatory components. In contrast, those of a fault signal often contain dominant oscillatory components. This distinct difference can be used to effectively distinguish faults from normal perturbations. To characterize this difference, this paper proposes a metric termed “the fault variance”. The calculation procedure is as follows:
Step (a): Due to variations introduced by the signal extraction method, the fault components may differ and therefore require correction. The time–frequency component associated with the maximum permutation entropy is selected as the representative fault component. The energy signal E W n ( t ) of the fault component is computed and W c n ( t ) of the maximum permutation entropy is calculated and normalized to obtain g n ( t ) :
E W n ( t ) = [ W c n ( t ) ] 2 g n ( t ) = E W n ( t ) min ( E W n ( t ) ) max ( E W n ( t ) ) min ( E W n ( t ) )
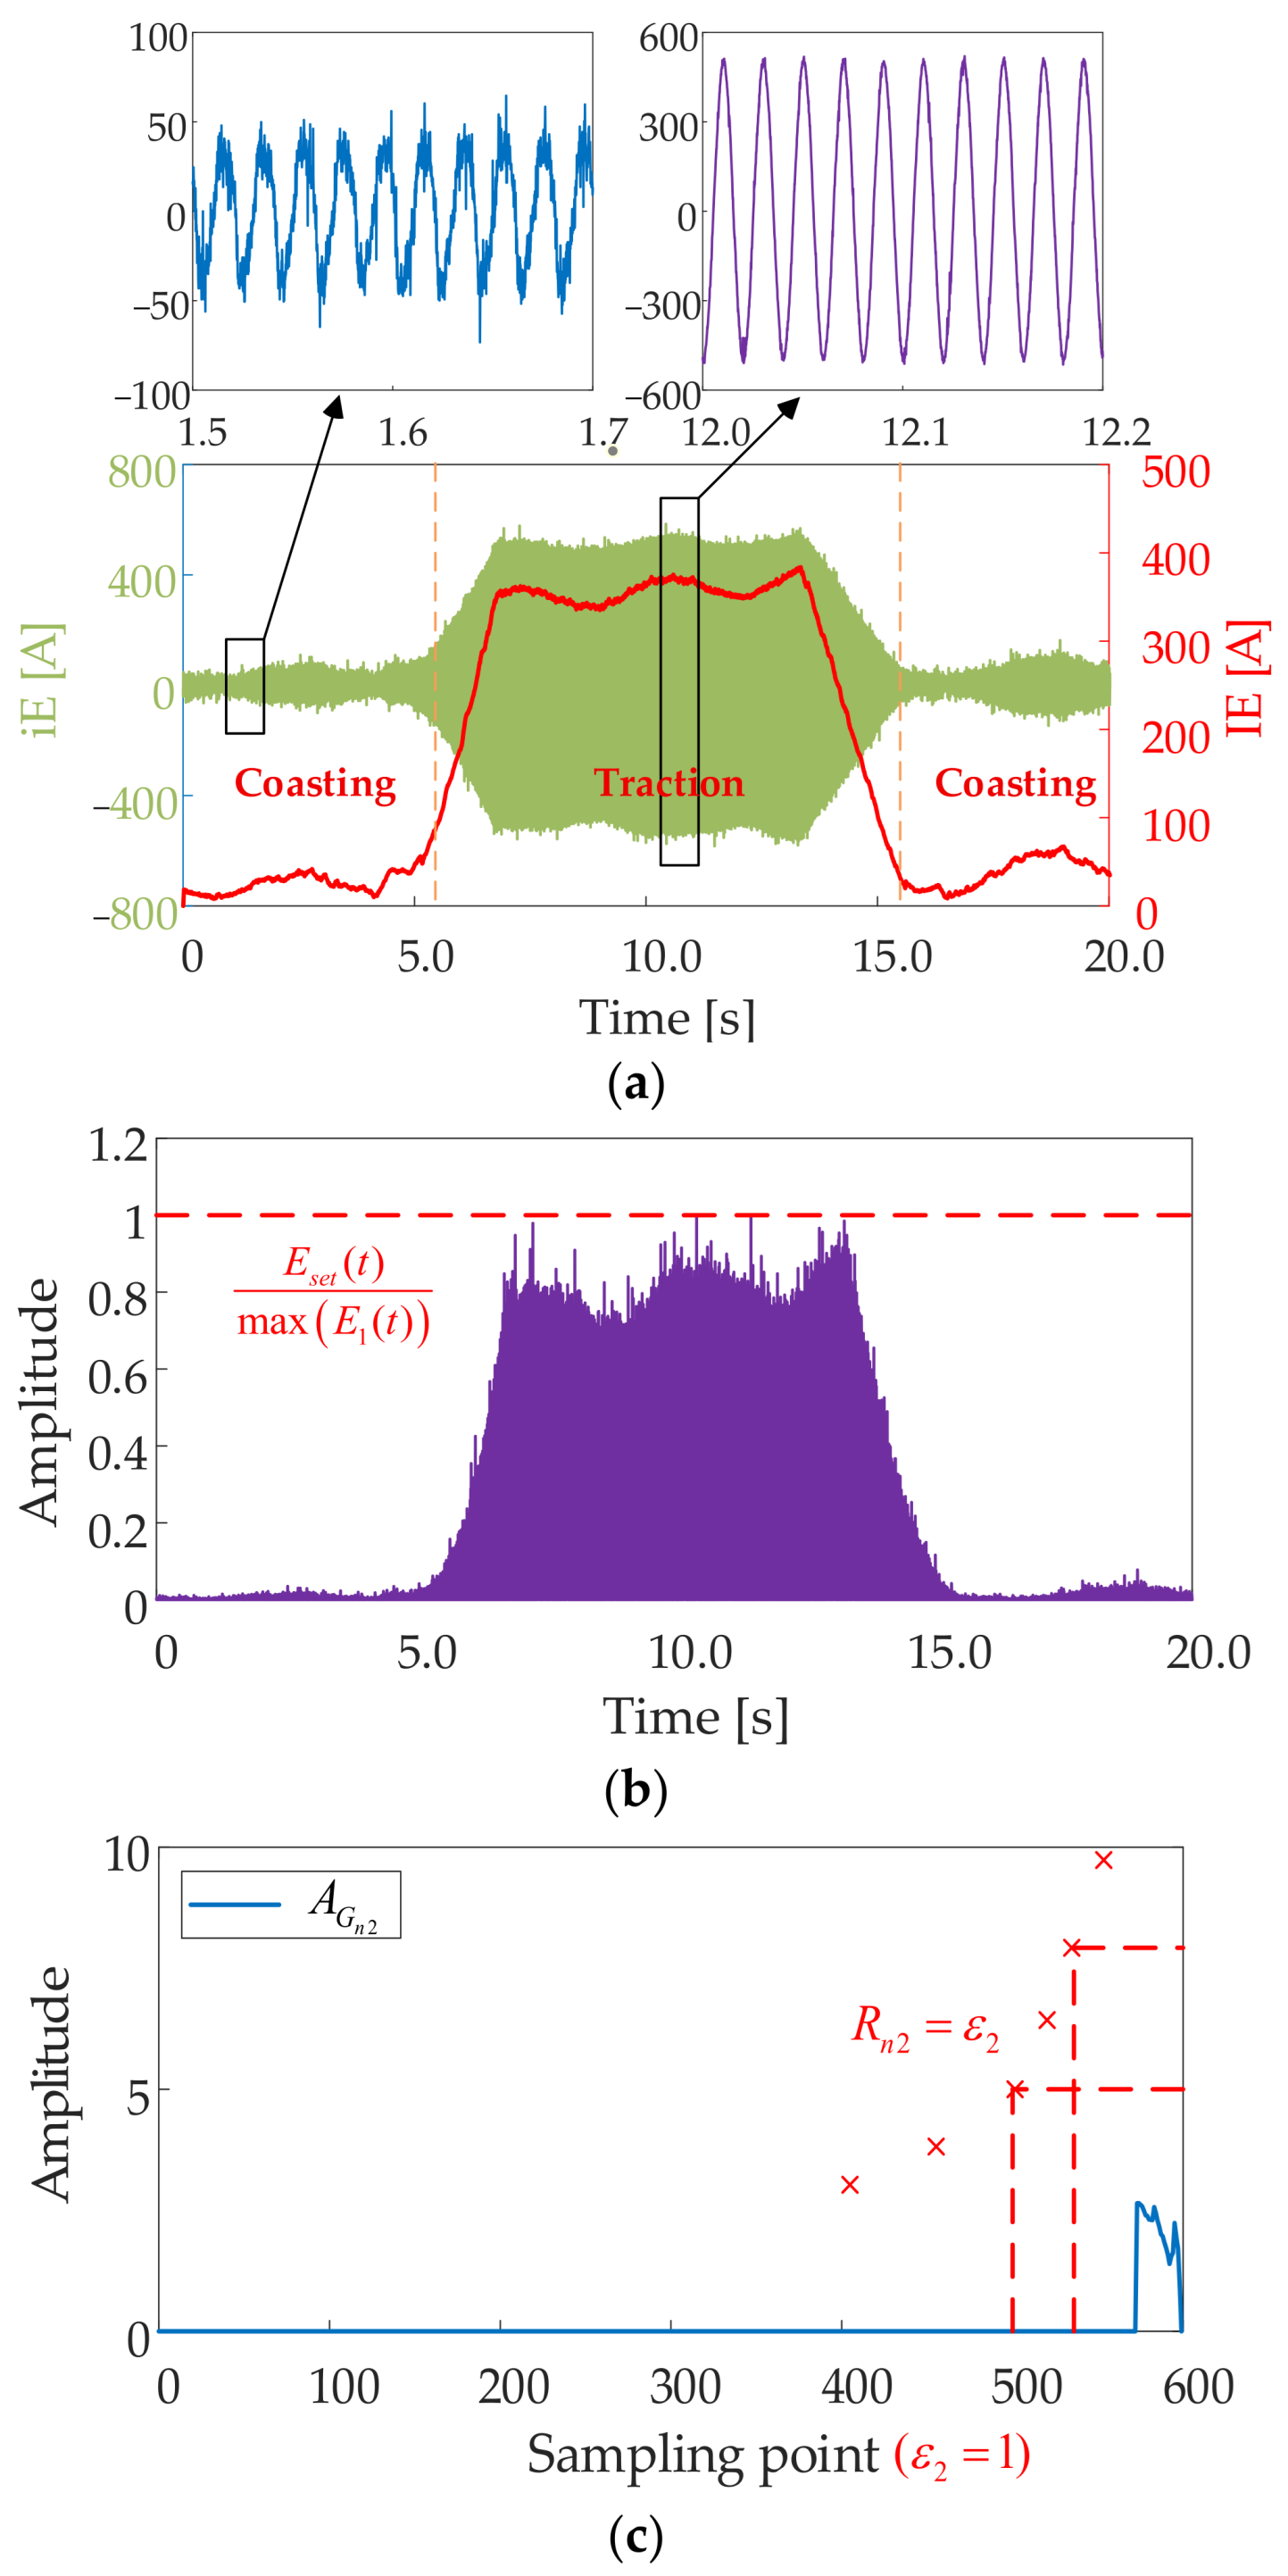
Step (b): Set the value of E 1 ( t ) with a value less than E s e t ( t ) / max E 1 ( t ) to 0 to compute the new energy sequence G n 1 ( t ) . E s e t ( t ) is the energy signal generated by avoiding the maximum load of the EMU. Set the value of g n ( t ) with value less than 0.1 to 0 to compute the new energy sequence G n 2 ( t ) . This process further suppresses the impact of the non-dominant oscillatory components.
Step (c): Rearrange G n ( t ) in ascending order to obtain the value sequence G V n ( s ) and the index sequence G C n ( s ) , where s denotes the sequence number. The fault variance R n is then computed using the following formula:
A = G V n ( s ) × G C n ( s ) max ( G C n ( s ) )
R n = 1 l 1 s = 1 l A μ 2
where A is the reconstruction sequence and μ is the expectation of A .
Equation (19) includes two operations. The first operation is the ascending ordering, which reduces the variability among values of similar magnitude, effectively minimizing intra-class differences. The second operation involves computing the product of the sorted energy sequence and its inverted index sequence, which amplifies the differences between values from different regions, thereby enhancing inter-class separability. Equation (20) is fundamentally based on the variance, which describes the degree of dispersion in a dynamic time series. For characteristic time–frequency components, fault signals typically exhibit a higher degree of dispersion than normal disturbances. Therefore, the variance defined in Equation (20) serves as an effective indicator for faults detection.
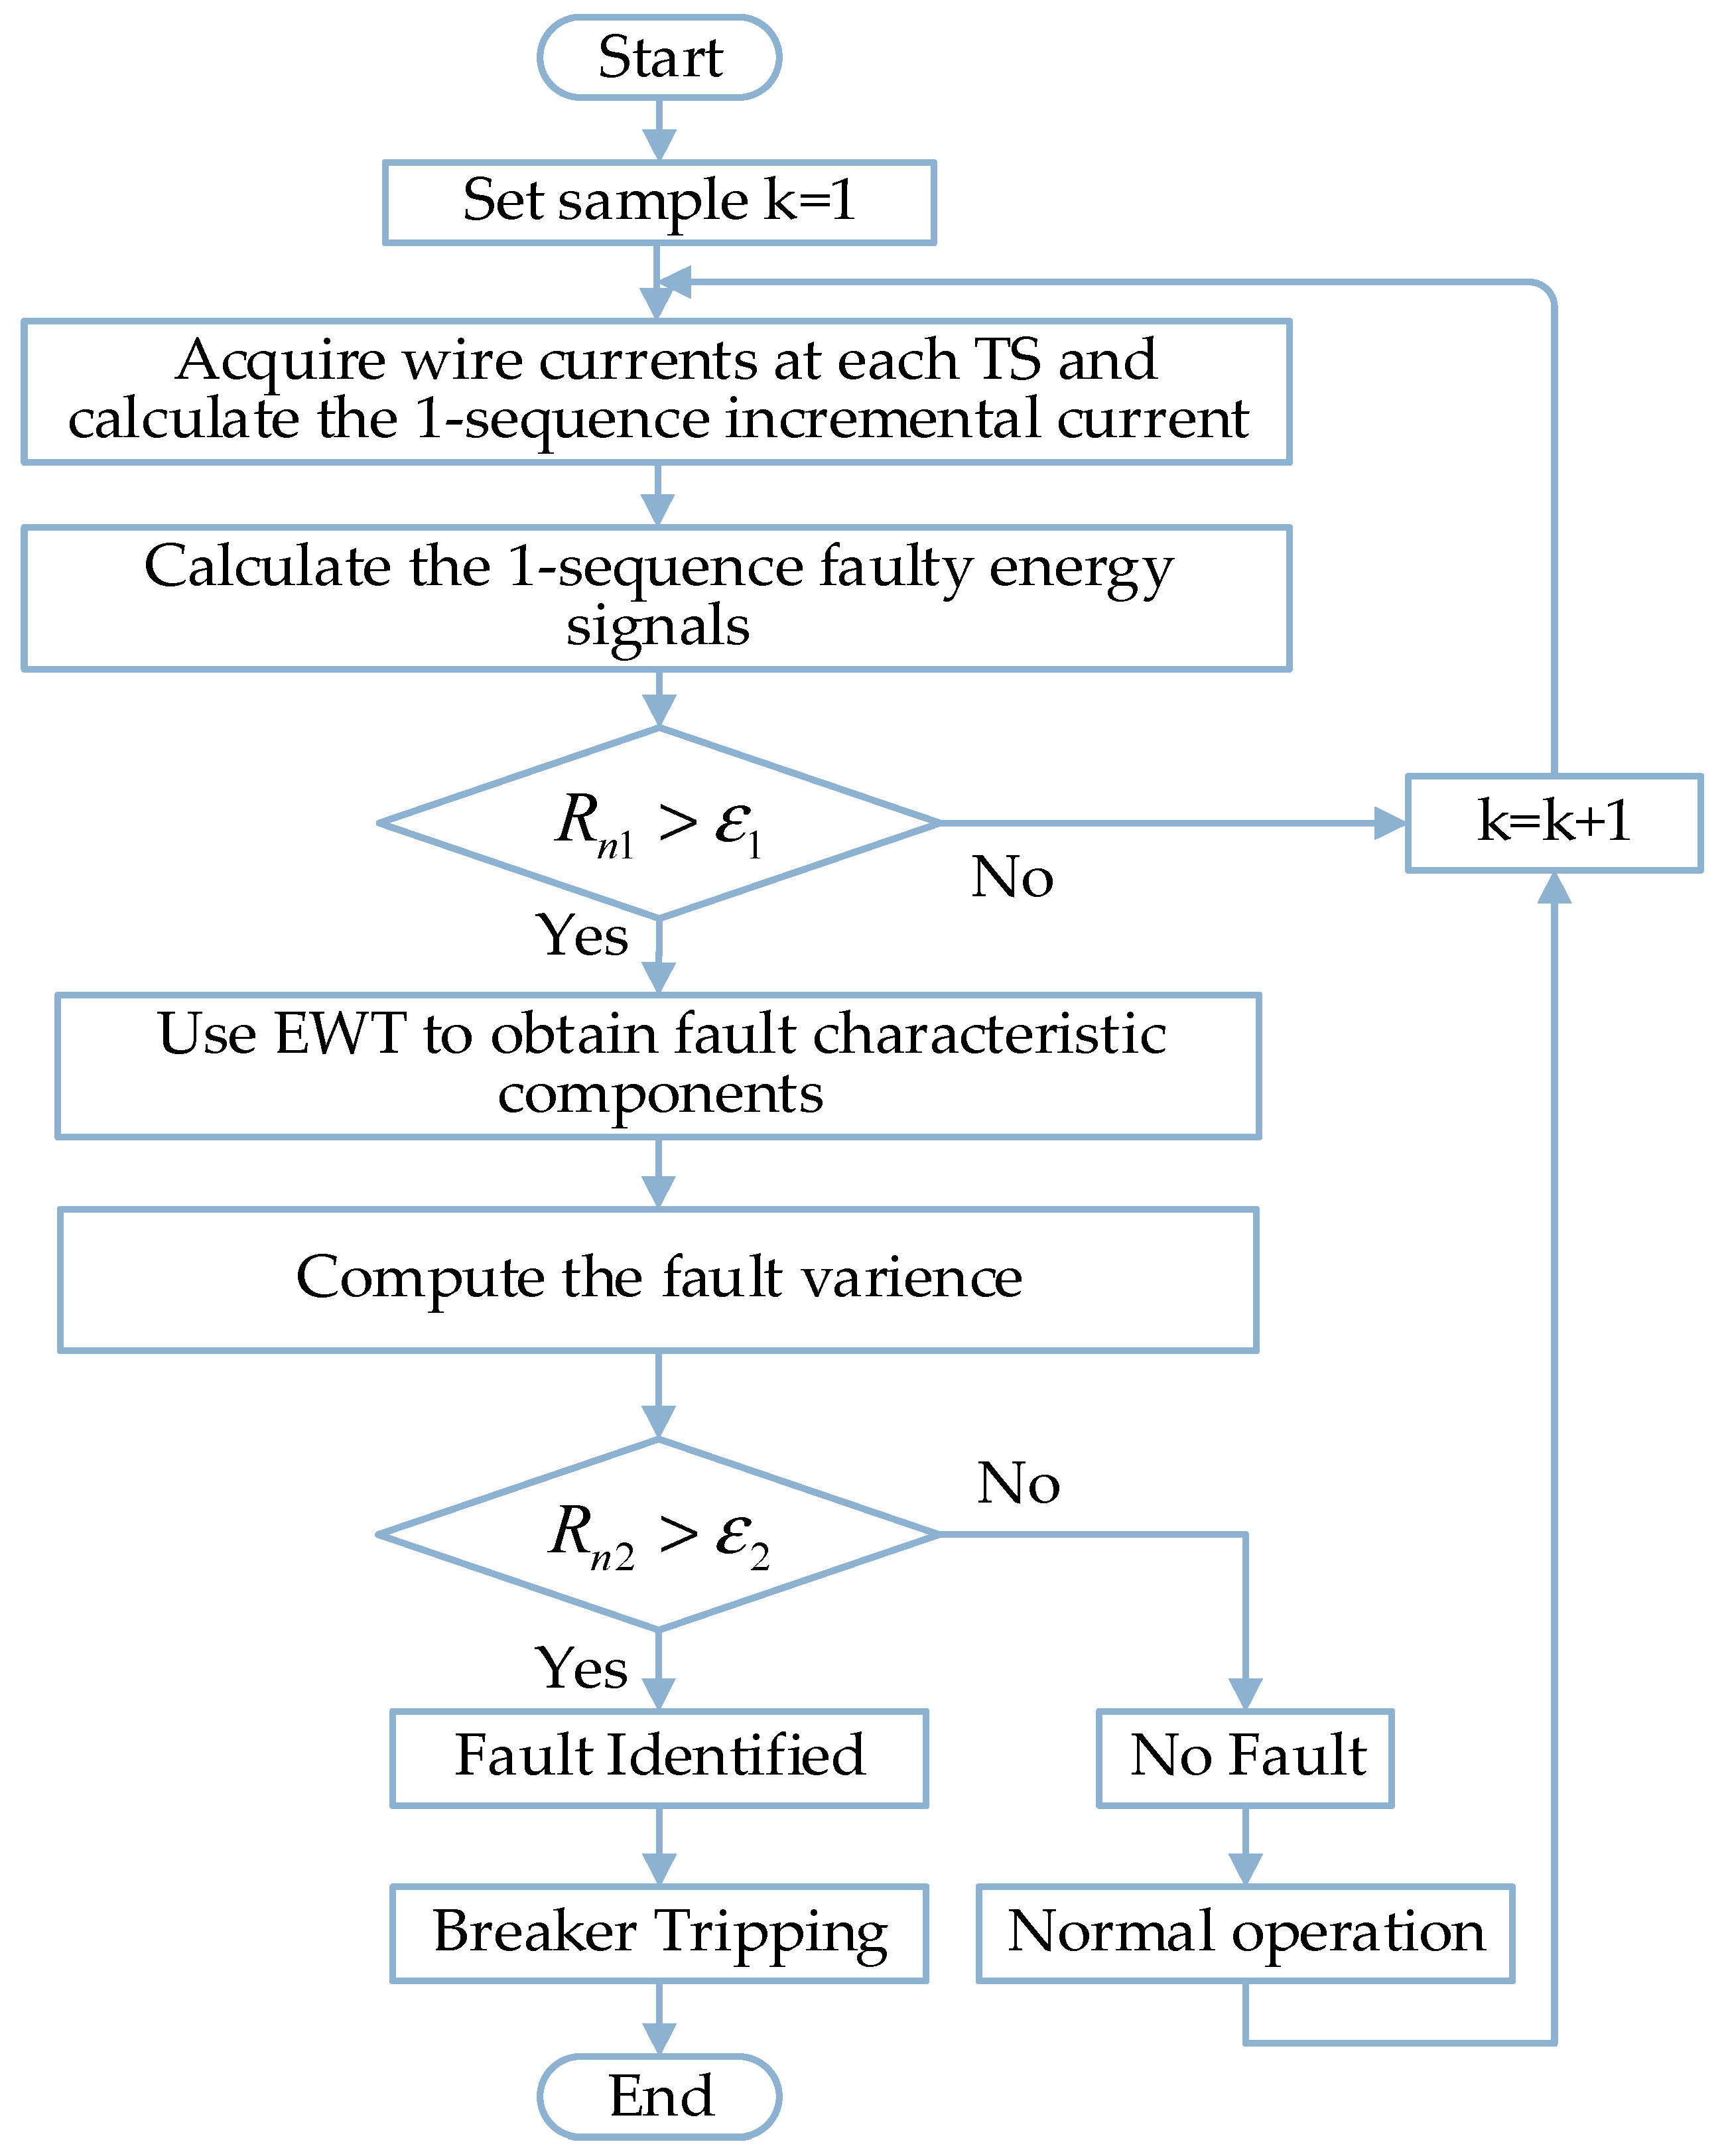
In summary, the process of fault identification is illustrated in Figure 6. A fault in the traction network is identified when the fault variance calculated from both the minimum and maximum permutation entropy components simultaneously exceeds a predefined threshold. Taking a fault detection window of 600 sampling points at 10 kHz as an example, the dispersion of the fault variance R n 1 , corresponding to low-frequency components, is relatively large and can be set within the range of 10–100. In contrast, the dispersion of the fault variance R n 2 , corresponding to high-frequency components, is smaller and can typically be set to 1.

3. Case Studies

To evaluate the performance of the proposed fault identification method, an AT network for flexible TPSS is modeled. The modeled system represents a 48 km section of the railway, which is divided into three subsections. The parameters of the FTPSS are displayed in Table 1. These parameters were obtained through on-site measurements conducted along the Chuan-Qing Railway, which employs FTPSS. The sampling frequency is set to 10 kHz.
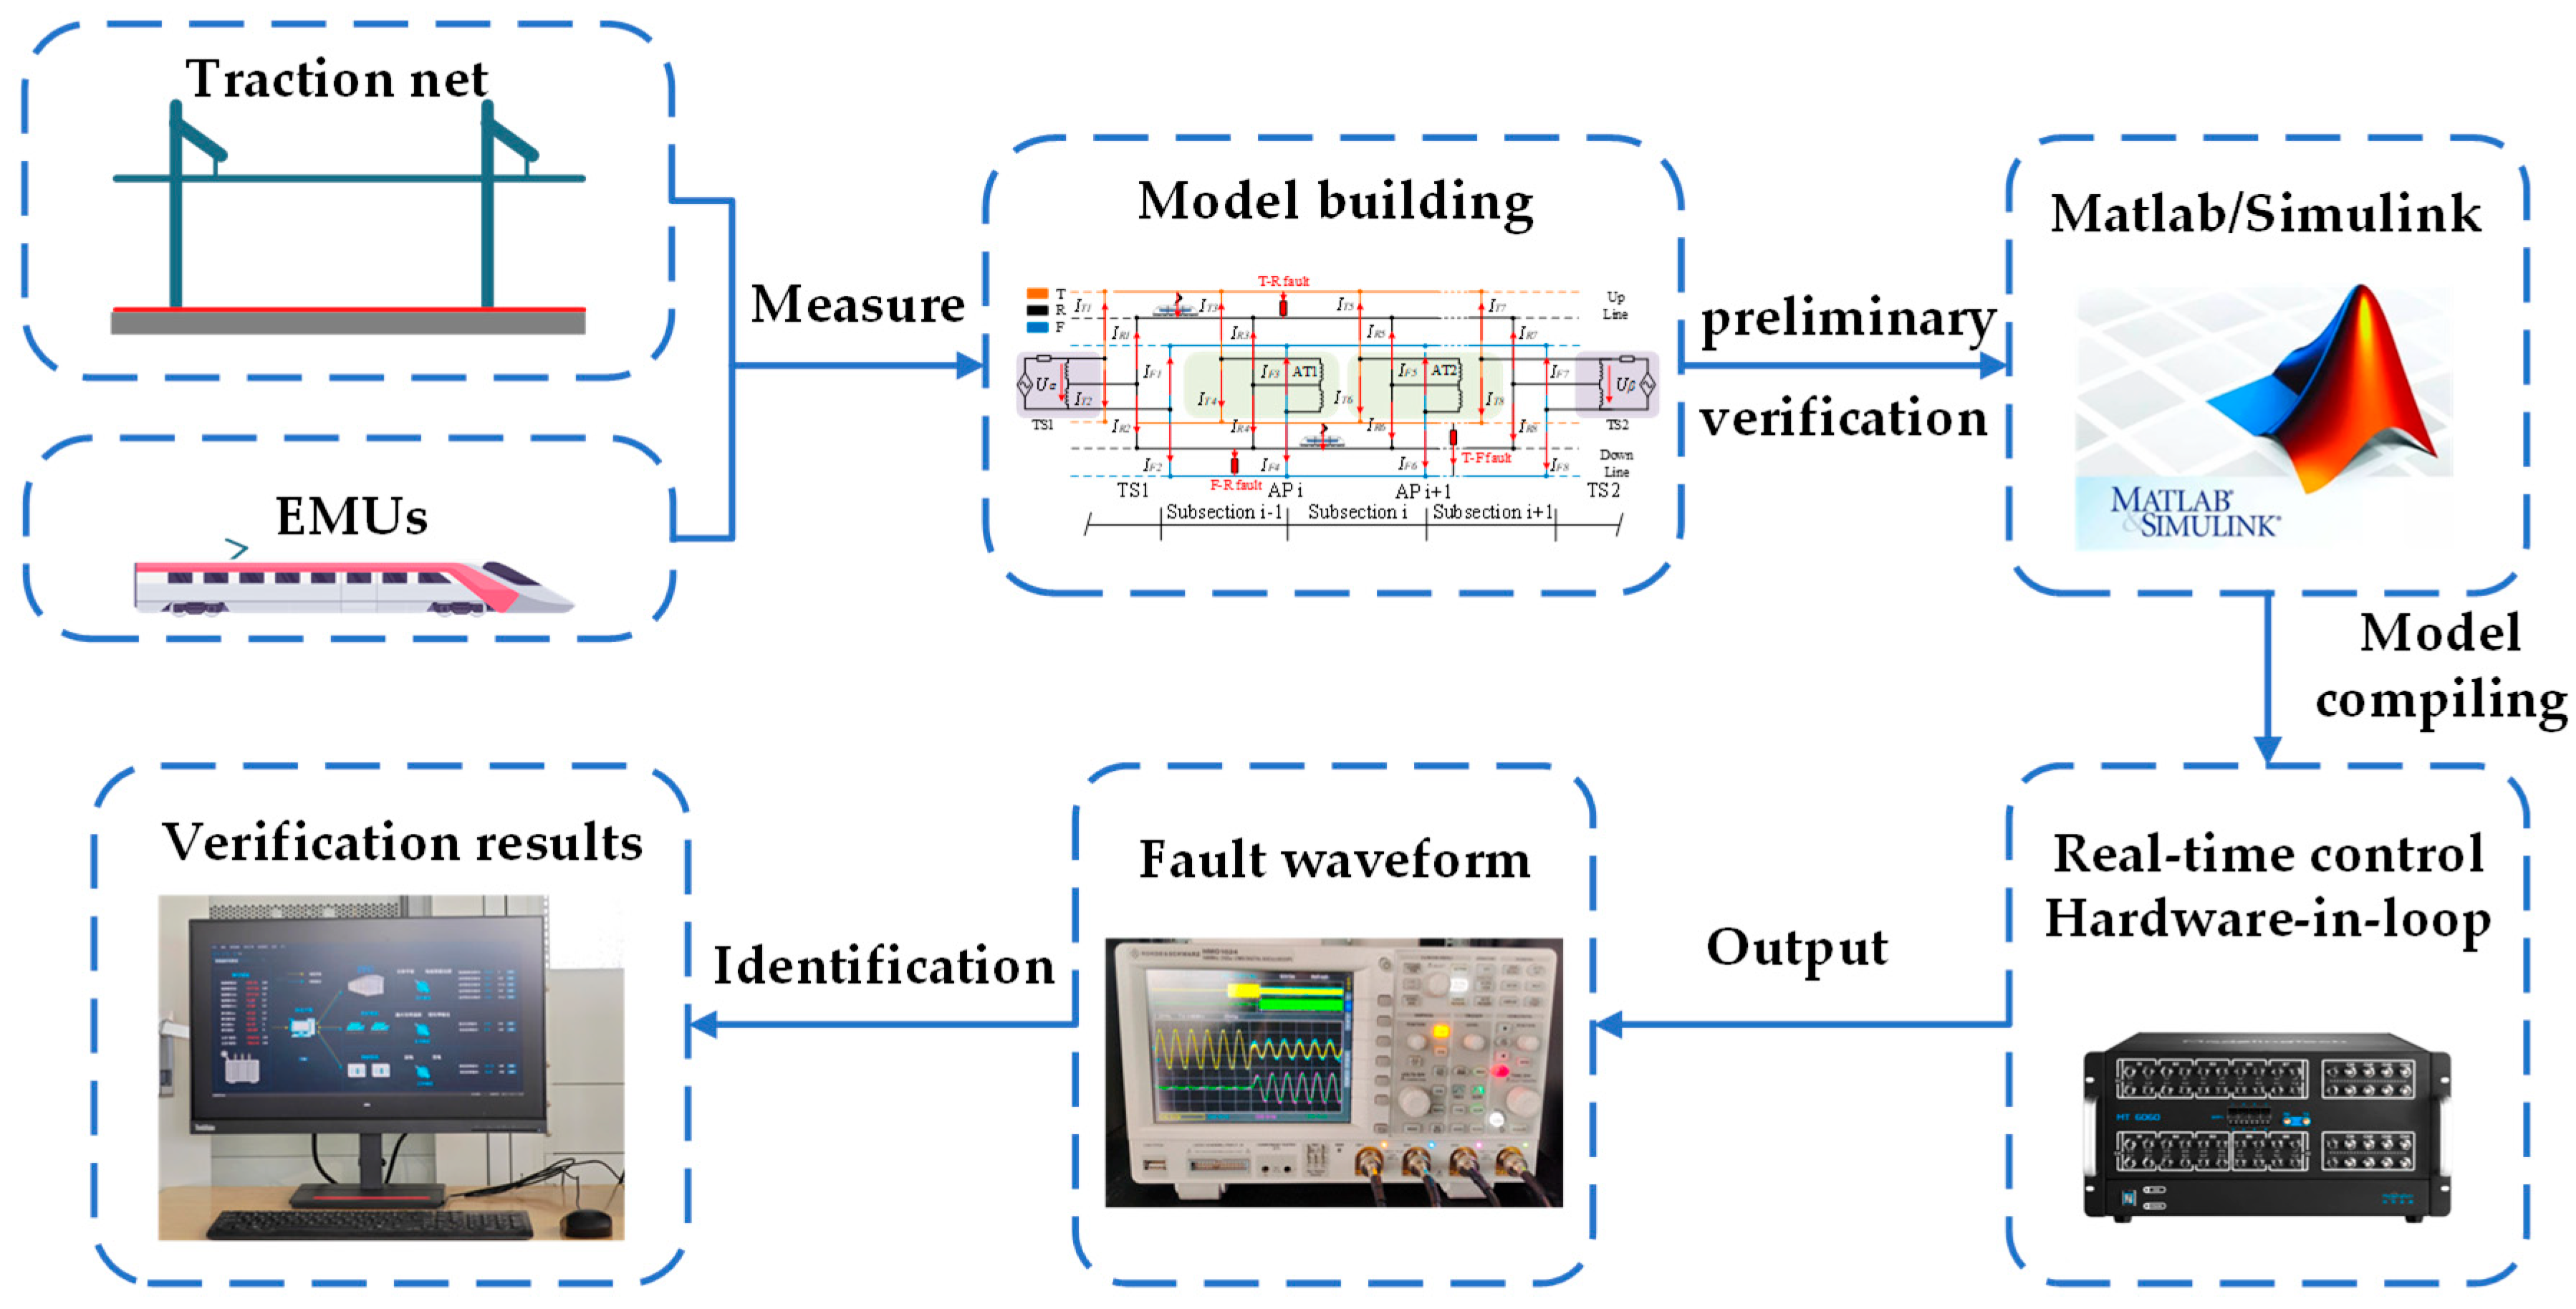
Figure 7 shows the flowchart of working procedure. Based on the measured traction network parameters and operational data from the CRH380A trainset on the Chuan-Qing Railway, a Matlab/Simulink simulation model was established. In Section 3.1, Section 3.2, Section 3.3 and Section 3.4, the influence of various factors—such as fault distance, fault impedance, fault inception angle, inrush current, and EMUs—on the performance of the proposed fault identification method was systematically analyzed. Finally, in Section 3.5, the accuracy and reliability of the method were further validated through real-time control hardware-in-loop experiments, which offer a more realistic testing environment.
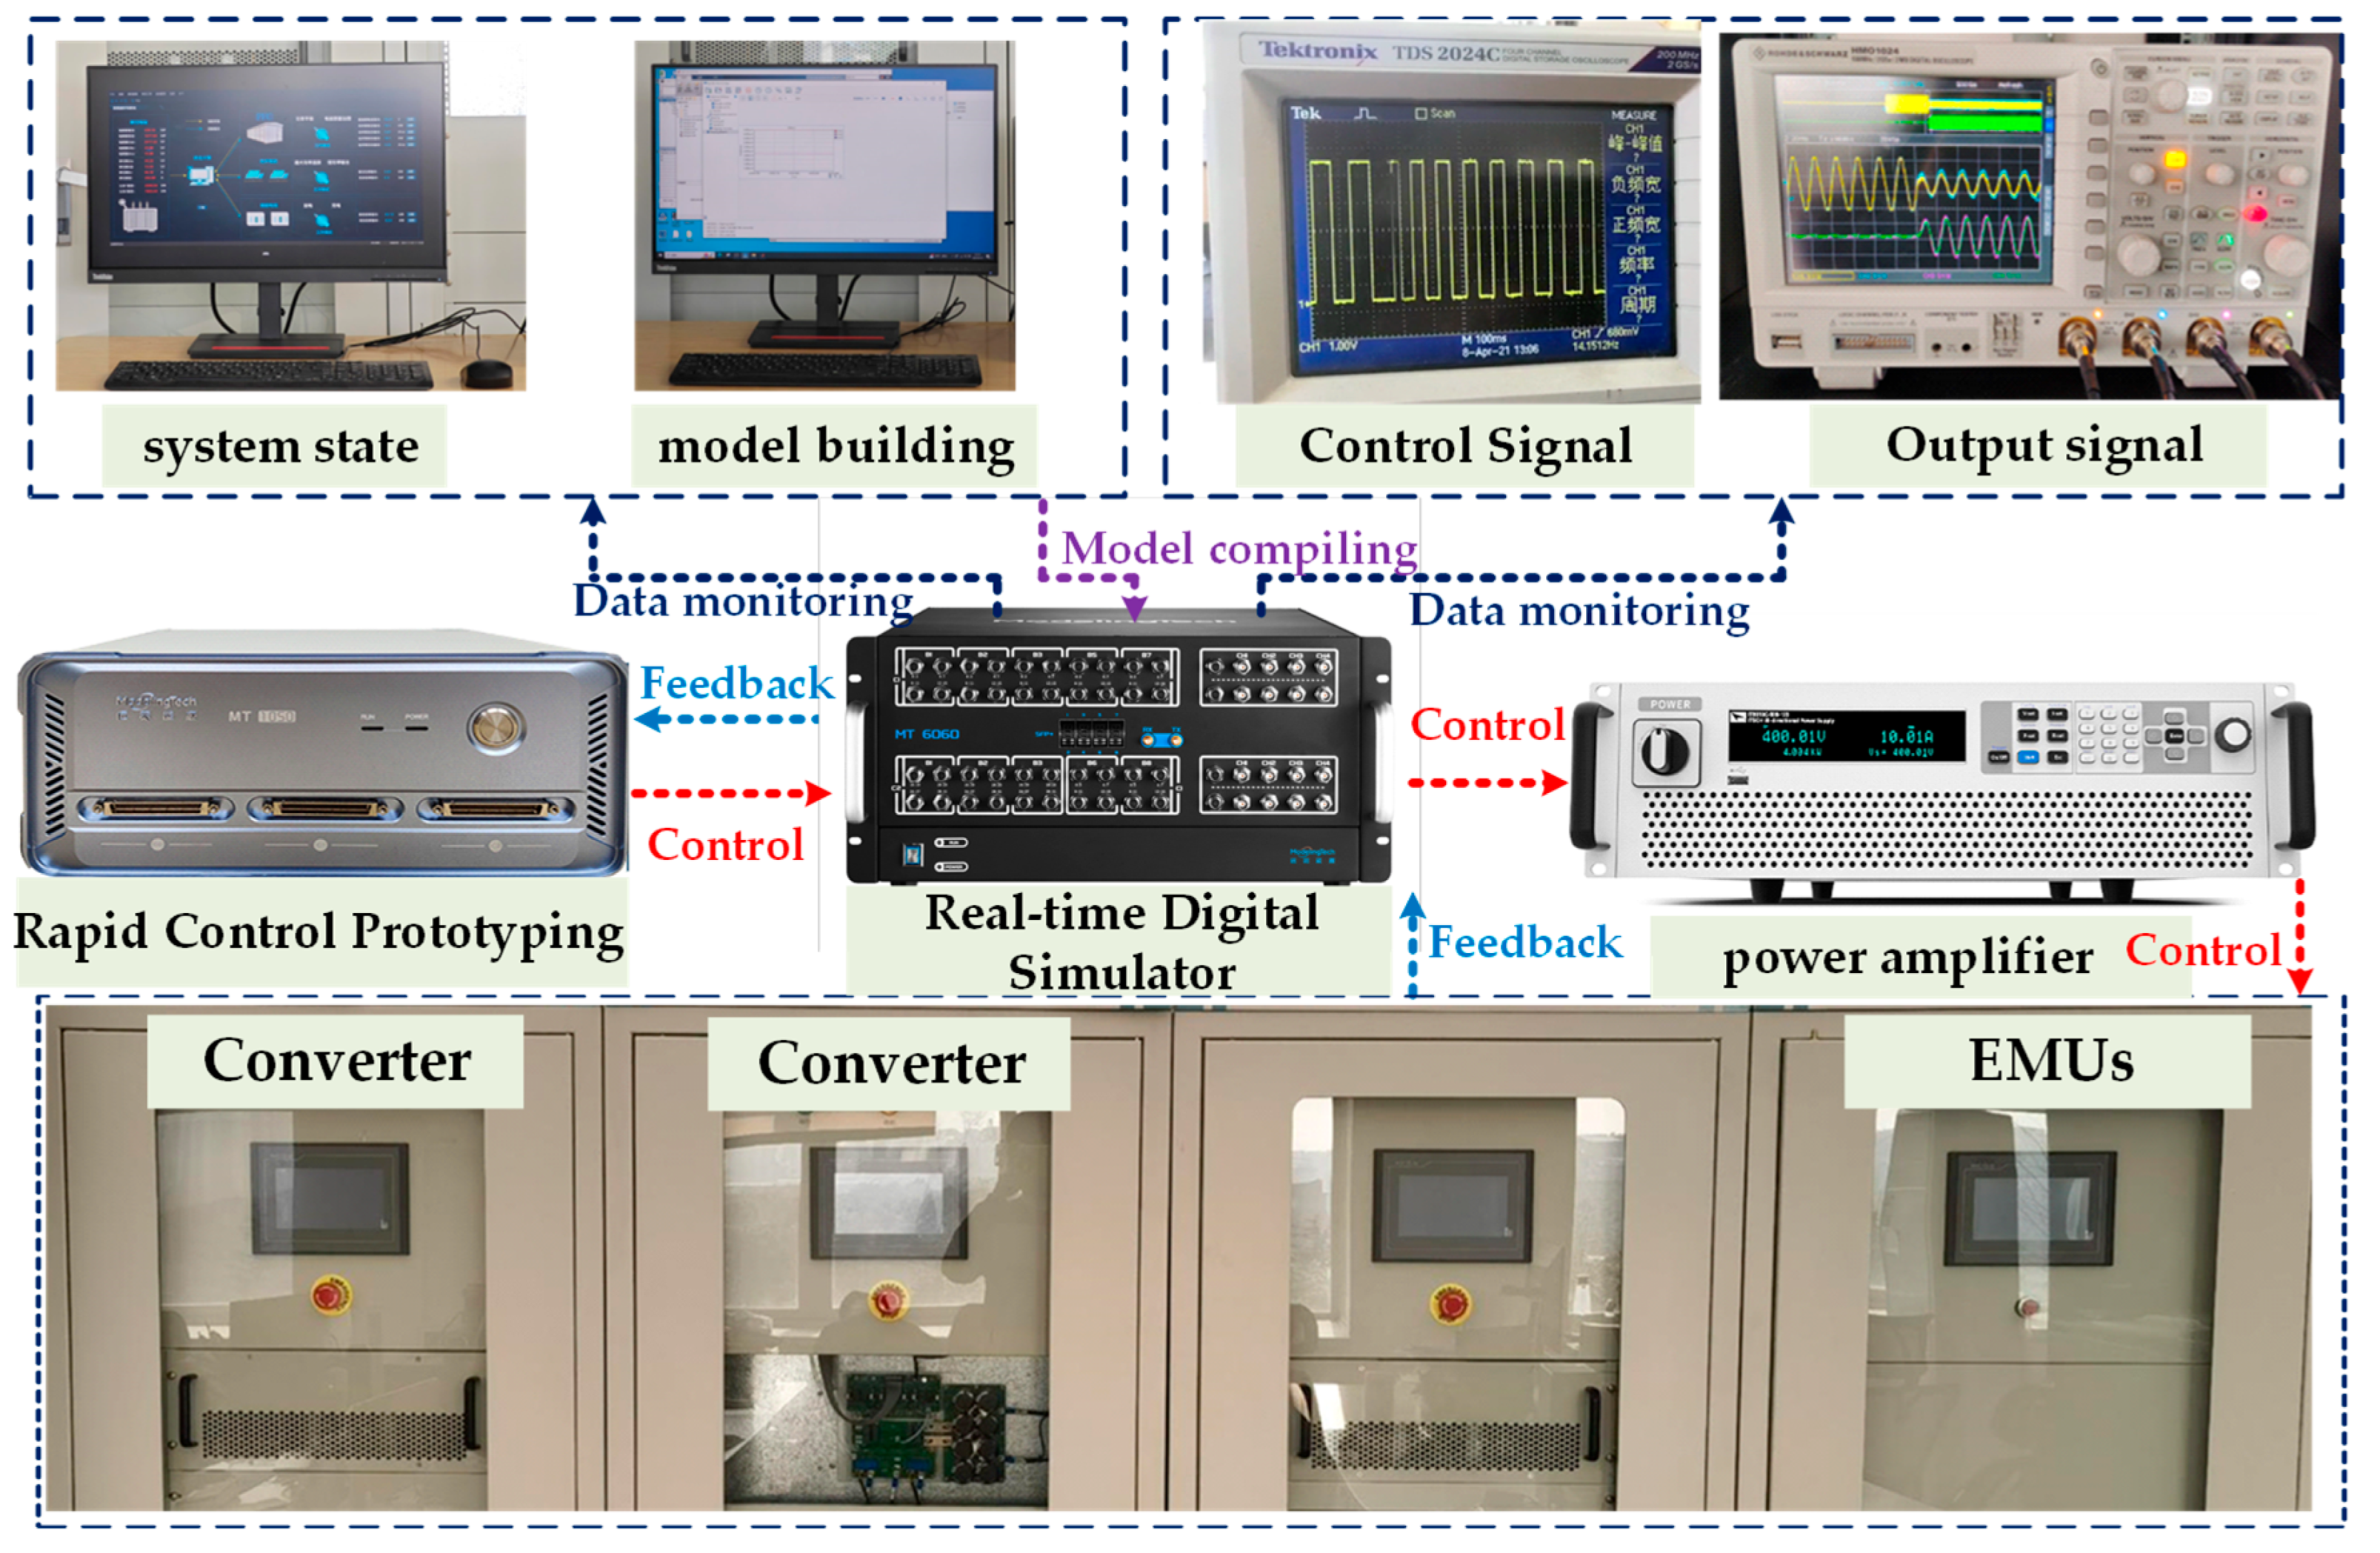
Figure 8 illustrates the experimental setup for the real-time control hardware-in-loop simulation. The AC-DC and DC-AC physical modules are employed to emulate the actual operation of the FTPSS converters located at TS1 and TS2. The traction network model is compiled into Real-time Digital Simulator. The rapid control prototyping is used to facilitate rapid integration of the control algorithms with physical hardware. Real-time Digital Simulator output signal controls TS1 and TS2 through a power amplifier.

3.1. Testing with Fault Position and Metallic Fault Types

Metallic and non-metallic faults are defined based on whether the fault current leads to current limitation in the converter. This section evaluates the effectiveness of the proposed method in identifying metallic faults occurring at different fault distances.
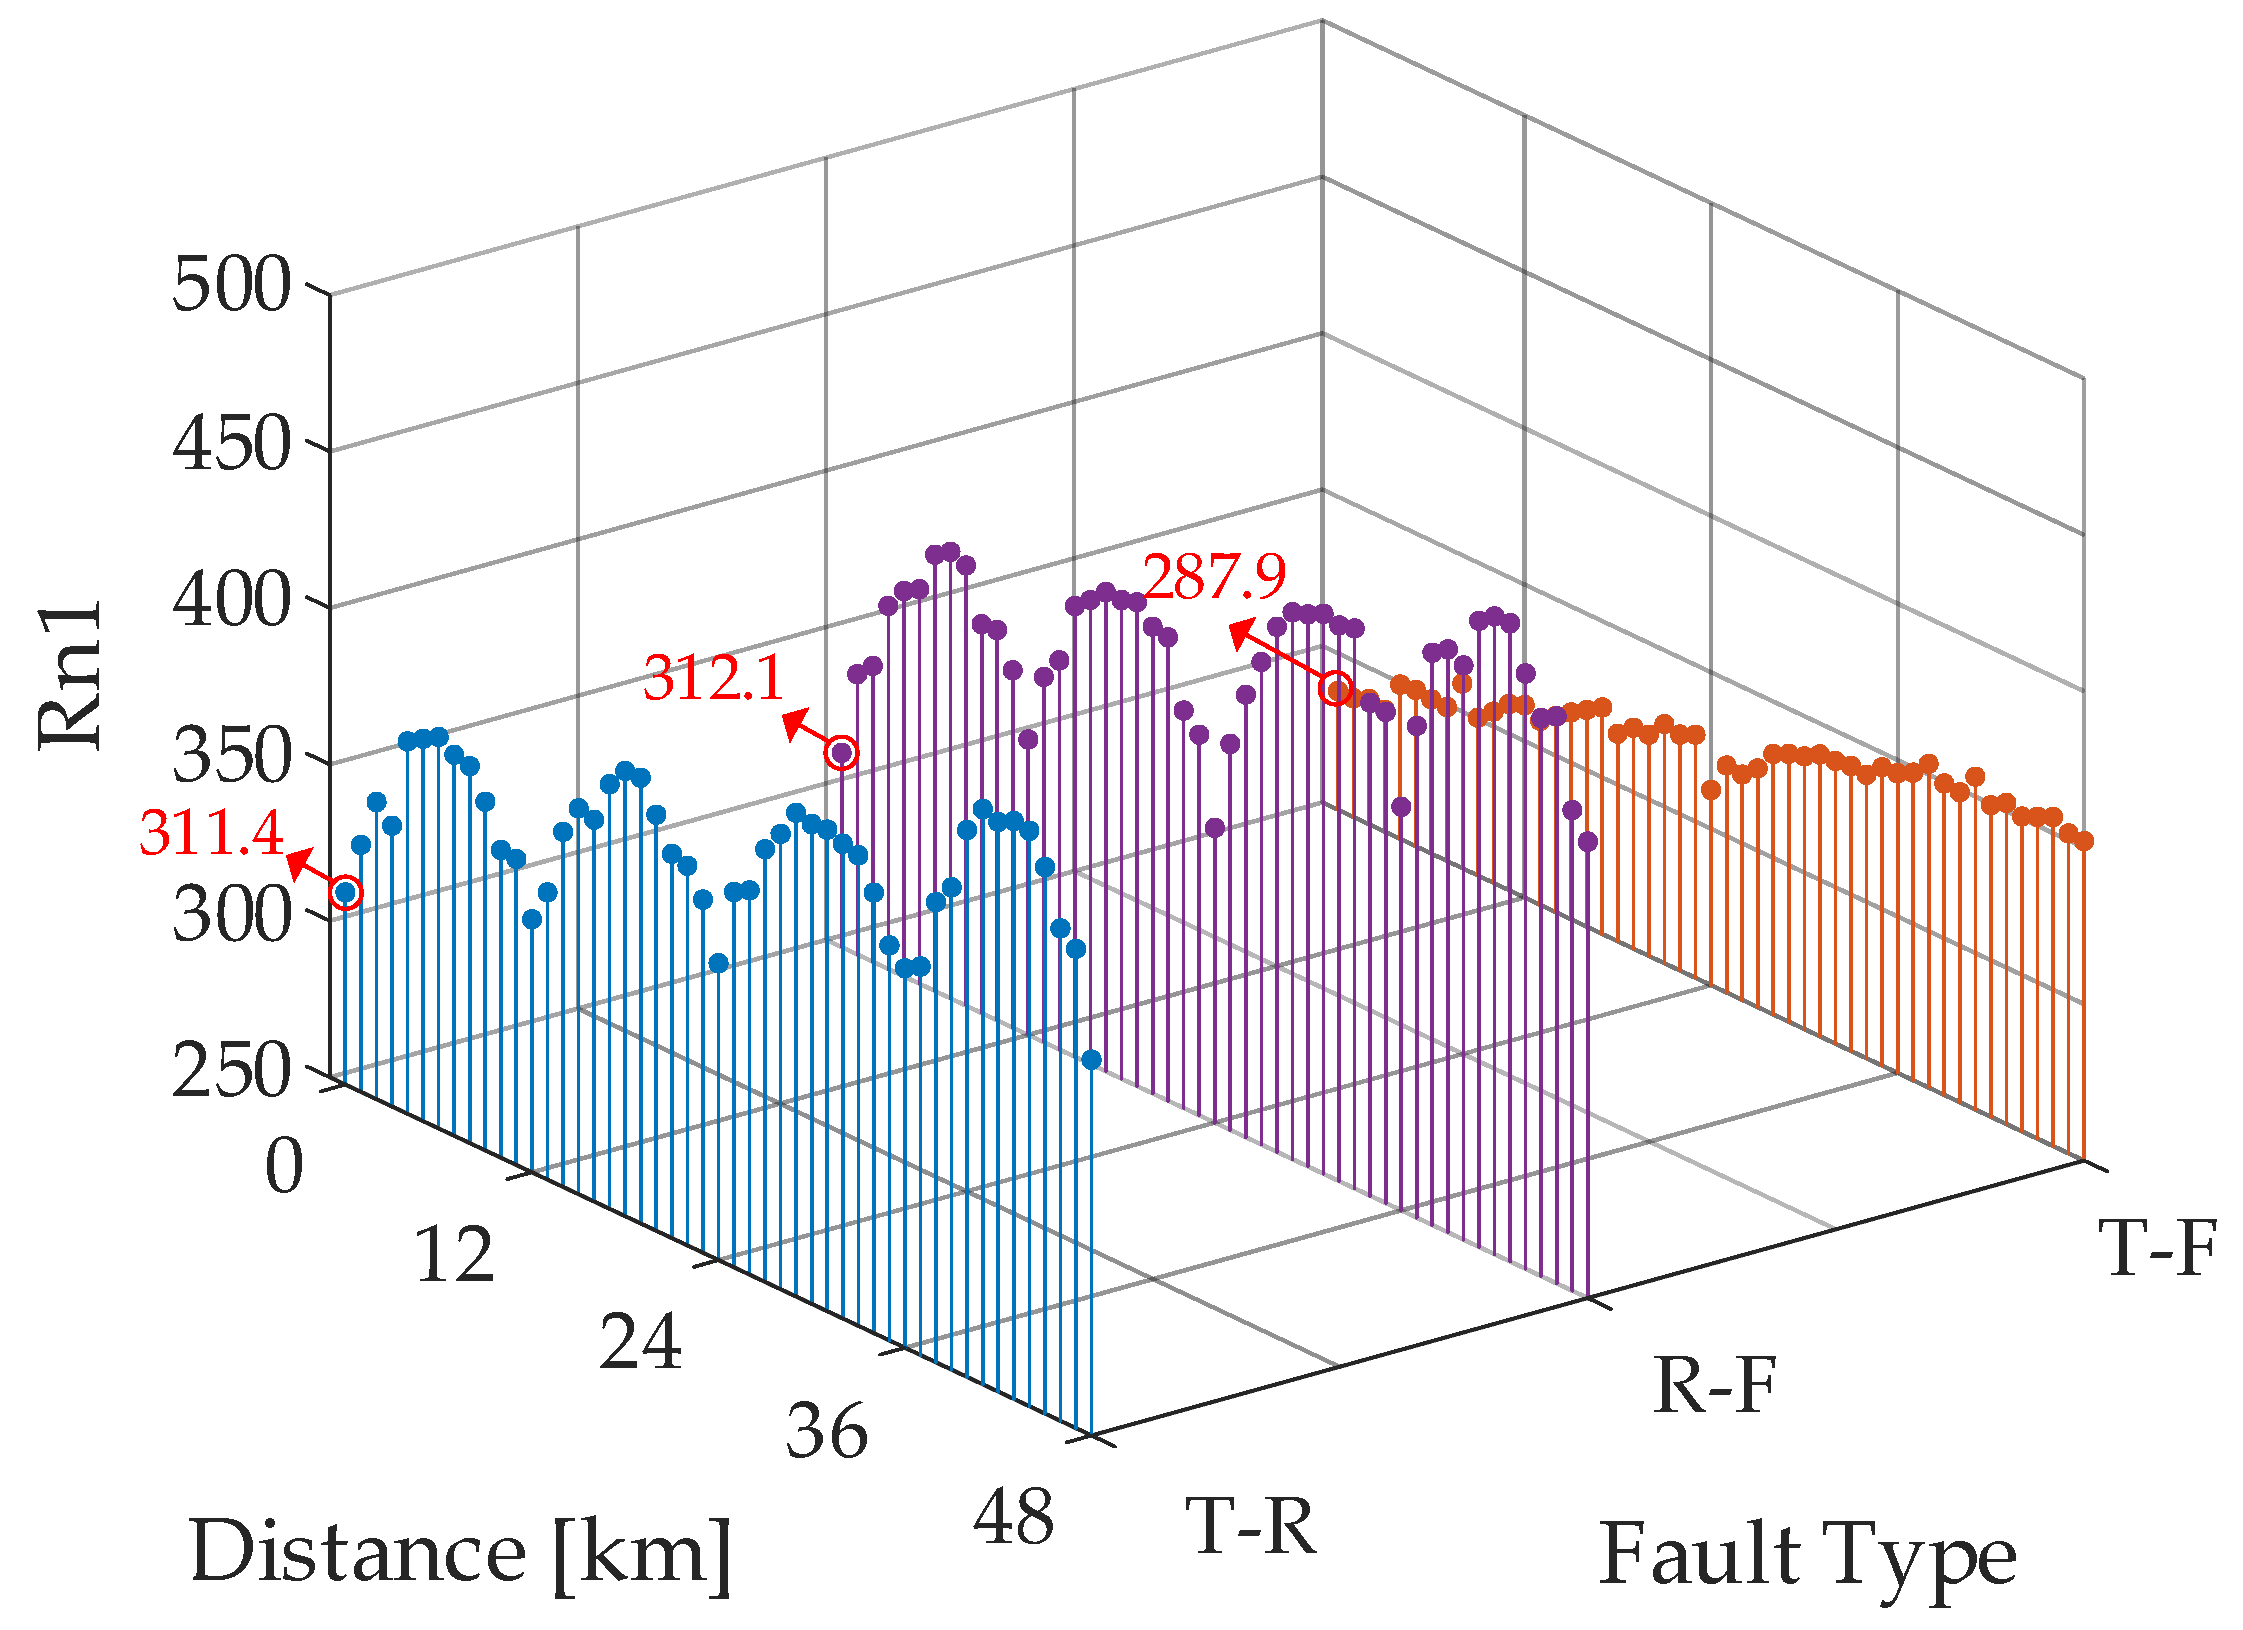
In Figure 9, it can be learned that the fault variance R n 1 is smaller in T-F and larger in F-R faults for different fault types T-R, F-R, and T-F. In all three fault types T-R, F-R, and T-F, the minimum R n 1 is calculated for fault currents occurring at the outlet of the substation, which are 311.4, 312.1, and 287.9, respectively.
Figure 10a shows the energy signals E 1 ( t ) corresponding to T-R, F-R, and T-F faults occurring at a distance of 6 km from the substation. Due to the metallic nature of the fault, the short-circuit current rises sharply, while the incremental short-circuit current decreases quickly as a result of the converter’s current-limiting strategy. And the fault voltages are 25 kV for both T-R and F-R faults, and 50 kV for the T-F fault. After transforming E 1 ( t ) to A , as shown in Figure 10b, the area of the curve envelope T-F is minimized while F-R is maximized. Consequently, the corresponding R n 1 is also minimized by T-F and maximized by F-R.
The multiple time–frequency components W n ( t ) extracted from signal E 1 ( t ) via the empirical wavelet transform (EWT) are demonstrated in Table 2. For each time–frequency component, the results of the permutation entropy are calculated.
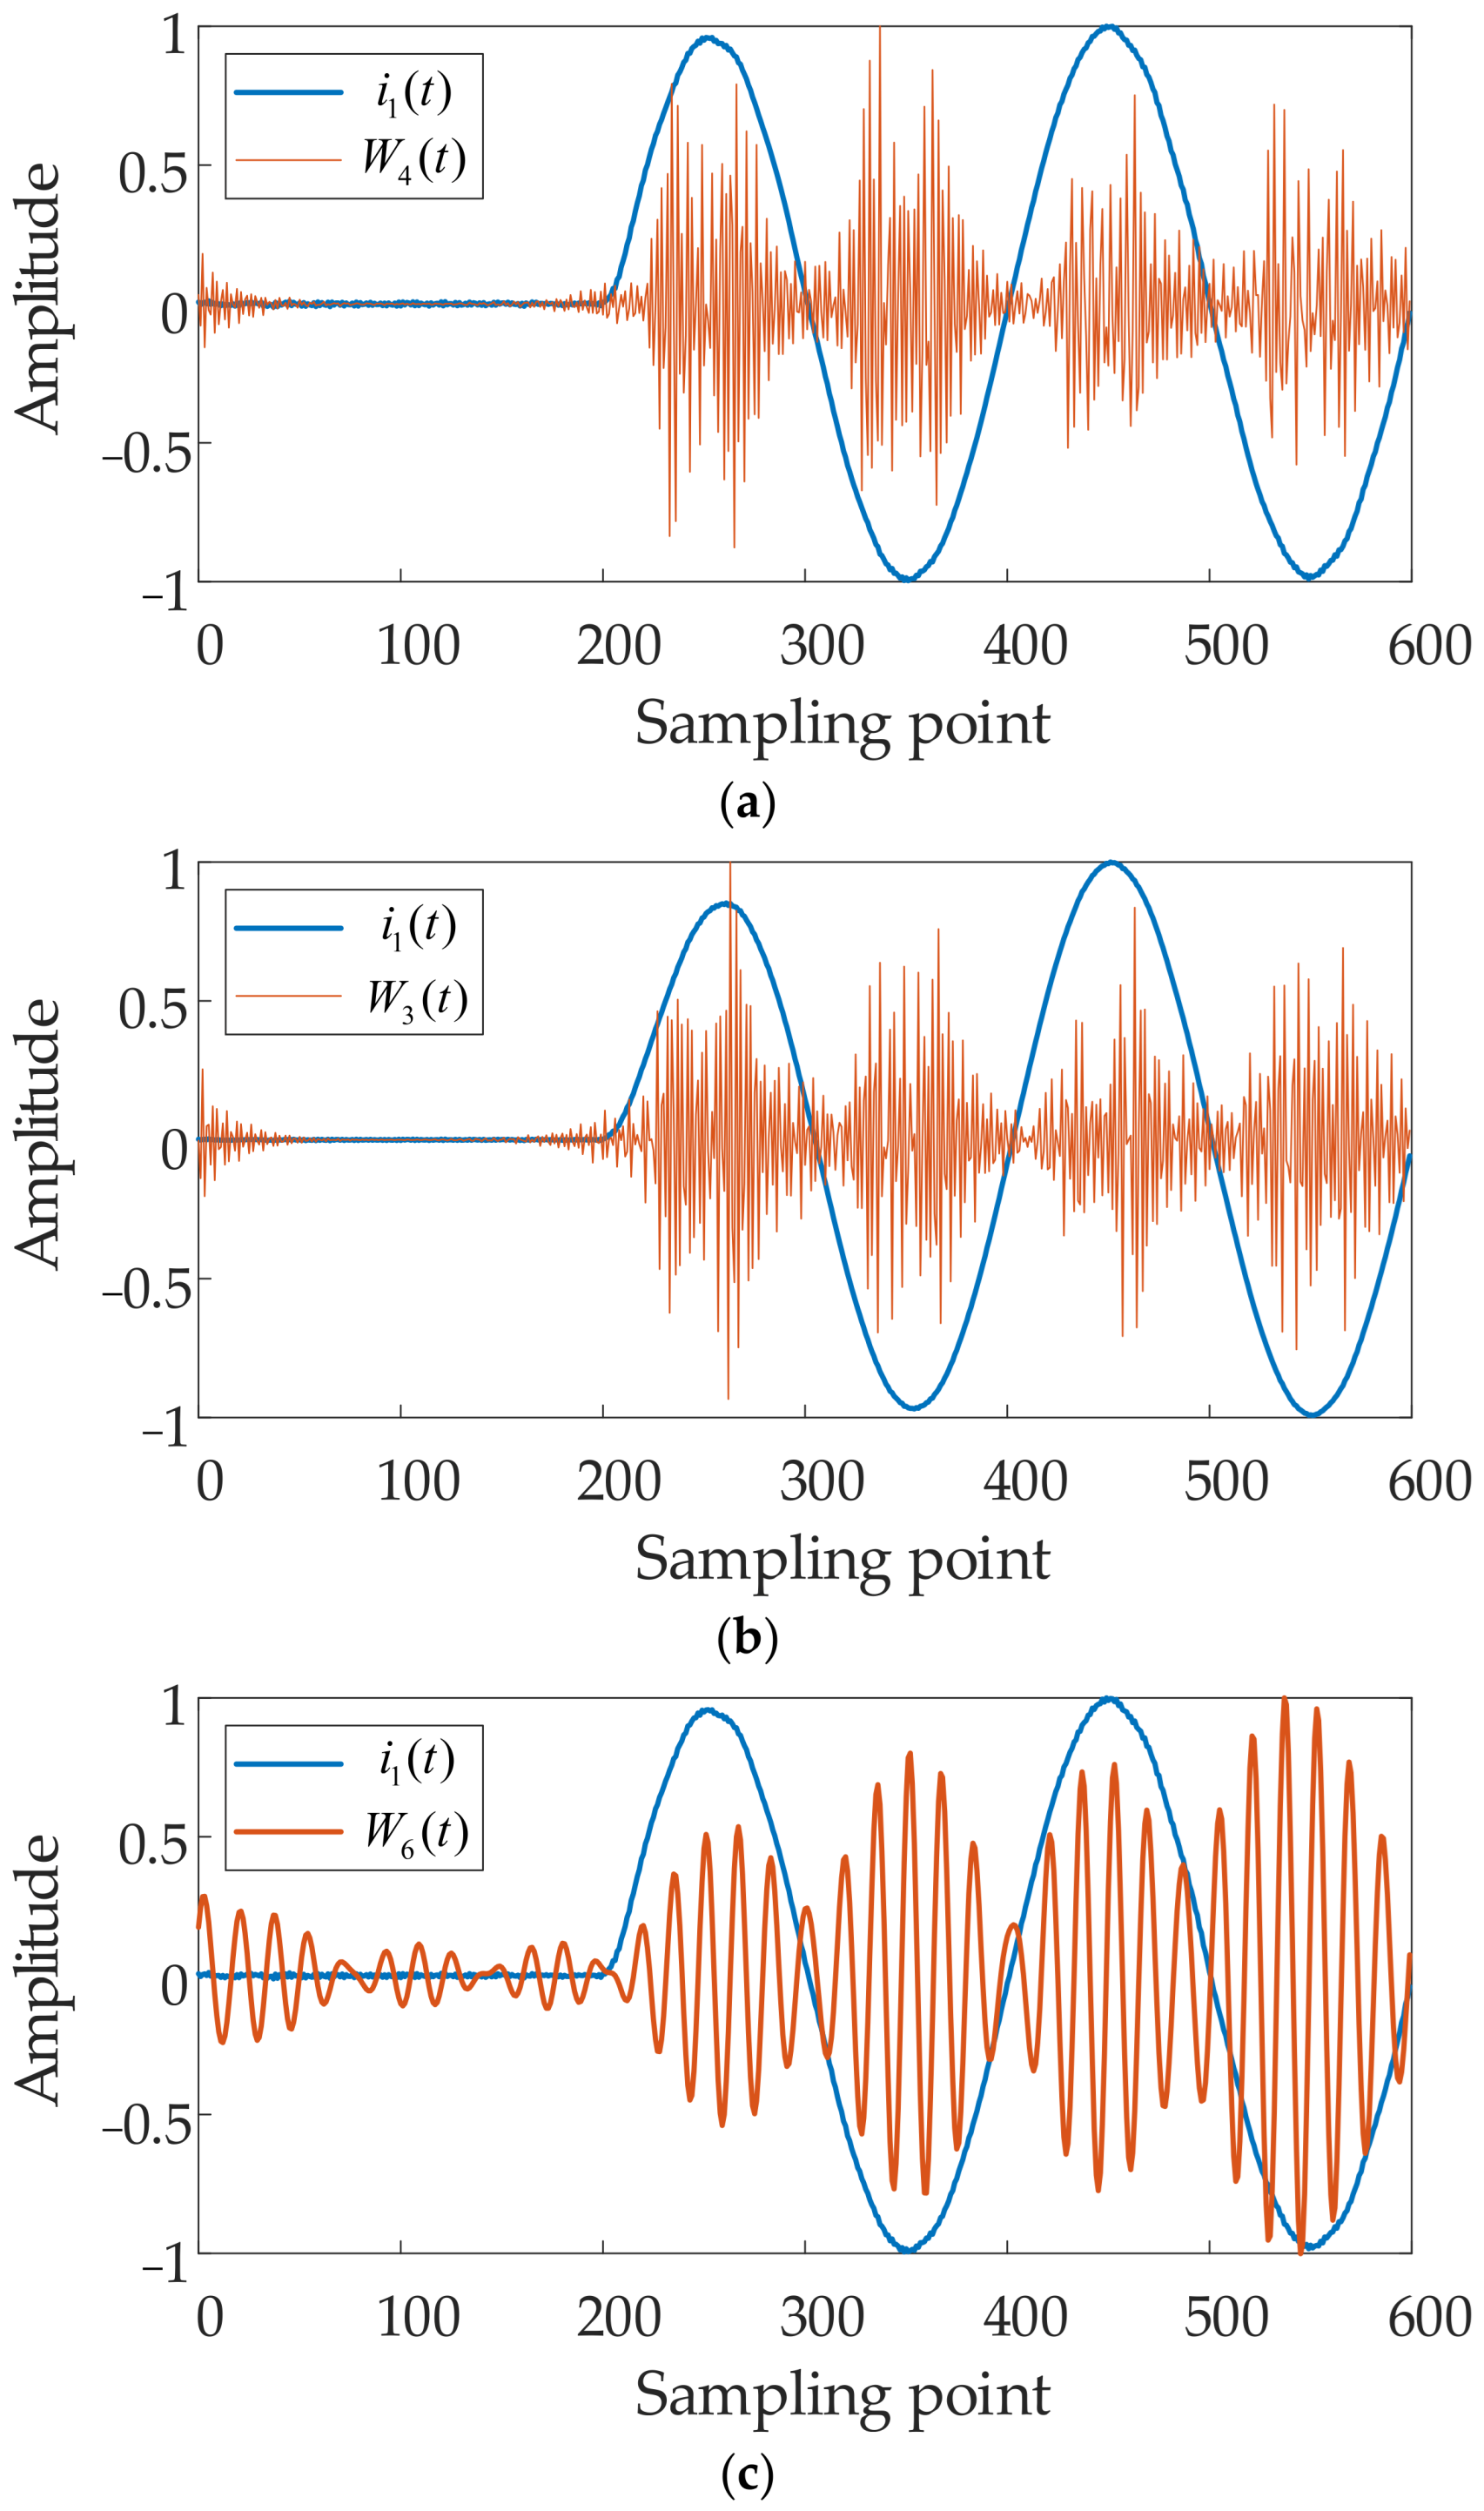
Figure 11 shows the waveforms of W n ( t ) with one-sequence current signal i 1 ( t ) for T-R, T-F, and F-R faults, respectively. Among them, the T-R and T-F are the fault components corresponding to the maximum permutation entropy, while R-F demonstrates the time-frequency component with relatively lower permutation entropy. It can be seen that the fault components with larger permutation entropy can track the one-sequence current signal changes well. The nonmetallic fault produces four energy changes in the fault component after the fault, which is significantly different from the disturbance. R n 1 is 13.6, 11.79, and 113.7, respectively.
These results demonstrate that permutation entropy is effective in selecting the fault components that exhibit the most drastic changes, which can be well used to identify the faults.

3.2. Testing with Fault Inception Angle and Fault Impedance

Figure 12 shows the magnitude of R n 1 for metallic and non-metallic faults under varying fault inception angles. While the calculation of incremental current is inherently independent of the fault inception angle, the presence of current limiting measures introduces dependencies: the larger the fault inception angle, the sooner the short-circuit current reaches the current limiting threshold, and thus the earlier the incremental current is suppressed. By comparing Figure 12a with a transition impedance of 0.75 Ω and Figure 12b with a transition impedance of 50 Ω, it can be observed that the present method is more advantageous in identifying faults under the high transition impedance conditions, particularly in the absence of current limiting measures.
Figure 13a shows the variation of fault impedance with respect to fault distance in FTPSS. It can be seen that, under the influence of AT, the fault impedance exhibits a nonlinear, saddle-shaped relationship with fault distance. Since FTPSS eliminates neutral section, the nonlinear relationship is further exacerbated by the combined effect of power sources on both sides. Figure 13b shows the protection zone used for distance protection, where a fault point is simulated every four kilometers. The distance protection employs a protection area, with the following polygon characteristics [32]: inrush current phase shift angle of 85°, capacitive phase shift angle of 15°, line impedance angle of 70°, distance reactance setting value of 15 Ω, and the resistance setting value of 16 Ω. Due to the bidirectional injection of fault current in the FTPSS, the measured impedance increases, significantly degrading the performance of conventional distance protection. As a result, it can only correctly identify faults with a fault impedance up to 5 Ω. However, the method proposed in this paper can effectively identify faults with a fault impedance as high as 50 Ω.

3.3. Impact of Inrush Current

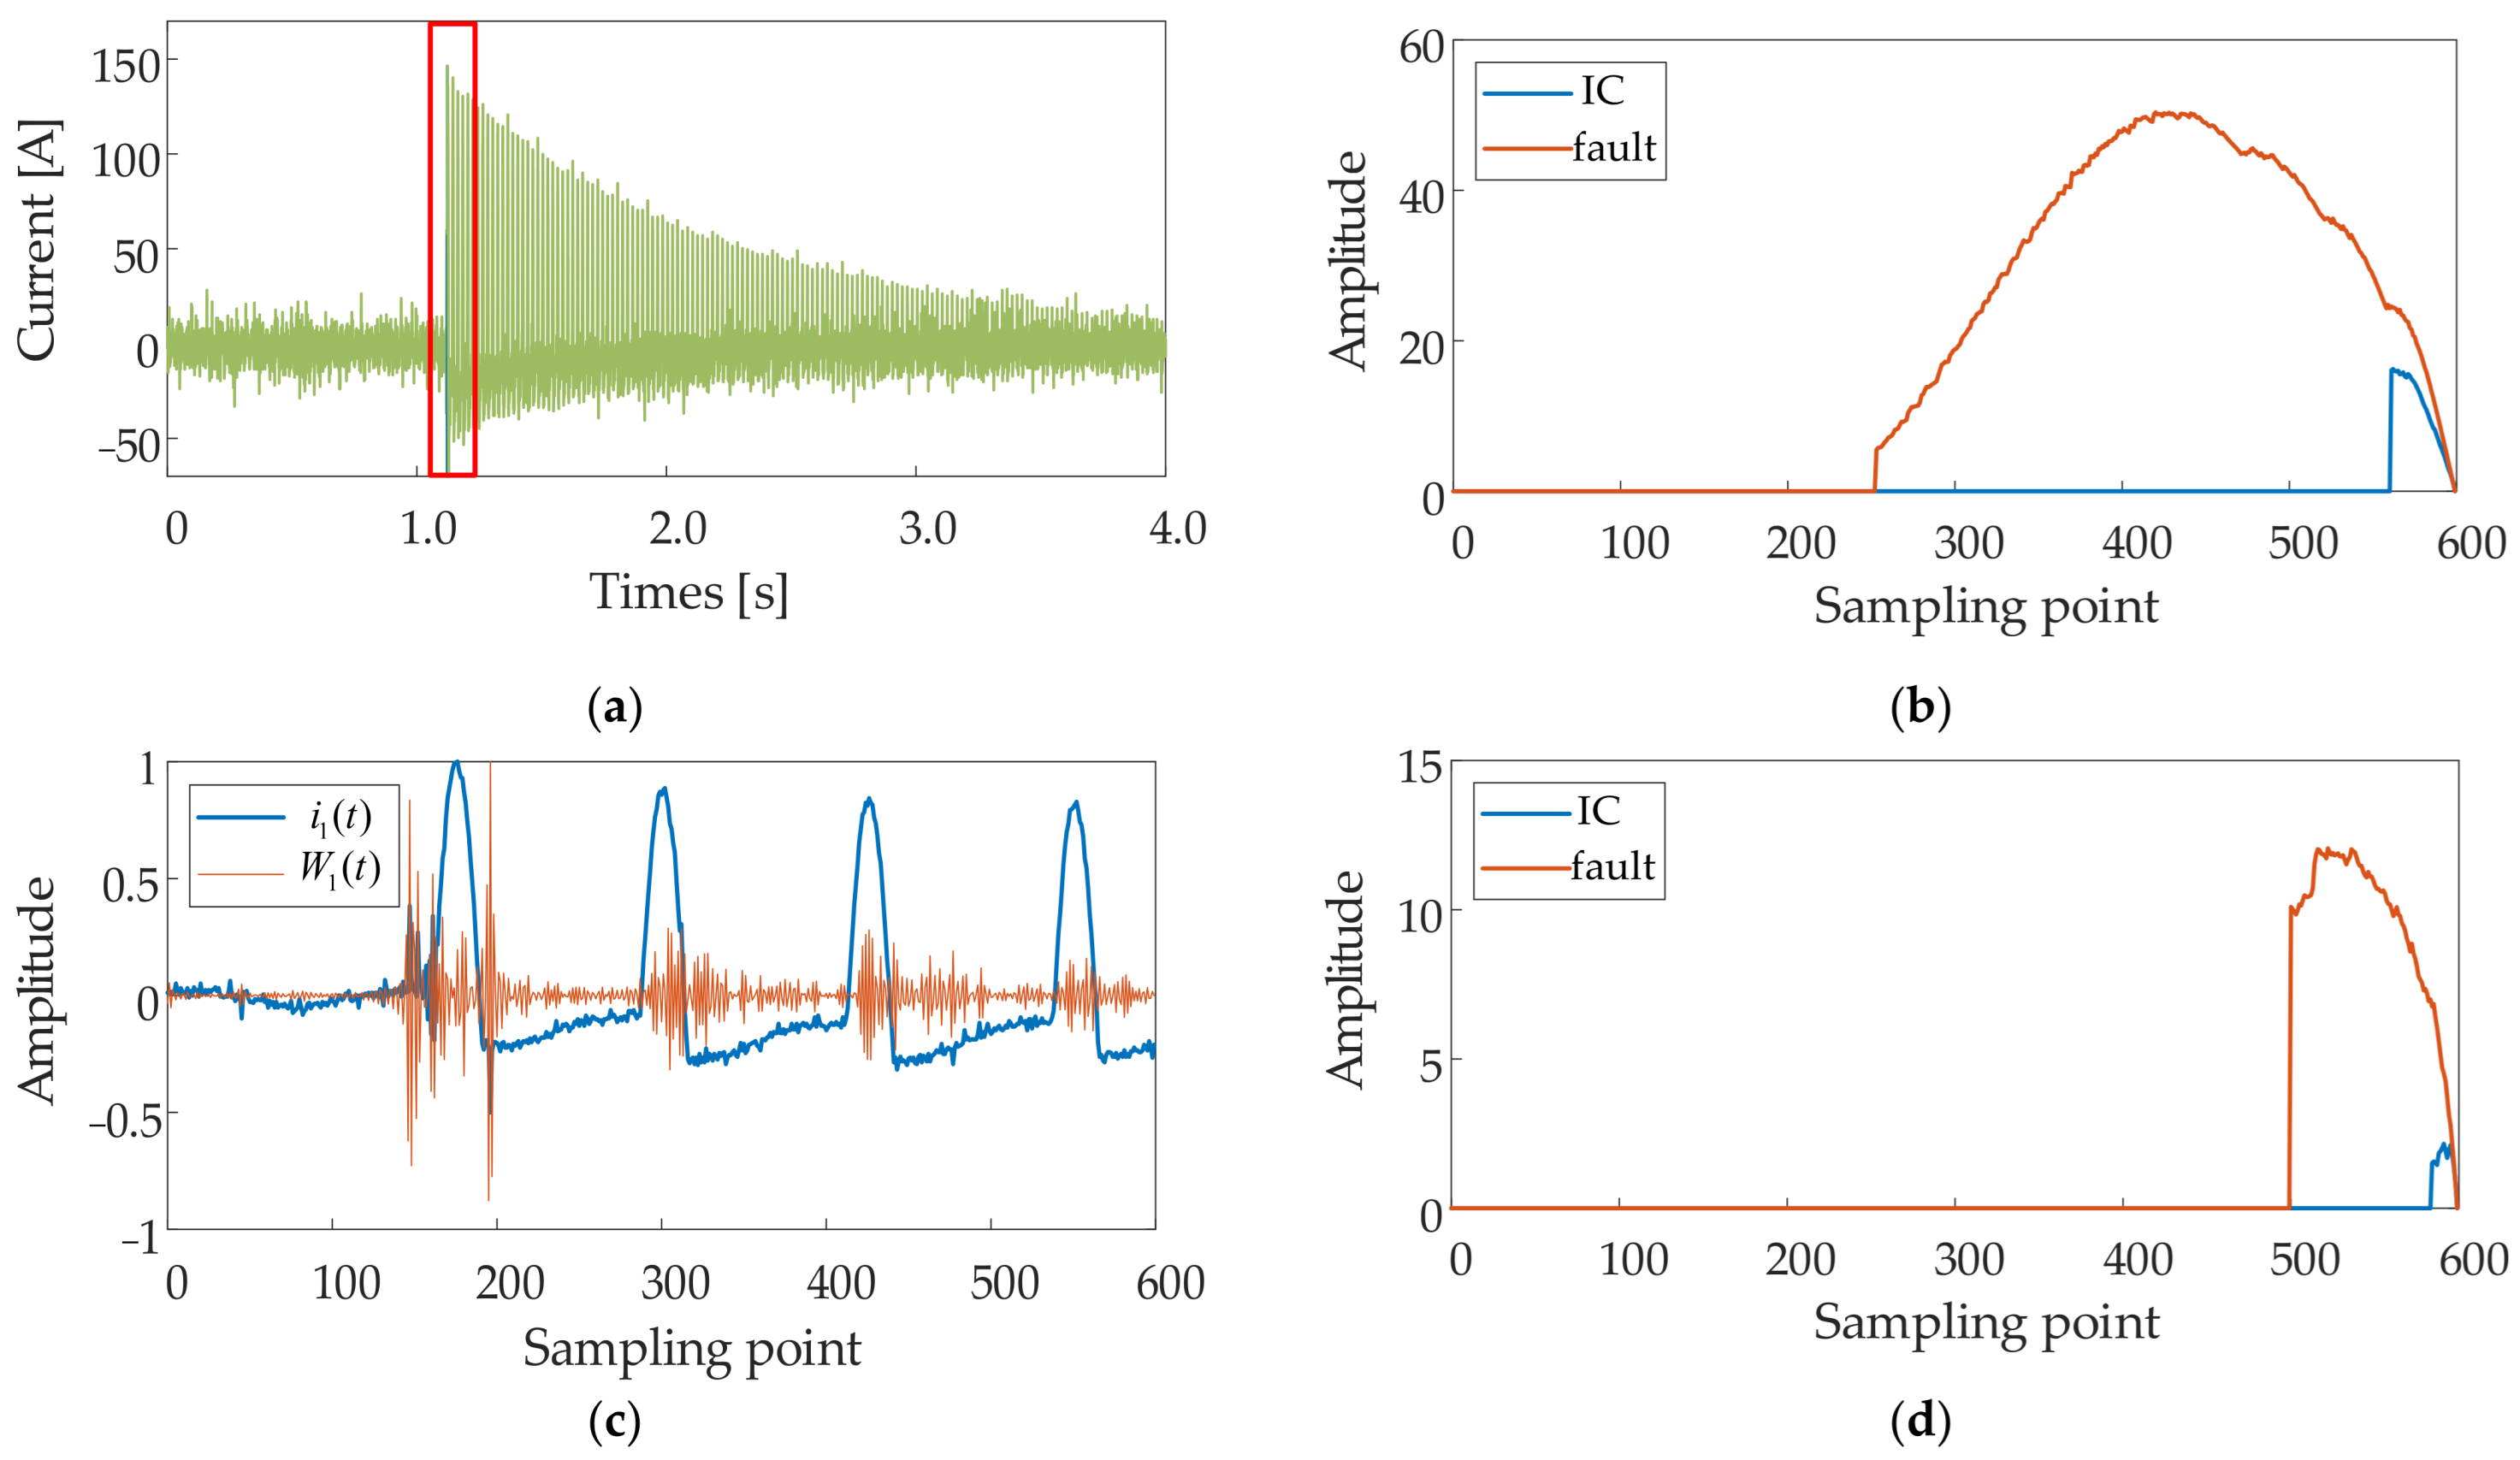
During the actual operation of EMUs, inrush current often occurs when the EMUs transformer is closed [22]. And the incremental current protection is often affected by the inrush current, leading to false activation. To address this issue, this section performs fault identification using the inrush current data obtained from field measurements.
Table 3 mainly shows the inrush current after one-sequence transformation, followed by empirical wavelet transform to decompose the signals into multiple time-frequency components. For each time–frequency component, the corresponding permutation entropy is calculated accordingly.
As shown in Figure 14a, the one-sequence incremental current corresponding to the inrush current is displayed, where the boxed part indicates the time window during which the fault occurs. Figure 14b compares the sequence A obtained from the G n 1 ( t ) of inrush current and the fault current signals. It can be clearly seen that the sequence A of the fault has a longer duration and a larger area of the envelope than that of the inrush current. Upon calculation, the R n 1 of the inrush current is 8.46, which does not reach the threshold. Figure 14c shows the comparison of the current i 1 ( t ) with the characteristic component W 1 ( t ) , and it can be clearly found that the inrush current generates a violent high-frequency perturbation at the moment of its occurrence, while the high-frequency energy is maximum in the first half-cycle of its occurrence, and the subsequent high-frequency energy continues to decay. And then, Figure 14d represents the sequence A comparison obtained from G n 2 ( t ) . After calculation, the R n 2 of the inrush current is 0.07, which does not reach the threshold.
In summary, the method proposed in this paper can effectively distinguish between actual faults and system disturbances caused by inrush currents, utilizing both 1-sequence incremental currents and high-frequency energy signals in the fault identification process.

3.4. Impact of EMUs Current

In this section, measured EMU currents are used to investigate the effect of EMUs on fault identification. As illustrated in Figure 15a, the EMUs, as a volatile and random load, are often prone to causing fault activation in protection as well as fault recognition. As shown in Figure 15b, the peak value of EMUs current is used to calculate the value of E s e t , which effectively avoids the influence of EMUs current on fault identification when E 1 ( t ) is processed into G n 1 ( t ) . Additionally, due to the property of fault variance, the proposed method successfully addresses the issue of inrush currents generated by EMUs interfering with incremental current protection. Figure 15c shows the sequence A G n 2 corresponding to the G n 2 ( t ) signal generated by EMUs. After calculation, the R n 2 of this sequence is 0.19, which remains below the predefined threshold.
It can be seen that the EMUs generate unstable high-frequency signals during EMU coasting operation. At this stage, the permutation entropy can adaptively select the fault-related components for tracking the energy changes in high-frequency signals. Furthermore, through the fault variance calculation, the wavelet energy generated by EMUs is effectively identified and regarded as a frequent disturbance.

3.5. Analysis of Experimental Results

In order to verify the feasibility of the proposed empirical wavelet energy-based fault identification method, an experimental platform of real-time control hardware-in-the-loop was built, as shown in Figure 16. Various types of current signals were recorded in real-time using an oscilloscope. Experimental tests and model building were carried out through the simulation software of the host computer. The real-time digital simulator accurately modeled both the device and its dynamic, as well as the rapid control prototype. The above experimental environment enables the acquisition of current signals that closely resemble those in the actual FTPSS following a fault, thereby providing more realistic data for the validation of fault identification methods. The resulting output sequence A under each case is shown in Figure 17.
Table 4 shows the experimental design, including various traction network fault types, fault impedance, fault location, EMU positions, and the corresponding value of the fault variance calculated by the proposed fault identification method. It can be observed that the R n 1 obtained for Cases 1–4 exceeds threshold value of 100, and R n 2 surpasses the threshold value of 1. The method is more sensitive in recognizing faults with high fault impedance. Moreover, the detection of faults using one-sequence faulty energy signals is largely independent of the EMU location, system operation modes, and fault types. The experiments were conducted with 10 kHz sampling frequency, and the data do not need to be synchronized, which enhances its practicality and ease of implementation.

4. Conclusions

To address the degradation in traditional protection performance caused by the current-limiting control strategy adopted by the converter of FTPSS during fault conditions, a fault identification method based on empirical wavelet energy for FTPSS is proposed. The method realizes fault signal identification by extracting fault-related energy components and applying mathematical statistics analysis.
Using the composite sequential network model, a unified fault detection signal, namely, one-sequence incremental current, is derived for both EMU loads and various types of faults. The signal is then energized and normalized, enabling a unified detection standard for faulty currents across different amplitudes. Using empirical wavelet transform (EWT), the signal is decomposed into distinct time–frequency components. By comparing their permutation entropy, the method adaptively selects the components most indicative of faults. The sequence reorganization of the energy signal greatly reduces the influence of the EMUs and non-dominant oscillatory components. Furthermore, the use of fault variance effectively mitigates the impact of high-frequency disturbances and inrush currents on fault identification. The proposed method is validated through both a Matlab/Simulink simulation model and a real-time control hardware-in-loop experimental platform. Experimental results confirm that the method can reliably identify FTPSS faults with fault impedance exceeding 50 Ω, under varying fault distances, fault types, fault inception angles, and different operational modes of the traction power network.

Author Contributions

Conceptualization, J.L. and S.W.; methodology, J.L.; software, J.L. and Z.S.; validation, J.L., Z.S. and D.T.; formal analysis, J.L.; investigation, N.C.; resources, S.W. and S.Y.; data curation, Z.S.; writing—original draft preparation, J.L.; writing—review and editing, D.T.; visualization, J.L.; supervision, S.W.; project administration, S.Y.; funding acquisition, S.W. All authors have read and agreed to the published version of the manuscript.

Funding

This research was funded by [CHN ENERGY Shuo Huang Railway Development Co.] grant number [SHTL-24-41] and the APC was funded by [Southwest Jiaotong University].

Conflicts of Interest

Author Shengchun Yan was employed by CHN ENERGY Shuo Huang Railway Development Co. The remaining authors declare that the research was conducted in the absence of any commercial or financial relationships that could be construed as a potential conflict of interest.

References

  1. Battistelli, L.; Pagano, M.; Proto, D. 25-kV 50 Hz high-speed traction power system: Short-circuit modeling. IEEE Trans. Power Deliv. 2011, 26, 1459–1466. [Google Scholar] [CrossRef]
  2. Liu, Y.; Chen, M.; Cheng, Z.; Chen, Y.; Li, Q. Robust energy management of high-speed railway co-phase traction substation with uncertain PV generation and traction load. IEEE Trans. Intell. Transp. Syst. 2021, 23, 5079–5091. [Google Scholar] [CrossRef]
  3. Wang, S.; Chen, M.; Kou, Z.; Sun, Z.; Zhao, N.; Li, Q. Fault Location of AT Traction Network Adopting Bilateral Power Supply Mode Based on Generalized Symmetrical Components Method. IEEE Trans. Transp. Electrif. 2023, 10, 5103–5118. [Google Scholar] [CrossRef]
  4. Luo, A.; Wu, C.; Shen, J.; Shuai, Z.; Ma, F. Railway static power conditioners for high-speed train traction power supply systems using three-phase V/V transformers. IEEE Trans. Power Electron. 2011, 26, 2844–2856. [Google Scholar] [CrossRef]
  5. He, X.; Shu, Z.; Peng, X.; Zhou, Q.; Zhou, Y.; Zhou, Q.; Gao, S. Advanced cophase traction power supply system based on three-phase to single-phase converter. IEEE Trans. Power Electron. 2013, 29, 5323–5333. [Google Scholar] [CrossRef]
  6. Li, Z.; Li, X.; Wei, Y.; Lu, C.; Lin, Y.; Li, Z. Ground fault analysis and grounding method of static power converters in flexible AC traction power supply systems. IEEE Trans. Power Electron. 2021, 37, 5535–5546. [Google Scholar] [CrossRef]
  7. Shen, R.; Han, Z.; Liu, S.; Gao, S. An Adaptive Reclosing Scheme for All-Parallel Autotransformer Traction Network of High-Speed Railway Based on Multisource Information. IEEE Trans. Transp. Electrif. 2023, 10, 407–420. [Google Scholar] [CrossRef]
  8. Saini, D.K.; Nair, R.; Yadav, M.; Prasad, R. Modified algorithm for fault detection on AC electrical traction line: An Indian climate case study. IEEE Trans. Transp. Electrif. 2018, 4, 936–950. [Google Scholar] [CrossRef]
  9. Wu, S.; Wu, M.; Li, L.; Wang, S.; Song, K.; Wang, Y. Analysis and Comparison of MMC-Based Co-Phase Traction Power Supply Topology for Auto-Transformer Power Supply System. IEEE Trans. Power Deliv. 2022, 37, 4053–4063. [Google Scholar] [CrossRef]
  10. Xu, Z.Y.; Xu, G.; Ran, L.; Yu, S.; Yang, Q. A new fault-impedance algorithm for distance relaying on a transmission line. IEEE Trans. Power Deliv. 2010, 25, 1384–1392. [Google Scholar] [CrossRef]
  11. Han, Z.; Li, S.; Liu, s.; Liu, J.; Gao, S. A Reactance-Based Fault Location Method for Overhead Lines of AC Electrified Railway. IEEE Trans. Power Deliv. 2020, 35, 2558–2560. [Google Scholar] [CrossRef]
  12. Han, Z.; Liu, S.; Gao, S.; Bo, Z. Protection scheme for China high-speed railway. In Proceedings of the 10th IET International Conference on Developments in Power System Protection (DPSP 2010). Managing the Change, Manchester, UK, 29 March–1 April 2010; pp. 1–5. [Google Scholar]
  13. Liu, S.; Han, Z.; Gao, S. Inter-tripping protection scheme for feeding sections of high-speed railway based on current features. Proc CSEE 2014, 34, 4437–4442. [Google Scholar]
  14. Wang, D.; He, X.; Gao, S. Protection Scheme Based on Current Limiting Control of Flexible Traction Power Supply System. In Proceedings of the 2024 IEEE 19th Conference on Industrial Electronics and Applications (ICIEA), Kristiansand, Norway, 5–8 August 2024; pp. 1–6. [Google Scholar]
  15. Wang, S.; Chen, M.; Li, Q.; Huang, W.; Wu, B. A new hybrid fault identification method based on multiterminals synchronous measure information for all parallel at traction power supply system. Energies 2018, 11, 2698. [Google Scholar] [CrossRef]
  16. Lin, G.; Hong, B.; Wu, Z.; Fu, X. Power supply arm protection scheme of high-speed railway based on wide-area current differential. Railw. Eng. Sci. 2023, 31, 281–292. [Google Scholar] [CrossRef]
  17. Li, B.; Chen, D.; He, J.; Wang, C.; Song, J.; Lyu, H. Fault analysis and protection in flexible DC traction power supply system. IEEE Trans. Transp. Electrif. 2023, 10, 5599–5613. [Google Scholar] [CrossRef]
  18. Naidu, O.; Pradhan, A.K. A traveling wave-based fault location method using unsynchronized current measurements. IEEE Trans. Power Deliv. 2018, 34, 505–513. [Google Scholar] [CrossRef]
  19. Wang, X.; Wei, X.; Gao, J.; Song, G.; Kheshti, M.; Guo, L. High-impedance fault detection method based on stochastic resonance for a distribution network with strong background noise. IEEE Trans. Power Deliv. 2021, 37, 1004–1016. [Google Scholar] [CrossRef]
  20. AsghariGovar, S.; Pourghasem, P.; Seyedi, H. High impedance fault protection scheme for smart grids based on WPT and ELM considering evolving and cross-country faults. Int. J. Electr. Power Energy Syst. 2019, 107, 412–421. [Google Scholar] [CrossRef]
  21. Song, X.; Gao, F.; Chen, Z.; Liu, W. A negative selection algorithm-based identification framework for distribution network faults with high resistance. IEEE Access 2019, 7, 109363–109374. [Google Scholar] [CrossRef]
  22. Fulin, Z.; Feifan, L.; Ruixuan, Y. Identification of abnormal phenomenon of vehicle-network coupling in electrified railway. Proc. CSEE 2021, 41, 7937–7950. [Google Scholar]
  23. Lin, G.; Fu, X.; Quan, W.; Hong, B. Improved fault location method for AT traction power network based on EMU load test. Railw. Eng. Sci. 2022, 30, 532–540. [Google Scholar] [CrossRef]
  24. Fan, B.; Liu, T.; Zhao, F.; Wu, H.; Wang, X. A review of current-limiting control of grid-forming inverters under symmetrical disturbances. IEEE Open J. Power Electron. 2022, 3, 955–969. [Google Scholar] [CrossRef]
  25. He, X.; Peng, J.; Han, P.; Liu, Z.; Gao, S.; Wang, P. A novel advanced traction power supply system based on modular multilevel converter. IEEE Access 2019, 7, 165018–165028. [Google Scholar] [CrossRef]
  26. Lin, G.-S.; Li, Q.-Z. Impedance calculations for AT power traction networks with parallel connections. In Proceedings of the 2010 Asia-Pacific Power and Energy Engineering Conference, Chengdu, China, 28–31 March 2010; pp. 1–5. [Google Scholar]
  27. Wang, S.; Li, Q.; Han, J.; Chen, M.; Sun, Z. Ground fault identification and location of autotransformer traction network for high-speed railway based on multi-terminals synchronous measure information. IET Gener. Transm. Distrib. 2023, 17, 5458–5472. [Google Scholar] [CrossRef]
  28. Gao, J.; Wang, X.; Wang, X.; Liu, J.; Yang, A.; Yuan, H.; Wei, X. A High-Impedance Fault Detection Method for Distribution Systems Based on Empirical Wavelet Transform and Differential Faulty Energy. IEEE Trans. Smart Grid 2021, 13, 900–912. [Google Scholar] [CrossRef]
  29. Li, L.; Zhang, Z.; Cai, W.; Zhuang, Q.; Bi, G.; Deng, J.; Chen, S.; Kan, X. Research on the longitudinal protection of a through-type cophase traction direct power supply system based on the empirical wavelet transform. Glob. Energy Interconnect. 2024, 7, 206–216. [Google Scholar] [CrossRef]
  30. Sun, S.; Liu, J.; Wang, J.; Chen, F.; Wei, S.; Gao, H. Remaining useful life prediction for AC contactor based on MMPE and LSTM with dual attention mechanism. IEEE Trans. Instrum. Meas. 2022, 71, 1–13. [Google Scholar] [CrossRef]
  31. Huo, Z.; Zhang, Y.; Shu, L.; Gallimore, M. A new bearing fault diagnosis method based on fine-to-coarse multiscale permutation entropy, laplacian score and SVM. IEEE Access 2019, 7, 17050–17066. [Google Scholar] [CrossRef]
  32. Shen, R.; Han, Z.; Liu, S.; Gao, S. A Novel Distance Protection Method for Out-of-Phase Faults of AC Traction Power Supply System. IEEE Trans. Power Deliv. 2023, 38, 3729–3732. [Google Scholar] [CrossRef]
Figure 1. Neutral section of the traditional TPSS.
Wevj 16 00495 g001
Figure 2. Structure diagram of the flexible TPSS.
Wevj 16 00495 g002
Figure 3. Conductor configuration and fault types of FTPSS.
Wevj 16 00495 g003
Figure 4. Topology of 2 × 25 kV FTPSS.
Wevj 16 00495 g004
Figure 5. A composite sequence network model. (a) T-R fault, (b) T-F fault.
Wevj 16 00495 g005
Figure 6. Flowchart of fault identification in FTPSS.
Wevj 16 00495 g006
Figure 7. Flowchart of working procedure.
Wevj 16 00495 g007
Figure 8. Real-time control hardware-in-loop experimental setting.
Wevj 16 00495 g008
Figure 9. The value of R n 1 vary with distance.
Wevj 16 00495 g009
Figure 10. (a) E 1 ( t ) in different fault types; (b) A in different fault types.
Wevj 16 00495 g010
Figure 11. (a) Curve of i 1 ( t ) and W 4 ( t ) in T-R fault; (b) Curve of i 1 ( t ) and W 3 ( t ) in T-R fault; (c) Curve i 1 ( t ) of and W 6 ( t ) in F-R fault.
Wevj 16 00495 g011
Figure 12. (a) R n 1 in metallic faults; (b) R n 1 in non-metallic fault.
Wevj 16 00495 g012
Figure 13. (a) Fault impedance at different fault distances; (b) protection area of distance protection under FTPSS.
Wevj 16 00495 g013
Figure 14. (a) i 1 ( t ) in inrush current; (b) A for G n 1 ( t ) in inrush current and fault; (c) W 1 ( t ) and i 1 ( t ) in inrush current; (d) A for G n 2 ( t ) in inrush current and fault.
Wevj 16 00495 g014
Figure 15. (a) EMUs current; (b) E 1 ( t ) curve; (c) A for G n 2 ( t ) .
Wevj 16 00495 g015
Figure 16. One-sequence current signal of TSs. (a) Case 1, (b) Case 2, (c) Case 3, (d) Case 4.
Wevj 16 00495 g016
Figure 17. A for G n 1 ( t ) and G n 2 ( t ) . (a) Case 1; (b) Case 2; (c) Case 3; (d) Case 4.
Wevj 16 00495 g017
Table 1. Self-impedances and mutual impedance.
ParametersConductorSymbolValue [Ω/km]
ImpedancesTZt0.115 + j0.384
FZf0.150 + j0.420
RZr0.165 + j0.481
Between T and RZtr0.048 + j0.164
Between T and FZtf0.048 + j0.178
Between F and RZfr0.048 + j0.150
Capacitances Value [F/km]
Upline TCt116.420 × 10−9
Upline FCf110.350 × 10−9
Downline TCt216.420 × 10−9
Downline FCf216.350 × 10−9
Table 2. Permutation entropy for W n ( t ) in different fault types.
Fault TypeFault Impedance 50 Ω
[W1, W2, W3, W4, W5, W6, W7, W8, W9, W10]
T-R[0.95, 0.94, 0.94, 0.98, 0.95, 0.93, 0.89, 0.89, 0.91, 0.87]
F-R[0.95, 0.94, 0.94, 0.98, 0.95, 0.91, 0.89, 0.88, 0.90, 0.87]
T-F[0.95, 0.94, 0.98, 0.96, 0.93, 0.92, 0.95, 0.92, 0.91, 0.87]
Note: The maximum permutation entropy, highlighted in red, indicates the component that contains the most significant fault-related features, and is thus identified as the fault characteristic component.
Table 3. Permutation entropy for W n ( t ) in inrush current.
Fault Type[W1, W2, W3, W4, W5, W6, W7, W8, W9, W10]
Inrush Current[0.98, 0.97, 0.95, 0.96, 0.97, 0.96, 0.90, 0.92, 0.93, 0.89]
Note: W 1 ( t ) , exhibiting the maximum permutation entropy, which is highlighted red, is selected as the fault component for fault identification.
Table 4. Experimental scenario and results.
CasesFault TypeFault
Impedance
Fault
Position
EMUs PositionRn1Rn2Identify
Correctly?
1T-R0.75 ΩUp line 6.2 km\589.54.33
2F-R0.75 ΩUp line 15.1 kmDown line 29.1 km606.72.46
3F-R35 ΩDown line 21.6 km\1563.34.59
4T-F35 ΩDown line 39.4 kmDown line 26.2 km537.59.71
Disclaimer/Publisher’s Note: The statements, opinions and data contained in all publications are solely those of the individual author(s) and contributor(s) and not of MDPI and/or the editor(s). MDPI and/or the editor(s) disclaim responsibility for any injury to people or property resulting from any ideas, methods, instructions or products referred to in the content.