Article

Design of an Optimal Enhanced Quadratic Controller for a Four-Wheel Independent Driven Electric Vehicle (4WID-EV) Under Failure Cases

by
Sasikala Durairaj
and
Mohamed Rabik Mohamed Ismail
*
Department of Mechatronics Engineering, Faculty of Engineering and Technology, SRM Institute of Science and Technology, Kattankulathur Campus, Chennai 603203, India
*
Author to whom correspondence should be addressed.
World Electr. Veh. J. 2025, 16(8), 470; https://doi.org/10.3390/wevj16080470
Submission received: 6 July 2025 / Revised: 31 July 2025 / Accepted: 11 August 2025 / Published: 18 August 2025

Abstract

Owing to the recent attention towards the growing issue of global warming, the automotive industry is shifting towards more capable and eco-friendly vehicles with longer ranges than conventional vehicles. Although the transition to eco-friendly vehicles faces several challenges, including component failures due to mechanical wear, electrical voltage fluctuations, motor damage from overloads, infrastructure, and external environmental disturbances. The four-wheel independent drive electric vehicle (4WID-EV) is often used as an alternative to the single-drive electric vehicle, providing improved traction control and reducing the increased load on the individual motors. This study proposes an optimally enhanced controller to control the linear and nonlinear trajectories of four independent motors to evaluate the electric vehicle’s speed and address challenges involved in torque distribution to the independent drive, especially under various motor failure conditions. The computed results reveal that the proposed optimal linear quadratic regulator (LQR) controller accurately predicts better than the conventional proportional integral derivative (PID) controller in terms of the vehicle’s speed under various motor failures. Specifically, the optimal LQR controller achieves a faster settling time of 2.5 s, a lower overshoot of 0.8%, a mean error of 0.0441 rad/s, and a mean squared error (MSE) of 0.0820 (rad/s2). These results indicate that the proposed controller enhances stability and accuracy, improving adaptability even under motor failure conditions in 4WID-EVs.

1. Introduction

The design and control of vehicles have gradually changed due to the electrification of mobility. Figure 1 depicts the transportation sector, initially propelled by internal combustion engine vehicles (ICEVs) but gradually gravitating toward electric vehicles (EVs). A 4WID-EV makes individual torque control at each wheel possible, which probably improves stability, traction, and energy efficiency [1,2]. These vehicles are especially susceptible to actuator and sensor failures due to their complex structure [3]. To guarantee fault tolerance, energy efficiency, and real-time responsiveness in 4WID-EVs, strong control mechanisms are necessary [4]. Recent advancements have explored drive train technologies and vehicle electrification from multiple perspectives [1,5], yet the challenge of ensuring consistent performance under fault conditions persists. Wahid et al. [1] suggested that the drivetrain components for electric vehicles would enhance the complexity of the control introduced by in-wheel motors.
Similarly, Hossain et al. [2] described how improved electric vehicle control systems are necessary to achieve sustainable goals. According to Lulhe and Date [3], 4WID-EVs are becoming increasingly dependent on permanent magnet synchronous motors (PMSMs) and brushless direct current (BLDC) motors, which means fault-resilient control algorithms are required. For example, Baidya et al. [6] introduced a novel PID-based controller integrated with sensory feedback for direct current (DC) motor control, reporting a rise time of 0.82 s and overshoot < 5% to reduce the steady state error and control effort, quadratic controllers, including linear quadratic regulator (LQR), have shown promise [6]. However, actuator failures negatively impact traditional LQR. Studies have suggested additions including sliding mode control (SMC) [7], adaptive neuro-fuzzy inference systems (ANFIS) [8], and model predictive control (MPC) [9,10,11] to solve this.
Fault tolerance is a significant research area for in-wheel motor systems. Peng et al. [12] implemented torque vectoring and fault detection algorithms for in-wheel motors and achieved a 12% improvement in slip mitigation. Xu et al. [13] used chaotic random grey-wolf-optimization-based proportional integral derivative (CR-GWO-PID) tuning with in-wheel motors to ensure a settling time of 0.63 s under slip conditions. Guo et al. [14] discussed failure compensation under drive actuator faults and proposed control laws that maintained yaw rate error under ±2%. The control methodologies in 4WID-EVs are often compared for robustness, computation time, and fault-tolerance. Lu et al. [15] developed a stochastic MPC that handles actuator faults and model uncertainties; simulations showed stable tracking despite a 15% actuator efficiency loss. Shen et al. [16] combined Lyapunov theory with adaptive tuning to control drive economy and reported torque deviation < 1.5 Nm during fault injection.
Vehicle stability control is vital under an actuator or steering system failure. Using feedback loops, Han et al. [17] created a steering-failure-tolerant strategy that reduced lateral error by 20% when compared to the baseline. Model reference adaptive control (MRAC), as suggested by Zhou et al. [18], ensures stability within 0.5 s following a motor failure. Fewer works discuss complete fault-tolerant design in lateral, yaw, and roll dynamics for 4WID-EVs, even though many concentrate on longitudinal control and energy optimization [19,20,21]. Although they provide more flexible options, adaptive techniques like ANFIS [8] and MPC [10,22] may entail more computational load and tuning complexity. Notably, the work by Li et al. [23] applied robust H tracking for steer-by-wire (SBW) and maintained less than 3% overshoot in transient response. Integration of advanced observers and estimation techniques also plays a role. Lu et al. [24] developed an integral fast terminal sliding mode observer to estimate system states under noise and faults, achieving < 2% steady-state error. The design of enhanced LQR controllers has not been sufficiently explored, particularly under concurrent fault conditions (e.g., motor and sensor faults together). A recent trend involves integrating LQR with other methods (e.g., MPC or SMC). Chen et al. [25] proposed a nonlinear hierarchical controller that used LQR at its core and reached 95% tracking accuracy under tire burst simulation. In contrast, Wang et al. [26] analyzed the thermal effects of insulated gate bipolar transistor (IGBT) in MPC and suggested a multi-layer structure to protect switching devices under high load.
From the energy and grid perspective, integration of energy management strategies using adaptive artificial intelligence or particle swarm optimization (PSO)-tuned PID has been very effective [27,28,29,30,31]. However, most such methods have yet to be validated in fault-tolerant lateral or yaw stability scenarios in 4WID configurations. For instance, Naqvi et al. [29] used PSO to optimize proportional-integral (PI) parameters for a BLDC drive but only addressed energy saving, not motor fault compensation. Despite efforts in eco-cruising and coordinated path/yaw tracking [32,33], gaps remain in designing a unified controller capable of managing actuator, sensor, and communication faults in real time [34]. Several approaches were considered for the specific parameters to manage to balance the dynamics for normal motors rather than faulty motors [35,36]. A properly tuned, enhanced LQR can offer this by optimizing performance metrics such as settling time, rise time, overshoot, and torque deviation even in degraded modes.
To summarize the shortcomings of the existing studies, although various specific control algorithms (e.g., MPC and CR-GWO-PID) have been proposed, there is a lack of comprehensive frameworks that integrate multiple control strategies for enhanced performance. The existing models fail to consider the external factors that influence vehicle performance. Strengthening these models by incorporating dynamic environmental and weather conditions is crucial. However, the developed approaches for fault estimation fail to ensure the robustness of the control system considering the uncertainties, which suggests using an adaptive controller to respond to abrupt changes in external disturbances. Another key challenge is torque vectoring, which requires an optimized strategy to enhance stability and performance, and its influence on efficiency and energy consumption. Nevertheless, the existing mathematical models require extensive validation for diversified driving conditions. Therefore, an efficient control system is needed to address EV challenges effectively.
This study develops a design for an optimal LQR controller to address the electric vehicle’s nonlinear dynamics, demonstrating comparatively better performance over conventional PID controllers. Key innovations include precise speed regulation under varying trajectories and measurable improvements in key performance indicators, such as the rise time, settling time, overshoot, and mean error. This study also emphasizes the optimal LQR controller’s capability in energy management and implementing a control system that provides a robust and reliable control strategy for the improved performance of electric vehicles. The main highlights of this study are summarized as follows:
  • The optimal LQR controller was developed as an advanced control strategy to optimize the system’s performance. The controller employs state-space models to represent the system dynamics and calculates the optimal control inputs to achieve the desired output.
  • PID and optimal LQR controllers are implemented to control the velocity of the 4WID-EV. PID controllers offer a simple design approach with proven effectiveness, whereas optimal LQR controllers provide significant control performance but require a more complex design.
  • A comparative analysis indicated that the rise time, settling time, and overshoot, particularly under fault scenarios predicted by the optimal LQR controller, are better than those of the PID controller.

2. Methods

The configuration for controlling a 4WID-EV integrates a comprehensive system that combines vehicle dynamics modeling, motor control, and a PID controller to establish a baseline for comparison with the proposed optimal LQR controller. The control system simulates the behavior of a vehicle by accounting for resistive forces, including the tire rolling resistance, aerodynamic drag, and grading resistance. Each wheel is powered by a separate DC motor, with a PID controller that regulates motor speeds based on feedback from current sensors to maintain the desired velocity. A Simulink model is implemented for the proposed control methodology, considering the vehicle mass and motor specifications, allowing performance evaluation against the proposed optimal LQR controller under various driving conditions. The simulated optimal LQR and PID controller’s performance responses were compared to ensure the control system.

2.1. Modeling of 4WID-EV

Numerical modeling of an EV is an efficient approach for designing and analyzing a control system for real-world conditions. It enables predictive analysis, optimization, and development of fault-tolerant control strategies for electric vehicles. This work develops a longitudinal dynamic model of a 4WID-EV based on Newtonian mechanics. The model considers the tractive effort from in-wheel motors and opposing resistive forces, including rolling resistance, aerodynamic drag, and grade resistance.

2.1.1. Controlling Parameters and Assumptions

The key controlling parameters considered for the analysis include vehicle mass (mv), radius (r), rolling resistance coefficient (Cr), aerodynamic drag coefficient (Cd), frontal area (Af), drivetrain efficiency (ηd), road angle (α), and air density (ρ). Uniform motor torque distribution, negligible suspension dynamics, and constant drivetrain efficiency were assumed in this study.

2.1.2. Governing Equation

The force calculations were performed based on Newton’s second law, and the vehicle speed was determined from the motor torque while accounting for various resistive forces. These resistive forces oppose the vehicle’s forward motion and include the rolling resistance, which acts to resist tire rotation against the road surface and is given by:
F r = m v g C R cos α = 150.09   N
where m v is the mass of the vehicle, C R is the rolling resistance coefficient, g is gravitational acceleration, and α is the road/grade angle.
Aerodynamic drag is a resistive force created when a moving vehicle pushes air out of the atmosphere, which does not necessarily occur quickly. This force can be expressed as:
F α = 0.5 ρ A f C D V v + V w 2 = 566.25   N
where F α is the aerodynamic drag force, ρ is the air density, A f is the vehicle’s frontal area, C D is the aerodynamic drag coefficient, V v is vehicle speed, and V w is the wind speed in the travel direction of the vehicle.
The grading resistance refers to the force experienced by a vehicle on a sloped road owing to its mass/weight. However, based on the assumptions in this study, it is implied that the 4WID-EV is moving horizontally, implying a slope angle of 0°. Consequently, the grading force is considered to be zero and is expressed as:
F g = m v g sin α = 0

2.2. Modeling of Motor Using PID Controller

The closed-loop control of the motor begins with a motor model equation, both electrically and mechanically, as discussed in [22,24]. The armature-controlled motor was modeled based on an electrical equation:
L a r d i a r d t = V a r K b a r ω a r R a r i a r
R a r signifies the armature resistance, and L a r denotes the armature inductance. Similarly, the mechanical relationship of the DC motor is expressed as:
J a r ω ˙ a r = b a r ω a r + K t a r i a r
where J a r indicates the moment of inertia, b a r representing viscous damping, V a r is the armature voltage, and K b a r ω b a r is the back electromotive force voltage. The coefficients K b a r and K t a r offer a conversion coefficient between the mechanical and electrical components. The transfer function of the motor can then be described as follows using the Laplace transform:
ω a r s V a r = K t a r J a r S + b a r L a r S + R a r + K t a r K b a r
Conventional PID controllers was extensively used in industrial operations owing to their simplicity and effective controllability. The 4WID-EV is employed for torque distribution, where the input is the difference between the planned and calculated vehicle velocities. The average torque from each motor wheel is summed to determine the vehicle’s angular velocity. The closed-loop transfer function of the system was obtained using a PID controller with constant values for the optimal time-domain specifications.
G c l o s e d l o o p = ω ( s ) V s = K t 1 K d s 2 + K t 1 K p s + K t 1 K i s 3 L 1 J 1 + J 1 + b 1 L 1 + K t 1 K d s 2 + b 1 R 1 + K t K p s + ( K t 1 K i + K t 1 K b 1 )
Similarly, the gain terms varied with motor failure conditions. Although PID controllers offer several advantages, tuning methods neglect the process constraints.

2.3. Proposed Methodology for the Optimal Linear Quadratic Regulator

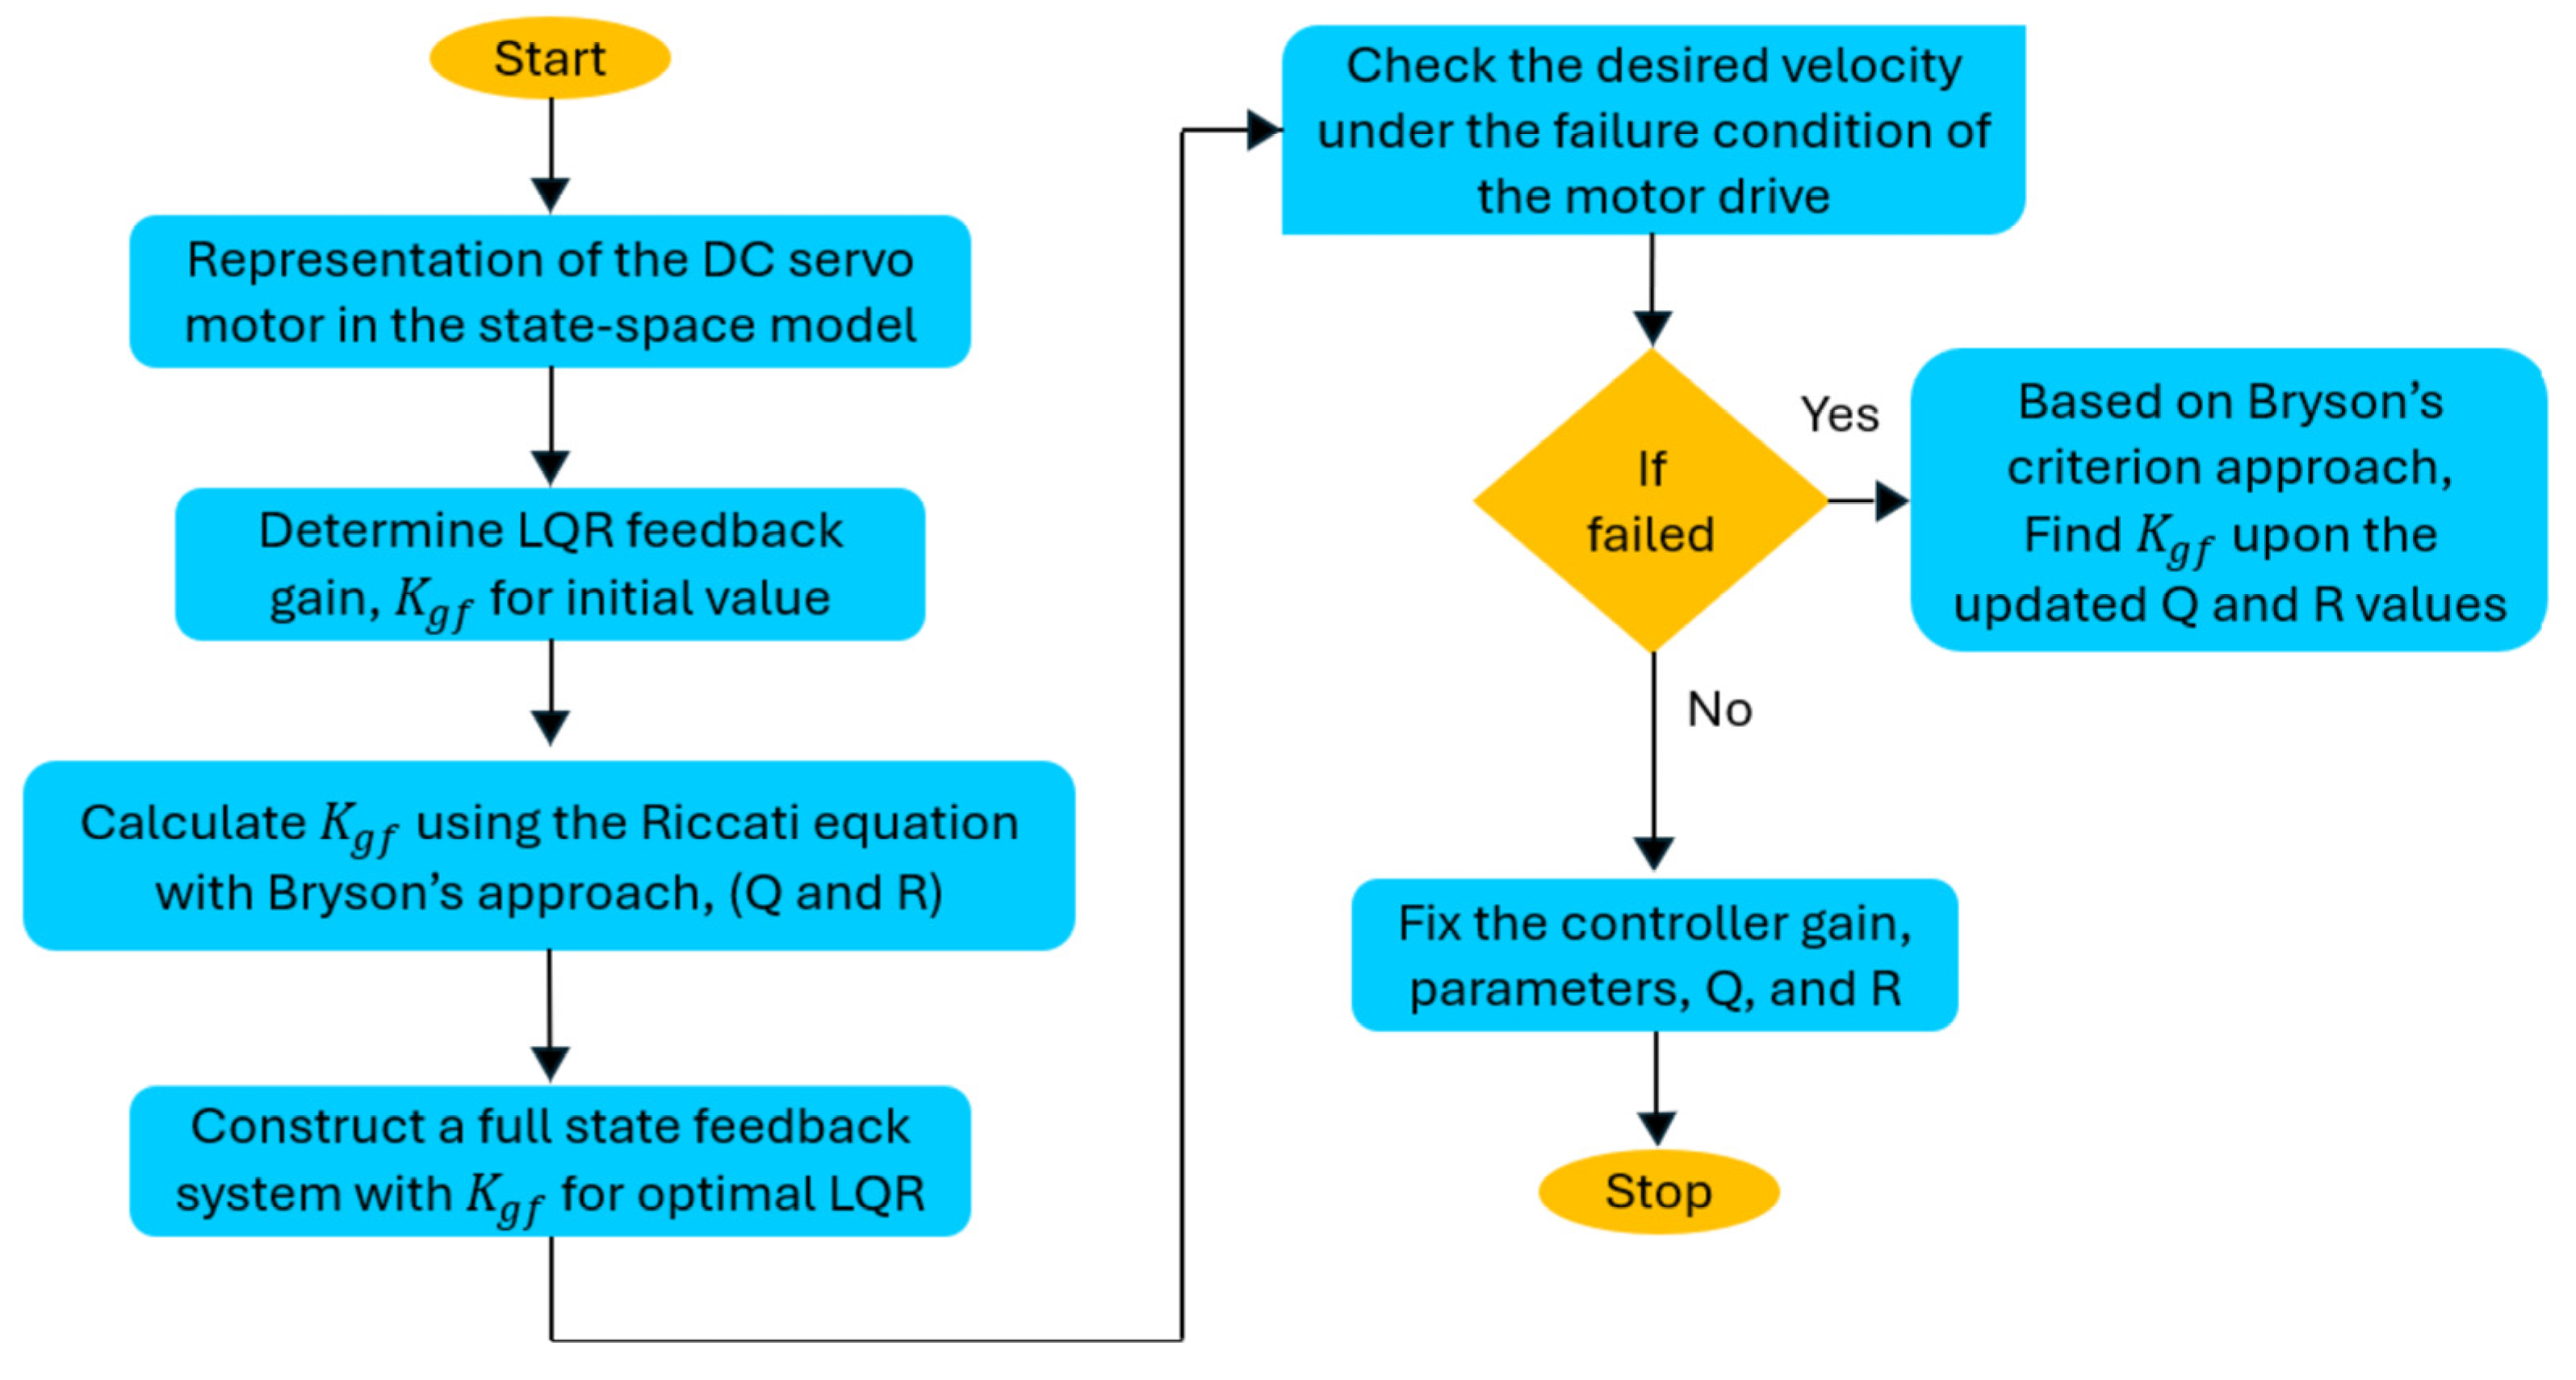
The proposed methodology for the EV’s control system follows a process design flow that uses an optimal LQR controller to regulate the vehicle’s velocity by modulating the torque created by the DC motor, which is applied to the vehicle’s mass. The structure of the proposed optimal LQR for controlling a single motor drive system is shown in Figure 2, and the model of the closed-loop system and its design are explained in Figure 3.
The motor is modeled using a state-space approach with an optimal LQR controller, and the corresponding motor model equations are as follows:
X t = A x t + B u t
y t = C x t
X t = x 1 x 2 ; A = b a r J a r k t a r J a r k b a r L a r R a r L a r ; B = 0 1 L a r ; C = 1 0 ; Y = 1 0 x 1 x 2
The feedback gain K g f is calculated based on the initial conditions. Subsequently, the ‘Q’ and ‘R’ values are adjusted using the Riccati equation, factoring in the current system state and the desired feedback gain.
The vehicle’s velocity is influenced by variations in the torque during motor failures or external disturbances. The optimal LQR plays a critical role in the vehicle achieving the desired velocity in the event of multiple motor failures; utilizing an optimal LQR, the desired performance can be attained by optimizing the performance index (J). The performance index (J) of the linear quadratic regulator controller is described as follows:
J = ( x T t Q x t + u T R u t d t
Equation (10) represents the quadratic performance index and a weighted integral, where x(t) denotes the state vector, u(t) denotes the input control vector, Q denotes the state weighting matrix, and R denotes the control weighting matrix. To initiate the optimization process for the optimal LQR controller, the values of the Q and R components were determined using the approach of Bryson’s rule. The reference speed inputs for the system in this research were carried out for 20 m/s and 40 m/s, and the measured steady-state vehicle velocity fell within a comparable range. Therefore, the elements of Q and R determine the relative weighted inverse squares of the maximum permitted values of the respective individual state variables and control inputs, ensuring that matrices of Q were set to 250*eye(2), corresponding to a maximum allowable velocity deviation of approximately 0.0632 m/s, while R is a symmetric, positive semi-definite matrix, which was selected as 10, corresponding to a maximum control input magnitude of 0.3162 units to ensure that the vehicle velocity was maintained under various motor failure conditions. The constraints imposed by matrix Q and R help minimize the performance index. The optimal linear quadratic regulator then identifies the optimal control input law u:
u = K g f x
where K g f denotes the optimal state feedback gain matrix
K g f = R 1 B T P
where K g f solving the algebraic Riccati equation (ARE) yields the feedback gain matrix. P defines a symmetric and positive definite matrix that is obtained by the solution of the ARE and is described as:
A T P + P A P B R 1 B T P + Q = 0
When operating beyond normal conditions, the vehicle’s velocity can decrease unpredictably. Thus, this design approach is classified as a controller rather than a regulator. Consequently, the desired input state is adjusted by multiplying it with the regulator constant, K r g , which is defined as follows:
K r g = C × A B × K g f 1 × B 1

2.4. Implementation of the Proposed Methodology

2.4.1. Proposed System-Level Architecture Model

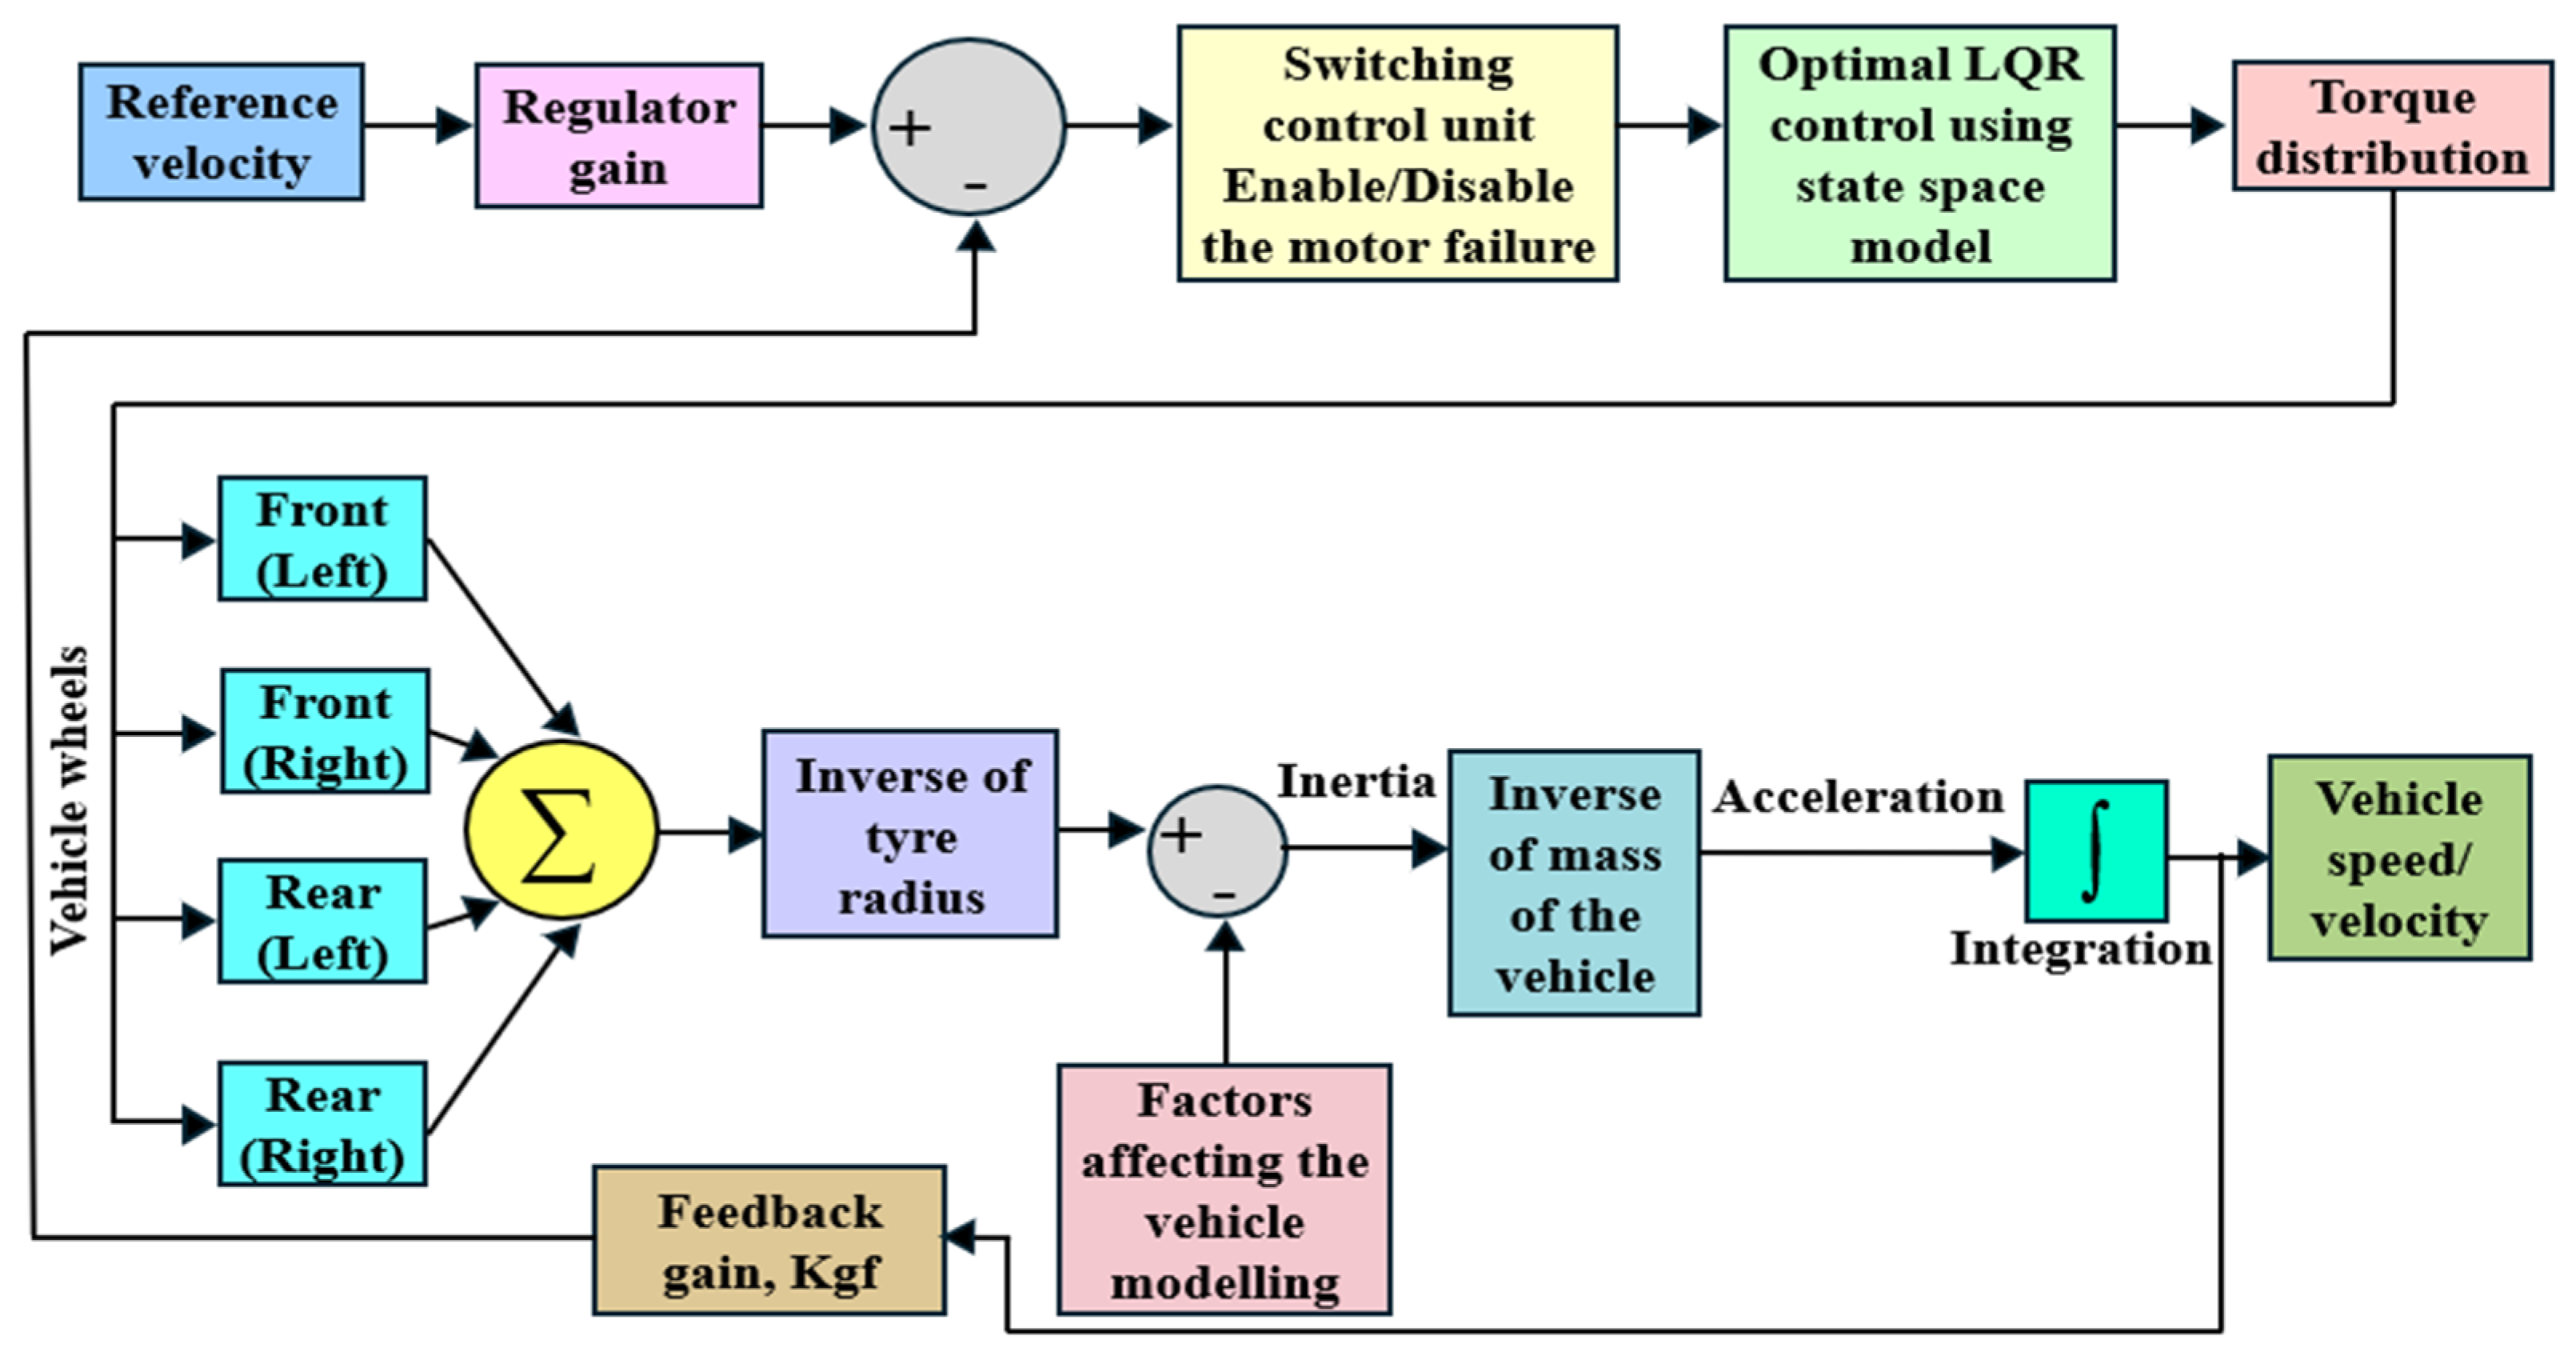
The simulation environment for the proposed optimal LQR model is illustrated in Figure 4. Despite the modeling assumptions, the unique controller design offers a methodical solution for retaining continuity and performance stability. Some nonlinear systems may be stabilized, even when continuous-state feedback laws cannot do so. This block diagram illustrates a vehicle speed control system using an optimal LQR approach. The system begins with a reference velocity input that represents the desired speed. This reference velocity was compared to the actual vehicle speed, and the error signal was sent through a regulator gain to adjust the control action. The adjusted signal enters a switching control unit, which can turn functionality from on to off during a motor failure. Then, the signal goes to the proposed optimal LQR control block, which uses a state-space model to determine the optimal torque distribution across the vehicle’s wheels, helping to maintain the desired speed. The torque was distributed to each wheel (front left, front right, rear left, and rear right) and combined in a summing block to represent the total torque applied.
The combined torque signal is then divided by the inverse of the tire radius, which converts the torque into a force applied to the vehicle. This force is further modified by feedback gains and other factors affecting vehicle dynamics, such as inertia and external conditions, including tire rolling resistance, aerodynamic drag, and road friction. The total force was then divided by the vehicle’s mass to compute the acceleration, which was integrated over time to determine the vehicle’s speed.
This measured speed was fed back to the summing junction to compare with the reference velocity, closing the feedback loop to maintain the desired vehicle speed despite disturbances or motor failures. The resulting force was then divided by the vehicle’s mass to compute the acceleration, which was integrated over time to yield the vehicle’s speed or velocity. The control loop receives the velocity input by enabling continuous regulation to track the reference velocity closely. This loop facilitates accurate vehicle speed control by dynamically modulating torque distribution and compensating for changes in vehicle dynamics. The total vehicle mass is determined by including the entire passengers’ weight, battery weight, hull weight, and motor weight. Table 1 summarizes the calculated input parameters for each integrated component in the Simulink model of the EV.

2.4.2. Operation and Flow Diagram of Switching Control Unit

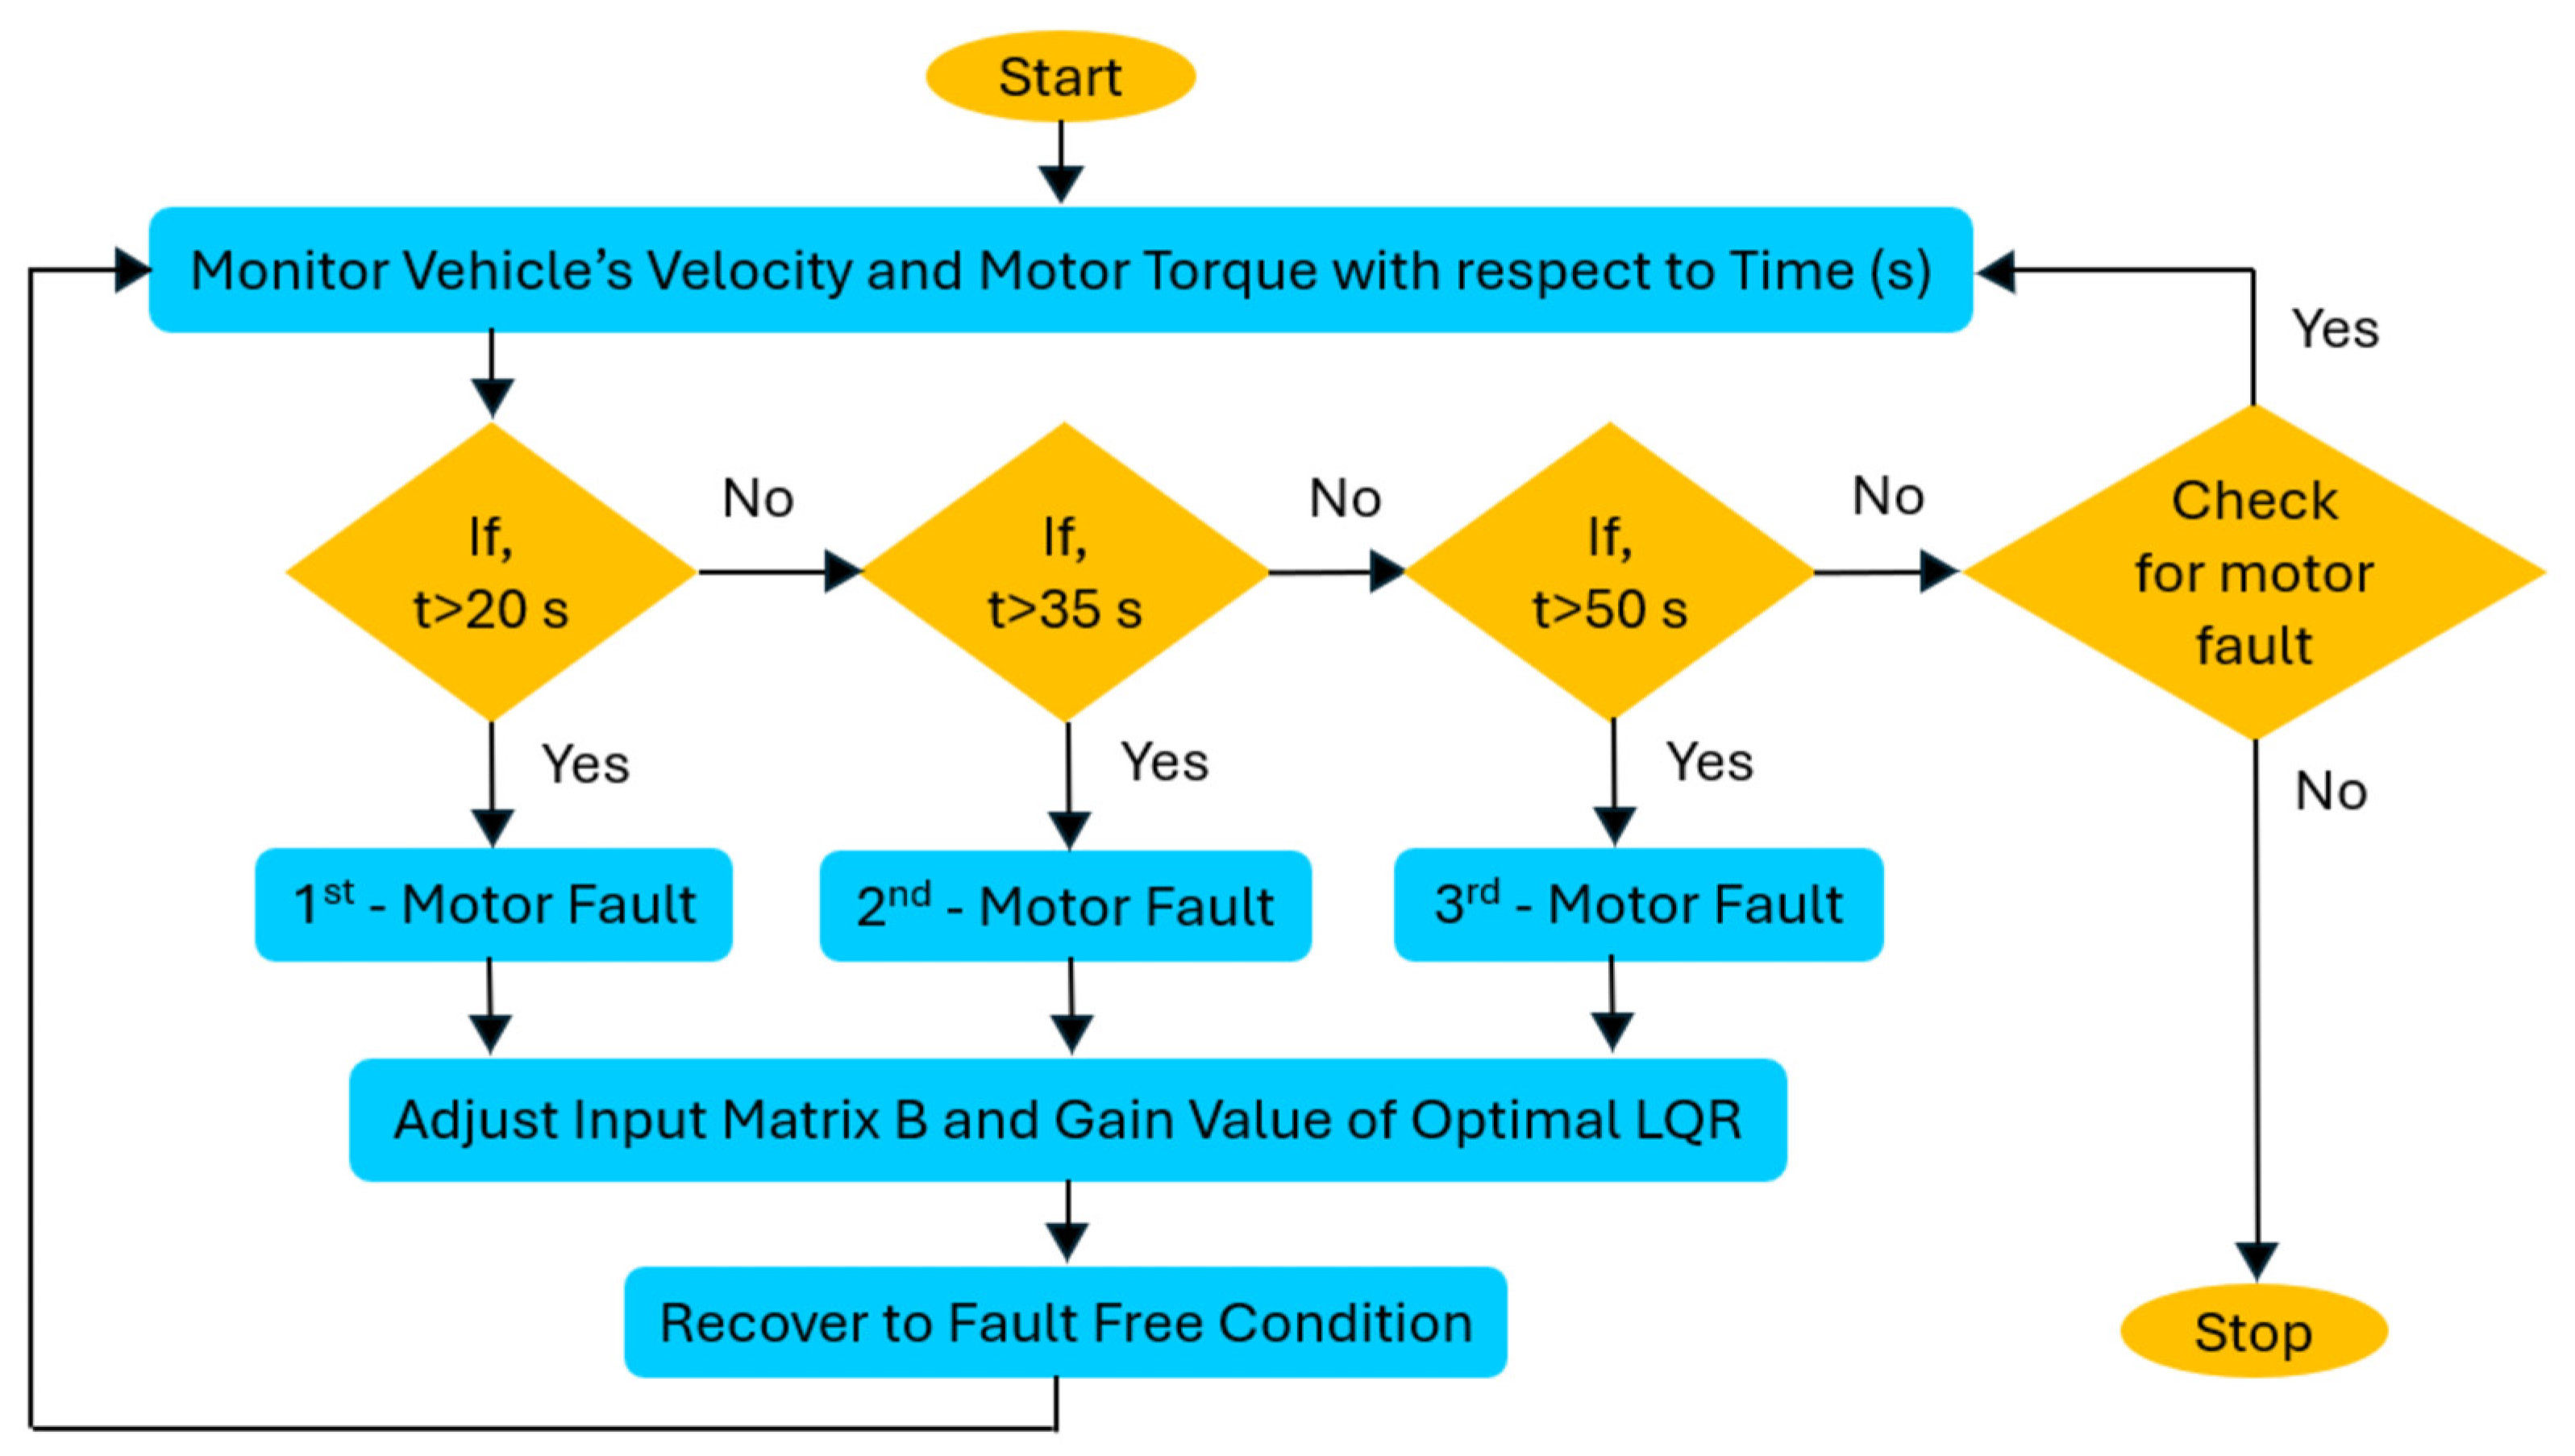
The switching control unit flow process was depicted and illustrated in Figure 5. The function of the switching control unit control the vehicle’s stability and maintain the desired velocity of the proposed 4WID-EV. This unit interfaces with the optimal LQR by modifying the input matrix and updating the gain values upon detecting a fault. For normal operating conditions, the optimal LQR works based on initially designed parameters for fault-free scenarios. The proposed model employs a threshold-based logic within the switching control unit, specifically utilizing a time-triggered fault detection mechanism. This mechanism continuously monitors key system responses—vehicle velocity, torque, speed, and current are used to identify deviations indicative of faults. In this implementation, the system response is evaluated over 60 s. Faults are systematically introduced at a predefined time to assess the effectiveness of the control mechanism. The first motor fault is triggered at 20 s; at this moment, a deviation in system response is observed, prompting the switching unit to command the LQR to reconfigure its input matrix and update its gain to counteract the fault. A second fault is initiated at 35 s, and the system again autonomously adjusts its control parameters to restore regular operation. A third motor fault is introduced at 50 s, with similar corrective actions taken. In all cases, the transient nature of the fault is detected by switching control units and ensures recovery by appropriately updating the LQR parameters. Following recovery, the system returns to its nominal state. If new faults are detected thereafter, the switching control unit reactivates the fault-detection and recovery process, ensuring continuous fault tolerance and improved dynamic performance of the vehicle system.

3. Results and Discussion

The performance and tuning characteristics of the proposed optimal LQR controller are systematically compared with a conventional PID controller under various motor failures across different speeds using MATLAB-based simulations. The simulation outcomes are the key performance metrics that were analyzed in the following sections.

3.1. Performance Analysis of the Model for Varying Reference Input (20 m/s)

This section discusses a performance analysis of the proposed model for a reference input of 20 m/s. The simulation analyzes the system’s dynamic response to gradual and rapid changes in the reference command. The robustness of the model is also investigated by introducing perturbations and observing the deviations in the system. The simulated model results were compared for different failure scenarios to ensure the model’s ability to account for stability, high fidelity, disturbance rejection, and adaptability.

3.1.1. Motor Torque

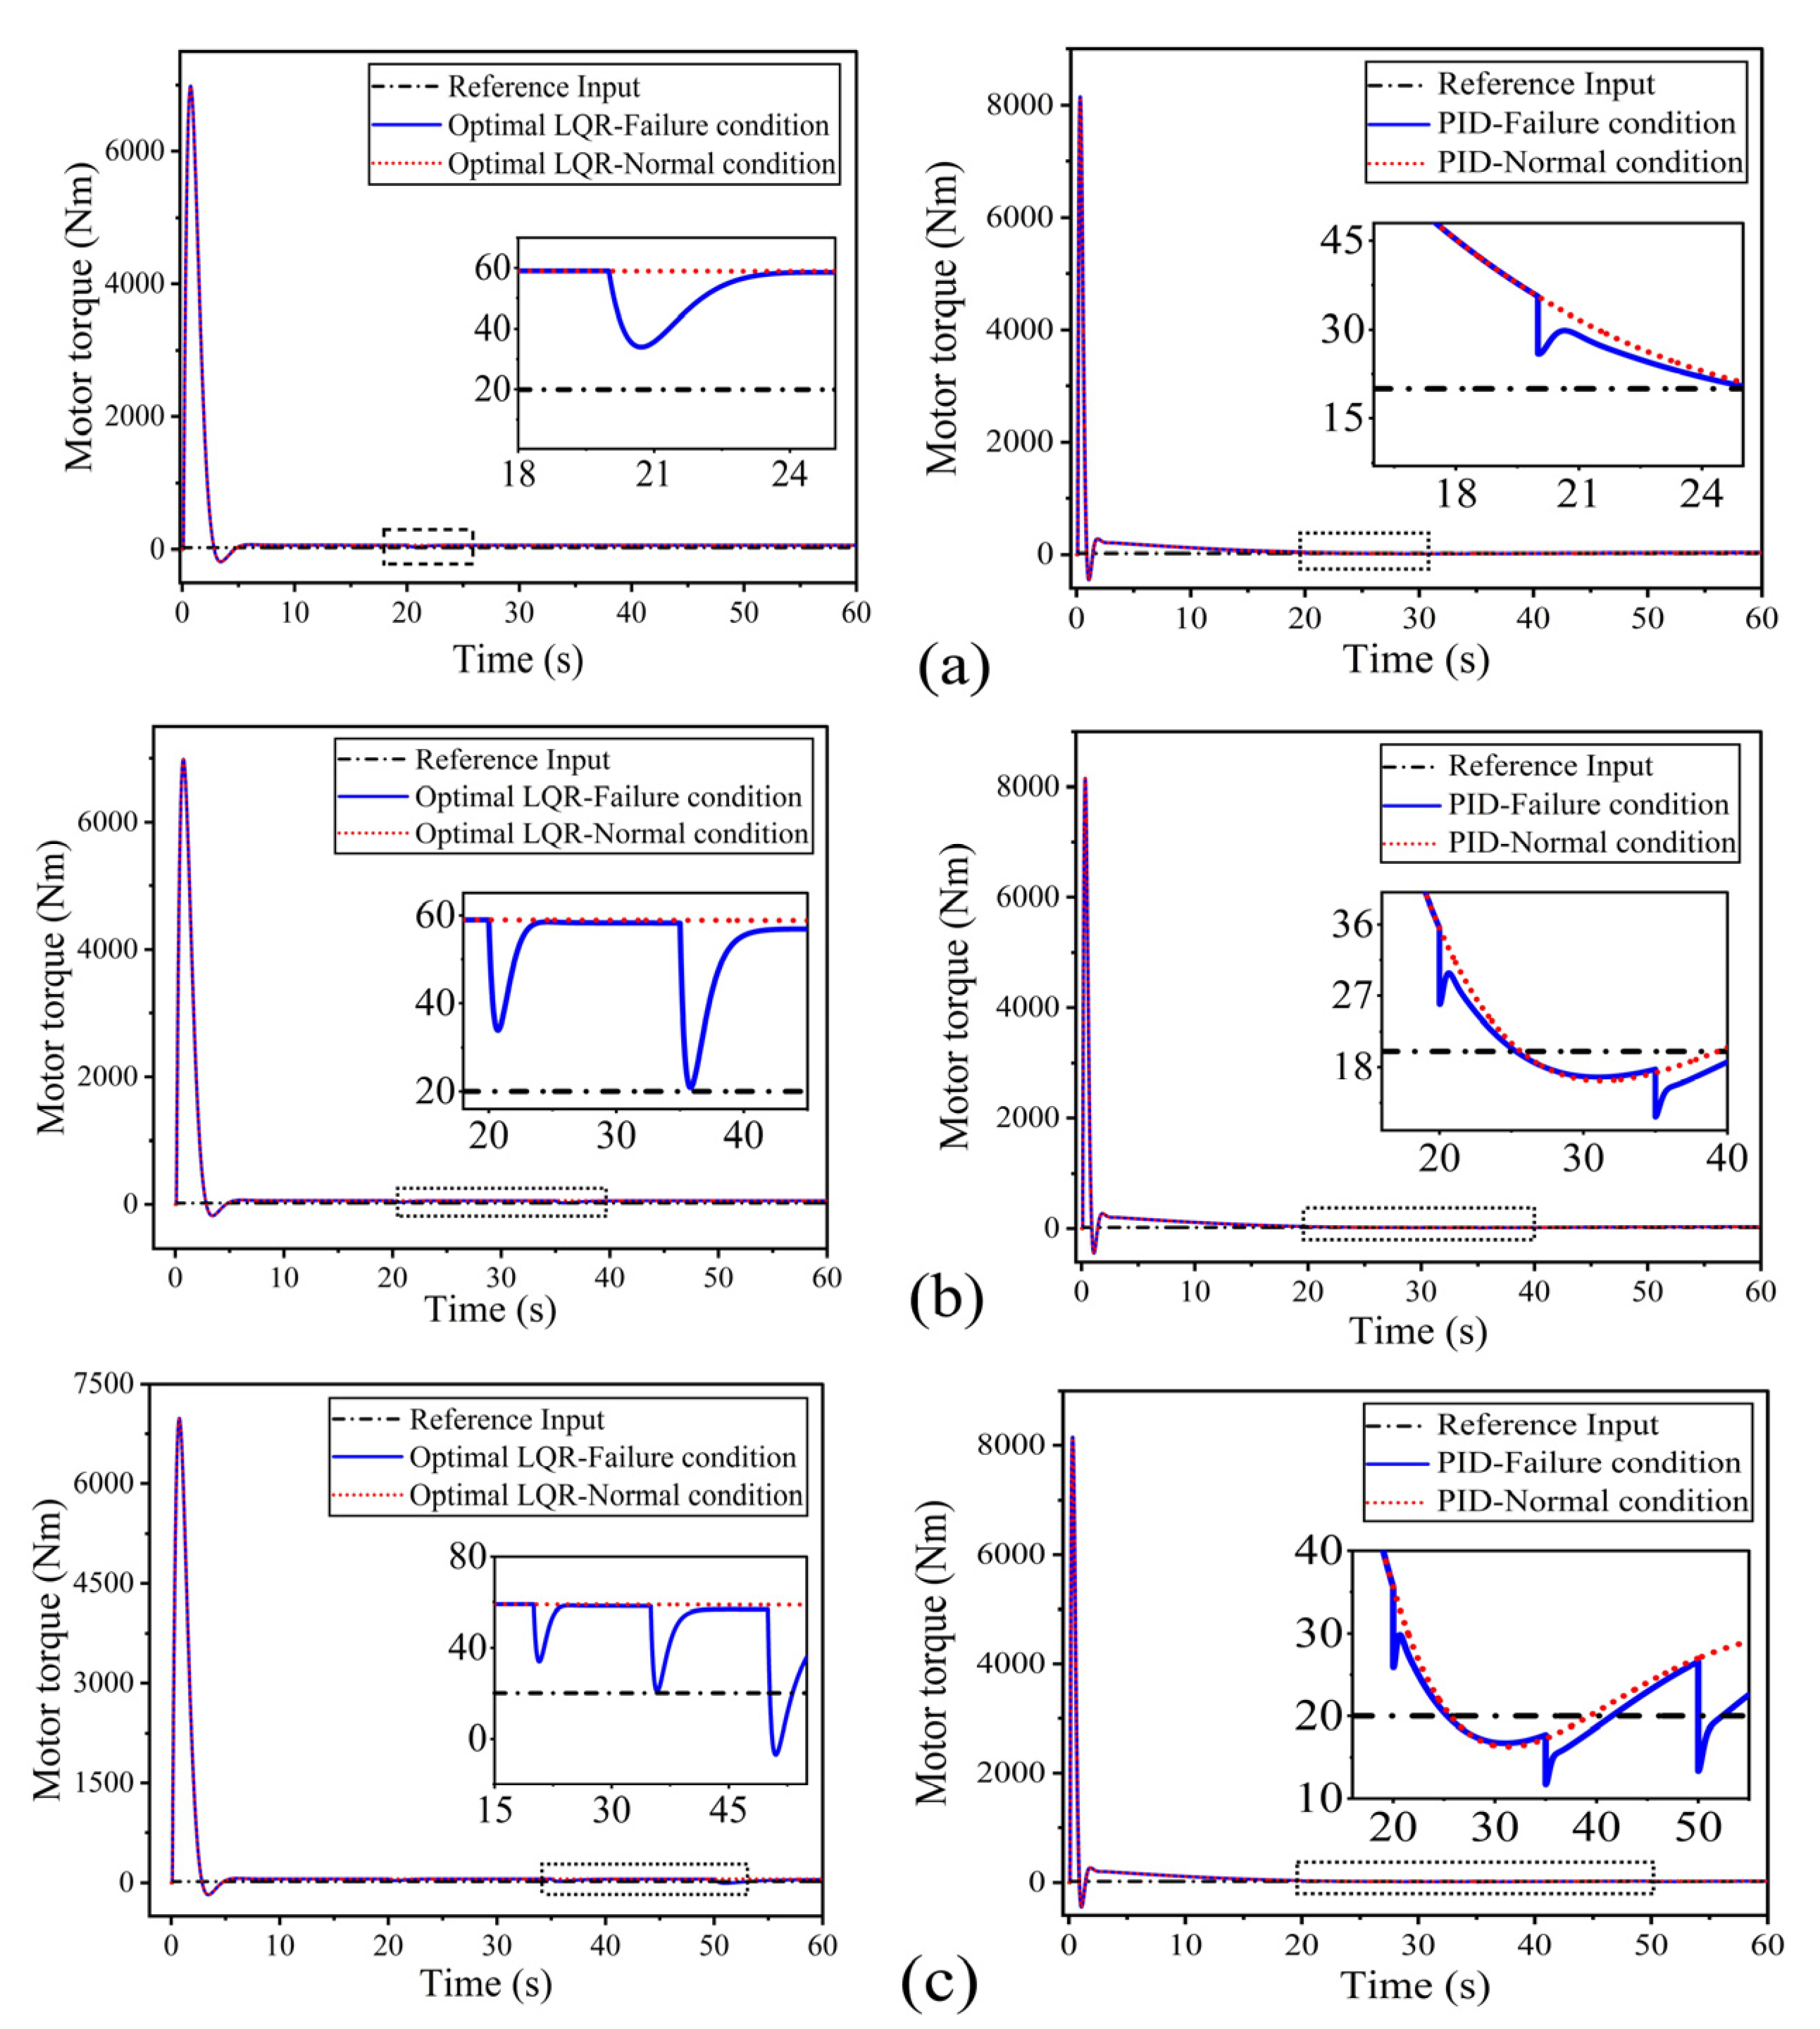
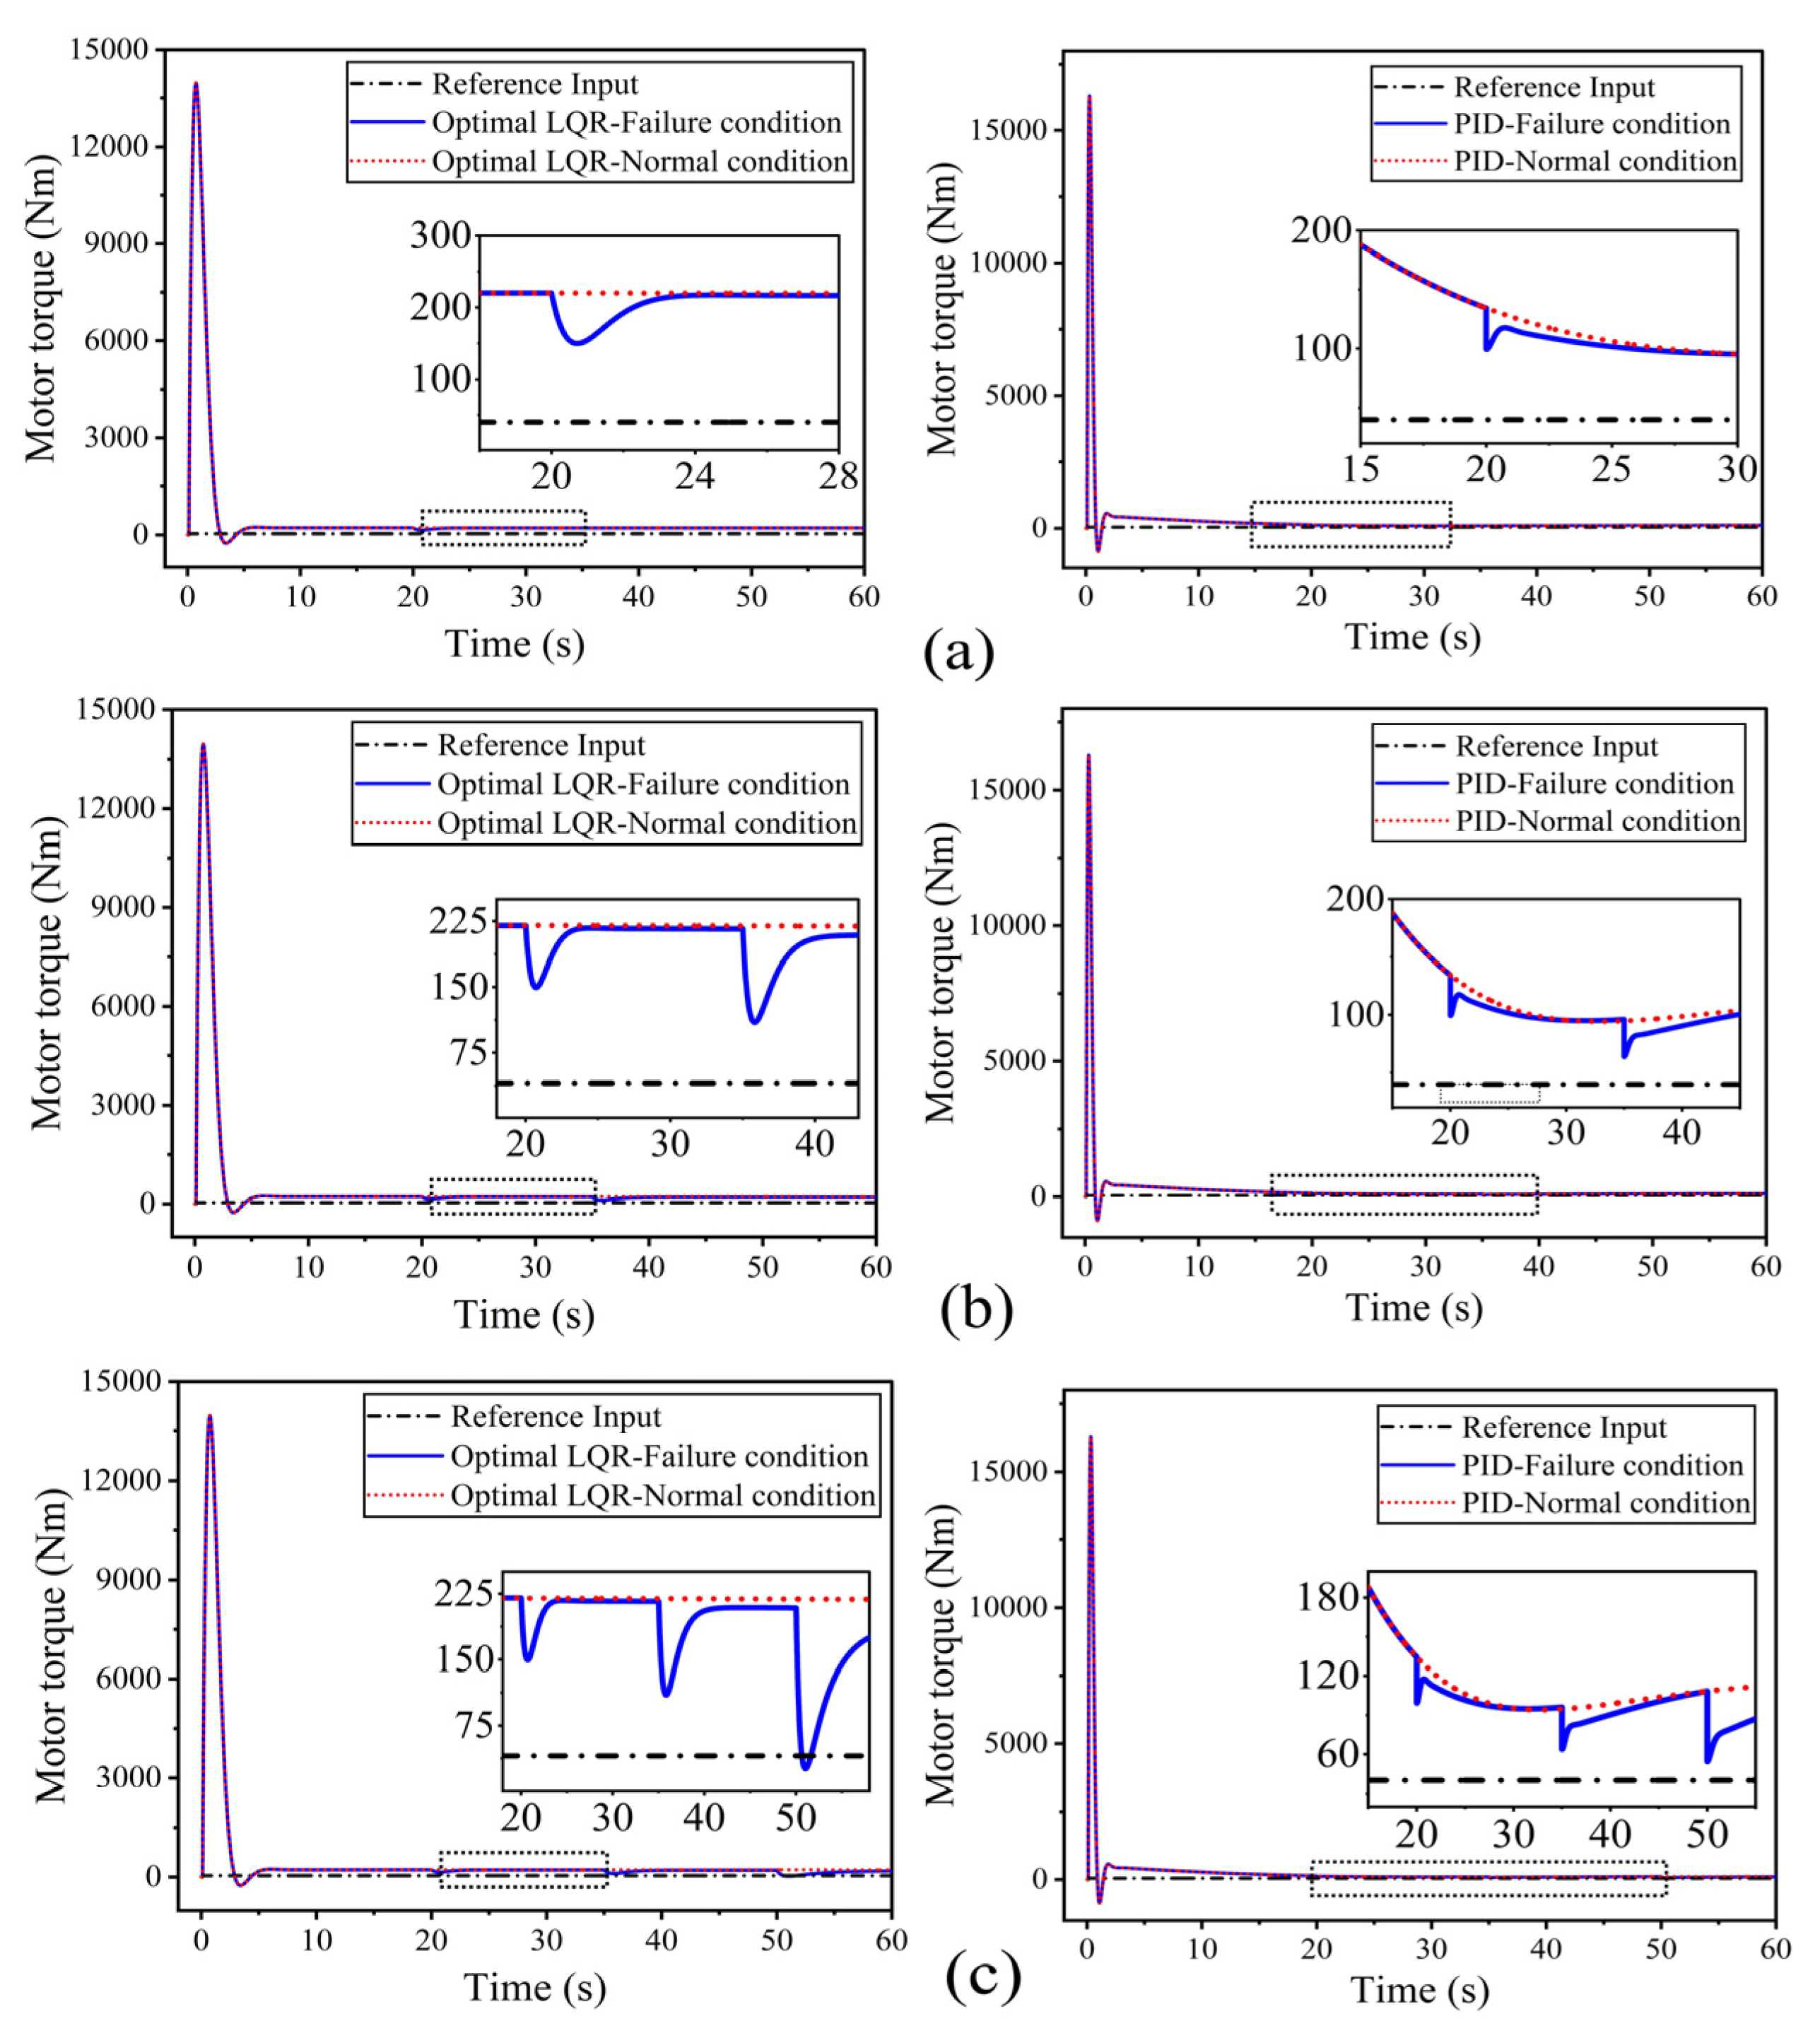
A comparative analysis of the motor torque using the controller at a reference speed of 20 m/s is presented in Figure 6, which illustrates the torque response using optimal LQR (left) and PID (right) controllers under varying motor failure scenarios in a 4WID-EV system. In each of Figure 6a–c, the motor torque is plotted against simulation time in seconds over a 60 s interval. Figure 6a illustrates the motor torque response for the optimal LQR (left) and PID (right) controller under normal conditions, as well as during a one-motor failure scenario. A reference torque of 20 Nm and a constant vehicle speed of 20 m/s were considered as input to the electric motor. The simulated results were evaluated and compared for normal and one-, two-, and three-motor failure conditions.
In Figure 6a, the optimal LQR controller achieves a peak torque of 6800 Nm and quickly stabilizes at 60 Nm within 1 s, with a minimal steady-state error under normal conditions. When one motor failure is introduced, optimal LQR exhibits a maximum torque of about 6750 Nm, resulting in a slight disturbance of torque of 38 Nm at 21 s and re-stabilizes within 1 s. The PID controller, in contrast, exhibits an initial overshoot of 6850 Nm, a prolonged settling time of approximately 15 s, and a final torque of 57 Nm, resulting in a significant steady-state error of −30 Nm. After the motor failure, PID produces peak torque of 6800 Nm with a slight dip in torque at 18 Nm and restabilizes within 4 s at 30 Nm, showing erratic fluctuations and slow recovery, demonstrating weaker disturbance rejection.
In Figure 6b, the optimal LQR controller achieves a peak torque of 6800 Nm and quickly stabilizes at 60 Nm within 1 s, with a minimal steady-state error under normal conditions. When two motor failures are introduced, the optimal LQR reveals robust behavior, with minor torque drops of 25 Nm at 35 s, stabilizing to 58 Nm within 1.5 s, yielding a small steady-state error of −2 Nm. The PID controller suffers significant fluctuations post-failure (25 Nm deviations), slow recovery (4.5 s), and high error (−5 Nm), highlighting degraded performance under two-motor failure.
As shown in Figure 6c, the optimal LQR controller achieves a peak torque of 6000 Nm and quickly stabilizes at 60 Nm within 1 s, with a minimal steady-state error under normal conditions. When three motor failures are introduced, the responses of the controller under three-motor failure are presented. When the optimal LQR torque peaks at 6900 Nm, motor failure exhibits a decline of 0 Nm at 50 s and then stabilizes at 55 Nm with a recovery time of 2 s, which results in a final error of 5 Nm. Conversely, the PID controller overshoots to 6800 Nm, drops drastically post-failure to 12 Nm, and stabilizes at 25 Nm, leading to a critical error of −35 Nm and the longest recovery time (5 s).

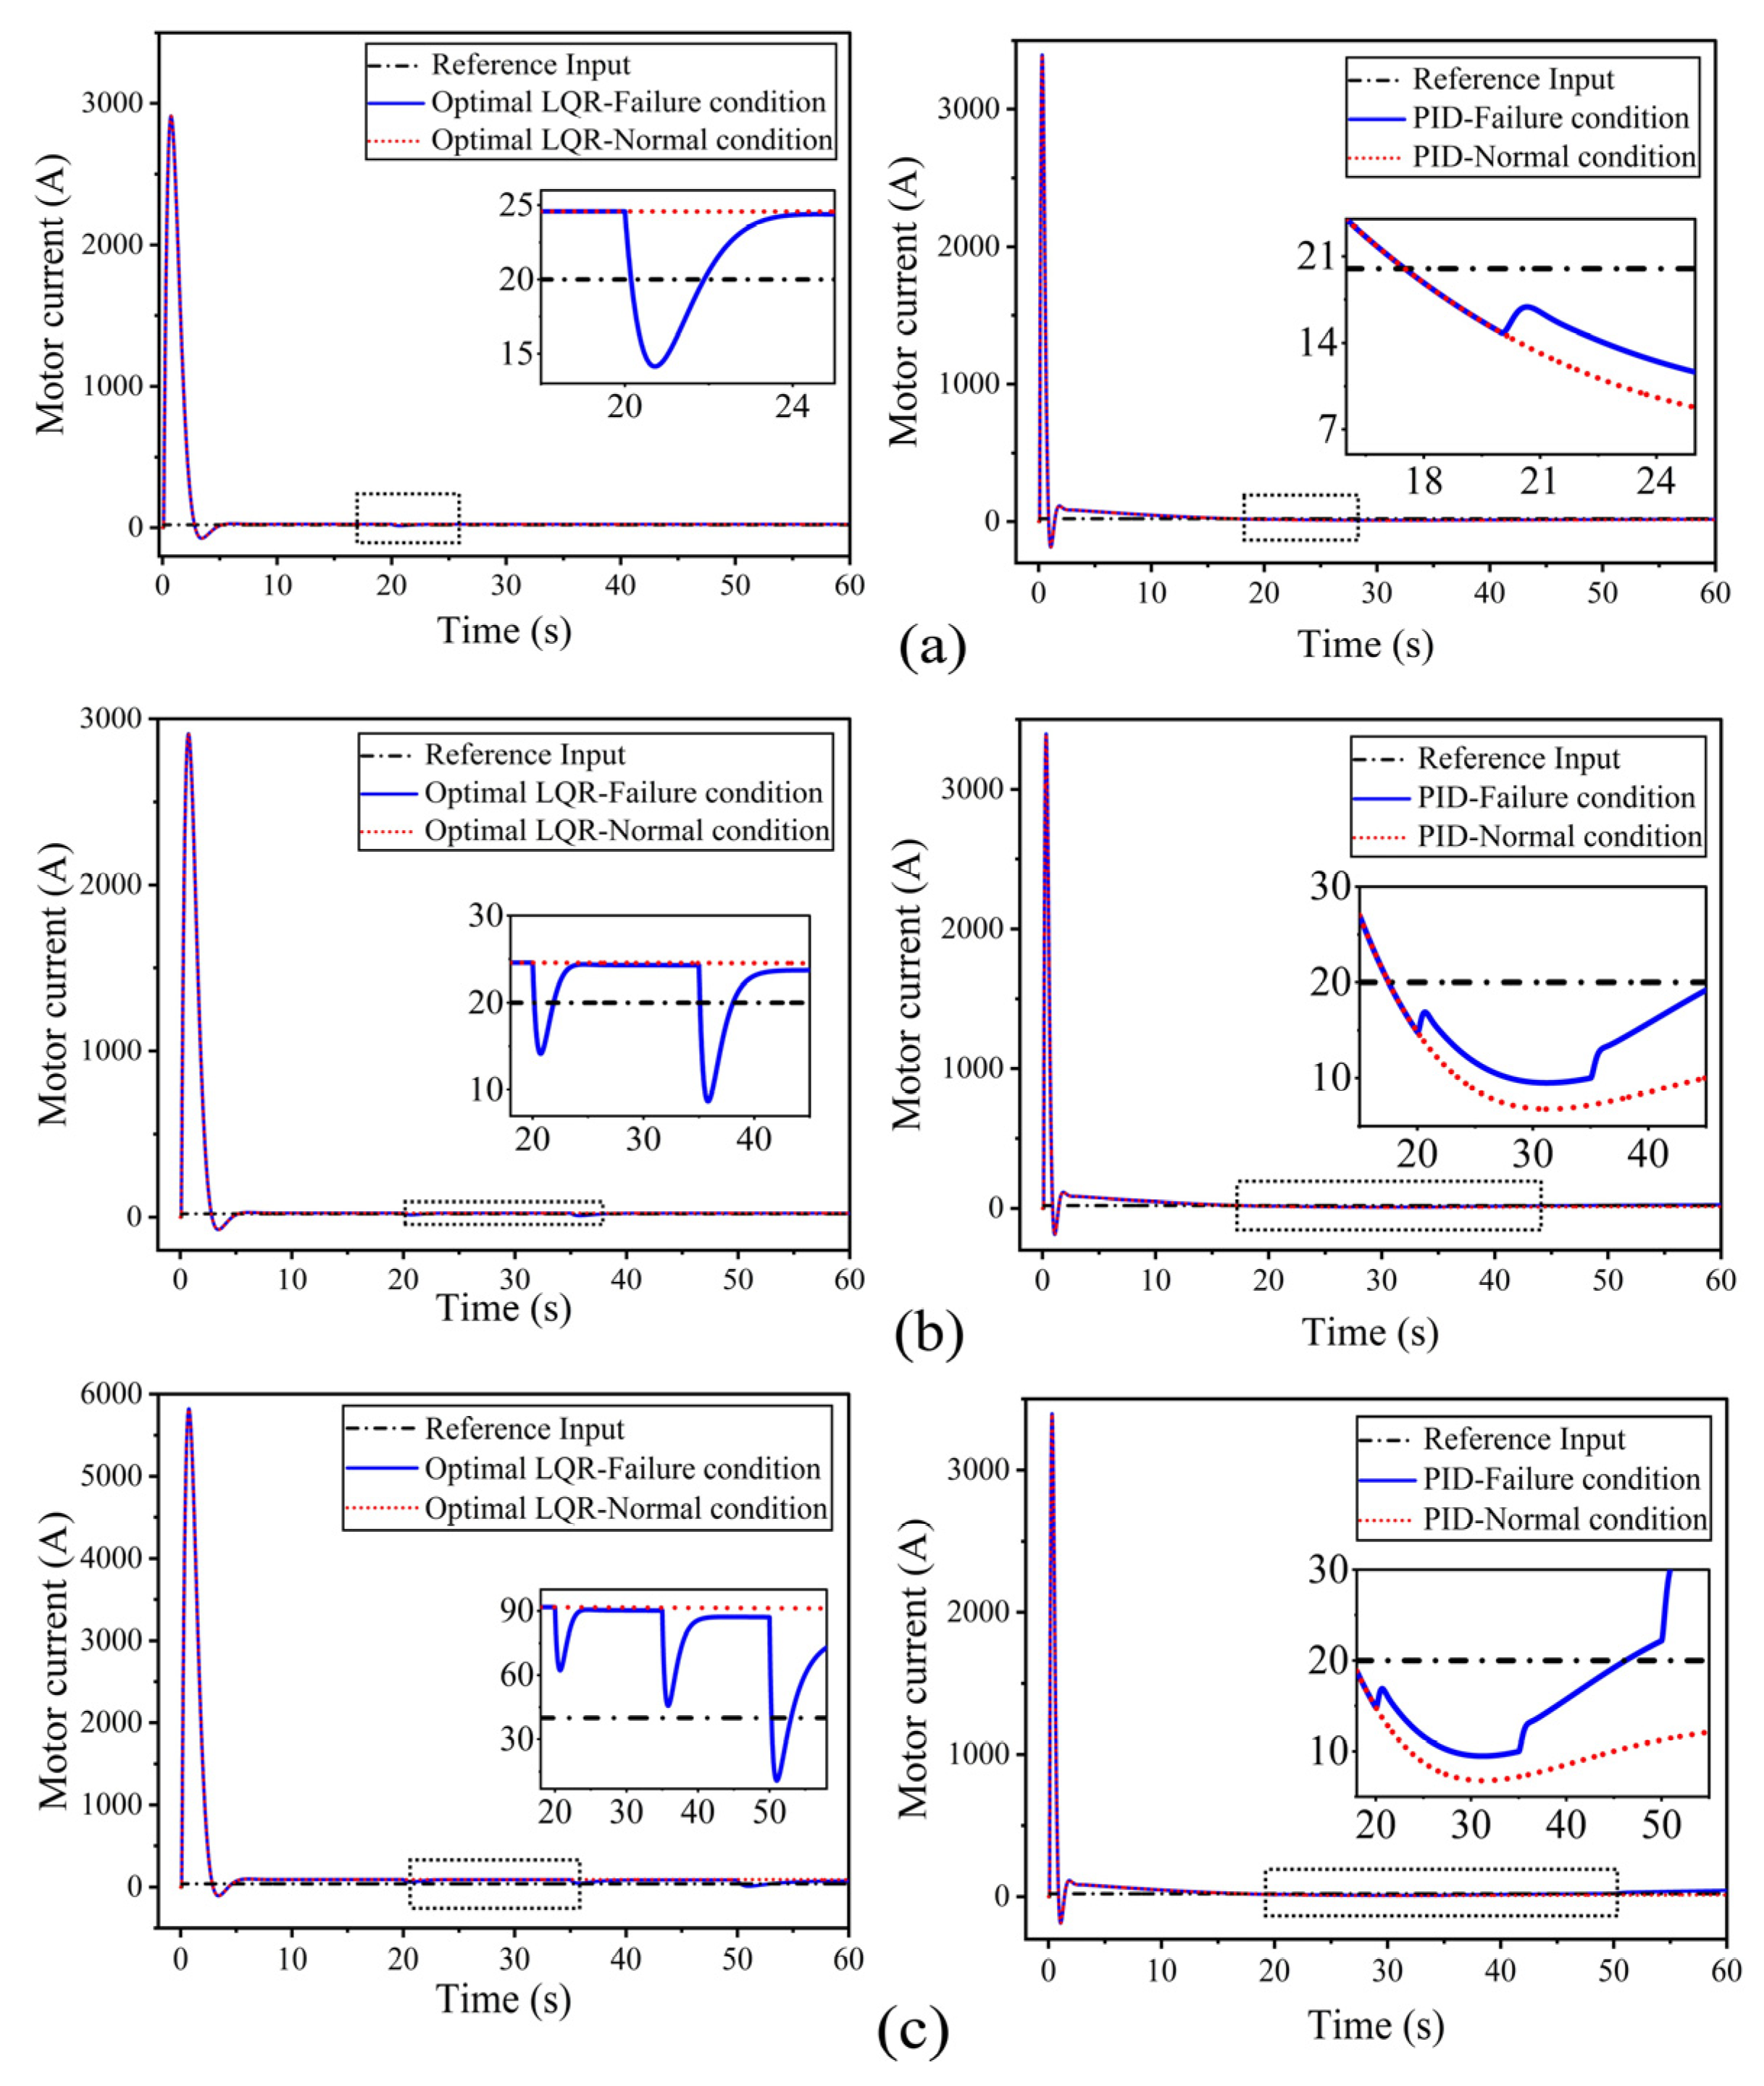
3.1.2. Motor Current

Figure 7 presents a comparison of motor current responses for a reference vehicle speed of 20 m/s. Figure 7a illustrates the performance of the optimal LQR controller (left) and PID controller (right) for the reference input with one motor failure. Under normal conditions, during the interval of 0 to 60 s with a reference input of 20 V, the PID controller produces a peak current of around 2955 A at 3 s, and the current stabilizes at approximately 22 A, whereas the optimal LQR controller achieves a high peak motor current of 2950 A at 2 s, rapidly settling to a steady-state response at 25 A. As a result of this analysis, it can be seen that the optimal LQR’s current response is not sturdy, with minimal overshoot and better tracking capability, indicating optimal transient and steady-state performance. In contrast, the PID’s transient performance is very slow and exhibits a higher steady-state error compared to the optimal LQR controller. Under one-motor failure conditions, the PID controller’s current response reaches the peak of 2935 A at 3 s, and during the failure at 20 s, the motor current gradually increases. The motor current post-failure reached over 7 A, indicating ineffective fault accommodation and increased power loss. In contrast, the optimal LQR controller reveals a peak current of 2920 A at 3 s, the motor failure occurs at 20 s, and the motor response reaches its steady-state current of 12 A. The results show that the optimal LQR controller rapidly recovers with improved control accuracy by confirming its superior fault-handling capability.
Figure 7b shows the controller responses with two-motor failure scenarios. The optimal LQR controller maintains a peak current response of 2900 A at 2 s. The steady-state current was slightly reduced to 24 A, despite larger transient disturbances at 35 s. Conversely, the PID controller produces a peak responsive current of 2920 A at 3 s, and when a failure occurs at 35 s, the motor suffers from a progressive rise in motor current, eventually reaching 11 A. The results indicate that, during the motor failure, the PID controller exhibits less effective current regulation and a lack of dynamic compensation compared to the optimal LQR controller. Figure 7c shows the optimal LQR controller’s peak current response of about 5850 A at 2 s for a three-motor failure that occurs over the time interval of 50 s. A sharper fluctuation in motor current can be seen, which stabilizes at 65 A within 2 s, ensuring that the controller still maintains operational integrity using one motor and consistently exhibits resilience. However, the PID controller becomes significantly unstable with the rise of current around 2900 A at 3 s, while the failure occurs at 50 s and quickly recovers within 5 s. This leads to a constrained response under serious actuator loss and highlights the PID controller’s unsuitability for high-reliability EV systems under fault-prone environments.

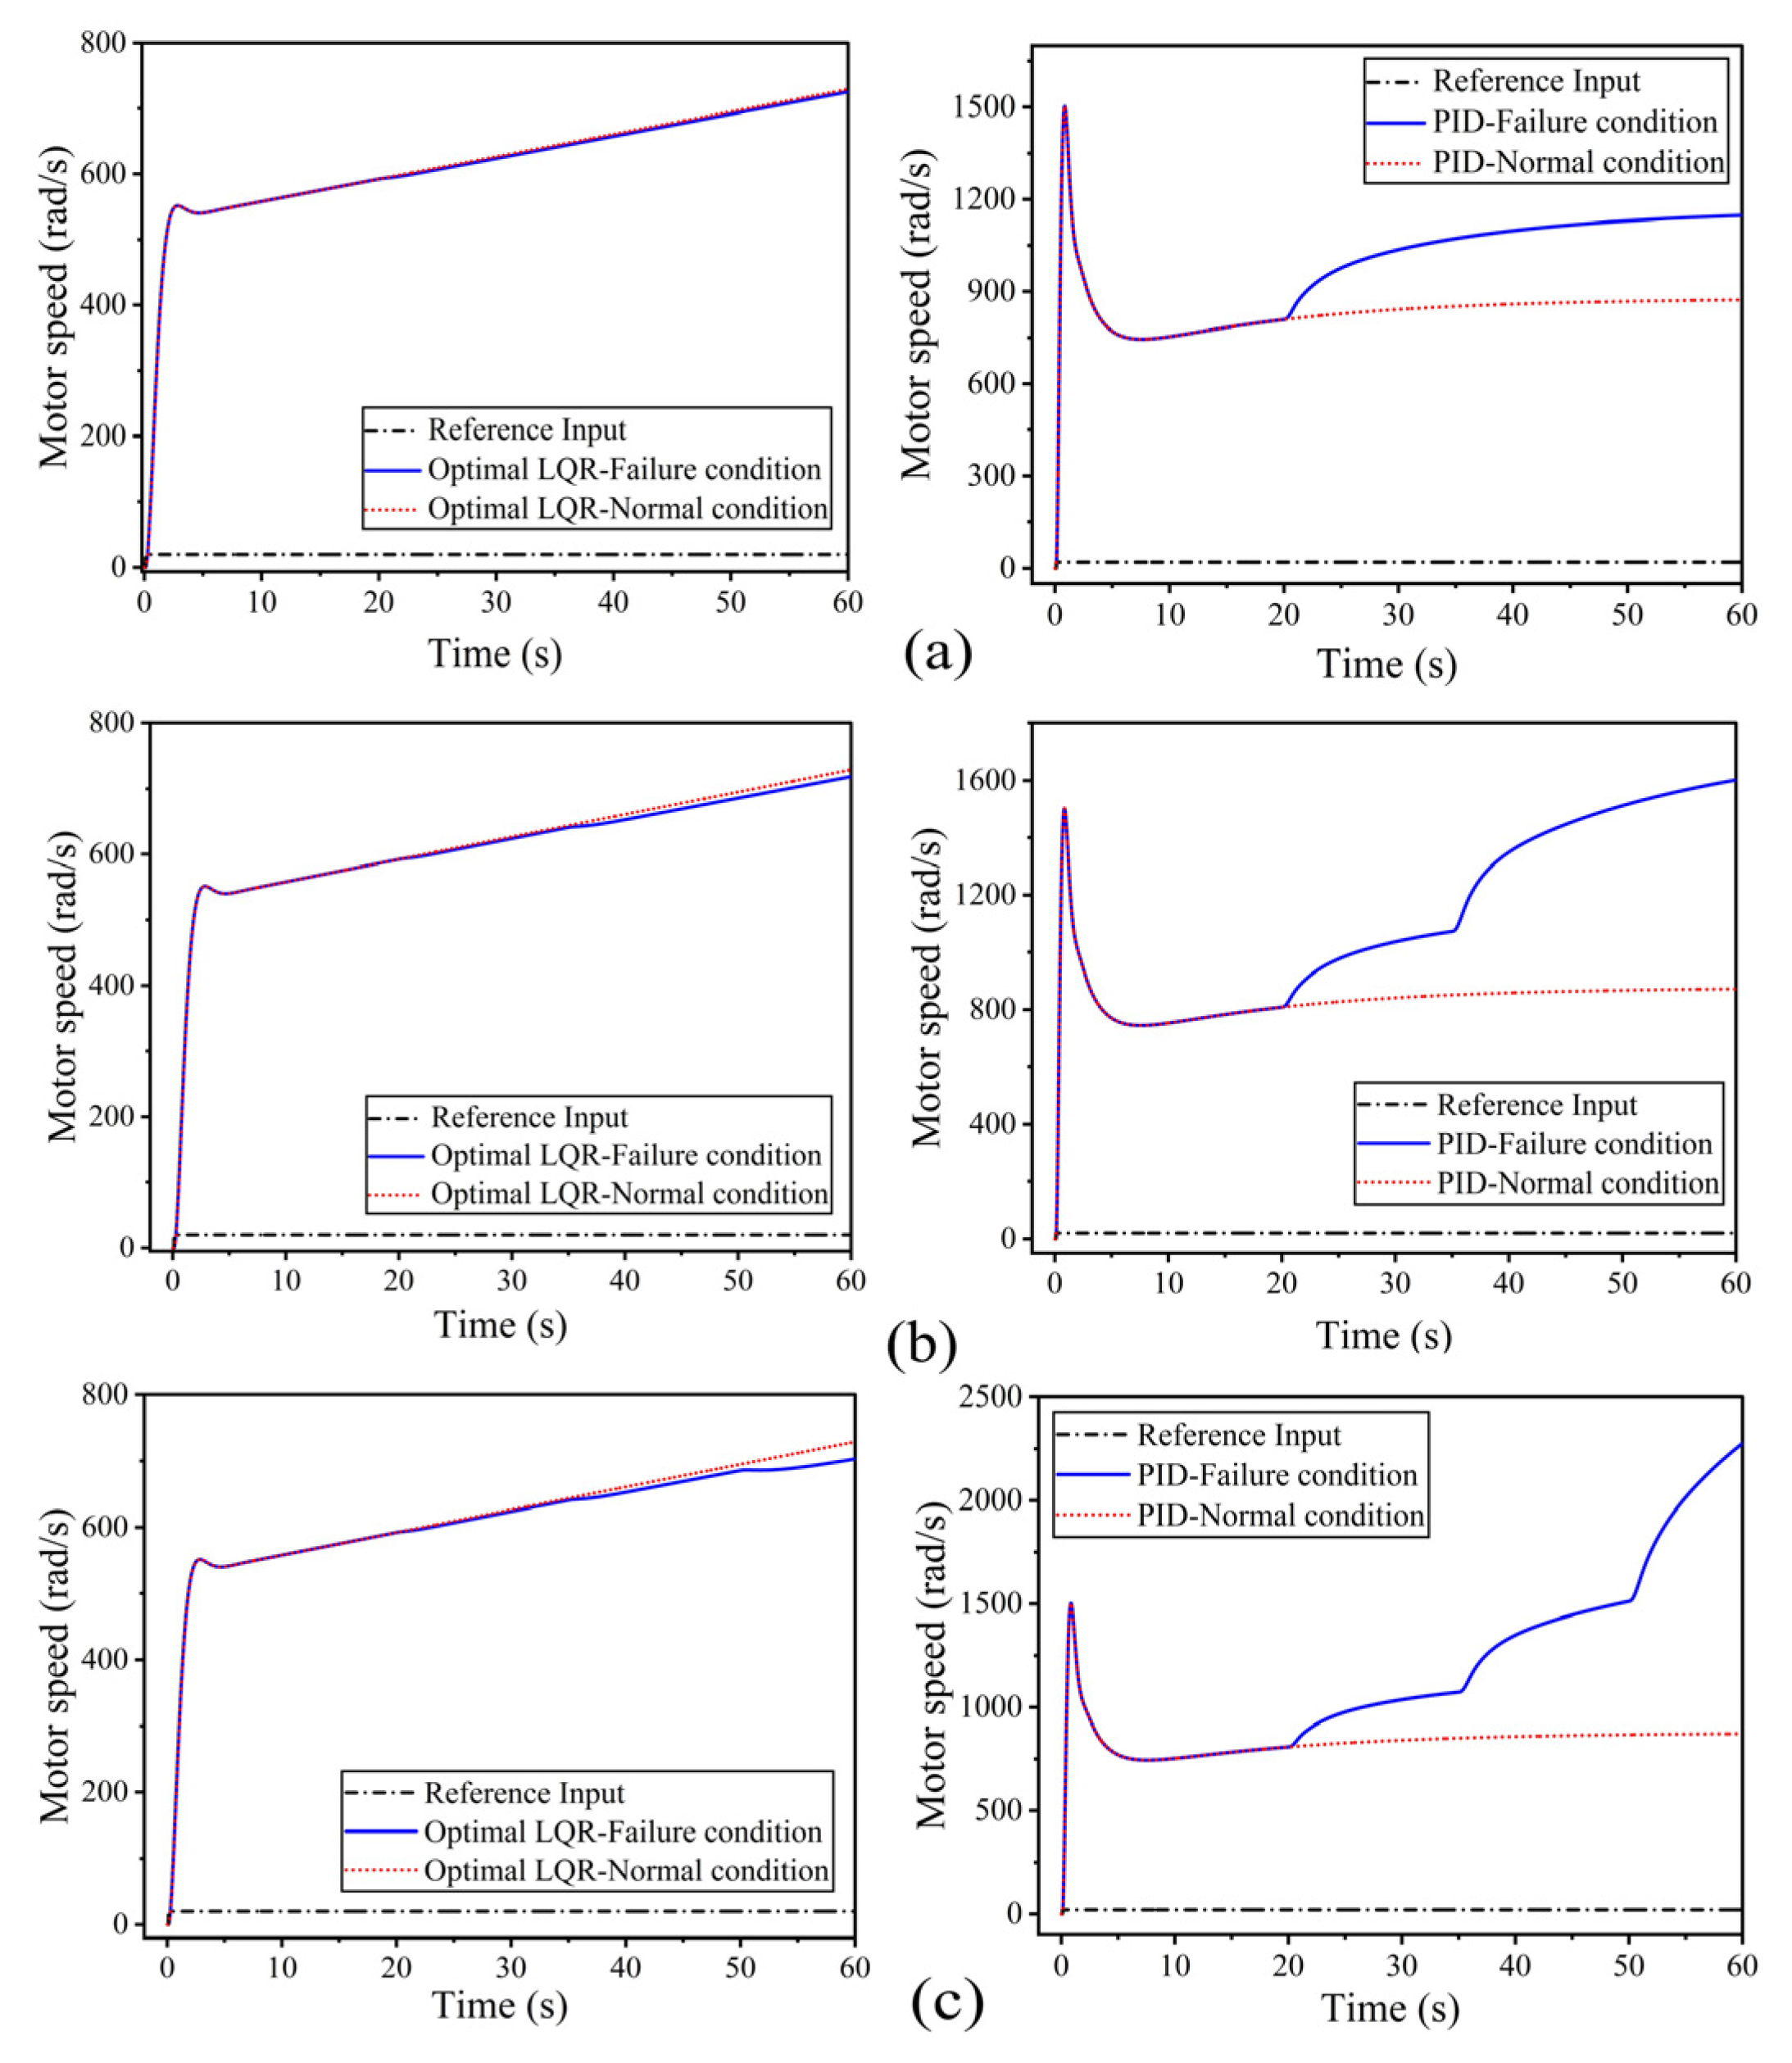
3.1.3. Motor Speed

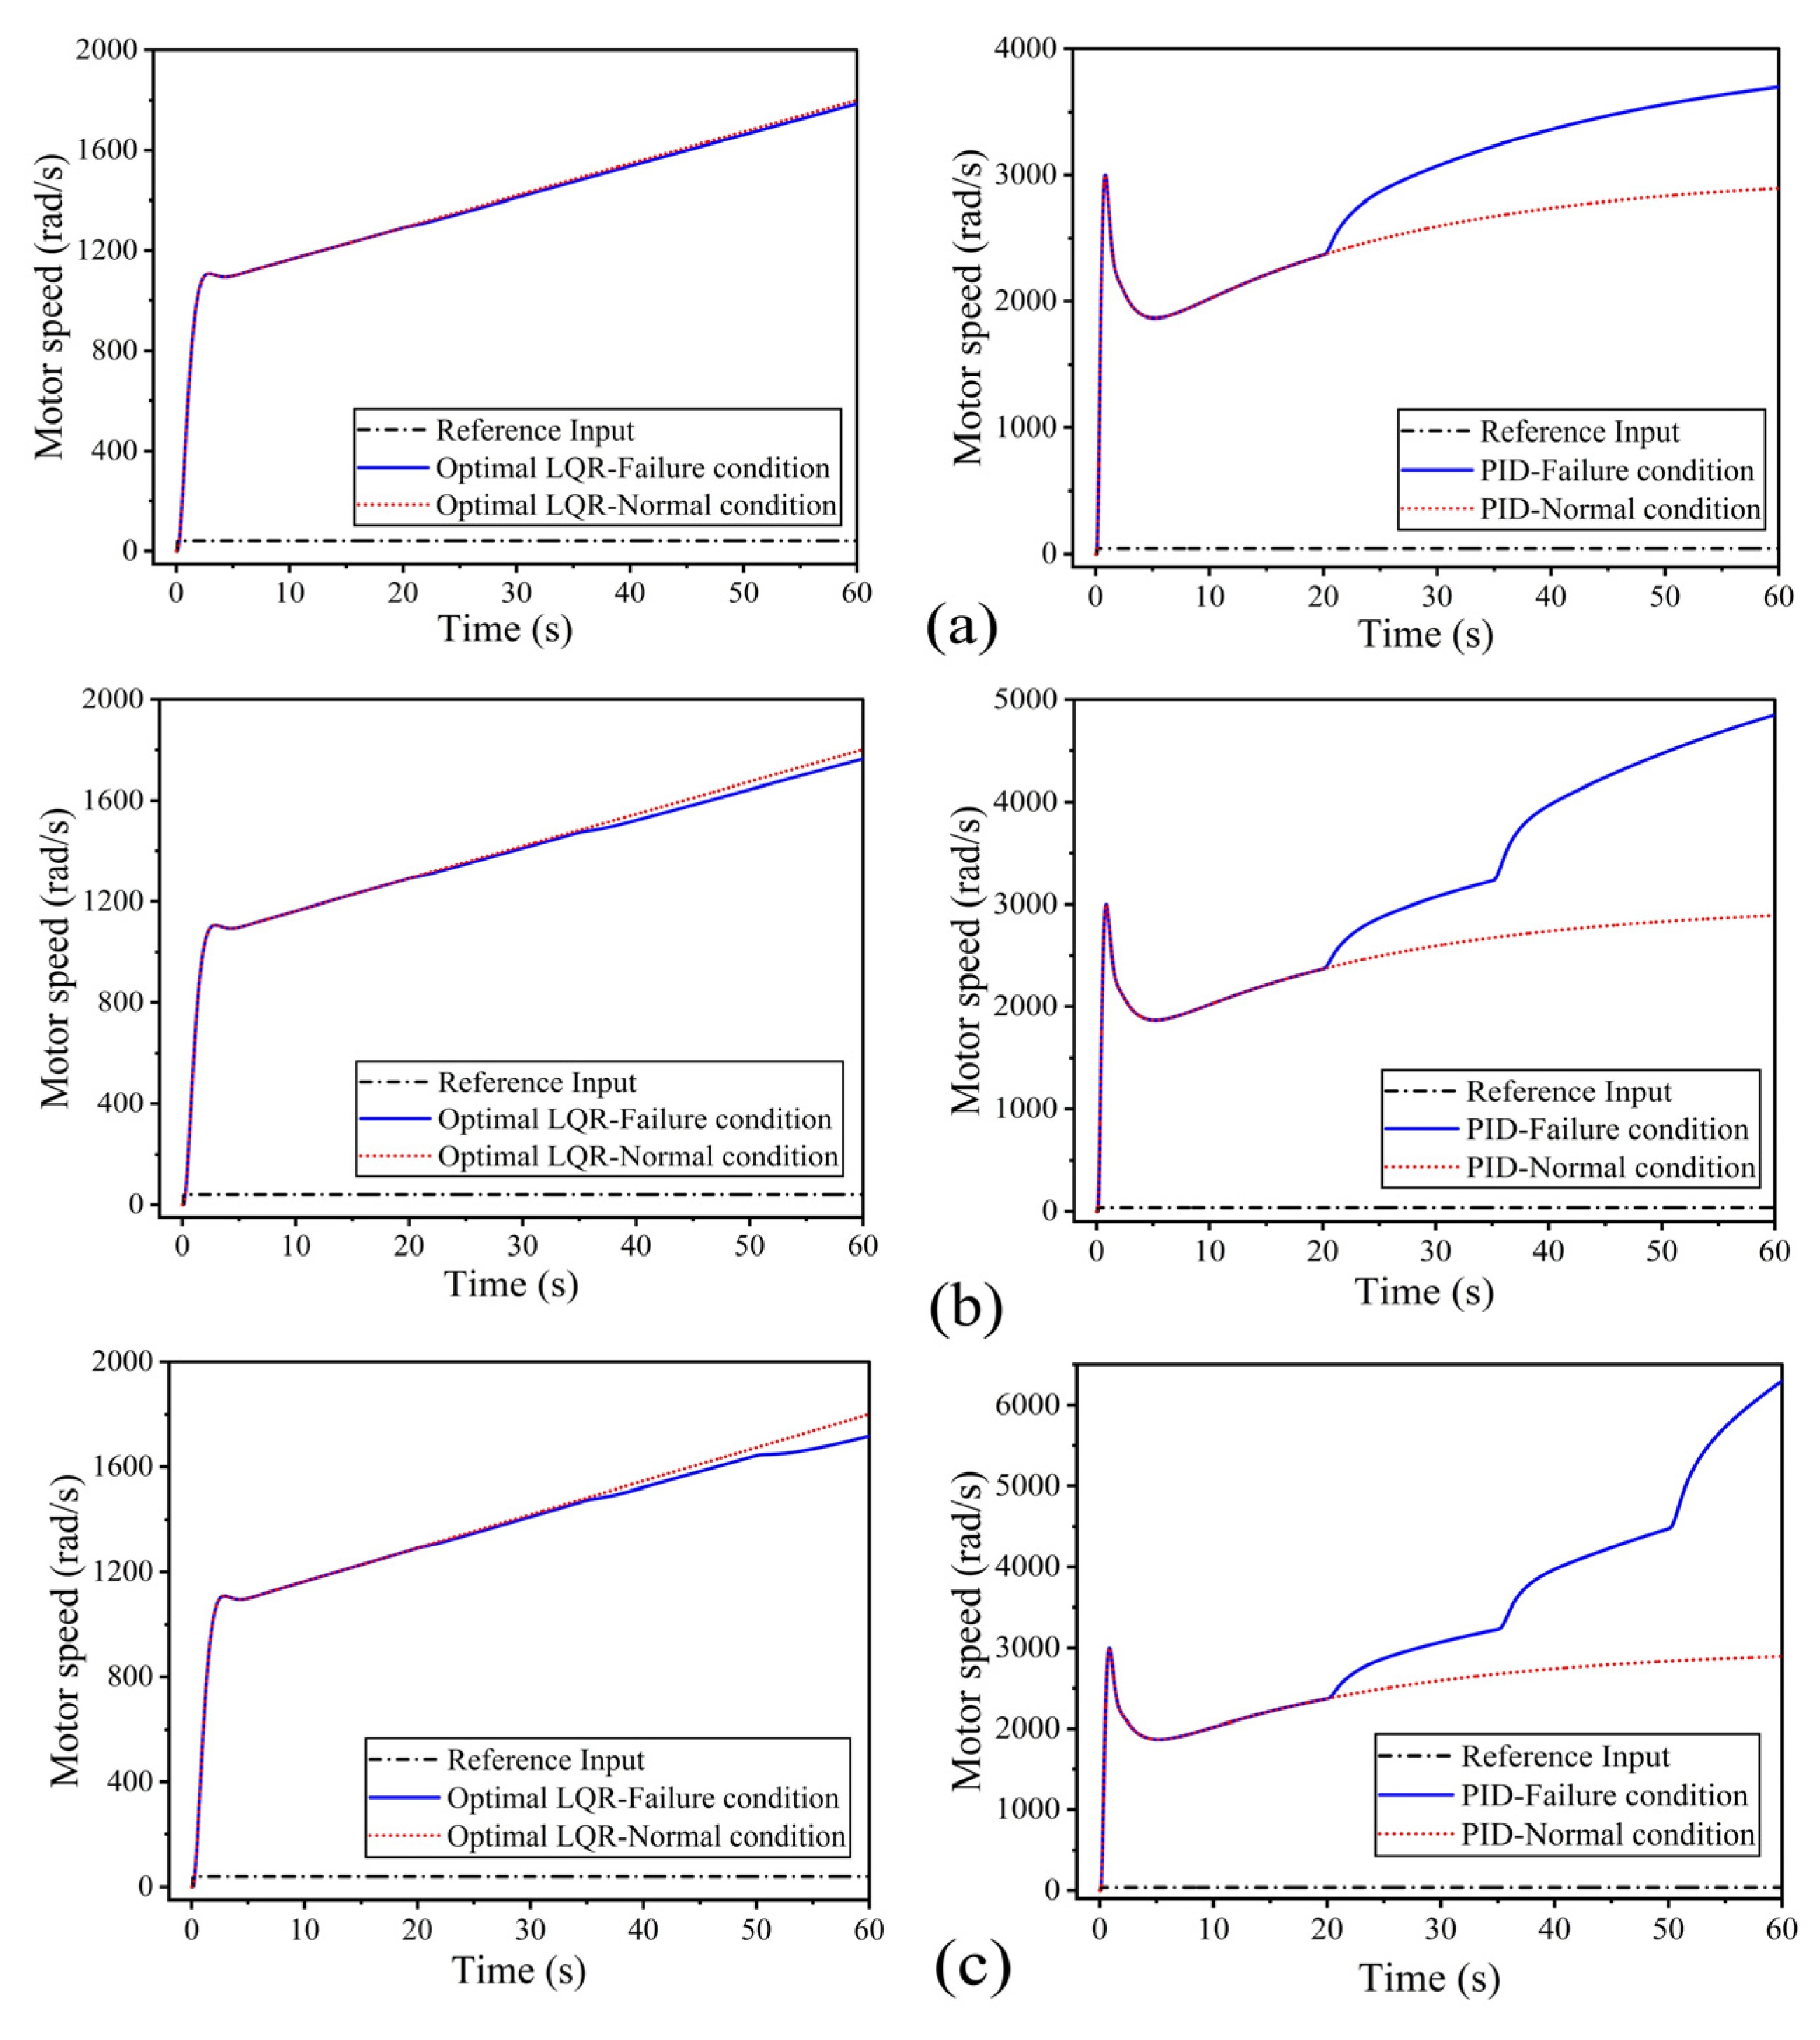
A comparison of motor speed responses at a vehicle speed of 20 m/s is presented in Figure 8. Figure 8a illustrates the controller’s responses for the one-motor failure condition. For the given 20 m/s reference input over 60 s, the PID controller’s motor speed response peaks at 760 m/s. After an initial overshoot, it settles at 740 m/s and shows a steady-state error of approximately 10%, unlike the optimal LQR controller, which delivers a wider motor speed response of 755 m/s with a faster rise time of approximately 2.5 s and negligible steady-state error under normal conditions. Considering the one-motor failure condition, the PID controller reaches a maximum speed of 1200 m/s, and then the failure occurs at 20 s, which in turn reduces the motor speed drastically and significantly overshoots at 1197 m/s. The controller’s steady-state response reaches a deviation of 600 m/s, resulting in a steady-state error of about 16.67%. The optimal LQR controller response reduces to 700 m/s during the failure, which occurs at 20 s. The controller stabilized at 745 m/s with a lesser overshoot by achieving a steady state error of 2.78%, highlighting its superior tracking efficiency.
Figure 8b shows the controller responses under two-motor failure conditions. The PID controller reaches the maximum motor speed of 1600 m/s at 5.5 s. The motor failure occurs at 35 s, and then the controller response settles at 550 m/s within a recovery period of 11 s, which in turn results in less performance under failure severity. In contrast, the optimal LQR controller’s motor speed response reaches 765 m/s at 2.5 s and experiences a minor impact with a recovery time of 2 s. Therefore, the result of the optimal LQR controller exhibits a steady state error of 3.3%, showing its robustness and better fault-tolerant control for high-speed tracking. Figure 8c presents the controller responses under three-motor failures. The PID controller response produces a motor peak speed of 1500 m/s, and upon failure, which occurs at 50 s, the motor speed response achieves 2000 m/s at 7 s, which results in a steady-state motor speed of 500 m/s. The PID controller response shows an extreme overshoot, with a steady-state error of about 33.33%, and struggles to recover its original state. In contrast, the optimal LQR controller’s speed response reaches 770 m/s at 3 s, and then motor speed stabilizes at 730 m/s at 7 s for the failure of three motors at 50 s, demonstrating its robustness despite the reduced motor torque.

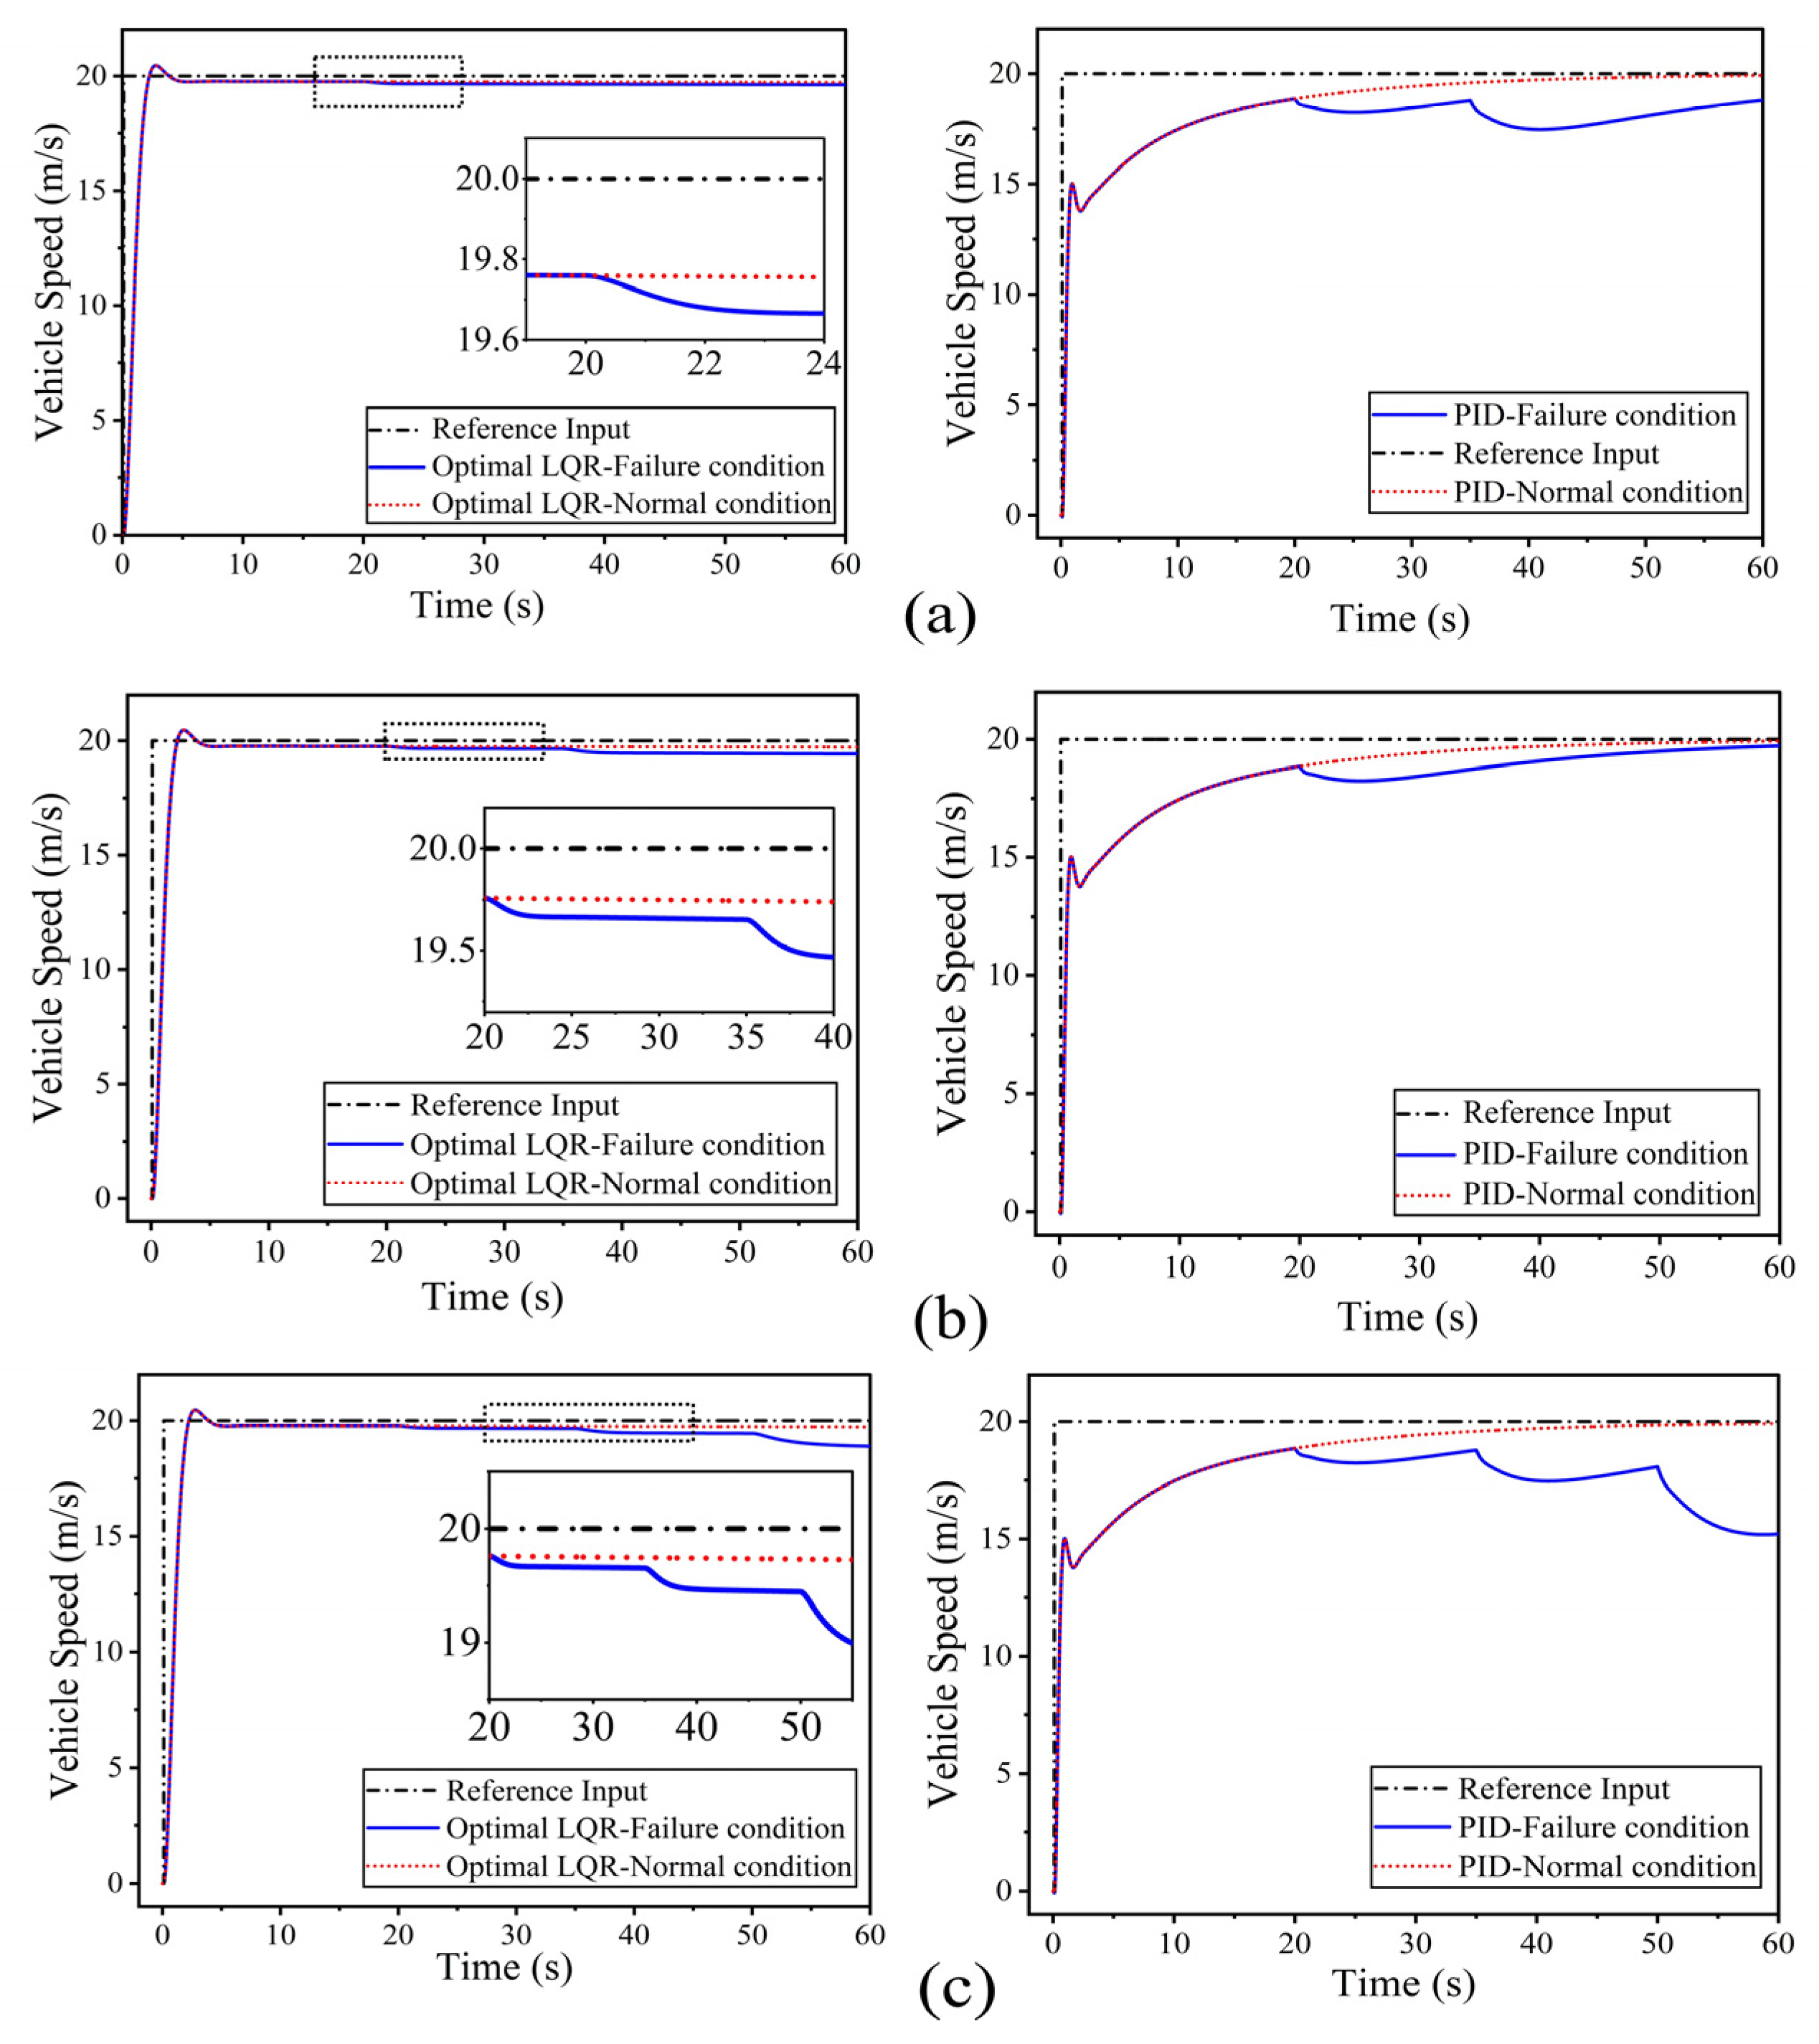
3.1.4. Vehicle Speed

The vehicle speed responses using the controller at a vehicle speed of 20 m/s are shown in Figure 9. Figure 9a presents the controller’s response under one-motor failure. The vehicle speed of the controllers’ responses has a reference input of 20 m/s from 0 to 60 s. The optimal LQR controller achieves a vehicle speed of 20 m/s under normal conditions and 19.75 m/s under a single-motor failure, with minimal overshoot values of 0.3% and 0.5%, respectively. Subsequently, the PID controller’s response achieves a vehicle speed of 20 m/s under normal conditions and 18.3 m/s under a single-motor failure, with minimal overshoot values of 0.5% and 4%, respectively. Figure 9b illustrates the controller’s responses for two-motor failure conditions. The response of the optimal LQR controller for the vehicle speed varied from 0 to 60 s for a reference input of 20 m/s. Upon two-motor failures at 35 s, the vehicle speed stabilized at a maximum of 19.45 m/s at 60 s with a dip speed of 19.2 m/s by achieving a minimal overshoot of 0.3%. In contrast, the PID controller response achieves a vehicle speed of 17.1 m/s by producing an overshoot of 6%. Figure 9c presents the controller’s responses for three-motor failures. The optimal LQR controller response achieves a vehicle speed of 19 m/s between 20 to 60 s, with a dip speed of 18.75 m/s, which results in a minimal overshoot of 5%. Conversely, the PID controller’s response for a vehicle speed of 16.1 m/s, ranging from 20 to 60 m/s, respectively, produces an overshoot of 7%. As a result, the PID controller reveals delayed convergence and is highly sensitive to disturbance, while the optimal LQR controller consistently demonstrates smoother transitions with better fault-tolerant and controlled vehicle speed response.

3.2. Performance Analysis of the Model for Varying Reference Input (40 m/s)

This section highlights the performance analysis of the simulated model results under a 40 m/s reference input, examining its dynamic response to gradual and abrupt changes. The model’s robustness is assessed by introducing perturbations and analyzing the resulting behavior. The proposed model was validated for different dynamic conditions to show its accuracy, stability, and adaptability.

3.2.1. Motor Torque

The motor torque responses of the controller at a vehicle speed of 40 m/s are presented in Figure 10. Figure 10a illustrates the performance of the controller under normal and one-motor failure conditions. The optimal LQR controller achieves a smooth torque profile with a peak of 13,500 Nm at 0.8 s and stabilizes at a steady-state value of 201 Nm, with negligible overshoot and zero steady-state error. However, the optimal LQR maintains stability under one-motor failure, although the steady-state torque drops to 120 Nm, resulting in a steady-state error of 1%. The controller response demonstrates fault resilience with a recovery time of 2 s and a well-damped transient response. In contrast, the PID controller, under normal conditions, reaches a peak torque of 14,200 Nm within 1 s, leading to stabilization at 194 Nm. However, during the failure, the steady-state torque declines sharply to 100 Nm, leading to a large error of 18%. Then, the recovery time increases to 4 s, and visible oscillations indicate reduced robustness. Finally, the optimal LQR controller achieves a lower steady-state error of 4 Nm as compared to 38 Nm from the PID controller and faster recovery of 2 s for LQR and 4 s for the PID controller.
Figure 10b illustrates the controller’s response under normal and two-motor failure conditions. During normal conditions, the optimal LQR controller shows a peak torque of 13,299 Nm and settles at a steady-state torque of 202 Nm, maintaining a response with minimal steady-state error. Under two-motor failure conditions, the torque stabilizes at 164 Nm, resulting in a steady-state error of 6 Nm. The recovery time extends slightly to 4 s, but the system remains well-damped without excessive overshoot. In comparison, the PID controller peaks at 14,000 Nm under normal conditions and stabilizes around 158 Nm. When failure occurs, the torque drops to 140 Nm, producing a maximum error of 44 Nm, with a slower recovery time of 5 s. As a result, optimal LQR achieves a lower steady-state error of 8 Nm, as compared to 52 Nm from the PID controller, and recovers quickly. Figure 10c shows controller responses under normal conditions and three-motor failures. For a reference of 40 m/s during normal conditions, optimal LQR manages the torque trajectory efficiently, with a peak torque of 13,000 Nm and a steady-state torque of 194 Nm. The controller stabilizes at 194 Nm, keeping the steady-state error as low as 8 Nm with a recovery time of 4 s. The motor torque response of PID peaks at 13,800 Nm and dips with speed during the failure at 120 Nm, and the response degrades, with a steady-state torque of 150 Nm, resulting in a significant steady-state error of 52 Nm. The recovery takes over 12 s, and the transient response shows periodic dips, reflecting inadequate handling of the disturbance. The optimal LQR maintains a steady-state error of 8 Nm and quicker recovery, proving better robustness than PID, even under three-motor failure conditions.

3.2.2. Motor Current

The motor current responses of the controllers at a vehicle speed of 40 m/s of a 4WID-EV under normal, one-motor failure, two-motor failure, and three-motor failure conditions are shown in Figure 10. In Figure 11a both the controllers converge toward the reference current. However, the optimal LQR controller exhibits a sharper transient response, with an initial peak current of 5800 A at 1.4 s, quickly stabilizing to a steady state of 90 A at 7 s with minimal steady-state error. Conversely, the PID controller reaches a lower peak of 5800 A at 1.5 s and settles at a slightly reduced steady-state current of 90 A at 14.5 s, respectively. In Figure 11b, the optimal LQR controller’s motor current response increases to 5800 A at 1.6 s, while the steady-state current remains at 90 A at 7.1 s, maintaining a small error margin of <1%. The PID controller shows increased oscillation and a modest rise in steady-state current to 65 A at 15.2 s, with a steady-state error of about 27%.
As seen in Figure 11c, with three motor failure conditions, the optimal LQR controller continues to deliver a stable and resilient response. The peak current rises marginally to 5800 A at 1.8 s, and the steady-state current holds around 90 A at 7.3 s, reflecting a minor increase in the steady-state error. The PID controller, however, begins to show deterioration: the peak current remains at 5800 A at 1.9 s, but the steady-state current deviates to 75 A at 17.5 s, resulting in an increased steady-state error. However, the PID controller fails to stabilize the system effectively, showing cumulative growth in motor current. These results indicate that the optimal LQR controller consistently provides faster stabilization, reduced steady-state error, and higher fault tolerance.

3.2.3. Motor Speed

The controller’s motor speed responses at a vehicle speed of 40 m/s are shown in Figure 12. Figure 12a shows the controller’s motor speed response under normal conditions and one motor failure. Under normal conditions, the optimal LQR controller results in a smooth acceleration, reaching a steady-state speed of 1900 m/s with a significant overshoot of 1.5%. The system settles within 5 s, with a peak speed of 1930 m/s at 3.5 s and a reduced steady-state error. For the PID controller, the system initially overshoots, reaching a peak speed of 1975 m/s at 2.8 s. It exhibits mild oscillation and stabilizes at 1900 m/s. During one motor failure, the optimal LQR controller demonstrates maximum motor speed up to 1885 m/s at 3.7 s, with the system settling at 1850 m/s. The steady-state error increases modestly to 2.6%. In contrast, the PID controller’s maximum motor speed response produces 3700 m/s at 4.2 s, and stabilizes at 1740 m/s, indicating a steady-state error of 8.4%. The results indicate that the damping is reduced, with a decline in speed tracking accuracy. In Figure 12b, the motor speed response using the controllers under normal conditions and two motor failures is illustrated. With two motor failures, the optimal LQR controller yields a peak of 1855 m/s at 3.9 s, with a final steady-state speed of 1800 m/s, resulting in a steady-state error of 2.1%. For the PID controller, the response is less stable and reaches a maximum speed of 3900 m/s at 4.8 s, then drops to a steady-state speed of 1650 m/s, resulting in a steady-state error of 13.2%. In Figure 12c, the motor speed response under normal conditions and three motor failures are shown. Under three-motor failures, the optimal LQR controller retains the peak speed of 1800 m/s at 4.2 s, with a steady-state speed of 1750 m/s, resulting in a steady-state error of 7.9%. The PID controller becomes significantly unstable and peaks at 5100 m/s at 5 s but stabilizes insignificantly at 1580 m/s, yielding a steady-state error of 20%.
The comparative analysis shows that the optimal LQR controller maintains higher motor speeds, achieves closer convergence to reference inputs, and minimizes steady-state error under both normal and failure conditions compared to the PID controller. While the PID controller suffers from high steady-state errors (above 7% in all cases), the optimal LQR controller maintains acceptable error margins under failure conditions (2.63% for one-motor failure, 5.26% for two-motor failure, and 7.89% for three-motor failure). The optimal LQR also exhibits smoother and more stable dynamic behavior, with lower overshoots observed in PID control.

3.2.4. Vehicle Speed

Figure 13 compares the vehicle speed responses of the optimal LQR and PID controllers at a reference speed of 40 m/s. Figure 13a displays the vehicle speed of the controller responses for one motor failure condition. The vehicle speed of the controllers’ responses has a reference input of 40 m/s from 0 to 60 s. The optimal LQR controller’s response for vehicle speed under one motor failure and normal conditions is 39.5 m/s (at 6 s) and 40 m/s (at 5 s), respectively, by achieving a minimal overshoot of 0.5%. In contrast, the PID controller’s response for the vehicle speed under one motor failure and normal conditions is 37.5 m/s (at 14 s) and 40 m/s (at 12 s), respectively, by achieving an overshoot of about 4 and 3.5% respectively.
Figure 13b illustrates the controller’s responses for two motor failure conditions. The response of the optimal LQR controller for the vehicle speed varied from 0 to 60 s for a reference input of 20 m/s. Owing to two motor failures at 35 s, the vehicle speed stabilized at a maximum of 39.2 m/s at 7 s with a minimal overshoot of 0.6%. In contrast, the PID controller response achieves a vehicle speed of 36 m/s (at 16 s) by producing a larger overshoot of 5%. Figure 13c presents the controller’s responses for three motor failure conditions. The optimal LQR controller response achieves a vehicle speed of 38.5 m/s at 8 s, which results in an overshoot of 6.5%. Conversely, the PID controller’s response for a vehicle speed of 34 m/s at 18 s produces an overshoot of 6.5%. As a result, the PID controller produces substantial error and instability for fault-tolerant scenarios, while the optimal LQR controller offers lower steady-state error and faster stabilization. Thus, the optimal LQR controller is better suited for vehicle speed regulation in 4WID-EVs, particularly under failure conditions.

3.3. Time Domain Analysis of PID vs. Optimal LQR in 4WID-EV Under 0–3 Motor Fault at Reference Speeds of 20 and 40 m/s

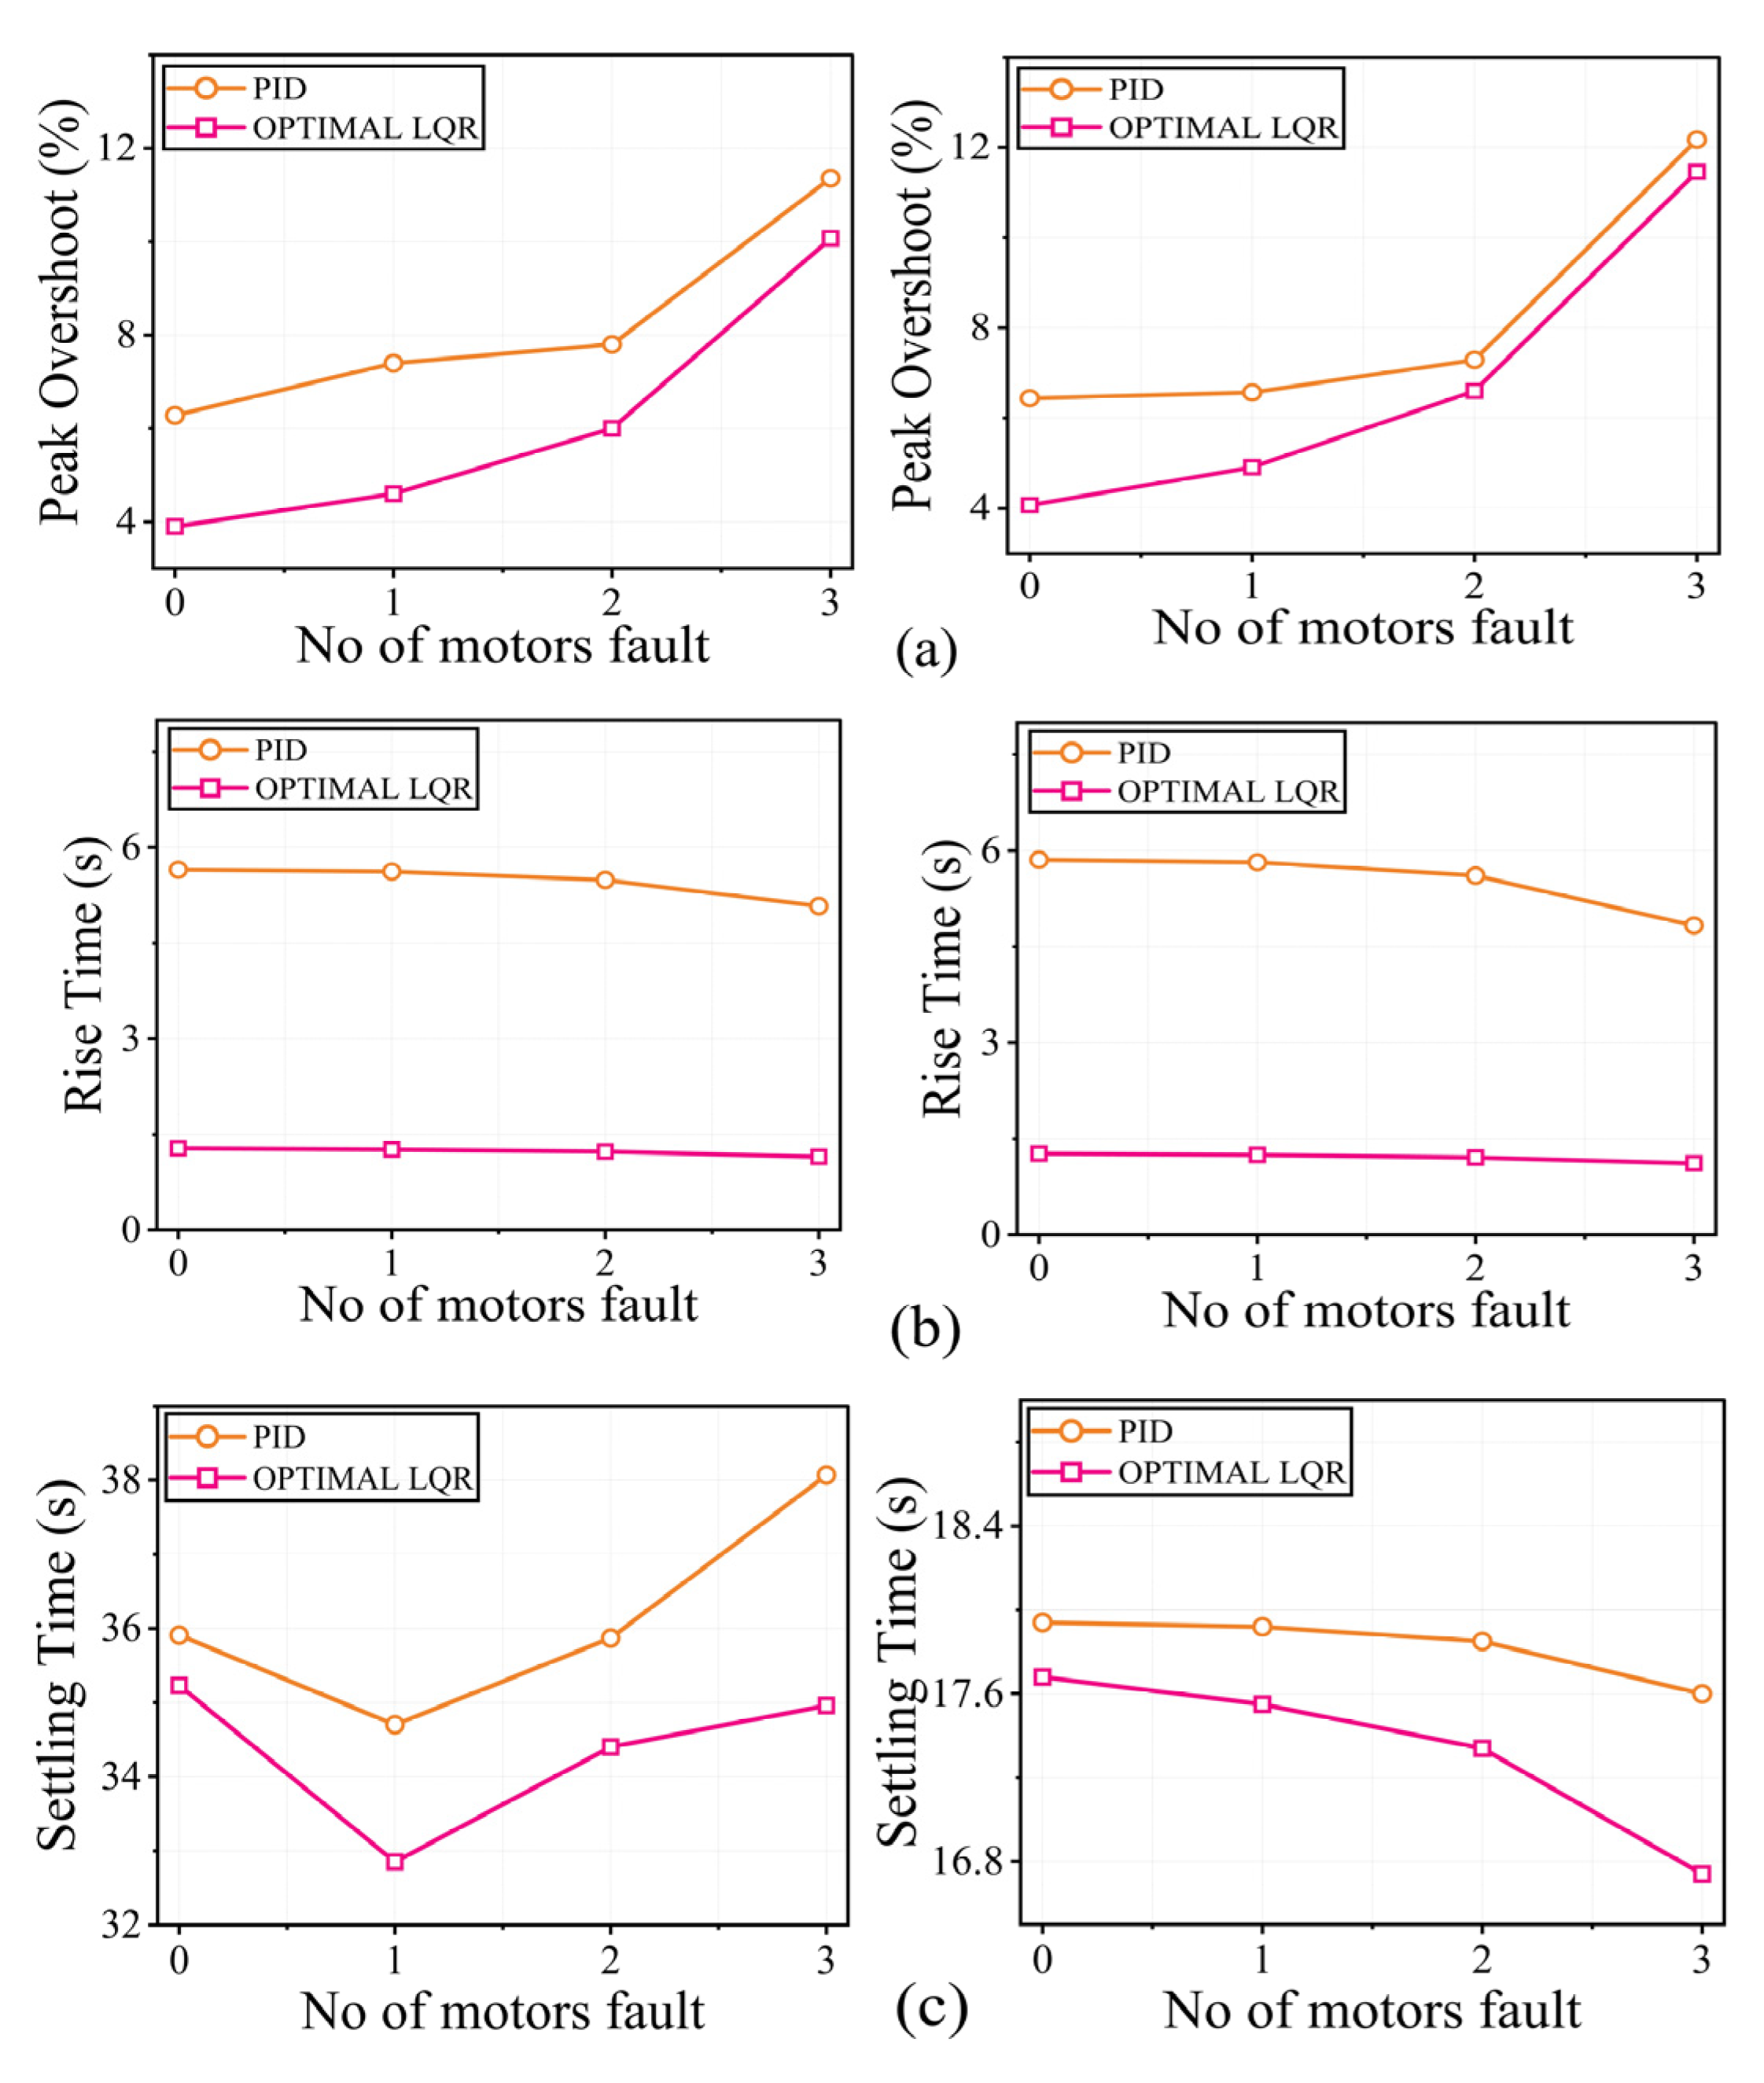
Figure 14 compares the analysis part of the time domain specification of PID vs. optimal LQR at vehicle speeds of 20 m/s (left) and 40 m/s (right). Figure 14a displays the peak overshoot response of various controllers used for 0–3 motor faults. Under all motor fault conditions, the optimal LQR controller consistently achieves lower peak overshoot for the 20 m/s and 40 m/s reference inputs. Both controllers have very little overshoot at zero motor faults. Still, when faults increase, the PID controller’s overshoot rises more quickly, reaching about 12% under three motor faults at 40 m/s, while the LQR controller’s overshoot is only about 10%. This pattern indicates that, particularly under degraded settings, the LQR controller offers more damped and stable performance. Figure 14b demonstrates that, independent of motor faults or velocity, the rise time for the optimal LQR controller stays relatively constant (~2 s). On the other hand, the PID controller’s rise time noticeably increases, particularly at higher fault circumstances. As motor faults increase from 0 to 3, the rise time goes from 5.6 to 6.2 s at 20 m/s and from 5.8 to 6.5 s at 40 m/s. This indicates that the LQR controller is more responsive and impervious to performance loss in fault conditions. The settling time for the PID controller rises significantly with faults for 20 m/s (left) in Figure 14c, approaching 39 s for three motor faults, but the LQR controller remains below 35 s. Although both controllers exhibit longer settling times with faults at 40 m/s (right) in Figure 14c, the LQR retains faster settling, concluding at about 16.7 s with three motor faults instead of 17.8 s for PID. Overall, the result suggests that optimal LQR reduces oscillations and transients while providing faster stability.

3.4. Sensitivity Analysis of the Model for Various Reference Input (20 and 40 m/s)

Sensitivity analysis was carried out for the different reference inputs. We tested 20 and 40 m/s through a simulation environment to observe the significant impact of a ±10% variation in the vehicle’s mass (1377 and 1683 kg) using SIMULINK MATLAB version 2024a software (settings: rolling resistance, Cr, 0.009). The observed impacts on motor torque, current, speed, and vehicle speed when subjected to a coupled motor fault (coupled front left and rear right) and three motor faults are of the utmost importance in understanding the system’s behavior under fault conditions.

3.4.1. Response of a Proposed Optimal LQR Controller for Coupled In-Wheel Motor Fault Conditions at a Reference Speed, 20 m/s, and 40 m/s

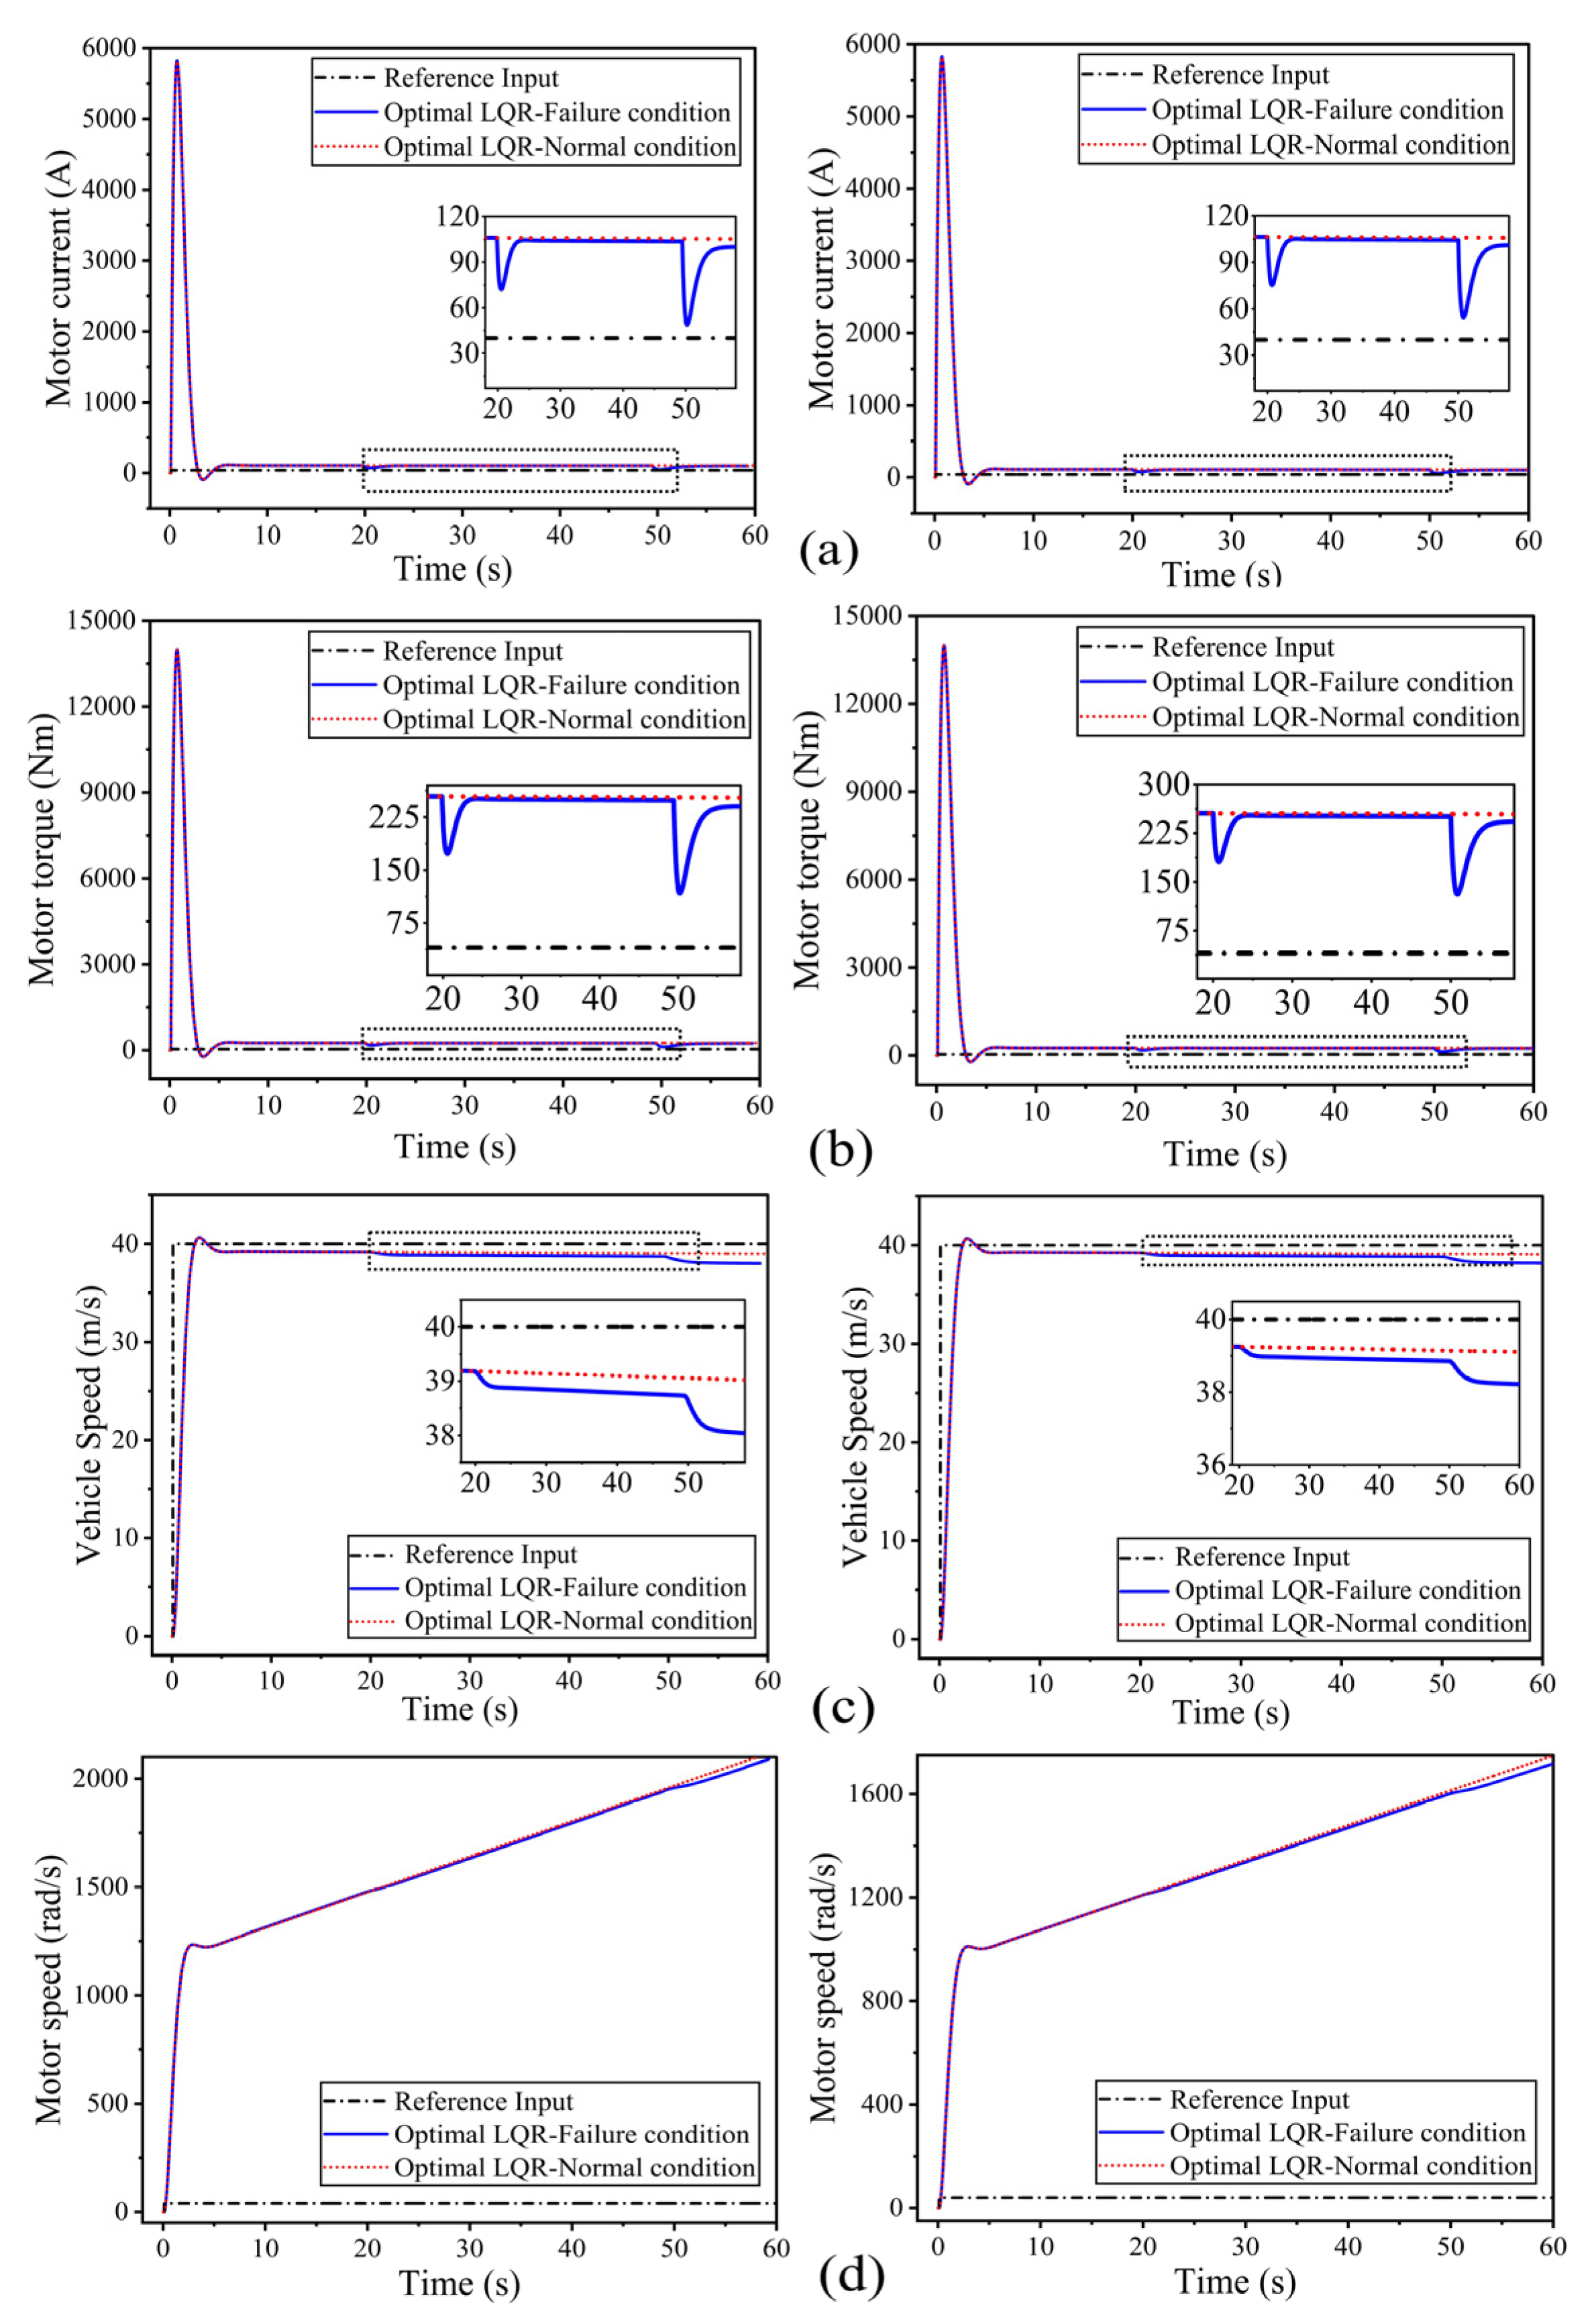
Figure 15 depicts the responses of the optimal LQR at a reference speed of 20 m/s for coupled in-wheel motor fault conditions (front left and rear left). The optimal LQR controller keeps the system stable while experiencing a slight decline in performance. During failure episodes at 20 s and 50 s, the motor current exhibits discernible decreases (~20 A) after initially peaking at 2800 A. During faults, torque increases to 6800 Nm, decreases to almost 0 Nm, and then rises to roughly 75 Nm. Increased rolling resistance and inertial factors cause the vehicle’s speed to reduce by 2.5%, to about 19.5 m/s. The motor speed rarely deviates from its stable range of 750 rad/s. The LQR achieves satisfactory dynamic recovery with a settling time of about 8 s and fault recovery in 4–5 s, even with increasing mass and resistance.
Figure 16 presents the responses of the optimal LQR for motor torque, current, speed, and vehicle speed at a reference speed of 40 m/s. The LQR controller retains performance with only slight degradation at a reference input of 40 m/s with coupled motor failures. The motor current first peaks at about 5800 A and then drops to about 30 A at 20 s and 50 s fault intervals. At each failure, the torque drops to about 0 Nm after reaching up to 13,000 Nm, with a steady-state recovery of about 225 Nm. Due to higher rolling resistance and decreased torque availability, the vehicle’s speed decreases by approximately 3% from its initial starting point of 40 m/s to 38.8 m/s. Under fault circumstances, the motor speed stays constant at about 1900 rad/s, deviating by less than 2%. Despite increased mass and resistance, the LQR controller manages two faults with a settling time of about 9 s and fault recovery in less than 5 s, guaranteeing satisfactory speed tracking and torque balancing.

3.4.2. Response of a Proposed Optimal LQR Controller for Three In-Wheel Motor Fault Conditions at a Reference Speed, 20 m/s, and 40 m/s

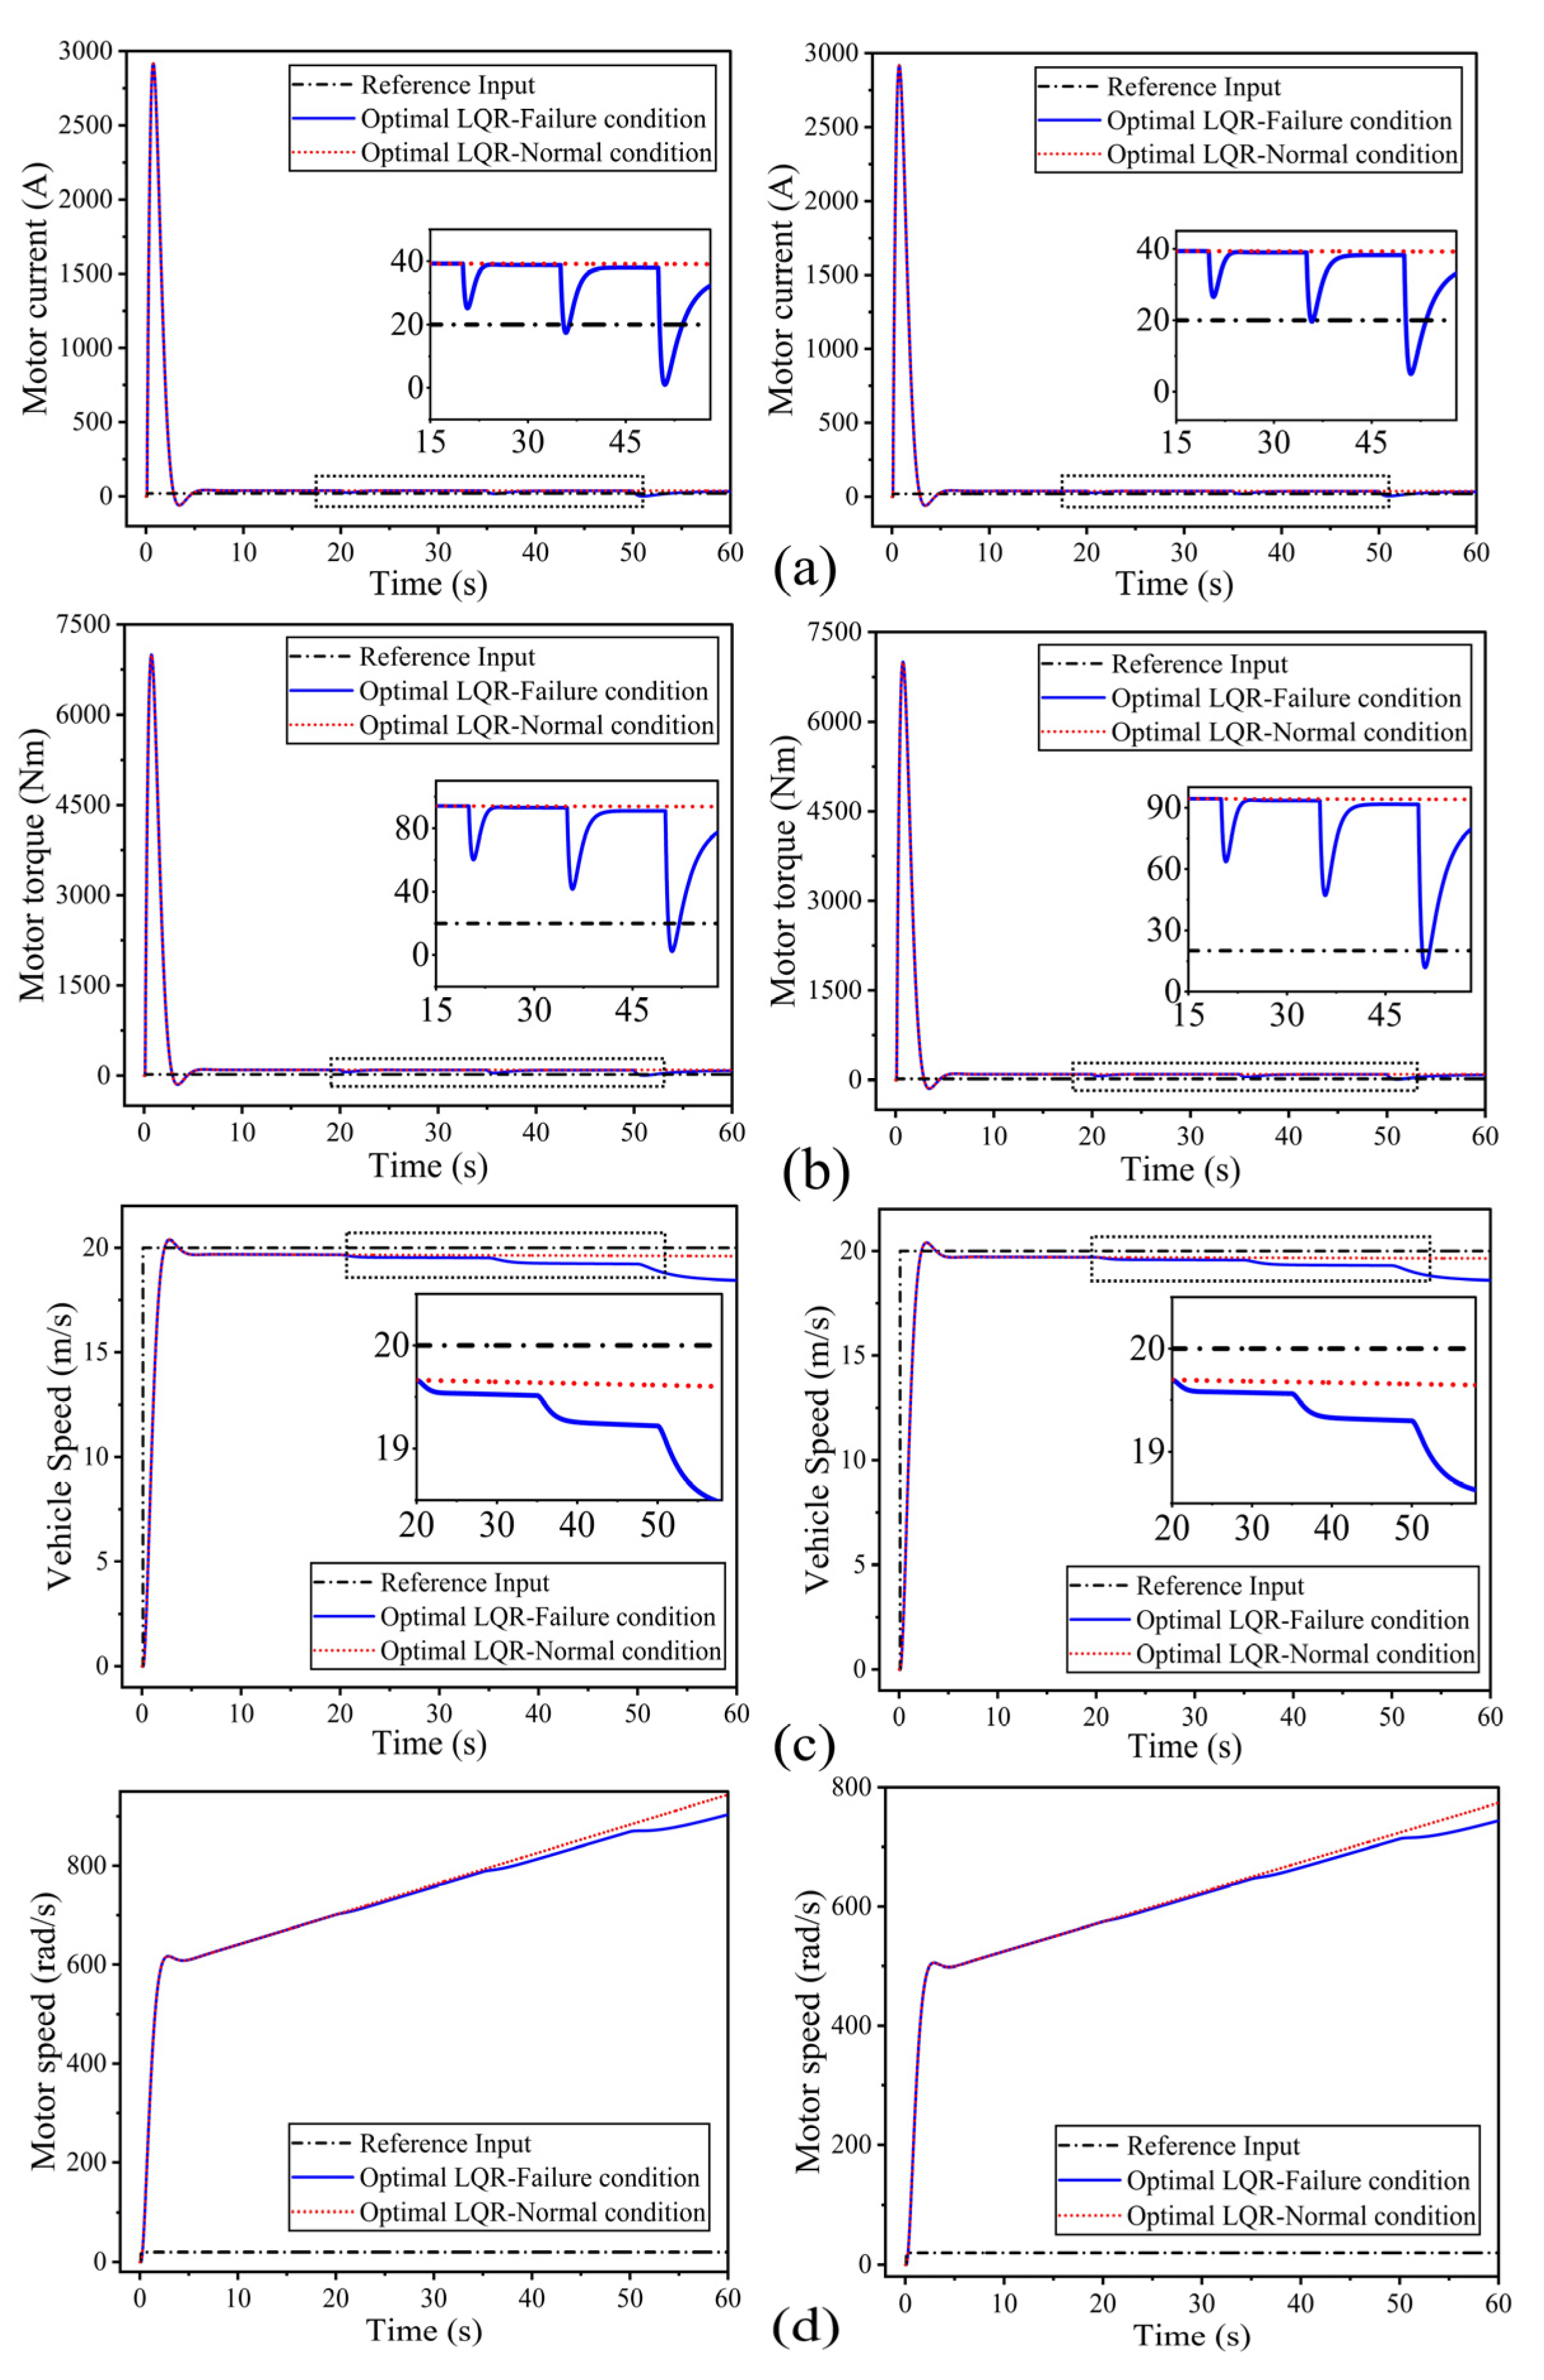
Figure 17 shows the responses of the optimal LQR for motor torque, current, speed, and vehicle speed at a reference speed of 20 m/s for three in-wheel motor failures. The LQR controller faces greater difficulties when there are three motor failures. During faults, the motor current dips deeper and longer, reaching 0 A. The motor current peaks at 2700 A. At each problem, the torque drops abruptly and gradually recovers to 70 Nm after initially reaching 7200 Nm but fails to sustain. A 5% decrease in vehicle speed, to about 19.0 m/s, is caused by increased rolling resistance and restricted torque availability. The motor speed deviates more from the typical situation and settles at 780 rad/s. LQR control under high mass and resistance becomes less efficient in severe fault scenarios, as seen by the settling time of around 10 s and the slower recovery after the fault (6–8 s).
Figure 18 represents the responses of the optimal LQR for motor torque, current, speed, and vehicle speed at a reference speed of 40 m/s for three in-wheel motor fault conditions. The LQR controller maintains system integrity under increased stress in the more serious case of three motor failures at 40 m/s. Although the torque quickly collapses to zero after each fault event, the system recovers efficiently to roughly 200 Nm, supported by swift current regulation and optimum control actions. Even if the vehicle speed drops to about 37 m/s (about 7.5% deviation), it still stays within reasonable bounds, demonstrating the LQR’s capacity to manage significant torque deficits. Despite a modest increase in recovery time (6–8 s), the controller maintains overall system stability and guarantees smooth deterioration as the motor speed stabilizes at about 1700 rad/s. This performance under increased rolling resistance and mass solidifies the LQR’s position as a dependable and effective real-time fault-tolerant control system in high-speed 4WID-EVs.
The PID and LQR controllers’ performance is tabulated in Table 2. The proposed controller, with gains of K1 = 60 and K2 = 100, has a settling time of 0.13 s, an overshoot of 0.27%, a mean error of 0.0441 rad/s2, and an MSE of 0.0820 rad/s2, while the PID controller with gains of Kp = 60 and Ki = 100 has the same settling time of 0.13 s, but higher overshoot of 0.33%, mean error of 0.0674 rad/s2, and MSE of 0.1050 rad/s2. The comparison result indicates that the proposed controller (optimal LQR) provides better results than the PID controller.

4. Conclusions and Future Work

4.1. Conclusions

Implementing PID and optimal LQR controllers can improve the motor’s failure scenario in 4WID-EVs. The proposed optimal enhanced LQR is even more effective in tuning the regulated vehicle speed, with faster recovery after the failure occurs. The key contributions and findings from this study are summarized as follows:
  • The controller was designed explicitly for 4WID electric vehicles, and the modeling environment was developed and tested under various conditions.
  • The proposed optimal LQR controller demonstrated better tracking performance, accurately following the desired speed profile across varying trajectories. A comparative analysis with a conventional PID controller revealed that the optimal LQR consistently outperformed PID in terms of maximum attainable speed, stability, and responsiveness, particularly at elevated speeds.
  • During the transient phases for step inputs at 20 m/s and 40 m/s, the system exhibited short-duration peaks in motor torque (up to 6900 Nm and 14,200 Nm) and current (up to 5580 A and 5800 A), respectively. Despite these transient peaks, the system remained stable and quickly settled to nominal operating ranges (approximately 60–100 Nm and 50–90 A).
  • The proposed controller predictions are better in terms of settling time, overshoot, mean error, and MSE than the conventional PID controller, indicating enhanced stability and accuracy.

4.2. Future Work

Implementing PID and optimal LQR controllers can improve the motor’s failure scenario in 4WID-EVs. The simulation’s peak torque and current transients will be verified under actual hardware limitations, such as sensor noise, torque saturation, and inverter limits. Furthermore, a hybrid LQR–SMC controller will be created to improve resilience in the event of serious motor failures. To prepare for real-world implementation in 4WID-EVs, simulation and HIL testing will be conducted for both optimal LQR and LQR–SMC techniques.

Author Contributions

Conceptualization, S.D. and M.R.M.I.; methodology, S.D.; software, and validation, S.D. and M.R.M.I.; investigation, M.R.M.I.; writing—original draft preparation, S.D.; supervision, writing—review, M.R.M.I.; visualization, M.R.M.I. All authors have read and agreed to the published version of the manuscript.

Funding

This research received no external funding.

Data Availability Statement

The original contributions presented in this study are included in the article. Further inquiries can be directed to the corresponding author.

Acknowledgments

The authors express their gratitude to SRM Institute of Science and Technology, for providing the essential facilities and support for the completion of the research work.

Conflicts of Interest

The authors declare no conflicts of interest.

Abbreviations

4WID-EVFour-wheel independent drive electric vehicle
PMSMPermanent magnet synchronous motor
BLDCBrushless direct current
LQRLinear quadratic regulator
PIDProportional integral derivative
MRACModel reference adaptive control
SMCSliding mode control
PSOParticle swarm optimization
SBWSteer-by-wire
CR-GWO-PIDChaotic random grey-wolf-optimization-based proportional integral derivative
IGBTInsulated gate bipolar transistor
EVsElectric vehicles
ICEVsInternal combustion engine vehicles
PIProportional integral
MPCModel predictive control
DCDirect current
AREAlgebraic Riccati equation

References

  1. Wahid, M.R.; Budiman, B.A.; Joelianto, E.; Aziz, M. A Review on Drive Train Technologies for Passenger Electric Vehicles. Energies 2021, 14, 6742. [Google Scholar] [CrossRef]
  2. Hossain, M.d.; Kumar, L.; Islam, M.; Selvaraj, J. A Comprehensive Review on the Integration of Electric Vehicles for Sustainable Development. J. Adv. Transp. 2022, 2022, 3868388. [Google Scholar] [CrossRef]
  3. Lulhe, A.M.; Date, T.N. A technology review paper for drives used in electrical vehicle (EV) & hybrid electrical vehicles (HEV). In Proceedings of the 2015 International Conference on Control, Instrumentation, Communication and Computational Technologies (ICCICCT), Kumaracoil, India, 18–19 December 2015; pp. 632–636. [Google Scholar] [CrossRef]
  4. Khurana, A.; Kumar, V.V.; Sidhpuria, M. A Study on the Adoption of Electric Vehicles in India: The Mediating Role of Attitude. Vision J. Bus. Perspect. 2020, 24, 23–34. [Google Scholar] [CrossRef]
  5. Singh, A.P.; Kumar, Y.; Sawle, Y.; Alotaibi, M.A.; Malik, H.; Márquez, F.P.G. Development of artificial Intelligence-Based adaptive vehicle to grid and grid to vehicle controller for electric vehicle charging station. Ain Shams Eng. J. 2024, 15, 102937. [Google Scholar] [CrossRef]
  6. Baidya, D.; Dhopte, S.; Bhattacharjee, M. Sensing system assisted novel PID controller for efficient speed control of DC motors in electric vehicles. IEEE Sens. Lett. 2023, 7, 1–4. [Google Scholar] [CrossRef]
  7. Ahmed, I.; Adnan, M.; Ali, M.; Kaddoum, G. Supertwisting sliding mode controller for grid-to-vehicle and vehicle-to-grid battery electric vehicle charger. J. Energy Storage 2023, 70, 107914. [Google Scholar] [CrossRef]
  8. Vignesh, R.; Ashok, B.; Kumar, M.S.; Szpica, D.; Harikrishnan, A.; Josh, H. Adaptive neuro fuzzy inference system-based energy management controller for optimal battery charge sustaining in biofuel powered non-plugin hybrid electric vehicle. Sustain. Energy Technol. Assess. 2023, 59, 103379. [Google Scholar] [CrossRef]
  9. Mathesh, G.; Saravanakumar, R. A novel intelligent controller-based power management system with instantaneous reference current in hybrid energy-fed electric vehicle. IEEE Access 2023, 11, 137849–137865. [Google Scholar] [CrossRef]
  10. Charest-Finn, M.; Pejhan, S. Model Predictive Control Used in Passenger Vehicles: An Overview. Machines 2024, 12, 773. [Google Scholar] [CrossRef]
  11. Wang, W.; Yuan, S.; Yang, C.; Zhang, Y. A robust MPC-based vehicle stability control strategy for four-wheel independent drive electric vehicles considering IGBT thermal effect. Nonlinear Dyn. 2025, 113, 6893–6906. [Google Scholar] [CrossRef]
  12. Peng, H.; Wang, W.; Xiang, C.; Li, L.; Wang, X. Torque coordinated control of four in-wheel motor independent-drive vehicles with consideration of the safety and economy. IEEE Trans. Veh. Technol. 2019, 68, 9604–9618. [Google Scholar] [CrossRef]
  13. Xu, X.; Wang, M.; Xiao, P.; Ding, J.; Zhang, X. In-wheel motor control system for four-wheel drive electric vehicle based on CR-GWO-PID control. Sensors 2023, 23, 8311. [Google Scholar] [CrossRef]
  14. Guo, M.; Bao, C.; Cao, Q.; Xu, F.; Miao, X.; Wu, J. Fault-Tolerant Control Study of Four-Wheel Independent Drive Electric Vehicles Based on Drive Actuator Faults. Machines 2024, 12, 450. [Google Scholar] [CrossRef]
  15. Lu, Y.; Liang, J.; Zhuang, W.; Yin, G.; Feng, J.; Zhou, C. Four-wheel independent Drive Vehicle Fault Tolerant Strategy Using Stochastic Model Predictive Control with Model Parameter Uncertainties. IEEE Trans. Veh. Technol. 2023, 73, 3287–3299. [Google Scholar] [CrossRef]
  16. Shen, Y.; Zhao, Y.; Deng, H.; Lin, F.; Shen, H. Coordinated control of stability and economy of distributed drive electric vehicle based on Lyapunov adaptive theory. Proc. Inst. Mech. Eng. Part D J. Automob. Eng. 2024, 238, 1535–1549. [Google Scholar] [CrossRef]
  17. Han, Q.; Liu, C.; Zhao, J.; Liu, H. The Fault-Tolerant Control Strategy for the Steering System Failure of Four-Wheel Independent By-Wire Steering Electric Vehicles. World Electr. Veh. J. 2025, 16, 183. [Google Scholar] [CrossRef]
  18. Zhou, Z.; Zhang, G.; Chen, M. A Fault-Tolerant Control Strategy for Distributed Drive Electric Vehicles Based on Model Reference Adaptive Control. Actuators 2024, 13, 486. [Google Scholar] [CrossRef]
  19. Liang, Y.; Dong, H.; Li, D.; Song, Z. Adaptive eco-cruising control for connected electric vehicles considering a dynamic preceding vehicle. eTransportation 2024, 19, 100299. [Google Scholar] [CrossRef]
  20. Deepak, K.; Mandal, R.K.; Verma, V. Novel Aggregated Controller of Wind and PV based Grid Connected Charging Station for Electric Vehicle. Int. J. Power Electron. Drive Syst. (IJPEDS) 2023, 14, 2319–2327. [Google Scholar] [CrossRef]
  21. Kannan, R.; Sundharajan, V. A novel MPPT controller based PEMFC system for electric vehicle applications with interleaved SEPIC converter. Int. J. Hydrogen Energy 2023, 48, 14391–14405. [Google Scholar] [CrossRef]
  22. Peng, H.; Wang, W.; An, Q.; Xiang, C.; Li, L. Path tracking and direct yaw moment coordinated control based on robust MPC with the finite time horizon for autonomous independent-drive vehicles. IEEE Trans. Veh. Technol. 2020, 69, 6053–6066. [Google Scholar] [CrossRef]
  23. Li, Z.; Jiao, X.; Zhang, T. Robust H∞ Output Feedback Trajectory Tracking Control for Steer-by-Wire Four-Wheel Independent Actuated Electric Vehicles. World Electr. Veh. J. 2023, 14, 147. [Google Scholar] [CrossRef]
  24. Lu, S.; Wu, Q.; Zhang, J.; Liu, B.; Chu, Z.; Yang, W. Fault-tolerant control of electric vehicle based on integral fast terminal sliding mode. Proc. Inst. Mech. Eng. Part D J. Automob. Eng. 2025, 09544070241310952. [Google Scholar] [CrossRef]
  25. Chen, X.; Qu, Y.; Cui, T.; Zhao, J. Nonlinear hierarchical control for four-wheel-independent-drive electric vehicle. Complex Eng. Syst. 2023, 3, 8. [Google Scholar] [CrossRef]
  26. Djouadi, H.; Ouari, K.; Belkhier, Y.; Lehouche, H. Real-Time HIL Simulation of Nonlinear Generalized Model Predictive-Based High-Order SMC for Permanent Magnet Synchronous Machine Drive. Int. Trans. Electr. Energy Syst. 2024, 2024, 5536555. [Google Scholar] [CrossRef]
  27. Naqvi, S.S.A.; Jamil, H.; Iqbal, N.; Khan, S.; Lee, D.I.; Park, Y.C.; Kim, D.H. Multi-objective optimization of PI controller for BLDC motor speed control and energy saving in Electric Vehicles: A constrained swarm-based approach. Energy Rep. 2024, 12, 402–417. [Google Scholar] [CrossRef]
  28. Kumar, M.; Panda, K.P.; Naayagi, R.T.; Thakur, R.; Panda, G. Comprehensive review of electric vehicle technology and its impacts: Detailed investigation of charging infrastructure, power management, and control techniques. Appl. Sci. 2023, 13, 8919. [Google Scholar] [CrossRef]
  29. Jassim, A.A.; Karamb, E.H.; Alic, M.M.E. Design of optimal PID controller for electric vehicle based on particle swarm and multi-verse optimization ALGORITHMS. Eng. Technol. J. 2023, 41, 446–455. [Google Scholar] [CrossRef]
  30. Jia, C.C.; Liu, W.; He, H.W.; Chau, K.T. Superior energy management for fuel cell vehicles guided by improved DDPG algorithm: Integrating driving intention speed prediction and health-aware control. Appl. Energy 2025, 394, 126195. [Google Scholar] [CrossRef]
  31. Reddy, G.S.; Premkumar, M.; Ravi, S.; Abualigah, L. An intelligent converter and controller for electric vehicle drives utilizing grid and stand-alone solar photovoltaic power generation systems. Int. J. Appl. Power Eng. (IJAPE) 2023, 12, 255–276. [Google Scholar] [CrossRef]
  32. Li, Y.; Cai, Y.; Sun, X.; Wang, H.; Jia, Y.; He, Y.; Chen, L.; Chao, Y. Trajectory tracking of four-wheel driving and steering autonomous vehicle under extreme obstacle avoidance condition. Veh. Syst. Dyn. 2024, 62, 601–622. [Google Scholar] [CrossRef]
  33. Serralvo Neto, R.; Palermo, J.B.; Giacomini, R.; Rodrigues, M.; Delatore, F.; Rossi, G.B.; Bühler, R.T. Performance Prediction of a 4WD High-Performance Electric Vehicle Using a Model-Based Torque-Vectoring Approach. World Electr. Veh. J. 2023, 14, 183. [Google Scholar] [CrossRef]
  34. Talbot, J.; Brown, M.; Gerdes, J.C. Shared Control Up to the Limits of Vehicle Handling. IEEE Trans. Intell. Veh. 2024, 9, 2977–2987. [Google Scholar] [CrossRef]
  35. Lee, K.; Lee, M. Fault-tolerant stability control for an independent four-wheel drive electric vehicle under actuator fault conditions. IEEE Access 2020, 8, 91368–91378. [Google Scholar] [CrossRef]
  36. Chen, Q.P.; Xu, W.H.; Lv, Z.Y.; Zeng, D.Q.; Zhong, C.P.; Zeng, X.C. Anti-slip regulation method for electric vehicles with four in-wheel motors based on the identification of slip ratio. Trans. Can. Soc. Mech. Eng. 2024, 48, 15–25. [Google Scholar] [CrossRef]
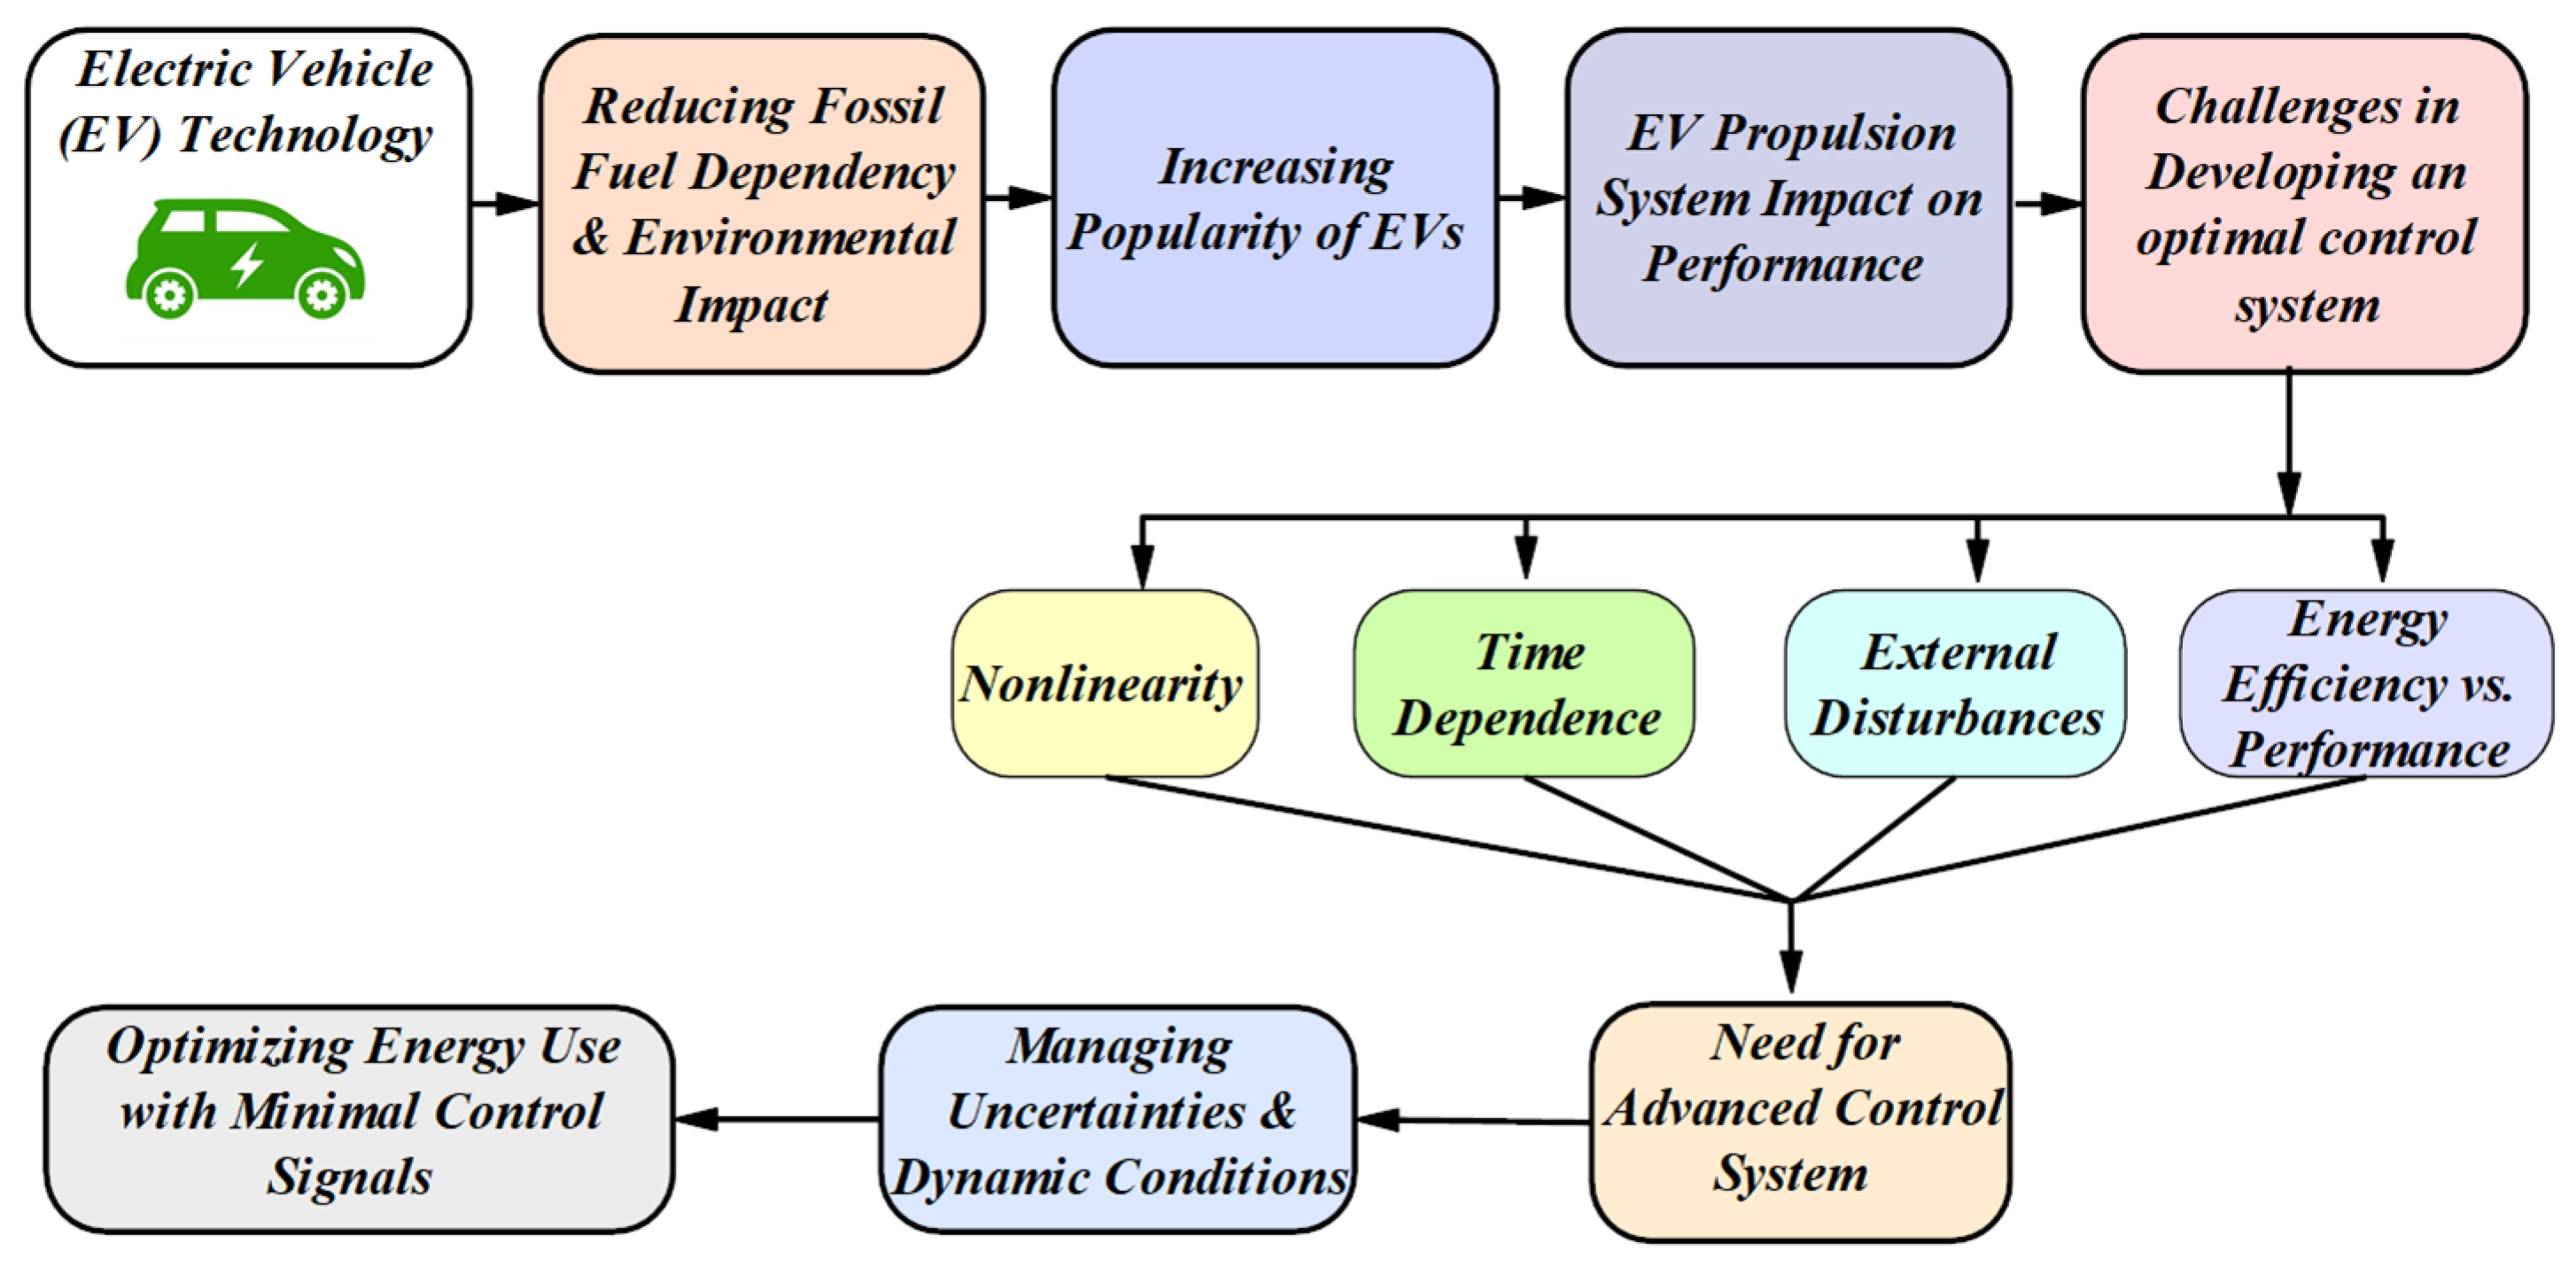
Figure 1. Major challenges encountered in the EV.
Wevj 16 00470 g001
Figure 2. Schematic of the optimal LQR control system for controlling a single motor drive.
Wevj 16 00470 g002
Figure 3. Design of optimal LQR for 4WID−EV under failure cases.
Wevj 16 00470 g003
Figure 4. Proposed LQR controller design for a 4WID−EV.
Wevj 16 00470 g004
Figure 5. Flow diagram of proposed switching control unit in 4WID-EV.
Wevj 16 00470 g005
Figure 6. Comparison of motor torque at vehicle speed of 20 m/s: optimal LQR (left) and PID (right) with (a) 1-motor failure, (b) 2-motor failure, and (c) 3-motor failure.
Wevj 16 00470 g006
Figure 7. Comparison of motor current at vehicle speed of 20 m/s: optimal LQR (left) and PID (right) with (a) 1-motor failure, (b) 2-motor failure, and (c) 3-motor failure.
Wevj 16 00470 g007
Figure 8. Comparison of motor speed at vehicle speed of 20 m/s: optimal LQR (left) and PID (right) with (a) 1-motor failure, (b) 2-motor failure, and (c) 3-motor failure.
Wevj 16 00470 g008
Figure 9. Comparison of vehicle speed at vehicle speed of 20 m/s: optimal LQR (left) and PID (right) with (a) 1-motor failure, (b) 2-motor failure, and (c) 3-motor failure.
Wevj 16 00470 g009
Figure 10. Comparison of motor torque at vehicle speed of 40 m/s: optimal LQR (left) and PID (right) with (a) 1-motor failure, (b) 2-motor failure, and (c) 3-motor failure.
Wevj 16 00470 g010
Figure 11. Comparison of motor current at vehicle speed of 40 m/s: optimal LQR (left) and PID (right) with (a) 1-motor failure, (b) 2-motor failure, and (c) 3-motor failure.
Wevj 16 00470 g011
Figure 12. Comparison of motor speed at vehicle speed of 40 m/s: optimal LQR (left) and PID (right) with (a) 1-motor failure, (b) 2-motor failure, and (c) 3-motor failure.
Wevj 16 00470 g012
Figure 13. Comparison of vehicle speed over time at reference vehicle speed of 40 m/s: optimal LQR (left) and PID (right) with (a) 1-motor failure, (b) 2-motor failure, and (c) 3-motor failure.
Wevj 16 00470 g013
Figure 14. Comparison of time domain analysis at vehicle speeds of 20 m/s (left) and 40 m/s (right) for optimal LQR and PID, showing (a) peak overshoot, (b) rise time, and (c) settling time.
Wevj 16 00470 g014
Figure 15. Optimal LQR response under coupled motor faults for mass variation (1377 kg—(left); 1683 kg—(right)) with Cr = 0.009 at 20 m/s: (a) motor current, (b) motor torque, (c) vehicle speed, (d) motor speed.
Wevj 16 00470 g015
Figure 16. Optimal LQR response under coupled motor faults for mass variation (1377 kg—(left); 1683 kg—(right)) with Cr = 0.009 at 40 m/s: (a) motor current, (b) motor torque, (c) vehicle speed, (d) motor speed.
Wevj 16 00470 g016
Figure 17. Optimal LQR response under three motor faults for mass variation (1377 kg—(left); 1683 kg—(right)) with Cr = 0.009 at 20 m/s: (a) motor current, (b) motor torque, (c) vehicle speed, (d) motor speed.
Wevj 16 00470 g017
Figure 18. Optimal LQR response under three in-wheel motor faults for mass variation (1377 kg—(left); 1683 kg—(right)) with Cr = 0.009 at 40 m/s: (a) motor current, (b) motor torque, (c) vehicle speed, (d) motor speed.
Wevj 16 00470 g018
Table 1. Parameters of motor and vehicle.
Motor ParametersValuesVehicle ParametersValues
Resistance, R10.004 ΩMass of the vehicle, M11530 Kg
Inductance, L10.0016 HGrade angle, α
Moment of inertia, J14.31 Kg/m2Rolling resistance, Cr0.01
Moment of inertia, J28.63 Kg/m2Air density, ρ1.225 Kg/m3
Moment of inertia, J312.93 Kg/m2Vehicle speed, Vv(20–40) m/s
Back emf, Kb10.1wind speed, Vw(20–40) m/s
Torque constant, Kt10.042Air drag coefficient, CD0.29 m3
Friction coefficient, b11Gravitational acceleration, g9.81 m/s2
Maximum torque @ 20 m/s 55 Nm Frontal   area ,   A f 2.1 m2
Maximum torque @ 40 m/s 194 Nm
Maximum speed @ 20 m/s770 m/s
Maximum speed @ 40 m/s1750 m/s
Table 2. Comparison of controller performance.
ControllerGainSettling
Time (s)
Overshoot
(%)
Mean Error (rad/s)MSE
(rad/s2)
PIDKp = 60,
Ki = 100
0.130.330.06740.1050
Proposed
(Optimal LQR)
K1 = 60,
K2 = 100
0.130.270.04410.0820
Disclaimer/Publisher’s Note: The statements, opinions and data contained in all publications are solely those of the individual author(s) and contributor(s) and not of MDPI and/or the editor(s). MDPI and/or the editor(s) disclaim responsibility for any injury to people or property resulting from any ideas, methods, instructions or products referred to in the content.