Article

Electrify the Field: Designing and Optimizing Electric Tractor Drivetrains with Real-World Cycles

Institute of Automotive Technology, School of Engineering & Design, Technical University of Munich Boltzmannstrasse 15, 85748 Garching, Germany
*
Author to whom correspondence should be addressed.
World Electr. Veh. J. 2025, 16(8), 463; https://doi.org/10.3390/wevj16080463
Submission received: 12 June 2025 / Revised: 18 July 2025 / Accepted: 10 August 2025 / Published: 14 August 2025

Abstract

The electrification of tractors can increase the self-supply of renewable energy produced on the farm and reduce the operating costs of tractors. However, electric tractors face higher upfront costs than their diesel counterparts, as well as limited operating time. A drivetrain that is highly efficient in a wide range of agricultural applications reduces operating costs and enables long operating times. Thus, we propose a method to design electric tractor drivetrain configurations that incorporates longitudinal dynamic simulations to enable the development of such efficient drivetrains. To represent a diverse application profile, we include real-world load cycles recorded from a 104 kW diesel tractor. Our investigation focuses on the axle-individual drivetrain topology (eAxle) and the central motor topology as the configurations that offer the most promising trade-off between efficiency and complexity. The design method includes the top-down design of the topology including its individual components, such as the inverter, motor, and transmission, which are varied based on the load. Our method derives drivetrains with average efficiencies of 83% for an axle-individual topology with two gears. With a 100 kWh battery, such a drivetrain enables operating times of 7.5 h when fertilizing and 2.4 h when seeding.

1. Introduction

Today’s agricultural industry is expected to meet the food demands of a growing population that is projected to increase to 9.7 billion by 2050 [1], with most of the projected growth occurring in countries of the Global South with nature-dependent livelihoods. Population growth combined with rapid urbanization is already causing considerable pressure on the environment, coupled with increasing demand for water and energy [1]. Regarding the latter, agriculture is highly dependent on fossil fuels. For instance, agriculture accounts for 13% of total diesel consumption in India [2]. Olkkonen et al. [3] states that the substitution of fossil fuels with renewable energy sources can reduce greenhouse gas emissions by 10–25% in the agricultural sector. The majority of fossil fuels are consumed by tractors, as they are one of the most important components for increasing productivity in agriculture [4]. With policymakers and private enterprises looking to drive mechanization to increase agricultural productivity and food security, the projected energy demand for tractors threatens to further increase emissions and dependence on fossil fuels.
While the electrification of vehicles is considered the fastest way to reduce emissions, the electrification of tractors is still in its infancy [5,6]. According to Kivekäs and Lajunen [7] and Beltrami et al. [8], the currently available electric machinery is only suitable for a small niche of farm types. However, because 98% of all farms worldwide and 53% of agricultural land is worked by small- and medium-sized family farms, they are a significant target group that must be supplied with suitable machines to enable sustainable mechanization [9].
The successful development of an appropriate electric drivetrain design for electric tractors is necessary to overcome customer reluctance associated with the technological transition, specifically addressing concerns regarding higher initial investment costs compared to diesel tractors and the constrained operating time resulting from limited battery capacity. The drivetrain is the key in solving both challenges: lowering initial investments by reducing the cost and complexity of drivetrains and enabling high efficiency to achieve longer operating hours with the limited installed battery capacity.

2. State of the Art

The electrification of tractors is gaining momentum, with several manufacturers unveiling prototypes and producing their first machinery [10,11,12,13,14]. Nevertheless, market observations indicate that conversion concepts that merely replace the diesel engine with an electric motor dominate the industry’s concepts [15]. These concepts are not able to utilize the design freedom that has been created by electric drivetrains. Figure 1 presents the designs proposed by industry and research.

2.1. Drivetrain Topology

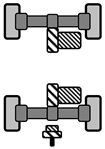
Serrao [16] states the following three topologies as relevant for off-highway machinery: central motor architecture, axle-individual motors, and wheel-individual motors. The latter two are well-known in the automotive sector [17,18]. The dual-motor configuration plays only a role for heavy-duty machinery, especially if a power take-off (PTO) to drive implements is required. The following authors present a more detailed investigation of the different topologies.
Beak et al. [19,20] proposed wheel-individual motors with their research tractor platform. To design their hardware prototype, they developed a simulation of a 120 kW wheel-individual tractor with the simulation model SoftwareX and chose the reduction ratio of the gearbox according to the recording from a diesel tractor during various agricultural operations. They estimate that the tractor could operate for about 2.4 h of plowing. The actual energy consumption normalized to the agricultural operation is not available. Traction tests with the prototype validated the simulation.
Instead of driving each wheel individually, several authors have proposed a dual-motor configuration, which allows for the summation of torque from two motors with a planetary gear.
Cheng et al. [21] compared such a dual-motor drive system with a wheel-individual topology. With their focus on deriving the efficiency of the powertrain, the dual-motor configuration performed better on average than the wheel-individual topology. Li et al. [22] provided a wide torque and speed range for a two-wheel drive tractor by coupling two similar permanent synchronous magnetic (PSM) motors. Chen et al. [23] additionally connected one of the motors to the PTO and investigated the optimum power split between the two motors.
Not only investigating a single topology but addressing the unclear question of the most suitable topology for a 10 t payload wheel loader, Van Dingenen et al. [24] compared the central motor, axle-individual, and wheel-individual topologies. The authors examined the optimal electric drivetrain by comparing the typical load points with the efficiency map of the topology. The investigation favors the central motor architecture because of the increased efficiency due to the well-chosen gear ratio of a two-speed gearbox. The study highlights the importance of a holistic approach by matching the components but does not include different component sizes through scaling and multiple-gear transmissions for the other topologies.
Independent from the topology, several authors propose multi-speed transmissions coupled with electric motors for off-highway purposes: Machado et al. [25] applied them with a central motor, whereas Kampker et al. [26] and Gözen et al. [27] presented them with axle-individual drivetrain. Having at least two gears allows electric motors to be operated more frequently in areas of high efficiency [24], and two-speed transmissions are usually cheaper and lighter than single-speed drivetrains [28]. Eghtessad et al. [29] claimed that vehicles with multi-speed transmissions have a higher suitability for markets with multiple use cases.

2.2. Optimization of Drivetrains

Due to the rising complexity in the design freedom of electric drivetrains, detailed system simulations are necessary to master the complexity and derive optimization concepts without any heritage from diesel-driven concepts [7]. All components of a drivetrain need to be optimized and matched together to have the best outcome [30]. To cope with the large solution space, various authors have applied optimization methods such as particle swarm [28,31], quasi-Monte Carlo with neuronal networks [29], genetic algorithms [32,33], and full-factorial calculation [34,35].
Necessary for such optimizations are longitudinal dynamic simulations, which are common for on-road vehicles [30,32], as performed by Verbruggen et al. [31], showing how to optimize the drivetrain of trucks for different topologies. Lajunen et al. [34] and Pathak et al. [35] presented a similar methodology for buses.
Unlike road vehicles, the load on a tractor during operation is mainly influenced by the implement used and not solely by the driving resistance forces [36]. The implement may require being drafted with a certain tractive force, or the implement may be actively driven via the PTO shaft [37]. Therefore, a simulation of the driveline must be thought of in terms of operation and include the wide range of load points that occur in the real world. As is common with off-road machines, the performance of the tractor depends mainly on tire–soil interaction, which affects traction performance through variable slip on the front and rear axles [38].
Kivekäs and Lajunen [7] stated that “detailed simulation models that simulate all the components of machines (that) are critical to their viability and energy efficiency”. Including a dynamic simulation with self-recorded load cycles from a conventional tractor, Lajunen [39] and Lajunen and Kivekäs [37] investigated the energy efficiency of different alternative drivetrains for tractors with a distance-based simulation including slip. Using the vehicle simulation software Autonomie, a conventional, a hybrid, a fuel cell, and a battery electric powertrain were investigated. The battery electric tractor with an output of 112 kW and a three-speed transmission shows an energy reduction of up to 70% compared to the conventional diesel tractor. The results show the advantage of the electric drivetrain, but not its detailed design. In the following publication [7], the authors show that the optimal drivetrain configuration is highly dependent on the workload and tire–soil interaction. By studying an electric agricultural robot with a semi-empirical tire-ground interaction model and a multi-degree-of-freedom model, the authors show that four-wheel drive is superior to two-wheel drive in an axle-individual topology and enables 7.5% lower energy consumption, although information on the effects of the drive topology is lacking.
Lagnelöv et al. [40] carried out a simulation to investigate an autonomous battery electric tractor and the performance of various charging systems, such as battery swapping or conductive charging. The simulation derives the required energy demand from the sum of the driving resistance forces under the assumption of constant slip and the approximated implement tractive force based on the empirical equations of the American Society of Agricultural and Biological Engineers (ASABE) [41]. A black box model of the drivetrain with constant efficiency derives the necessary energy from the load.
With the connection between high-level drivetrain design and component-level simulation still missing in the literature, this paper introduces a top-down methodology for electric-tractor drivetrains that fills three key gaps:
First, system-level analyses as Lajunen [39] demonstrate that battery electric tractors can outperform diesel counterparts in overall energy efficiency, but they do not investigate how specific drivetrain configurations influence that efficiency. Second, more detailed studies (e.g., Kivekäs and Lajunen [7]) highlight the importance of tire–ground interaction and show that road–vehicle models cannot be directly applied to field tractors—yet a design framework for selecting and sizing electric drive components across realistic duty cycles is missing. Finally, existing comparisons of axle-individual versus central motor layouts report performance for isolated cases but lack a unified optimization strategy that explores the full design space under consistent load profiles.
To bridge these gaps, our manuscript makes three key contributions:
Hence, this work addresses the following points:
(i)
Integrate real-world load cycles across various operations suitable to electric tractors to enable comparisons, performance benchmarking and applicability for farmers.
(ii)
Develop a system-level design strategy that considers the interdependencies between load, topology, and drivetrain components to ensure that the entire system achieves optimal efficiency and performance.
(iii)
Execute longitudinal dynamic simulations to quantify energy consumption and efficiency on each mission profile.
The contribution clarifies the relationship between the design and efficiency and provides actionable design guidance for deploying electric drivetrains in real agricultural settings.

3. Materials and Methods

In order to design the drivetrain in such a way that maximum efficiency and productivity are achieved through topology and component selection, we propose a system perspective in our work that comprises the steps shown in Figure 2. To derive the optimized electric drivetrain, the first input is a profile of various load cycles from the recording of a conventional 104 kW tractor. The methodology is agnostic to any electric energy source. To counter the load, the solution space offers a range of different topologies and components. For each drivetrain design, the longitudinal dynamic simulation calculates the energy consumption, including tire-ground interactions. Particle swarm optimization varies the component properties and sizes according to the solution space of the drivetrain until the termination criterion—minimum energy consumption—is reached. The result is the configuration of the most efficient drivetrain for the applied load.

3.1. Application of Real-World Cycles

One of the main barriers in the design of electric tractors and the key to a beneficial design is the integration of real-world load cycles that reflect the operations that the electric tractor must fulfill. Hence, this study builds on the reference cycles published by Götz et al. [36], which were recorded during almost 100 h of tractor operation with 8 different attachments of a 104 kW Fendt 314 Gen4 (Table A1). The goal of the drivetrain design is to perform the same tasks as the recorded tractor with the same or better performance and minimal energy consumption (see [36] for the experimental setup).
Table 1 shows the five different operations with their average load, which we apply during our simulation. To characterize the condition of the soil during the work, we estimated the standardized ASABE cone index according to literature values [41,42]. The timeshare of the specific implement in the total cycle is chosen per task based on Renius’ [42] task-specific operating time distributions in German farms.
The cycle specifications during operation were obtained logging the Society of Automotive Engineers (SAE) standard J1939 CAN bus and the ISO 11783 ISOBUS standard. The following signals at a rate of 10 Hz were used in the analysis as an input signal:
  • SPN 190, “engine speed”, which reports the rotational speed of the engine’s crankshaft, denoted as n eng .
  • SPN 544, “engine reference torque,” which reports the maximum torque the engine can deliver under its current conditions, denoted as T ref .
  • SPN 513, “actual engine percent torque”, which reports the engine’s current torque as a percentage of the reference torque (SPN 544), denoted as T act .
  • ISOBUS 1859, “ground-based machine speed”, which reports the tractor’s speed over the ground as measured by a sensor such as radar or GPS, representing its true forward velocity without the influence of wheel slip, denoted as v ground and in the simulation as v t a r g e t .
  • ISOBUS 1879, “rear draft”, which reports the apparent horizontal force applied to the rear hitch by the implement, denoted as F d r a f t .
  • ISOBUS 1862, “wheel-based machine speed”, which reports the speed of a machine as calculated from the measured wheel or tail-shaft speed, denoted as v wheel .
  • ISOBUS 1860, “ground-based machine distance”, which reports the distance travelled.
  • SPN 1883, “rear PTO output shaft speed”, which reports the rotational speed of the rear power take-off (PTO) shaft, denoted as n pto .
  • ISOBUS 1877, “rear hitch in-work indication”, indicating if the rear hitch is in work position.
  • SPN 580, “altitude”, which reports the tractor’s current altitude above sea level, typically measured using GPS.
For transportation where the tractor unit is towing a trailer, we calculate the rear draft force based on the measured weight of the trailer during operation (10,600 kg) and the resulting rolling resistance, downhill slope resistance, and acceleration resistance.
The recorded signals of the real operating profiles make it possible to divide the total power requirement into (1) the traction requirement and (2) the PTO requirement. Therefore, we can divide the power demand supplied by the diesel tractor during the recordings into its individual consumers. The distribution and application of the load are carried out in the longitudinal dynamic simulation.

3.2. Drivetrain Solution Space

To find the optimal drivetrain configuration, the solution space is divided into levels that include the topology type, the component characteristics (permanent synchronous motor (PSM) or induction motor (IM) for the electric motor), and the number of gears in the transmission. As shown in Table 2, the components are additionally varied in their dimensions to allow the most beneficial combination of inverter, motor, and transmission, enabling an overall system assessment rather than focusing solely on individual component optimization. The solution space allows a considerable oversizing of the components, so that single-gear motor-transmission combinations meet the requirements.
In the central motor topology, a single drive covers the entire power requirement, while in the axle-individual topology, the motor power is optimized individually for each axle. In the latter case, only the rear axle has several gears. All drivelines supply the PTO shaft with a single motor, which is connected to a single stage transmission.
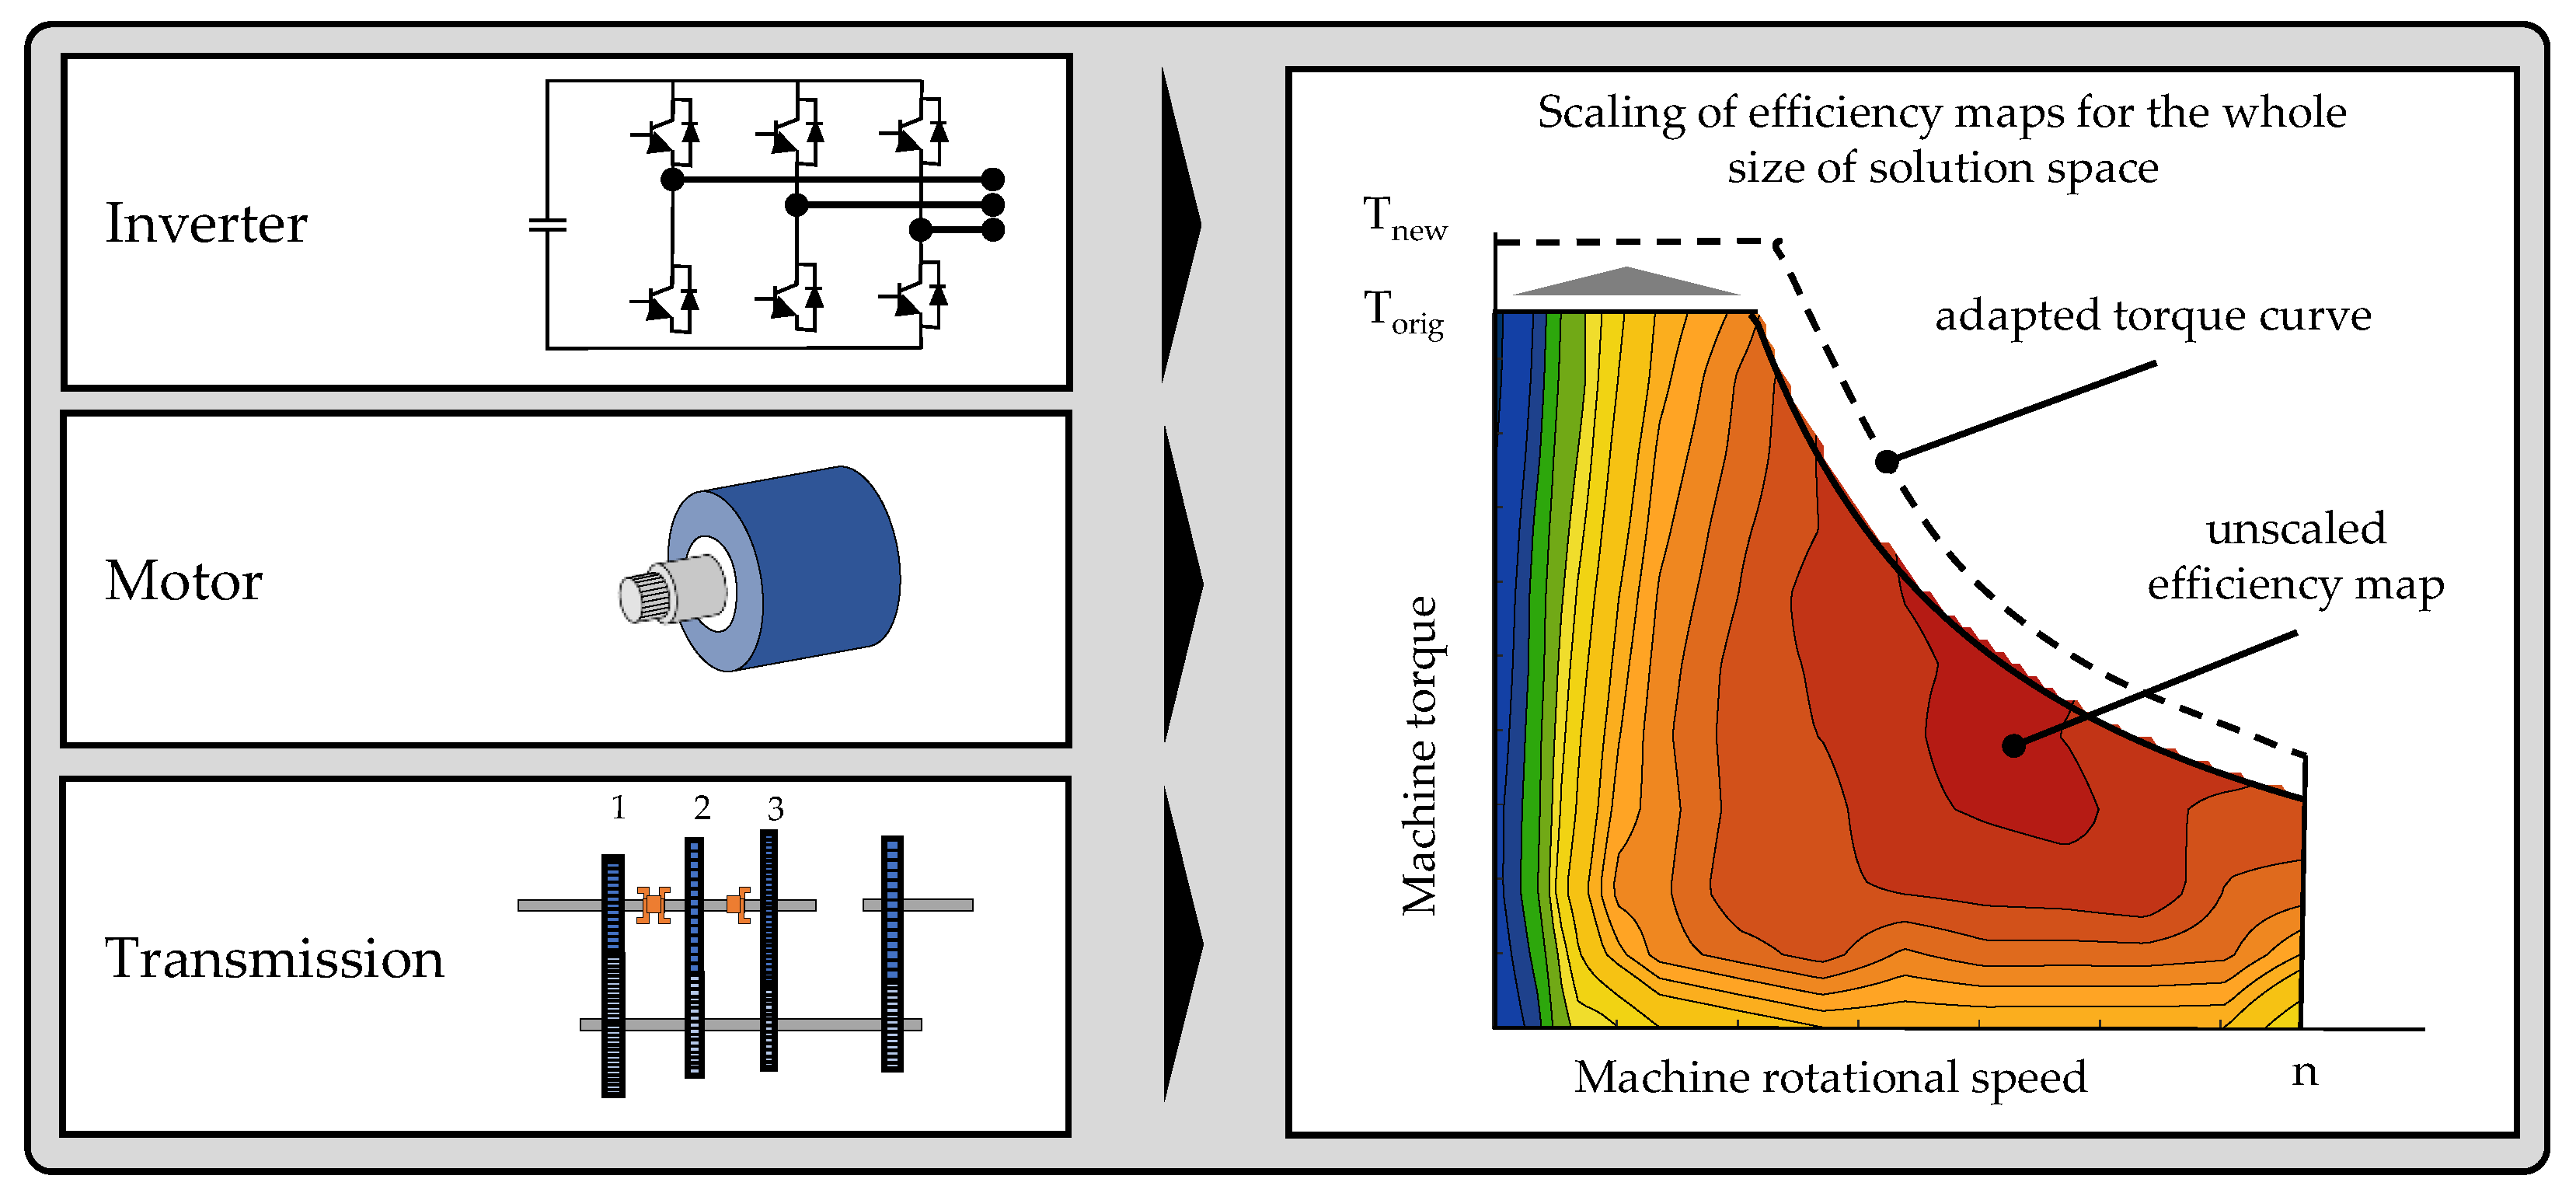
The components of inverter and motor are sized according to the necessary power demand with efficiency maps, which reflect the characteristic of standard automotive components as the IGBT inverter from Chang et al. [44], a PSM from the VW ID.3 [45], an IM from MDL Ltd. [46]. Figure 3 shows how the original efficiency map is adapted to match the required dimension of the component by scaling the maximum torque curve.
The transmission is designed to include two parallel shafts and spur gears, including the option of one or two gears with an efficiency map according to Pathak et al. [35]. The maximum necessary gear ratio is specified by the maximum speed of the tractor—in this case 50km/h—in combination with the gear ratio of the differential, the final drive, and the transfer case for the central motor. Those components include constant efficiencies (Table A3). With two gears, the speed range is split in a field gear until 15 km h−1 and a road gear above 15 km h−1.
g e a r = 1 , for v < 15   km   h 1 2 , for v 15   km   h 1
A maximum of two gears is used to take advantage of the simplicity of electric drives and their large, high-efficiency areas.
The solution space for the PTO includes the combination of an inverter, either a PSM or IM motor and a single-gear transmission. The gear ratio is selected such that the PTO has a maximum speed of 1100 rpm, and the maximum torque is selected according to the maximum required demand during all cycles.

3.3. Optimization

Optimization is a crucial step in finding the optimum solution for the drivetrain under the given load, taking into account the mutual influence of all components in the solution space. The objective function for the optimal drivetrain minimizes the energy consumption for a given load by varying the design:
E battery = 0 T P battery d t
P battery is the power the battery must provide in every time step for the drivetrain.
The efficiency η DE describes how effectively the drivetrain converts the supplied power of the battery to the wheels.
η DE = T drive , wheel ω w P battery
To evaluate the traction performance of the drivetrain, we calculate how efficiently the driving force at the wheels is transferred into the productive, non-dissipative forces: rear draft, slope, and acceleration. Those are calculated within the simulation of the load cycle and put in relation to the torque at the wheels:
η TE = ( F draft + F slope + F acc + F air ) v COG T drive , wheel ω w
The power delivery efficiency η PDE —product of drivetrain and tractive efficiency—is affected by the tractor’s driveline and the tire–soil interaction:
η PDE = η TE η DE
We choose, in accordance with [47,48], a particle swarm optimization (PSO) to find the best configuration as trade-off between implementation effort and computational performance. The PSO iteratively refines the proposed solutions by simulating the collective behavior of a swarm of particles, each of which represents a potential powertrain configuration with a unique combination of design variables. We initialize the swarm with 200 particles, which are passed to the longitudinal dynamic simulation to determine the energy consumption. The objective function leads to the optimal configuration. The optimization process ends when the improvement in energy consumption between two consecutive particles over 20 iterations is less than 0.1%. A drivetrain configuration fails the requirements if it exceeds 10 s of full load or standstill to ensure the same or better area output than the recorded diesel tractor, as its velocity trajectory can be followed correctly.

3.4. Forward Longitudinal Simulation

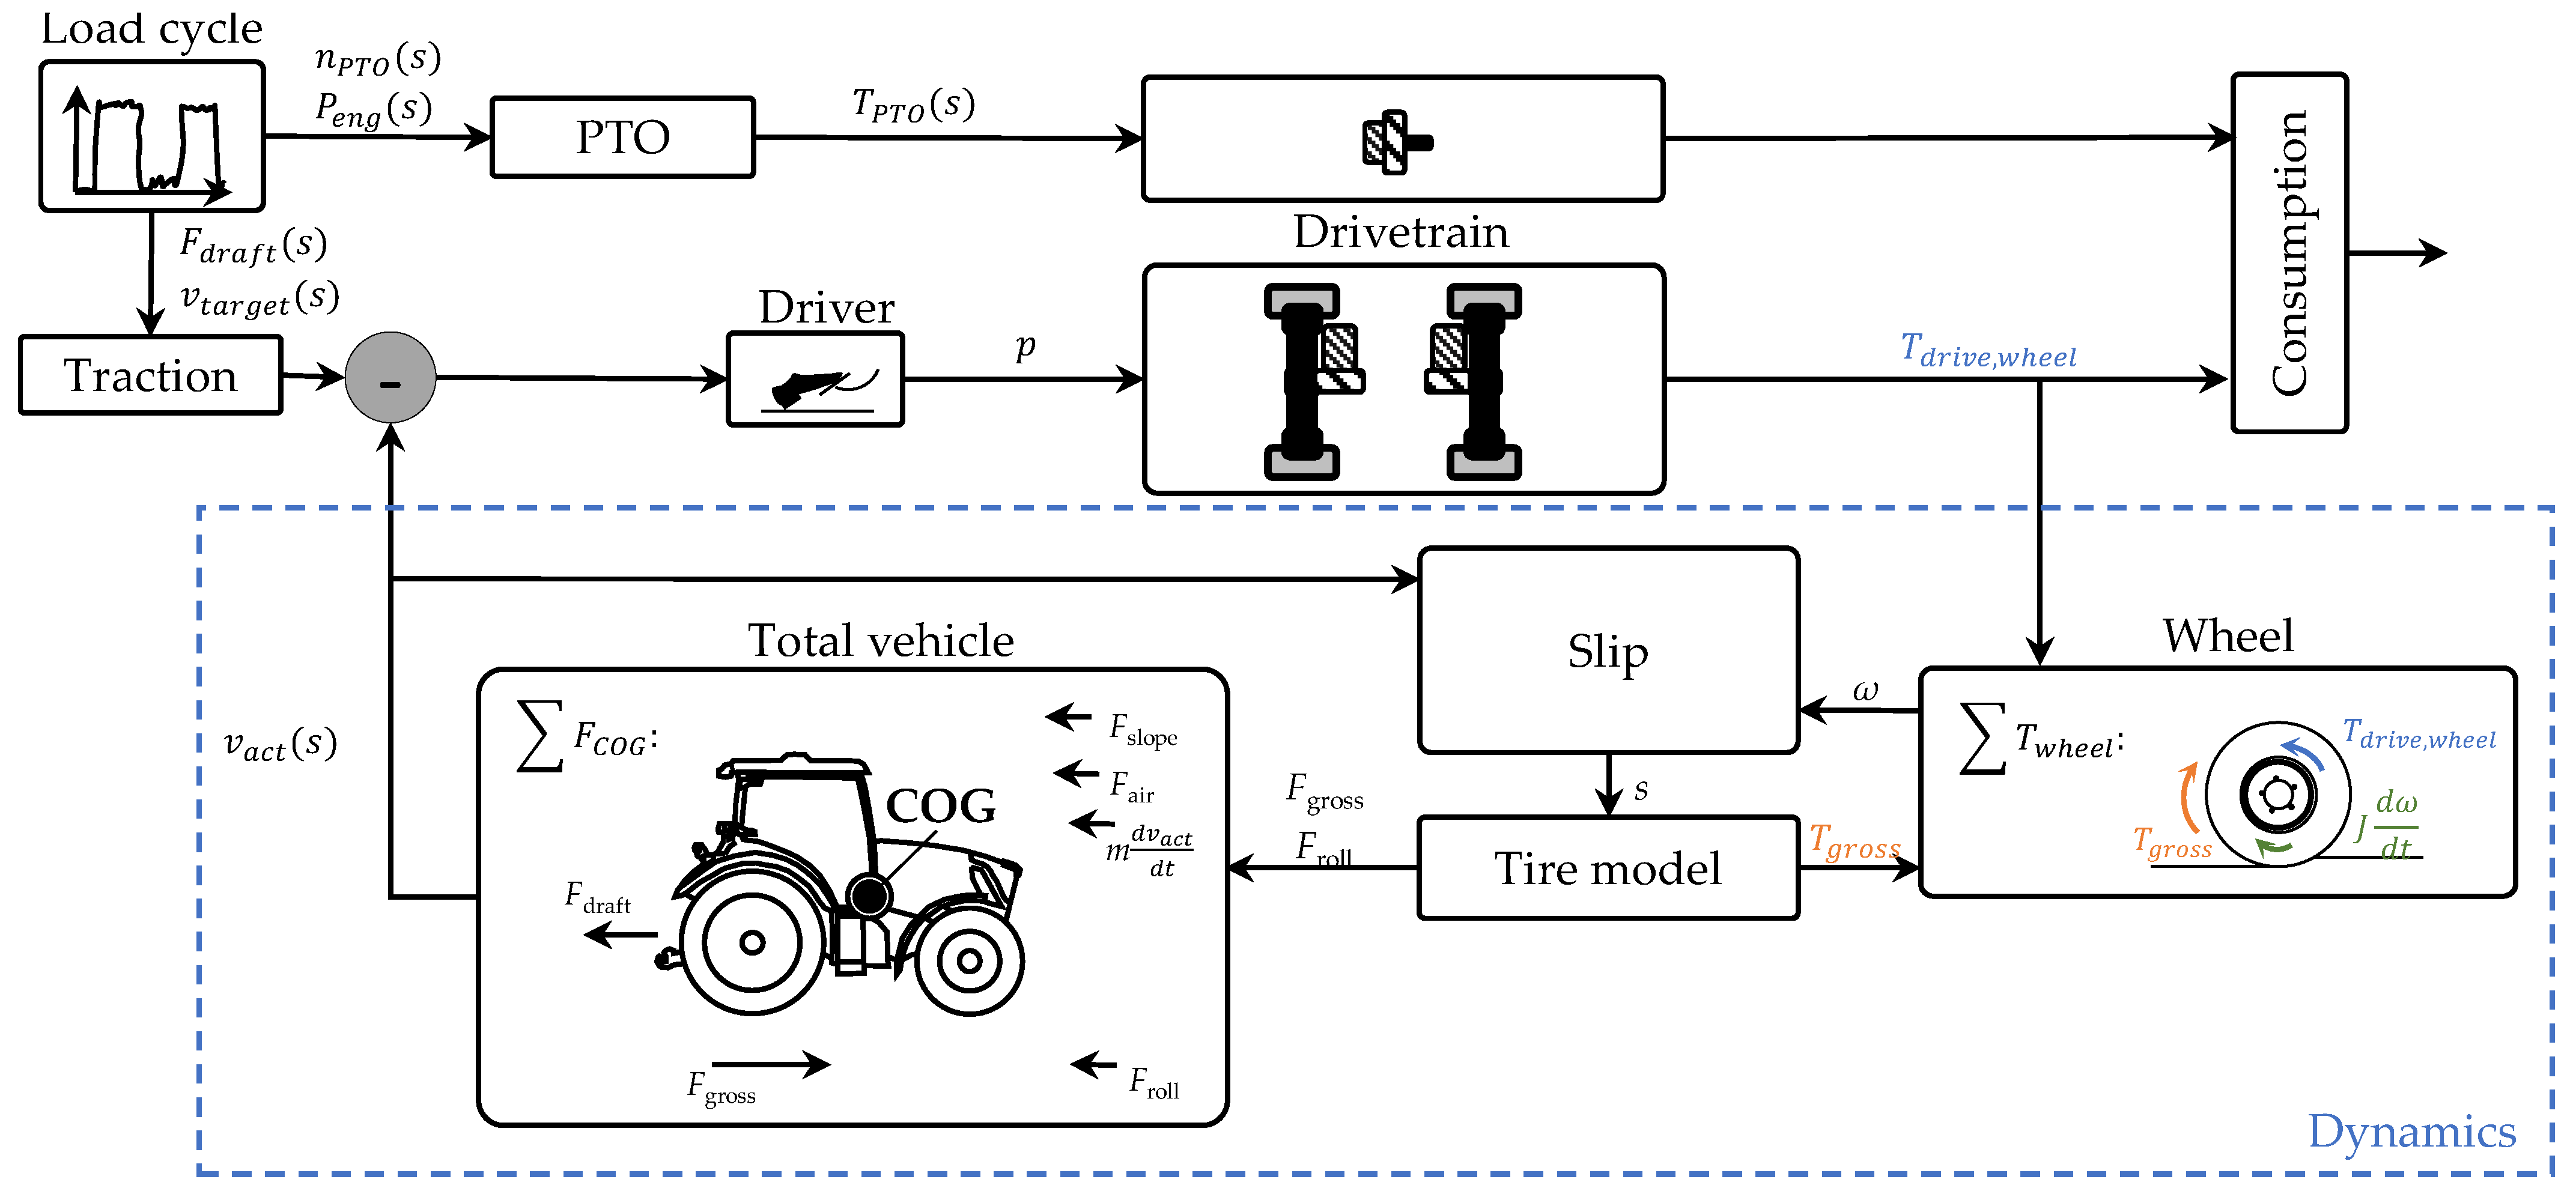
The forward longitudinal simulation provides a mathematical expression of the driveline and the driving behavior. Figure 4 guides the simulation model: the load from the recorded real-world cycles is divided into the traction and PTO drive. We calculate the load on the PTO using the recorded engine power and PTO speed. For the traction drive, a virtual driver reacts to the load—given by the target speed, the rear draft of the attachment, and the gradient—by transferring a certain throttle position to the driveline. The drivetrain generates torque at the wheels according to the throttle position.
The empirical tire model by Zoz and Grisso [49] is at the center of the tractor’s dynamics: with the help of the model, we obtain the gross tractive torque T g r o s s at the wheels and the gross tractive force F g r o s s at the vehicle. (1) The equilibrium of forces on the wheel provides us with the rotational speed ω of the wheel. (2) In parallel, the sum of the forces at the center of gravity (COG) determines the vehicle speed. If we compare the speed at the wheels and at the center of gravity, we obtain the slip during each time step. The actual speed v a c t serves as the output, which is compared with the target speed v t a r g e t from the load cycle, and the driver can react accordingly. The sum of the energy required for the drivetrain and for the PTO must be provided by the battery ( E battery ).

3.4.1. Driver and Drivetrain

The virtual driver of the tractor is described by an optimal single-point preview control model which reacts to the deviation between the actual velocity v a c t and the target velocity v t a g e t from the load cycle [50]. Depending on the deviation, the driver gives a throttle position p as a percentage of the maximum possible torque at the current speed to the drivetrain. In contrast to automotive applications, off-road vehicles are simulated in a distance-based manner instead of a speed-based manner, as the distance matters for the performed work.
The drivetrain converts the throttle position into the actual target torque by applying the efficiency map from the solution space, which is the combination of the inverter, motor, gearbox, and final drive. The result is the torque of the drivetrain at the wheels T d r i v e , w h e e l , t in every time step, including the efficiencies along the way. With the axle-individual topology, the throttle position is applied equally to the engine of the front and rear axles, allowing them to set individual speeds.
T drive , wheel ( t ) = 1 2 p ( t ) T max n t 1 i g e a r ( t 1 ) i FD η T , n System Efficiency Map
where p ( t ) is the throttle position, and T max n t 1 the maximum possible motor torque at the motor speed n t 1 at the last time step. The gear ratio i gear , t 1 is selected from the gear in the last time stamp, and i FD is the gear ratio of the final drive. The system efficiency map with the efficiencies of the inverter, gearbox, transfer case, differential, and final drive is summarized by the variable η ( T , n ) .
In the case of a central motor (CM) architecture, the throttle position is applied to the motor, and the torque is split between the front and rear axles by the transfer case, defined by Equation (7). The speed of the individual axles is coupled by the transfer case.
T drive , wheel , CM , t = 1 2 f T g r o s s , f / r p t T max n t 1 i g e a r , t 1 i FD η T , n System Efficiency Map
Hereby f T g r o s s , f / r is the ratio of gross traction between the axles (A1). The efficiency of the transfer case is added as a constant factor to the system efficiency map as an approximation.

3.4.2. Dynamics

The traction demand depends on the sum of the driving resistance forces plus the demand from the implement. The actual speed v a c t is obtained using
F COG : m d v act d t = F g r o s s F r o l l F a i r F s l o p e F d r a f t
with F r o l l as the rolling resistance, F a i r as the air resistance, F s l o p e as the slope downforce, F d r a f t as the recorded draft force from the implement, and F g r o s s as the actual gross traction. The slope downforce and the air resistance are calculated according to Equation (A2). Since the weight of the implements is unknown, as is the amount of implement weight transferred directly to the ground during the implement application, we do not consider the weight of the implements and focus solely on the known weight of the traction machine.
The longitudinal rolling resistance and gross traction are obtained with the empirical tire model from Zoz and Grisso [49], which models the contact force at the tire–soil interface. The forces are calculated as a function of the vertical load on the individual tire F w , the net traction coefficient κ , and the rolling resistance coefficient ρ :
F g r o s s = F n e t + F r o l l = κ · F w + ρ · F w
with the load on front and rear tires as
F w , f = F draft h hitch F air h COG m v ˙ a c t h COG m g h COG sin ( θ ) + m g l r cos ( θ ) 2 ( l r + l f ) F w , r = F draft h hitch + F air h COG + m v ˙ a c t h COG + m g h COG sin ( θ ) + m g l f cos ( θ ) 2 ( l r + l f )
Whereas the net traction and rolling resistance coefficient are semi-empirically approximated as a function of the slip s for the front and rear axles [49]:
κ = 0.88 1 e 0.08 B n 1 e 7 s 1.2 B n + 0.5 s 1 B n
ρ = 1.2 B n + 0.5 s 1 B n + 0.03
with a mobility number B n which obtains the interaction between tire and soil dependent on tire parameters and a cone index C I characterizing the soil (Equations (A4) and (A5)).
Brixius [51] suggested the empirical Equation (A5) to calculate the increased soil strength in the rut through the multi-pass effect, expressed by an increased C I Value.
The slip is calculated from the difference between the speed of the wheel v wheel and the actual vehicle speed v actual . The slip is derived for front and rear wheels individually:
s = v wheel v act v wheel
The wheel rotational dynamics obtain the wheel speed v w h e e l :
T w h e e l : J d ω d t = T drive , wheel T gross
with the rotational speed ω and the inertia of the wheel J.

3.4.3. Power Take-Off (PTO)

In order to transfer the power requirement for the PTO shaft from the load cycles to the simulated tractor, the power required for the PTO shaft during the recordings must first be determined. Different to Mattetti et al. [52] who applies a constant share of the total motor power to the PTO, our approach is different: we split the total engine power P eng , of the tractor during the recordings into the tractive power, PTO, and auxiliaries:
P pto = P eng P trac η T , F 314 P aux η pto , F 314
The total engine power during the recordings is calculated from the product of the recorded engine speed n eng , the engine reference torque T r e f , and the actual engine percent torque T a c t . The tractive force is determined by the recorded slip and the semi-empirical tire model. The demand for auxiliaries is based on the analysis by Saetti et al. [53] to be P aux = 13.7 % P eng . The efficiency of the drivetrain ( η T , F 314 ) and the PTO ( η pto , F 314 ) of the recorded tractor Fendt 314 are chosen at the upper end from the values provided by Renius [42], to omit any pro-electric bias. The torque that is applied in the simulation is derived from the PTO power P p t o :
T pto = 60 P pto 2 π n pto
with n pto being the recorded PTO speed.

4. Results

4.1. Working Cycle Characteristics

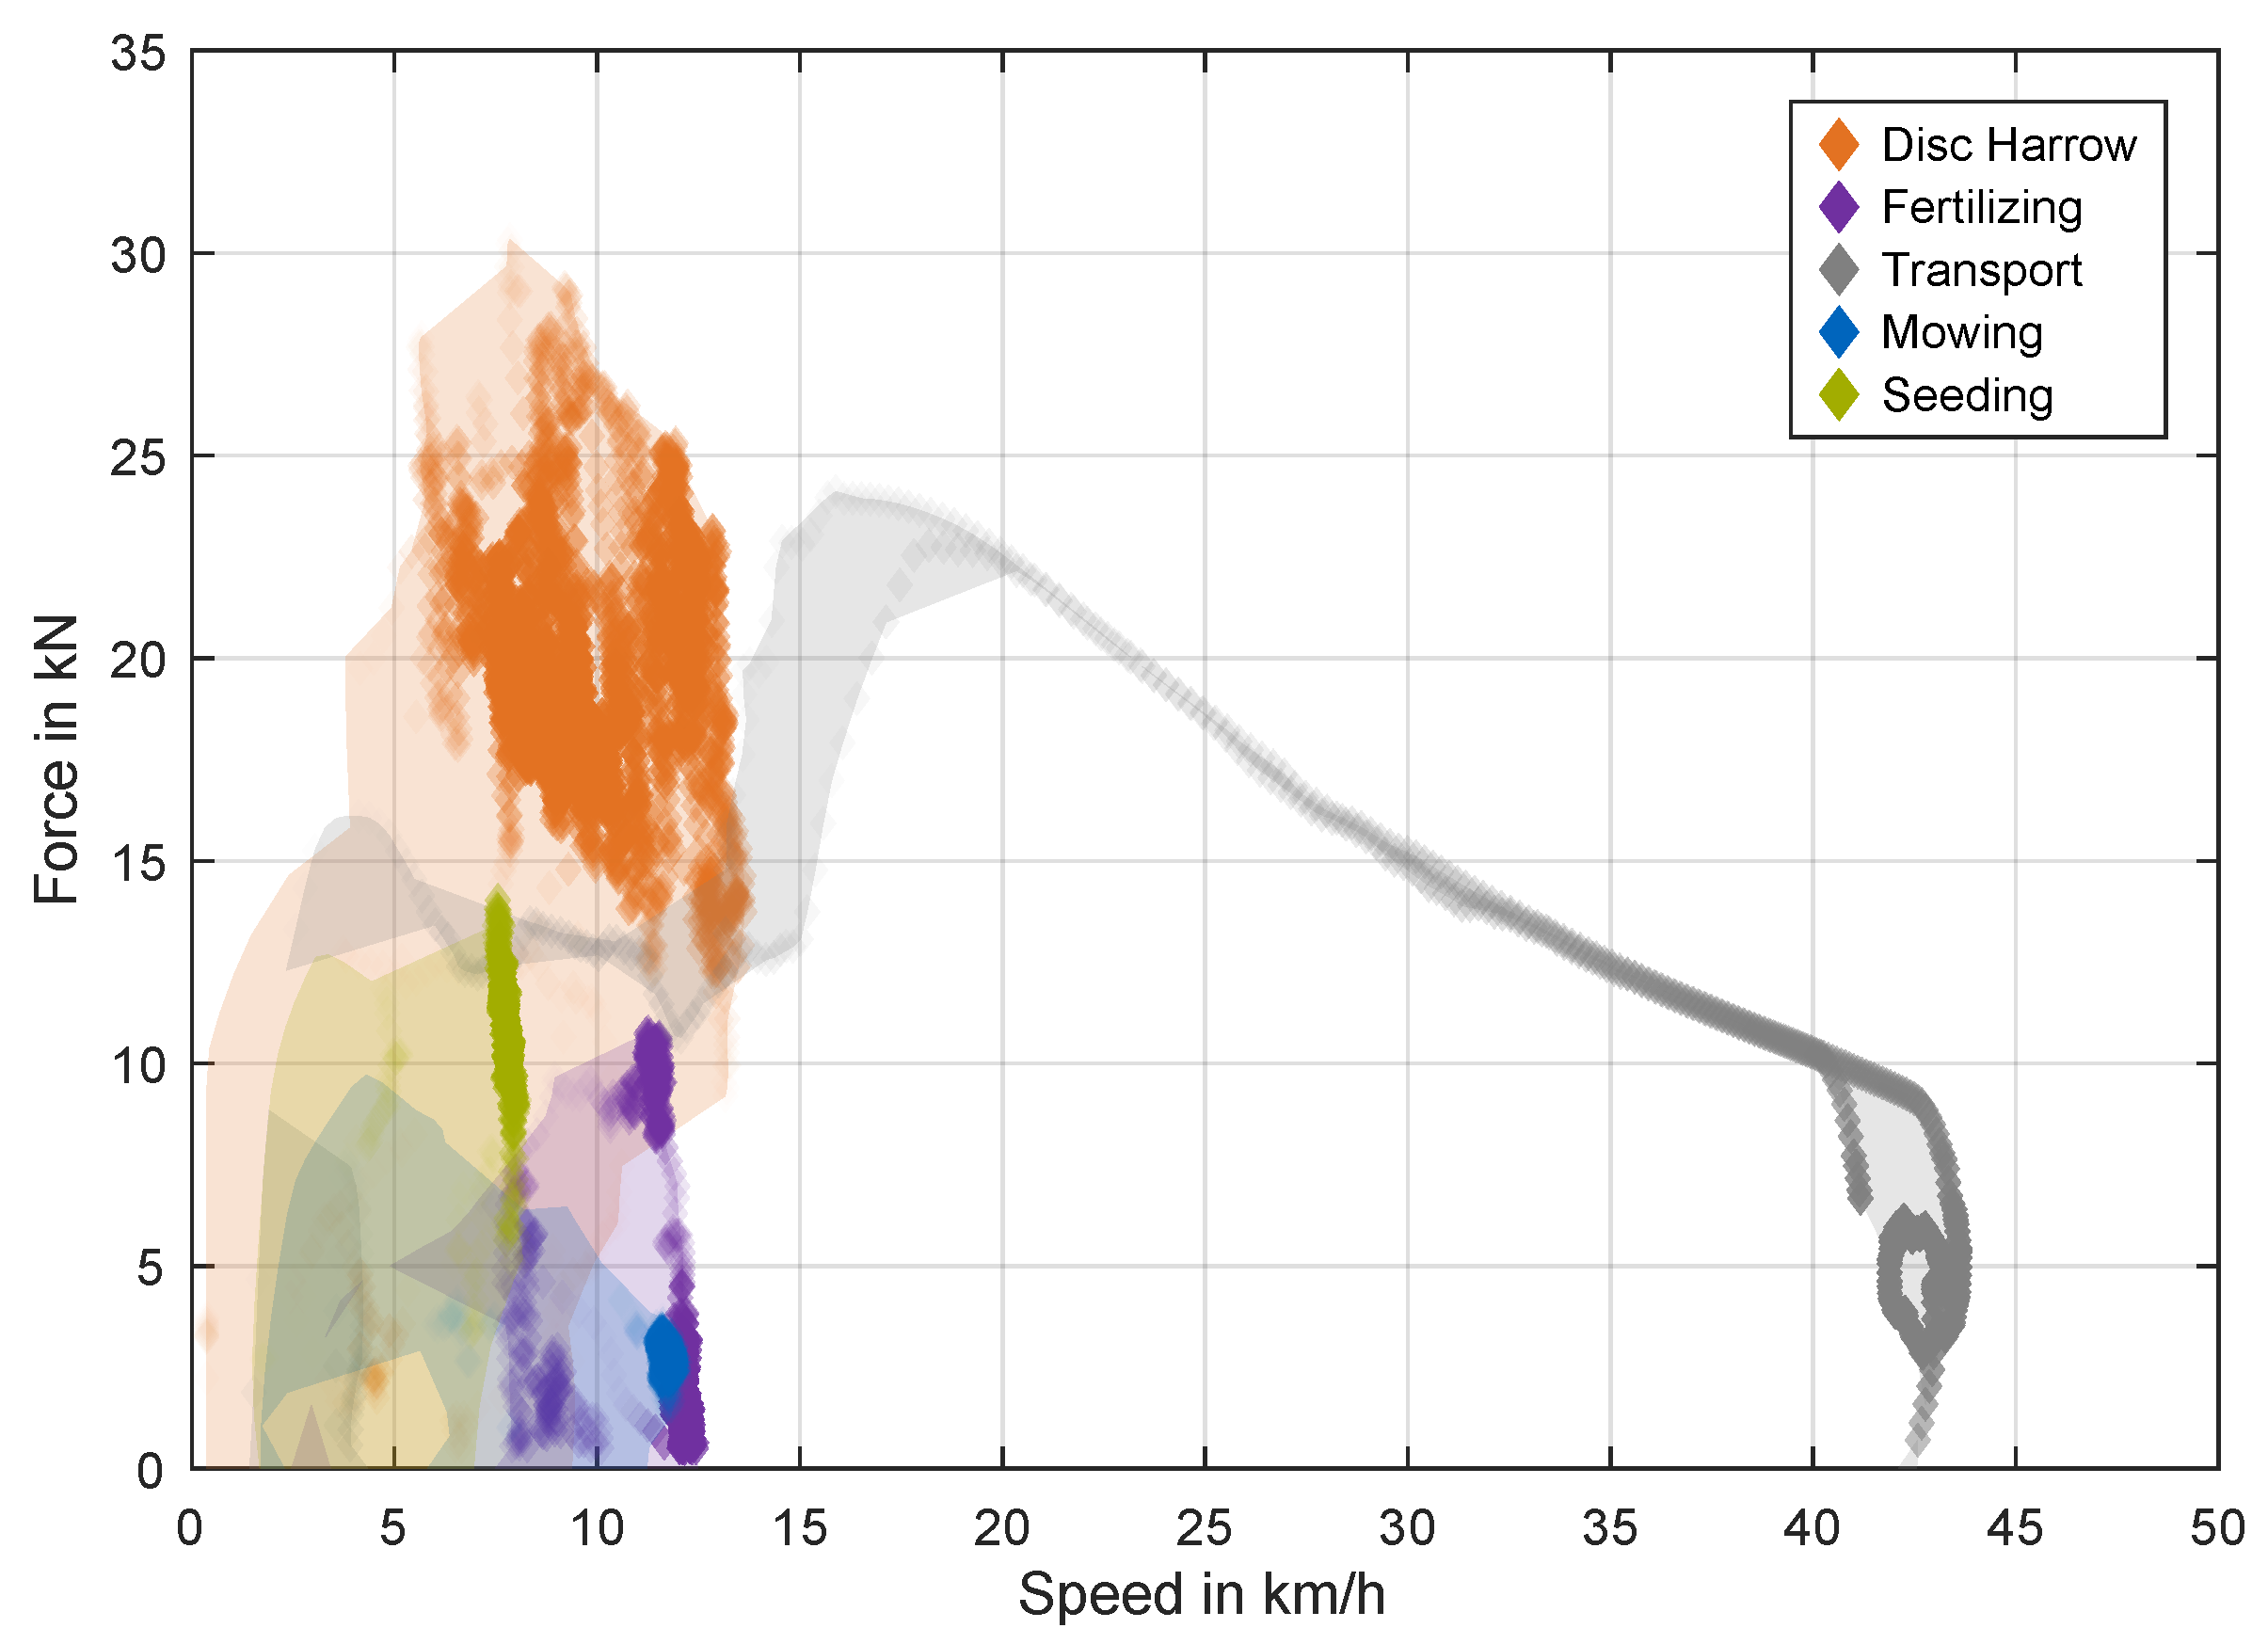
In line with the objective of integrating real-world cycles across various agricultural operations, Figure 5 illustrates the distribution of the resistance forces as a function of speed, which need to be overcome by the drivetrain. The data clearly show significant variations in load across different implements used throughout the agricultural season. This diversity in agricultural loads, as demonstrated by the different resistance forces, must be considered when utilizing the flexibility of electric drivetrains, highlighting the need for a systemic approach that extends from the loads to the individual components. While operations such as fertilizing and mowing exert minimal traction forces as the primary power is transmitted to the implement via the PTO, tillage, and transport are significantly more load-intensive due to the high draft forces from the implement. High draft forces also apply to transportation, where the additional weight of the trailer plays a major role in the slope down force. As opposed to tasks in the field with speeds less than 15km/h, the driveline must cover a wide speed range for transport while maintaining the required load capacity.

4.2. Optimized Drivetrain

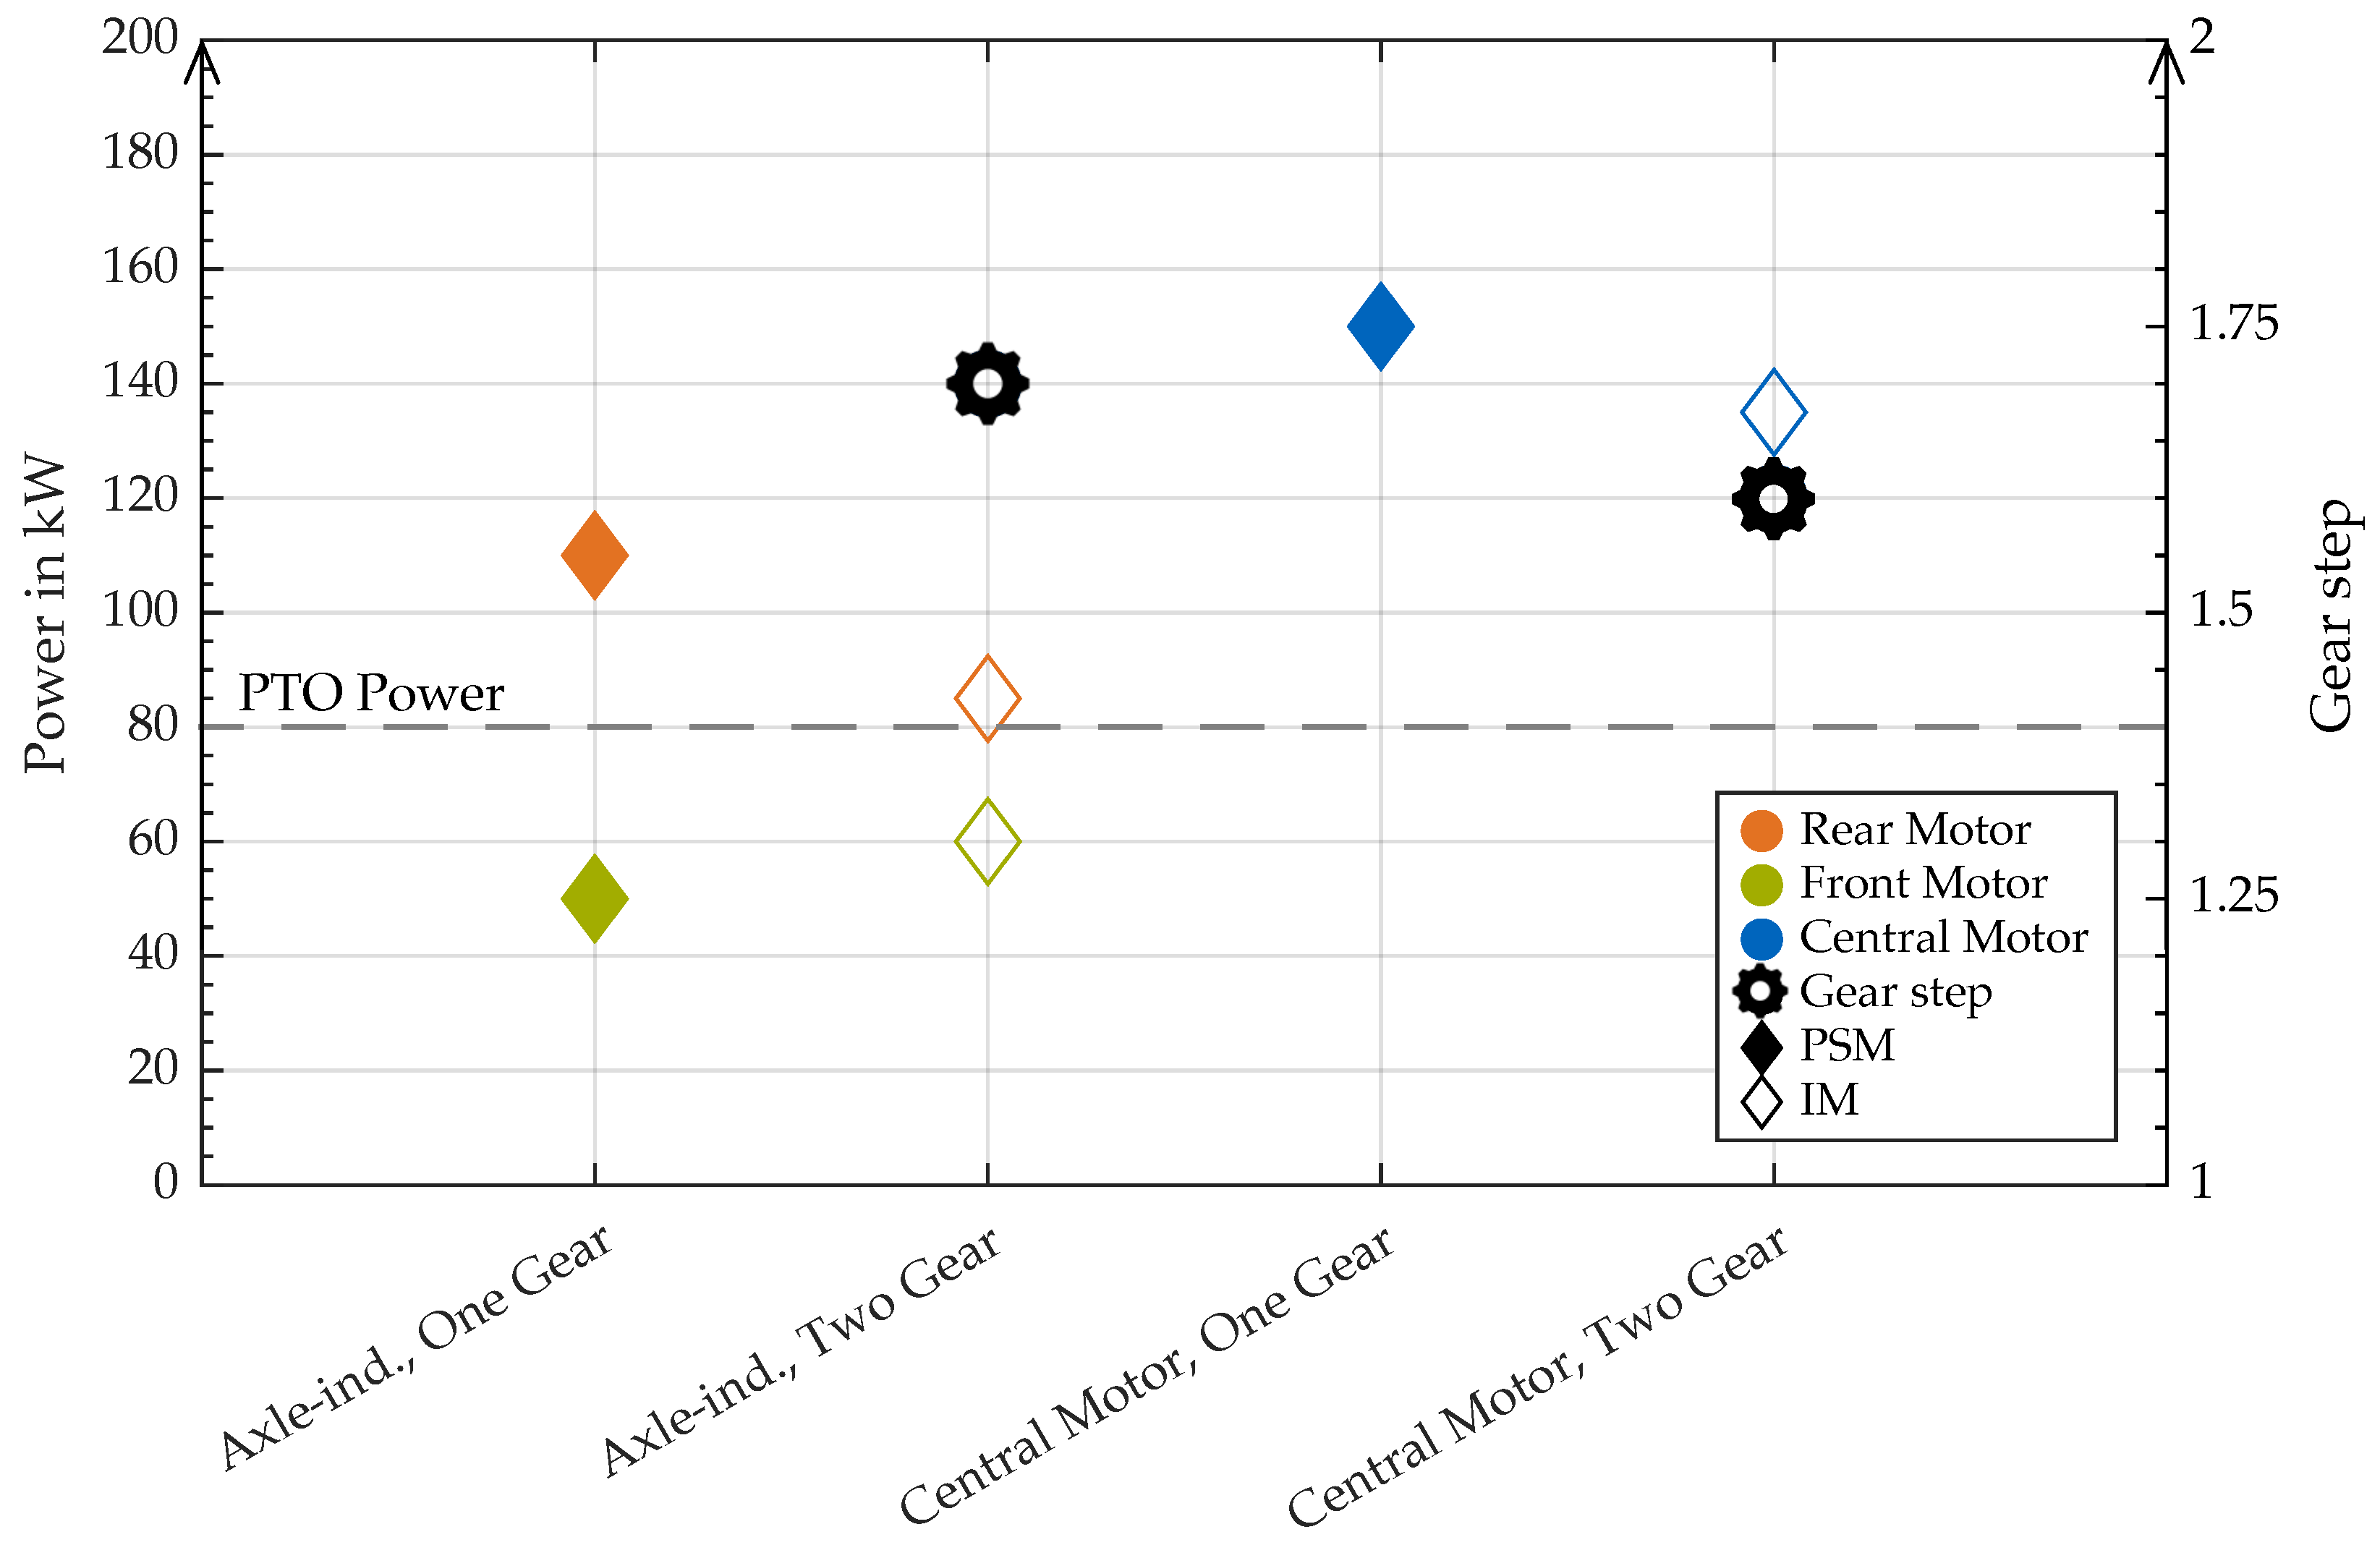
By optimizing for the best drivetrain component combination, the most efficient drivetrain can be designed for the applied load at the system-level. For the investigated central motor and axle-individual topologies, Figure 6 shows the most efficient configurations with one or two gears.
The most efficient axle-individual topologies include a smaller powered front than rear axle with either 50kW or 60kW motors. This is in line with the weight distribution during the load cycles, with the majority of traction being transmitted on the rear axle. With only one gear on the rear axle, the rear wheel motor is significantly oversized and requires 30% more power than with two gears in order to cover the wide speed range. The two-gear configuration enables the same traction at a marginally better efficiency of 83% with already 90kW at the rear axle (see Table 3).
With the central motor topology, the single-gear drivetrain is on average 1.1% less efficient than the axle-individual topology and requires a higher total power of up to 150 kW. A second gear with a gear ratio of 1.7, between first and second gear, again enables a marginally higher drivetrain efficiency of 82% but with 15 kW less power. The high output enables minimal energy consumption.
In configurations with a single gear, the PSM is the most favorable motor type for both the axle-individual and central motor topologies. The PSM offers higher efficiencies at higher rated speeds, which frequently occur due to the single-speed gearbox; with two gears, the IM delivers better efficiency. A gear step of 1.7 and 1.6 appears to be optimal.
Regardless of the number of gears and the topology decision, the drivetrains achieve an average traction efficiency of 70% in our simulation, which is in the range described in literature [54]. The PTO is sized identically across all configurations with a PSM of 80 kW to suit all real-world cycles, achieving an average efficiency of 76%.
Table 3 shows the results for the topologies across the different cycles. The most efficient axle-individual configuration achieves an average drivetrain efficiency of 83.3% consuming 26.7 kWh/ha in the disc harrow cycle, compared to the central motor configuration with 82.0% having a consumption of 26.9 kWh/ha. The high consumption during seeding is due to the combination of traction and PTO requirements, with the latter accounting for 38% of the total energy requirement. When mowing, the PTO consumes as much as 54% of the total energy requirement.
The results show the potential of our design method by achieving similar efficiencies across the topologies due to careful component sizing and matching. The optimization tends to higher machinery power due to efficiency gains and to meet the acceleration requirements especially in the load-intensive transport cycle.
Figure 7 presents the efficiencies during disc harrowing, the most energy-intensive cycle investigated, in more detail. With the objective function to minimize the total energy consumption, the drivetrains are tailored to maintain high efficiencies during periods of high power demand. The power range includes the traction demand for the topologies.
The drivetrain efficiency remains high around 85% during the power-intensive section. With an average slip of 5.4%, an average tractive efficiency of 77% is achieved—an indication of how effectively the wheels transfer the traction into the ground. As the same tractive efficiencies were achieved across the optimal configurations, the energy loss in the tire–soil interaction is not relevant for the optimization.

4.3. Productivity of Optimized Drivetrain

The efficiency and energy consumption directly influence the capability of electric tractors in real operation and customer acceptance of this technology. As previously mentioned, the drivetrain is the key to achieving high operating hours with limited battery capacity. Hence, Figure 8 shows the operating times of the designed electric tractor with an assumed 100 kWh battery and a two-gear axle-individual topology. The operating times are clustered according to the different load cycles from Table 1. To show the effect of speed on consumption and running time, we show the operating times that can be achieved with one battery charge while the operator drives slower (80%) or faster (120%) than the recorded load cycles. This is crucial as the power needs change with speed.
The results show that one battery charge can cover a whole working day for low-energy activities such as fertilizing with an energy consumption of around 15 kWh/h, whilst the high efficiency also enables half a day’s use for mowing and seeding. For energy-intensive work such as soil cultivation or transportation, the operating times fall below two hours. The reference cycle, which includes all tasks with the time distribution shown in Table 1, has an average running time of 1.9 h.
As a result, electric tractors are a viable option for low- to medium-intensity tasks of 10–30 kWh/h, provided the drivetrain is more than 80% efficient. The same powertrain is also capable of handling heavy-duty tasks such as tillage or transportation, but not with sufficiently long operating times, meaning that the batteries either need to be recharged or swapped out.
The optimized tractor is able to achieve up to 1.2 times higher target velocities due to the fact that the most efficient drivetrains have higher peak power. Hence, the optimized drivetrains have the same or even higher work performance than the recorded diesel tractor. This is also evident when looking at the average throttle position of the drivetrains. Moreover, the configurations with two gears have more spare capacity during the field work cycles (Table A6).

4.4. Potential and Plausibility of the Design Method

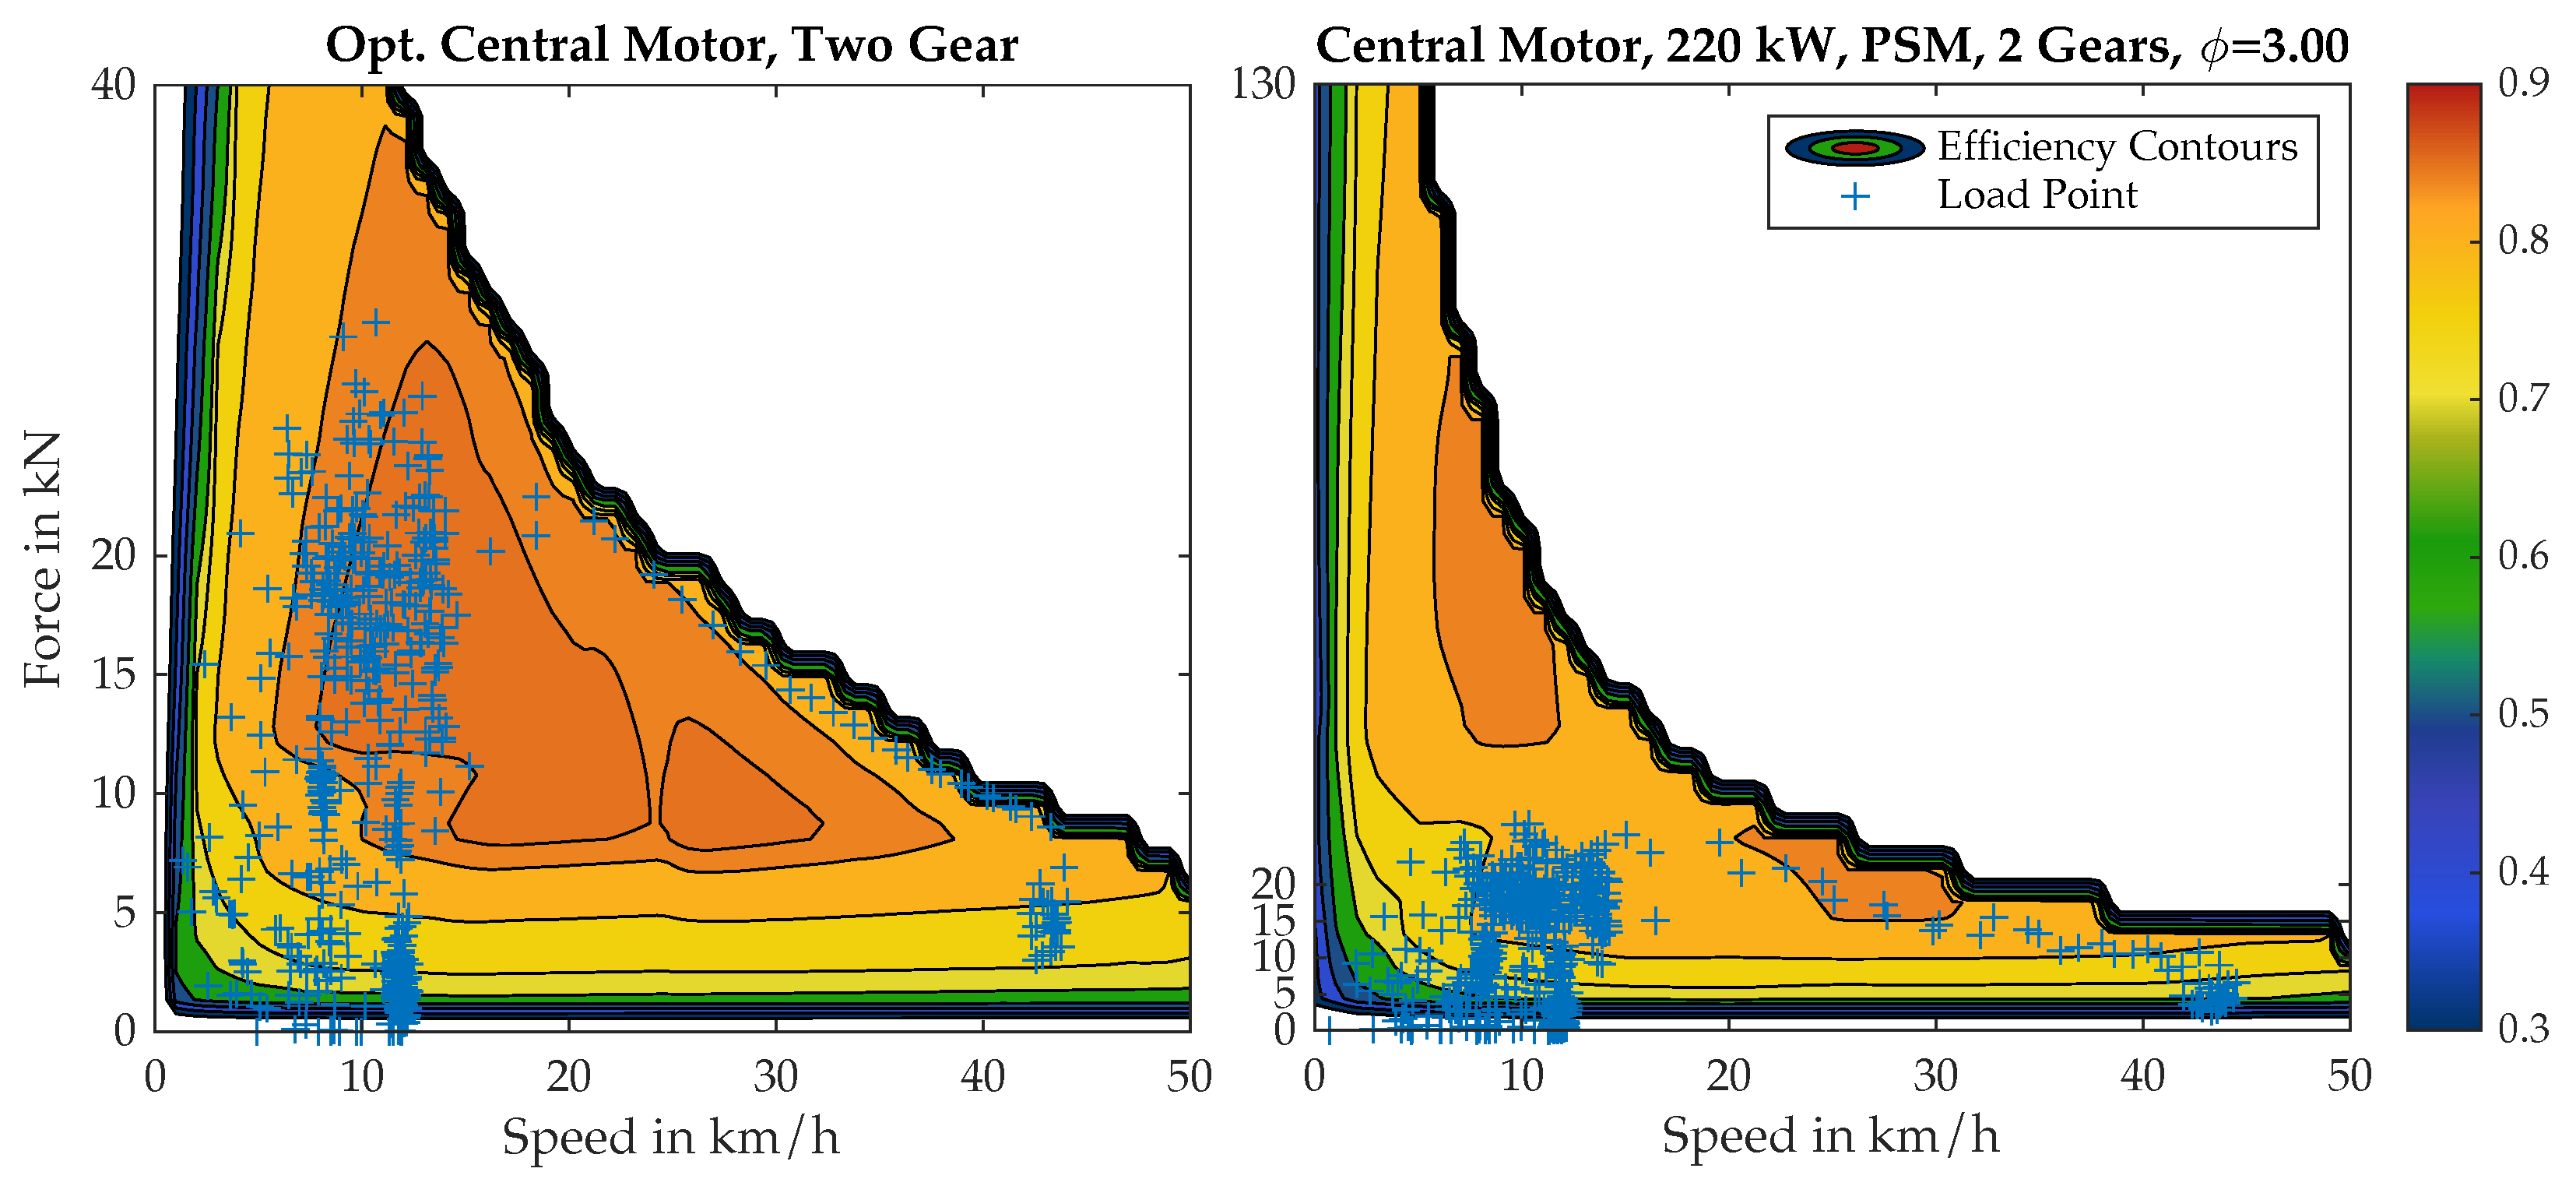
To demonstrate the potential of the presented top-down design method, we compare the optimized central motor configuration against a deliberately mismatched variant drawn from the same solution space. Specifically, this most unfavorable variant uses a 220 kW motor paired with a gear step of 3, which is significantly larger than the ideal sizing identified by our optimizer. The drivetrain is significantly oversized compared to the optimized configuration. Under identical mission profiles, this oversized drivetrain reaches only 71.6% average efficiency—10.4% points below the 82.0% achieved by the optimized layout.
Figure 9 visualizes how these two designs interact with the load-point map. In the optimized case, the majority of operating points lie squarely within the motor’s region of maximum efficiency, thanks to precisely matched component sizing and gearing. By contrast, the unfavorably designed variant places many load conditions outside its high-efficiency envelope, leading to wasted energy.
While the optimized powertrain on the left is designed with our method in such a way that most of the load points are located in areas with high efficiency, the unfavorable topology from the same solution space is poorly adapted to the load points. This efficiency gap underscores the core insight of our methodology that accurate alignment between the tractor’s real-world load spectrum and the electric drive components is essential.
In order to plausibilize the results of the simulation, we compare the dynamics of the simulated electric tractor with the velocity and slip of the diesel tractor during the recordings of the load cycle.
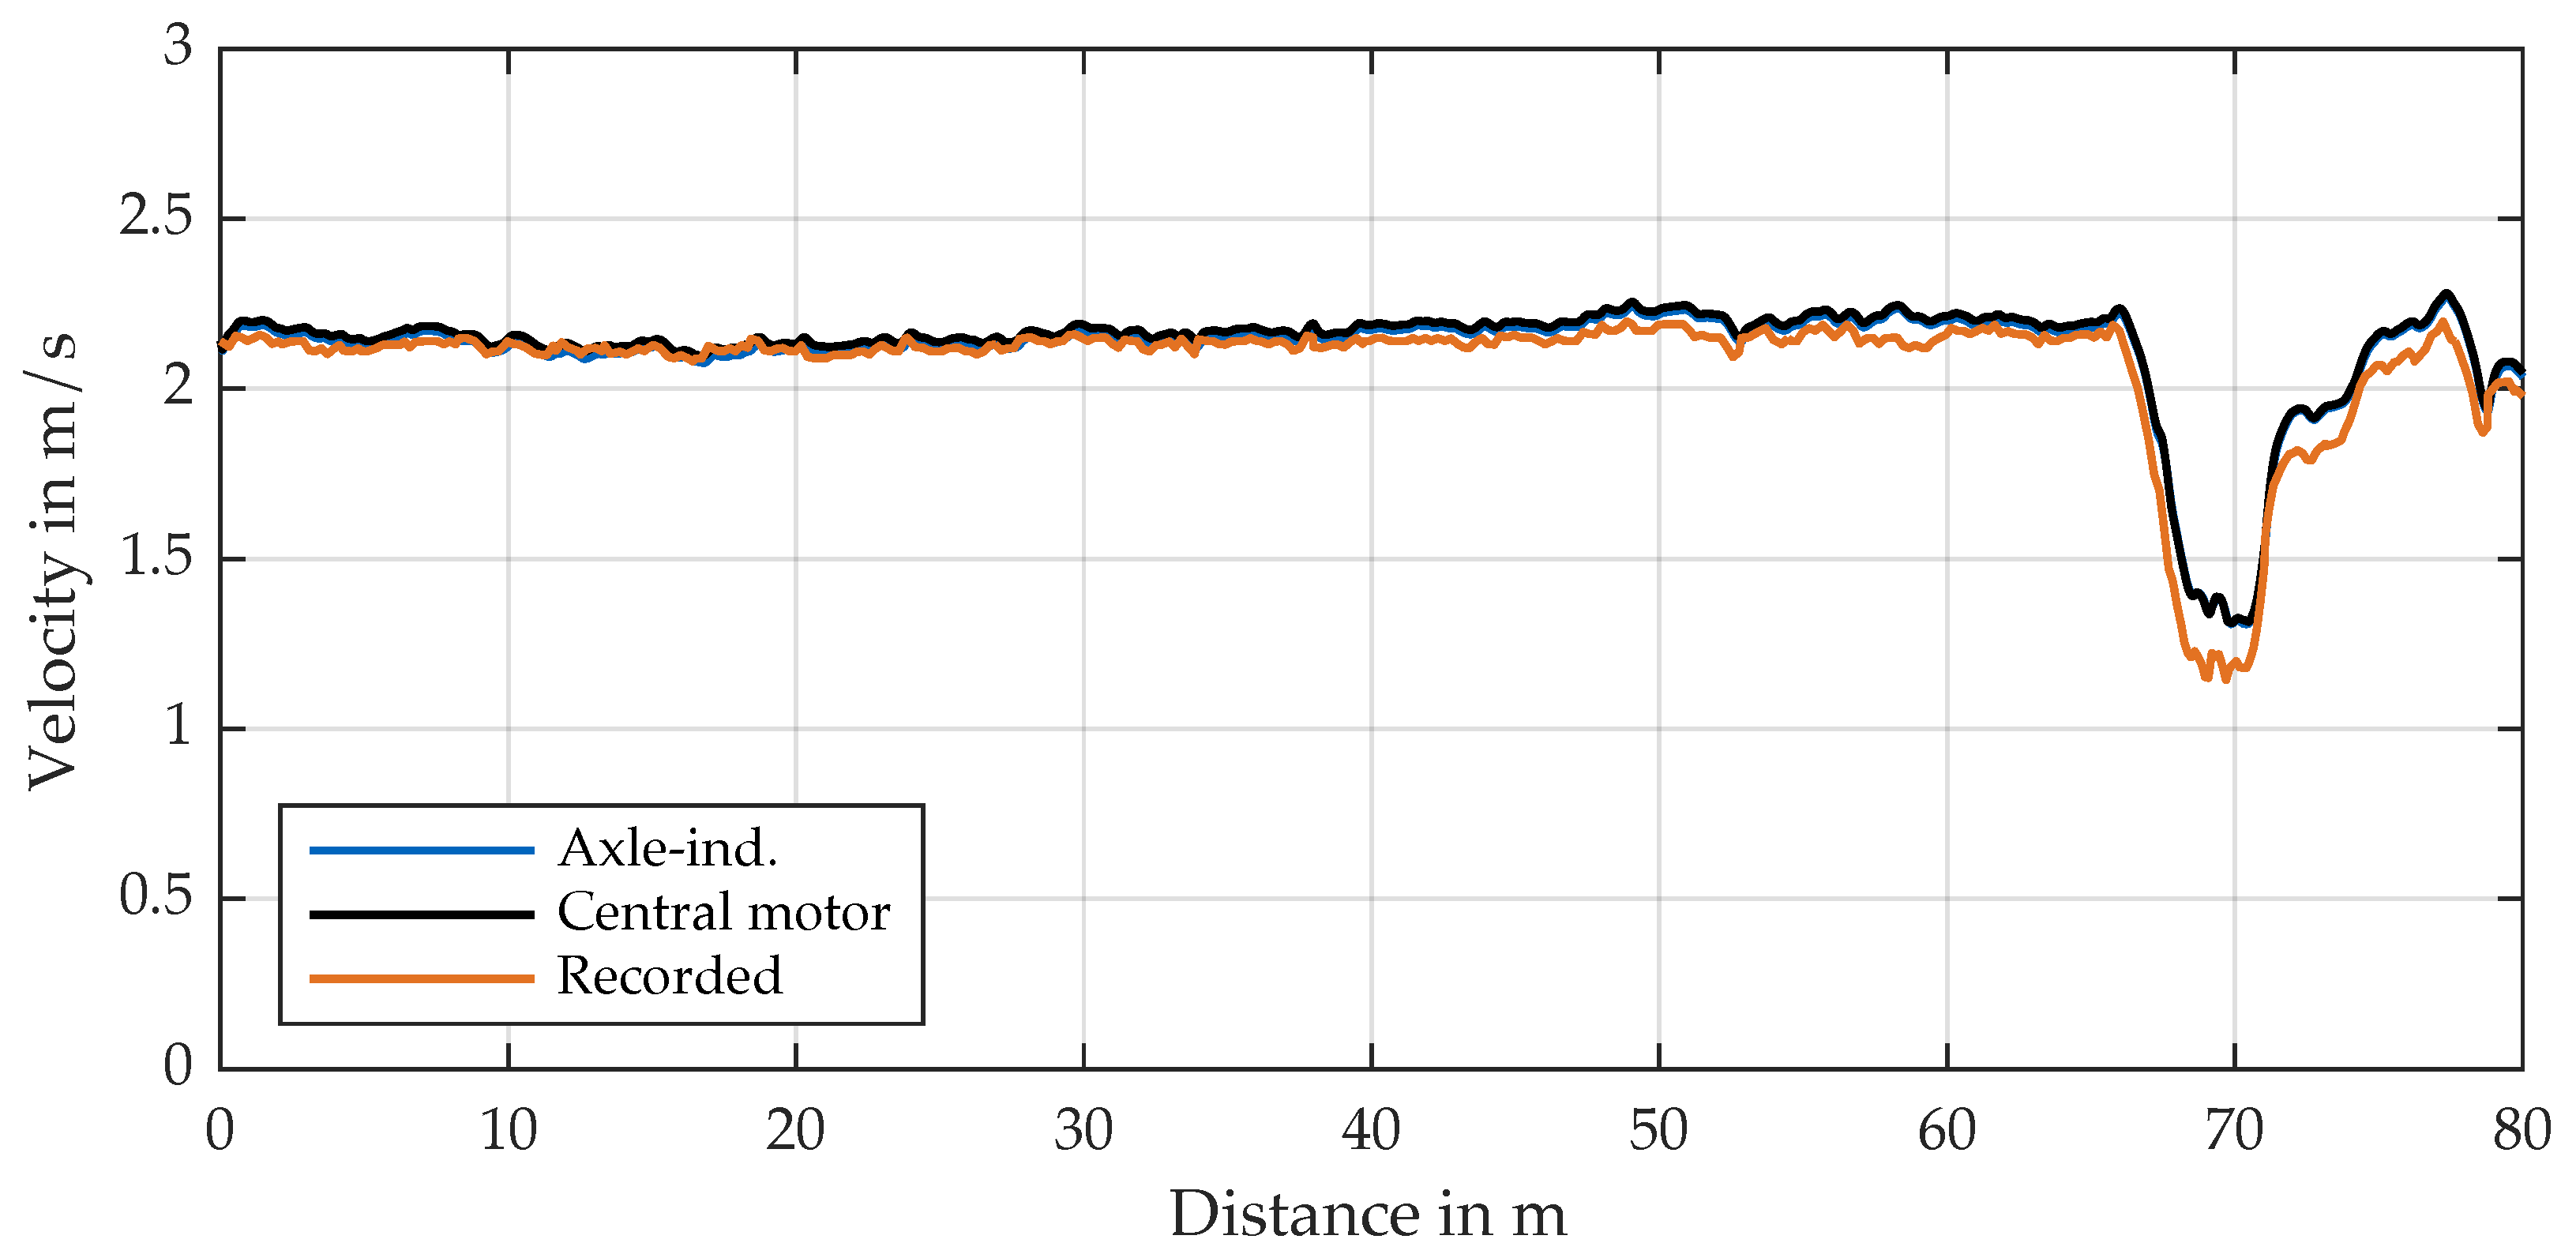
As it is vital for the derived energy consumption that the tractor is following the target velocity, Figure 10 shows exemplary for the seeding cycle that the most efficient topologies follow the recorded target velocity and therefore reach the same productivity as the recorded diesel tractor. The simulation excludes drivetrains that require more than 10 s maximum throttle position to ensure that the selected configurations provide the same productivity as the recorded diesel tractor.
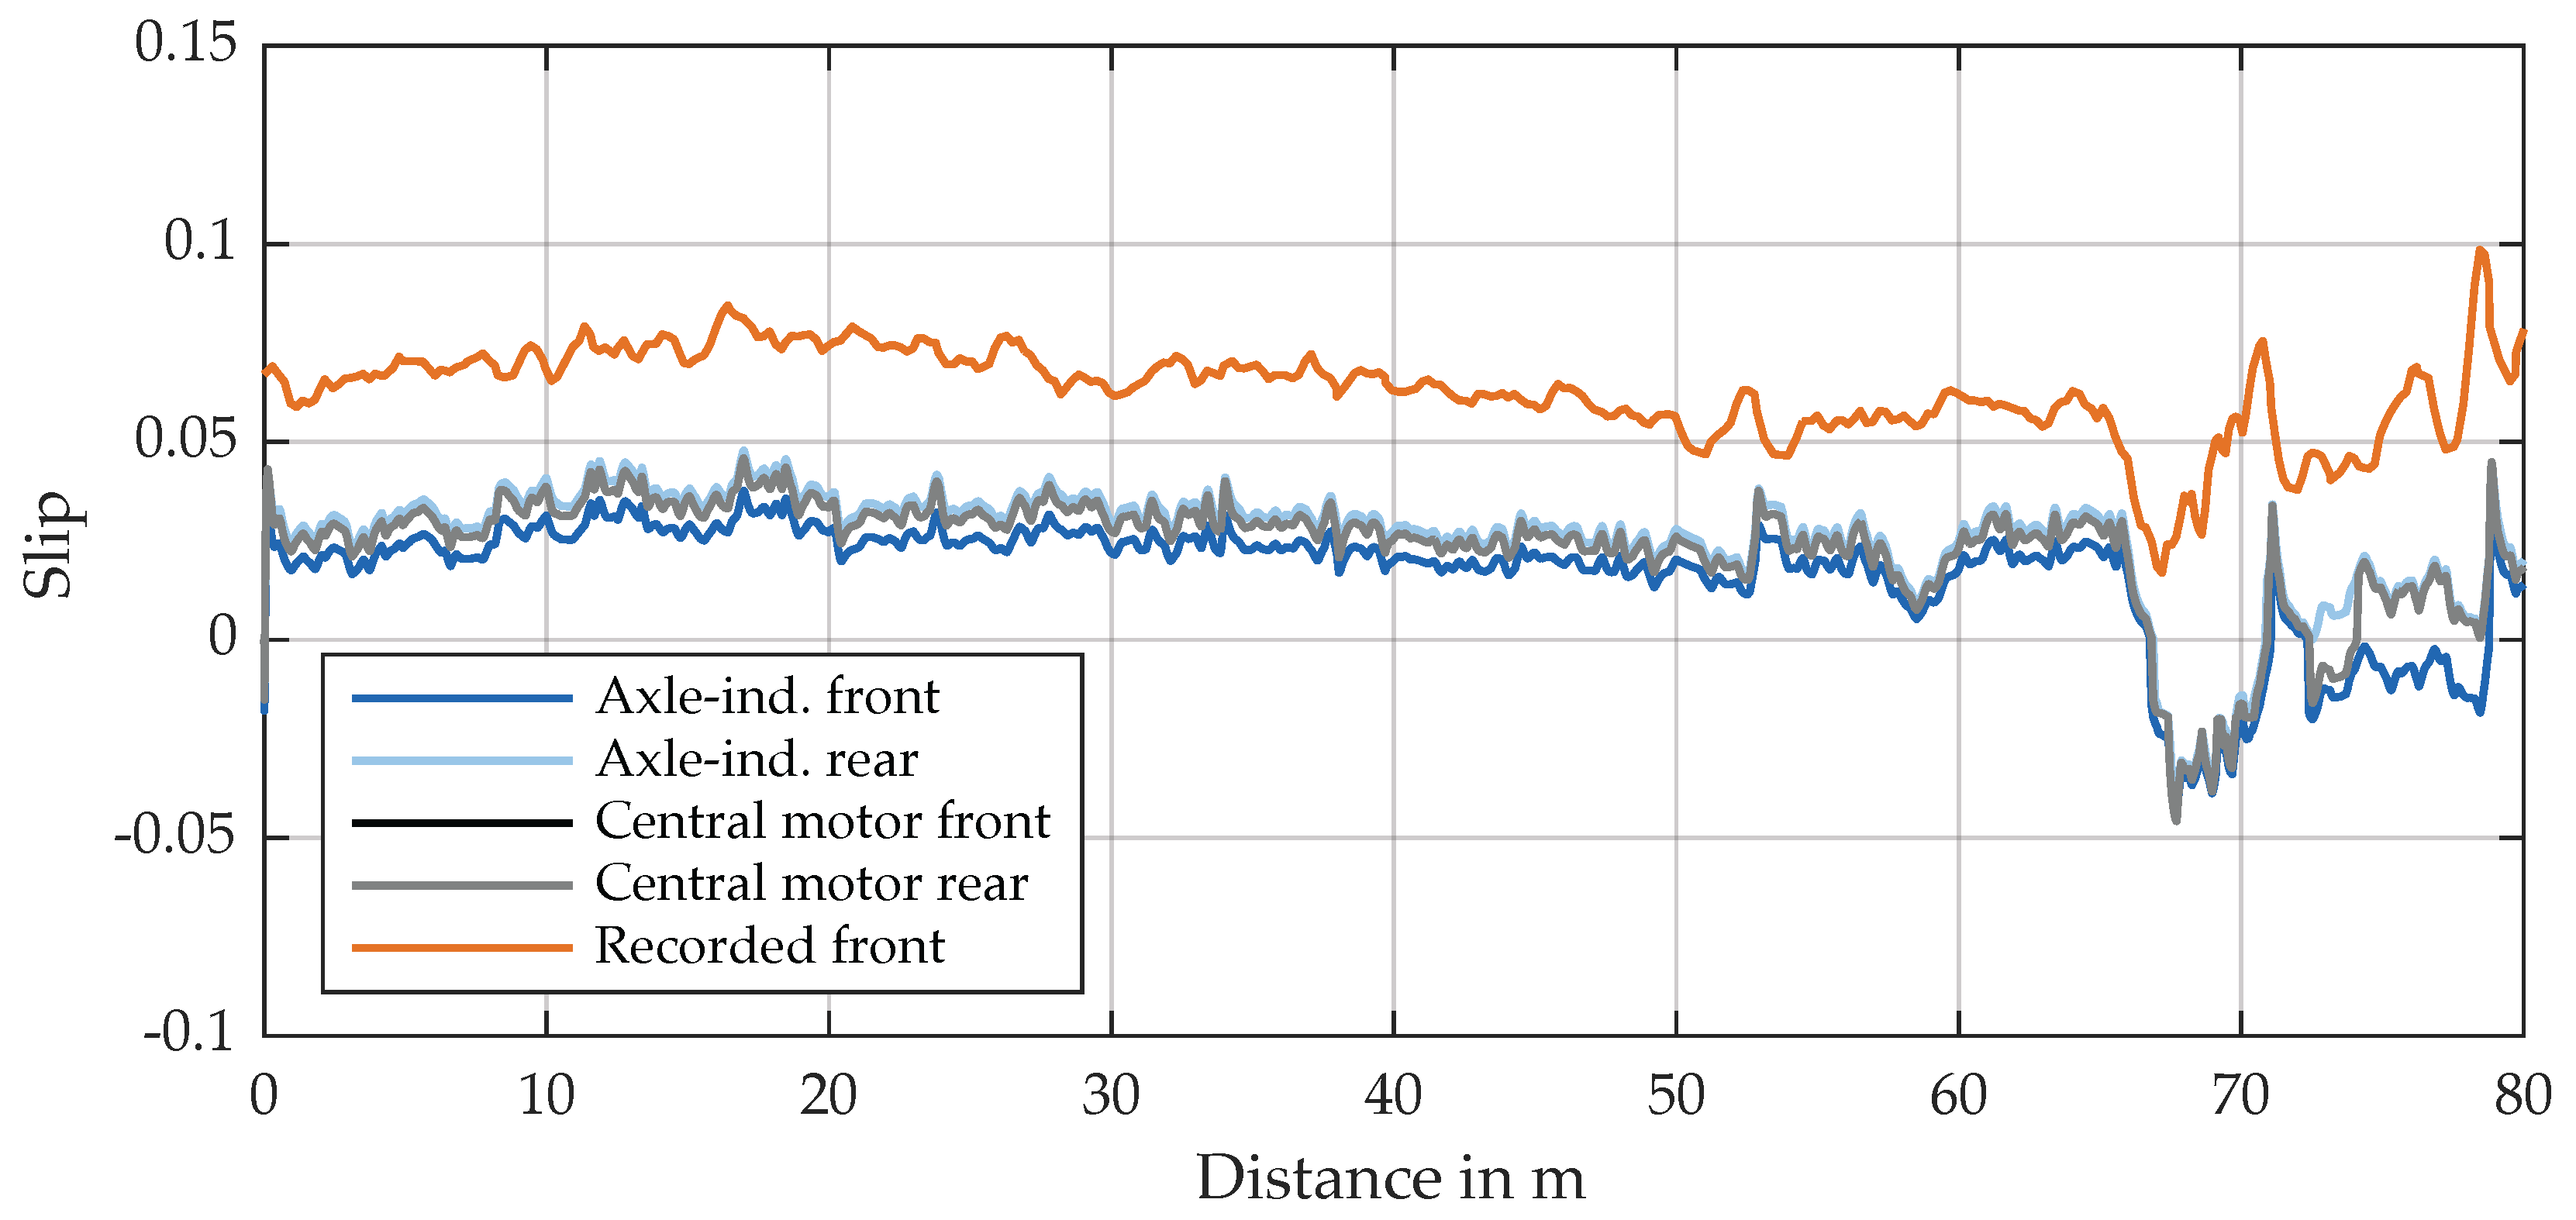
Figure 11 shows the occurring slip during the same cycle in comparison to the recorded tractor’s front axle. When looking at the front wheel slip during the recordings and in the simulation, we have a rather constant offset between the values. The difference between the simulated electric tractor and the recorded diesel tractor has several reasons that are connected with the actual transmitted traction force. At first, the weight distribution in the simulation does not include the implement weight. Additionally, the rear draft signal during the recordings is taken from the tractor’s internal sensors, which include unknown inaccuracies. Lastly, the tire–soil model from Zoz and Grisso [49] is semi-empirical, including assumptions for tire characteristics and the soil with the cone index, which indicates the soil’s ability to resist deformation. Future investigations might integrate measurements with refined rear draft signals and cone index measurements.
The identical slip at the front and rear axles at the axle-individual topology can act at the optimal traction at each axle without any coupling, as is the case with the central motor topology. Due to the coupling of the rotational speed between the rear and front axles through the transfer case, both axles cannot operate at the optimal slip and hence at the highest tractive efficiency.

5. Discussion

5.1. Performance of Optimized Topology

As shown in the previous section, due to our design methodology both topologies are comparable in terms of energy consumption, efficiency, and work covered. However, the axle-individual topology can be constantly driven with all-wheel drive, whereas the central motor must switch off the all-wheel drive and transfer the entirety of the traction solely to the rear axle during high speeds and tight curves due to the absence of a longitudinal differential. On the other hand, in the case of extremely unbalanced axle weight distribution—e.g., at slopes—the central motor topology can transfer the total power to one axle. The axis-individual topology is limited to the power installed on the loaded axis, so that such an architecture is unfavorable for mountainous terrain.
The designed topologies guarantee at least the same performance in draft force, velocity, and acceleration as the recorded diesel tractor. Hence, the optimization for minimal energy leads to a slightly over-sized design with throttle positions on average not exceeding 67% (Table A6).

5.2. Limitations of the Simulation

To provide with the optimization and simulation conclusive results, we use real-world load cycles. Due to the fact that they were recorded with a diesel-driven tractor with central motor topology, we present a way to split the total power into the actual traction and power take-off (PTO) demand; auxiliaries are assumed as a constant share in line with the literature but might vary regarding the load and tractor type. To refine the results, we propose future work to measure traction forces directly at the wheel hub and at the PTO shaft. The tire–soil interaction is limited to the adaptability of the model from Zoz and Grisso [49]. A direct measurement of the traction forces helps to refine the model for our environmental settings.
Additionally, the weight distribution between the axles was measured stationary, and the dynamic load distribution is calculated by the influence of acting resistance forces and slope angle. The geometries and weights of the simulated electric tractor are equated with those of the recorded tractor; the weight of the implement is neglected.
The generalizable methodology and the results of the simulation provide original equipment manufacturers with guidance on the optimum efficiency levels that can be achieved and farmers with an indication of which tasks can be easily integrated into daily operations with battery-powered tractors. Future investigations into practical suitability can base their case studies on the identified range of tasks and include further potential savings from electric drivetrains, such as the elimination of idling losses.

6. Conclusions

This article shows a methodology to design drivetrains for electric tractors and examines the optimal drivetrain topology for recorded real-world load cycles from a 104kW diesel tractor. To this end, we design axle-individual and central motor topologies and optimize the drivetrains with a solution space for each component. The optimization minimizes the energy requirement, which is derived from a longitudinal dynamic simulation developed specifically for electric tractors. The simulated electric drivetrains perform five different real load cycles with the power requirement for traction and PTO. The traction forces are derived using a semi-empirical tire–ground model that takes into account the ground interactions with the slip that occurs.
The results show similar efficiencies for the central motor and axle-individual topology, if optimized with our method. We designed the latter, with a 60 kW induction motor (IM) at the front axle and 85 kW (IM) at the rear axle coupled with a two-speed gearbox, which achieves an average drivetrain efficiency of 83%. With a 100 kWh battery, such a topology enables a running time of 7.5 h when fertilizing and up to 2.4 h when seeding. More energy-intensive tasks, such as disc harrowing, require recharging after just 1.4 h. The simulation clearly shows that battery electric tractors can cover half to full working days if they are selected for appropriate purposes and the drivetrain is optimized with the proposed solution space to the efficiencies shown. The proposed methodology helps original equipment manufacturers (OEMs) design highly efficient electric tractors to exploit economic potential and mitigate emissions in agriculture.

Author Contributions

First author, K.G., conceptualization, K.G.; methodology, K.G. and M.P.; software, M.P., L.M., S.M. and K.G.; validation, K.G. and M.P.; resources, M.L.; writing—original draft preparation, K.G. and M.P.; writing—review and editing, K.G. and M.L.; visualization, K.G. and M.P.; supervision, M.L. All authors have read and agreed to the published version of the manuscript.

Funding

This research was funded by European Union with the grant agreement 963530.

Data Availability Statement

The developed simulation model is available at the following open-source repository, created by the authors: https://github.com/korbig/E-Traculator.

Acknowledgments

We would like to thank the Bern University of Applied Sciences and Roger Stirnimann in particular for their support and the provision of measuring equipment.

Conflicts of Interest

The authors declare no conflicts of interest.

Abbreviations

The following abbreviations are used in this manuscript:
PTOpower take-off
PSMpermanent synchronous magnetic motor
IMinduction motor
ASABEAmerican Society of Agricultural and Biological Engineers
SAESociety of Automotive Engineers
PSOparticle swarm optimization
CIcone index
EDenergy demand

Appendix A

Table A1. Specifications for the simulated tractor adapted from the Fendt 314 Gen4 during the simulation.
SymbolParameterCategoryValue
mmass of tractorvehicle6380 kg
m f r o n t nominal mass on front axlevehicle2320 kg
m r e a r nominal weight on rear axlevehicle4060 kg
L WB wheelbasevehicle2.42 m
l r RW distance to COGvehicle L WB m r e a r m m
l f FW distance to COGvehicle L WB m f r o n t m m
h COG height of COGvehicle0.5 m
h hitch height of force attackvehicle0.5 m
l e a d FW FW leadvehicle0%
btire width unloadedrear tire 650/60 R38677 mm
front tire 540/65 R24532 mm
dtire diameter unloadedrear tire 650/60 R381735 mm
front tire 540/65 R241312 mm
δ vertical tire deflection under loadrear tire 650/60 R38118.5 mm
front tire 540/65 R2483.0 mm
htire section heightrear tire 650/60 R38406.2 mm
front tire 540/65 R24345.8 mm
m wheel , f / r tire weightrear tire 650/60 R38266 kg
front tire 540/65 R24171 kg
η T , F 314 Drivetrain efficiencyrecorded tractor0.85
η p t o , F 314 PTO efficiencyrecorded tractor0.95
c w drag coefficientdrag force0.9 [55]
ρ l air densitydrag force1.2 kg/m3
Afrontal areadrag force5.6 m2
θ gradient from load cycleslope force-
Table A2. Implement in operational cycle.
ImplementWidthMassRolling Resistance Coef.
Disc Harrow3 m--
Fertilizer25 m--
Seeder3 m--
Mower8.3 m--
Trailer-10.6 t0.1
Table A3. Fixed design parameters for electric tractor drivetrain.
SymbolParameterValue
η d i f f efficiency differential0.97
η F D efficiency final drive0.98
η t r a n s f e r efficiency transfer case0.96
i d i f f ratio differential4
i F D ratio final drive7
i t r a n s f e r ratio transfer case d r / d f
Table A4. Optimization parameters.
ParameterValue
Swarm Size200
Max. Iterations20
Inertia Range[0.7, 1.1]
Social Adjustment Weight0.2
Self Adjustment Weight0.5
Function Tolerance1 × 10 4
Table A5. Simulation parameters.
ParameterValue
SolverRunge-Kutta
Time step0.001
minimum velocity0.1 m s−1
max. velocity gear one15 km h−1
Torque distribution between front and rear axle:
f T g r o s s , f / r = T gross , f T gross , r + T gross , f
Drag force:
F a i r = 1 2 c w ρ A v 2
Slope downforce:
F s l o p e = m g s i n ( θ )
Mobility number:
B n = b · d · C I F W 1 + 5 δ h 1 + b d 1 + 3 b d
Cone index at the rear axle due to the multi-pass effect:
C I r = C I f ( 1 + 1.8 exp ( 0.11 B n ) )
Inertia
J wheel = 1 2 m wheel , f / r r wheel , f / r 2
Table A6. Results of Optimization: average throttle position during the cycles.
Avg. Throttle Position in %Axle-Ind., One GearAxle-Ind., Two GearCentral Motor, One GearCentral Motor, Two Gear
Disc Harrow66.0756.4665.8749.36
Fertilizing14.6713.1814.7811.97
Mowing12.1910.1211.979.24
Seeding33.9927.4634.3824.83
Transport64.3966.6463.8666.91

References

  1. Maja, M.M.; Ayano, S.F. The Impact of Population Growth on Natural Resources and Farmers’ Capacity to Adapt to Climate Change in Low-Income Countries. Earth Syst. Environ. 2021, 5, 271–283. [Google Scholar] [CrossRef]
  2. Statista. India—Diesel Consumption Volume in Agriculture Industry 2020; Statista: Munich, Germany, 2020. [Google Scholar]
  3. Olkkonen, V.; Lind, A.; Rosenberg, E.; Kvalbein, L. Electrification of the agricultural sector in Norway in an effort to phase out fossil fuel consumption. Energy 2023, 276, 127543. [Google Scholar] [CrossRef]
  4. Mrema, G.C.; Kienzle, J.; Rome, J.J. Current Status and Future Prospects of Agricultural Mechanization in Sub-Saharan Africa [SSA]. AMA Agric. Mech. Asia Afr. Lat. Am. 2018, 49, 13–30. [Google Scholar]
  5. Lagnelöv, O.; Dhillon, S.; Larsson, G.; Nilsson, D.; Larsolle, A.; Hansson, P.A. Cost analysis of autonomous battery electric field tractors in agriculture. Biosyst. Eng. 2021, 204, 358–376. [Google Scholar] [CrossRef]
  6. Beligoj, M.; Scolaro, E.; Alberti, L.; Renzi, M.; Mattetti, M. Feasibility Evaluation of Hybrid Electric Agricultural Tractors Based on Life Cycle Cost Analysis. IEEE Access 2022, 10, 28853–28867. [Google Scholar] [CrossRef]
  7. Kivekäs, K.; Lajunen, A. Effect of Soil Properties and Powertrain Configuration on the Energy Consumption of Wheeled Electric Agricultural Robots. Energies 2024, 17, 966. [Google Scholar] [CrossRef]
  8. Beltrami, D.; Iora, P.; Tribioli, L.; Uberti, S. Electrification of Compact Off-Highway Vehicles—Overview of the Current State of the Art and Trends. Energies 2021, 14, 5565. [Google Scholar] [CrossRef]
  9. Graeub, B.E.; Chappell, M.J.; Wittman, H.; Ledermann, S.; Kerr, R.B.; Gemmill-Herren, B. The State of Family Farms in the World. World Dev. 2016, 87, 1–15. [Google Scholar] [CrossRef]
  10. AGCO Fendt. Fendt e100 Vario—Der E-Standardtraktor. 2025. Available online: https://www.fendt.com/de/landmaschinen/e-traktoren/fendt-e100vario (accessed on 17 February 2025).
  11. Böhrnsen, A. Neuer 100-kW-Elektro-Traktor von Tadus. Profi Online. 29 September 2023. Available online: https://www.profi.de/aktuell/aktuelle-meldungen/neuer-100-kw-elektro-traktor-von-tadus-31143.html (accessed on 17 February 2025).
  12. Rigitrac Traktorenbau. Rigitrac SKE 40 Electric. 2023. Available online: https://www.rigitrac.ch/produkte-1/rigitrac-ske-40-electric/ (accessed on 17 February 2025).
  13. Monarch Tractor. World’s First Electric Autonomous Tractor | Monarch Tractor. 2025. Available online: https://www.monarchtractor.com/ (accessed on 17 February 2025).
  14. Deere & Company. John Deere Stellt Neue Autonome Maschinen und Technologien auf der CES 2025. 2025. Available online: https://www.deere.de/de/unser-unternehmen/news-und-medien/pressemeldungen/2025/john-deere-stellt-neue-autonome-maschinen-und-technologien-auf-der-ces-2025-vor.html (accessed on 17 February 2025).
  15. Götz, K.; Pizzinini, C.; Strauss, J.; Tennakoon, S.; Menelaos, M.; Booysen, T.; Lienkamp, M. Conception of an electric tractor for farming in sub-Saharan Africa. In Proceedings of the 7th E-Mobility Power System Integration Symposium (EMOB 2023), Copenhagen, Denmark, 25 September 2023; pp. 221–227. [Google Scholar] [CrossRef]
  16. Serrao, L. Driving the electric transformation—The evolution of off-highway powertrain. In Powertrain Systems in Mobile Machines 2022; VDI Verlag: Ludwigsburg, Germany, 2022; pp. 135–150. [Google Scholar] [CrossRef]
  17. Felden, M.; Butterling, P.; Jeck, P.; Eckstein, L.; Hameyer, K. Electric vehicle drive trains: From the specification sheet to the drive-train concept. In Proceedings of the 2010 14th International Power Electronics and Motion Control Conference (EPE/PEMC 2010), Ohrid, Macedonia, 6–8 September 2010. [Google Scholar] [CrossRef]
  18. Pesce, T.; Lienkamp, M. Definition And Optimization of the Drive Train Topology for Electric Vehicles. World Electr. Veh. J. 2012, 5, 24–35. [Google Scholar] [CrossRef]
  19. Baek, S.Y.; Kim, Y.S.; Kim, W.S.; Baek, S.M.; Kim, Y.J. Development and Verification of a Simulation Model for 120 kW Class Electric AWD (All-Wheel-Drive) Tractor during Driving Operation. Energies 2020, 13, 2422. [Google Scholar] [CrossRef]
  20. Baek, S.Y.; Baek, S.M.; Jeon, H.H.; Kim, W.S.; Kim, Y.S.; Sim, T.Y.; Choi, K.H.; Hong, S.J.; Kim, H.; Kim, Y.J. Traction Performance Evaluation of the Electric All-Wheel-Drive Tractor. Sensors 2022, 22, 785. [Google Scholar] [CrossRef]
  21. Cheng, Z.; Zhou, H.; Lu, Z. A Novel 10-Parameter Motor Efficiency Model Based on I-SA and Its Comparative Application of Energy Utilization Efficiency in Different Driving Modes for Electric Tractor. Agriculture 2022, 12, 362. [Google Scholar] [CrossRef]
  22. Li, T.; Xie, B.; Li, Z.; Li, J. Design and Optimization of a Dual-Input Coupling Powertrain System: A Case Study for Electric Tractors. Appl. Sci. 2020, 10, 1608. [Google Scholar] [CrossRef]
  23. Chen, Y.; Xie, B.; Du, Y.; Mao, E. Powertrain parameter matching and optimal design of dual-motor driven electric tractor. Int. J. Agric. Biol. Eng. 2019, 12, 33–41. [Google Scholar] [CrossRef]
  24. van Dingenen, J.; Faggiani, G.; Serrao, L. Evolution of transmission technology for electric off-highway machines. In Powertrain Systems in Mobile Machines 2024; VDI-Berichte, VDI Verlag GmbH: Düsseldorf, Germany, 2024; pp. 79–94. [Google Scholar] [CrossRef]
  25. Machado, F.; Kollmeyer, P.; Barroso, D.; Emadi, A. Multi-Speed Gearboxes for Battery Electric Vehicles: Current Status and Future Trends. IEEE Open J. Veh. Technol. 2021, 2, 419–435. [Google Scholar] [CrossRef]
  26. Kampker, A.; Heimes, H.H.; Schmitt, F.; Backes, T.; Betz, M.; Hadzovic, T. Design of an Electric Drive Axle for Heavy Duty Commercial Vehicles in the Long-Haul Application Under Consideration of Energy Consumption. In Proceedings of the 2022 12th International Electric Drives Production Conference (EDPC), Regensburg, Germany, 29–30 November 2022; pp. 1–8. [Google Scholar] [CrossRef]
  27. Gözen, E.; Çevirgen, M.S.; Özgül, E. Transmission speed and ratio optimization for heavy-duty electric truck. Heliyon 2022, 8, e10028. [Google Scholar] [CrossRef] [PubMed]
  28. Domingues-Olavarria, G.; Marquez-Fernandez, F.J.; Fyhr, P.; Reinap, A.; Andersson, M.; Alakula, M. Optimization of Electric Powertrains Based on Scalable Cost and Performance Models. IEEE Trans. Ind. Appl. 2019, 55, 751–764. [Google Scholar] [CrossRef]
  29. Eghtessad, M.; Meier, T.; Rinderknecht, S.; Küçükay, F. Antriebsstrangoptimierung von Elektrofahrzeugen. ATZ—Automob. Z. 2015, 117, 78–85. [Google Scholar] [CrossRef]
  30. Schönknecht, A.; Babik, A.; Rill, V. Electric Powertrain System Design of BEV and HEV Applying a Multi Objective Optimization Methodology. Transp. Res. Procedia 2016, 14, 3611–3620. [Google Scholar] [CrossRef]
  31. Verbruggen, F.J.R.; Silvas, E.; Hofman, T. Electric Powertrain Topology Analysis and Design for Heavy-Duty Trucks. Energies 2020, 13, 2434. [Google Scholar] [CrossRef]
  32. Fries, M.; Lehmeyer, M.; Lienkamp, M. Multi-criterion optimization of heavy-duty powertrain design for the evaluation of transport efficiency and costs. In Proceedings of the IEEE ITSC 2017, Yokohama, Japan, 16–19 October 2017; pp. 1–8. [Google Scholar] [CrossRef]
  33. Wang, B.; Xu, M.; Yang, L. Study on the economic and environmental benefits of different EV powertrain topologies. Energy Convers. Manag. 2014, 86, 916–926. [Google Scholar] [CrossRef]
  34. Lajunen, A. Comparison of Different Powertrain Configurations for Electric City Bus. In Proceedings of the 2014 IEEE Vehicle Power and Propulsion Conference (VPPC), Coimbra, Portugal, 27–30 October 2014; pp. 1–5. [Google Scholar] [CrossRef]
  35. Pathak, A.; Sethuraman, G.; Krapf, S.; Ongel, A.; Lienkamp, M. Exploration of Optimal Powertrain Design Using Realistic Load Profiles. World Electr. Veh. J. 2019, 10, 56. [Google Scholar] [CrossRef]
  36. Götz, K.; Kusuma, A.; Dörfler, A.; Lienkamp, M. Agricultural load cycles: Tractor mission profiles from recorded GNSS and CAN bus data. Data Brief 2025, 60, 111494. [Google Scholar] [CrossRef] [PubMed]
  37. Lajunen, A.; Kivekäs, K.; Freyermuth, V.; Vijayagopal, R.; Kim, N. Simulation of Alternative Powertrains in Agricultural Tractors. In Proceedings of the 36th International Electric Vehicle Symposium and Exhibition (EVS36), Sacramento, CA, USA, 11–14 June 2023; pp. 1–11. [Google Scholar]
  38. Regazzi, N.; Maraldi, M.; Molari, G. A theoretical study of the parameters affecting the power delivery efficiency of an agricultural tractor. Biosyst. Eng. 2019, 186, 214–227. [Google Scholar] [CrossRef]
  39. Lajunen, A. Simulation of energy efficiency and performance of electrified powertrains in agricultural tractors. In Proceedings of the 2022 IEEE Vehicle Power and Propulsion Conference (VPPC), Merced, CA, USA, 1–4 November 2022; pp. 1–6. [Google Scholar] [CrossRef]
  40. Lagnelöv, O.; Larsson, G.; Nilsson, D.; Larsolle, A.; Hansson, P.A. Performance comparison of charging systems for autonomous electric field tractors using dynamic simulation. Biosyst. Eng. 2020, 194, 121–137. [Google Scholar] [CrossRef]
  41. American Society of Agricultural and Biological Engineers. Agricultural Machinery Management Data; American Society of Agricultural and Biological Engineers: St. Joseph, MI, USA, 2011; p. 1. [Google Scholar] [CrossRef]
  42. Renius, K.T. Fundamentals of Tractor Design; Springer: Cham, Germany, 2020. [Google Scholar]
  43. Götz, K. Agricultural Load Cycles: Tractor Mission Profiles From Recorded Gnss and Can Bus Data. Zenodo 2025. [Google Scholar] [CrossRef]
  44. Chang, F.; Ilina, O.; Hegazi, O.; Voss, L.; Lienkamp, M. Adopting MOSFET multilevel inverters to improve the partial load efficiency of electric vehicles. In Proceedings of the 2017 19th European Conference on Power Electronics and Applications (EPE’17 ECCE Europe), Warsaw, Poland, 11–14 September 2017; pp. P.1–P.13. [Google Scholar] [CrossRef]
  45. Wassiliadis, N.; Steinsträter, M.; Schreiber, M.; Rosner, P.; Nicoletti, L.; Schmid, F.; Ank, M.; Teichert, O.; Wildfeuer, L.; Schneider, J.; et al. Quantifying the state of the art of electric powertrains in battery electric vehicles: Range, efficiency, and lifetime from component to system level of the Volkswagen ID.3. eTransportation 2022, 12, 100167. [Google Scholar] [CrossRef]
  46. Goss, J. Performance Analysis of Electric Motor Technologies for an Electric Vehicle Powertrain. 2019. Available online: https://www.semanticscholar.org/paper/Performance-Analysis-of-Electric-Motor-Technologies/c547b9dc18ae70ab987c3903796b5d958c7e9840 (accessed on 9 August 2025).
  47. Luque, P.; Mántaras, D.A.; Roces, J.; Castejón, L.; Malón, H.; Valladares, D. Optimization of the powertrain of electric vehicles for a given route. Transp. Res. Procedia 2021, 58, 246–253. [Google Scholar] [CrossRef]
  48. Hegazy, O.; van Mierlo, J. Particle Swarm Optimization for optimal powertrain component sizing and design of fuel cell hybrid electric vehicle. In Proceedings of the 2010 12th International Conference on Optimization of Electrical and Electronic Equipment, Brasov, Romania, 20–22 May 2010; pp. 601–609. [Google Scholar] [CrossRef]
  49. Zoz, F.; Grisso, R. Traction and tractor performance. In SAE Distinguished Lecture # 27, Agricultural; SAE International: Warrendale, PA, USA, 2003. [Google Scholar]
  50. MacAdam, C.C. An Optimal Preview Control for Linear Systems. J. Dyn. Syst. Meas. Control 1980, 102, 188–190. [Google Scholar] [CrossRef]
  51. Brixius, W.W. Traction Prediction Equations for Bias Ply Tires. In ASAE Paper 87-1622; American Society of Agricultural Engineers: St. Joseph, MI, USA, 1987; p. 8. [Google Scholar]
  52. Mattetti, M.; Annesi, G.; Intrevado, F.P.; Alberti, L. Investigating the efficiency of hybrid architectures for agricultural tractors using real-world farming data. Appl. Energy 2025, 377, 124499. [Google Scholar] [CrossRef]
  53. Saetti, M.; Mattetti, M.; Varani, M.; Lenzini, N.; Molari, G. On the power demands of accessories on an agricultural tractor. Biosyst. Eng. 2021, 206, 109–122. [Google Scholar] [CrossRef]
  54. Angelucci, L.; Varani, M.; Pinet, F.; Martin, V.; Vertua, A.; Molari, G.; Mattetti, M. The role of tyres and soil conditions in enhancing the efficiency of agricultural tractors. Soil Tillage Res. 2025, 251, 106570. [Google Scholar] [CrossRef]
  55. Reif, K.; Dietsche, K.H. Bosch Automotive Handbook, 9th ed.; John Wiley & Sons Ltd.: New York, NY, USA, 2014. [Google Scholar]
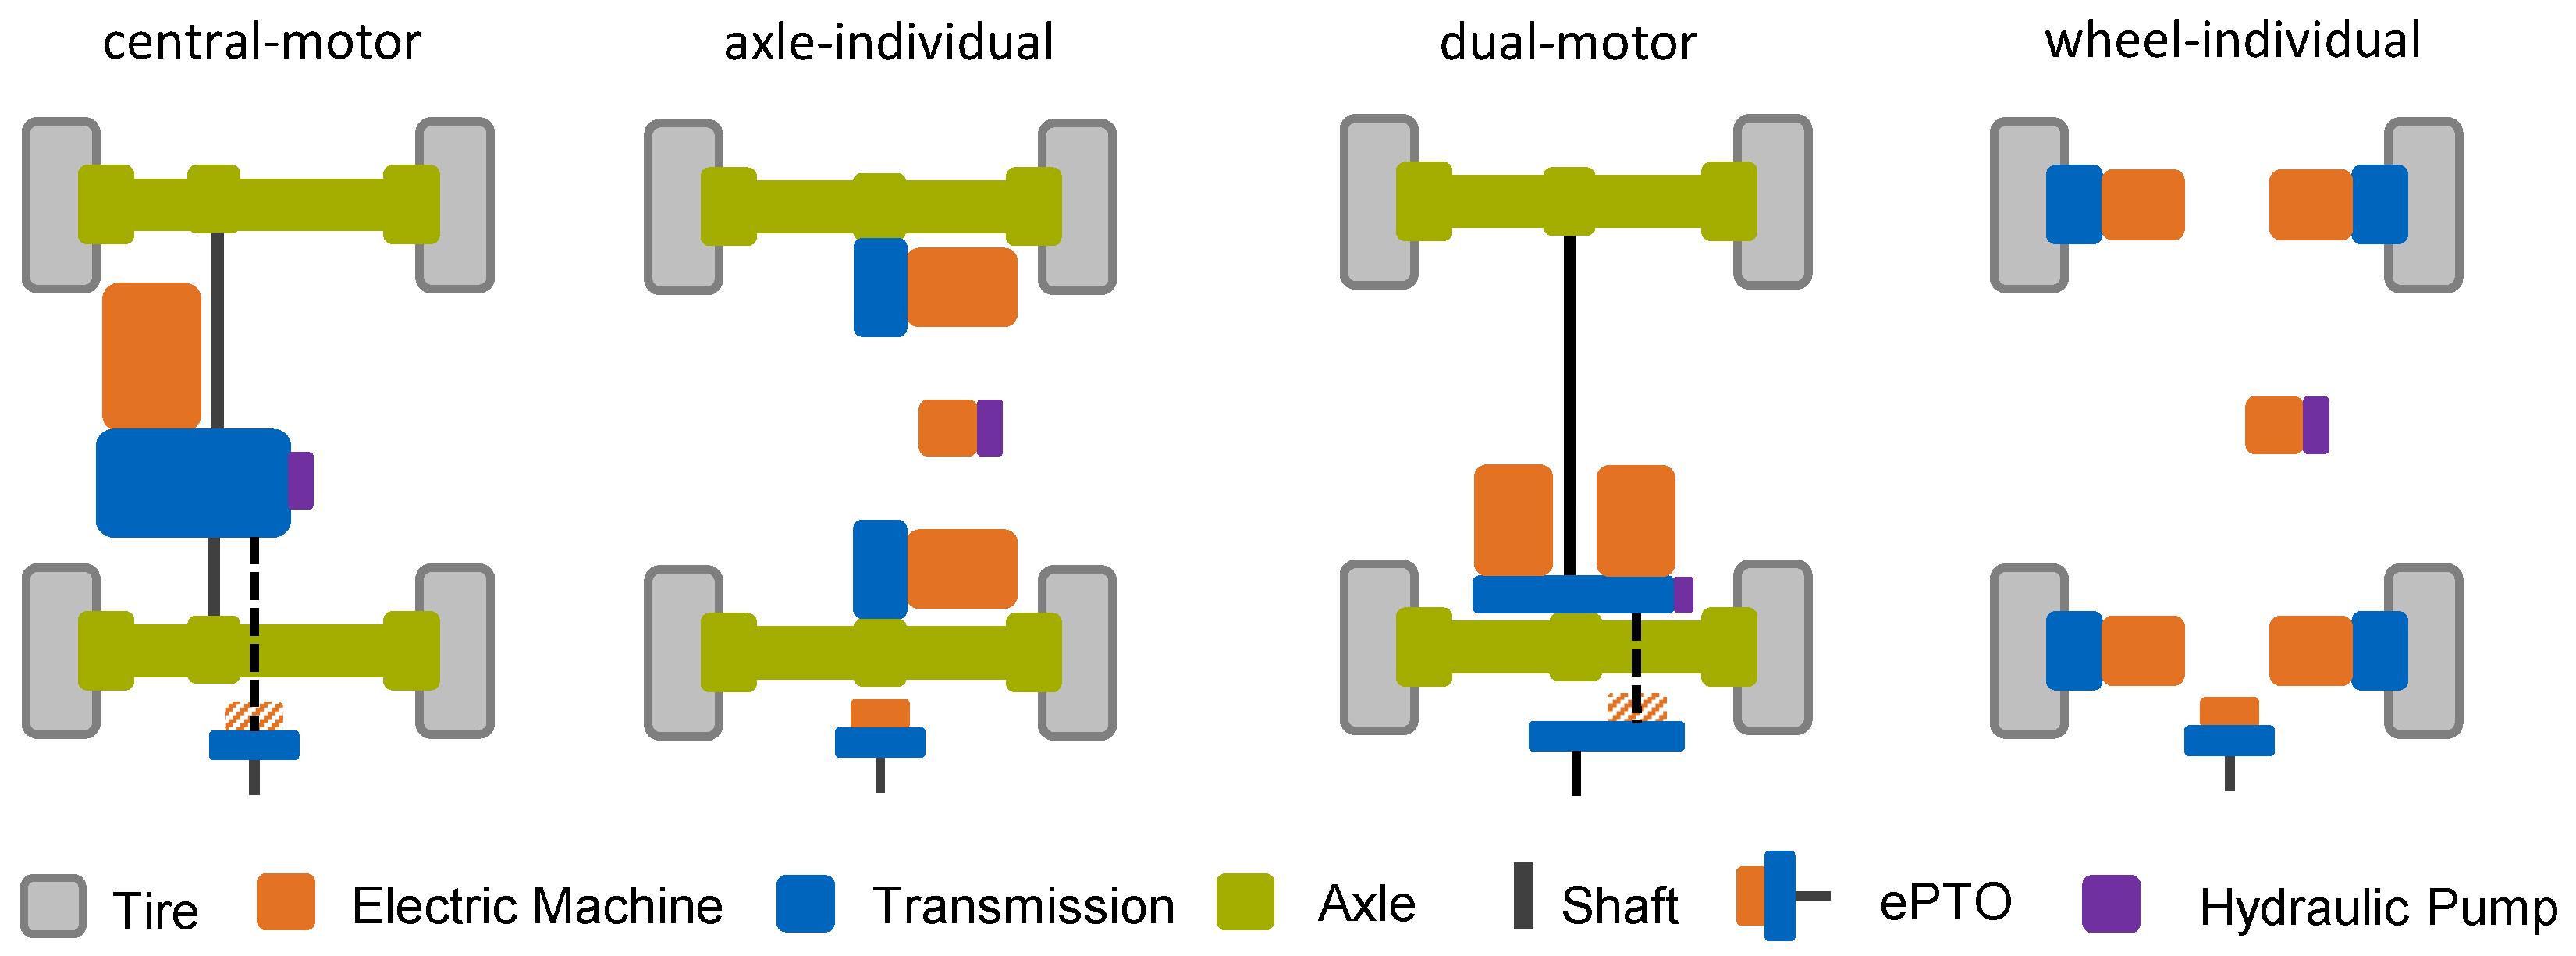
Figure 1. Overview of various possible drivetrain topologies for electric tractors. The overview includes the drivetrain, PTO, and auxiliaries as hydraulics.
Wevj 16 00463 g001
Figure 2. Methodology to derive an optimized drivetrain based on real-world load cycles with a forward longitudinal dynamic simulation.
Wevj 16 00463 g002
Figure 3. Procedure for the sizing of the inverter, motors, and transmission with efficiency maps from literature.
Wevj 16 00463 g003
Figure 4. Longitudinal dynamic simulation for the energy efficiency and consumption during the load cycles.
Wevj 16 00463 g004
Figure 5. Sum of the resistance forces which need to be overcome by the traction drive across the different operations.
Wevj 16 00463 g005
Figure 6. Result of the drivetrain design optimization: power of the motors and gear step for the most efficient configurations for the axle-individual and central motor topologies.
Wevj 16 00463 g006
Figure 7. Drivetrain and tractive efficiency for the optimized drivetrains during the disc harrowing cycle.
Wevj 16 00463 g007
Figure 8. Operating times: running time in hours for a 100 kWh battery for the optimized drivetrains. The left axis shows the runtime, and the right axis corresponds to the consumption for the runtime. The running time and consumption are shown for different target velocities: the circle indicates the target velocity, and the bar indicates a velocity range of 80–120% of the target speed. The transport cycle covers a maximum of 100% of the target speed.
Wevj 16 00463 g008
Figure 9. Difference between optimized and intentionally oversized drivetrain: the figure shows the accumulated efficiency map of the complete drivetrains for the optimized two-gear central motor architecture and the oversized reference configuration, including the load points.
Wevj 16 00463 g009
Figure 10. Velocity for the optimal axle-individual and central motor topologies with two gears in comparison to the recorded tractor during the seeding cycle.
Wevj 16 00463 g010
Figure 11. Slip for the optimal axle-individual and central motor topologies with two gears in comparison to the recorded tractor during the seeding cycle.
Wevj 16 00463 g011
Table 1. Composition of the reference cycle according to the data from Götz et al. [43] and the time shares from Renius [42]. The experimental setup for the cycle data is described in the former.
Work TypeTime ShareTraveled DistanceAverage SpeedImplement WidthCone Index CI
Wevj 16 00463 i001Tillage45%638 m9.9 km/h3 m900 kPa
Wevj 16 00463 i002Fertilizing12%319 m9.5 km/h15 m700 kPa
Wevj 16 00463 i003Seed drill combination10%97 m6.8 km/h3 m450 kPa
Wevj 16 00463 i004Mowing15%272 m10.1 km/h8.3 m1200 kPa
Wevj 16 00463 i005Transport18%711 m28.7 km/h13 t1800 kPa
Table 2. Considered solutions for the optimization.
TopologyComponentComponent CharacteristicNumber of Variants
axle-individualcentral motorInverter typeIGBT1
Wevj 16 00463 i006Wevj 16 00463 i007Machine typePSM, IM2
Transmission—number of gears1, 22
Power rear axle50–150 kW in steps of 5315
Power front axle30–100 kW in steps of 5
Power CM70–220 kW in steps of 531
Gear step1.0–3.0 in steps of 0.121
Table 3. Results of optimization: efficiencies and energy consumption per operation.
VariableAxle-Ind., One GearAxle-Ind., Two GearCentral Motor, One GearCentral Motor, Two Gear
η PDE 0.5790.5820.5710.574
η TE 0.7000.7000.7000.700
η DT 0.8270.8330.8160.820
Energy Demand in kW h ha−1
Disc Harrow26.6126.6627.1826.92
Fertilizing0.530.530.540.55
Mowing4.044.004.064.07
Seeding30.3029.6730.5429.92
Transport2.872.882.902.92
Disclaimer/Publisher’s Note: The statements, opinions and data contained in all publications are solely those of the individual author(s) and contributor(s) and not of MDPI and/or the editor(s). MDPI and/or the editor(s) disclaim responsibility for any injury to people or property resulting from any ideas, methods, instructions or products referred to in the content.