Abstract
This study combines text mining and binary logit model to analyze the main influencing factors of consumers’ purchase intention for new energy vehicles (NEVs) in Urumqi. Through the analysis of 34,561 consumer reviews and 400 valid questionnaire data, the study found that battery technology, sales price, and policy support have a significant impact on purchase intention. Based on the differences in consumers’ price sensitivity, technology preference, and policy support, this paper segments consumers into six groups. Based on these findings, we propose policy recommendations to optimize subsidy policies, promote battery technology upgrades, and improve charging infrastructure, in order to drive the development of the NEV market.
1. Introduction
With the increasingly serious problem of global climate change, governments have taken measures to reduce greenhouse gas emissions [1,2]. New Energy Vehicles (NEVs), as one of the effective means to replace traditional fuel vehicles, are of great significance in energy saving and emission reduction [3,4,5]. The carbon peaking and carbon neutrality goals proposed by the Chinese government have made the New Energy Vehicles industry a strategic focus of national development. The government encourages consumers to choose New Energy Vehicles by implementing various policies, such as subsidies, tax exemptions, and infrastructure construction [6,7,8]. However, despite the increasing policy support, consumers’ willingness to purchase is still affected by a variety of factors. In particular, consumers’ knowledge of New Energy Vehicles, environmental awareness, economic status and the degree of improvement of related supporting facilities all profoundly affect their decision-making [9,10,11].
In China, the government has given strong support to the new energy vehicles industry, especially in the context of the carbon peaking and carbon neutrality goals, the market of new energy vehicles has been promoted by both policy and technology [12,13,14]. However, the rapid growth of the market has not fully covered all regions, especially in areas like Urumqi, where the level of economic development is relatively low, the climate is cold and the infrastructure is relatively weak [15], the popularization of new energy vehicles is facing even greater difficulties. As the capital of Xinjiang Uygur Autonomous Region (XUAR), Urumqi, despite possessing certain market potential, still has major obstacles regarding the popularization of new energy vehicles due to the special characteristics of its geographic and socio-economic environment. In 2018, the annual sales volume of new energy vehicles in Urumqi was 730, accounting for 0.59% of the total local automobile sales volume. During the same period, the national sales volume of new energy vehicles exceeded 1 million, accounting for 3.73% of the total automobile sales volume, which was six times that of Urumqi. In terms of car ownership, the number of new energy vehicles in Urumqi was 2837, accounting for 0.27%. However, the national average was 1.11%, and the difference between Urumqi and the national average was about four times [16]. Therefore, it is of great significance to conduct a study on the purchase intention of consumers in Urumqi to explore the key factors affecting their purchase decisions and to promote the healthy development of the local new energy vehicles market.
Currently, research on the purchase intention of new energy vehicles has achieved certain results in several fields, especially in the study of consumer behavior in large and medium-sized cities, where scholars have generally explored the influence of factors such as price, subsidies for purchasing vehicles, range, and charging facilities on consumer decision-making [16,17,18,19,20]. However, these studies mainly focus on regions with more mature economic development, ignoring the specific market demand in second- and third-tier cities like Urumqi, especially in the Xinjiang region. In addition, the analysis methods of the existing studies are mostly traditional questionnaire surveys and statistical regression analysis [21,22], which, although of some significance, fail to fully explore and utilize big data platforms and text mining techniques to extract deeper demand information from consumers’ actual feedback.
Therefore, this paper aims to supplement the shortcomings in the study by first collecting online comments and feedback from consumers in Urumqi through a big data platform, and using text mining techniques to deeply analyze consumers’ opinions and extract key purchase motivators. Second, a binary logit regression model is used to quantitatively analyze the influence of each factor on consumers’ willingness to purchase new energy vehicles, and market segmentation is performed by combining consumers’ personalized needs. Finally, targeted policy recommendations and marketing strategies are proposed based on the findings. Through this study, we expect to provide theoretical support and practical guidance for the development of the new energy vehicles market in Urumqi and other similar regions and help the industry develop in a healthy and sustainable manner.
2. Mining of Influencing Factors Based on the Autohome Platform
2.1. Data Collection
In order to analyze the influencing factors of consumers’ purchase intention in Urumqi, this paper selects the top ten selling vehicle lines as the research object based on the sales ranking data of new energy vehicles from January to November 2024 provided by the China Passenger Vehicle Association. On this basis, this paper utilizes text mining technology to crawl the consumer review data of these vehicle lines in other regions of the country from the website of Autohome.
In the data processing process, Python 3.11 version of the foolnltk package was used for word splitting, which is based on deep learning technology with high accuracy, and irrelevant words were eliminated by a Chinese deactivation word list. By data cleaning and preprocessing the 37,441 raw comments that were crawled, 34,561 valid text data related to the research topic were finally obtained. The comment data were manually checked and censored to eliminate the parts that were irrelevant to the research topic. The specific operation flow is shown in Figure 1.
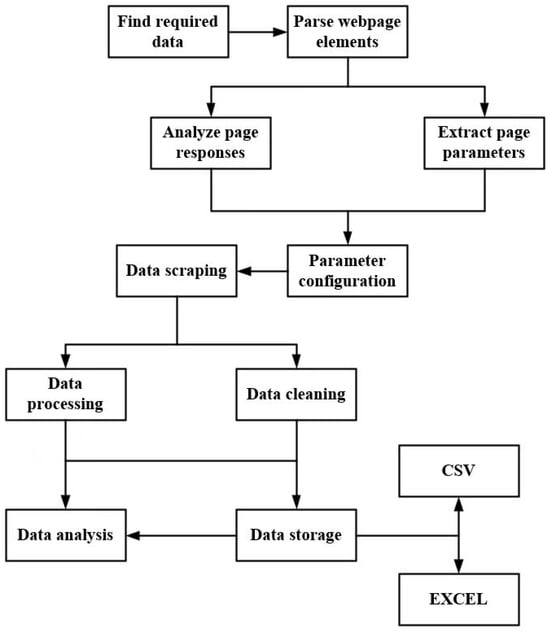
Figure 1.
Web crawler specific process.
The rigorous and systematic data collection and preprocessing work has laid a solid data foundation for further exploring the influencing factors of consumers’ willingness to purchase new energy vehicles in Urumqi.
2.2. Frequency Analysis of Words
In the word frequency statistics of the text after word processing, this paper removes meaningless words, adverbs, adjectives, and other irrelevant components, and extracts the top ten keywords, as shown in Table 1.

Table 1.
Frequency of comment words in the national area.
Consumers’ concerns about new energy vehicles nationwide center on features such as space, range, exterior, charging, and interior. Among them, “space” has the highest frequency, indicating that consumers are particularly concerned about the size of the interior space of new energy vehicles. Among the emotion words, “satisfaction” accounts for the highest proportion, reflecting consumers’ high overall recognition of new energy vehicles.
2.3. LDA Thematic Clustering
The implicit Dirichlet distribution is a statistical model commonly used in text analysis to extract potential topics from a collection of documents. In this paper, the perplexity of the LDA model was calculated by SPSS (version 17.0, IBM, Armonk, NY, USA), and usually, the smaller the perplexity, the better the topic clustering effect. After determining the optimal number of topics, this paper implemented LDA Topic Cluster Analysis.
Combined with the LDA model, this paper divides the collected text data of new energy vehicles consumers into five main themes. The LDA analysis of different themes can be seen specifically in Table 2.
Table 2.
LDA Thematic analysis results.
Topic I: Charging and Rear Space. This topic reflects consumers’ concerns about charging convenience and driving comfort, especially regarding charging speed and the accessibility of charging stations. With the increasing popularity of new energy vehicles, consumers are paying more and more attention to the distribution of charging facilities and the convenience of charging. Especially in cold climate regions like Urumqi, where low temperatures have a significant impact on battery performance and charging speed, consumers’ attention to the charging experience is even stronger. Furthermore, the comfort of the rear space is also an important factor determining purchasing intentions, especially in the context of family cars, where consumers place greater emphasis on ride comfort.
Topic II: Consumer Economics and Usage Preferences. This topic primarily focuses on price and economics, reflecting consumers’ emphasis on cost-effectiveness when choosing new energy vehicles. Consumers generally pay close attention to the purchase cost of vehicles and the economic efficiency of daily use, especially in terms of electricity costs and long-term usage expenses.
Topic III: Appearance Design and Functional Configuration. This topic reveals the importance consumers place on appearance design and door functions, especially when choosing new energy vehicles. Appearance design and vehicle functionality become significant factors influencing purchasing intentions. Consumers have high requirements for the appearance of cars, especially young people and fashion-oriented consumers. They value whether the car’s appearance conforms to their personal esthetic and reflects their lifestyle and personality. In addition, door design and basic vehicle functions such as door opening and seat comfort also have a significant impact on purchasing decisions.
Topic IV: Charging Speed and Intelligent Functions. This topic reflects the high attention consumers pay to charging speed and intelligent functions. As the new energy vehicle market gradually matures, consumers’ expectations for charging time are gradually increasing. Especially in daily use, charging speed has become one of the key factors influencing consumer decisions. Consumers hope that charging can not only be completed conveniently but also quickly, to avoid long waiting times. Furthermore, intelligent functions have become an important consideration for modern consumers when choosing new energy vehicles, especially for young groups and technology-oriented consumers.
Theme V: Battery Performance and Endurance. This topic focuses on battery technology and endurance, indicating consumers’ high attention to battery performance. With the popularity of new energy vehicles, battery endurance has become one of the most concerned factors for consumers when choosing new energy vehicles. Especially in long-distance driving and cold climates, the low-temperature performance and endurance of batteries are particularly important. When choosing new energy vehicles, consumers pay more attention to whether the battery can meet their daily travel needs. Especially in cold regions like Urumqi, the low-temperature adaptability and endurance of battery technology directly affect consumers’ purchasing decisions.
3. Design of Survey Programs Based on Text Mining
3.1. Questionnaire Design
The questionnaire was designed using a combination of single-choice questions and matrix scale questions and combined with the results of the above crawl data risk. This article analyzes consumer reviews through LDA topic modeling, identifying multiple topics related to new energy vehicles, including charging experience, brand preference, and battery technology. Based on the LDA analysis results, we designed innovative questionnaire questions, especially in areas such as charging experience and brand identity, which are factors not previously covered in traditional new energy vehicle research. By introducing these new questions, the questionnaire in this article can more comprehensively capture the actual needs of consumers, enhancing the depth and representativeness of the survey.
Furthermore, this article combines the questionnaire designed in the literature [23,24,25,26] and the actual situation in the city of Urumqi to ensure that it can be a comprehensive assessment of the consumer’s willingness to buy the design logic is shown in Figure 2.
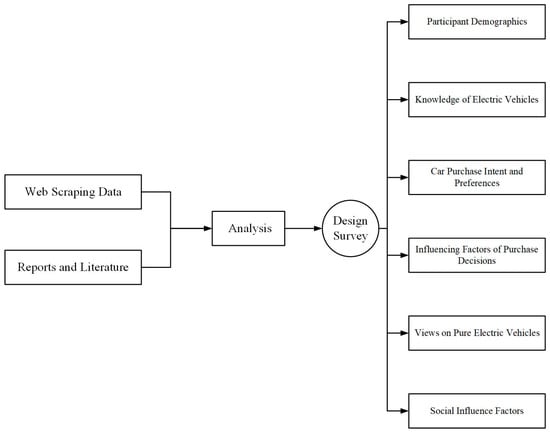
Figure 2.
Logic diagram for questionnaire design.
In the questionnaire design process, in order to ensure the representativeness and validity of the data, this paper sets up special screening conditions, requiring participants to have Urumqi city household registration. This ensures the regional representativeness of the data source and avoids sample bias.
3.2. Methods of Investigation
In order to ensure the scientific nature of the survey, this paper adopts probability sampling, so that each unit in the whole has a pre-known non-zero probability of being sampled. This kind of sampling follows the principle of randomness and excludes subjective arbitrariness or purposiveness. In order to reduce the sampling error, this paper first conducts stratified sampling, and to make sure that the probability of inclusion of each survey unit is equal, this paper adopts three-stage unequal probability PPS. Therefore, this survey uses stratified sampling and a three-stage sampling combined probability sampling survey method, in which the three-stage sampling was taken from the administrative districts in the city of Urumqi. Then, it was taken from the administrative districts in the community, and, finally, its permanent residents were finally sampled to obtain the sample frame, as shown in Table 3.
Table 3.
Survey sampling frame.
3.3. Demographics of Respondents
The data were collected from 8 November to 27 December 2024. We collected 457 questionnaires, including 47 invalid questionnaires. First, this paper excluded 23 answers that did not pass the screening questions. Second, the questionnaire completion results showed that the average response time was about 15 min, so this paper excludes seven answers which had a too short response time (ranging from 1 to 7 min). Thirdly, we manually screened the answers to exclude “straight line” responses, of which 27 responses were excluded. Finally, this paper obtained 400 valid questionnaires, with a response rate of 87.5%. This high response rate is attributed to the adoption of a three-stage proportional probability sampling (PPS) method in this study, which ensured a balanced distribution of samples across various groups, including gender, age, education level, and income. The basic profile of the questionnaire fillers is shown in Table 4.
Table 4.
Basic information of the filler.
The survey targets residents of various age groups, including middle school students. Although middle school students currently lack the ability to purchase cars, they represent future consumers. By studying the purchasing preferences of middle school students, we can better predict future market demand trends and provide references for policymakers and businesses in formulating marketing strategies in the future. Furthermore, middle school students’ consumption attitudes are gradually taking shape, and their views on new energy vehicles may influence their future car-purchasing decisions. Therefore, studying the middle school student group is of great significance for the long-term development of the new energy vehicle market.
4. Correlation Analysis of Influencing Factors Based on Binary Logit
To study whether consumers are willing to purchase pure electric vehicles, “whether to purchase pure electric vehicles” can be used as the dependent variable, combined with factors such as gender, age, education, occupation, annual income, sales price, charging cost, range, intelligent technology, car purchase subsidy policy, vehicle purchase tax policy, and charging facility construction as independent variables, to construct a binary logit regression model. Modelling allows this paper to analyze the impact of each independent variable on consumers’ willingness to purchase pure electric vehicles, and to further clarify which factors have a statistically significant impact on consumers’ decision-making.
4.1. Overview of the Model
We chose to use the binary logit model in this questionnaire survey mainly because the model is applicable to data with a dichotomous dependent variable. Since the dependent variable in this paper is whether to buy a pure electric car, i.e., the consumer’s purchasing decision, it is consistent with the application scenario of the binary logit model. The model can help us quantify the impact of each independent variable such as gender, age, income, price, etc., on consumers’ purchase decision and predict the probability of each factor on consumers’ choice of pure electric cars. At the same time, the binary logit model allows for the use of continuous and categorical variables as independent variables, and can consider the influence of multiple factors, so it is very suitable for this kind of market research and can provide the basis for automobile manufacturers to formulate accurate marketing strategies.
4.2. Model Building
The binary logit model is shown in the above equation, with P denoting the probability of consumers purchasing new energy vehicles. P/(1 − P) is the ratio of the probability of consumers purchasing new energy vehicles to the probability of not purchasing new energy vehicles. For the regression coefficients of the independent variables, independent variable A is the factor that influences whether or not to purchase a new energy vehicle. In this article, it includes age, gender, household income, etc. The regression coefficients for these independent variables reflect their impact on consumers’ purchasing intentions [14]. Since the model requires that all independent variables need to be numerical variables, many independent variables such as gender and age are categorical or qualitative variables. In order to include these categorical variables in the model for analysis, they need to be converted into dummy variables as shown in Table 5 and Table 6. This article recognizes that using a large number of predictive variables may lead to overfitting and statistical power issues. To mitigate this risk, we conducted variable selection in the model and optimized it through stepwise regression. Additionally, cross-validation was performed to ensure the robustness and generalizability of the model results. We also examined the event per variable (EPV) for each predictive variable, with a sample size meeting the conventional standard of at least 10 events per variable, thereby ensuring the statistical power of the model.
Table 5.
Assignment of demographic variables.
Table 6.
Impact Factor Assignment.
4.3. Reliability and Validity Testing
The reliability analysis of this article is shown in Table 7. The results showed that the Cronbach alpha coefficient value corresponding to the purchase factor variable was 0.906, the Cronbach alpha coefficient value corresponding to the perceived value variable was 0.834, the Cronbach alpha coefficient value corresponding to the perceived risk variable was 0.746, and the Cronbach alpha coefficient value corresponding to the community influence variable was 0.871. The Cronbach alpha coefficient values of each variable were all greater than 0.7. At the same time, the CITC values of each item and the Cronbach alpha values of deleted items met the research requirements, indicating that the stability of each variable in the questionnaire was high and the reliability passed the test.
Table 7.
Reliability tests.
Using factor analysis to conduct information enrichment research, we firstly analyze whether the research data is suitable for factor analysis. As can be seen from Table 8, the KMO is 0.933, which is greater than 0.6, meeting the prerequisite requirements of factor analysis, meaning that the data can be used for factor analysis research, as well as the data passed Bartlett’s sphericity test (p < 0.05), which indicates that the research data was suitable for factor analysis.
Table 8.
KMO and Bartlett’s test.
In further analysis, this paper uses the maximum variance rotation method (varimax) to rotate the factors to reveal the relationship between the factors and the research items, as shown in Table 9. Table 9 demonstrates the extraction of factors to research items and their correlation. From the table, it can be seen that the commonality value of all research items is greater than 0.4 and the absolute value of the corresponding factor loading coefficients is more than 0.5. This indicates that there is a significant correlation between the research items and the factors, and that the factors are able to extract the relevant information effectively.
Table 9.
Post-rotation factor loading coefficients.
4.4. Model Application
After defining each variable, a binary logit model was established, and a correlation analysis was carried out according to the model setting. The calculation results are presented in Table 10, summarizing the outcomes of the binary logit regression analysis, encompassing statistical data such as the regression coefficient, z-value, Wald chi-square value, p-value, and OR value for each variable. Specifically, the regression coefficient reflects the magnitude of the impact of each independent variable on consumer purchase intention, with a positive value indicating a positive effect on purchase intention and a negative value indicating an inhibitory effect. The z-value and Wald chi-square value are used to test the significance of the regression coefficient, while the p-value is used to determine whether a variable is statistically significant. Generally, when the p-value is less than 0.05, we consider the variable to have a significant impact on the dependent variable. The OR value indicates the strength of the impact of the independent variable on purchase intention, with an OR value greater than 1 indicating an increase in the likelihood of purchase intention and an OR value less than 1 indicating a decrease in this likelihood. The 95% confidence interval (CI) provides the range of the regression coefficient. If the confidence interval does not include 1, it indicates that the variable has a significant impact on purchase intention. We conducted thorough robustness checks on the model results to ensure their reliability and stability. Additionally, we provided detailed statistical results such as regression coefficients, z-values, and p-values.
Table 10.
Summary of binary logit regression analysis results.
In this paper, in order to facilitate the writing of the subsequent binary logit model, the independent variables will all be expressed in mathematical conformity, as shown in Table 11. According to Table 11, the binary logit model about the purchase intention of new energy vehicles in Urumqi is as follows:
Table 11.
Variable compliance comparison table.
According to the model, the significance level of eight factors such as purchase subsidy, vehicle purchase tax, driving experience, intelligent technology, battery technology, selling price, cost of use such as electricity cost, and after-sales service are all below 0.05. However, the significance levels of gender, age, education level, annual income, family size, level of understanding, acceptable charging time, range, psychological price, free registration, vehicle brand, ride comfort, appearance and interior, safety performance, hill climbing performance, maintenance and upkeep costs, convenient car purchase credit services, pre-sales consulting services, and promotion and publicity strategies are all greater than 0.05. Therefore, it is believed that they will not have an overall impact on purchase intention.
According to the binary logit model calculation results, by analyzing the numerical values of various indicators influenced by different factors, this paper can analyze the following significant influencing factors:
- Purchase subsidies: The regression coefficient for purchase subsidies is 0.688, with a significance of 0.01, indicating that the subsidy policy significantly increases consumers’ willingness to buy. For every additional unit of subsidy, the likelihood of purchase intention increases by 1.989 times. Especially in the price-sensitive market, subsidies can effectively reduce the cost of vehicle purchase.
- Vehicle Purchase Tax: The regression coefficient of purchase tax is 0.542, with a significance of 0.01, showing that purchase tax has a positive effect on purchase intention. For every unit increase in purchase tax, the willingness to buy increases by 1.719 times. Although the rise in purchase tax may increase the burden, it may reflect the influence of government policy guidance.
- Driving experience: The regression coefficient of driving experience is 0.512, with a significance of 0.01, indicating that driving experience has a positive influence on purchase intention. For every unit of improvement in driving experience, purchase intention increases by 1.669 times, especially in new energy vehicles where comfort and maneuverability become key factors in decision-making.
- Intelligent technology: the regression coefficient of intelligent technology is 0.504, with a significance of 0.01, indicating that intelligent technology has an important influence on purchase intention. For every unit increase in intelligent technology, the purchase intention increases by 1.655 times, and technological progress attracts more and more consumers’ interest.
- Battery technology: the regression coefficient of battery technology is 0.906 with significance of 0.01, indicating that battery technology is crucial to purchase intention. For every unit of battery technology improvement, purchase intention increases by 2.474 times, and battery performance improvement significantly improves consumers’ purchase experience.
- Selling price: The regression coefficient of selling price is 1.384 with a significance of 0.01, showing that price has a significant positive effect on purchase intention. Each unit increase in price increases willingness to buy by 3.991 times, especially with subsidy support, and the influence of price on purchase decision gradually becomes positive.
- Electricity cost: The regression coefficient of electricity cost is 0.402 with a significance of 0.05, indicating that electricity cost has a positive effect on purchase intention. For every unit increase in electricity cost, the purchase intention increases by 1.495 times, and the lower cost of use can effectively increase the purchase interest.
- After-sales service: the regression coefficient of after-sales service is −0.446 and the significance is 0.05, indicating that after-sales service has a negative influence on purchase intention. For every unit of after-sales service, purchase intention decreases by 0.640 times. Consumers may pay more attention to the value of the product itself rather than after-sales service. This result reflects consumers’ relative neglect of after-sales services in their purchasing decisions. When choosing new energy vehicles, consumers typically pay more attention to core factors such as battery technology, driving range, vehicle performance, and price, while after-sales services may be seen as an added value rather than a decisive factor. Furthermore, the emergence of negative coefficients may also be related to consumers’ low concern for brand loyalty and high expectations for product quality. Many consumers believe that the core performance and technical features of a car are more important than after-sales services. Some brands in the market may have established strong product trust, leading consumers to believe that basic after-sales services are sufficient. This finding reminds us that when promoting new energy vehicles, companies need to pay more attention to enhancing the core competitiveness of the product itself, in addition to after-sales services, to meet consumers’ high demand for technology and performance.
5. Consumption Mining and Classification Based on Second-Order Clustering
Based on the analysis of consumer purchase intentions, this paper employed the SOM-KMeans secondary clustering method to segment consumers. The selected variables encompassed purchase subsidies, vehicle purchase taxes, driving experience, intelligent technology, battery technology, sales prices, electricity costs, and after-sales services. Additionally, three additional factors, namely perceived value, community effect, and perceived risk, were also taken into account. A total of 11 variables were chosen for cluster analysis.
5.1. Second-Order Cluster Analysis
Based on the results of the binary logit model, this article selects eight factors including purchase subsidies, vehicle purchase taxes, driving experience, intelligent technology, battery technology, sales prices, electricity costs, and after-sales service. At the same time, considering the impact of the surrounding environment on oneself, it adds three factors: perceived value, community effect, and perceived risk. Therefore, a total of 11 variables were selected as clustering factors. The specific clustering process is shown in Figure 3.
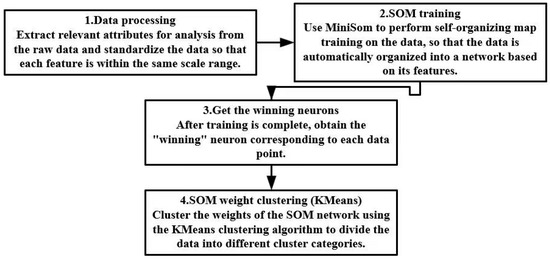
Figure 3.
Second-order clustering process.
5.2. Model Comparison
This article uses three-dimensional clustering methods such as K-means, hierarchical clustering, spectral clustering, and SOM to obtain the results shown in Figure 4. In K-means clustering, consumer groups were divided more clearly, but the shape of the clusters was assumed to be spherical, resulting in poor performance when dealing with complex or non-spherical data, especially in certain groups with uneven density, K-means failed to effectively distinguish complex consumer patterns. Hierarchical clustering, on the other hand, showed a more delicate hierarchical relationship and was able to recognize subtle differences between groups; however, its computational complexity was higher, especially when the dataset was larger, the processing speed was slower, and it was also more sensitive to noisy data, which affected the stability of the results. Spectral clustering can handle nonlinear data better and show the differences in technology preferences among different consumer groups, but it also faced the problems of heavy computational burden and over-reliance on parameter settings, which led to less than satisfactory results in some cases. SOM clustering, on the other hand, can handle more complex cluster shapes and provide intuitive visualization results, but the figure shows that the boundaries between clusters are not clear enough at times, especially in high-dimensional data or overlapping groups, which may lead to some ambiguity in interpretation. Thus, while each method had its merits, they each had some limitations.
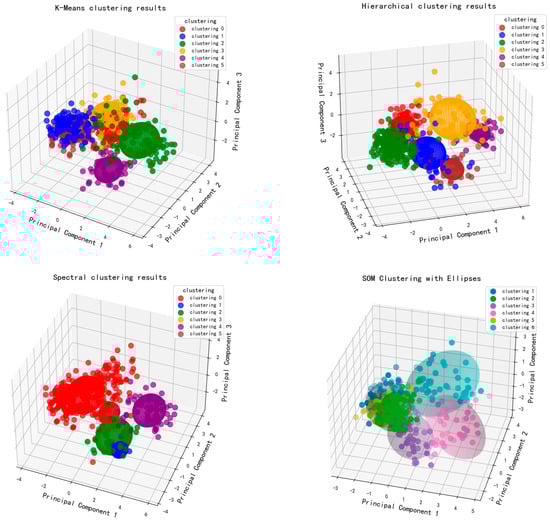
Figure 4.
Conventional clustering results.
According to the above results, it is found that the clustering effect of K-means and SOM is better, in this regard, this paper combines the two algorithms for the second-order clustering strategy. Firstly, the data are implicitly projected by SOM, and then clustered by K-means, which can combine the nonlinear mapping ability of SOM and the efficient clustering characteristics of K-means to make up for the shortcomings of the separate method, which is shown in Figure 5. SOM can handle the nonlinear relationship of data and provide a more suitable input data space, while K-means can efficiently perform clustering based on this, enhancing the accuracy and stability of the clustering. Furthermore, the contour coefficient of the second-order clustering of SOM and K-means is 0.6785764, that of SOM is 0.5111238, and that of K-Means is 0.4378564, reflecting the excellent performance of the second-order clustering.
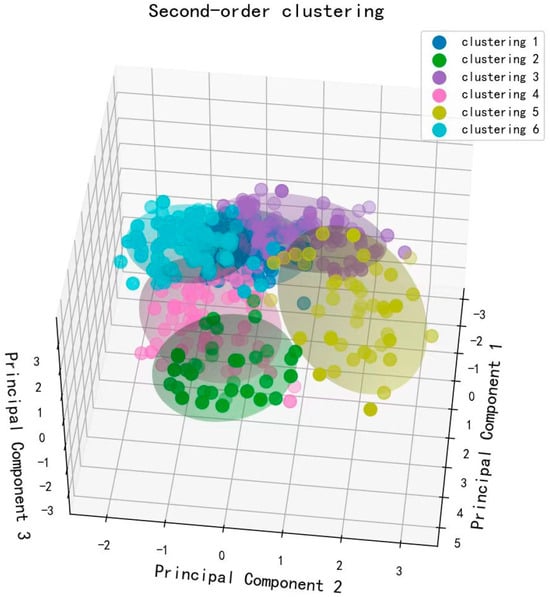
Figure 5.
Second-order clustering results.
5.3. Analysis of Results
Based on the above second-order clustering method, the consumers are divided into six different types, as shown in Table 12, and the proportion of the six different types, as shown in Table 13.
Table 12.
Second-order clustering results.
Table 13.
Percentage of each type of group.
(1) Technologically Innovative Consumers
This group attaches importance to battery technologies, intelligent features, and other technological innovations. They are more inclined to choose technologically advanced new energy vehicles and are willing to pay higher prices for technological innovations. They are willing to pay higher prices for technological innovations. Price has less influence on their purchasing decisions, and they are mainly concerned with technological advancement and future potential.
(2) Cost-performance oriented consumers
These consumers are price-sensitive and mainly focus on the cost-performance of automobiles. They are more inclined to choose those models that strike a balance between price and performance. For them, battery life, price, and actual cost of use (e.g., cost of electricity) are the most important purchasing considerations.
(3) Brand-oriented Consumers
Brand-oriented consumers have high demands regarding brand reputation and after-sales service. They usually choose models from well-known brands because the brand represents their trust in quality and service. Although these consumers are willing to pay a higher price, they expect better after-sales protection and added value of the brand.
(4) Omni-directional Consideration Consumers
This group considers a combination of factors, such as technology, price, brand, performance, etc., in their purchasing decisions. They do not favor one particular factor, but make their choices based on the combined performance of all factors. For them, the cost-effectiveness, technology content, and brand reputation of the purchased vehicle are very important.
(5) Experience-first Consumers
Experience-first consumers value the driving experience and the impact of intelligent features of the car on their daily lives. For them, product comfort, performance, and user experience are often more important than price and brand. They are willing to pay extra for better experience and technology, especially smart driving and connected car features.
(6) Practical and Economical Consumers
This group of consumers is concerned about the basic functions and cost-effectiveness of a car. They are price-sensitive and tend to choose models that are moderately priced and have practical features. Battery life, charging convenience, and electricity cost are key factors in their purchasing decisions. They value the practicality and cost-effectiveness of a car more than brand or technological innovation.
Cost-performance oriented and practical economy consumers are highly sensitive to price and battery life, so, optimizing battery technology and lowering the selling price for these two groups will directly drive their purchase intentions. On the other hand, technologically innovative consumers are more concerned about the improvement of battery technology, and upgrading technology is particularly important for their purchase decision. Experience-first consumers are more interested in the driving experience and smart technology in their purchasing decisions, so improvements in battery technology will also increase their interest in purchasing.
6. Conclusions and Recommendations
Through offline interviews, questionnaire design and stratified three-stage PPS, this paper investigates the purchase intention of Urumqi permanent residents on new energy vehicles and conducts binary logit score and consumer Cluster Analysis on the data obtained from the survey to obtain the following conclusions:
- Main influencing factors: The main factors for consumers to purchase new energy vehicles in Urumqi include purchase subsidies, vehicle purchase tax, driving experience, intelligent technology, battery technology, sales price, electricity cost, and after-sales service. Through regression analysis, the regression coefficients of battery technology and sales price are 0.906 and 1.384, respectively, indicating that the improvement of battery technology and the reduction in price have a significant driving effect on the purchase intention, especially in the Urumqi market, the influence of these two factors is more prominent.
- Consumer Group Analysis: Consumers in Urumqi can be divided into six categories: technologically innovative, cost-performance oriented, brand oriented, all-round consideration oriented, experience priority oriented, and practical and economic oriented. Technologically innovative consumers emphasize battery technology and smart functions and are willing to pay higher prices; cost-performance-oriented consumers value the balance between price and performance, especially battery life and power costs; brand-oriented consumers have high requirements for brand reputation and after-sales service; and all-round consideration consumers consider factors such as technology, price and brand in a comprehensive manner. Experience-first consumers focus on driving experience and intelligent technology, and practical and economical consumers are more concerned about cost-effectiveness and basic functions.
- In order to promote the development of the new energy vehicle market in Urumqi, firstly, cost-performance oriented and practical economy consumers are more sensitive to price and battery life, so, it is recommended that the Government optimize the cost-performance ratio by lowering the sales price of new energy vehicles and upgrading the battery technology, as well as launching entry-level models suitable for these groups. Second, for technologically innovative consumers, who are more concerned about battery technology and intelligent features, the government should increase R&D support in these areas and encourage companies to launch new energy vehicles with leading technology. Meanwhile, brand-oriented and all-encompassing consumers have higher requirements for branding and after-sales services, and the government should strengthen brand building and consumer education in order to improve brand identity and market competitiveness. Through these targeted policy measures, the needs of different consumer groups can be effectively met and the healthy development of the new energy vehicle market in Urumqi can be promoted.
- By analyzing consumers’ purchase intentions for new energy vehicles in Urumqi, this study proposes targeted policy recommendations that emphasize the impact of key factors such as battery technology, sales price, and government policies on consumer decision-making. These policy recommendations are applicable not only to Urumqi, but also to other regions with slower economic development and incomplete infrastructure. We suggest that other similar cities can optimize policy support, increase infrastructure development, and enhance technological innovation, especially in battery technology and smart technology, based on the results of this study, so as to effectively promote the development of the new energy vehicle market. However, this study also has some shortcomings. First, the study sample is mainly from Urumqi city. The research method is relatively single, in the future, the sample can be expanded to cover consumers in more regions or cities, as well as to improve the research method, such as through consistency scoring and perplexity analysis in LDA topic modeling and considering the interactions between different variables to improve the generalizability of the results. Meanwhile, the study did not differentiate between the two types of consumers with and without cars but included all consumers uniformly in the analysis. There is a plan to compare car owners and car owners without cars as a group in future studies to explore the impact of this difference on purchase intentions. In addition, the study mainly focuses on the analysis of consumer purchase intention, and the relationship between consumer intention and actual behavior can be further verified in the future by combining actual purchase behavior and market sales data. With the rapid development of new energy vehicle technology, future research could also delve into how emerging technologies, such as autonomous driving and connected vehicles, affect consumers’ purchase decisions. In conclusion, although this study provides valuable market recommendations, there is still room for further improvement in terms of research methodology and data scope.
Author Contributions
Conceptualization, J.H. and Z.H.; methodology, J.H.; software, Z.H.; validation, J.H. and Z.H.; formal analysis, J.R.; investigation, X.Z. and Y.Z.; resources, J.H. and Q.L.; data curation, J.H., Q.L. and Y.Z.; writing—original draft preparation, Z.H.; writing—review and editing, J.H.; visualization, Z.H.; supervision, J.H.; project administration, J.R. All authors have read and agreed to the published version of the manuscript.
Funding
This research received no external funding.
Institutional Review Board Statement
This research does not require ethical approval according to the Measures of People’s Republic of China (PRC) Municipality on Ethical Review; Measures for Ethical Review of Biomedical Research Involving People (revised in 2016); Measures of National Health and Wellness Committee on Ethical Review of Biomedical Research Involving People (Wei Scientific Research Development [2016] No.11).
Informed Consent Statement
Informed consent was obtained from all subjects involved in the study.
Data Availability Statement
The data presented in this study are available on request from the corresponding author.
Acknowledgments
Thanks to the “Tianchi Talent” Introduction Plan Leading Innovative Talents Project of Xinjiang “Study on Key Technologies for Optimizing the Quality of Expressway Traffic Safety Facilities and Enhancing the Lifetime Traffic Safety Guarantee in Special Areas and Complex Environments”, Xinjiang Key Laboratory of Green Construction and Smart Traffic Control of Transportation Infrastructure and Natural Science Foundation General Project of Xinjiang (2024D01C30) “Research on Traffic Operation Risk Causation Mechanisms and Safety Strategies of Expressway Maintenance Section based on Data-driven”.
Conflicts of Interest
The authors declare no conflict of interest.
References
- Yalçın, E.S. Development of a Forecasting Framework Based on Advanced Machine Learning Algorithms for Greenhouse Gas Emissions. Systems 2024, 12, 528. [Google Scholar] [CrossRef]
- Yuan, X.; Liu, X.; Zuo, J. The development of new energy vehicles for a sustainable future: A review. Renew. Sustain. Energy Rev. 2015, 42, 298–305. [Google Scholar] [CrossRef]
- Lin, J. Effects of electric vehicle demonstration and promotion policy on air pollution: Evidence from China. Transp. Policy 2025, 162, 1–19. [Google Scholar] [CrossRef]
- Chen, L.; Ma, R. Clean energy synergy with electric vehicles: Insights into carbon footprint. Energy Strategy Rev. 2024, 53, 101394. [Google Scholar] [CrossRef]
- Xie, D.; Gou, Z.; Gui, X. How electric vehicles benefit urban air quality improvement: A study in Wuhan. Sci. Total Environ. 2024, 906, 167584. [Google Scholar] [CrossRef]
- Yalçın, E.S. Adoption of New Energy Vehicle in the Post-Subsidy Era with Heterogeneous Consumer Demand. Chin. J. Manag. Sci. 2024, 32, 141–152. [Google Scholar]
- Ge, Y.; Chen, K. Selection of Production Strategies for New Energy Vehicles: An Analysis of the Impact of Government Intervention Policies. Systems 2025, 13, 61. [Google Scholar] [CrossRef]
- Li, D.D.; Yang, J.Y. Adoption of New Energy Vehicle with Reference Effect. Oper. Res. Manag. Sci. 2024, 33, 43–50. [Google Scholar]
- Wang, X.; Lv, T.; Cai, R.; Deng, X. Research on Content Analysis and Quality Evaluation for Online Reviews of New Energy Vehicles. Inf. Dev. 2024, in press. [CrossRef]
- Wang, C.; Sinha, P.N.; Zhang, X.; Wang, S.; Lee, Y.-K. The Impact of NEV Users′ Perceived Benefits on Purchase Intention. Travel Behav. Soc. 2024, 34, 100681. [Google Scholar] [CrossRef]
- Tan, R.; Lin, B. Are People Willing to Support the Construction of Charging Facilities in China? Energy Policy 2020, 143, 111604. [Google Scholar] [CrossRef]
- Chen, Y.J.; Sun, Y.M. Competitive Pricing Strategies of Vehicle Manufacturers Considering Smart Manufacturing Technical Subsidy Policy. J. Syst. Manag. 2024, 33, 890–900. [Google Scholar]
- Yu, P.; Zhang, J.; Yang, D.; Lin, X.; Xu, T. The Evolution of China′s New Energy Vehicle Industry from the Perspective of a Technology–Market–Policy Framework. Sustainability 2019, 11, 1711. [Google Scholar] [CrossRef]
- Ou, S.; Lin, Z.; Qi, L.; Li, J.; He, X.; Przesmitzki, S. The Dual-Credit Policy: Quantifying the Policy Impact on Plug-in Electric Vehicle Sales and Industry Profits in China. Energy Policy 2018, 121, 597–610. [Google Scholar] [CrossRef]
- Li, F. Current Situation, Problems and Countermeasures of New Energy Vehicles in Xinjiang. Innov. Entrep. Theory Res. Pract. 2019, 2, 158–159. [Google Scholar]
- He, Y.M. Opportunities and Challenges: Developing Strategies of New Silk Road Economic Belt and the Development of Cities in Xinjiang. J. Sichuan Norm. Univ. 2015, 42, 16–27. [Google Scholar]
- Wang, Y.; Wen, Y.; Xu, Y.; Shi, L.; Yang, X. Health Benefits Quantification for New-Energy Vehicles Promotion: A Case Study of Beijing. Int. J. Environ. Res. Public Health 2022, 19, 13876. [Google Scholar] [CrossRef]
- Xian, Y.; Wang, Q.; Fan, W.; Da, Y.; Fan, J. The Impact of Different Incentive Policies on New Energy Vehicle Demand in China′s Gigantic Cities. Energy Policy 2022, 168, 113137. [Google Scholar] [CrossRef]
- Fan, B.; Wen, Z.; Qin, Q. Competition and Cooperation Mechanism of New Energy Vehicle Policies in China′s Key Regions. Humanit. Soc. Sci. Commun. 2024, 11, 1640. [Google Scholar] [CrossRef]
- Han, W.; Zhang, G.; Xiao, J.; Bénard, P.; Chahine, R. Demonstrations and Marketing Strategies of Hydrogen Fuel Cell Vehicles in China. Int. J. Hydrogen Energy 2014, 39, 13859–13872. [Google Scholar] [CrossRef]
- Jia, H.; Lin, B. Why Chinese Residents Underinvest in New Energy Vehicles? Insights from Prospect Theory. Technol. Anal. Strateg. Manag. 2025, accepted. [CrossRef]
- Zhu, Y.S.; Zhu, J.S.; Yu, S.W.; Qiu, G.Y. Research of Customer’s Choice Preference for New Energy Vehicles: Based on the Analysis of a Consumer Survey in Shenzhen. Acta Sci. Nat. Univ. Pekin. 2017, 53, 429–435. [Google Scholar]
- Yang, K.; Bu, H.; Huang, R.; Liu, M.T. How Green Marketing Practices Improve Customer Loyalty: The Mediating Role of Green Corporate Image and the Moderating Role of Green Self-Identity in the New Energy Vehicle Market. Asia Pac. J. Mark. Logist. 2025, 37, 1067–1088. [Google Scholar] [CrossRef]
- Hao, Y.; Dong, X.Y.; Deng, Y.X.; Li, L.-X.; Ma, Y. What Influences Personal Purchases of New Energy Vehicles in China? An Empirical Study Based on a Survey of Chinese Citizens. J. Renew. Sustain. Energy 2016, 8, 065904. [Google Scholar] [CrossRef]
- Fan, J.L.; Wang, Q.; Yang, L.; Zhang, H.; Zhang, X. Determinant Changes of Consumer Preference for NEVs in China: A Comparison Between 2012 and 2017. Int. J. Hydrogen Energy 2020, 45, 23557–23575. [Google Scholar] [CrossRef]
- Zhao, X.; Ma, Y.; Shao, S.; Ma, T. What Determines Consumers′ Acceptance of Electric Vehicles: A Survey in Shanghai, China. Energy Econ. 2022, 108, 105805. [Google Scholar] [CrossRef]
Disclaimer/Publisher’s Note: The statements, opinions and data contained in all publications are solely those of the individual author(s) and contributor(s) and not of MDPI and/or the editor(s). MDPI and/or the editor(s) disclaim responsibility for any injury to people or property resulting from any ideas, methods, instructions or products referred to in the content. |
© 2025 by the authors. Published by MDPI on behalf of the World Electric Vehicle Association. Licensee MDPI, Basel, Switzerland. This article is an open access article distributed under the terms and conditions of the Creative Commons Attribution (CC BY) license (https://creativecommons.org/licenses/by/4.0/).