Abstract
Real-time traffic light detection is essential for the safe navigation of autonomous vehicles, where timely and accurate recognition of signal states is critical. YOLOv8, a state-of-the-art object detection model, offers enhanced speed and precision, making it well-suited for real-time applications in complex driving environments. This study presents a modified YOLOv8 architecture optimized for traffic light detection by integrating Depth-Wise Separable Convolutions (DWSCs) throughout the backbone and head. The model was first pretrained on a public traffic light dataset to establish a strong baseline and then fine-tuned on a custom real-time dataset consisting of 480 images collected from video recordings under diverse road conditions. Experimental results demonstrate high detection performance, with precision scores of 0.992 for red, 0.995 for yellow, and 0.853 for green lights. The model achieved an average mAP@0.5 of 0.947, with stable F1 scores and low validation losses over 80 epochs, confirming effective learning and generalization. Compared to existing YOLO variants, the modified architecture showed superior performance, especially for red and yellow lights.
1. Introduction
Accurate traffic signal detection plays a crucial role not only in ensuring vehicle safety but also in optimizing traffic system performance. According to the World Health Organization, over 50% of urban traffic accidents occur at intersections, with a significant share attributed to signal violations or misinterpretation by drivers [1]. Reliable signal detection in autonomous systems can therefore reduce the likelihood of intersection-related collisions. Furthermore, precise and timely detection of traffic signals supports smoother traffic flow, reduces idling time, and contributes to fuel efficiency and lower emissions, which are key objectives in sustainable and intelligent transportation infrastructure [2,3]. Autonomous driving systems rely on robust traffic light detection for safe navigation, making real-time recognition of signal states a critical task [4]. Early approaches to traffic light detection used color thresholding, template matching, or mapping data, but these classical methods struggled with complex backgrounds and varied lighting [5]. The advent of deep learning, especially convolutional neural networks (CNNs), revolutionized object detection by learning hierarchical features automatically [6]. In particular, the You Only Look Once [3] (YOLO) family of one-stage detectors has enabled real-time detection with high accuracy. The original YOLO unified object classification and localization into a single network, achieving unprecedented speed without sacrificing considerable precision [7]. Subsequent YOLO versions (v2–v7) progressively improved detection performance by incorporating advances like multi-scale feature fusion and improved training techniques. Recently, YOLOv8 pushed the state-of-the-art further with an anchor-free decoupled head, an enhanced feature fusion PAN-fused path network, and a unified multi-task loss, resulting in superior small-object detection and simpler, faster inference compared to YOLOv7 [8]. Empirical studies confirm YOLOv8’s advantages. For example, Hoang et al. reported that YOLOv8 attained ~98–99% mAP on traffic light datasets, outperforming YOLOv5–v7 in both accuracy and real-time performance.
Despite these advances, traffic light detection remains challenging due to the small object size, illumination variations, and environmental complexity [9,10]. Traffic lights are often distant and visually ambiguous, making detection difficult, especially under glare, weather effects, or occlusions [11]. Additionally, determining the light’s color state (red, yellow, green) under such challenging conditions adds a layer of complexity [9]. These factors contribute to missed or incorrect detections, which can be hazardous in autonomous driving systems. Consequently, improving the robustness and reliability of detection remains a major research focus [12]. Moreover, autonomous systems also need to apply sensor fusion methods, such as the Adaptive Fuzzy Kalman Filter, to improve real-time vehicle positioning accuracy, thus ensuring dependable control and navigation [13].
To address these challenges, recent works have enhanced YOLO-based detection in several capacities. One direction focuses on model efficiency for deployment in real-time embedded systems. For instance, Wang et al. built a lightweight YOLOv5s-based detector that reduced model size and computational load while maintaining high accuracy—suitable for low-power platforms like the Jetson Nano [14]. Another line of work tackles small-object sensitivity, using feature pyramid fusion and attention modules. Chuang et al. integrated a residual bi-fusion FPN with transformer-based attention to improve recall and precision on distant lights [15]. Similarly, Zhou et al. proposed KCS-YOLO, which adds a small-object detection layer and CBAM attention to enhance visibility under fog and low light [16].
Data augmentation is another key strategy, with synthetic data generation and domain adaptation helping to address rare or difficult scenarios. For example, Gakhar et al. introduced a method using Fourier domain adaptation to simulate hostile weather (fog, rain), improving detection robustness [17]. Such techniques complement architectural improvements by expanding model generalization.
In parallel with recent architectural advancements in object detection models such as YOLO, an increasing number of studies have highlighted the emerging role of generative artificial intelligence (AI) in vision-based transportation systems. Generative models, including Generative Adversarial Networks (GANs) and diffusion-based models, have been actively utilized to address key limitations in training data—such as data scarcity, rare event representation, and robustness under challenging visual conditions including glare, fog, and occlusion. Wang et al. [18] and Da et al. [19] presented comprehensive surveys outlining how generative AI is shaping the future of autonomous driving and transportation planning. These works emphasize practical applications such as synthetic training data generation, digital twin construction, and simulation-based infrastructure design.
Several recent studies have also demonstrated the direct benefits of generative AI in traffic signal detection tasks. Huang and Wang [20] developed a lightweight traffic light detector augmented with diffusion-based data generation, achieving over 98% accuracy in adverse lighting conditions. Zhu et al. [21] introduced ODGEN, a domain-specific synthetic data pipeline based on diffusion models, which improved YOLO detector performance by up to 25%. Similarly, Baik and Kim [22] used photorealistic human image synthesis to train YOLOv7 for detecting human traffic controllers, highlighting generative AI’s potential in addressing rare, safety-critical scenarios with limited real-world data.
Several recent studies have focused on improving the efficiency and accuracy of YOLOv8 through architectural modifications, particularly by incorporating Depth-Wise Separable Convolutions (DWSCs). These enhancements aim to reduce computational cost and model size while maintaining or improving detection performance. Zhang et al. [23] proposed a lightweight version of YOLOv8s by replacing standard convolutional layers with DWSCs for tomato detection. Their model achieved a notable mAP of 93.4% with a 27% reduction in model parameters and real-time inference at 138.8 FPS. Similarly, Wu et al. [24] introduced LCA-YOLOv8-Seg for surface crack detection by embedding depth-wise convolutions into a segmentation-based YOLOv8n framework. Their model achieved 0.945 IoU accuracy at 129 FPS with a significant reduction in weight size.
Yue et al. [25] developed LE-YOLO, a YOLOv8n variant that integrates DWSCs into a custom lightweight backbone named LHGNet. Although their model showed a mAP improvement of 5.4% on the VisDrone dataset and a reduction of parameters to 2.1 M, it suffered from reduced inference speed due to added complexity. Another variant, YOLOv8s-Depthwise, proposed by Naftali et al. [26], integrated DWSCs throughout both the backbone and partially in the head. It achieved a competitive mAP (0.750) and significantly reduced model size (10.6 MB), while maintaining a respectable inference time (~0.027 s per frame). However, their implementation lacked comprehensive feature fusion strategies and modular integration across all stages.
Although the above works have demonstrated the potential of DWSCs in YOLOv8 architecture, most limit their modifications to the backbone or select layers without fully leveraging synergies with other architectural components such as SPPF, FPN, C2F modules, and dynamic upsampling.
In contrast to prior works, the architecture proposed in this study integrates depth-wise separable convolution blocks at multiple levels, including both the backbone and head. This approach represents comprehensive architectural restructuring rather than a simple substitution of standard convolutions. The main contributions of the proposed model can be summarized as follows:
- Full-spectrum DWSC Deployment: In contrast to existing models that primarily use DWSCs in the backbone, our architecture extends DWSC integration across the entire feature processing pipeline, from input stages through to multi-scale detection heads.
- Enhanced Multi-Scale Feature Fusion: The design includes multiple upsampling and concatenation layers, paired with C2F modules, to capture both shallow and deep semantic features efficiently.
- SPPF Integration for Contextual Awareness: A strategic SPPF block enriches spatial features before final detection, contributing to better performance on objects affected by glare or occlusion.
- End-to-End Lightweight Optimization: Despite increased modularity, the overall model achieves significant reductions in model size and improved inference speed, while maintaining or improving mAP on standard datasets.
This novel configuration outperforms existing YOLOv8 models by achieving a better balance among accuracy, model compactness, and real-time performance. To the best of our knowledge, this is the first work to holistically integrate DWSCs with YOLOv8’s FPN, SPPF, and C2F across both the backbone and head, demonstrating superior results without compromising detection robustness.
It is important to mention that traffic signal displays appear in various configurations beyond the standard circular indicators. These include directional arrow signals (e.g., green or red turn arrows), which are commonly used to control lane-specific movements and indicate permitted turning actions. While arrow-shaped signals serve distinct purposes in traffic control, their shapes, orientations, and activation states introduce additional complexity for vision-based recognition systems {Yeh, 2020 #50} {Yeh, 2021 #49}. In contrast, circular red, yellow, and green lights remain the most universally adopted form of vehicle signalization at intersections and are widely standardized across jurisdictions. For this reason, the present study focuses exclusively on circular signal states, which are essential for general vehicle navigation and decision-making in autonomous driving scenarios. Future research can consider extending the detection framework to accommodate arrow and other specialized signals through multi-class classification or shape-aware recognition models.
Although this study focuses on the detection of traffic light color states, future work can consider addressing broader real-world challenges. These include mitigating the effects of sun glare on visual perception [27,28], integrating Unscented Kalman Filters (UKFs) for improved state estimation and multi-sensor fusion [29,30], and incorporating Simultaneous Localization and Mapping (SLAM) frameworks for enhanced localization and navigation in dynamic traffic environments [27,28]. Additionally, recent advancements suggest that generative AI is increasingly being integrated with traditional computer vision methods in intelligent transportation systems. While not implemented in the present work, these techniques offer valuable potential for expanding training diversity, improving detection robustness, and enabling realistic simulation-driven development in future applications.
2. Enhanced YOLOv8 + DWSC for Traffic Light Detection
You Only Look Once (YOLO) is a cutting-edge, one-stage object-detection model known for its real-time capability and its simple architecture. YOLO differs from conventional two-stage detectors that generate region proposals and classify based on those proposals. YOLO treats the detection task as a single regression problem and predicts the coordinates of the bounding box and class probabilities directly from the entire image in a single forward pass using a CNN [7,31]. This single-model approach ensures that YOLO remains both fast and accurate and uniquely poised for real-time applications like autonomous driving, surveillance, and robotics [32].
The architecture of YOLO divides the input image into a (G × G) grid where each grid cell is responsible for predicting the bounding boxes along with their class confidence scores. The model then outputs the class probability map for efficient localization and identification of objects, Figure 1. The architecture enables the detection of multiple objects within an image frame while still achieving real-time performance. Its superior speed and accuracy make YOLO a choice of model for embedded and edge-computing used cases where inference speed is a paramount concern [33].
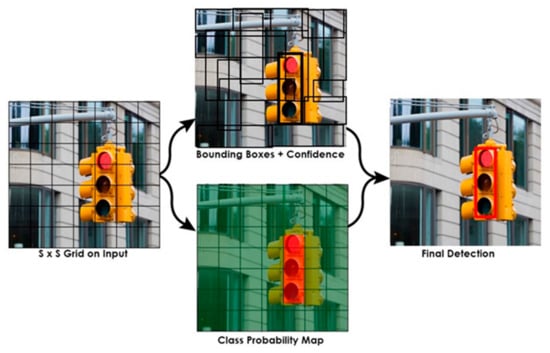
Figure 1.
Dividing the input image into G × G grids.
2.1. YOLOv8 Detection Model Structure
The YOLOv8 object detection model is a single-stage, anchor-free deep learning framework optimized for high-speed and high-accuracy detection tasks. It is composed of three main components: the backbone, the neck, and the detection head. This architecture enables efficient multiscale feature extraction, fusion, and object prediction, making it highly suitable for real-time scenarios such as traffic light signal recognition in autonomous driving applications.
The detection pipeline begins with input preprocessing, where the input image is resized (e.g., to 640 × 640 pixels), normalized to a range between 0 and 1, and optionally augmented using transformations such as mosaic augmentation, HSV adjustments, or image flipping.
The preprocessed image is passed through the backbone, which utilizes C2f modules to extract multiscale features . These modules enhance gradient flow and computational efficiency by enabling cross-stage feature propagation and partial computation reuse [8].
The extracted features are then processed by the neck, which employs a combination of Feature Pyramid Network (FPN) and Path Aggregation Network (PAN) mechanisms to produce aggregated multi-scale feature maps . This fusion strategy allows for strong localization of small and large objects by integrating semantic and spatial information across scales.
The detection head is anchor-free and decoupled into separate branches for classification, bounding box regression, and objectness estimation:
The classification branch predicts object class probabilities .
The regression branch predicts bounding box coordinates .
The abjectness branch outputs the confidence score indicating the presence of an object.
At inference time, sigmoid activations are applied to normalize predictions, and Non-Maximum Suppression (NMS) is performed to filter overlapping detections based on confidence and IoU thresholds. The final detections are returned as a set as follows:
where each detection is associated with a class label and a confidence score .
In this study, YOLOv8 serves as the base detection architecture.
To enhance its performance under high-glare and illumination-variant conditions, especially in distinguishing yellow traffic lights, Depth-Wise Separable Convolutions (DWSCs) are integrated into the backbone and/or detection head. This modification improves computational efficiency and feature selectivity without sacrificing detection accuracy [34].
2.2. Proposed Enhanced YOLOv8
In this work, we developed an improved YOLOv8-based architecture particularly for traffic light state detection. The proposed architecture deploys Depth-Wise Separable Convolution (DWSC) to maximize the representational power with reduced computational overhead. The architecture presented in this work differs from prior architectures in that it uses Depth-Wise Separable Convolution (DWSC) blocks at various levels and at different parts of the model, the backbone, as well as the head; see Table 1 and Figure 2. Additionally, the proposed architectural improvement also includes a specialized signal-state classification module, which is reliable in recognizing red, yellow, and green lights.

Table 1.
Proposed enhanced YOLOv8 vs. other YOLOv8 + DWSC models.
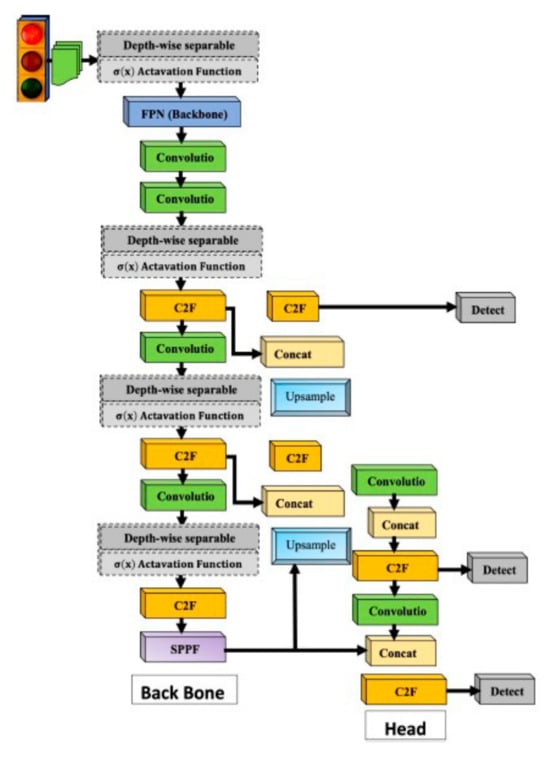
Figure 2.
Architecture diagram of the modified YOLOv8 model using Depth-Wise Separable Convolution for traffic light detection.
The detector’s adaptability to multi-scale object changes was enhanced through the combined use of DWSCs within C2F and SPPF modules, which support efficient feature extraction while preserving gradient flow via modular depth and residual links. Overall, the lightweight convolutional architecture, coupled with efficient color classification, offers an improvement in detection accuracy, lower false positives, and real-time efficiency, rendering it fit for use in these settings that are dynamic and complicated.
Depth-Wise Separable Convolutions (DWSCs) for Enhanced Efficiency
Depth-Wise Separable Convolutions (DWSCs), which consist of depth-wise and point-wise (1 × 1) convolutions, are a promising architectural improvement to convolutional neural networks (CNNs) in the scope of real-time systems like traffic light detection in embedded environments because they combine a low computational complexity and parameter number with detection accuracy. DWSCs can be used to address real-time requirements when inference speed and size of the model are constrained, as shown in Figure 3.
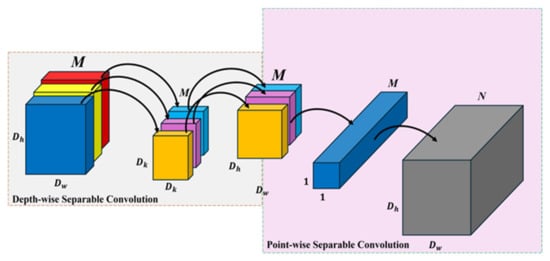
Figure 3.
Performing the Depth-Wise Separable Convolution process.
- Depth-Wise Separable Convolution
In a conventional convolutional layer, the convolutional kernel acts on all input channels at once to create a highly computationally intensive output feature map. DWSC, however, breaks this process into two steps. Depth-wise convolution uses a separate kernel for each input channel and convolves them independently. This operation extracts spatial features independently for each of the input channels but maintains the spatial dimensionality while reducing the computational cost considerably.
where
Yd is the depth-wise convolution output;
Wd is the depth-wise filter.
- Point-Wise Convolution
A depth-wise convolution is followed by point-wise convolution (1 × 1) to unify or combine the outputs that have been filtered spatially across all input channels. The depth-wise 1 × 1 convolution achieves a linear combination of the channels. This step enables the model to combine the information from (potentially spatially disjoint) different feature maps. Point-wise convolution is basic in terms of operations. However, it is essential for combining the features from the demands of depth-wise convolution. Point-wise 1 × 1 convolution can merge spatially disjointed features and process-separated features as a multi-channel one. Depth-wise convolution can capture color-dependent and smaller objects such as traffic lights.
- Combined Depth-Wise Separable Convolution
Equation (3) illustrates the full computation of the Depth-Wise Separable Convolution (DWSC) method, where the operation is decomposed into two stages: a spatial convolution performed independently for each input channel (depth-wise), followed by a channel-wise linear combination using 1 × 1 convolutions (point-wise). In this formulation, Wd denotes the depth-wise filters, which capture spatial features across each input channel independently, while Wp represents the point-wise filters of shape M×K, responsible for projecting the intermediate features into a new space by fusing information across all M input channels to produce K output channels. The final output tensor Y [i, j, k] ∈ R H × W × K aggregates both local spatial patterns and inter-channel relationships. This architectural separation reduces computational complexity significantly compared with a traditional convolution with kernel size P × Q, input channels M, and output channels K, which requires P × Q × M × Q multiplications. The DWSC formulation reduces this to P × Q × M + M × K, yielding a subsequent computational cost reduction and making it highly efficient for real-time applications.
2.3. Model Training
The accurate and reliable prediction of the proposed real-time traffic light detection is highly dependent on the training process. A robust training process is employed in this paper to ensure the accuracy, robustness, and generalization of the proposed YOLOv8-DWSC model across different traffic scenarios and situations. The training process is structured as follows:
Initial Phase—Few-Shot Learning Foundation: The available labeled data consisted of a small set of traffic light images allowing the model to learn the initial object properties. Starting with a small set of high-quality data contributing to the model development corresponds to a few-shot learning foundation, where the model can generalize from the few examples because of its ability to compose a hierarchy of features.
Transfer Learning with Pre-Trained Weights: Transfer learning was used to initialize the model with pre-trained YOLOv8 weights, which were further trained on the public Github dataset 2023 [36]. This approach improves training speed and convergence. With transfer learning, the model used the features already extracted from the large-scale image datasets while the model recognized the traffic lights’ signals, e.g., shapes and edges. All layers were fine-tuned with lower learning rates to prevent overfitting.
Real-Time Data Augmentation Using Video Libraries: A dynamic data augmentation strategy using video was adopted to enhance dataset variability and authenticity. Traffic video sequences were used to capture multiple angles, lighting situations, and motion distortions, sampled in Figure 4 and Figure 5. This enabled the model to learn driving characteristics using video sequences, which is reflective of the real-world situation. Karakan et al. [37] and Kim et al. [12] highlighted the improvements in object detectors when image data sourced from videos were applied to models. Video helps to generalize the datatypes through temporal context of the frames, provide pertinent information on variations in object size, blurring, and occlusions. Such enhancements taught the model to generalize motion-oriented processes and improved the traffic light model.
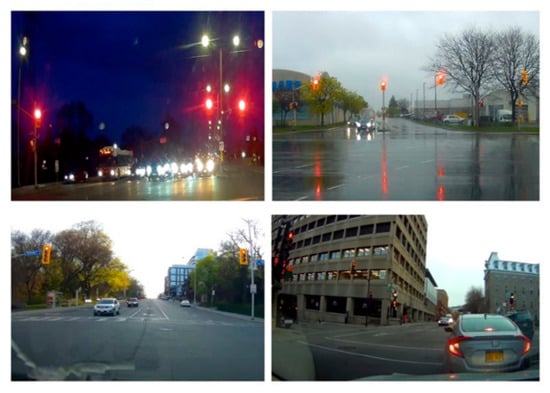
Figure 4.
Sample frame where a red light was acquired under natural lighting [38,39].
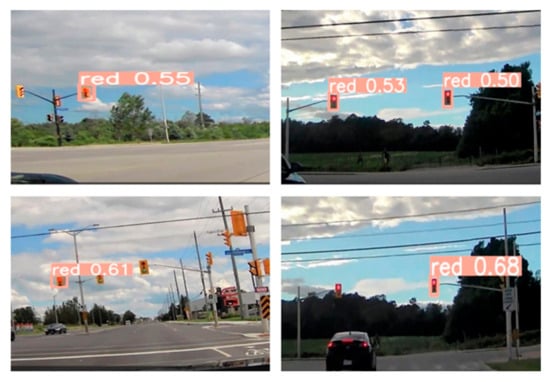
Figure 5.
Red light detection in real time at different locations.
Dataset Partitioning and Management: The whole dataset was organized into three sections:
- Training Set: The training set includes manually annotated images as well as augmented frames from videos.
- Validation Set: The validation dataset is used for hyperparameter tuning and overfitting detection in training.
- Test Set: This is held out for final performance evaluation to check the generalization of the model.
The proposed model leverages few-shot learning, transfer learning, and real-time data augmentation from video sources to effectively address the training challenges posed by complex urban environments with diverse environmental and temporal conditions. Given this training approach, the enhanced detection performance of the YOLOv8-DWSC model is primarily attributed to its model robustness in real scenarios.
While standard datasets like LISA were reviewed, this study prioritized real-time performance using a custom dataset derived from video capture in uncontrolled conditions. However, future work will include benchmarking on the LISA Traffic Light Dataset to enable broader comparability and validation
2.4. Performance Metrics
To provide a detailed evaluation of the model’s performance in identifying traffic light signals, this subsection first presents key detection accuracy metrics, including precision, recall, F1 score, and mean Average Precision (mAP). These metrics offer critical insights into the model’s ability to accurately and consistently detect relevant objects under varying confidence thresholds. Following this, training loss indicators are discussed to assess the model’s learning behavior and convergence throughout the training process, complementing the accuracy metrics with optimization-based performance insights.
2.4.1. Detection Accuracy Metrics
To comprehensively evaluate the performance of the proposed object detection model, several accuracy metrics were employed. These metrics quantify the model’s ability to correctly identify and classify relevant instances while minimizing false detections. In this subsection, we detail key evaluation indicators including precision, recall, F1 score, and mean Average Precision (mAP), which collectively offer a robust framework for assessing detection reliability, sensitivity, and overall effectiveness across various confidence thresholds and intersection over union (IoU) levels.
Precision quantifies the ratio of correctly identified positive instances to the total number of instances that the model classified as positive. It reflects the model’s ability to avoid false positives and is defined as follows:
where TP refers to true positives, and FP represents false positives. Precision is widely used in object detection and classification tasks to measure the accuracy of positive predictions [40].
Recall measures the proportion of actual positive instances that are correctly identified by the model, thereby reflecting its sensitivity and completeness. It is expressed as follows:
where FN denotes false negatives. A high recall indicates that most of the relevant instances are detected [40,41].
The F1 score serves as the harmonic mean of precision and recall, offering a balanced evaluation of the model’s ability to detect true positives while minimizing both false positives and false negatives. The F1 score is particularly valuable in real-time applications where both high precision and high recall are critical. It is defined as follows:
where P and R are the precision and recall, respectively. This metric is extensively used in information retrieval and detection systems for its robustness in imbalanced datasets [42].
To further investigate the model’s performance under varying detection confidence levels, precision–confidence, recall–confidence, and F1–confidence curves were utilized. These performance plots enable an in-depth analysis of the model’s behavior across a range of confidence thresholds, providing insight into its calibration and robustness under conditions of uncertainty [43].
The mean Average Precision (mAP) was employed to summarize detection performance across multiple intersection over union (IoU) thresholds. This metric captures the area under the precision–recall curve and is formulated as follows:
where P(R) denotes the precision at a specific recall level R. The mAP is a standard benchmark in object detection challenges such as PASCAL VOC and MS COCO [44,45].
2.4.2. Training Loss Indicators
The model used for object detection in this paper is YOLOv8. During the training phase, the three main losses observed were box loss, classification loss, and distribution focal loss (DFL). Box loss measures the accuracy of the bounding box of the predicted and the actual outputs. Classification loss reflects the model’s prediction of probabilities for classes. DFL aids in calculating the offset and refining the predicted results. The loss functions are calculated after every epoch for both the training and testing datasets, reflecting the model’s convergence and generalization.
Box Loss (CIoU): Box loss measures how accurate the predicted bounding boxes are compared to the true bounding boxes. YOLOv8 uses complete intersection over union (CIoU) loss [1], which is given as follows:
where is the intersection over union of the predicted and ground-truth boxes, is the distance in Euclidean metric between their centers, is the diagonal length of the smallest enclosing box that covers both boxes, and measures the consistency of their aspect ratios. This formulation ensures the predicted and true boxes have improved overlap, spatial proximity, and shape consistency [40].
Classification Loss (Binary Cross-Entropy): YOLOv8 uses a binary cross-entropy (BCE) loss function for classification in a multi-label context [41]. The loss for each predicted class probability and true label is given as follows:
This loss penalizes the incorrect classification of object categories and contributes to the model’s ability to distinguish between different classes.
Distribution Focal Loss (DFL): To improve the bounding box regression capabilities, YOLOv8 employs distribution focal loss (DFL) within the generalized focal loss (GFL) framework [42]. Instead of directly regressing the coordinates, DFL represents each coordinate as a discrete probability distribution on the fixed set of bins. DFL loss is calculated by applying the cross-entropy loss between the predicted distribution and the soft target distribution, which is defined based on the two closest bins to the ground-truth value as follows:
where is the predicted distribution and the ground truth offset.
In summary, during training, the logs of the training and validation loss values of , are recorded at each epoch. These curves are meaningful signals of the learning process. If the training loss is low and decreases, the model is converging. When the gap between training and validation losses is high, the model is likely overfitting. Conversely, if the loss values are consistently high, this could indicate underfitting or lack of learning capacity. Loss curves are used as diagnostic instruments during training.
Notice that the loss metrics here are different from the evaluation metrics; namely, mean Average Precision (mAP), precision, or recall. Specifically, the loss metrics show how good the model fits the training dataset, while the evaluation metrics determine the model’s real performance during inference on unseen data. mAP is the main metric used to measure the object detection results on object detection benchmarks [43].
3. Experimental Work
To assess the real-time efficiency of the YOLOv8-DWSC model for traffic light identification, a testbed comprising an HD streaming camera and a Google Colab-based platform was implemented.
3.1. Experimental Setup
The workstation was a low-spec (quad-core, with 8 GB RAM) laptop whose only purpose was connecting to Google Colab, which is a Google Research cloud-based development environment. It only uses a browser to open and work on the Colab notebooks; it is not used to run the deep learning model.
We used Google Colab online for the actual model training, inference, and evaluation. Google Colab is capable of providing dedicated GPU acceleration (NVIDIA Tesla T4 or equiv), RAM (up to 16 GB), and disk storage (100+ GB) depending on the specific Colab tier and runtime option selection [46,47,48]. These resources provided by Colab made it possible to run deep learning models like YOLOv8 in real time without investing costly computing resources. PyTorch 2.7.1 and Open-Source Computer Vision (OpenCV) versions along with the Ultralytics YOLO framework library are supported in Google Colab implementation; therefore, it is suitable for computer vision research on rapid prototyping efforts.
Prior to real-time traffic lights detection, a multi-stage training process was applied. Initially, the model was trained using a publicly available traffic light signal dataset from GitHub [36], which included 2097 annotated images. In addition, supplementary datasets from Roboflow [49] were utilized to incorporate diverse object detection scenarios and enhance the model’s generalization capability. This training approach was designed to improve the accuracy of traffic light color detection, particularly under detection colors of traffic light signals such as (red, yellow, and green).
Real-time video frames were obtained using a USB connected to an HD camera in various settings. The specifications of the camera were as follows:
- Wide-angle lens for improved field of view;
- Night vision for low-light scenarios;
- 1080-pixel resolution for high-clarity image input.
An idle camera position was used to replicate the point of view either from a vehicle dashboard or from a static traffic-monitoring camera. A sample frame where a red light was acquired under natural lighting is shown in Figure 4.
The Colab environment hosted the YOLOv8-DWSC model that implemented detection on the video stream frame by frame. The proposed system was able to detect traffic signals under different circumstances including angle, distance, and brightness. The captured confidence values are depicted in Figure 5 and range between 0.50 and 0.68, validating the efficiency of the architecture for real-time traffic signal detection.
3.2. Collecting Streaming Video of a Traffic Light
The HD pro webcam stream camera and laptop are used to capture the traffic light signal data. The benefits of using streaming cameras include high-definition video capability, wide angle lenses that ensure better visibility under all monitoring conditions, and the ability to capture real-time data. The dataset we are using is a product of video recordings of the traffic light signals. This dataset contains 480 images obtained from several videos. Having varied streetlight images from different angles and positions aids the model in learning generalization to additional real-world conditions. Dataset descriptions are provided in Table 2.

Table 2.
Dataset stages.
These images are 384 × 640 in size with regard to the input size of the frame. Each input video frame measures 384 pixels in height and 640 pixels in width. The variety within the dataset is important for enabling the model to learn how to detect and classify different types of traffic lights.
In summary, the experimental framework was carefully designed to validate the robustness and reliability of the enhanced YOLOv8 model in real-world traffic light detection scenarios. The setup integrated a systematic training environment with a live-stream video capture pipeline to simulate authentic driving conditions, ensuring diverse environmental exposure during data collection. The evaluation was grounded on rigorous performance metrics—including precision, recall, F1 score, and mAP—along with training and validation loss tracking, providing a comprehensive assessment of model behavior across various thresholds. This thorough experimental methodology ensures the credibility of the findings and establishes a strong foundation for the subsequent presentation and discussion of results.
4. Results and Discussion
The results obtained from our experiment highlight the robustness of our object detection model in accurately recognizing traffic light signals in diverse real-life situations. The precision–confidence curve, Figure 6, presents an analysis of the model’s performance, highlighting its consistent high precision, especially in accurately identifying red, yellow, and green traffic lights, as confidence levels increase. This indicates that the model demonstrates a strong capacity to identify all signals accurately and minimize instances of false positives.
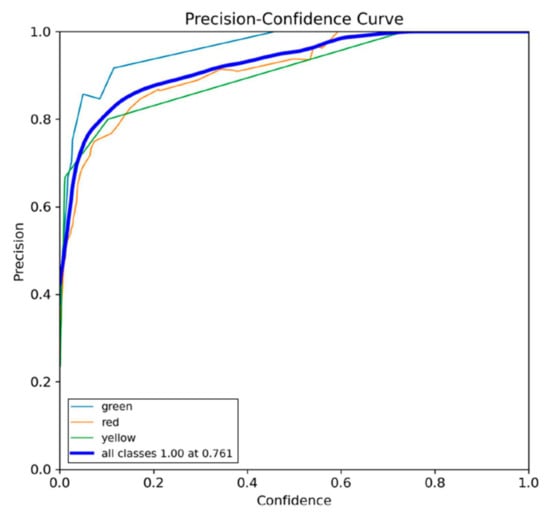
Figure 6.
Precision–confidence curve with 80 epochs of training.
Further examination of the precision–recall curve, as shown in Figure 7, highlights exceptional performance, with the model achieving high precision for (red = 0.992, yellow = 0.99, and green = 0.85) traffic lights. The model’s exceptional precision, accompanied by its dependable recall, showcases its ability to accurately detect almost all instances of light signals.
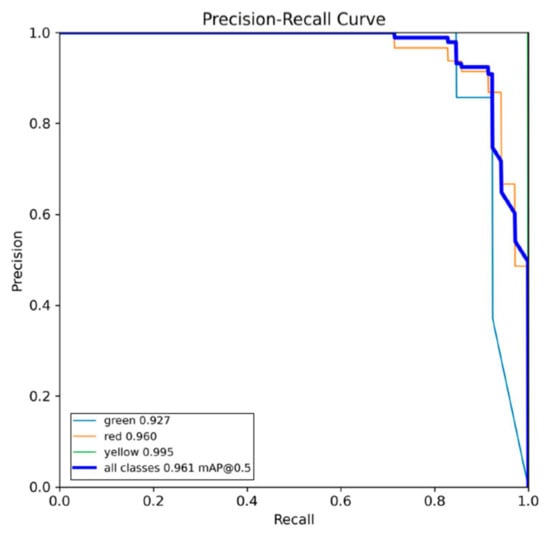
Figure 7.
Precision–recall curve with 80 epochs of training.
The recall–confidence curve provides additional evidence, illustrating how the model effectively maintains high recall levels while operating at lower confidence thresholds, guaranteeing the detection of traffic lights colors in a comprehensive manner.
The object detection model’s ability to recognize traffic light colors is demonstrated by the recall–confidence curve in Figure 8. The model (red curve) maintains high recall at various confidence levels, remaining near 1.0 even at lower thresholds. Recall is negatively impacted by confidence, which is expected given that higher thresholds eliminate some detections for greater accuracy. Very few true positives are missed because the model can identify almost all traffic light colors, even at lower confidence levels (high recall). Because it could be extremely dangerous to miss a red light, this high recall is necessary for autonomous navigation and real-time traffic monitoring. The model’s calibration curve demonstrates its dependability for experimental applications by showing a high recall in traffic light color detection.
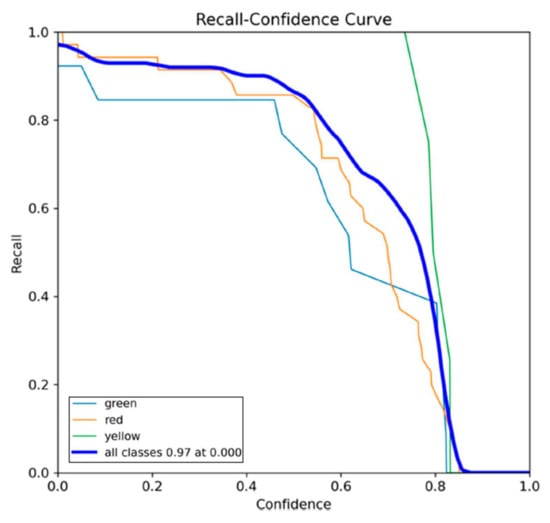
Figure 8.
Recall–confidence curve with 80 epochs of training.
The F1–confidence curve in Figure 9, provides an analysis of the model’s performance in detecting traffic lights colors. The red curve indicates that the model maintains a high F1 score across a range of confidence levels, peaking around 0.8. The F1 score, which is the harmonic mean of precision and recall, shows that the model balances both metrics effectively. At lower confidence thresholds, the model achieves high recall, capturing most red traffic light instances. As confidence increases, precision improves, maintaining a high F1 score up to a confidence threshold of 0.8, beyond which it begins to decline. This suggests that the model is well-calibrated, providing a reliable performance in detecting traffic lights colors. This high F1 score highlights the model’s suitability for real-time traffic monitoring and autonomous vehicle navigation, ensuring both accurate and comprehensive detection of red traffic signals.
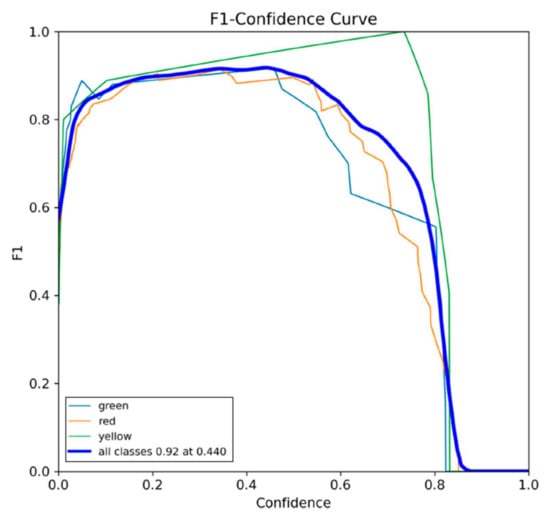
Figure 9.
F1–confidence curve with 80 epochs of training.
Figure 10 presents the training and validation loss curves for the proposed YOLOv8 model during the traffic light detection task. The graph illustrates three primary components of the validation loss, including classification loss (val/cls_loss), bounding box regression loss (val/box_loss), and distribution focal loss (val/dfl_loss), each tracked across all training epochs.
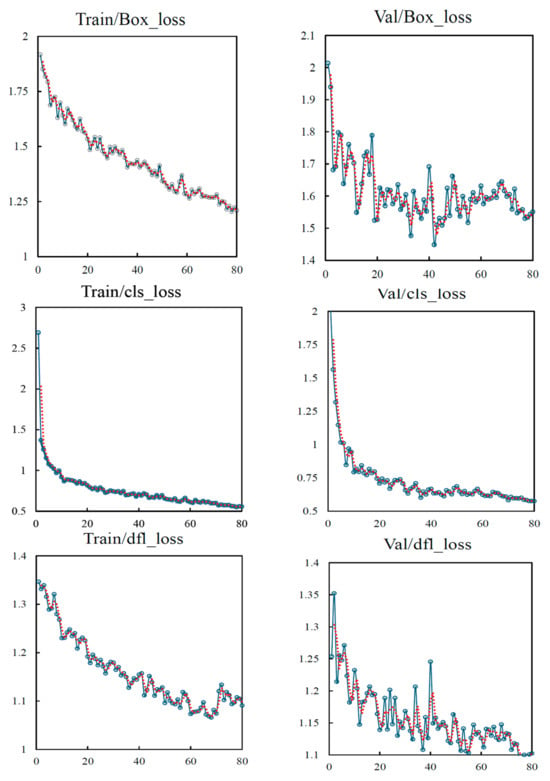
Figure 10.
Training and validation loss indicators over 80 epochs of the enhanced YOLOv8 model.
As observed, all three loss components exhibit a consistent downward trend throughout training, indicating that the model is effectively minimizing error and learning appropriate feature representations over time. The classification loss steadily decreases, showing that the model’s ability to distinguish traffic light color classes improves. Similarly, the box loss exhibits a strong downward trajectory, reflecting improved precision in object localization and bounding box regression. The distribution focal loss also reduces smoothly, further supporting the stability and robustness of the model’s convergence process.
The absence of significant fluctuations or spikes across the loss curves suggests stable training dynamics and a well-behaved optimization trajectory. This trend reinforces that the proposed YOLOv8 architecture adapts effectively to the traffic light dataset, achieving reliable generalization performance without overfitting.
In addition, mAP50–95 also increase steadily across epochs. This improvement signifies the model’s growing precision and generalization capability across varying locations. Overall, the consistent decline of validation loss components across training epochs demonstrates the enhanced learning capacity, improved localization accuracy, and classification reliability of the proposed model in the context of traffic light signal detection under real-world conditions.
The performance of the enhanced YOLOv8 model over 80 epochs is illustrated in Figure 11. The results demonstrate a consistent improvement in detection accuracy, precision, and recall throughout the training process, accompanied by a steady decrease in the loss value.
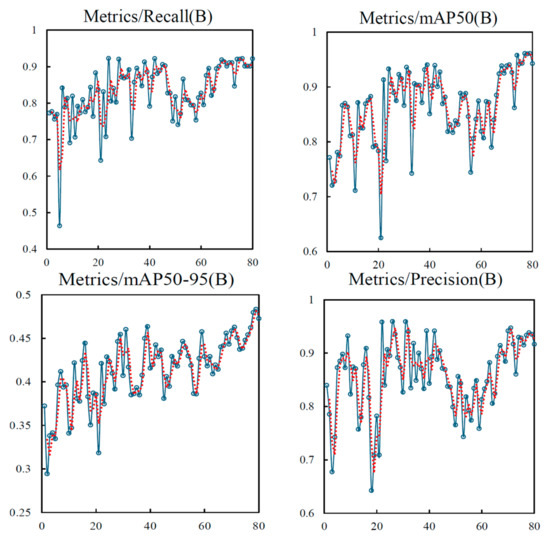
Figure 11.
Performance metrics of the enhanced YOLOv8 model over 80 epochs.
During the initial epochs, the model exhibits rapid learning, reflected in the steep increase in accuracy, precision, and recall. These metrics increase significantly in the early stages and gradually plateau as the model converges. The accuracy curve stabilizes at a high value, indicating consistent correct classification. Similarly, precision improves steadily, showing the model’s ability to reduce false-positive predictions, while recall increases continuously, highlighting enhanced detection of true positives with fewer missed objects.
The model validation performance metrics include the mean Average Precision (mAP) at intersection over union (IoU) thresholds of 0.50 (mAP50) and 0.50–0.95. The increasing recall trend supports a positive improvement in the model’s ability to detect true positives with reduced false-negative occurrences, particularly critical in traffic light recognition for autonomous driving.
The loss curve follows an inverse trend: it starts at a high value and decreases rapidly in the early epochs, eventually stabilizing at a low value. This indicates effective learning and minimal error as training progresses. The smoothness and monotonic nature of all curves—with no irregular oscillations—further confirm the stability and consistency of the optimization process
Overall, these results suggest that the proposed enhanced YOLOv8 model achieves high generalization capability, reliable spatial detection, and accurate color recognition of traffic lights. Its stable training behavior and performance trends make it well-suited for real-world autonomous driving implementations, where safety-critical object detection is essential.
The modified YOLOv8 architecture results are displayed in Table 3. Training the YOLOv8 architecture to detect the red light involved the use of live videos for approximately 2 h, 45 min, and 10 s. The accuracy rates for traffic lights were 0.99 for red lights, 0.99 for yellow lights, and 0.85 for green lights. On average, the accuracy rate reached 94.3%.

Table 3.
Results of YOLOv8 architecture.
Hence, the F1 score and confidence values that are incorporated into the performance curves for machine learning models, such as precision–confidence or F1–confidence curves, are not assigned any specific units. The F1 score is a measure of a model’s accuracy that considers both precision (the accuracy of positive predictions) and recall (the ability to find all positive instances). The F1 score is calculated as the harmonic mean of precision and recall, providing a single metric ranging from 0 to 1 to evaluate the model’s performance. Similar to the precision and recall harmonic mean, confidence scores also range from 0 to 1, with higher values corresponding to a higher level of confidence in the pre- diction’s correctness. Therefore, neither the F1 score nor the confidence values are assigned any particular units, with both falling within the 0 to 1 range.
The proposed modified YOLOv8 model offers key advantages over other models, including higher accuracy in detecting red lights, 0.68 vs. 0.40 in YOLO8 [33], the ability to detect additional classes like yellow lights, and improved generalization across varied conditions. While it slightly underperforms in green light detection, its overall balance and versatility make it a stronger choice for real-world applications, as shown in Table 4.

Table 4.
Comparison confidence scores of the output detection model.
In comparison to alternative models in Table 5, the proposed modified YOLOv8 model exhibits a well-rounded performance across precision, recall, and F1 score. The model’s exceptional precision score of 0.99 signifies its remarkable ability to predict the correct class accurately. Although it falls slightly behind YOLO8 [47] and YOLO8 [50] with a recall score of 0.90, the F1 score of 0.90 reflects a commendable balance between precision and recall. Notably, the modified YOLOv8 outshines other models in overall detection accuracy, as evidenced by its perfect mAP@0.50 score of 1.00 at a threshold of 0.635. One limitation is its relatively lower recall, which might result in missing some detections that other models capture, potentially due to conditions and timing during image capture. Nevertheless, the high precision and mAP scores demonstrate that the proposed YOLOv8 model excels in accuracy and overall performance compared to existing YOLO models, despite its lower recall capability.

Table 5.
Comparison of scores obtained with different models.
Furthermore, additional evaluation metrics have been provided for a thorough evaluation of the model performance in response to the recommendation to analyze model performance more deeply, rather than focusing exclusively on precision score. The results in Table 6 indicate that the model has high precision over all classes of traffic light signals, with red and yellow signals being the dominant classes. From the normalized confusion matrix shown in Figure 12, it is observed that 85% of the time, the green signal is classified correctly, and the red and yellow signals are consistently classified correctly. There is a possibility of confusion between green signals and background, indicating a tendency to misclassify due to noise or glare.

Table 6.
Comparison of precision scores obtained with different models.
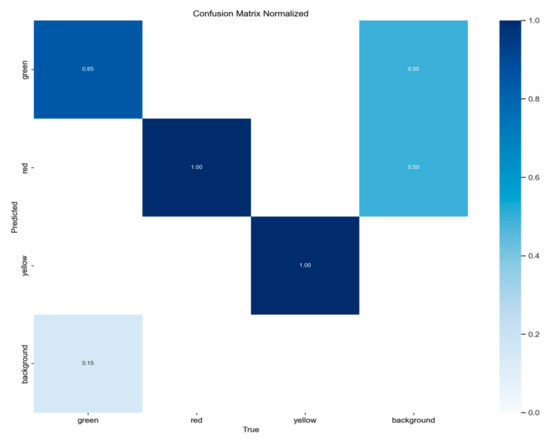
Figure 12.
Normalized confusion matrix showing classification accuracy.
In Figure 13, we present the ROC curve and confusion matrix results for the proposed CNN model for traffic light color classification. The ROC curve produces an AUC of 0.99, indicating a highly predictive model that can accurately classify the traffic light signals from the background noise.
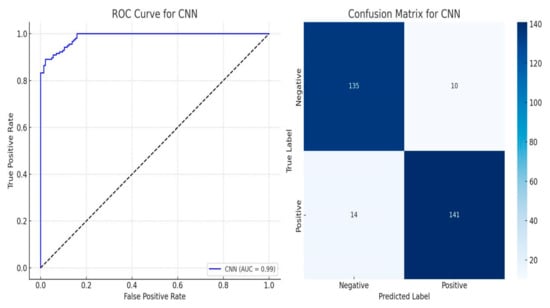
Figure 13.
ROC curve and confusion matrix for the CNN model.
The confusion matrix corroborates these results, presenting 135 true negatives, 141 true positives, 10 false positives, and 14 false negatives. The results indicate the model’s high precision and recall values, which are important for guaranteeing the detection reliability in safety-critical scenarios. These results prove the model’s robustness and accuracy when using CNN for real-time color recognition.
5. Conclusions
This study proposed a modified YOLOv8-based architecture that integrates Depth-Wise Separable Convolutions (DWSCs) throughout both the backbone and detection head to enhance real-time traffic light signal detection. The model was initially pretrained on a publicly available dataset and subsequently fine-tuned using a custom real-time dataset comprising 480 images captured under varied urban driving conditions. This two-stage training approach enabled strong generalization across diverse visibility scenarios.
Experimental evaluations confirmed the model’s effectiveness, achieving precision scores of 0.992 for red, 0.995 for yellow, and 0.853 for green lights, with an overall mAP@0.5 of 0.947. The model maintained stable training dynamics and low validation losses across 80 epochs, while offering reduced computational overhead—making it well-suited for embedded systems in autonomous vehicles. Compared to conventional YOLOv8 variants, the proposed model demonstrated superior detection performance, especially in recognizing red and yellow traffic lights.
A key limitation of the current study is the lack of cross-validation or evaluation on geographically diverse datasets. While the model performed well in controlled, urban daytime environments, its generalizability to unseen locations and conditions has not been systematically tested. Future work will focus on evaluating the proposed model using standardized datasets such as the LISA Traffic Light Dataset and BDD100K to assess robustness across various environmental, lighting, and geographical conditions. Additionally, the current model exhibits slightly lower recall for green signals, particularly in scenarios with high glare or background interference. To address these challenges, subsequent work will enhance green light recognition and incorporate advanced perception modules, including Unscented Kalman Filters (UKFs) for improved state estimation and sensor fusion, as well as SLAM frameworks for robust localization and navigation in dynamic, real-world traffic environments.
Author Contributions
Methodology, F.Y.; software, F.Y.; validation, F.Y.; formal analysis, F.Y.; investigation, F.Y.; resources, F.Y.; writing—original draft, F.Y.; writing—review and editing, J.Z.S.; supervision, J.Z.S.; project administration, F.Y. All authors have read and agreed to the published version of the manuscript.
Funding
This research received no external funding.
Data Availability Statement
The data are not publicly available due to privacy concerns and are related to the next work that is still not complete. Further inquiries can be directed to the corresponding author.
Conflicts of Interest
The authors declare no conflict of interest.
References
- World Health Organization. Global Status Report on Road Safety 2018; WHO: Geneva, Switzerland, 2018. [Google Scholar]
- Federal Highway Administration. Signalized Intersection Safety. 2024. Available online: https://safety.fhwa.dot.gov/intersection/signalized/ (accessed on 26 June 2025).
- Litman, T. The Benefits of Transportation Demand Management (TDM); Victoria Transport Policy Institute: Victoria, BC, Canada, 2021. [Google Scholar]
- Hoang, T.N.; Nguyen, K.H.; Hua, H.K.; Nguyen, H.V.N.; Quach, L.-D. Optimizing YOLO performance for traffic light detection and end-to-end steering control for autonomous vehicles in Gazebo-ROS2. Int. J. Adv. Comput. Sci. Appl. 2023, 14, 475–484. [Google Scholar]
- Zhang, J.; Zou, X.; Kuang, L.-D.; Wang, J.; Sherratt, R.S.; Yu, X. CCTSDB 2021: A more comprehensive traffic sign detection benchmark. Hum.-Centric Comput. Inf. Sci. 2022, 12, 23. [Google Scholar]
- Ketkar, N.; Moolayil, J.; Ketkar, N.; Moolayil, J. Deep Learning with Python: Learn Best Practices of Deep Learning Models with PyTorch; Springer: New York, NY, USA, 2021. [Google Scholar]
- Redmon, J.; Divvala, S.; Girshick, R.; Farhadi, A. You only look once: Unified, real-time object detection. In Proceedings of the IEEE Conference on Computer Vision and Pattern Recognition, Las Vegas, NV, USA, 27–30 June 2016; pp. 779–788. [Google Scholar]
- Jocher, G.; Chaurasia, A.; Qiu, L.; Hogan, J. YOLOv8: Ultralytics Next-Generation Real-Time Object Detector. 2023. Available online: https://github.com/ultralytics/ultralytics (accessed on 15 December 2024).
- Wang, K.; Tang, X.; Zhao, S.; Zhou, Y. Simultaneous detection and tracking using deep learning and integrated channel feature for ambint traffic light recognition. J. Ambient Intell. Humaniz. Comput. 2022, 13, 271–281. [Google Scholar] [CrossRef]
- Wu, D.; Liao, M.-W.; Zhang, W.-T.; Wang, X.-G.; Bai, X.; Cheng, W.-Q.; Liu, W.-Y. YOLOP: You only look once for panoptic driving perception. Mach. Intell. Res. 2022, 19, 550–562. [Google Scholar] [CrossRef]
- Cao, Z.; Liao, T.; Song, W.; Chen, Z.; Li, C. Detecting the shuttlecock for a badminton robot: A YOLO based approach. Expert Syst. Appl. 2021, 164, 113833. [Google Scholar] [CrossRef]
- Kim, J.; Cho, H.; Hwangbo, M.; Choi, J.; Canny, J.; Kwon, Y.P. Deep traffic light detection for self-driving cars from a large-scale dataset. In Proceedings of the 2018 21st International Conference on Intelligent Transportation Systems (ITSC), Maui, HI, USA, 4–7 November 2018; pp. 280–285. [Google Scholar]
- Sasiadek, J.; Wang, Q. Low cost automation using INS/GPS data fusion for accurate positioning. Robotica 2003, 21, 255–260. [Google Scholar] [CrossRef]
- Wang, X.; Han, J.; Xiang, H.; Wang, B.; Wang, G.; Shi, H.; Chen, L.; Wang, Q. A lightweight traffic lights detection and recognition method for mobile platform. Drones 2023, 7, 293. [Google Scholar] [CrossRef]
- Chuang, C.-H.; Lee, C.-C.; Lo, J.-H.; Fan, K.-C. Traffic light detection by integrating feature fusion and attention mechanism. Electronics 2023, 12, 3727. [Google Scholar] [CrossRef]
- Zhou, Q.; Zhang, D.; Liu, H.; He, Y. KCS-YOLO: An Improved Algorithm for Traffic Light Detection under Low Visibility Conditions. Machines 2024, 12, 557. [Google Scholar] [CrossRef]
- Gakhar, I.; Guha, A.; Gupta, A.; Agarwal, A.; Toshniwal, D.; Verma, U. TLDR: Traffic Light Detection using Fourier Domain Adaptation in Hostile WeatheR. arXiv 2024, arXiv:2411.07901. [Google Scholar]
- Wang, Y.; Xing, S.; Can, C.; Li, R.; Hua, H.; Tian, K.; Mo, Z.; Gao, X.; Wu, K.; Zhou, S. Generative ai for autonomous driving: Frontiers and opportunities. arXiv 2025, arXiv:2505.08854. [Google Scholar]
- Da, L.; Chen, T.; Li, Z.; Bachiraju, S.; Yao, H.; Li, L.; Dong, Y.; Hu, X.; Tu, Z.; Wang, D. Generative ai in transportation planning: A survey. arXiv 2025, arXiv:2503.07158. [Google Scholar]
- Huang, Y.; Wang, F. D-TLDetector: Advancing Traffic Light Detection with a Lightweight Deep Learning Model. IEEE Trans. Intell. Transp. Syst. 2025, 26, 3917–3933. [Google Scholar] [CrossRef]
- Zhu, J.; Li, S.; Liu, Y.A.; Yuan, J.; Huang, P.; Shan, J.; Ma, H. Odgen: Domain-specific object detection data generation with diffusion models. Adv. Neural Inf. Process. Syst. 2024, 37, 63599–63633. [Google Scholar]
- Baik, S.; Kim, E. Detection of Human Traffic Controllers Wearing Construction Workwear via Synthetic Data Generation. Sensors 2025, 25, 816. [Google Scholar] [CrossRef]
- Yang, G.; Wang, J.; Nie, Z.; Yang, H.; Yu, S. A Lightweight YOLOv8 Tomato Detection Algorithm Combining Feature Enhancement and Attention. Agronomy 2023, 13, 1824. [Google Scholar] [CrossRef]
- Wu, Y.; Han, Q.; Jin, Q.; Li, J.; Zhang, Y. LCA-YOLOv8-Seg: An Improved Lightweight YOLOv8-Seg for Real-Time Pixel-Level Crack Detection of Dams and Bridges. Appl. Sci. 2023, 13, 10583. [Google Scholar] [CrossRef]
- Li, H.; Ma, J.; Zhang, J. ELNet: An Efficient and Lightweight Network for Small Object Detection in UAV Imagery. Remote Sens. 2025, 17, 2096. [Google Scholar] [CrossRef]
- Naftali, M.G.; Hugo, G. Palm Oil Counter: State-of-the-Art Deep Learning Models for Detection & Counting in Plantations. IEEE Access 2024, 12, 90395–90417. [Google Scholar]
- Gray, N.; Moraes, M.; Bian, J.; Wang, A.; Tian, A.; Wilson, K.; Huang, Y.; Xiong, H.; Guo, Z. GLARE: A dataset for traffic sign detection in sun glare. IEEE Trans. Intell. Transp. Syst. 2023, 24, 12323–12330. [Google Scholar] [CrossRef]
- Beigi, S.A.; Park, B.B. Impact of Critical Situations on Autonomous Vehicles and Strategies for Improvement. Future Transp. 2025, 5, 39. [Google Scholar] [CrossRef]
- Bersani, M.; Mentasti, S.; Dahal, P.; Arrigoni, S.; Vignati, M.; Cheli, F.; Matteucci, M. An integrated algorithm for ego-vehicle and obstacles state estimation for autonomous driving. Robot. Auton. Syst. 2021, 139, 103662. [Google Scholar] [CrossRef]
- Farag, W. Real-time autonomous vehicle localization based on particle and unscented kalman filters. J. Control Autom. Electr. Syst. 2021, 32, 309–325. [Google Scholar] [CrossRef]
- Ramos, L.T.; Sappa, A.D. A Decade of You Only Look Once (YOLO) for Object Detection. arXiv 2025, arXiv:2504.18586. [Google Scholar]
- Terven, J.R.; Córdova-Esparza, D.-M.; Romero-González, J.-A. A Comprehensive Review of YOLO Architectures in Computer Vision: From YOLOv1 to YOLOv8 and YOLO-NAS. Mach. Learn. Knowl. Extr. 2023, 5, 1680–1716. [Google Scholar] [CrossRef]
- Feng, H.; Mu, G.; Zhong, S.; Zhang, P.; Yuan, T. Benchmark Analysis of YOLO Performance on Edge Intelligence Devices. Cryptography 2022, 6, 16. [Google Scholar] [CrossRef]
- Howard, A.G.; Zhu, M.; Chen, B.; Kalenichenko, D.; Wang, W.; Weyand, T.; Andreetto, M.; Adam, H. MobileNets: Efficient Convolutional Neural Networks for Mobile Vision Applications. arXiv 2017, arXiv:1704.04861. [Google Scholar]
- Dong, X.; Liu, Y.; Dai, J. Concrete Surface Crack Detection Algorithm Based on Improved YOLOv8. Sensors 2024, 24, 5252. [Google Scholar] [CrossRef]
- Vennapu, S. Traffic Light Detection using YOLOv8—Training Repository. 2023. Available online: https://github.com/Satish-Vennapu/Traffic-Light-Detection-using-YOLOv8 (accessed on 5 January 2025).
- Karakan, A. Detection of Red, Yellow, and Green Lights in Real-Time Traffic Lights with YOLO Architecture. Celal Bayar Univ. J. Sci. 2024, 20, 28–36. [Google Scholar] [CrossRef]
- Dashcam, T. That’ll be a $325 Ticket in the Mail. Toronto Red Light Camera Dashcam, July 2024 ed.; YouTube: San Bruno, CA, USA, 2024. [Google Scholar]
- Anonymous. New York Driver Unfamiliar with Canada’s Advanced (Flashing) Green Lights, July 2024 ed.; YouTube: San Bruno, CA, USA, 2024. [Google Scholar]
- Sokolova, M.; Lapalme, G. A systematic analysis of performance measures for classification tasks. Inf. Process. Manag. 2009, 45, 427–437. [Google Scholar] [CrossRef]
- Powers, D.M.W. Evaluation: From Precision, Recall and F-Measure to ROC, Informedness, Markedness & Correlation. J. Mach. Learn. Technol. 2011, 2, 37–63. [Google Scholar]
- Sasaki, Y. The Truth of the F-measure; University of Manchester, MIB School of Computer Science: Manchester, UK, 2007. [Google Scholar]
- Guo, C.; Pleiss, G.; Sun, Y.; Weinberger, K.Q. On Calibration of Modern Neural Networks. In Proceedings of the 34th International Conference on Machine Learning (ICML), Sydney, Australia, 6–11 August 2017; pp. 1321–1330. [Google Scholar]
- Everingham, M.; Van Gool, L.; Williams, C.K.I.; Winn, J.; Zisserman, A. The PASCAL Visual Object Classes (VOC) Challenge. Int. J. Comput. Vis. 2010, 88, 303–338. [Google Scholar] [CrossRef]
- Lin, T.Y.; Maire, M.; Belongie, S.J.; Hays, J.; Perona, P.; Ramanan, D.; Zitnick, C.L. Microsoft COCO: Common Objects in Context. In Proceedings of the European Conference on Computer Vision (ECCV), Zurich, Switzerland, 6–12 September 2014; pp. 740–755. [Google Scholar]
- Bisong, E. Google Colaboratory. In Building Machine Learning and Deep Learning Models on Google Cloud Platform; Apress: Berkeley, CA, USA, 2019; pp. 59–64. [Google Scholar] [CrossRef]
- Biswas, S.; Acharjee, S.; Ali, A.; Chaudhari, S.S. YOLOv8 Based Traffic Signal Detection in Indian Roads. In Proceedings of the 2023 7th International Conference on Electronics, Materials Engineering & Nano-Technology (IEMENTech), Kolkata, India, 18–20 December 2023; pp. 1–6. [Google Scholar]
- Google. Google Colaboratory Frequently Asked Questions. 2024. Available online: https://research.google.com/colaboratory/faq.html (accessed on 25 June 2025).
- Roboflow. Microsoft COCO Subset Dataset; Roboflow: Des Moines, IA, USA, 2024. [Google Scholar]
- Krishna, S.S.; Parisha, V.; Varma, B.U.K.; Srinivasulu, C. Traffic Light Detection and Recognition Using YOLOv8. In Proceedings of the 2024 3rd International Conference on Applied Artificial Intelligence and Computing (ICAAIC), Salem, India, 5–7 June 2024; pp. 1227–1233. [Google Scholar]
Disclaimer/Publisher’s Note: The statements, opinions and data contained in all publications are solely those of the individual author(s) and contributor(s) and not of MDPI and/or the editor(s). MDPI and/or the editor(s) disclaim responsibility for any injury to people or property resulting from any ideas, methods, instructions or products referred to in the content. |
© 2025 by the authors. Published by MDPI on behalf of the World Electric Vehicle Association. Licensee MDPI, Basel, Switzerland. This article is an open access article distributed under the terms and conditions of the Creative Commons Attribution (CC BY) license (https://creativecommons.org/licenses/by/4.0/).