1. Introduction
Sustainable mobility is a recurrent topic in transportation, and among the different solutions for vehicle innovation, electric mobility seems to be a promising trend. In the USA, a national goal, according to the UN Sustainable Development Goals “
https://sdgs.un.org/goals (accessed on 26 July 2025)”, is planned for half of new cars and trucks sold to be zero-emission vehicles by 2030. According to the Fit for 55 climate package, the EU’s target is to reduce greenhouse gas emissions by at least 55% by 2030, with an even more ambitious new proposal for cars and vans to reduce these emissions by 100% by 2035. Consistent with the Kyoto Protocol, the Paris Agreement, and other limitations related to the environment, this may contribute to a reduction in CO
2 emissions, to which transportation is one of the principal contributors.
Vehicle electrification seems to be considered by public decision-makers, particularly at the European level, to be one of the main actions to be taken for emission reduction. However, the complexity of the transition process is also affected by the technological maturity of the batteries, the large-scale availability of raw materials, and the presence of an adequate charging network in the territory. In this context, planning activities can be useful (e.g., in the framework of the Sustainable Urban Mobility Plan—SUMP) for developing adequate charging infrastructure in “smart cities” based on identified mobility needs, the ways in which vehicles are used to enable trips connecting daily activities, and the vehicle features available on the market.
Considering the uncertainty surrounding energy prices, the market is increasingly being observed to lean towards alternatives to traditional ICEVs (internal combustion engine vehicles), which remain predominant. Electric vehicles (EVs), in 2022 “
https://alternative-fuels-observatory.ec.europa.eu/transport-mode/road/european-union-eu27/vehicles-and-fleet (accessed on 26 July 2025)”, represented 12% of the market share for passenger cars in the European Union (EU27). In Italy, the values are currently drastically lower: between 2022 and 2024, approximately 4% of vehicles sold in Italy were battery EVs (BEVs) according to UNRAE, the Italian association representing foreign automotive manufacturers operating in Italy; whereas Norway, with approximately 80% newly registered BEVs as a percentage of the total number of registrations of passenger cars, and Sweden, with 35%, lead the EV market in Europe. Typical issues affecting EVs, such as their limited range and the lack of a wide charging station network, have begun to be solved in recent years. Indeed, achieving improvements in battery performance and developing adaptation processes in cities for implementing proper charging networks, which include the mitigation of possible problems for the energy distribution grid, especially during peak hours, are recent trends in this field.
From a technological point of view, EVs must be distinguished into different groups, since their requirements and, hence, owner operations to manage the vehicles may be completely different: hybrid EVs (HEVs), plug-in hybrid EVs (PHEVs), and battery EVs (BEVs) are the three most common solutions. BEVs are the most challenging type, since these vehicles rely solely on an electric battery, allocating a crucial role to energy stored on board, whereas in the other variants, the electric battery is a support for the traditional thermal engine. HEVs are predominantly powered by gasoline, while PHEVs still have a traditional engine as well but can be fully electric powered, albeit with a significantly smaller range than BEVs. Unlike HEVs, PHEVs and BEVs can be directly recharged at specific electric charging stations (ECSs) thanks to their plug-ins. The time required for charging operations depends on the electric power of the station. The most common slower ECS options are rated at 3 and 7 kW, and they are intended for home and workplace recharges, or for places where an extended parking timeslot is available. Nevertheless, these options are not effective for shorter time windows. Therefore, faster solutions at 22 kW, 43 kW, 50 kW, or higher can be appreciated by users. However, they are usually more expensive to install and are adopted not for private use but for public spaces, such as wide parking areas in malls and workplaces. Even faster charging solutions are available, exceeding 100 kW (e.g., from 135 kW up to 350 kW), but these may not be supported by all EVs, or specific charging methods may be required in order to avoid influencing the battery’s state of health and lifecycle [
1]. However, electric vehicles and batteries are in continuous development, and today, charging at high power levels (e.g., 50 kW) can be an option even for medium-sized vehicles.
To test the feasibility of the proposed approach, results are presented concerning a case study based on data from real vehicles. Indeed, trip chains observed for cars were obtained from floating car data recorded in a metropolitan area, while simulations were carried out specifically considering battery electric vehicles (BEVs). This study aims to answer two principal research questions related to electric mobility:
Can the common characteristics of BEVs—typically, their range and charging options—be compared with observed vehicle usage, while also considering the time cars spend parked between consecutive trips, with the support of simulation?
How can the impact of the various charging strategies for BEVs on the energy required in various zones of a city be simulated?
First, the observed trip chains were screened to understand whether they can be satisfied by EV characteristics. In the event that the frequency of long-range daily trips is relevant for a specific market segment of vehicles, this may generate a limitation for BEVs. A similar analysis was applied in [
2], counting the days on which ICEVs’ demand was affordable considering typical BEV ranges, as well as those when adaptations became necessary, inferring the percentage of drivers whose needs were met. In [
3], an analogous analysis is presented, also including the information about the number of vehicles owned by the households under study. Since range anxiety is one of the most prominent deterrent factors that prevent people from buying vehicles different from traditional ICEVs [
4,
5,
6], the traveled distances were analyzed and compared to the battery capacities. An observation period of more consecutive days was considered because in one day most of the trips have a duration such that no charging operation would be required. Considering the range of a battery cycle, six consecutive days were selected to observe a noticeable energy consumption and at least a recharge operation in most cases (consistent with [
7], in which the reported number of charging operations in a typical week is between 2.8 and 3.1). On the other hand, during a working week (which can be easily managed by computational time needs), sporadic trips are likely to be excluded.
To answer the second question, not only was the chance of recharging the vehicles included in the simulation model, the zoning of the study area was also applied to evaluate the spatial distribution of the energy demand in the selected city in terms of the number of possible charging operations. This second step was performed by simulating different scenarios and could be useful to support a proper preliminary design of the charging infrastructure network and the electricity distribution infrastructure in the city. In the simulation model, a classification of the vehicles according to their segment was introduced to properly classify the charging needs and to identify the utilization levels of different charging powers.
The aim was to verify whether usual trips, as performed using traditional ICE vehicles and observed by FCD for more consecutive days, can also be satisfied by BEVs with limited battery capacity. For this reason, to make the situations comparable, the trips simulated with BEVs were assumed to be identical to those observed for ICE vehicles. Therefore, possible impacts on user habits that may change in new conditions, as in the case of different types of vehicles, are not considered in this study.
Many studies have been conducted to accurately estimate the battery state of charge (
SoC) for EVs during a trip. In [
8], the impact of driving style on the power required during the trip and, consequently, on the vehicle energy consumption is observed. In [
9], the effects caused by weather—and particularly by the wind speed and direction—on energy consumption are modeled. In [
10], for suggesting to drivers the near-optimal energy path in a road network, a real-time model was built for evaluating rolling resistance, which requires detailed data due to its sensitivity to the pavement and weather conditions. The simulation model proposed for EV energy consumption estimation in [
11] approximates real-life situations for vehicles and confirms the importance of real-time estimations for the role of driving style and weather conditions. Moreover, road geometry (slope, curvature, etc.) becomes crucial when dealing with the instantaneous power required by the engine. In terms of the battery side, it is also challenging to monitor the
SoC without introducing error terms. To better describe real-world driving conditions, an energy consumption model including battery
SoC was proposed by [
12], in addition to microscopic driving parameters such as real-time speed and acceleration, which can be used to estimate the instantaneous EV power, as reported in [
13].
A prediction model of the
SoC for BEVs, calibrated from floating car data (FCD)—including vehicle position and
SoC, available every 4 min—is proposed in [
14] using a statistical method (Monte Carlo Markov chain). In this case, a tailored average consumption index [kWh/km] was used for selected BEV models to adapt the forecasting to car features, but without using the average speed.
In this paper, the study area is modeled through the introduction of zoning, as reported in [
15]. An alternative way of performing a spatial analysis would be to represent the road network in the study area, as in [
16] and [
11]. However, the aim of this study is not to simulate and monitor vehicles during trips along the road network (i.e., when they are in motion) but to examine the trip chains for the observed vehicles during a working week period, during which many idle times occur, eventually allowing for a charging operation. For each trip, the origin and destination points are known, as are the time and distance traveled. Therefore, the energy consumption for vehicles is estimated according to this level of representation, which is adequate to simulate scenarios characterized by a higher number of EVs and identify the zones of the city where energy demand could be critical. In [
17], the prediction of electric vehicle charging demand was modeled using the observed parking data of EV users. To overcome the limit of the low penetration rate of BEVs, the authors of [
18] developed an algorithm to predict the total energy demand for FEVs in the city based on historical traffic data. Indeed, only recently have large datasets been available on the charging operations of BEVs in cases where their diffusion level is high, as in Shenzhen (China) [
19]. Nevertheless, despite the public network growth, home charging is still the most preferred solution for charging operations: the cost of 1 kWh of energy is lower in the latter case, where it could be considered to be a further house device, leading to an increase in electricity expenses of approximately +20% [
20]. On the other hand, the share of public infrastructure—which can be powered by DC (direct current), unlike private infrastructure—increases in highly populated areas, where there is not always room for private stations, or in places where high recharge speed is required [
21]. For this purpose, different network design strategies are proposed in [
22]: the balance between owners’ and users’ interests and the acceptable distance to charging stations are two examples of the critical aspect to be considered, as well as the possibility of facing slowdowns caused by bureaucratic delays [
23]. Moreover, the adoption of policies for incentivizing public recharge is a factor that could attract many eventual EV users, even more than the increase in taxes on traditional fuels, as observed in the survey performed in [
23]. Unfortunately, policies’ effects may vary according to the study area, since cost and other contextual variables may induce different variations in HEV/PHEV/BEV utilities [
23].
2. Materials and Methods
2.1. Historical Trip Chain Data by Car
Trip chain data are available in an FCD approach for approximately 25,000 equipped vehicles. The data are obtained by a service provider that collects data and provides them under a commercial agreement. Therefore, the data are not public, but they are available as a commercial service. In general, FCD represent vehicle positions at each given timestep, which can be at different time resolutions, from seconds to minutes. In this case study, considering the extended observation period of the trip chain to be simulated (approximately one week), this level of detail is not interesting, and the dataset includes only aggregated information for the entire trip. In particular, for each individual vehicle trip recorded, the origin and destination points are available, as well as the starting and arrival times, the trip length, and its average speed. The commercial service provides the list of trips in the dataset. The rule used to identify vehicle trips from FCD is based on the events of the engine when it is started or stopped. Hence, the authors do not elaborate on the rough FCD to obtain individual trips with detailed origin and destination points.
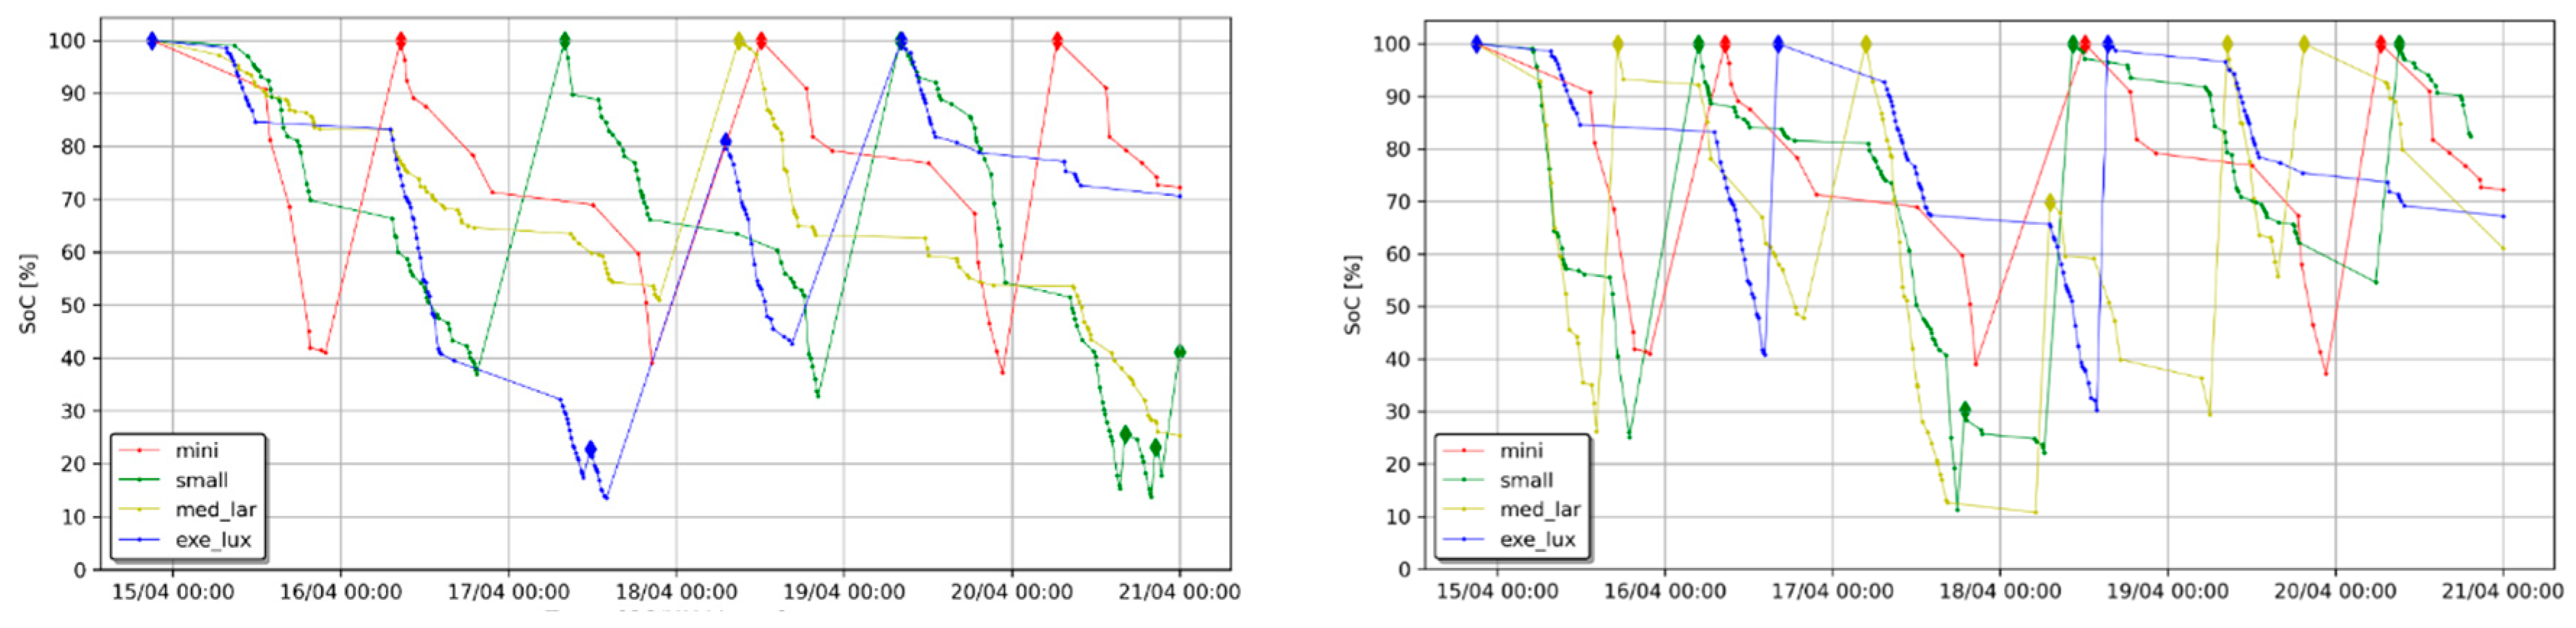
For this reason, hereafter, the dataset is denoted as HCD (historical car data). The available HCD datasets originate from black boxes installed in vehicles for insurance-related reasons, which record trip characteristics. The principal aim of this study is to extend the analysis for multiple days, since a 24 h period, as usually adopted for many applications in the transport system, is not enough to observe reasonable charging cycles for electric vehicles. The selected observation period covers 6 days: from Monday, 15 April to Saturday, 20 April 2019. During the experiments, only working days were examined and simulated, as an example of the application of the simulation approach. This is because the scheduling of activities is usually less flexible in terms of time and space, and including additional tasks for vehicles—such as charging activities—can be time-critical for users, as it may disrupt their daily routines. On the other hand, during weekends, users’ time availability is usually less constrained by their daily schedule, and this can impact their charging activities, such as duration and location, considering the expected free time. Journeys started on Saturday also included observation and simulation of the activities during the night between Friday and Saturday. Similarly, journeys that started on Sunday the 14th were also examined if they were extended to Monday the 15th. Therefore, the mobility habits that often occur on Sundays were not included. The extension of this period properly suits the aim of examining the possible mobility patterns concerning EVs, since it allows us to understand how charging operations are distributed in a timeslot longer than one day.
The data cover cities and towns falling in the area that feature as origins, destinations, or crossing points for trips between zones outside the Turin Metropolitan Area. The information about vehicle models was used to identify the vehicle market segment: A, B, C, D, E, and F for mini, small, medium, large, executive, and luxury cars, respectively. The segments were then grouped into 4 categories, which are similar to those adopted in [
20], to join the segments with fewer vehicles: mini (A), small (B), med_lar (C + D), and exe_lux (E + F). The database features are shown in
Table 1. The use of a dataset obtained from the observation provided the benefit of considering realistic distances and speeds, which can be related to different vehicle categories and may have different travel patterns and energy needs. In reality, trips with the same origin and destination may indeed follow different paths (i.e., different distance values could be recorded), and their average speed may change according to traffic conditions, weather, and many other factors that are not inferable from the observed data. For each trip, the considered features can be summarized as the date and time of trip departure and arrival, vehicle category, travel time, idle time, day of the week, traveled distance, vehicle ID, and the latitude and longitude of trip arrival.
To focus on relevant trips and reduce the computation time of the simulation experiments before elaborations, cleaning operations were applied to the dataset for removing secondary and short trips, which were identified if any of the following three criteria was met:
These three conditions allow for identifying those legs of the trips that are not relevant for the analysis, since they could be related to service operations, such as parking manoeuvers, and not to trips that can be performed using vehicles from origins to destinations. Considering their limited extension in terms of time and length, if compared to the total daily distance observed, their contribution to energy consumption in our case study is negligible. However, for other cases, these conditions can be adapted to specific situations, without any limitations on the simulation method.
Meanwhile, data with invalid model information were excluded, since it is impossible to match them with a market segment. Moreover, some trips do not include any arrival or departure location names, so a spatial join operation was necessary to find the country, region, province, and municipality in which the points fell. Data were dropped when the map matching was not valid.
The impact of the cleaning process on the dataset can be verified by observing that the final database includes 571,135 records instead of the 608,866 in the original version. However, the reduction in terms of vehicles is less relevant, since only 31 vehicles have been discharged out of approx. 24,700. More details are reported in
Table 1.
2.2. Energy Consumption Model for Vehicles
Many fuel consumption models are proposed in the literature, and a review can be found in [
24]. An example of a recent energy consumption model that can be applied to road links of urban and extra-urban networks is presented in [
25]. The model was calibrated based on FCD to include vehicle acceleration and the slope of the links, which were classified according to their features. However, considering the aim of the proposed method—which is to estimate the cumulative energy consumed during trips and the limitations in the available data, which are not related to second-by-second vehicle positions but are referred to trip chains, leg-by-leg—detailed energy models requiring link-by-link data cannot be applied in this study. One of the available options, which is consistent with the level of detail of the dataset, is the HERA model [
26], which can be applied for estimating the fuel consumption of the
trip according to its average speed V
i:
where a
j, b
j, c
j, and d
j are the model parameters and depend upon the category of the vehicle at issue. They can be defined based on the values provided for some categories (e.g., mini) and then derived for others if the real stated fuel consumption rates are known. Finally, the fuel consumption can be converted into electric energy using a proper coefficient, to consider these trips as if they were performed by EVs. Energy consumption [kWh] can also be estimated using consumption maps, such as those available in the agent-based simulation tool MATSim, which reports the energy consumption per unit of traveled distance as a function of the average speed. In the proposed simulations, the HERA model was used, whose parameters were calculated through a fitting function (i.e., fit
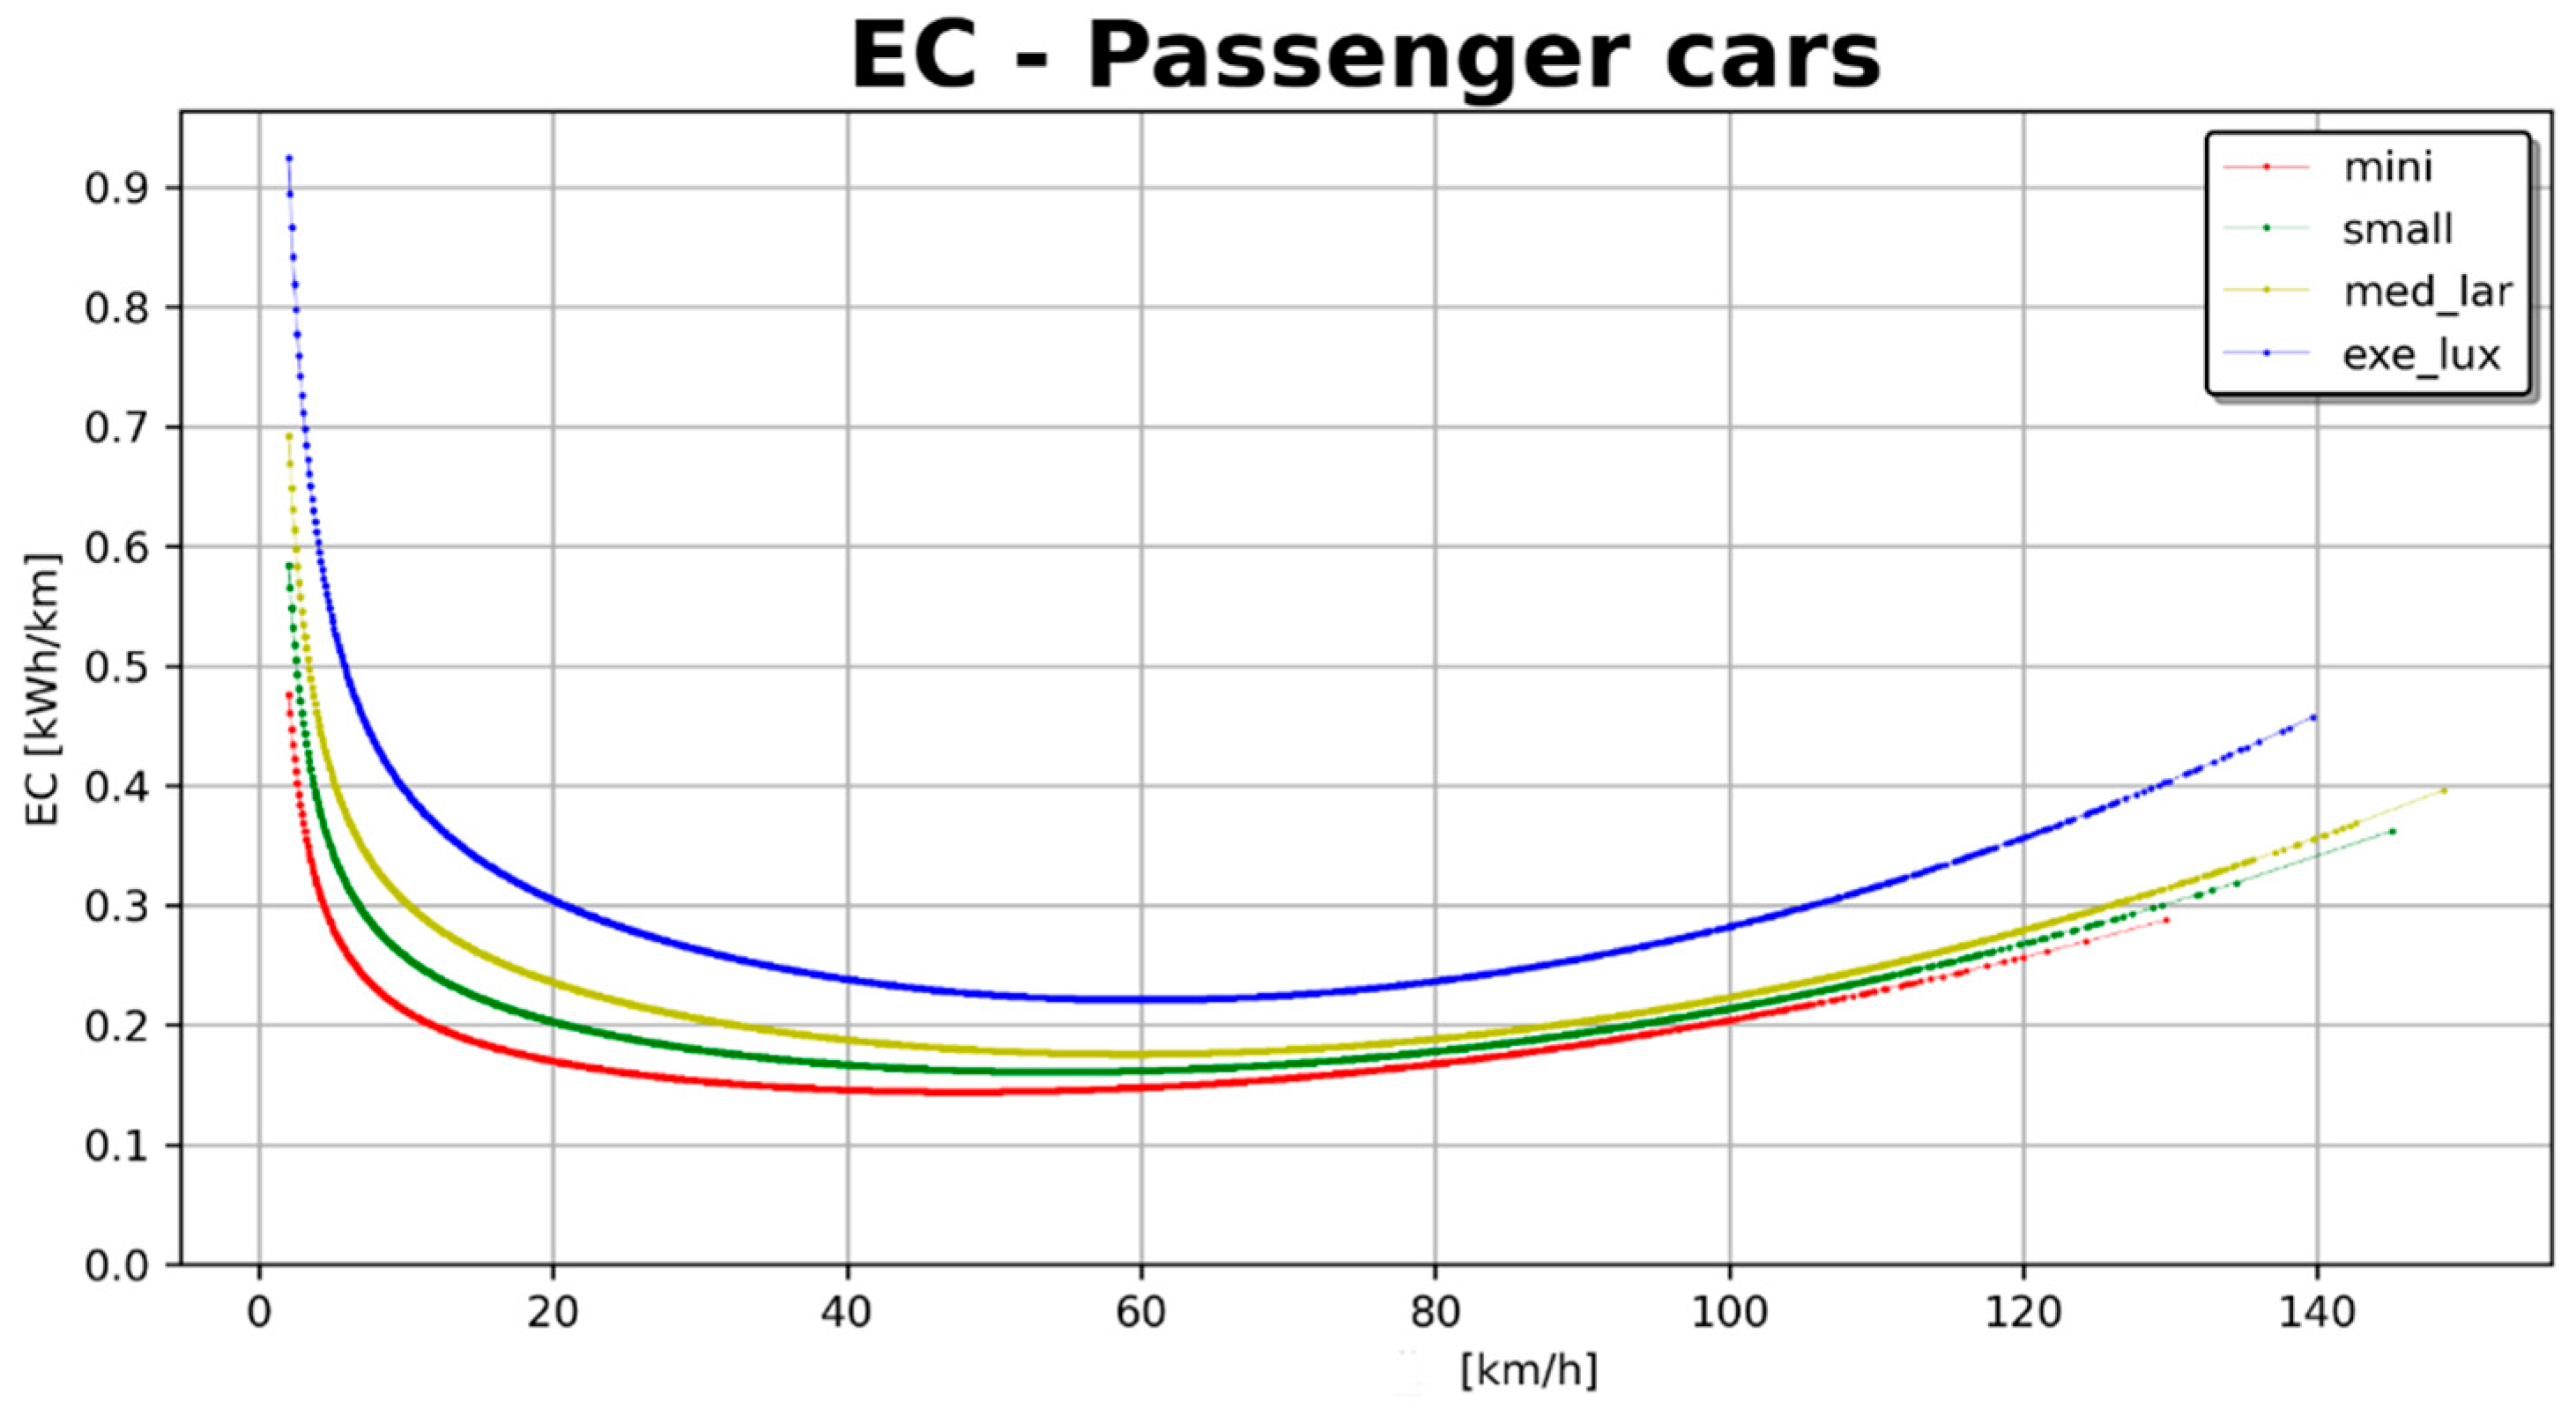
curve in the Python SciPy library) to the values of the consumption maps available for different vehicle types (
Figure 1). As expected, high-segmented cars tend to consume more than low-segmented ones. We found that energy consumption is minimal for speeds between 40 and 60 km/h, and this value changes according to the category. Consumption at 100 km/h is approximately one-third higher than the minimum. The maximum consumption rate is observed at low speeds (<10 km/h), likely because of the start-and-stop motion regime: the rate is 3–4 times higher for the three lowest categories, and even more remarkable for the exe_lux category.
A further enhancement of the model could include the ability of EVs to recover energy while braking. In [
27], the authors assume that the torque–speed curve in the braking phase is symmetrical to the acceleration phase. However, in the same study, it was found that, as vehicles often travel in an urban context, the contribution of energy recovery at low speeds can be neglected. Considering the approximation level in our simulation, this further refinement of the model was not included in the energy consumption.
2.3. EV Activity Simulation
The study area consists of the Turin Metropolitan Area, with a focus on the Turin municipality. A zoning system was introduced to aggregate trips according to their common destinations, so that eventual idle times could be spatially grouped to determine the energy requirements of specific areas. The zoning configuration was proposed assuming the version used in 2008 by the AMP (Agenzia Mobilità Piemonte—Piedmont Mobility Agency); it consists of 261 zones that cover the Turin municipality and its conurbation; 166 of these zones fall within the municipality boundaries and will be considered in the final section of this study. Starting from the trip chain data available for the consecutive days of the period, and applying the defined energy consumption model, three different simulation experiments were explored:
In the first reference case, different battery capacity scenarios were compared for evaluating how the observed vehicle trip chains can be suited by EVs, neglecting the opportunity to charge the vehicle during the simulation period; the purpose was to conduct a preliminary screening of the vehicle activities in the area and check how the trips are impacted by the automotive trend aimed at increasing the battery capacity.
In the second experiment, the simulations included the chance of recharging the vehicle if the idle time between consecutive trips was consistent with charging strategies (more details in the following section: Charging Strategies); a comparison of different charging options and the impact on the trip chains for the various vehicle categories and the electric grid was the principal result.
The third analysis simulated applying the approach of the second experiment with a focus on the core of the study area: the Turin municipality, where a geospatial analysis reveals the potential charging activities for the selected zones.
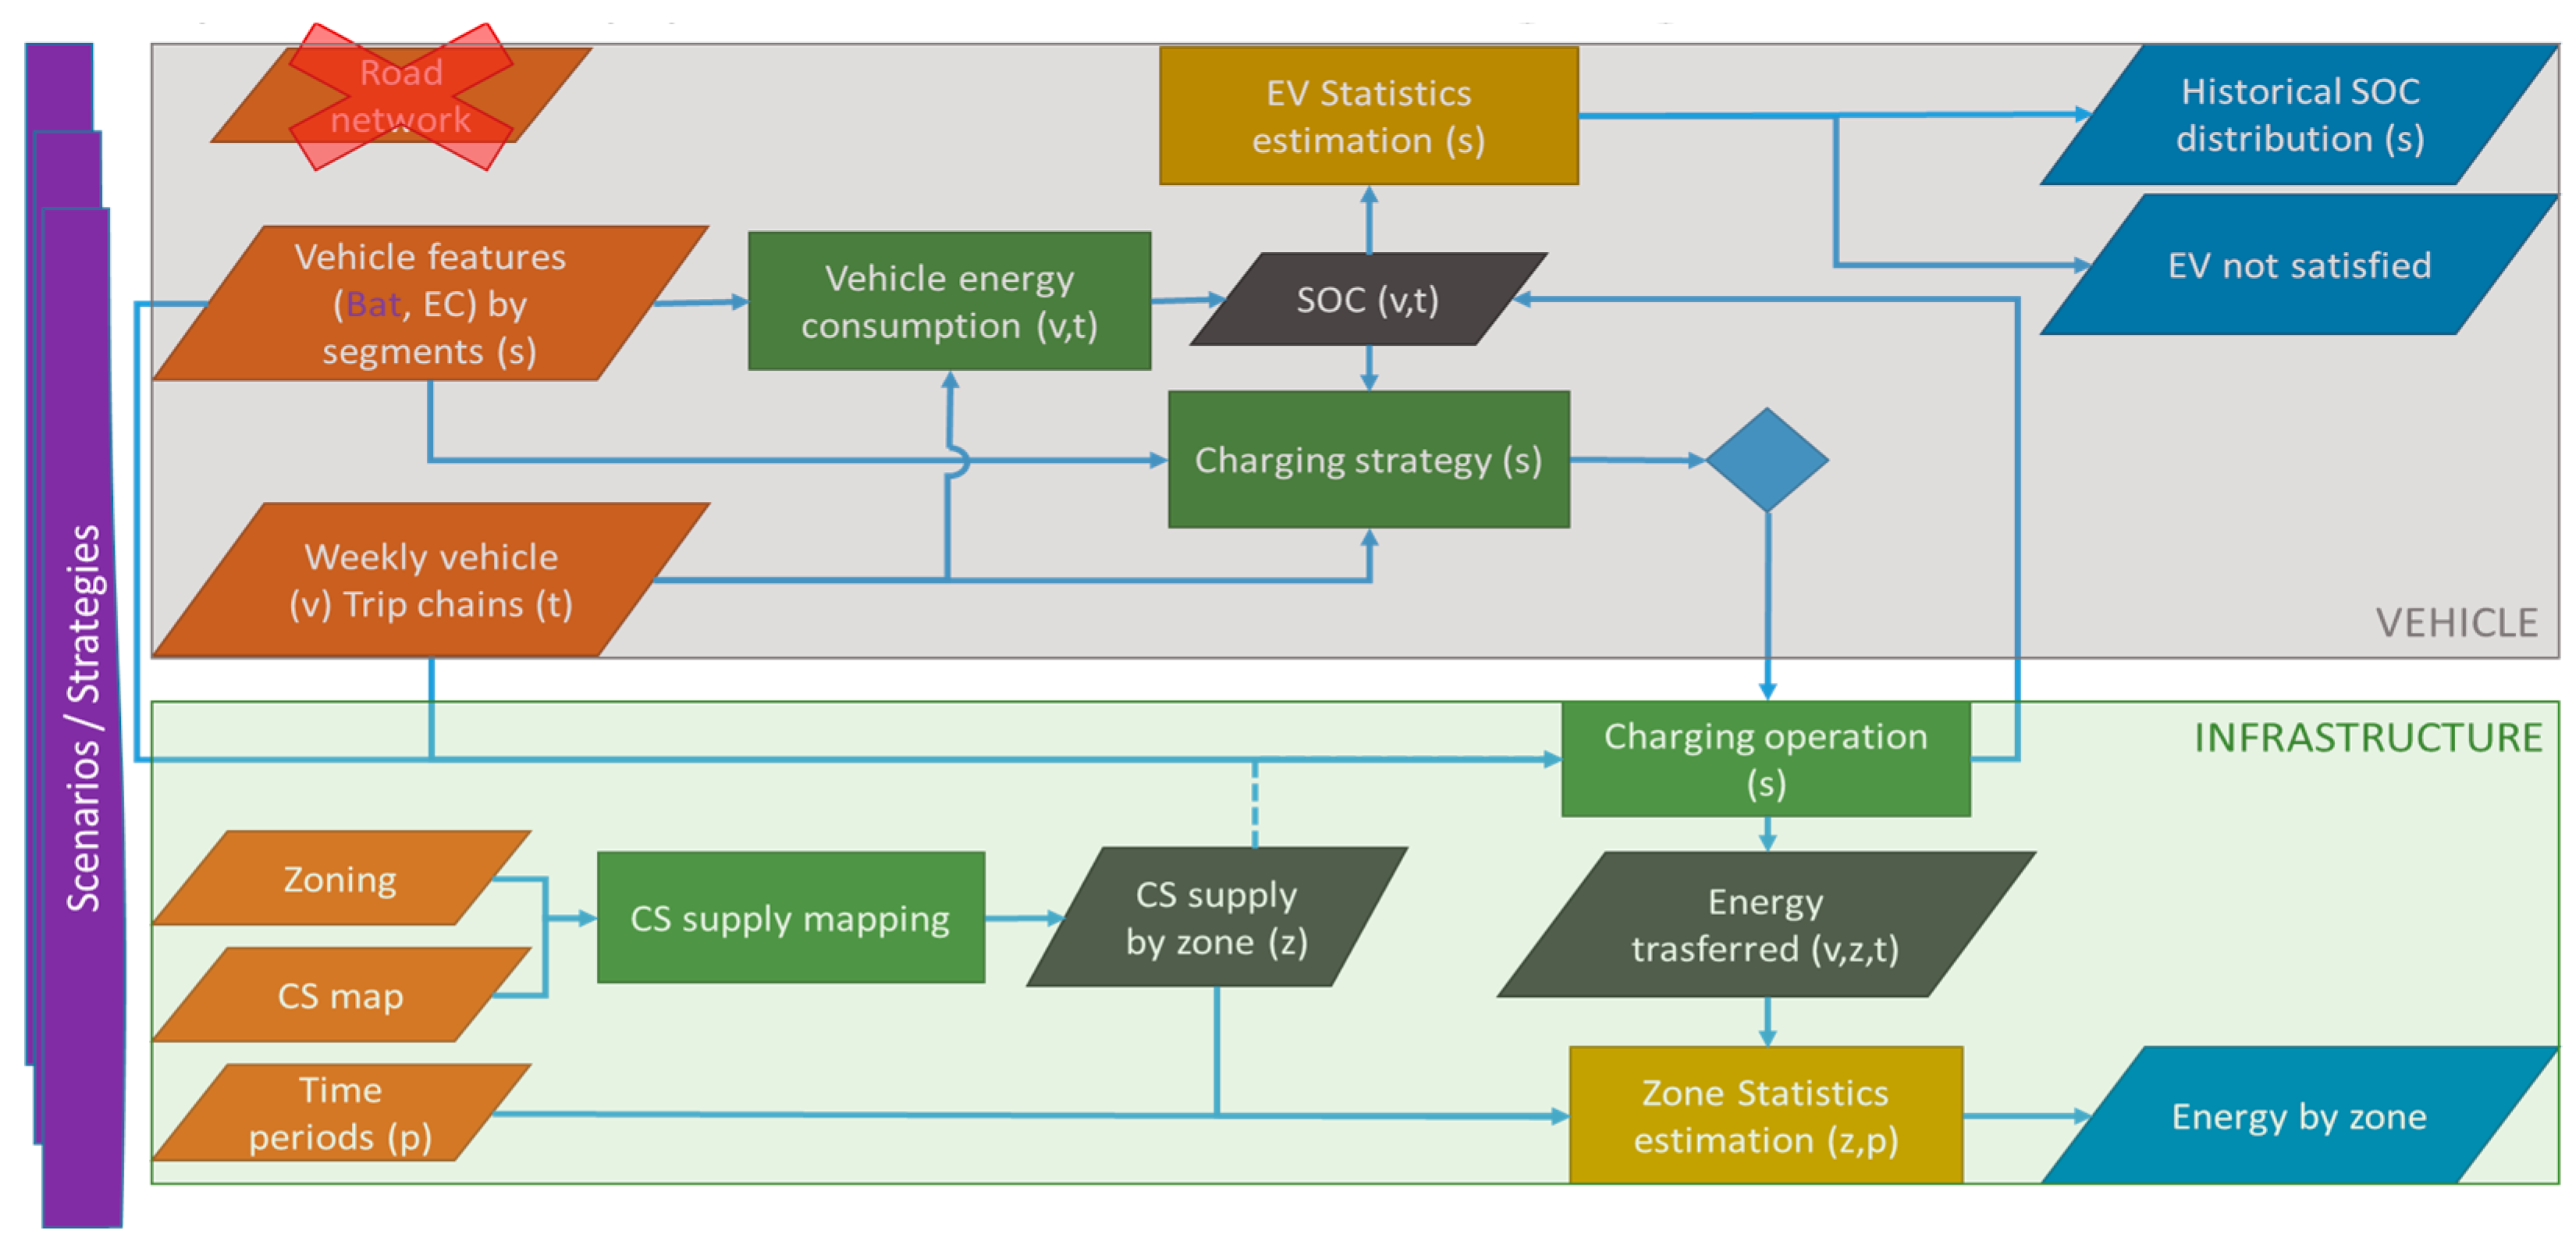
Figure 2 illustrates how the main procedures are connected, starting from the input data, as well as the output produced for both the vehicle set and the charging infrastructure.
Two layers were defined (vehicle and infrastructure) to organize the data and procedures. The input data for procedures of the “vehicle” layer included vehicle features, such as their battery capacity (Bat) and the parameters used to estimate energy consumption (EC), and trip chains for vehicles (v) describing their activities over time (t), as observed and recorded in the dataset. In this case, the demand was assumed to be fixed, and no information on the network was required, since the trips were directly observed via FCD. The procedure for vehicle consumption has the function of estimating the SoC for each vehicle (v) at the time (t) each leg of the trip is concluded.
Considering the “infrastructure” layer, the charging operations were simulated according to a defined strategy (s) to adjust the estimation of the
SoC for each vehicle and quantify the energy required by each zone. Indeed, the mapping of charging stations (CSs) requires a zoning of the city, a map of CSs, and a period (p) in which to perform the analysis. The list of the main parameters used is reported in
Table 2.
2.4. Modeling Battery SoC Profile for Simulated EVs
Vehicles were simulated during a 6-day observation period in a Python 3.7 IDE (integrated development environment). The battery’s state of charge (
SoC) was monitored for each vehicle trip by trip, and it could also increase after a trip if a recharge operation was included. In general, given the distance covered during the trip and the consumption rate (expressed as a function of the average speed), the energy required [kWh] for each trip was computed. More specifically, trips performed by the same vehicle were collected to trace the history of the
SoC of that vehicle as if it was an EV, as follows:
where
and
are the
SoC after and before the
ith trip of the
jth vehicle, respectively,
is the energy consumption of the ith trip, and
is the battery capacity of the
jth vehicle. In case of a recharge operation between two trips, the
SoC before or after the
ith trip will of course be higher. The amount of battery charged was computed as shown in Equation (4), where
is the power of the kth charging station, while
is the time available for the operation. The time required for a full charge is calculated as shown in Equation (3), but it may fail to fully recharge the vehicle if the available idle time is not enough. In that case, the charge time is determined by the time available instead of the time necessary for the full recharge.
depends upon the vehicle category, as reported in
Table 2, and two different hypotheses were used in the simulations.
In general, in electric vehicle batteries, the charging process can also be non-linear, and many factors can affect the charging curve (the type of battery, the vehicle, its condition, temperature, voltage, etc.). However, in our model, we focused on the charging operations as activities to be inserted in an extended trip chain over approximately one week for a large sample of classified vehicles. For this reason, considering the simulation’s timescale, an approximate linear charging curve was adopted, excluding more accurate models that could potentially improve the charging time estimate or the SoC increase, which may be more suitable for a short timescale. Nevertheless, it should be noted that randomness was incorporated into the model for the initial SoC generations, which can partially account for factors that are not explicitly stated, such as the effects of non-linear charging curves and variable environmental conditions.
Considering the current wide range of BEVs equipped with different options of battery capacity, we synthesized this information into a limited number of capacity values, which were assumed to be constants for each vehicle included in the same car segment. The values (
Table 3) were set in a standard scenario (BattStd), based on electric vehicles currently on the market, but also exploring the evolution expected in battery technology towards higher capacity values (BattEvo). Although this approach may not be adequate to represent the features of specific car models, it provides the opportunity to compare results in clearly defined conditions, which can also be assumed as a reference for similar cars.
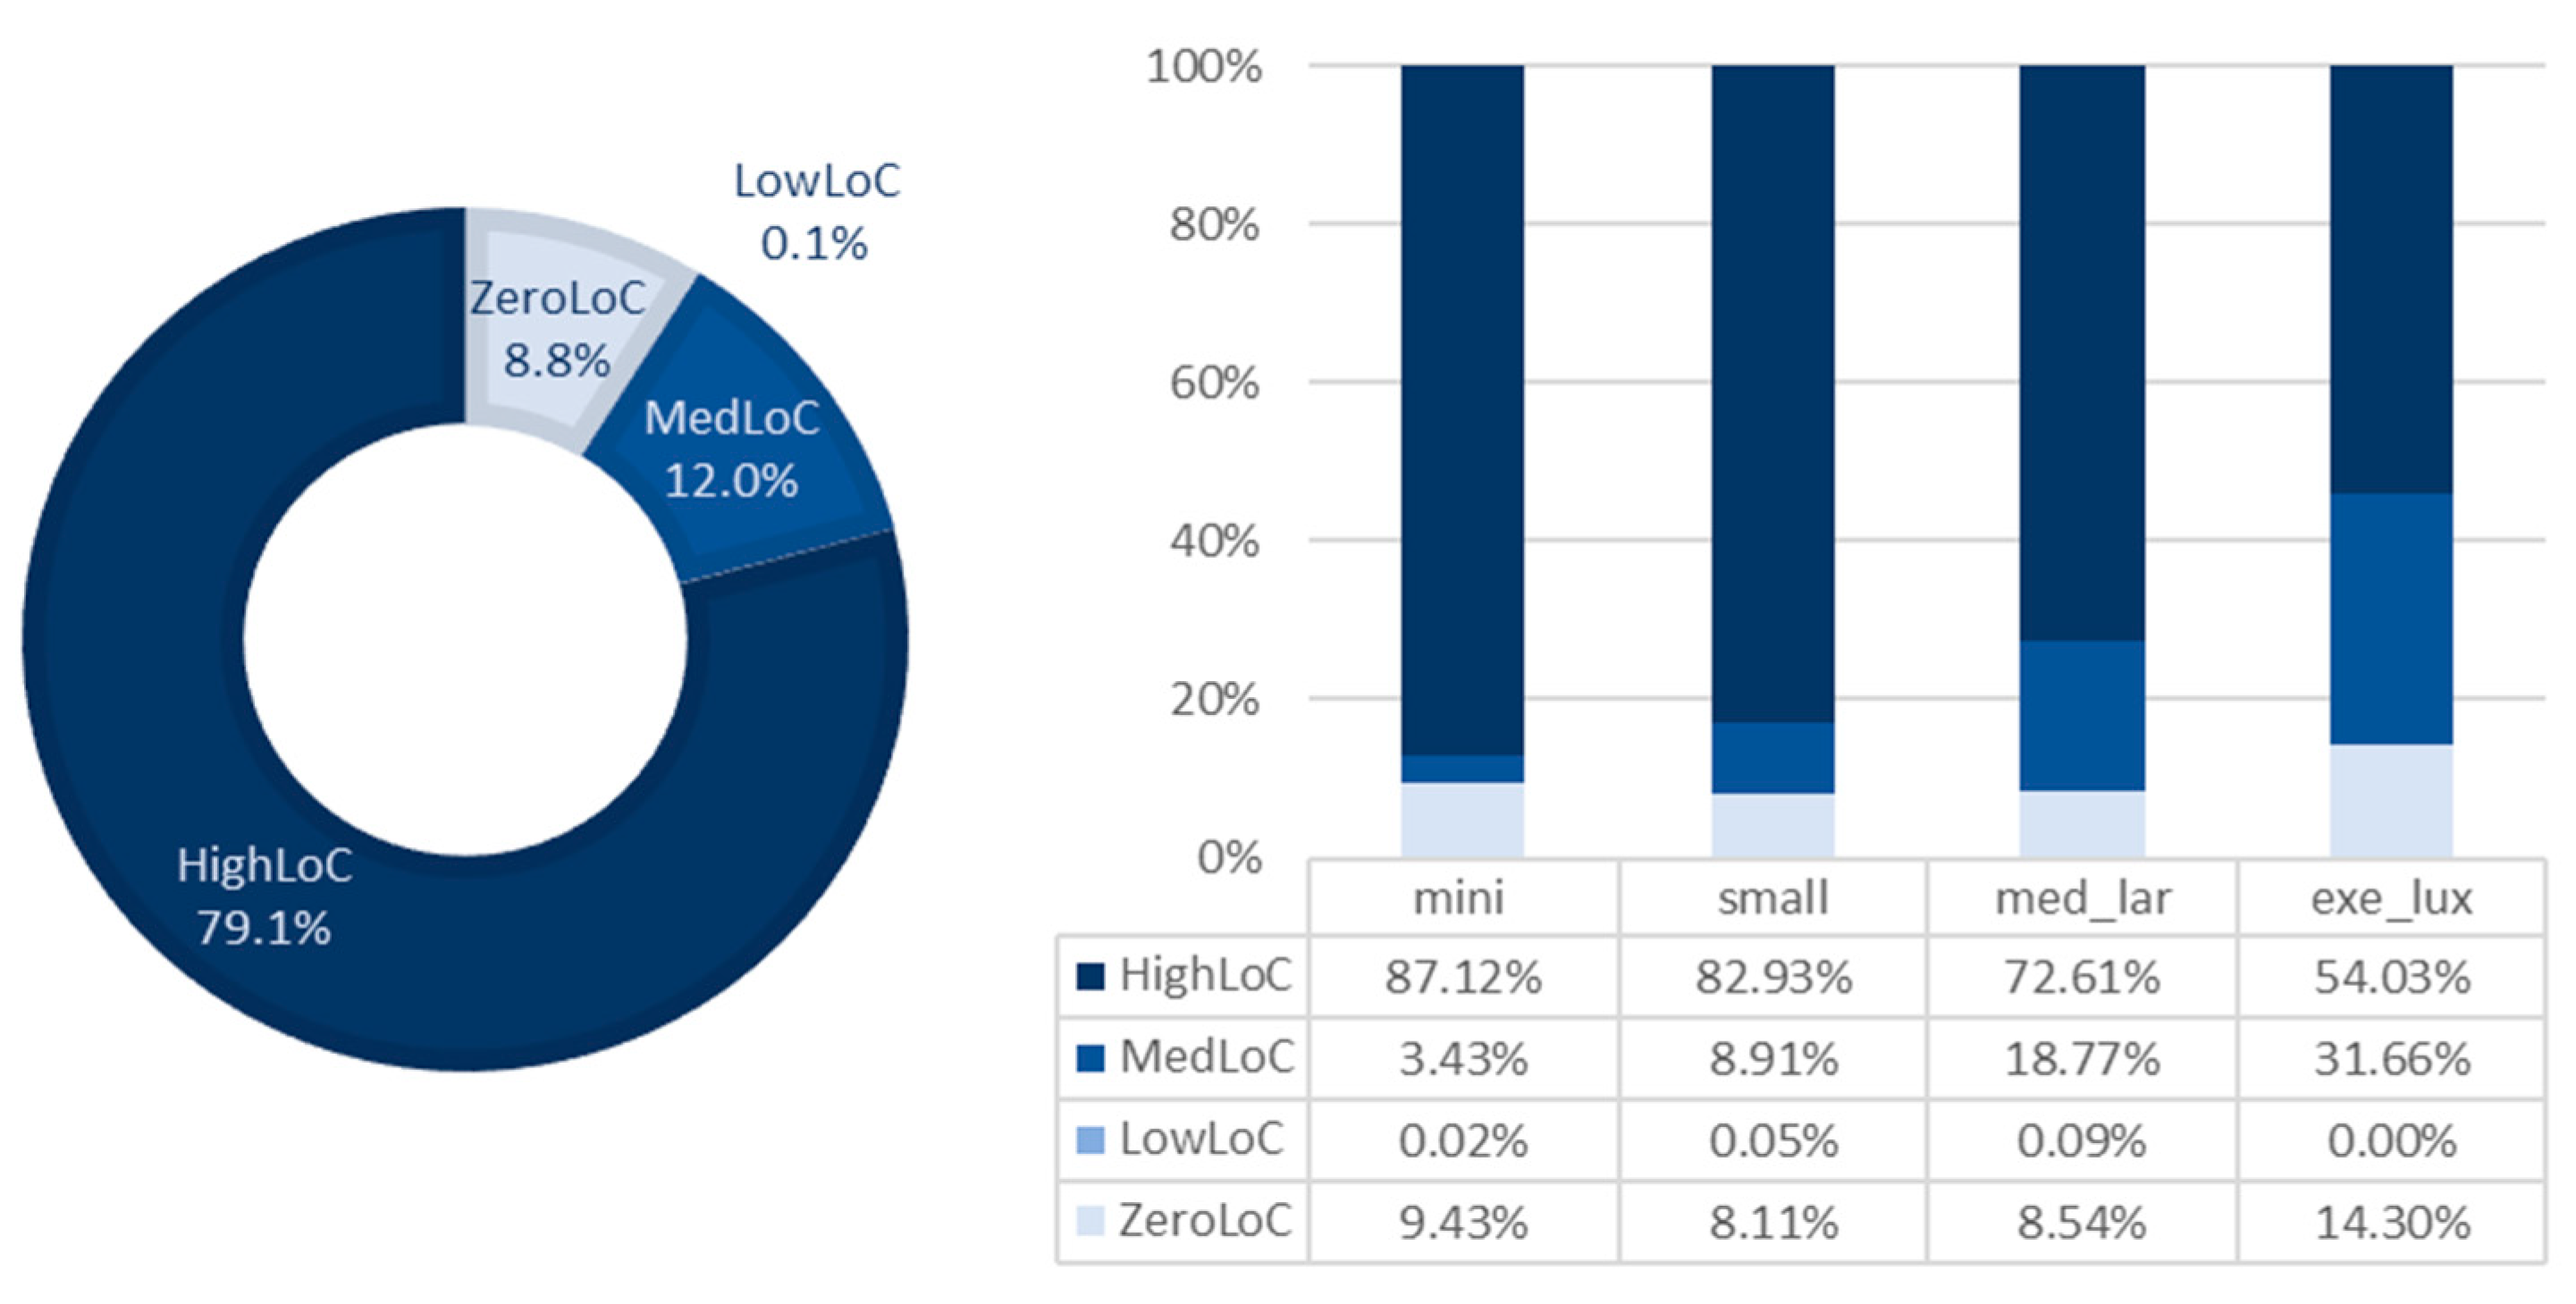
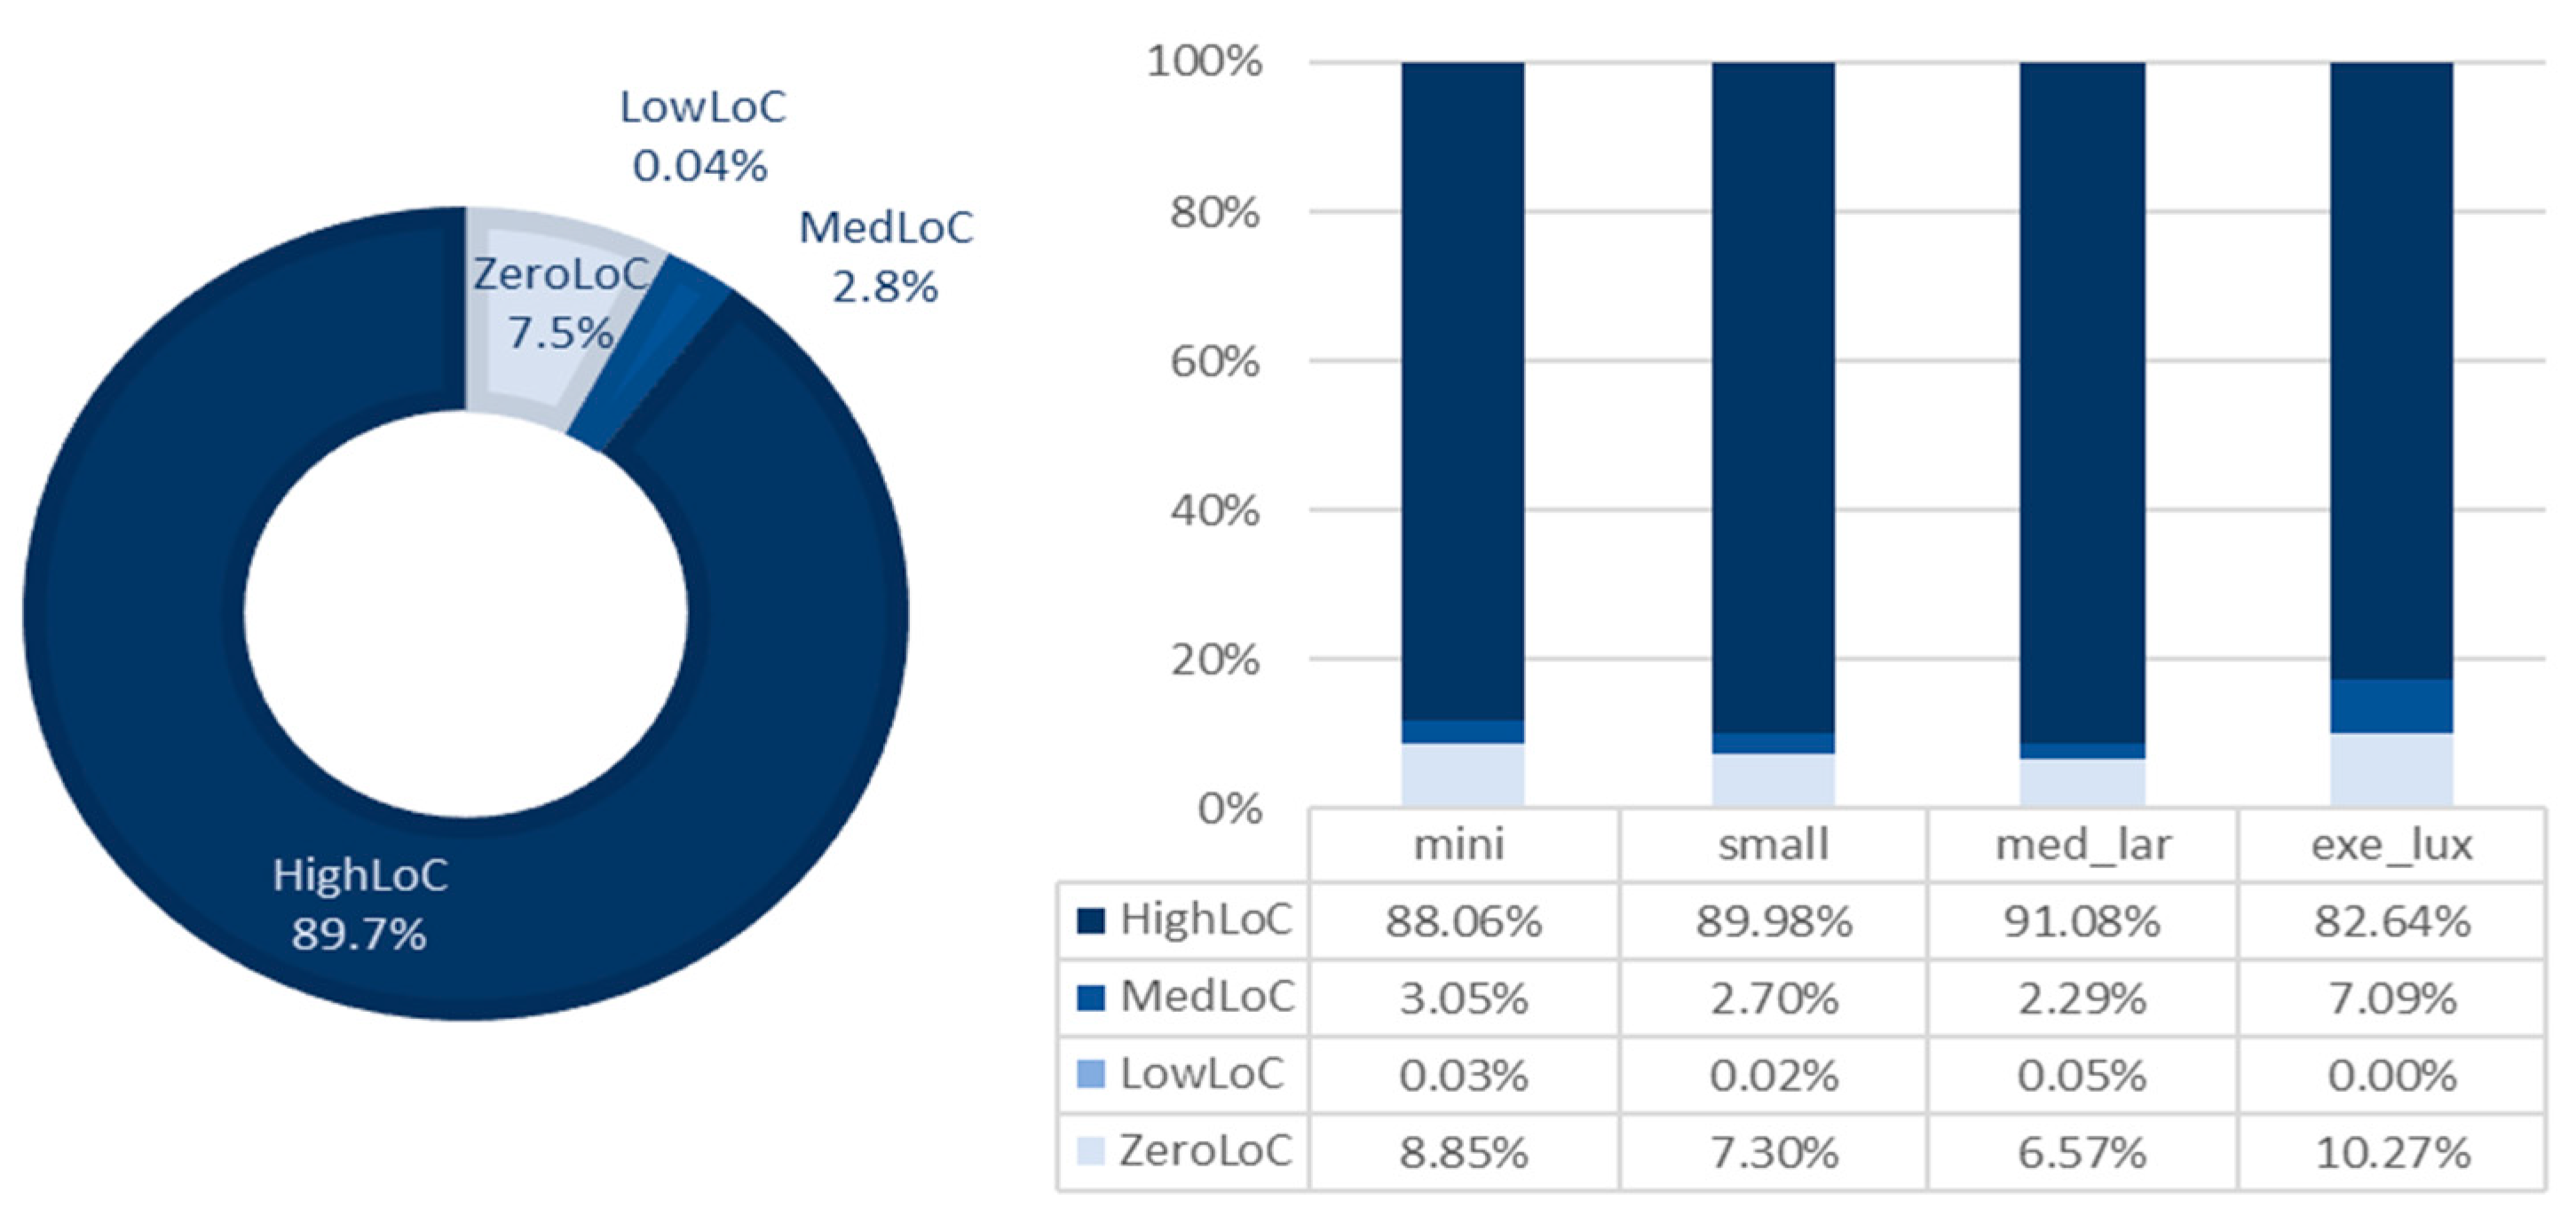
At the end of each trip, the vehicles were classified according to their remaining SoC (ZeroLoC if <1%, LowLoC if in the range [1%, 20%], MedLoC if in the range [20%, 50%], HighLoC if >50%), since this information is linked to the eventual need for recharging. Different scenarios were simulated according to the SoC before the first trip in the simulated period for each battery capacity value. Two options were considered, assuming an initial SoC equal to 100% or a random value extracted from a Gaussian distribution, with a mean value of 80% and a standard deviation of 15%.
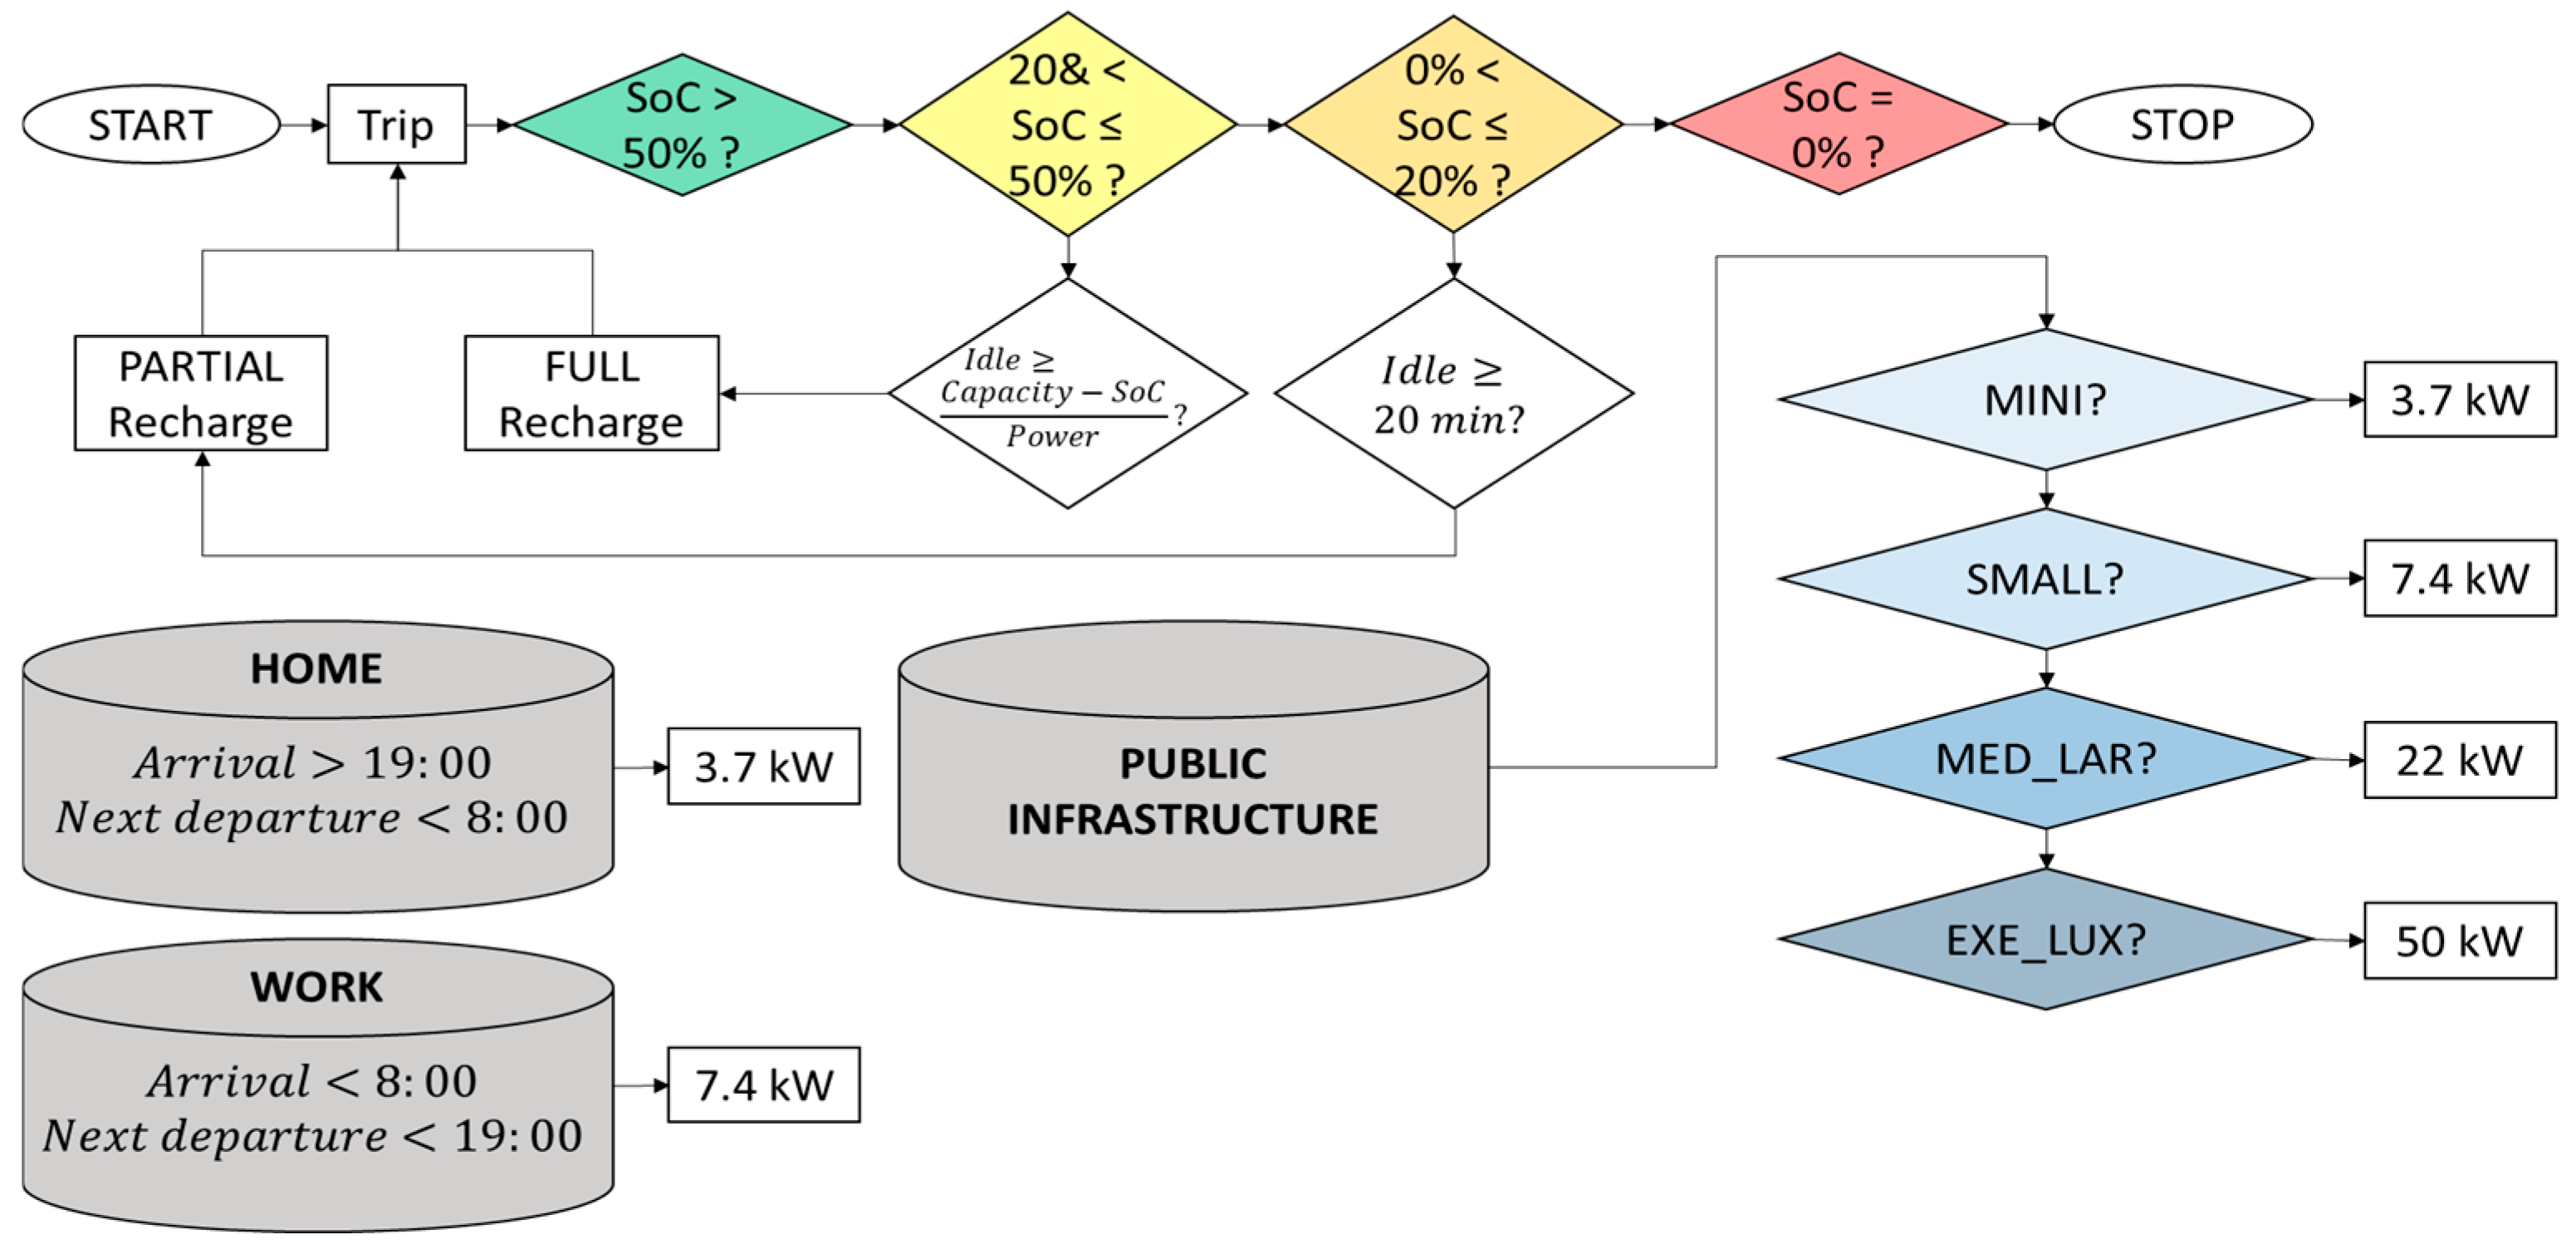
2.5. Charging Strategies
A relevant aspect to consider in order to effectively simulate the
SoC state of a set of vehicles in a study is the strategy adopted by the users for planning and incorporating their charging operations during the observation period. User recharge choice depends upon many factors: the energy power to be used may depend upon both the vehicle category and the available time, and range anxiety may also be affected by user preference. An interesting definition of charging choice is proposed in [
28]: “as the decision made by the driver, at a given charging opportunity, to charge their vehicle to a specific charge level, starting from a specific instant, and to be made available by a certain time”. An energy provider might manage battery charging operations all over the network when the idle time is higher than the time required for the desired recharge. As assumed in [
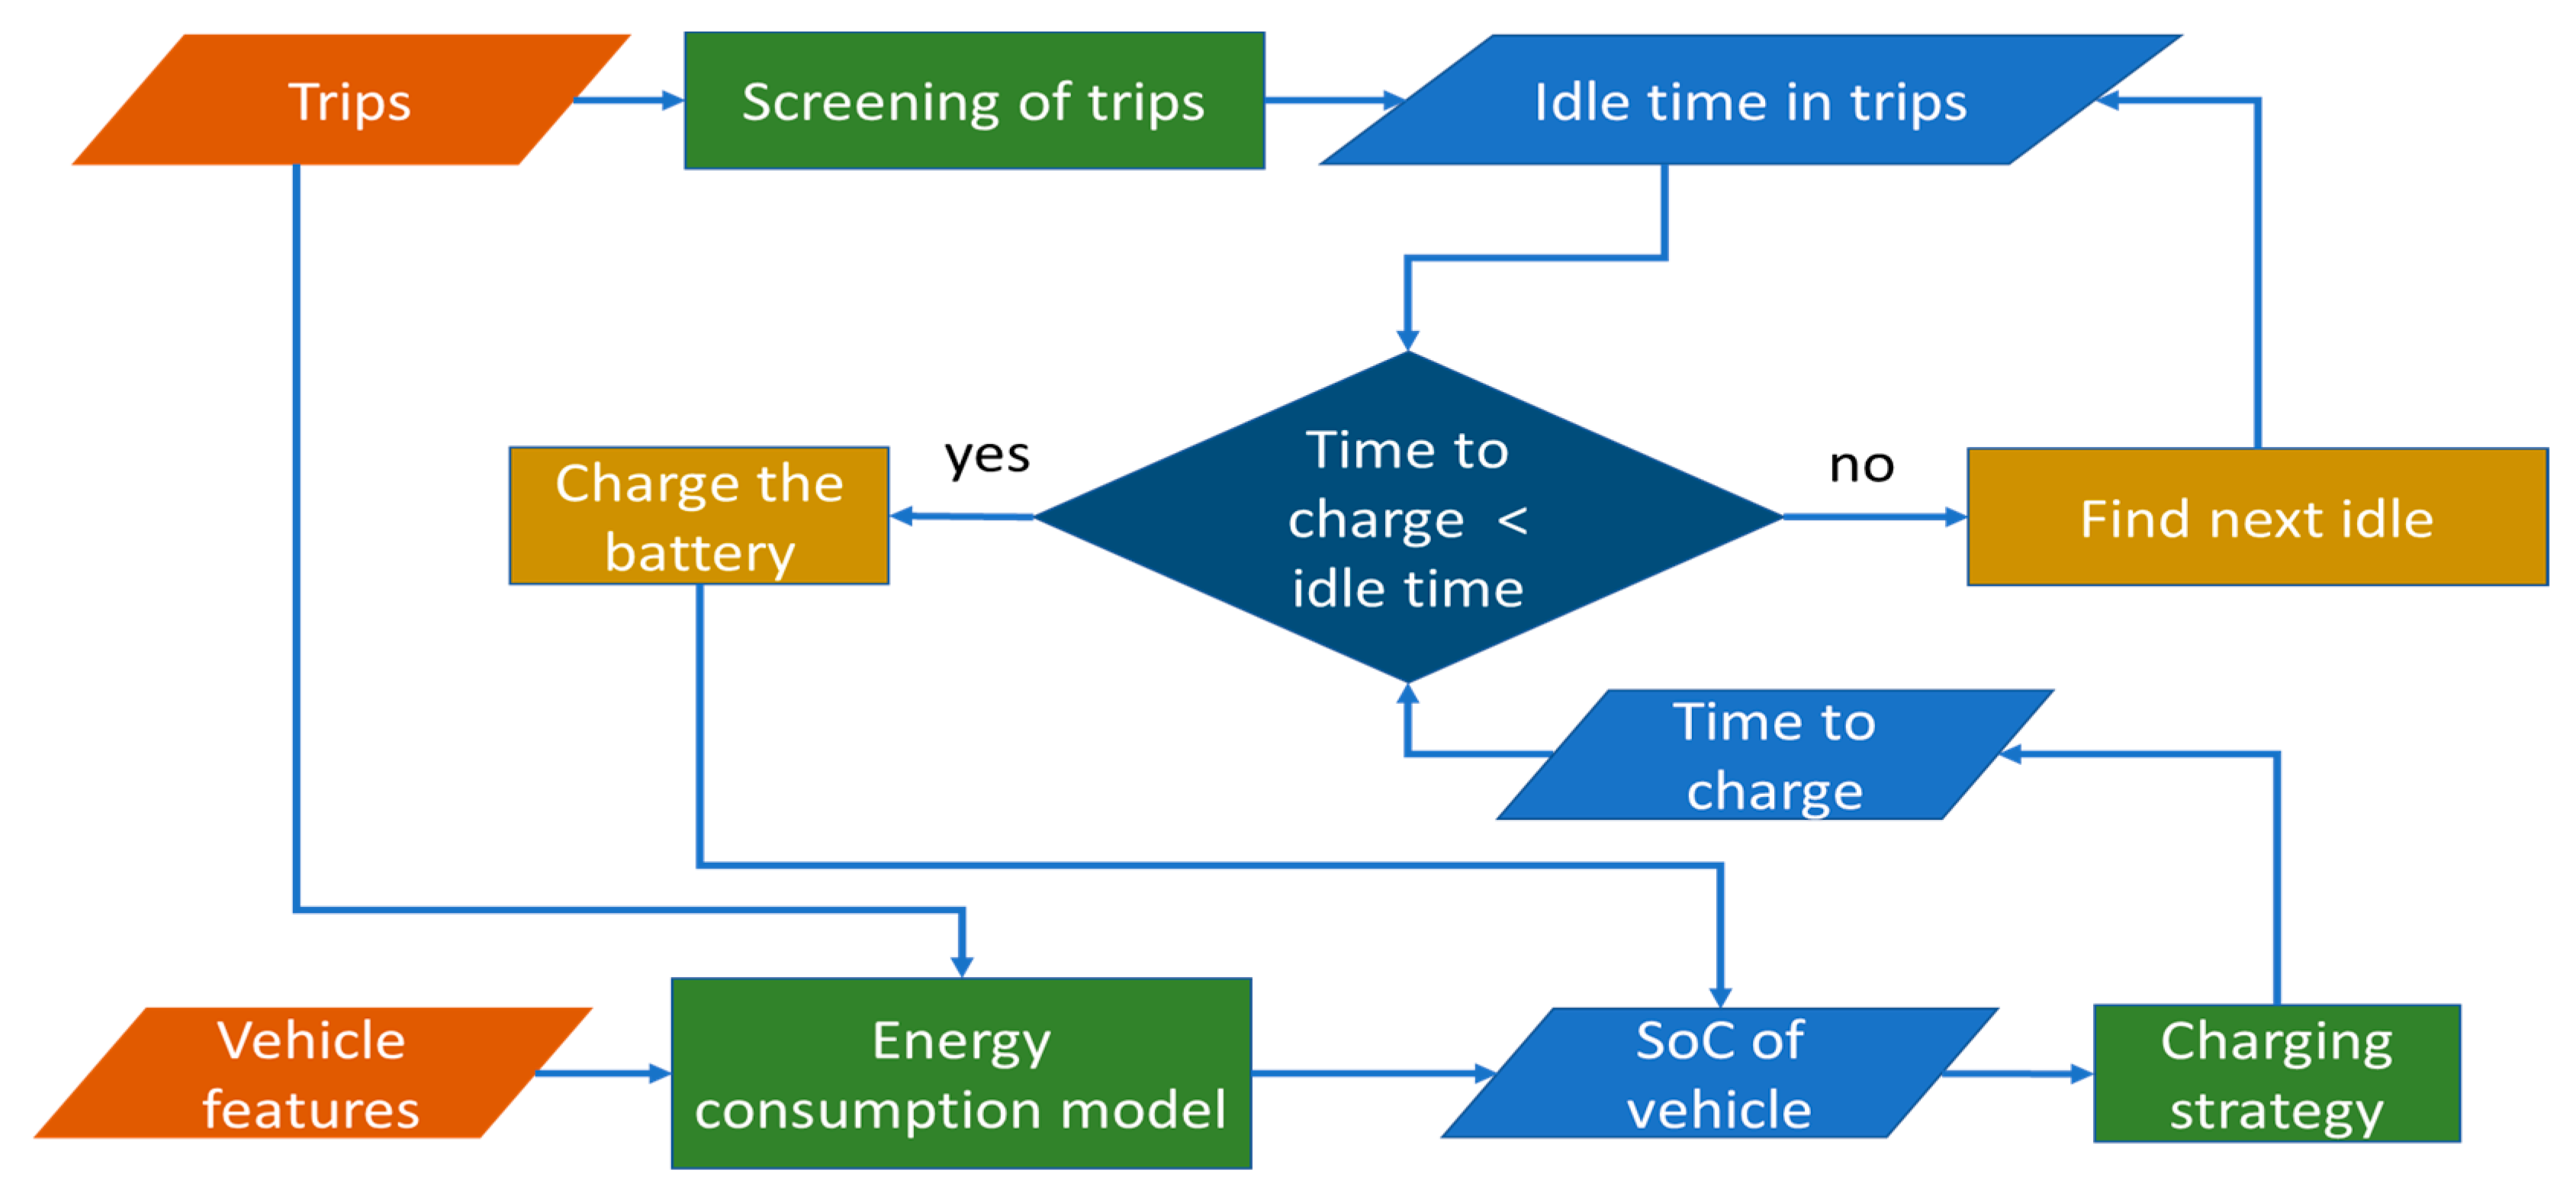
28], the arrival time can approximate the beginning of charging operations. Moreover, according to the observed time of day and the duration of the idle time, it can be inferred whether the idle time takes place at home or work. Indeed, we assume that, for an idle time longer than 24 h (or 7 h if the arrival time is after 7 p.m., or if the departure is before 8 a.m.), the parking is classified as “Home”, whereas for an idle time greater than 3 h and less than 10 h in the range 7 a.m.–8 p.m., the idle event is classified as “Work”. Although these rules cannot detect all situations, they can identify typical habits for the observed city, according to the data available for vehicles. In
Figure 3, the main blocks of the charging strategies modeled in the simulation are connected in a flowchart.
Each strategy is a combination of different elements, such as the place and time available to charge, the time of day, the
SoC to identify potential urgent charging needs, and electric power for charging. Considering the high number of combinations to examine all of the possible cases, only typical values were selected to build reasonable strategies (
Table 4), which were assumed for all of the users and can be considered reference cases to be used to compare results in well-defined conditions. A similar selection approach can be found in [
29] to define three typical strategies for the simulation of EV charging. On the other hand, real cases would require a detailed observation of different user charging behaviors, based on a data collection process by surveys, as well as the application of the observed strategies to different user categories. Although this is beyond the scope of this study, in the event that specific strategies are identified, they could be easily implemented, vehicle by vehicle, in the simulation model presented in this paper.
All of the conditions applied to the selected strategies are reported in
Table 5. A distinction is made between standard and emergency operations. In the latter case, the charging need is assumed to be urgent, and the threshold for deciding to recharge the vehicle is reduced.
Given a fixed power delivered by the ECS, the rate of recharge is supposed to be constant, according to the analysis level of this simulation. In general, the relationship between
SoC and time during the charging operation becomes less than linear for high
SoCs [
28,
30] and can be modeled if a detailed level of analysis is required. A more detailed description of the possible charging behaviors is reported in [
7], where the UBI (user–battery interface) and UBIS (UBI style) approach is presented: Actual user behavior depends not only upon the available time and the
SoC but also upon individual preferences, habits, and psychological dynamics. For instance, not all users charge their vehicle only when the
SoC goes below 50%, nor do they all charge their vehicle to 100%. An argument could be introduced about the charging power adopted, considering that some car models in medium segments are now chargeable with 50 kW or higher power. However, the energy price varies according to the maximum power (
Table 6); hence, the approximation of associating a typical charging power with a specific segment in the charging strategies is considered here.
In a real-life scenario, a low-segmented vehicle might also charge at high power, if compatible with the vehicle requirements, but it is assumed that this is not the typical behavior, according to the energy budget, which is assumed to be consistent with that for the EV purchase. On the other hand, even a high-segmented car may use a slow charging station, if preferred for specific reasons. Nevertheless, given the impossibility of considering all of the psychological aspects leading to the various combinations of charging choices, the segment–power joint combination was assumed for the charging strategies, as well as for the purpose of making our results transparent and the comparisons clear, thus being unaffected by these sources of variability.
4. Discussion and Conclusions
To understand whether observed car mobility demand can be satisfied by the battery ranges of typical electric vehicles (EVs), in this study, trip chains obtained from floating car data (FCD) collected from real-life vehicles were used to simulate the effects of different charging strategies. For this reason, the observed trip chains were assumed to be unaffected by the trend of switching to electric. The period of observation of the dataset covered six consecutive days in the Turin Metropolitan Area, where 608,866 trips were carried out by 24,758 vehicles, classified according to their market segment. A consumption rate was defined for different vehicle categories as a function of the trip’s average speed. This is useful for modeling, showing that, for very slow trips, consumption is the highest, while the minimum rate is observed for speed values between 40 and 60 km/h. The energy consumption for each trip was estimated by multiplying the specific rate of the vehicle category by the traveled distance. In the simulation model, vehicle segmentation was introduced not only to better estimate energy consumption but also to consider that mobility patterns may differ according to the vehicle category and that different powers are available for charging operations. Indeed, high-segmented vehicles usually use larger batteries and can be recharged at higher power (e.g., 50 kW or more). Idle periods that are likely to take place at home or work were specifically detected, and the typical charging power was assigned to those recharges, since the power levels available at home and work are approx. 3 and 7 kW, respectively. Meanwhile, higher power can be found at public charging points.
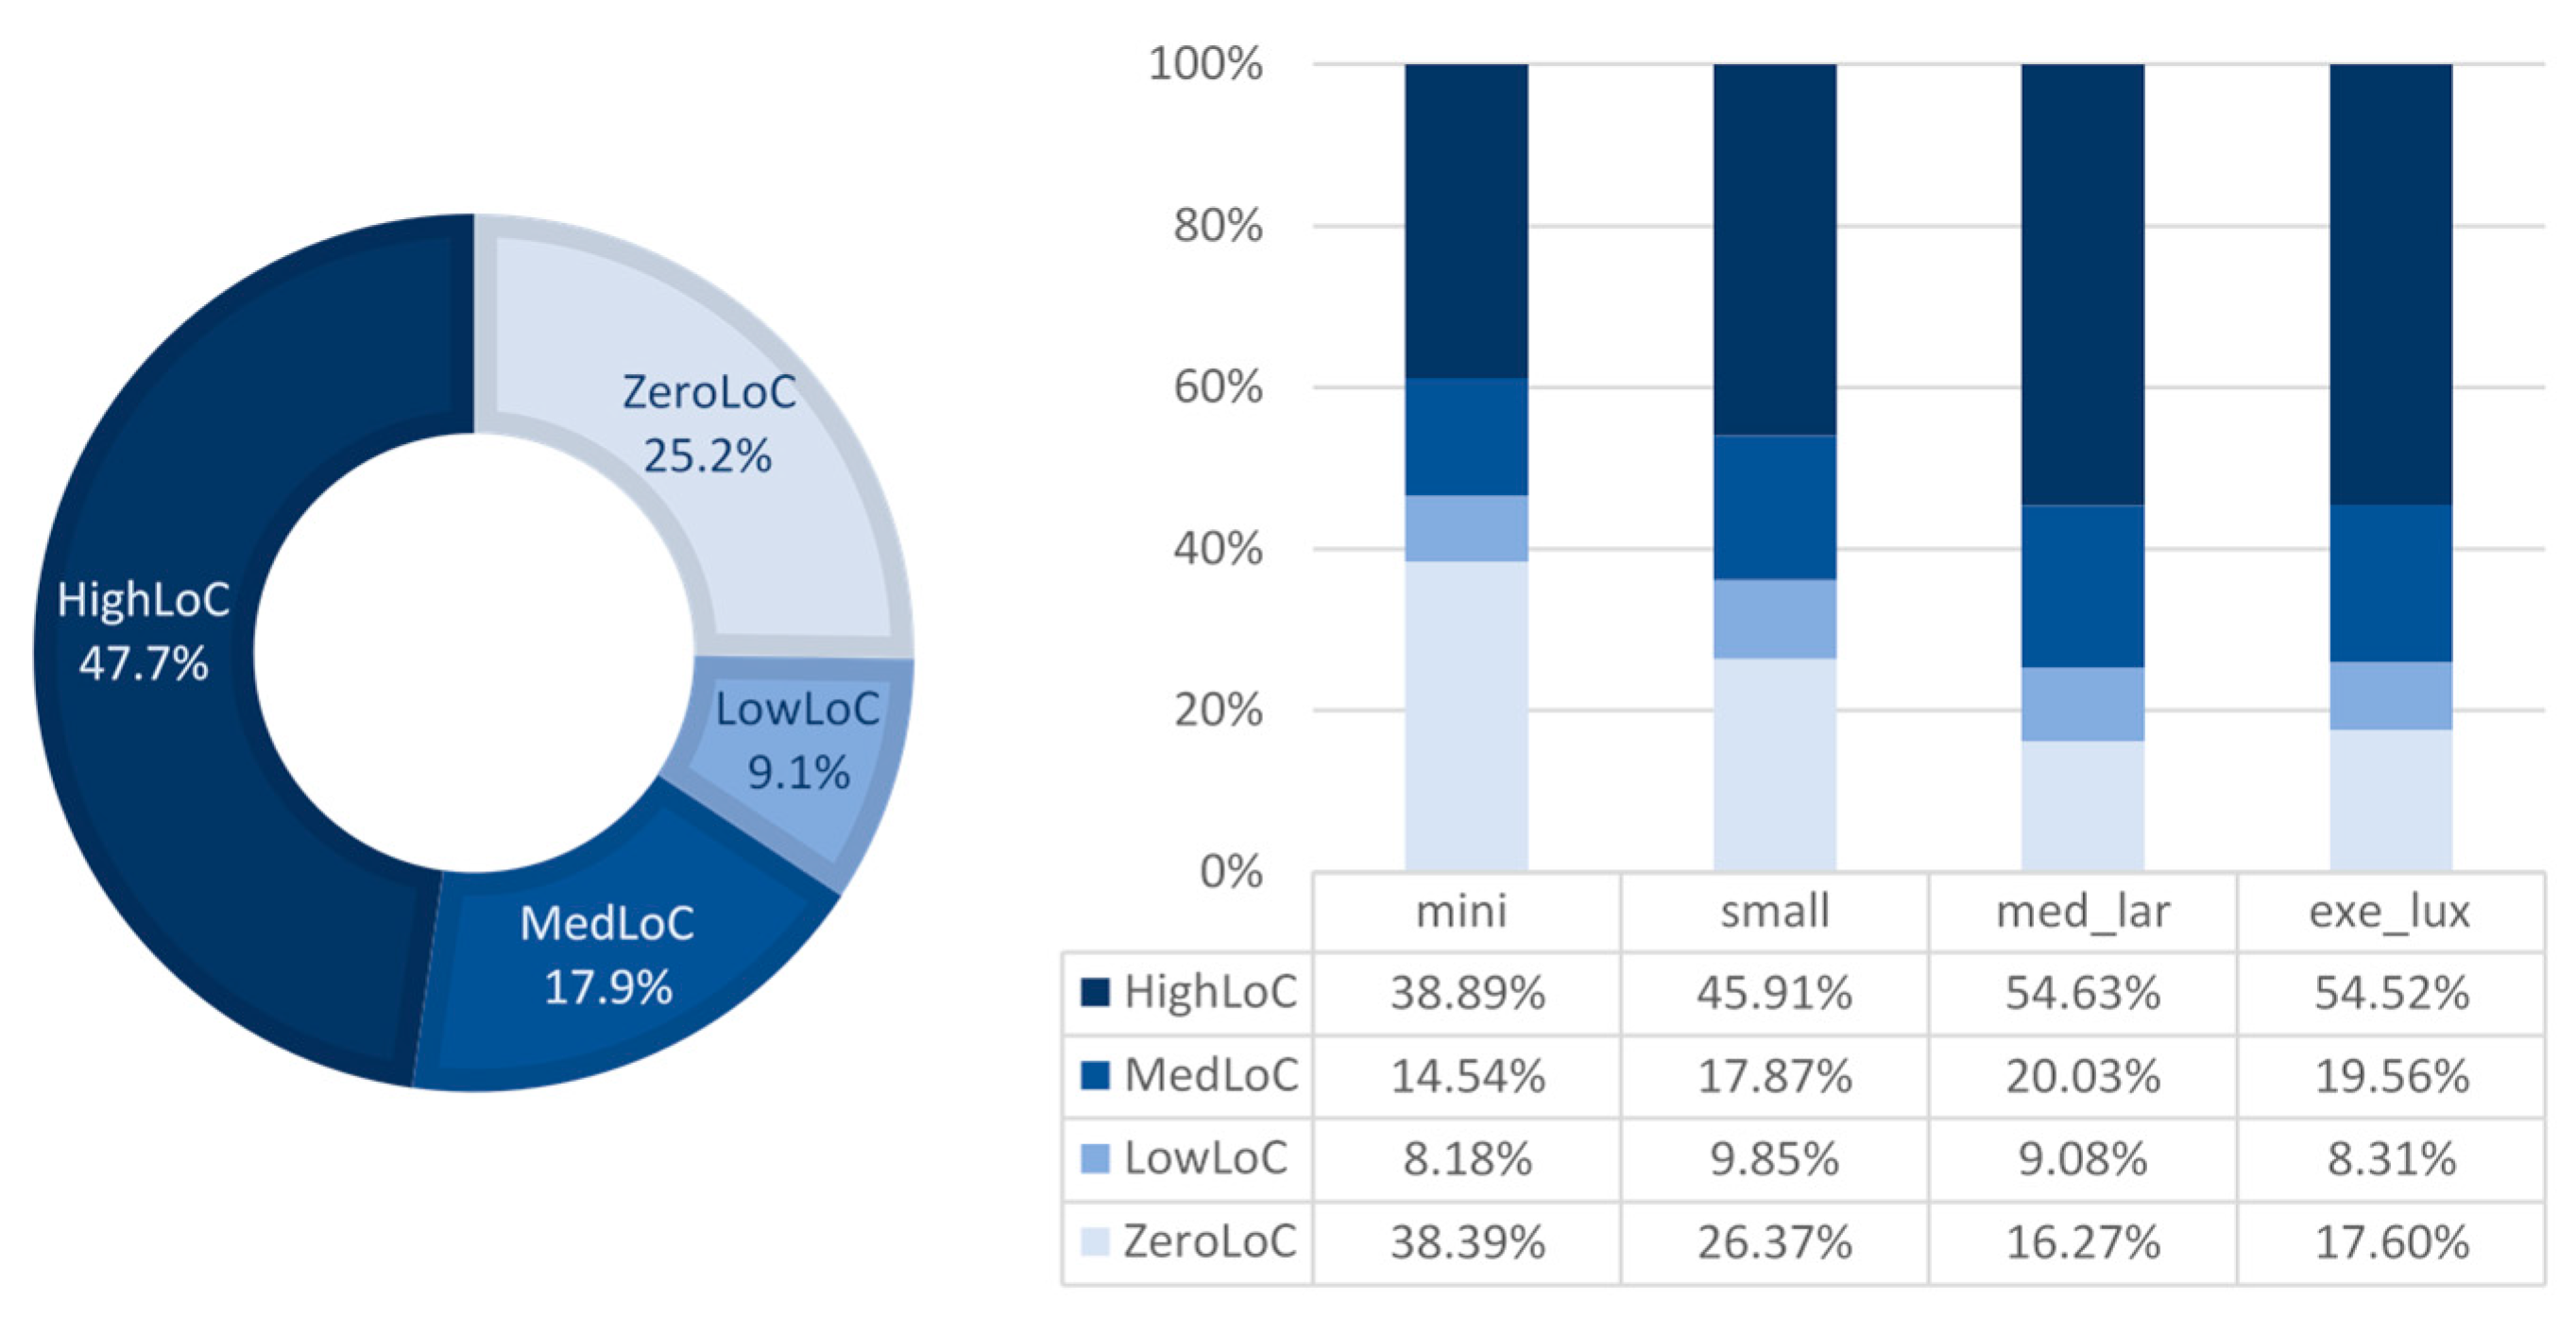
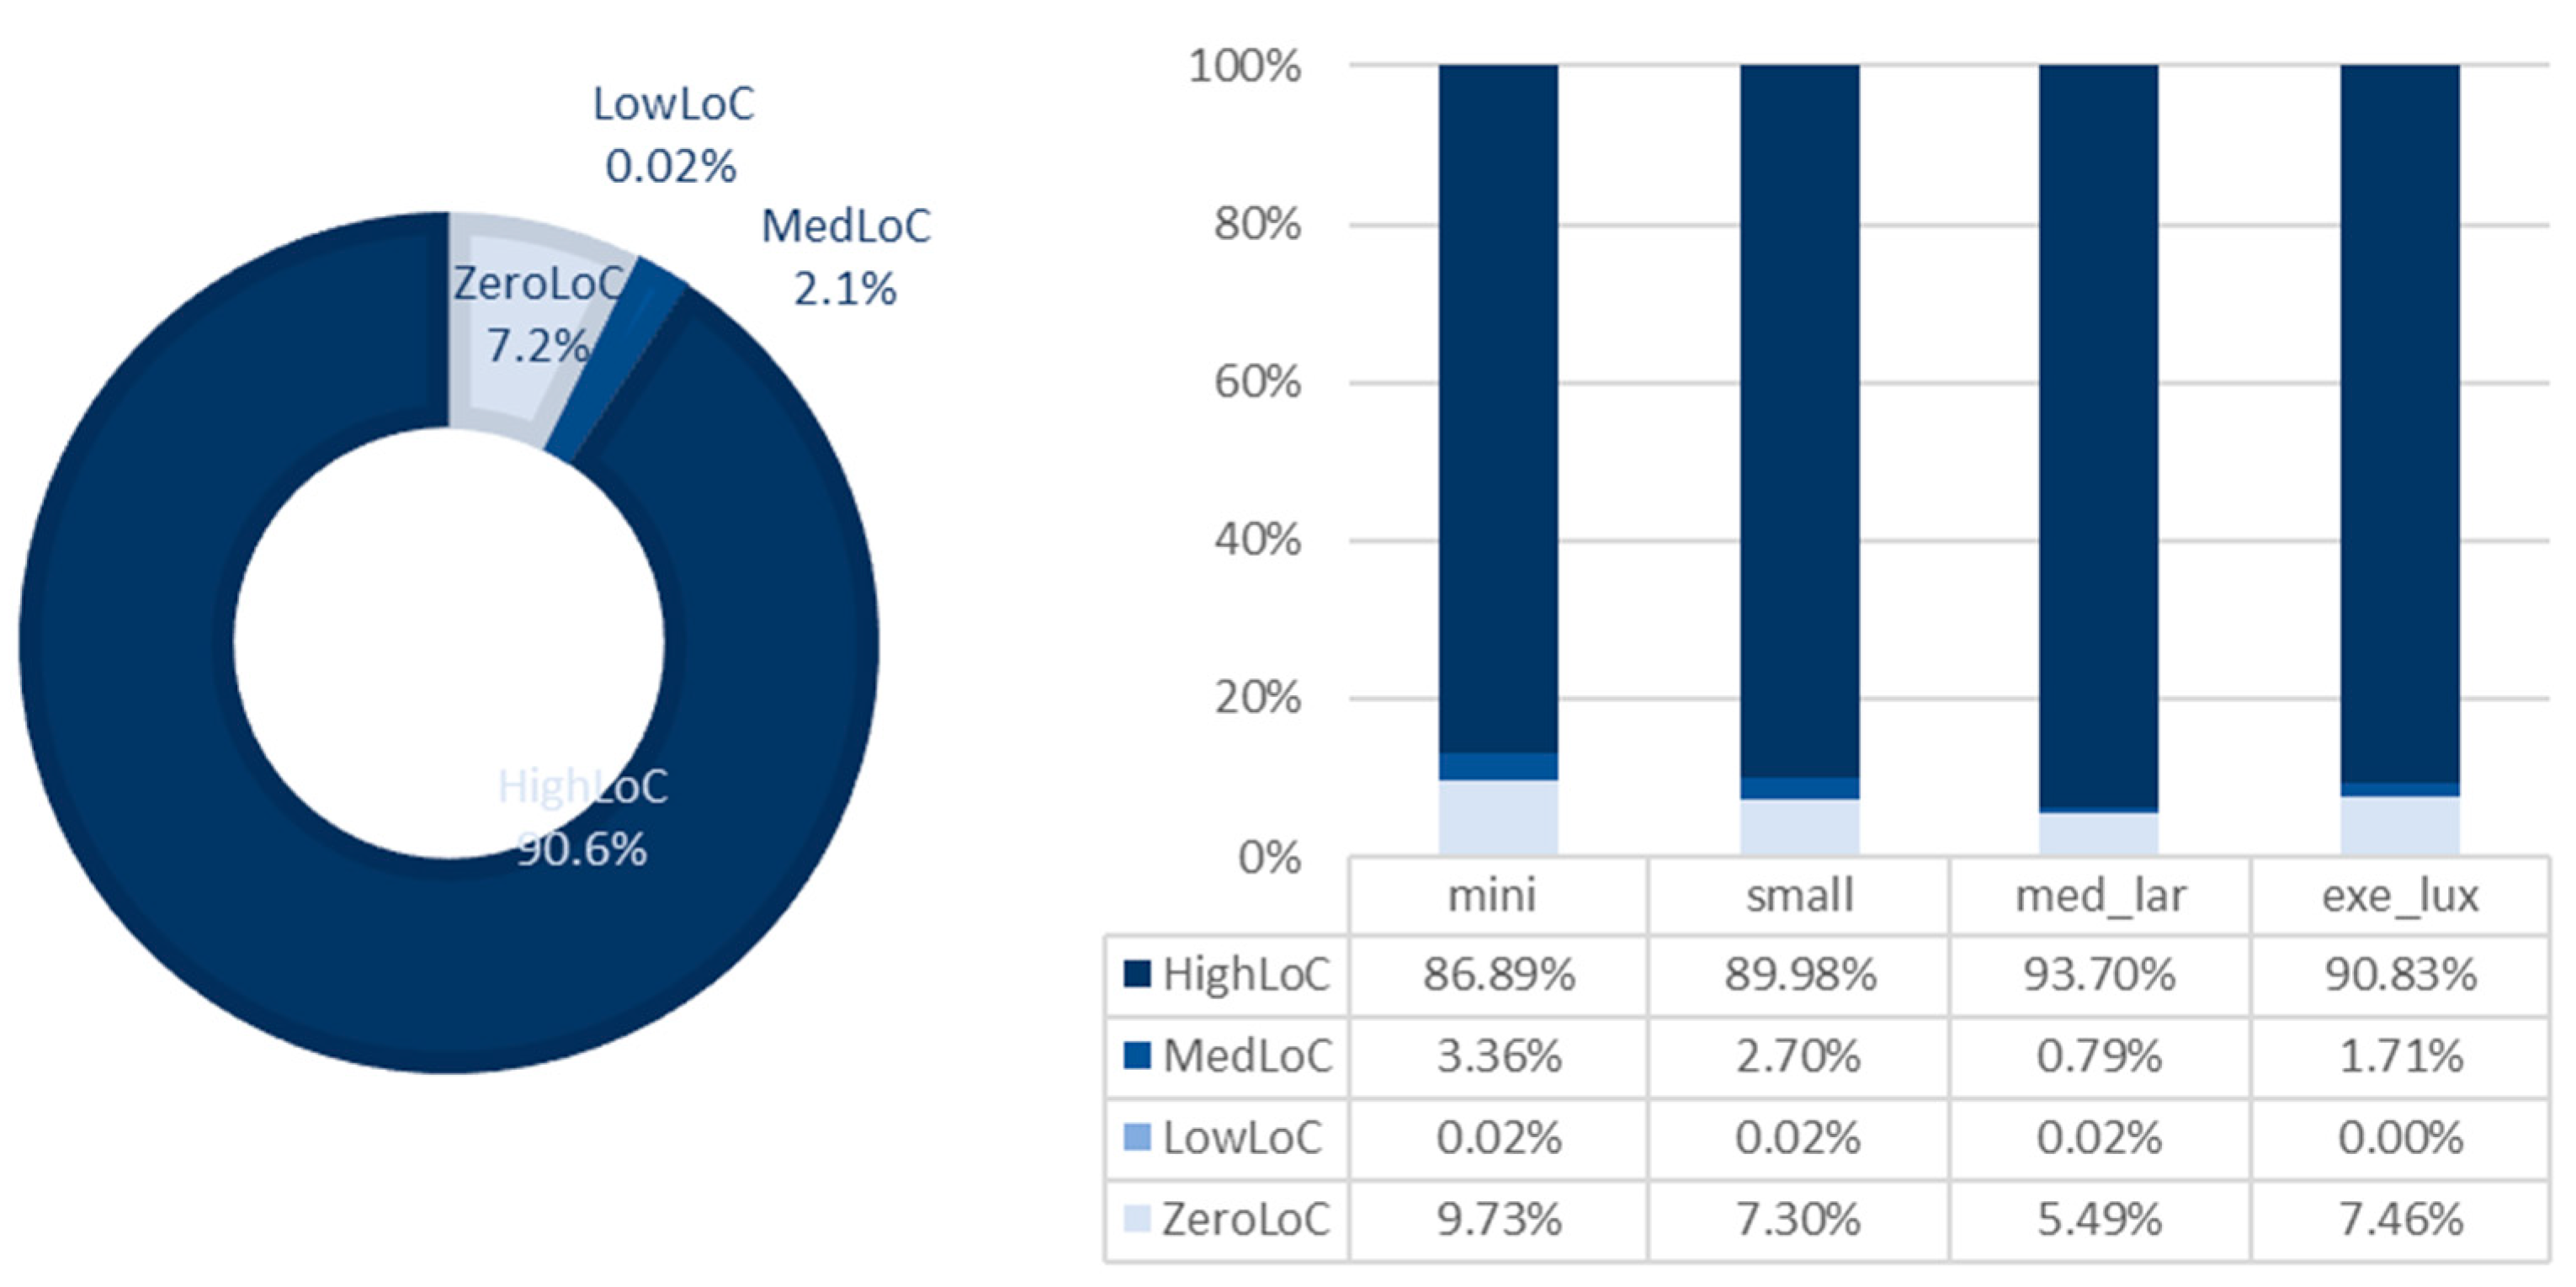
A first screening was run to estimate how many vehicles would be unable to finish the simulation period without any charging operations. Considering different combinations of initial battery state of charge (SoC) and size, the percentage of vehicles reaching an SoC equal to 0% during the period varied between 15% and 39%, and these bounds increased to 24% and 62% if vehicles with SoC lower than 20% at the end of the simulation period were also considered. Charging operations were then simulated according to several conditions, which were related to the idle time, the SoC, and the time of arrival and departure. Simulation experiments were carried out and, considering the lowest battery sizes set (among the two proposed) and a uniform initial SoC (100%), the percentage with low SoC observed at the end of the simulation was lower than 10% in three out of four cases. In one case, where only home/work charging was considered, this percentage increased to 34%.
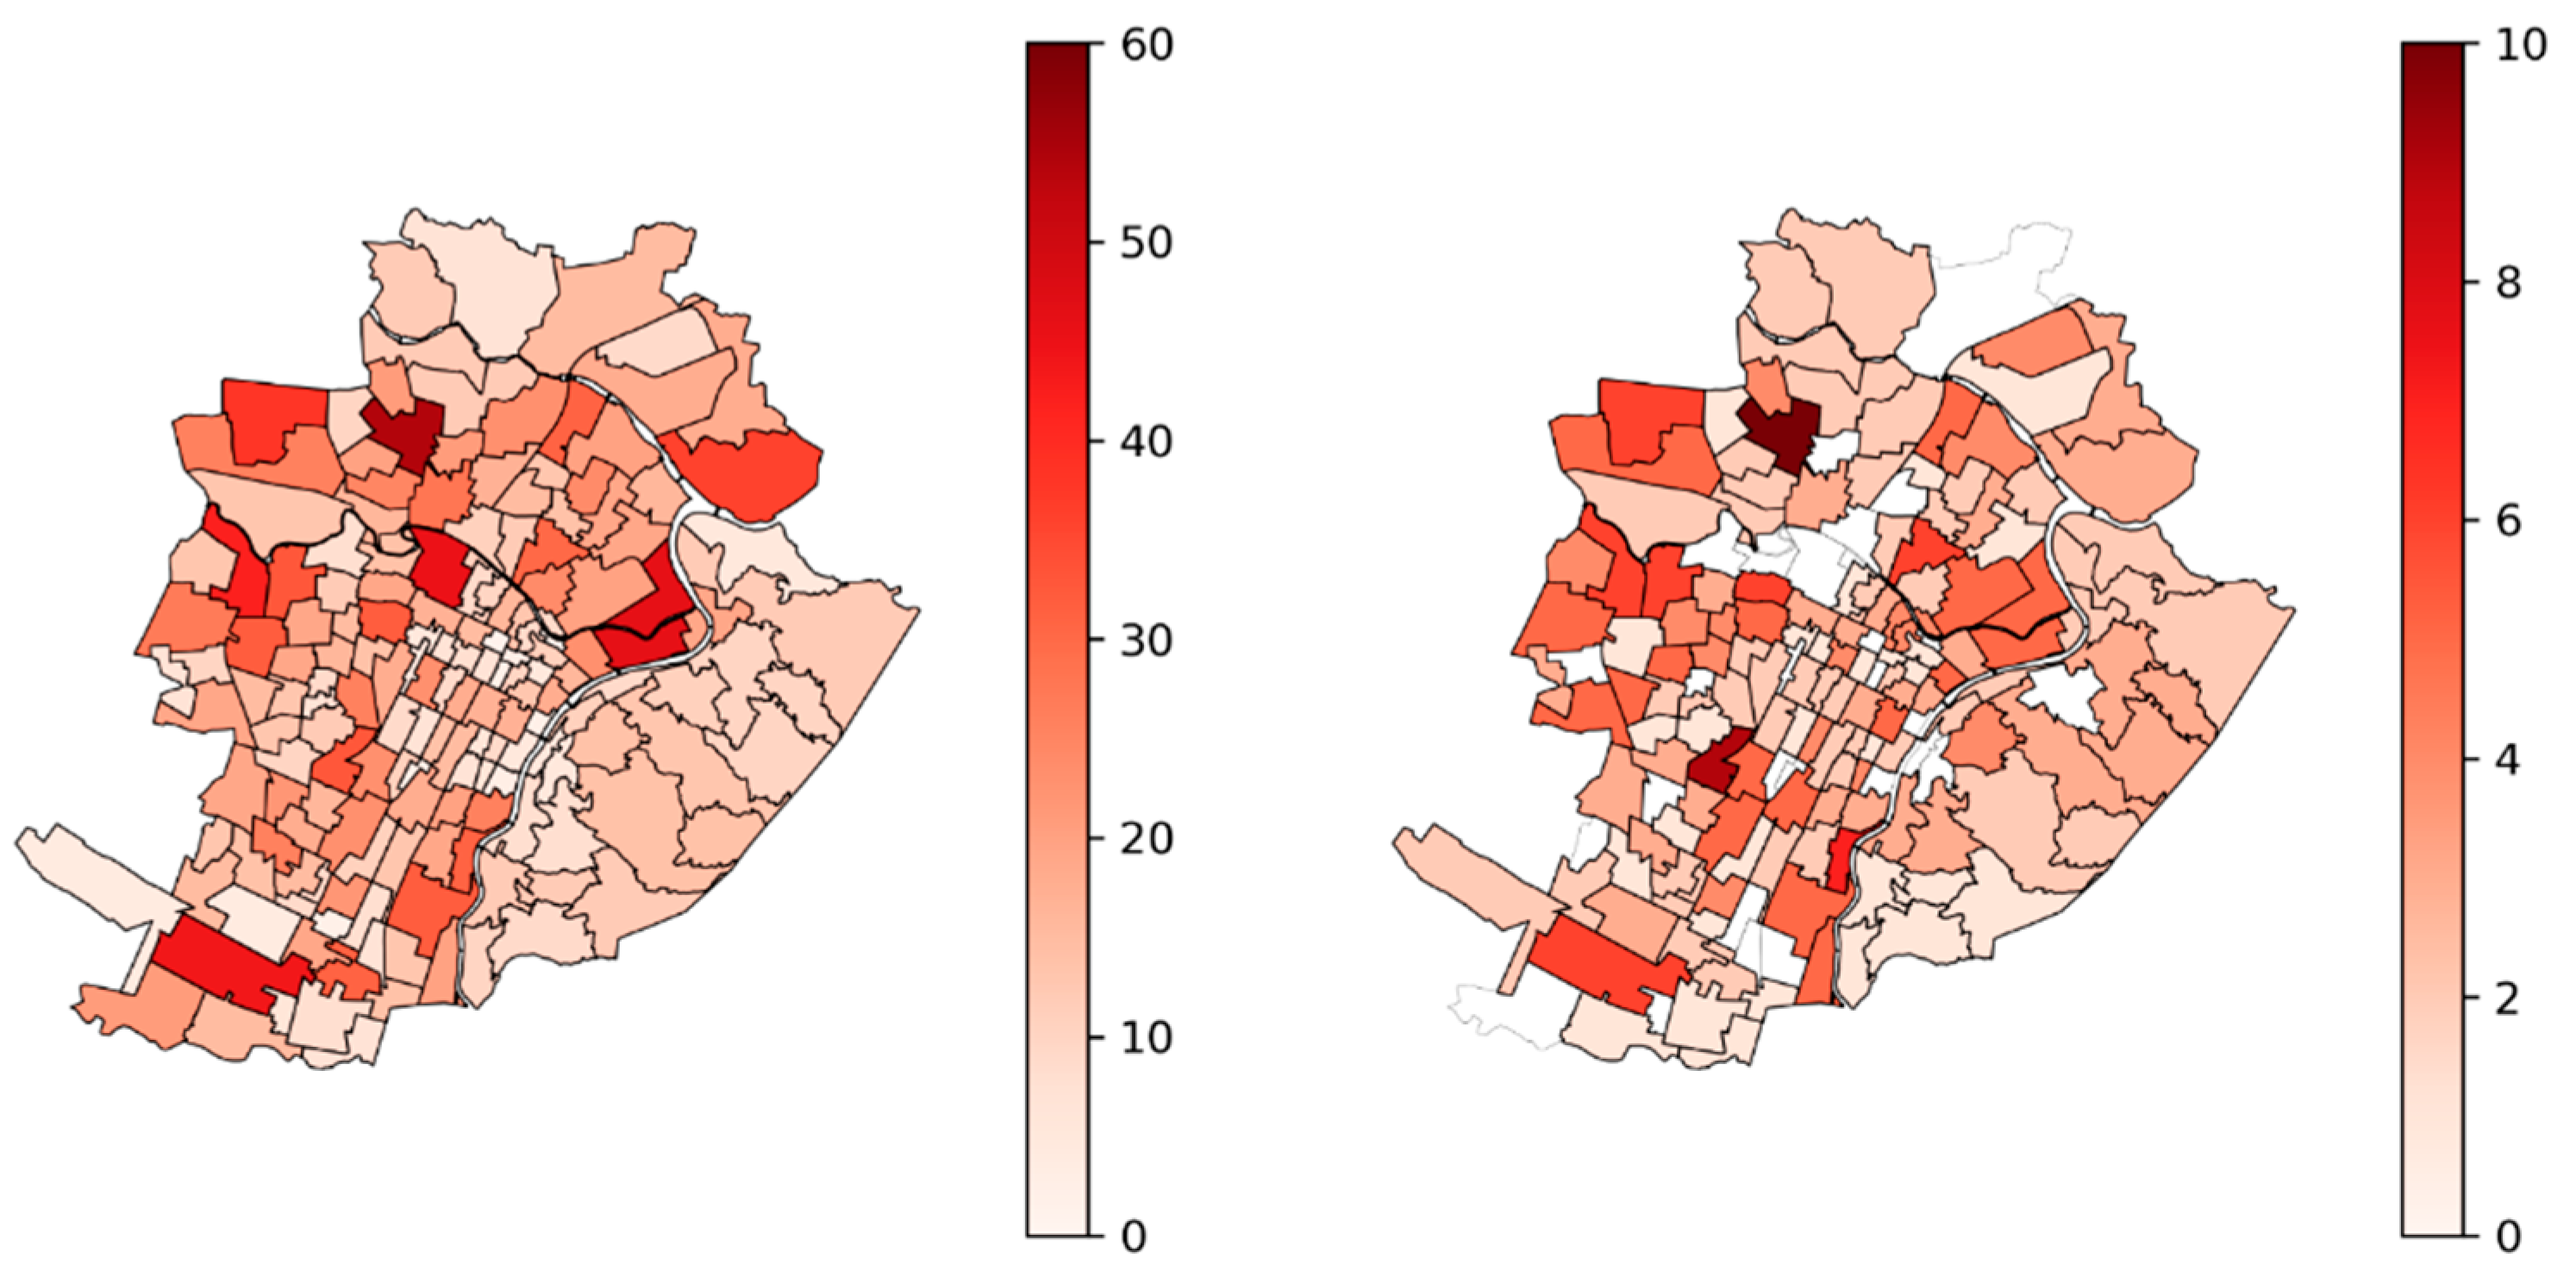
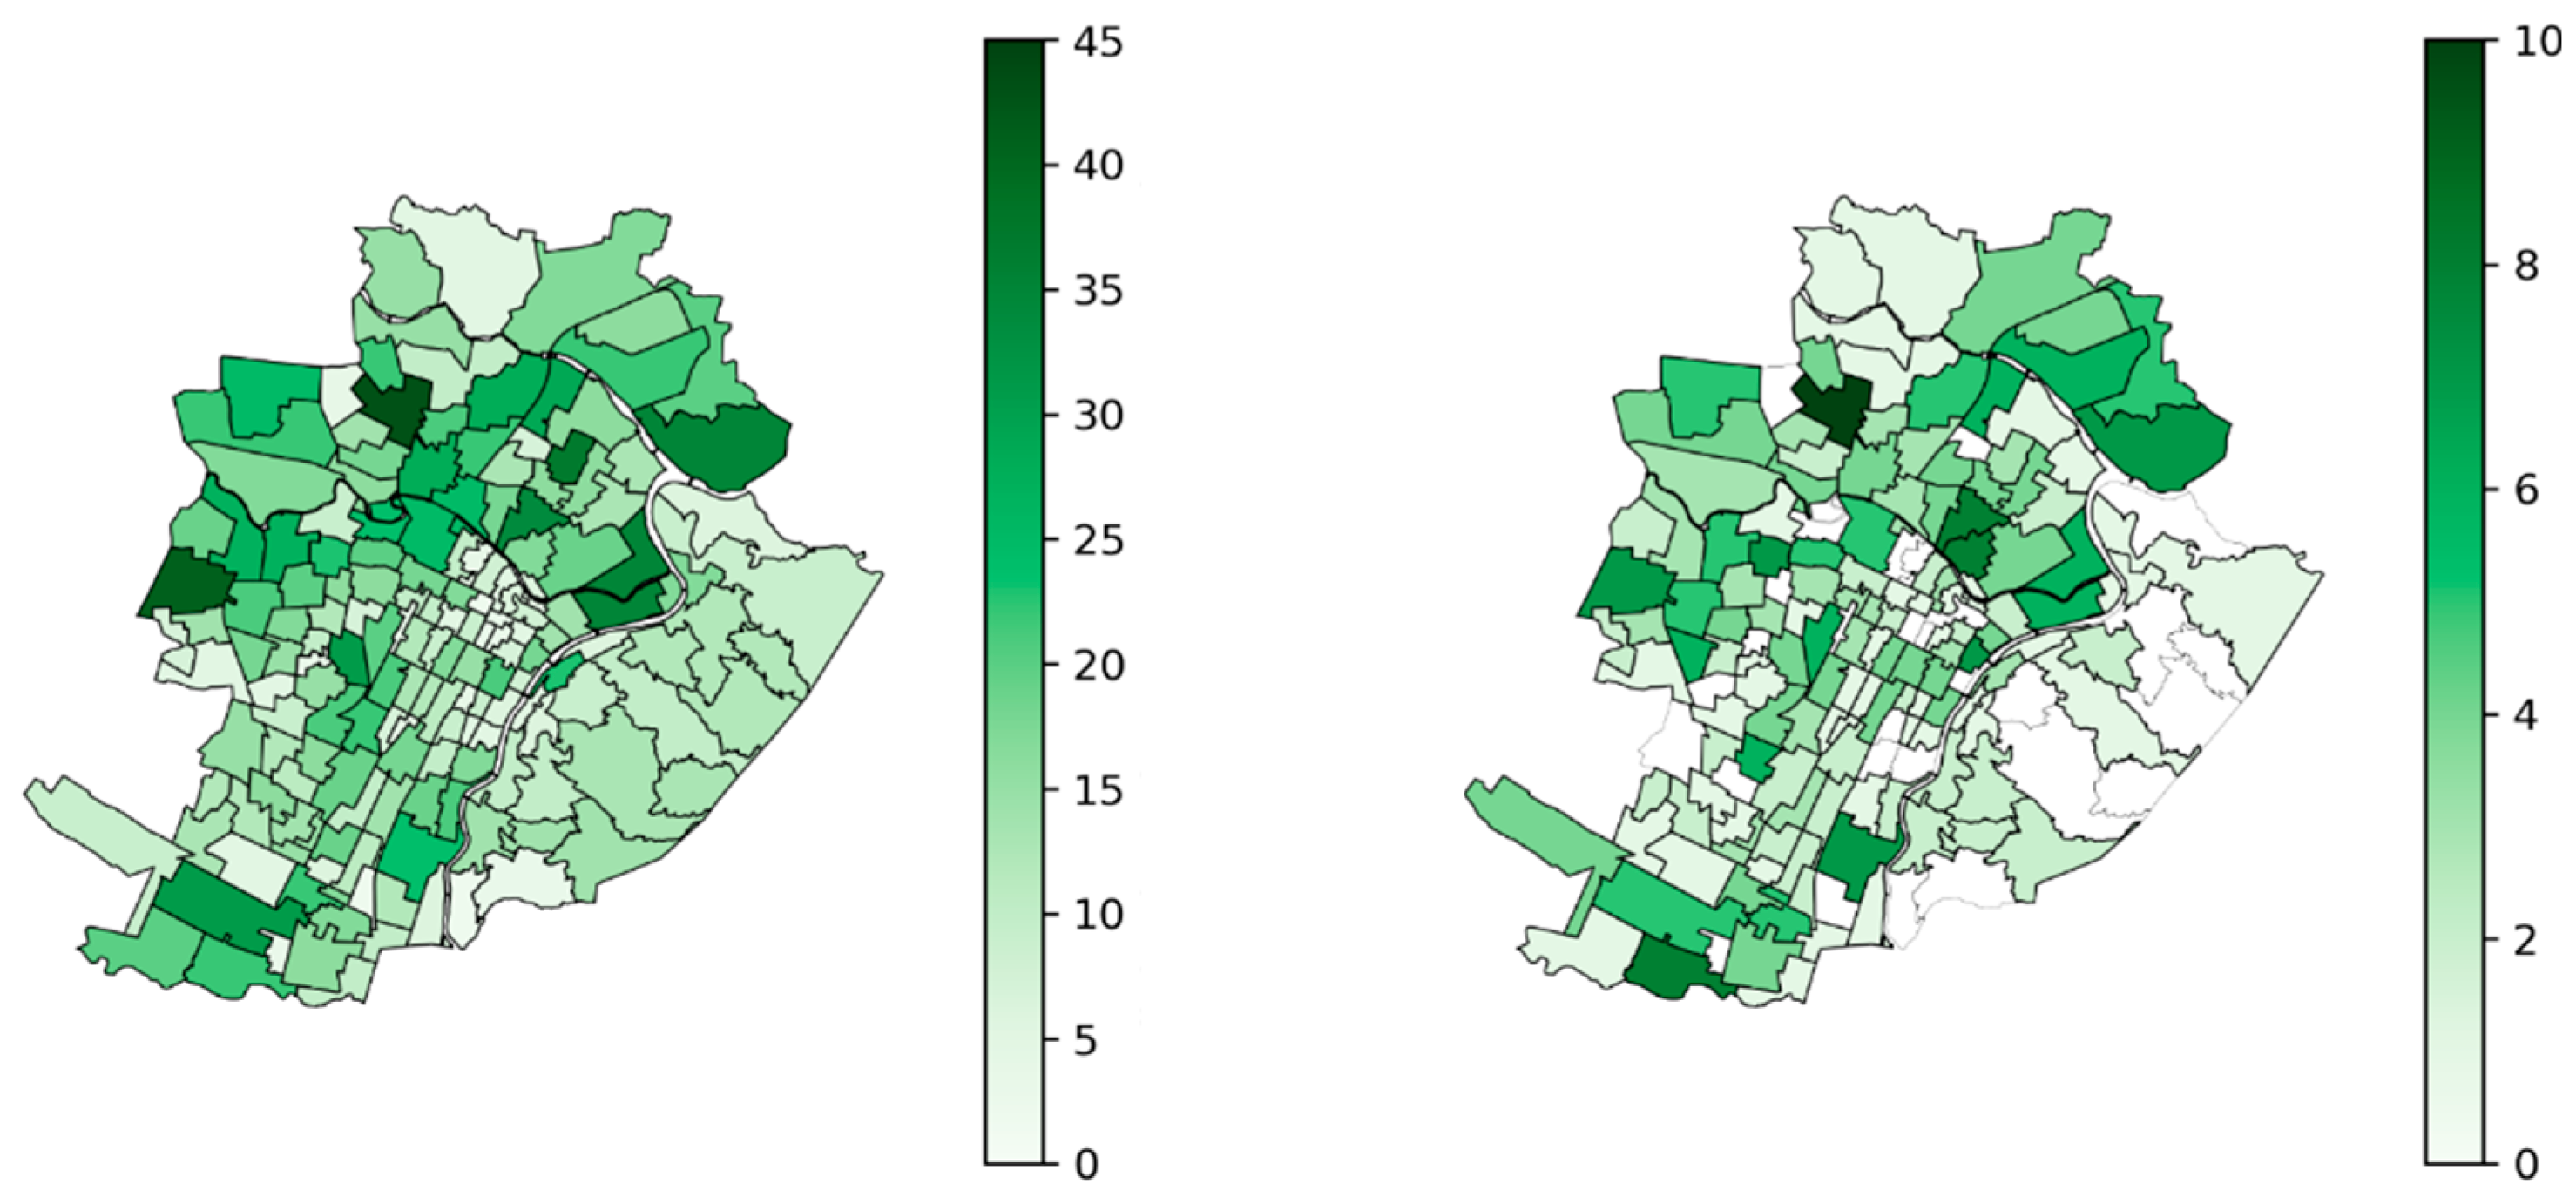
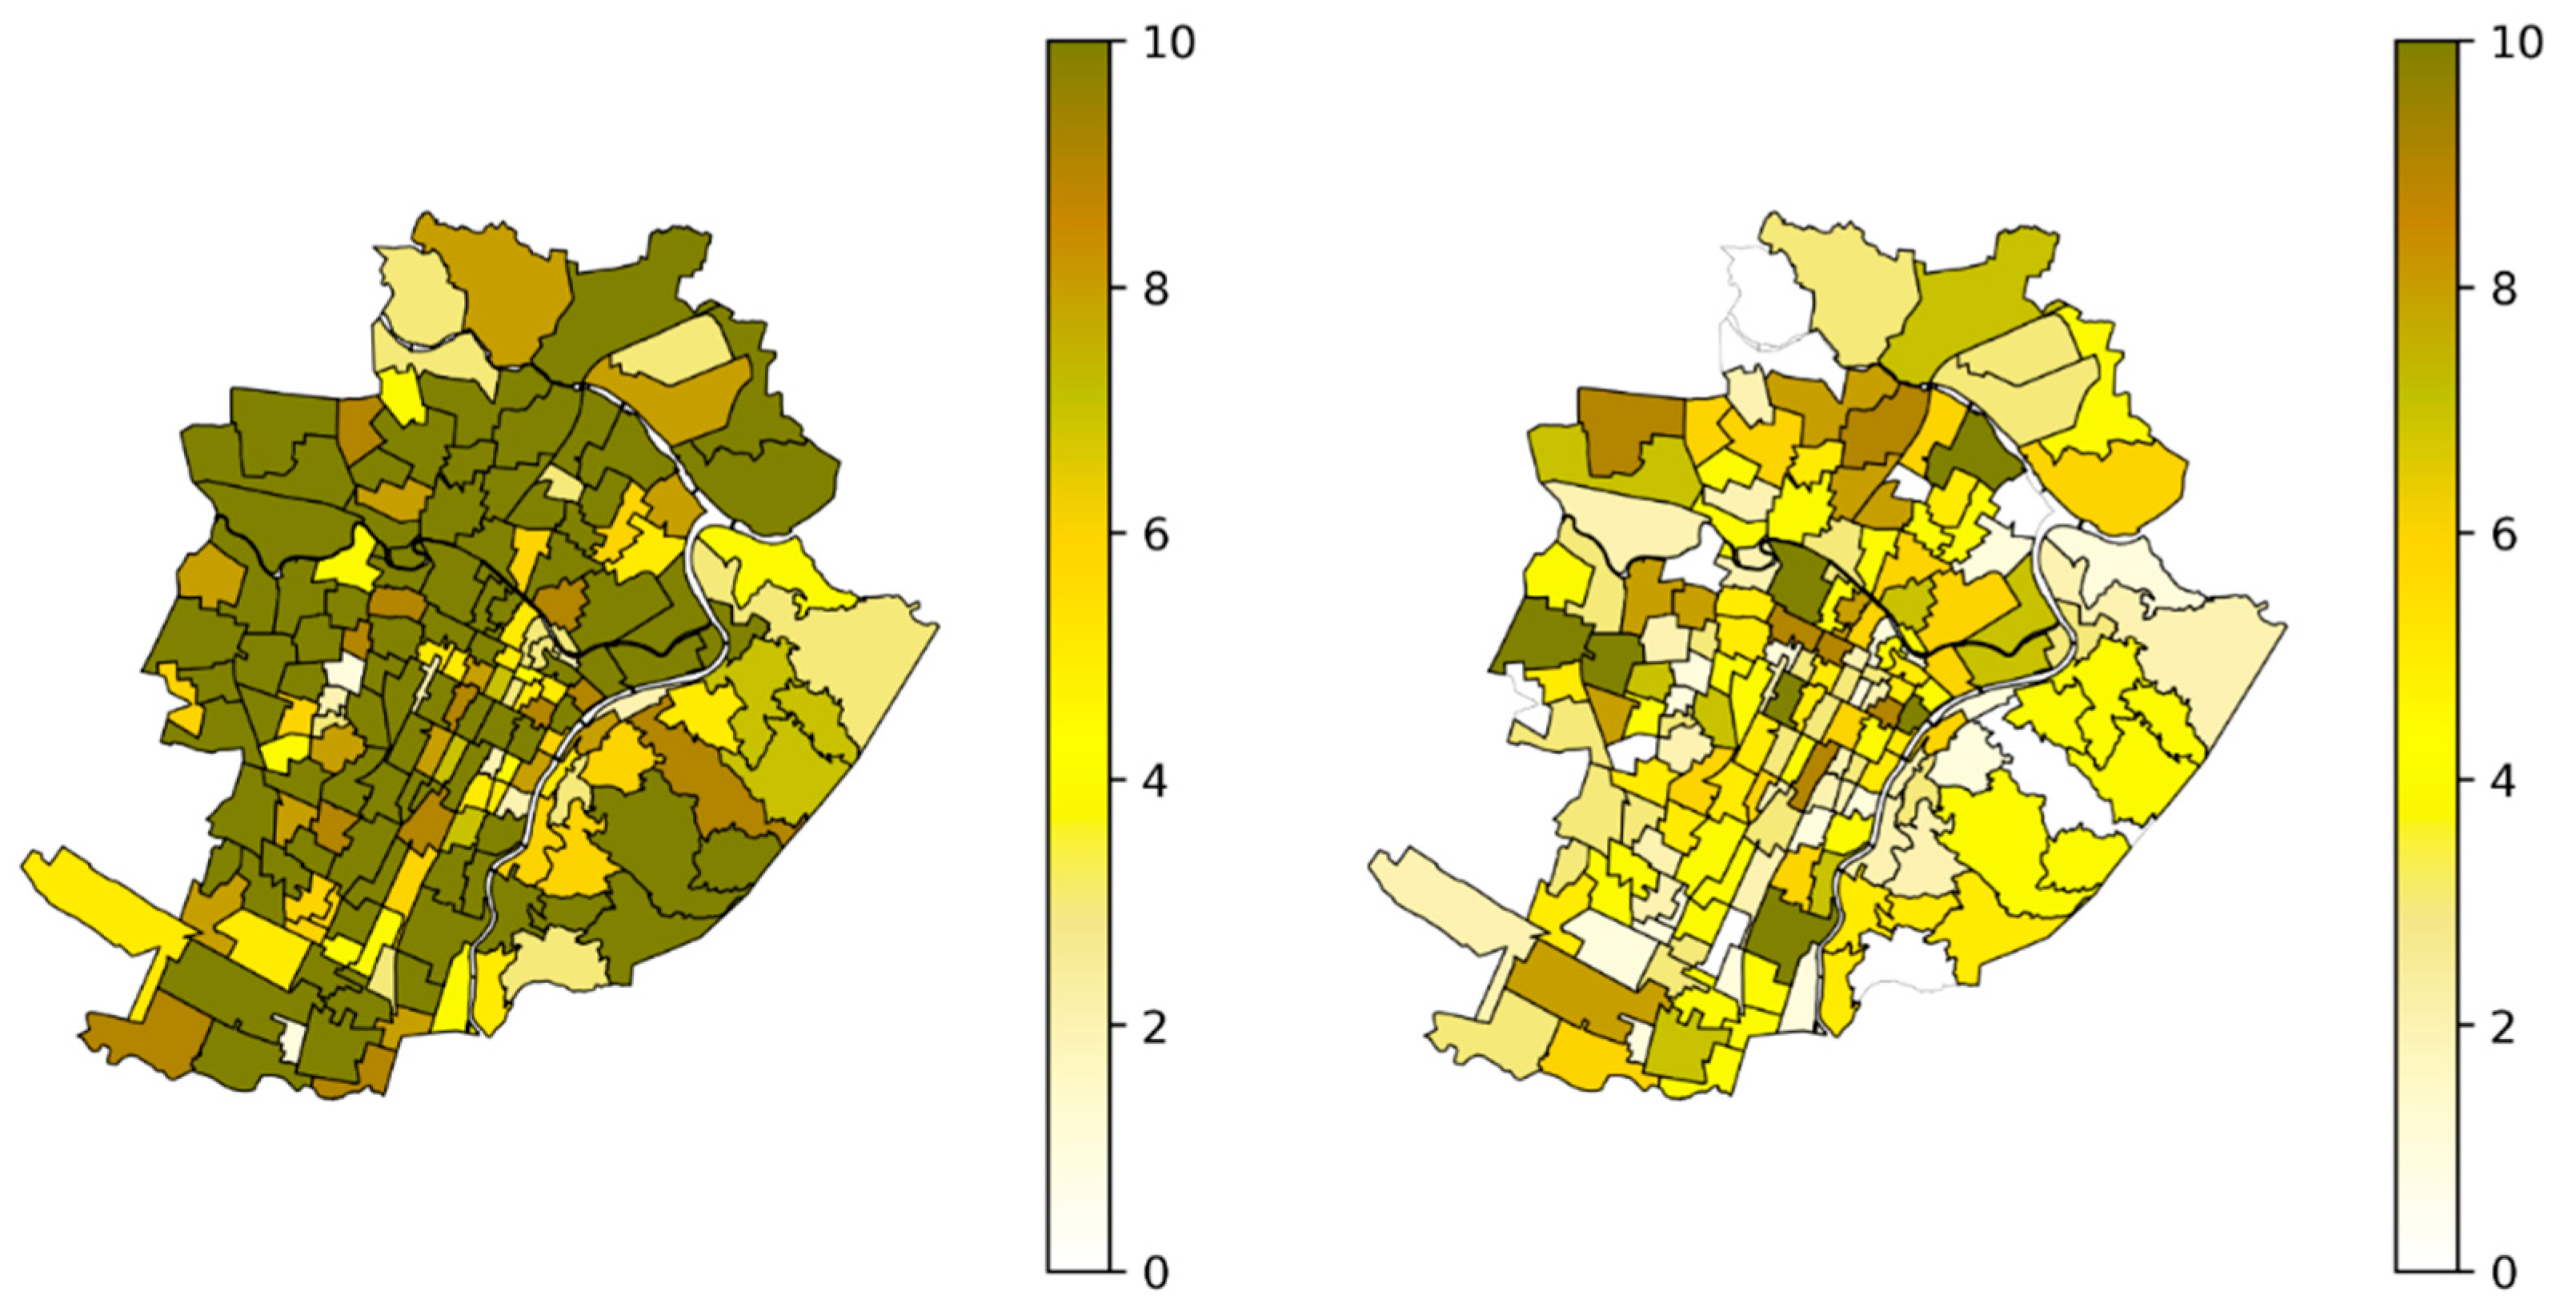
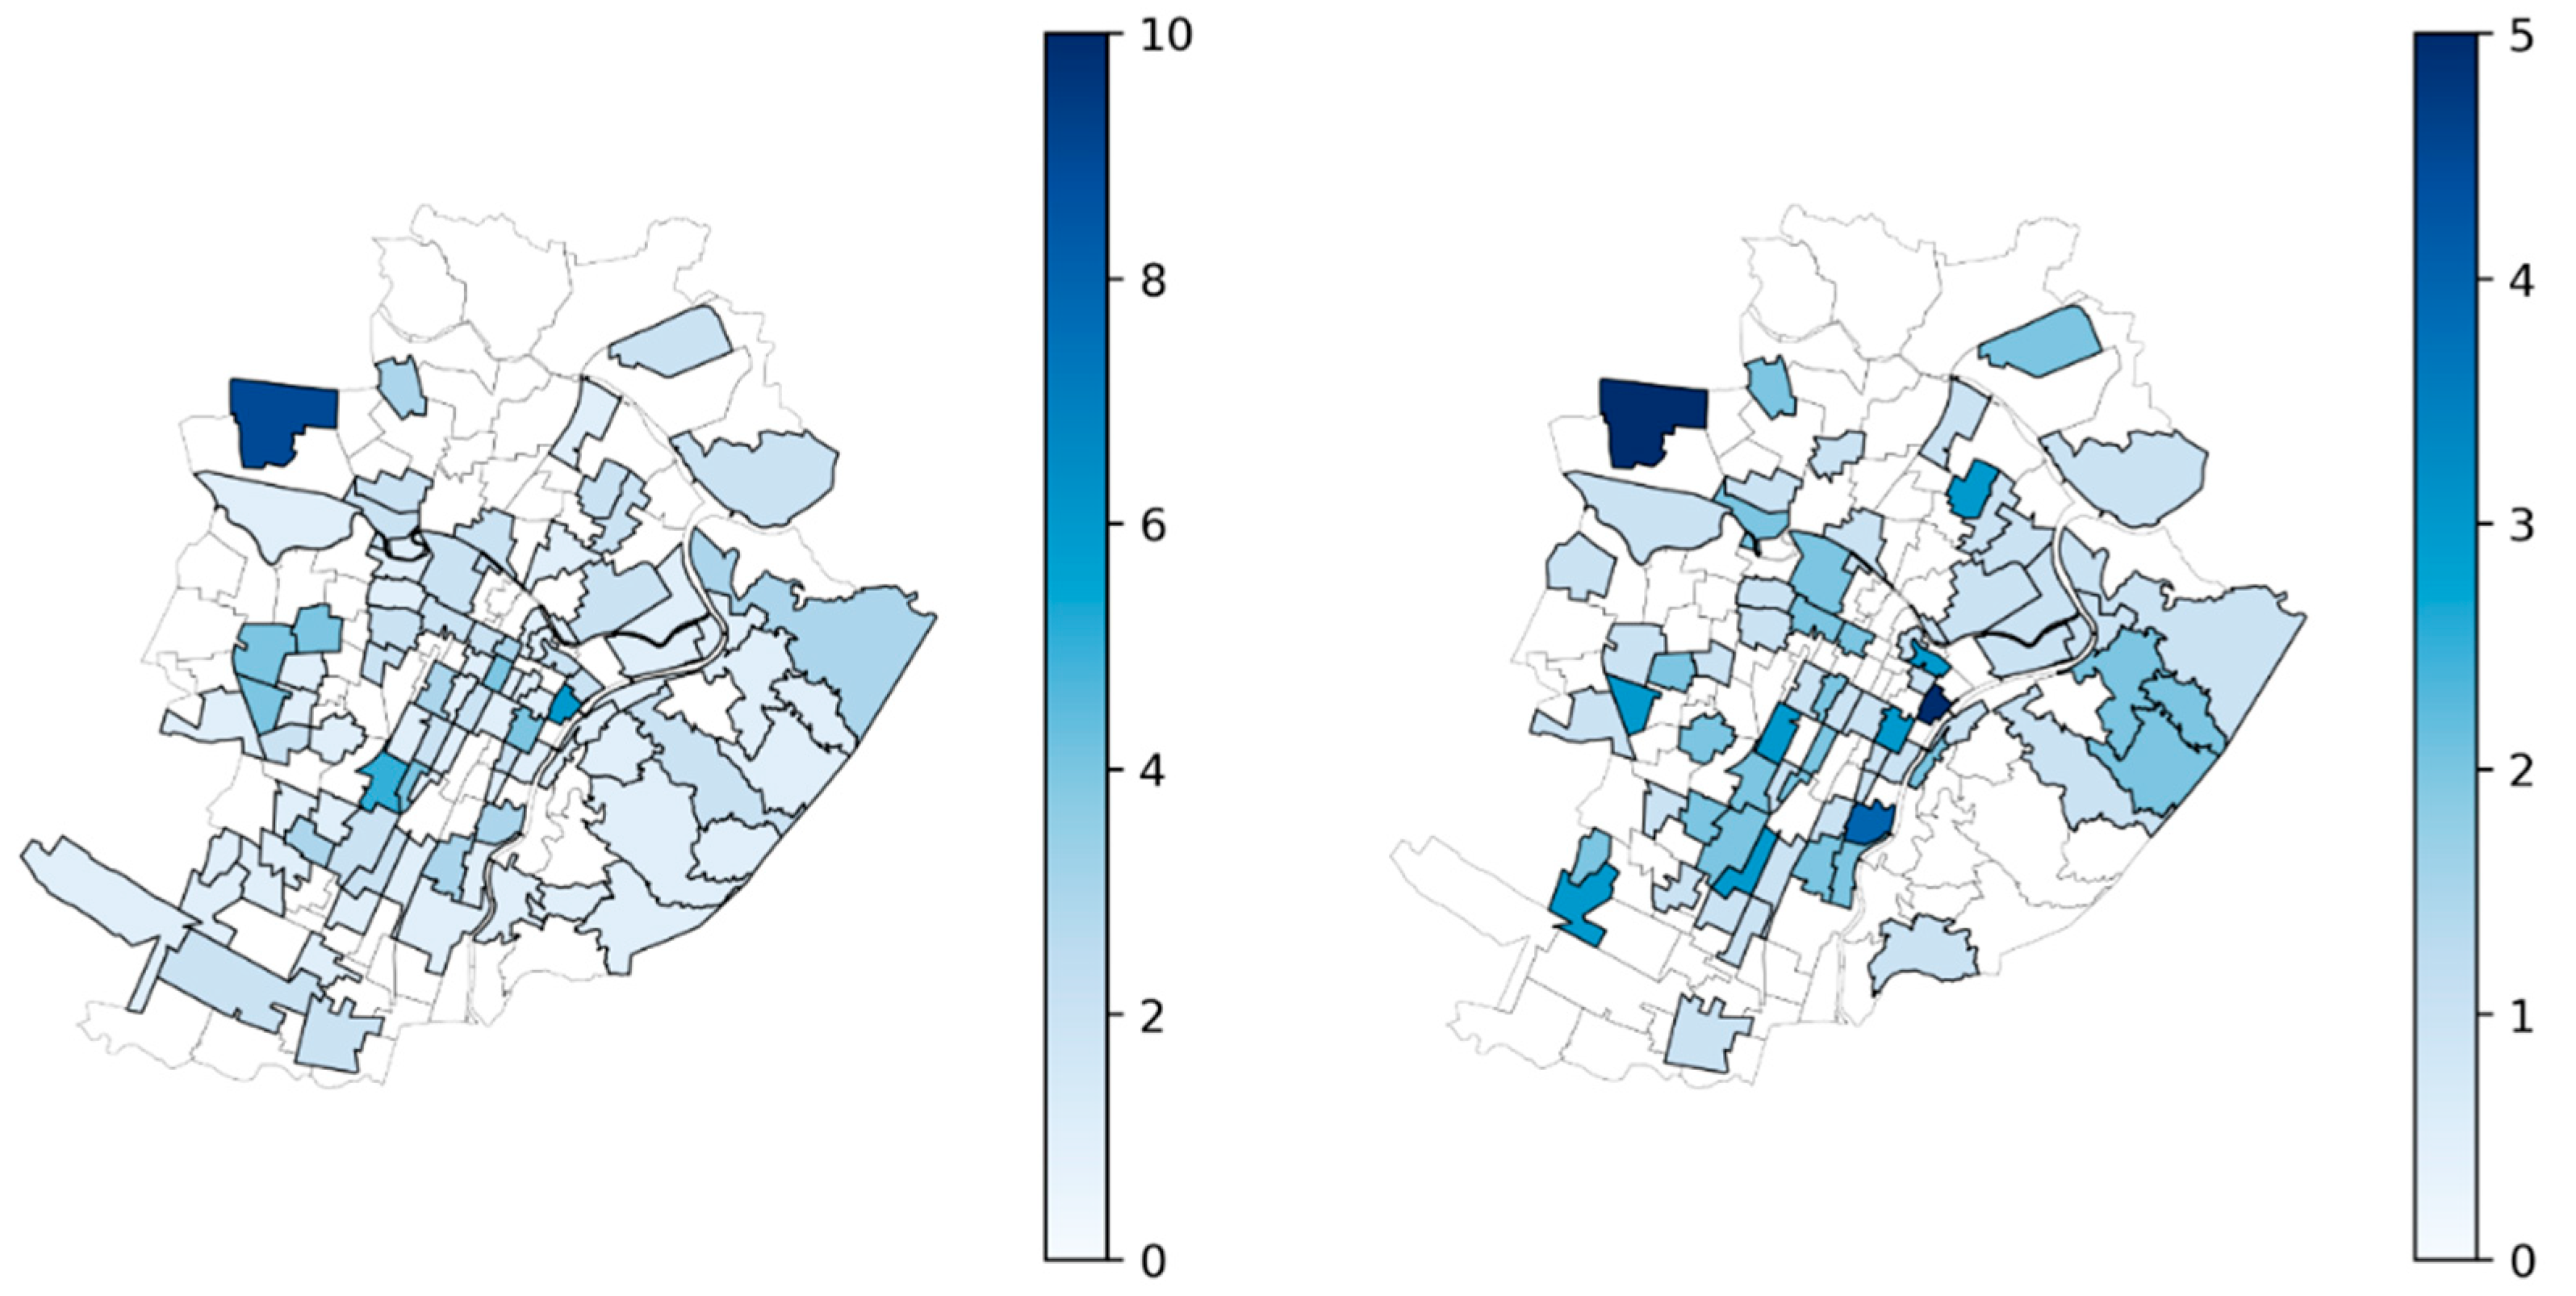
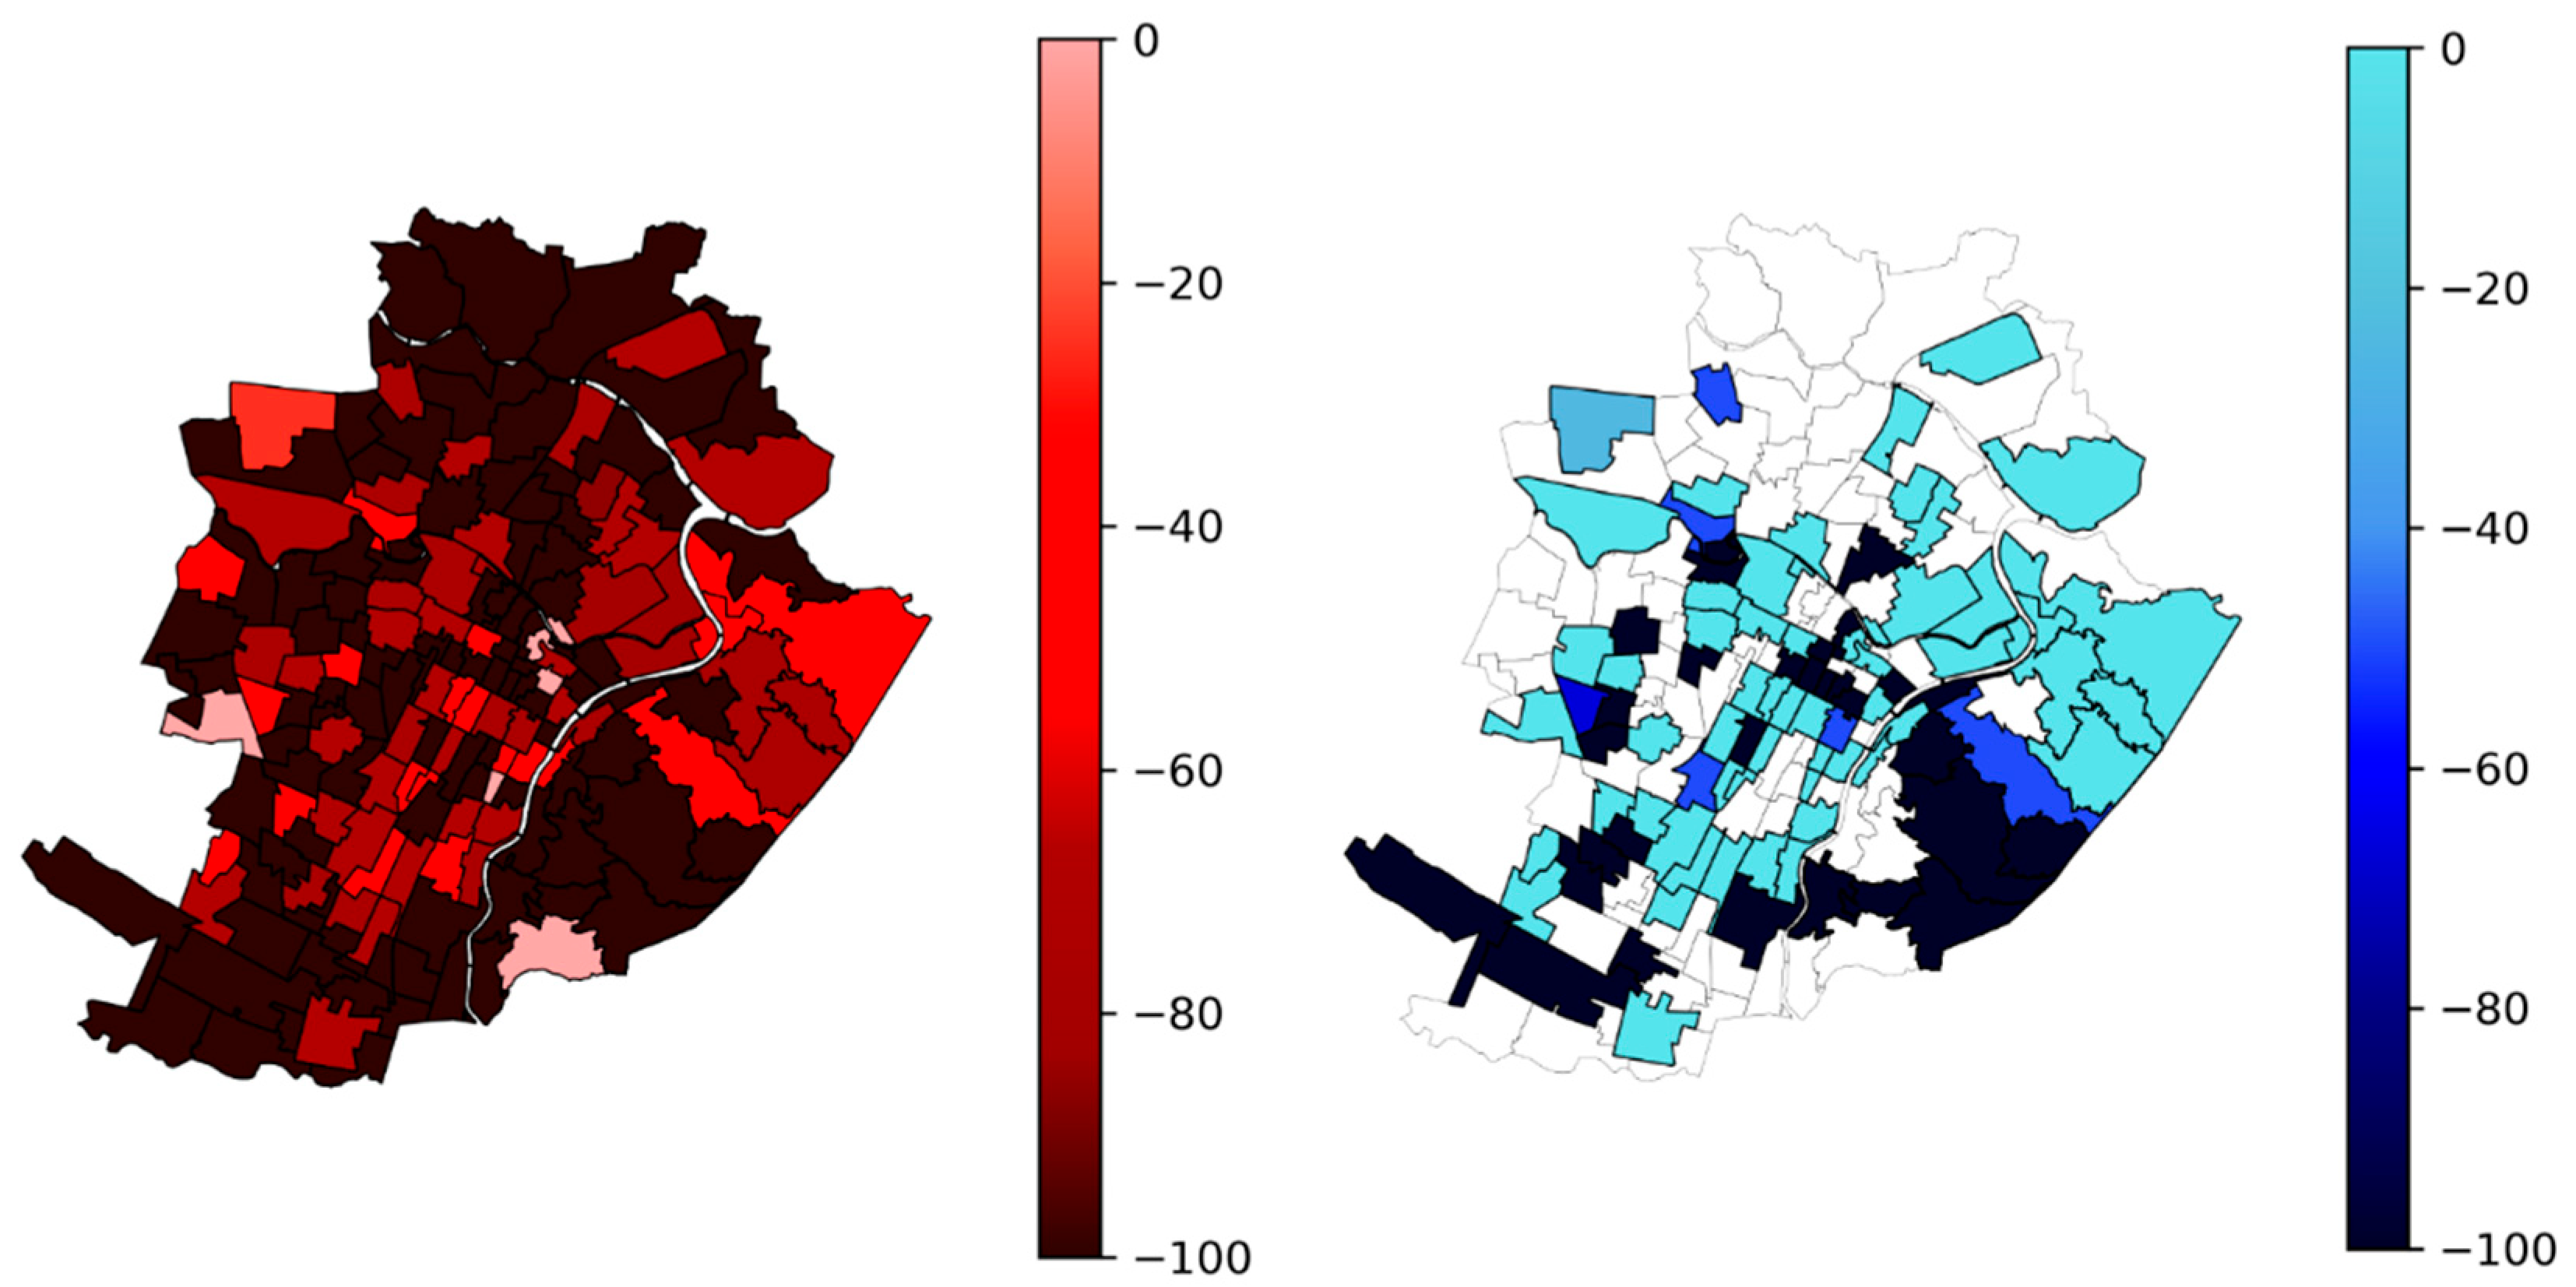
In a further set of scenarios, the study area was restricted to only the Municipality of Turin and, by introducing zoning (~160 zones), the analysis was performed in the case of an available home/work electric charging station (ECS) and in the case where only public infrastructure is considered. In both cases, ~6500 operations were simulated: In the former experiment, 5000 of those took place at home or work, heavily reducing (up to 100% in several zones) the energy demand from the public network in terms of the number of possible charging operations. This reduction was more evident for low-segmented vehicles since the number of operations is ~1/6 for mini vehicles and 1/4 for small ones. On the other hand, the same number decreased by 1/2 for the other two categories. In terms of public infrastructure, the demand from 3.7 kW stations almost reaches zero in many zones, while decreasing by ~20% in many zones for 50 kW stations, when home/work solutions are available. In general, this different behavior can be explained considering that high-segmented vehicles, due to their specific characteristics, tend to use power levels that are available only through public infrastructure, unlike other vehicles that use the same speed of charge whether the operation takes place at home/work or at a public ECS.
No information about the current ECS network available in the metropolitan area is included in this study. Nevertheless, the assumption of the availability of charging during the idle time, according to the different options, explored simulating the entire observed fleet, as electric vehicles provide benchmarking cases to compare different policies against the real-life trip chains of vehicles.
This simulation approach can be easily extended considering a planned scenario of charging infrastructure available by zones, which requires introducing a further condition on the charging strategy and a reduced set of electric vehicles (in order to still guarantee a reasonable computation time). However, this must be left to further research because focusing on realistic energy requirements from the specific stations by matching the simulated operations’ data availability is crucial. Moreover, technological developments introduced in e-mobility sectors should be considered in future scenarios because vehicle ranges are growing, recharge times are decreasing, and low-segmented vehicles could also typically be recharged with power higher than 50 kW. In the experiments presented here, no perturbation was introduced into the simulation, as one of the aims was to use simulations to evaluate how charging activities could be incorporated without requiring any changes to the daily or weekly routines of the vehicle users. However, in the event of accidents or adverse weather conditions, a modification of the trip chain could be generated and used to simulate charging operations in unusual situations, similar to the present experiments.


