Article

Dynamic Reconfiguration for Energy Management in EV and RES-Based Grids Using IWOA

by
Hossein Lotfi
1,*,
Mohammad Hassan Nikkhah
2 and
Mohammad Ebrahim Hajiabadi
1
1
Department of Electrical and Computer Engineering, Hakim Sabzevari University, Sabzevar 96131, Iran
2
School of Engineering, RMIT University, Melbourne 3000, Australia
*
Author to whom correspondence should be addressed.
World Electr. Veh. J. 2025, 16(8), 412; https://doi.org/10.3390/wevj16080412
Submission received: 16 June 2025 / Revised: 19 July 2025 / Accepted: 21 July 2025 / Published: 23 July 2025
(This article belongs to the Special Issue Power and Energy Systems for E-Mobility, 2nd Edition)

Abstract

Effective energy management is vital for enhancing reliability, reducing operational costs, and supporting the increasing penetration of electric vehicles (EVs) and renewable energy sources (RESs) in distribution networks. This study presents a dynamic reconfiguration strategy for distribution feeders that integrates EV charging stations (EVCSs), RESs, and capacitors. The goal is to minimize both Energy Not Supplied (ENS) and operational costs, particularly under varying demand conditions caused by EV charging in grid-to-vehicle (G2V) and vehicle-to-grid (V2G) modes. To improve optimization accuracy and avoid local optima, an improved Whale Optimization Algorithm (IWOA) is employed, featuring a mutation mechanism based on Lévy flight. The model also incorporates uncertainties in electricity prices and consumer demand, as well as a demand response (DR) program, to enhance practical applicability. Simulation studies on a 95-bus test system show that the proposed approach reduces ENS by 16% and 20% in the absence and presence of distributed generation (DG) and EVCSs, respectively. Additionally, the operational cost is significantly reduced compared to existing methods. Overall, the proposed framework offers a scalable and intelligent solution for smart grid integration and distribution network modernization.

1. Introduction

1.1. Motivation

Modern power systems are evolving rapidly due to the widespread adoption of electric vehicles (EVs) and the integration of renewable energy sources [1]. While these advancements promote a more sustainable energy future, they introduce significant challenges in the management and operation of distribution networks. The uncertain nature of EV charging demand and the variability of renewable energy output can lead to voltage instability, increased power losses, and imbalanced load distribution [1]. These dynamic and complex issues are further exacerbated by the uncertainty inherent in key power system parameters, particularly in distribution networks. Traditional network management techniques often fall short in addressing these multifaceted problems effectively. Addressing the uncertainties in load demand, renewable generation, and other critical variables requires innovative approaches that enable dynamic adaptation to evolving network conditions. By employing advanced optimization techniques and leveraging dynamic reconfiguration of distribution feeders, it is possible to achieve new levels of operational efficiency and reliability.
This research aims to develop a robust and scalable framework for energy management, addressing the challenges posed by uncertainty in power system parameters. Using an enhanced Whale Optimization Algorithm tailored to handle the discrete and variable nature of distribution networks, this work provides a practical solution to improve system performance. The proposed approach ensures that distribution networks remain resilient and efficient, even under fluctuating demands and uncertain operating conditions, paving the way for smarter and more sustainable power systems.

1.2. Literature Review

The concept of dynamic reconfiguration in distribution networks (DNR) has attracted growing interest as an effective strategy to enhance energy efficiency, reduce power losses, and improve system reliability. This literature review highlights recent studies that utilize evolutionary and metaheuristic algorithms for optimal DNR. Special attention is paid to configurations involving electric vehicles (EVs), distributed generation (DG) units, and dynamic load conditions, all of which reflect emerging challenges in modern power systems.
In [2], a state-of-the-art metaheuristic approach is proposed to address DNR and optimal DG placement. The technique aims to minimize energy losses and improve voltage stability, particularly under variable load conditions and renewable energy integration. In [3], a Fractal Search Algorithm (SFS) is introduced for DNR optimization, emphasizing improvements in network reliability and flexibility. This method effectively lowers energy losses while enhancing response capabilities. In [4], the Coyote Optimization Algorithm (COA) is applied to solve both DNR and DG allocation problems. Inspired by the pack-hunting behavior of coyotes, this method improves voltage regulation and reduces losses. In [5], an equilibrium-based algorithm is utilized to manage DNR under dynamic load profiles, successfully enhancing resource distribution and network efficiency. In [6], a multi-objective fuzzy optimization model integrates DSTATCOMs and DERs into the network. It simultaneously targets loss reduction, voltage profile improvement, and operational cost minimization, offering a comprehensive power system planning solution. In [7], the Electric Eel Optimization Algorithm handles DNR with integrated DG units. It shows adaptability to load and generation fluctuations, supporting system stability. In [8], the Tabu Search Algorithm is used for DNR, with a focus on minimizing switching costs and improving operational efficiency, particularly when incorporating DGs. In [9], the study examines joint DG placement and DNR, with a focus on maintaining network flexibility under varying load levels. In [10], the integration of parallel capacitors in smart networks is explored to enhance voltage stability and reduce reactive power losses through optimized DNR. In [11], a Differential Evolution Algorithm is employed to plan STATCOM placement in radial networks, aiming to minimize planning costs under diverse load conditions. In [12], a flexible simulated annealing technique is applied for optimal DG and capacitor allocation, reducing energy losses and improving network performance. In [13], a hybrid APSO and GWO-PSO algorithm is proposed for simultaneous planning of solar units and DSTATCOMs in DNR, improving voltage profiles and loss metrics. In [14], an enhanced Sine-Cosine Algorithm (SCA) is developed for integrated DNR and DG placement, aiming to improve voltage quality and loss minimization. In [15], the configuration of distributed wind turbines and DSTATCOMs is optimized to improve voltage recovery at sensitive nodes, thus increasing network resilience. In [16], a novel metaheuristic optimization method is applied to DNR and DG planning, delivering better voltage regulation and energy efficiency. In [17], a parallel simulated annealing approach is implemented for DNR with DG units to reduce power losses and enhance overall performance. In [18], the study focuses on line reconfiguration in smart grids for active loss minimization, while evaluating the influence of EVs on network operation. In [19], a hybrid simulated annealing and spanning tree algorithm is employed for DNR and reactive power compensation, significantly improving system efficiency. In [20], DNR in radial systems is optimized with integrated DGs, highlighting improvements in losses and system robustness under various operational conditions. In [21], a multi-objective dynamic reconfiguration framework using the LDBAS algorithm is introduced. This method considers DGs and EVs simultaneously, optimizing losses, voltage quality, and operational costs.

1.3. Challenges and Contributions

A review of the existing studies indicates that most have not simultaneously accounted for the combined effects of distributed generation units, capacitors, and EVs in addressing the optimization challenges of network reconfiguration. Additionally, when modeling the impact of electric vehicles, these studies typically consider either G2V or V2G interactions, failing to address the combined influence of both modes on the network. Furthermore, the majority of research has primarily focused on traditional objective functions, such as power losses, operational costs, and voltage deviation, while placing less emphasis on objectives related to the reliability and security of the distribution network. The inclusion of uncertainty parameters, which significantly increases the complexity of the optimization process, has also been largely overlooked. Most studies that do consider uncertainties often limit their scope to a single factor, such as demand or electricity prices, rather than addressing multiple uncertainty parameters simultaneously. This limitation reduces the accuracy and robustness of the proposed solutions under real-world conditions, leaving the complexity induced by uncertainties insufficiently addressed. Regarding multi-objective optimization, the majority of research favors weighted-sum methods due to their simplicity and widespread applicability. However, these methods have drawbacks, including the need for precise weight selection and their limited ability to identify the entire Pareto-optimal front. Conversely, more advanced approaches based on fuzzy logic and Pareto optimality—which better capture the trade-offs between conflicting objectives and provide a diverse set of optimal solutions—are less commonly employed. This limited use stems from computational complexity and modeling challenges, but expanding the application of these sophisticated techniques can enhance the comprehensiveness and accuracy of optimization outcomes and offer more flexible decision-making options. Based on the identified gaps in the literature, this study aims to achieve the following research objectives:
  • To develop a dynamic mathematical model for distribution network reconfiguration that enables optimal energy management in the presence of Electric Vehicle Charging Stations (EVCSs), Renewable Energy Sources (RESs), and capacitors. The model incorporates both Vehicle-to-Grid (V2G) and Grid-to-Vehicle (G2V) operational modes of electric vehicles.
  • To design and implement an improved Whale Optimization Algorithm (IWOA) to solve the Dynamic Network Reconfiguration (DNR) problem with the dual objectives of minimizing Energy Not Supplied (ENS) and operational costs. The enhanced algorithm addresses the local optima problem commonly encountered in the standard WOA.
  • To establish a multi-objective optimization framework using a fuzzy-based Pareto approach to balance ENS and operational cost objectives. The objective function includes comprehensive operational costs, covering the expenses related to purchasing both active and reactive power from all relevant equipment and sources within the network.
  • To propose a realistic uncertainty modeling approach based on generation/reduction techniques to represent stochastic parameters such as electricity prices and customer demand. This approach enables network operators to identify optimal operating conditions under uncertainty, improving the robustness of decision-making in real-world power systems.
This is how the rest of the paper is structured. Section 2 presents the problem formulation including objectives, constraints, uncertainty modeling, and DR formulation. Section 3 introduces IWO and how it is used in network reconfiguration. Section 4 discusses the simulation results on the 95-bus system. Conclusions are given in Section 5.

2. Problem Formulation

2.1. Objective Functions

This study’s objective goals include operational cost and ENS minimization [22].
  • Operational cost
The operation cost can be calculated as follows:
f 3 X = i = 1 N D G ( P r i c e D G , i h × P D G , i h ) + k = 1 N S u b ( P r i c e S u b , k h × P S u b , k h ) + j = 1 N S w   P r i c e S w , j × S W j h S W j h 1 + C o s t E V C S + C o s t C a p
C o s t E V C S = r = 1 N E S P r i c e E V C S , r h × P E V C S , r h
C o s t C a p = l = 1 N C a p P r i c e C a p , l h × Q C a p , l h
The first term in the goal function shown in (1) deals with the electricity costs generated by DGs. The costs of purchasing power from sub-stations come in second, and switching costs come in third. The cost of purchasing active and reactive power from the electric vehicle station and capacitor is introduced in terms 4 and 5 of Equation (1), respectively.
  • Energy not supplied
Following is how the ENS [21] is formulated:
E N S i = P i i , j V ,   i j ( U i , j + U i , j )

2.2. Optimization Constraints

Let us now discuss the limits of the optimization problem under discussion [22]. The network limit associated with being radial is computed using the following formula:
N b r a n c h = N B u s N s o u r c e
The following formulas can be used to calculate the constraint of load flow [22] equations:
P j = i = 1 N B u s V i V j Y i j cos θ i j δ i + δ j + α P D G P D G
Q j = i = 1 N B u s V i V j Y i j s i n ( θ i j δ i + δ j )
The following explanation explains the node’s voltage [23] limitation:
V m i n V i   V m a x
The feeder current constraint [23] is described as follows:
I f , i I f , i M a x       i = 1 , 2 , ,   N f e e d e r
The limitations pertaining to the generation capacity of DG units [24] are as follows:
0 i = 1 P P D G P L o a d
2 L D G N D G
The following is a definition of the state of balance between generation and consumption [24]:
P D G   +   P G r i d =   P L o a d +   P E V C S
The switching restriction [24] can be formulated as follows:
S i S 0 i N S w i t c h   ,   i = 1 , 2 , , N S w i t c h
The limitation related to the capacitors [23] is as follows:
Q m i n Q l   Q m a x
The restrictions related to EVCSs [1] are described below.
P E V C S = c = 1 N c P E V C S c
If it is assumed that Nev EV is at the EVCS c, we have
P E V C S c = p E V 1 ,   , p E V v , , p E V N v
According to the 2009 National Household Travel Survey (NHTS), EV arrival time could be represented by the following normal probability distribution function [25,26]:
F t a r r = 1 σ r r 2 π   e ( t μ r r ) 2 σ r r 2       0 t 24
Therefore, the power consumption of each EVCS is calculated based on the probability of each EV arriving at each EVCS and the number of hours spent at the EVCS for charging or discharging.

2.3. Uncertainty Modeling

In actuality, all projections have errors because of measurement or sampling errors as well as uncertainty in all data and variables. Consequently, it is necessary to analyze the power system in an uncertain setting. To move variables from a deterministic environment to a random one in this new space, a strong tool is needed. There is additional unpredictability in the load variable in a restructured setting. This research models load-related uncertainty as a normal distribution function [27].

Scenario Generation and Reduction Strategy

Initial load scenarios are created in order to model uncertainty. A specific number of scenarios with the greatest chance of occurring are chosen after the occurrence of each scenario has been calculated. The probabilities of the occurrence of the chosen scenarios are then normalized so that the probability of the sum of the chosen scenarios equals one [28].

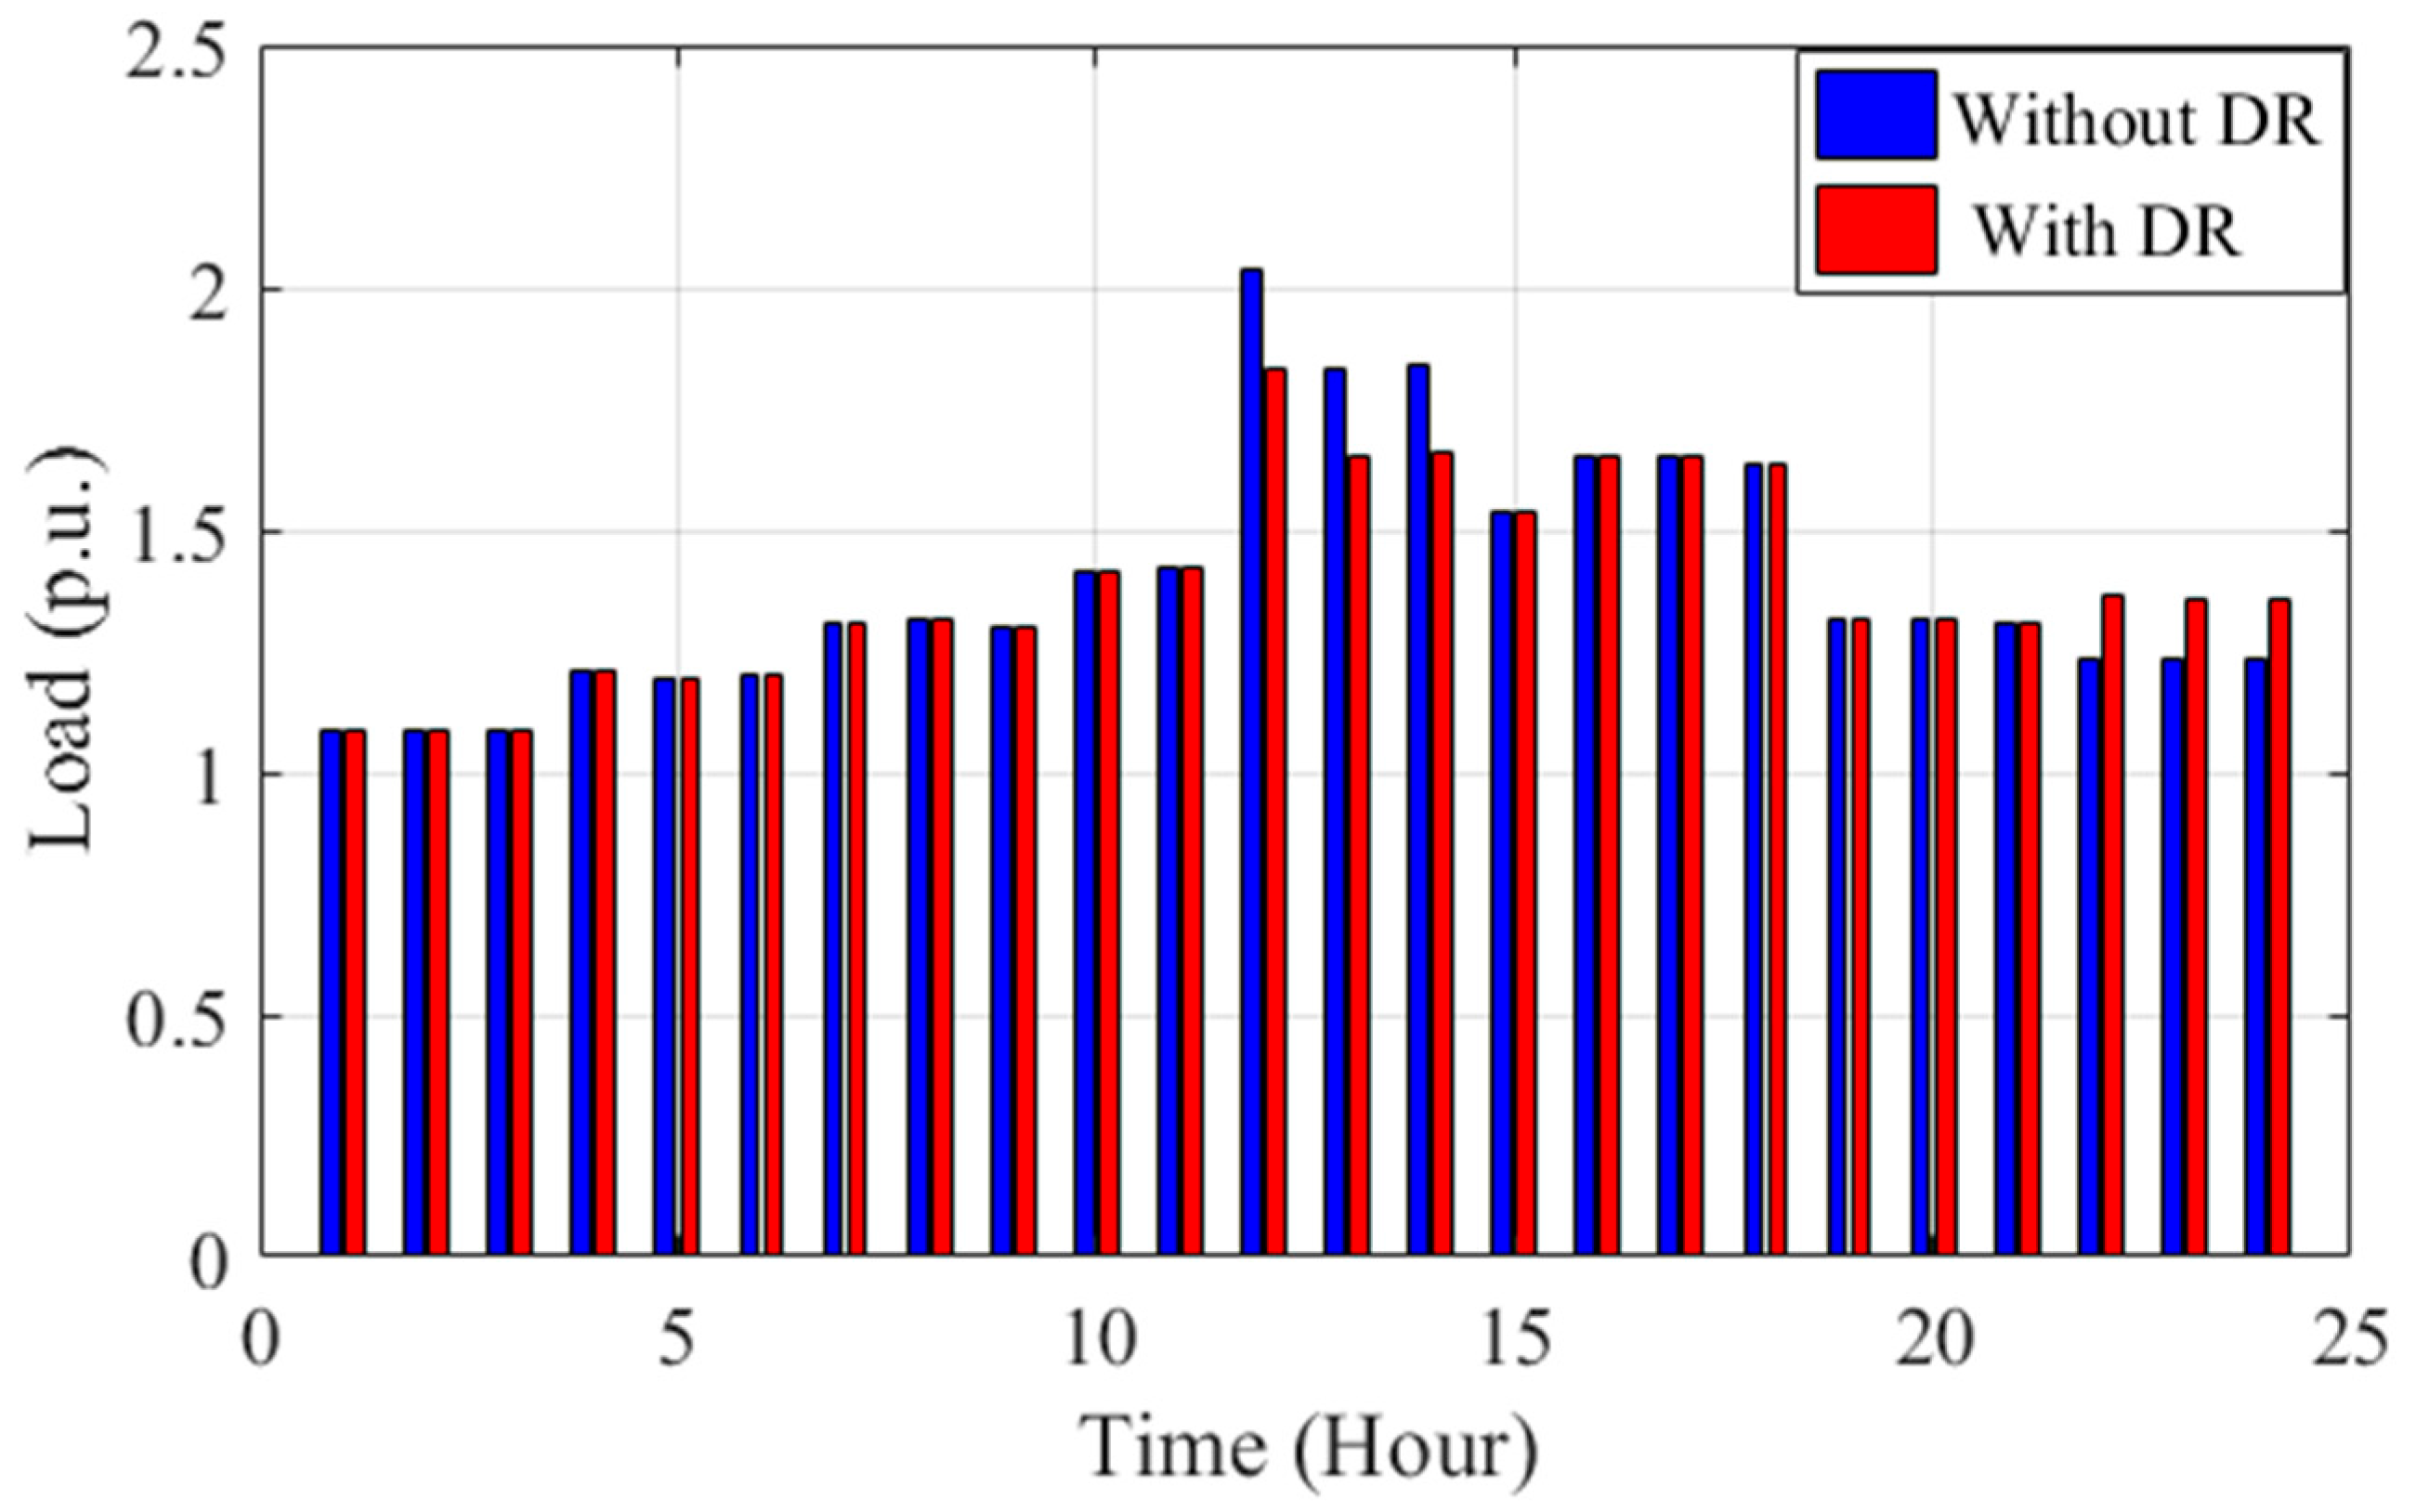
2.4. Demand Response Formulation

The US Department of Energy (DOE) defines demand response (DR) as changes to end-user customers’ typical consumption patterns in response to fluctuations in electricity prices over time, or incentive payments meant to promote lower electricity use during times of high wholesale market prices or when system reliability is at risk. This definition divides DR into two groups: incentive-based DR and time-based rates. Price elasticity of demand is a phrase used in the context of DR. The price-sensitivity of demand is the definition of elasticity [29].
E = ρ 0 d 0 × d d
Equation (19) provides the following description of the price elasticity of the ith period relative to the jth period (E(i, j)):
E ( i , j ) = ρ 0 ( j ) d 0 ( i ) × d ( i ) d ( j )
Some loads, such as lighting loads, cannot fluctuate from one period to the next and are only ever on or off. For a certain amount of time, these loads are therefore sensitive; this sensitivity is referred to as “self-elasticity,” and it is always negative. Process loads are one example of a consumption that can be shifted from peak to off-peak or low times. This kind of behavior is known as multi-period sensitivity, and it is quantified by “cross elasticity,” which is consistently positive [29].
p ( 1 ) p ( j ) p ( T ) = E 1,1 E ( 1 , i ) E ( 1 , T ) . . E ( j , 1 ) E ( j , i ) E ( j , T ) . . E ( 1,1 ) E ( T , i ) E ( T , T ) × ρ ( 1 ) ρ ( j ) ρ ( T )
The following is the definition of the modified load at hour j on the day after the application of the DR:
p D R j = p ( j ) × 1 + j = 1 T E i , j · p j p 0 i + A i + p e n ( i ) p 0 ( i )

3. Solution Method

This section provides a brief description of the multi-objective strategy, IWO algorithm, which takes into account the continuity of objective functions, derivatives, and integral operators, as opposed to mathematical methods that rely on beginning conditions.

3.1. Multi-Objective Strategy
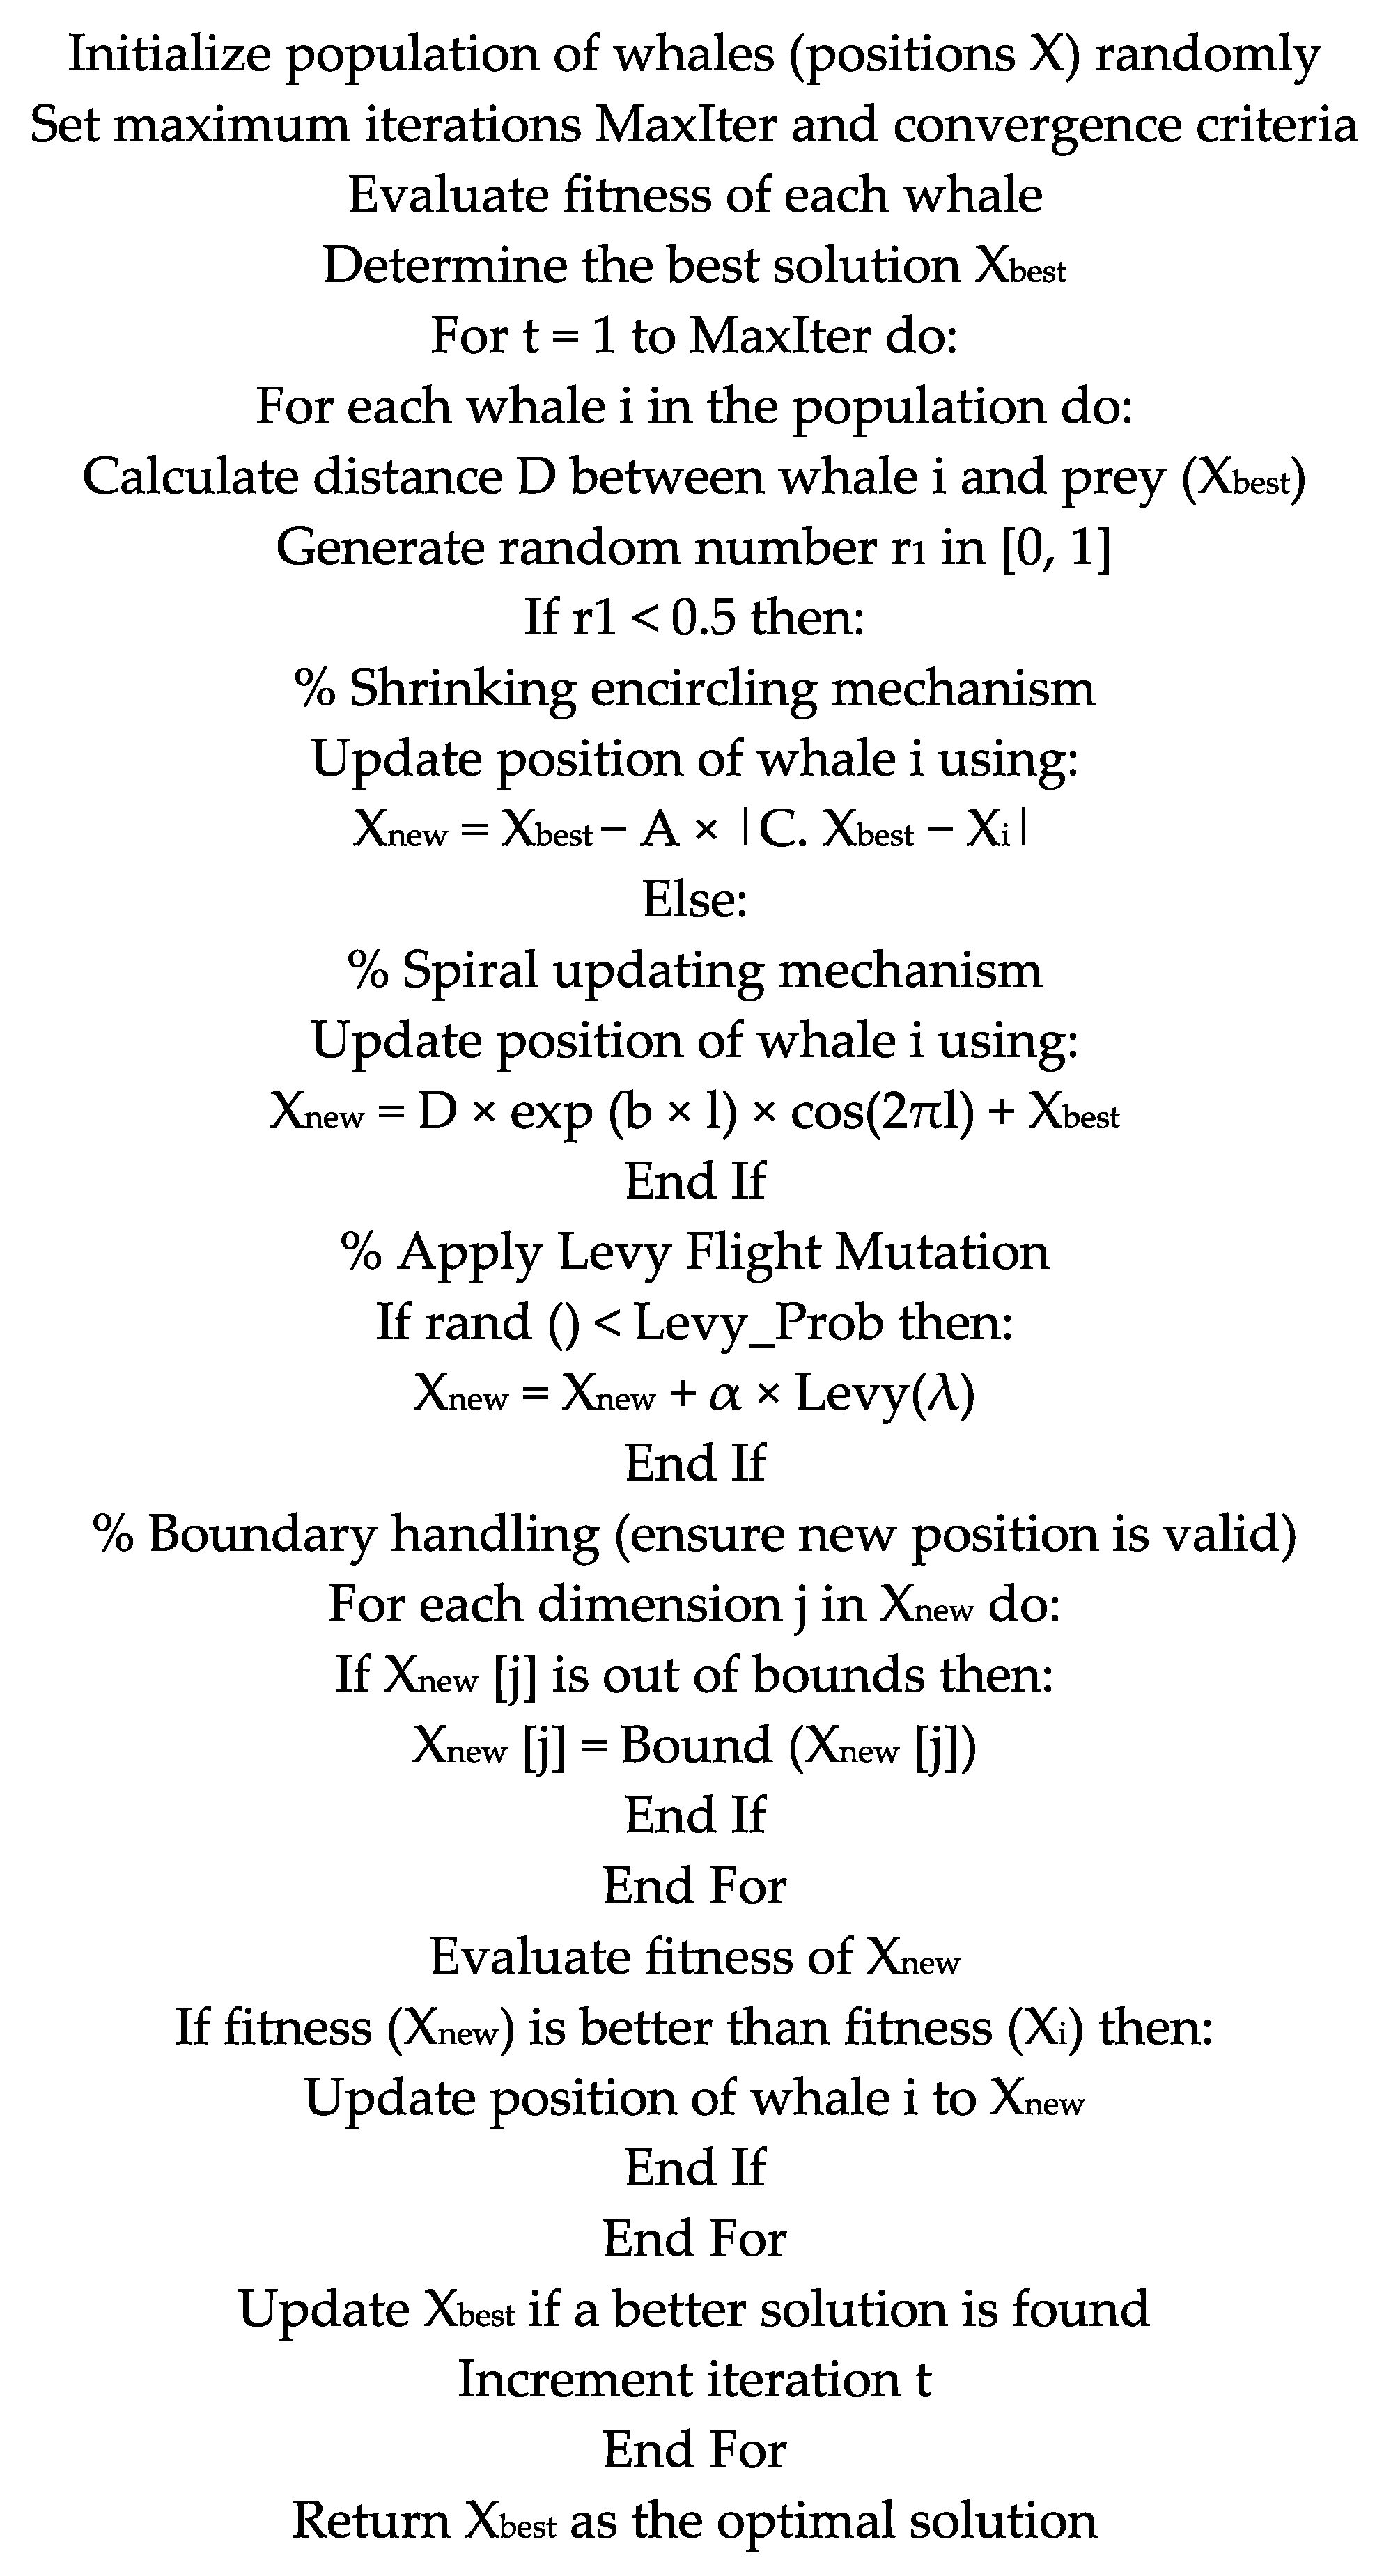
The following is a mathematical definition of a multi-objective optimization problem with inequality and equality constraints present:
M i n   f i X = f 1 X , f 2 X , f n X T g i ( X )   0 , h j ( x )     = 0
The Pareto-optimal solution concept replaces the optimal solution concept in multi-objective optimization [28]. When both requirements are met, X2 dominates the solution X1:
i 1 , 2 , N o b j ,       f i X 1 f i X 2
j 1 , 2 , N o b j ,       f j ( X 1 ) < f j ( X 2 )
During the optimization process, any Pareto solutions found are stored in an external memory called the repository. The optimization algorithm’s speed may decrease as the number of Pareto solutions increases. To avoid the heavy computational load, a fuzzy clustering approach is employed [28]. Accordingly, each objective function’s fuzzy membership function is as follows:
φ f i X = 1                                                                                                   f i X f i m i n 0                                                                                                 f i X f i m a x f i m a x f i X f i m a x f i m i n                                                                 f i m i n     f i X f i m a x
Based on (26), we sort the non-dominated solutions in the repository to identify the optimal compromise solution.
τ j = i = 1 n β i × φ f i X j j = 1 m i = 1 n β i × φ f i X j

3.2. Improved WOA

Based on the communal hunting behavior of humpback whales, the Whale Optimization Algorithm (WOA) is a metaheuristic optimization technique inspired by nature [30,31]. It looks for the best answers by imitating the whales’ special bubble-net hunting technique.
Important Mechanisms in WOA:
1. 
Encircling Prey:
WOA use the following method to update whale locations in the search space with respect to the prey, assuming that the current best solution represents the prey:
X t + 1 = X * t A . D
2. 
Bubble-Net Method of Attack:
This behavior is simulated using two methods:
Shrinking Encircling Mechanism: This method refines the search region by gradually lowering the A value.
Spiral Updating Mechanism: This mechanism simulates the helix-like movement of whales around their prey by generating a logarithmic spiral.
The following is used to update the positions:
X t + 1 = X / · e b l · cos ( 2 π l ) + X t
3. 
Phase of Exploration:
When the probability p leads to exploration rather than exploitation, whales randomly scan the space to avoid local optima [30,31]. This is accomplished by choosing solutions at random rather than depending only on the best one.
In this study, Levy flight is utilized as a complementary mechanism in the WOA to enhance the algorithm’s exploration capability and prevent it from getting trapped in local optima. This mechanism, by generating long and sudden random jumps, increases population diversity and efficiency in large search spaces. Additionally, it improves the exploitation of optimal points and provides an effective solution for complex problems with uncertainty. The explanation of the Levy distribution-based mutation in the improved WOA (IWOA) is as follows:
Levy Flight is a random search strategy that combines short and big steps with jumps that follow a heavy-tailed distribution. This jump method enhances search space exploration and keeps optimization algorithms from being stuck in local optima. The following is a mathematical representation of the Levy Flight mutation:
X n e w = X c u r r e n t + α · L e v y   ( λ )
Levy(λ) is a sample from the Levy distribution, defined as
L e v y   λ ~ x λ , 1 λ 3
The intensity of large leaps is controlled by the value λ in this formula. The IWO can more efficiently search the search space by avoiding local optima and identifying better optimal spots by implementing Levy Flight. The pseudocode for this method is shown in the Figure 1 below.

4. Simulation Results
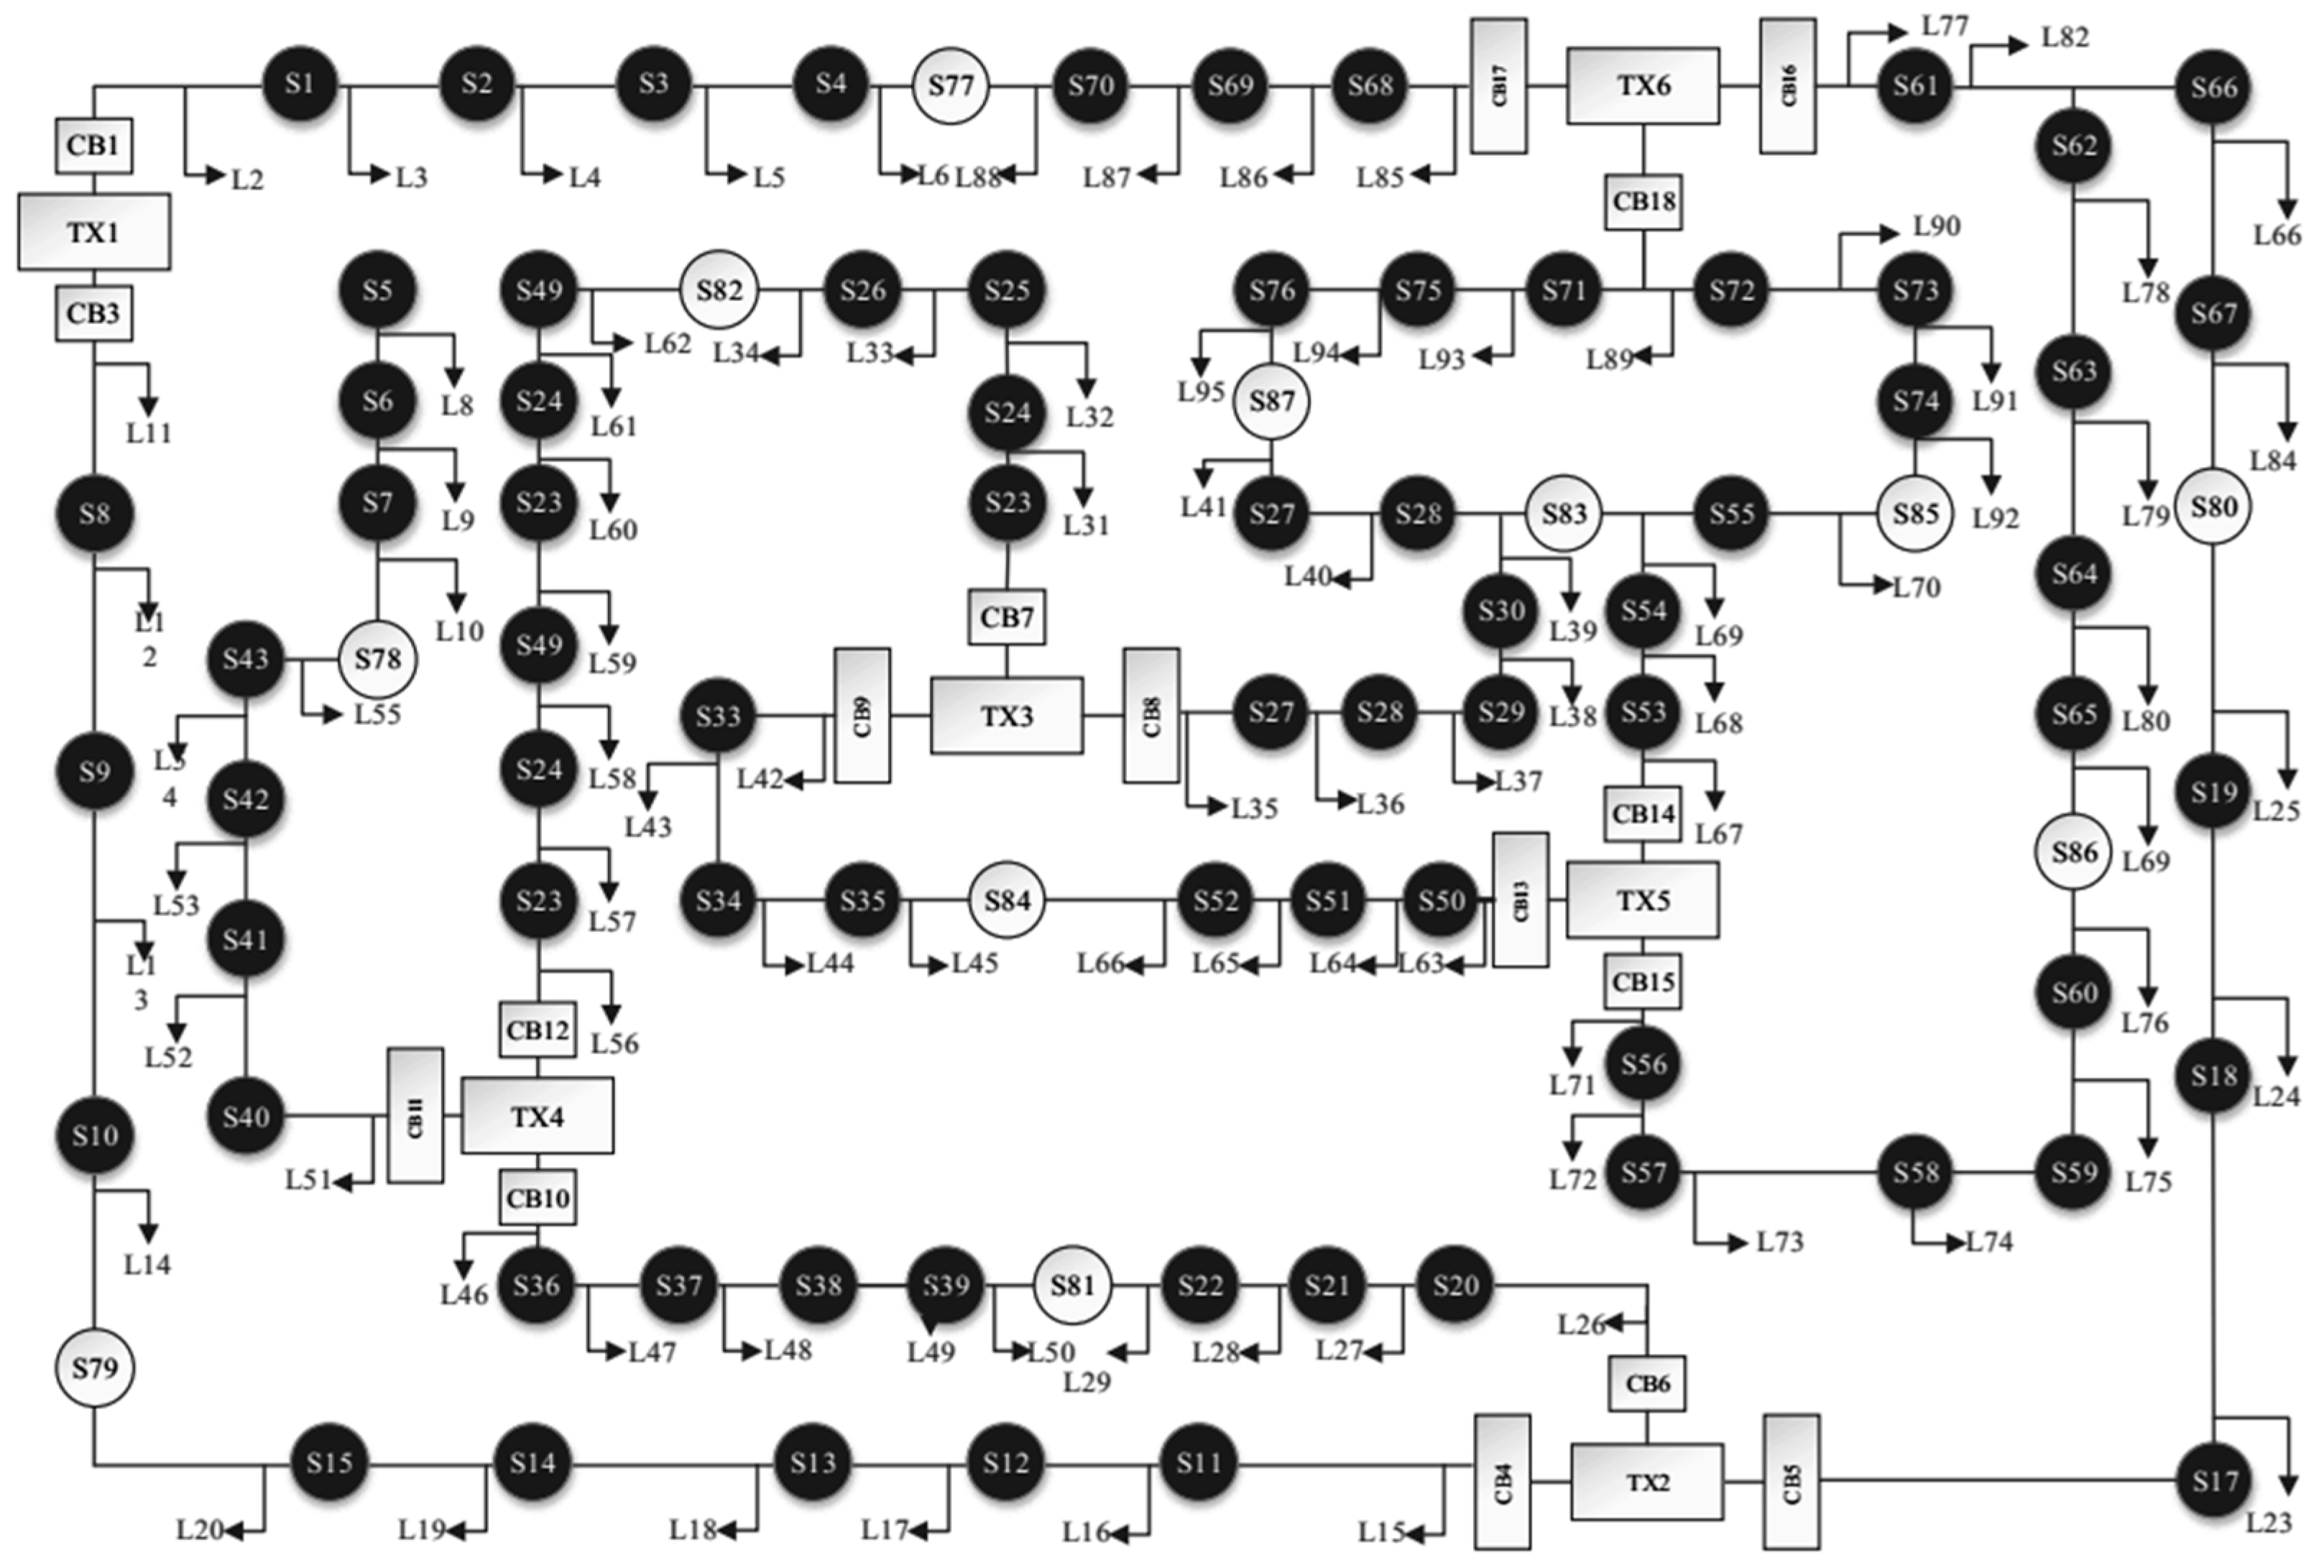
In this section, after introducing the test system, simulation results in two scenarios are presented and analyzed.

4.1. Case Study

It should be mentioned that a 95-node test system was introduced in this section to evaluate the suggested method for solving the considered optimization problem. The 95-node test system under study is shown in Figure 2 [32]. Three 1000 kW diesel generators (DGs) are located at buses #6, #6, #25, and #50; four 100 kVAr capacitors are installed at buses #10, #20, #34, #70; additionally, four EVCSs 250 kWh are located on buses #31, #45, #57, and #78. The capacity of each EVCS is four electric vehicles (EVs). It is also assumed that 75% of the EVs’ capacity will be used for G2V capability and the remaining 25% for V2G capability. The average hourly predicted load profile in the test network before and after the DRP implementation is shown in Figure 3. The MATLAB 2016b environment is used for all simulations. The IWOA method, the enhanced gravitational search algorithm (ESGA) [22], and the imperialist competitive algorithm (ICA) [22] are used to solve the suggested optimization issue in order to compare and validate the outcomes. The initial population and number of iterations for the proposed method are 400 and 100, respectively. The cost of the substation is USD 0.04 per kWh, while the costs for DGs and EVCSs are USD 0.043, USD 0.041, and USD 0.040 for heavy, middle, and base loads, respectively. The cost for capacitor units is USD 0.02 per unit, and the switching cost is USD 0.041 for each switch operation. The simulation results are shown in two scenarios below:

4.2. Scenario 1

In both single-objective and multi-objective frameworks, the DNR problem is resolved in this scenario when DG units, capacitors, and EVCSs are present. The optimization problem in this scenario has been solved without taking into account the impact of demand response and uncertainty. Table 1 displays the outcomes of this case as determined by the suggested approach. The single-objective optimization results for the operating cost and ENS functions are shown in Table 2 and Table 3 so that the outcomes of the suggested approach can be compared to those of alternative optimization techniques. Table 2 and Table 3 present the findings from 30 different tests. The optimal configuration of switches, the output power of DG units, capacitors, and the charge/discharge status of two EVCSs for ENS optimization are presented in Table 4 and Figure 4, Figure 5, Figure 6 and Figure 7 respectively. The output of the first and third EVCS is shown in this section. Electric vehicle charging and discharging at the charging station are shown by positive and negative numbers in Figure 6 and Figure 7.
The final row of Table 1 shows that the optimal objective function values obtained from the compromise solution exhibit a greater deviation from those of the single-objective optimizations. This is expected, as multi-objective optimization seeks a balanced trade-off between conflicting objectives, rather than optimizing each independently. As seen in Table 3 and Table 4, the proposed IWO algorithm demonstrates superior performance compared to other methods, particularly in reducing both ENS and operating costs. Specifically, Table 3 shows that the ENS achieved by the IWO algorithm improves upon the best solution of the competing methods by 4.6%, which is a noteworthy enhancement in terms of network reliability. Furthermore, the proposed method achieves an USD 88 reduction in total operating cost relative to the alternatives, contributing to more economical operation of the distribution network.
It is evident from Table 4 and Figure 4, Figure 5, Figure 6 and Figure 7 that the radial topology of the distribution network remains consistently preserved throughout the 24 h simulation period. Among the DG units, the one located at bus 6 demonstrates the highest power output of 815 kW at 1:00 AM, while the DG at bus 50 records the lowest output of only 50 kW at 10:00 PM. Regarding reactive power support, the capacitors at bus 20 and bus 70 show the maximum and minimum reactive power generation, producing 88 kVAr at 2:00 PM and 5 kVAr at 10:00 PM, respectively. This variation highlights the dynamic nature of reactive power compensation based on the network’s operational needs. In terms of EV charging behavior, the third and first EVs connected to the EVCS at bus 31 record the highest and lowest total energy intake over 24 h, amounting to 176.5 kW and 26 kW, respectively. Additionally, at the EVCS located at bus 57, the 14th EV achieves the highest net charging amount of 35.5 kW, while the 12th EV exhibits the highest net discharging (vehicle-to-grid contribution), amounting to −45.5 kW over the same time horizon.

4.3. Scenario 2

The DNR issue in the presence of DG units, capacitors, and EVCSs has been resolved in this scenario, just like in the last one. In contrast to the last scenario, both single-objective and multi-objective optimization now take into account the effects of uncertainty and the DR program. Table 5 shows the outcomes of single-objective and two-objective optimization taking only the DR program into consideration. While Table 6 shows the results of optimization taking into account both the DR program and uncertainty,. In order to meet DR program, 4% of the demand has been reduced from during peak hours (12:00 PM–14:00 PM) and shifting it to off-peak hours (10:00 AM–12:00 PM).
The optimal configuration of switches, the output power of DG units, capacitors, and the charge/discharge status of two EVCSs for two-objective optimization without uncertainty are presented in Table 7 and Figure 8, Figure 9, Figure 10 and Figure 11, respectively.
According to Table 7, the radial topology of the distribution network is preserved across all time intervals in this scenario, similar to the previous case. This consistency indicates that the applied control strategy and power flow coordination mechanisms successfully maintain the desired operational structure of the network under varying load and generation conditions throughout the day.
A comparison between scenarios one and two indicates that incorporating the DR program has improved reliability. For instance, the ENS has decreased by approximately 5% compared to the first scenario, which is directly related to enhanced reliability. Additionally, a noticeable reduction in operational cost is observed when incorporating the DR program in the second scenario. The operational cost in scenarios one and two are USD 136,535.23 and USD 136,215.23, respectively.
A comparison between Table 5 and Table 6 reveals that incorporating uncertainty into the optimization framework leads to a deterioration in the objective function values. For example, the ENS increases from 367.45 kWh/year in the deterministic case to 375.5 kWh/year when uncertainty is considered. This degradation stems from the fact that, under uncertainty, the optimization model adopts more conservative and risk-averse strategies to preserve system stability and reliability across a range of possible scenarios. Such an approach inherently restricts the feasible solution space by introducing additional constraints and robustness requirements. As a result, the optimization process may forgo more cost-effective or lower-ENS solutions that would only be valid under ideal or precisely known conditions. Furthermore, accounting for uncertainty often necessitates the deployment of supplementary resources—such as increased energy storage capacity or more resilient network configurations—which, in turn, elevate operational costs and reduce the overall optimality of the solution compared to the deterministic case.
As illustrated in Figure 8, Figure 9, Figure 10 and Figure 11, the distributed generation (DG) units at buses 6 and 25 recorded the lowest and highest power outputs between 5:00 and 6:00 AM, generating 75 kW and 880 kW, respectively. This variation highlights the influence of location-specific factors and demand profiles on DG unit performance during early morning hours. In terms of reactive power compensation, the capacitor unit at bus 10 exhibited both the lowest and highest values, generating 5 kVAr at 12:00 PM and 89 kVAr at 6:00 PM, respectively. This reflects the system’s dynamic reactive power requirements during midday and early evening, potentially driven by fluctuating load patterns and voltage regulation needs. Regarding EV activity, the seventh and ninth EVs at the EVCS installed at bus 45 registered the highest net charging and discharging amounts over the 24 h period, with energy transfers of 20.15 kW and −15 kW, respectively. Additionally, at the EVCS located at bus 78, the 16th EV achieved the highest total charging amount of 109.5 kW, while the 19th EV recorded the lowest, at 53.5 kW. These differences underscore the diversity in user behavior and mobility patterns, which significantly affect the overall impact of EVs on network loading and energy exchange.

4.4. Analysis of Pareto-Optimal Solutions

This study’s evaluation of the DNR problem as a multi-objective optimization problem is one of its primary objectives. Getting the non-dominated options is the first stage in creating the Pareto front, from which the system operator can select the solution that best suits his or her needs. In situations 1 and 2, the two-dimensional Pareto-optimal fronts produced by the suggested IWO method are displayed in Figure 12 and Figure 13, respectively. The red star in Figure 12 and Figure 13 represents the BCS that was achieved by applying Equation (26). It is important to note that operator preferences determine which BCSs are acquired.
All of the generated Pareto-optimal solutions, as depicted in Figure 12 and Figure 13, are non-dominated, which confirms the effectiveness of the proposed algorithm in addressing the complexities of the multi-objective DNR problem. An additional noteworthy observation is the shape and distribution of the Pareto fronts. The solutions are well spread across the objective space and include the extreme points corresponding to single-objective optimization outcomes. This indicates that the algorithm is capable of capturing a diverse set of trade-off solutions, allowing decision-makers to select from a wide range of feasible operating conditions based on their preferred objective prioritization.

5. Conclusions

This paper presents an effective methodology for addressing the DNR with the aim of energy management in the presence of EVCSs, DGs, and capacitors. Operational expenses and ENS are two of the main goals of the optimization problem, which is composed as a sophisticated multi-objective and nonlinear model. The WOA, which is renowned for its capacity to identify the best answers for complicated and multi-objective problems, has been used to tackle this challenging issue. The results show how these factors significantly affect system performance by combining sophisticated optimization approaches and comparing scenarios with and without demand response and uncertainty.
The main findings of this paper are summarized as follows:
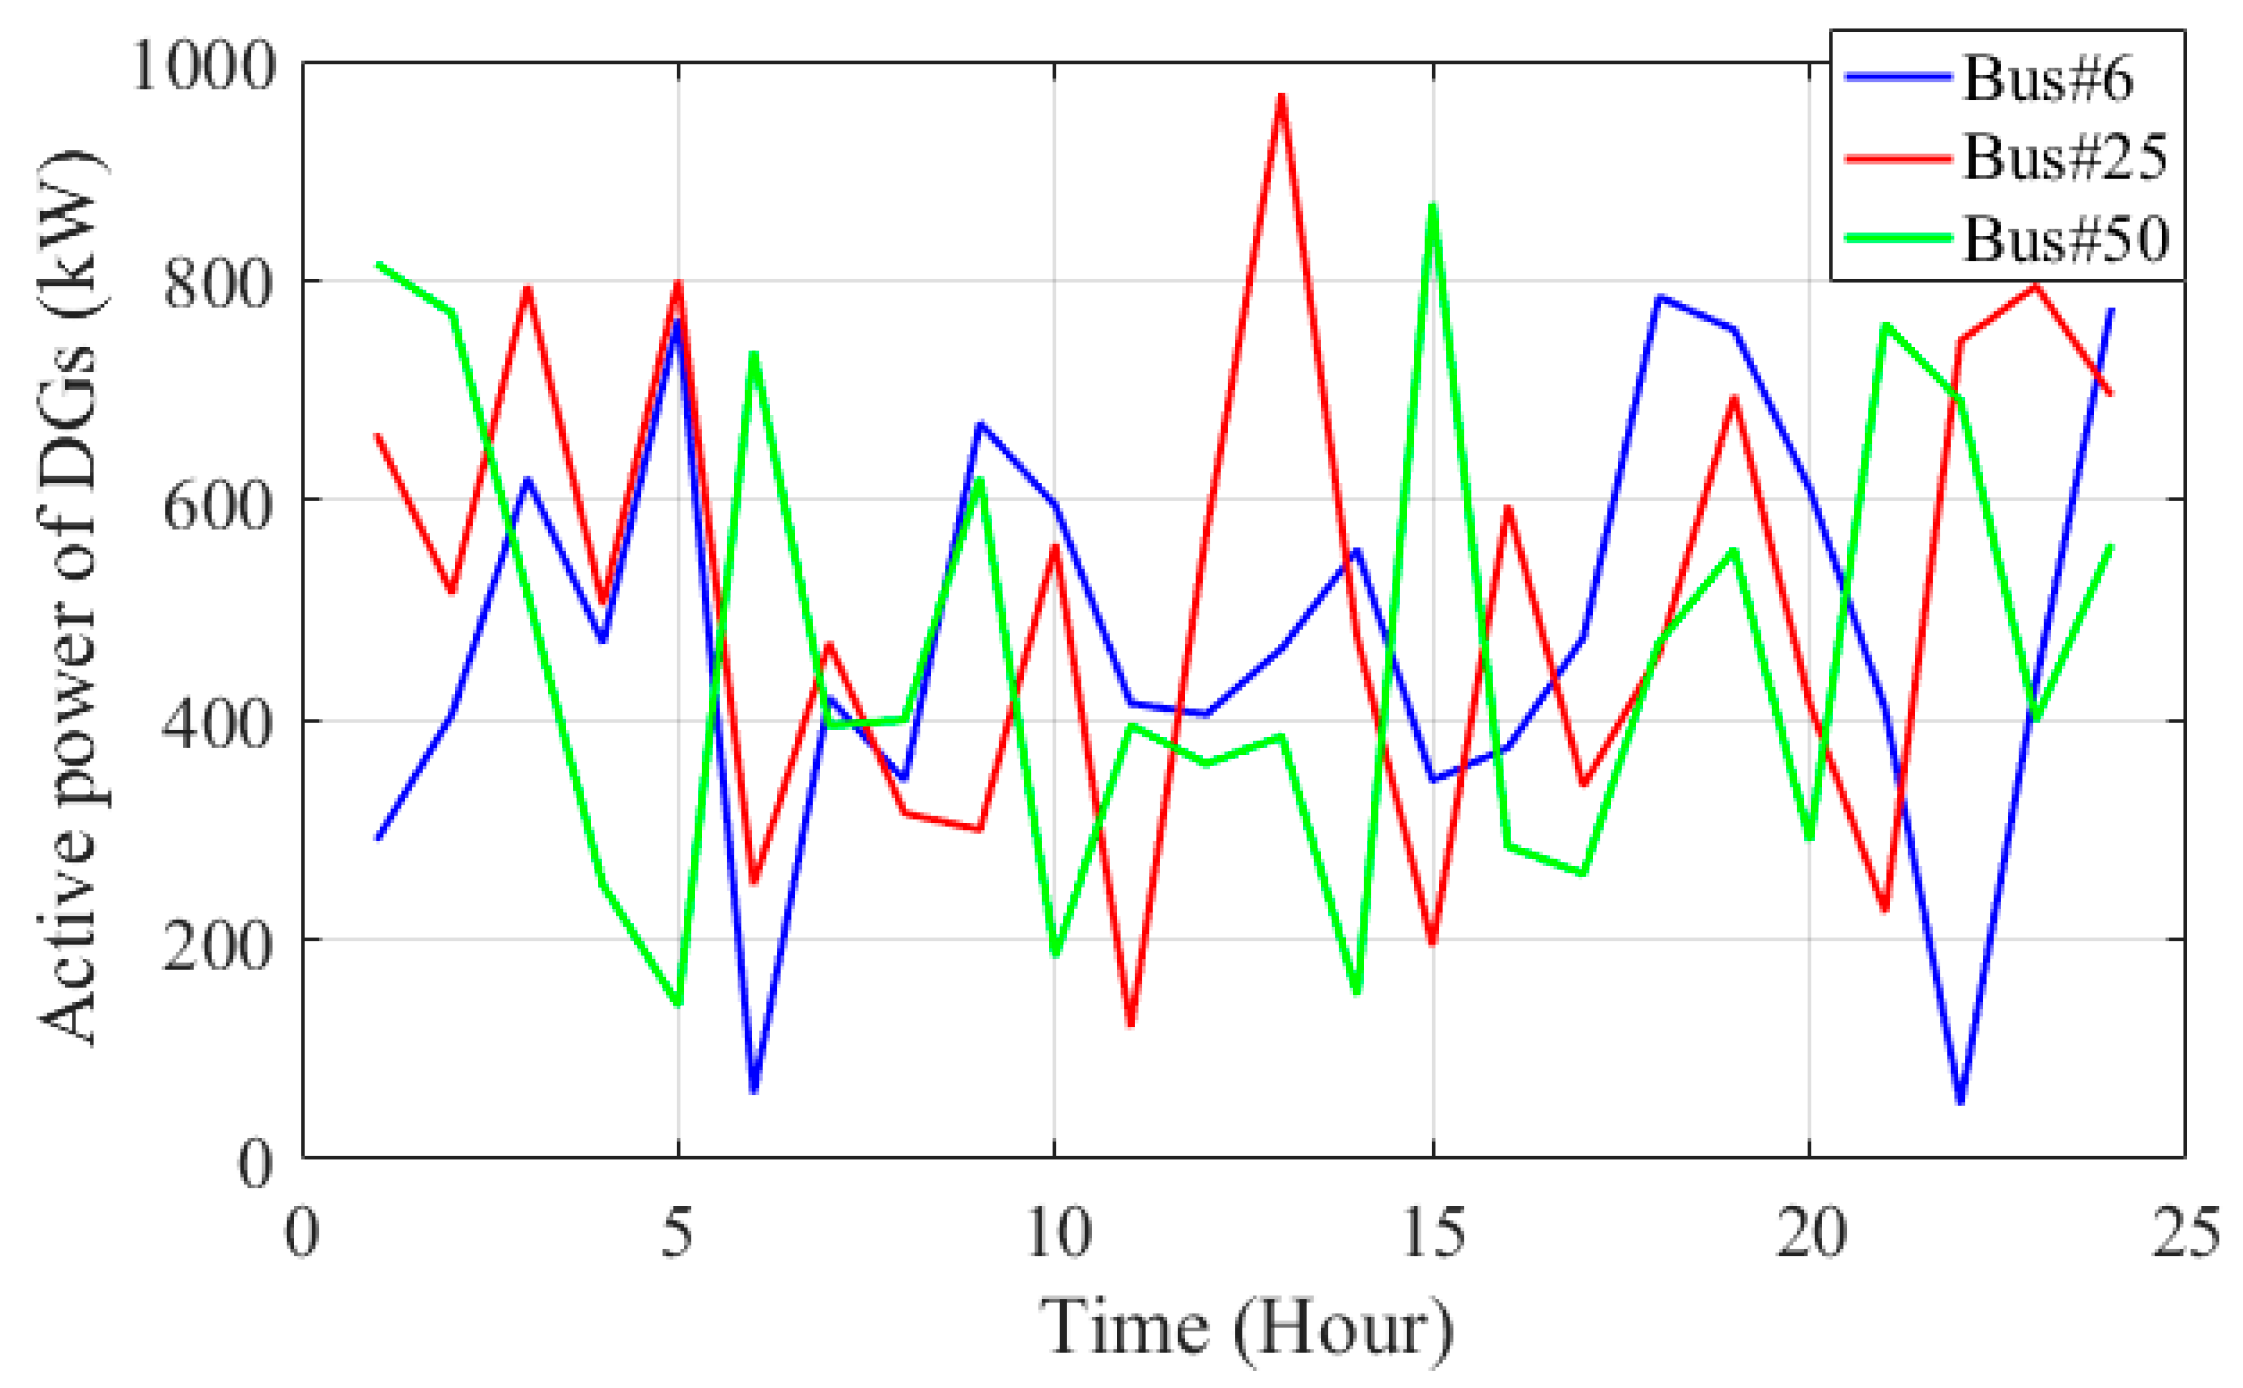
  • The proposed approach effectively optimizes energy management in distribution networks with EV charging stations, distributed generation (DGs), and capacitors through dynamic network reconfiguration.
  • The Whale Optimization Algorithm (WOA) successfully solves the complex multi-objective optimization problem by minimizing both operational costs and Energy Not Supplied (ENS). Compared to existing methods, the proposed algorithm achieves superior results by reducing total operating costs and improving system dependability.
  • Incorporating demand response (DR) programs enhances system reliability and significantly reduces Energy Not Supplied (ENS), even under uncertain operating conditions. By enabling flexible load adjustments and peak shaving, DR contributes to better load balancing and improved voltage profiles across the network, which is especially beneficial in scenarios with high variability in demand or renewable generation.
  • Although uncertainties necessitate more conservative decision-making to ensure system robustness, demand response mechanisms help mitigate their negative impacts on overall system performance. DR acts as a distributed and responsive resource that provides operational flexibility, allowing the system to maintain acceptable performance levels despite fluctuations in load profiles, renewable output, or market prices.
Limitations and Practical Challenges:
This study assumes certain patterns for EV arrivals and simplified models for DR implementation, which may not fully capture real-world complexities. Furthermore, practical deployment of the proposed algorithm requires consideration of hardware limitations and real-time adaptability within smart grid infrastructures. Computational demands and communication delays can affect implementation feasibility and should be addressed in future work.
Future Research Directions:
Future research can focus on developing adaptive dynamic reconfiguration methods that not only address the variability and intermittency of renewable energy sources through short-term forecasting but also integrate system protection considerations. Ensuring coordination between feeder switching actions and protection constraints is crucial to maintain system reliability and avoid unintended outages during reconfiguration. In addition, investigating the impact of communication delays, data loss, and cyber-physical threats on the reliability of dynamic reconfiguration is essential. Creating robust and secure control systems will enhance the resilience of distribution networks. Machine learning approaches, especially deep reinforcement learning, offer promising tools to predict grid conditions and automate feeder reconfiguration based on real-time data, reducing the need for manual rule-setting. Moreover, the practical implementation of the proposed methodology in real smart grid environments requires addressing challenges such as hardware requirements for real-time data acquisition and control, computational limitations of edge devices, and the adaptability of the algorithm for real-time operation. Finally, testing these strategies in hardware-in-the-loop (HIL) environments or with practical operational data can validate their effectiveness and facilitate their implementation in real-world distribution systems with electric vehicles and renewable energy.

Author Contributions

Methodology, H.L.; Software, H.L.; Investigation, M.H.N. and M.E.H.; Writing—original draft, H.L.; Writing—review & editing, M.H.N.; Supervision, M.E.H. All authors have read and agreed to the published version of the manuscript.

Funding

This research received no external funding.

Data Availability Statement

The data are not publicly available due to personal restrictions and privacy considerations. Reasonable requests for access may be considered by the corresponding author.

Conflicts of Interest

The authors declare no conflict of interest.

Abbreviations

P r i c e D G , i h   a n d   P r i c e S u b , s h The price of ith DG and the price of sth sub-station at hth time interval
P r i c e S w , k t Switching costs at the hth time interval
NDG and NswThe number of DG and the number of DG
P r i c e E V C S , r h   a n d   P r i c e C a p , l h The prices of kth EVCS and lth capacitor at hth time interval
U i , j and U i , j The total repair and restoration time for all upstream and downstream branches of the ith node
t i , j and t i , j The repair and restoration timeframes between nodes i and j
V, P i The group of nodes that a feeder supplies, the unsupplied load downstream of the ith point after a fault occurs
Nbus, NsourceThe number of nodes and substations
Qj and PjThe reactive and active powers that were injected into the ith bus
Yij and θ ijThe line’s amplitude and angle between the ith and jth nodes
Vi and δiThe voltage at node I and its angle
Vmin and VmaxThe bus’s permitted maximum and minimum voltages
I f , i and I f , i M a x The maximum current and amplitude of feeder i
LDG, PDGThe location of DG, the output of DG
NswitchThe number of switches
S0i and SiThe primary and secondary operating modes of the ith switch
Qmin and QmaxThe capacitor’s minimum and maximum allowable reactive power of lth capacitor
PEVCS, NcThe total power consumption of the EVCSs, the number of EVCSs in the network
pEVvThe power consumption of the EV v at the EVCS c
d0, ρ0The initial demand (USD/kWh), The spot electricity price (USD/kWh)
pDR(j) and p(j)The consumption load after to and before DR
hj (X) and gi (X)Equal and unequal constraints
τ i , βiThe fuzzy set of the ith objective function f i ( x ) , the weight of ith objective
f i m a x , f i m i n The objective function’s upper and lower bounds
m, nNumber of objective functions, number of non-dominant solutions
X * t Best position
A, DCoefficient vector, distance vector
b, lControl coefficient, random number in [−1,1]
Xnew, Xcurrentnew position after the jump, current position
αScaling factor controlling the jump intensity

References

  1. Rene, E.A.; Fokui, W.S.T.; Kouonchie, P.K.N. Optimal allocation of plug-in electric vehicle charging stations in the distribution network with distributed generation. Green Energy Intell. Transp. 2023, 2, 100094. [Google Scholar] [CrossRef]
  2. Maurya, P.; Tiwari, P.; Pratap, A. Enhanced secretary bird optimization algorithm for enhanced DG deployment and reconfiguration in electrical distribution networks to improve power system efficiency. Evol. Intell. 2025, 18, 52. [Google Scholar] [CrossRef]
  3. Tran, T.T.; Truong, K.H.; Vo, D.N. Stochastic fractal search algorithm for reconfiguration of distribution networks with distributed generations. Ain Shams Eng. J. 2020, 11, 389–407. [Google Scholar] [CrossRef]
  4. Nguyen, T.T.; Nguyen, T.T.; Nguyen, N.A.; Duong, T.L. A novel method based on coyote algorithm for simultaneous network reconfiguration and distribution generation placement. Ain Shams Eng. J. 2021, 12, 665–676. [Google Scholar] [CrossRef]
  5. Shaheen, A.; Elsayed, A.; El-Sehiemy, R.A.; Abdelaziz, A.Y. Equilibrium optimization algorithm for network reconfiguration and distributed generation allocation in power systems. Appl. Soft Comput. 2021, 98, 106867. [Google Scholar] [CrossRef]
  6. Sunil, A.; Venkaiah, C. Multi-objective adaptive fuzzy campus placement based optimization algorithm for optimal integration of DERs and DSTATCOMs. J. Energy Storage 2024, 75, 109682. [Google Scholar] [CrossRef]
  7. Maurya, P.; Tiwari, P.; Pratap, A. Electric eel foraging optimization algorithm for distribution network reconfiguration with distributed generation for power system performance enhancement considerations different load models. Comput. Electr. Eng. 2024, 119, 109531. [Google Scholar] [CrossRef]
  8. Bagheri, A.; Bagheri, M.; Lorestani, A. Optimal reconfiguration and DG integration in distribution networks considering switching actions costs using tabu search algorithm. J. Ambient. Intell. Humaniz. Comput. 2021, 12, 7837–7856. [Google Scholar] [CrossRef]
  9. Kamel, S.; Khasanov, M.; Jurado, F.; Kurbanov, A.; Zawbaa, H.M.; Alathbah, M.A. Simultaneously distributed generation allocation and network reconfiguration in distribution network considering different loading levels. IEEE Access 2023, 11, 105916–105934. [Google Scholar] [CrossRef]
  10. Sadeghi, S.; Jahangiri, A.; Shamim, A.G. Optimal reconfiguration of a smart distribution network in the presence of shunt capacitors. Electr. Eng. 2024, 106, 603–614. [Google Scholar] [CrossRef]
  11. Sanam, J. Optimization of planning cost of radial distribution networks at different loads with the optimal placement of distribution STATCOM using differential evolution algorithm. Soft Comput. 2020, 24, 13269–13284. [Google Scholar] [CrossRef]
  12. Biswal, S.R.; Shankar, G.; Elavarasan, R.M.; Mihet-Popa, L. Optimal allocation/sizing of DGs/capacitors in reconfigured radial distribution system using quasi-reflected slime mould algorithm. IEEE Access 2021, 9, 125658–125677. [Google Scholar] [CrossRef]
  13. Saw, B.K.; Bohre, A.K.; Jobanputra, J.H.; Kolhe, M.L. Solar-DG and DSTATCOM concurrent planning in reconfigured distribution system using APSO and GWO-PSO based on novel objective function. Energies 2022, 16, 263. [Google Scholar] [CrossRef]
  14. Raut, U.; Mishra, S. Enhanced sine–cosine algorithm for optimal planning of distribution network by incorporating network reconfiguration and distributed generation. Arab. J. Sci. Eng. 2021, 46, 1029–1051. [Google Scholar] [CrossRef]
  15. Yu, J.; Guo, Q.; Li, L. Optimal configuration of distributed wind turbines with D-STATCOMs for improving voltage recovery capability of sensitive nodes. Electr. Eng. 2024, 106, 1079–1091. [Google Scholar] [CrossRef]
  16. Huy, T.H.B.; Van Tran, T.; Vo, D.N.; Nguyen, H.T.T. An improved metaheuristic method for simultaneous network reconfiguration and distributed generation allocation. Alex. Eng. J. 2022, 61, 8069–8088. [Google Scholar] [CrossRef]
  17. Wang, H.J.; Pan, J.S.; Nguyen, T.T.; Weng, S. Distribution network reconfiguration with distributed generation based on parallel slime mould algorithm. Energy 2022, 244, 123011. [Google Scholar] [CrossRef]
  18. Singh, J.; Tiwari, R. Real power loss minimisation of smart grid with electric vehicles using distribution feeder reconfiguration. IET Gener. Transm. Distrib. 2019, 13, 4249–4261. [Google Scholar] [CrossRef]
  19. Stojanović, B.; Rajić, T.; Šošić, D. Distribution network reconfiguration and reactive power compensation using a hybrid Simulated Annealing–Minimum spanning tree algorithm. Int. J. Electr. Power Energy Syst. 2023, 147, 108829. [Google Scholar] [CrossRef]
  20. Parihar, S.S.; Malik, N. Network reconfiguration in the presence of optimally integrated multiple distributed generation units in a radial distribution network. Eng. Optim. 2024, 56, 679–699. [Google Scholar] [CrossRef]
  21. Wang, J.; Wang, W.; Wang, H.; Zuo, H. Dynamic reconfiguration of multiobjective distribution networks considering DG and EVs based on a novel LDBAS algorithm. IEEE Access 2020, 8, 216873–216893. [Google Scholar] [CrossRef]
  22. Kumar, N.; Quadri, I.A.; Ahsan, S. Multi-objective based performance analysis of optimal reconfiguration and DSTATCOM allocation in distribution networks. Electr. Power Syst. Res. 2025, 248, 111868. [Google Scholar] [CrossRef]
  23. Samal, P.; Panigrahy, D. Simultaneous feeder reconfiguration, DSTATCOM allocation, and sizing using seagull optimization algorithm in unbalanced radial distribution systems. Soft Comput. 2024, 28, 6403–6421. [Google Scholar] [CrossRef]
  24. Kalidasan, M.; Sekar, T.G.; Mohanasundaram, T. Power loss reduction and voltage profile enhancement by reconfiguration of radial distribution system with hybrid optimization method. Therm. Sci. Eng. Prog. 2025, 57, 103105. [Google Scholar] [CrossRef]
  25. Santos, A.; McGuckin, N.; Nakamoto, H.Y.; Gray, D.; Liss, S. Summary of Travel Trends: 2009 National Household Travel Survey; United States Department of Transportation: Washington, DC, USA, 2011. [Google Scholar]
  26. Samadi, M.; Nikkhah, M.H.; Lotfi, H. Electric vehicles and the operation of multi-carrier energy systems in the smart grid: A review study. Int. J. Ambient. Energy 2024, 45, 2331231. [Google Scholar] [CrossRef]
  27. Sharma, K.C.; Jain, P.; Bhakar, R. Wind power scenario generation and reduction in stochastic programming framework. Electr. Power Compon. Syst. 2013, 41, 271–285. [Google Scholar] [CrossRef]
  28. Lotfi, H.; Ghazi, R. Optimal participation of demand response aggregators in reconfigurable distribution system considering photovoltaic and storage units. J. Ambient. Intell. Humaniz. Comput. 2021, 12, 2233–2255. [Google Scholar] [CrossRef]
  29. Nikkhah, M.H.; Samadi, M.; Lotfi, H.; Vafadoost, P. Agent-based machine learning assessment on real data for improvement of the daily load factor using demand response program. Sustain. Energy Grids Netw. 2024, 40, 101584. [Google Scholar] [CrossRef]
  30. Mirjalili, S.; Andrew, L. The whale optimization algorithm. Adv. Eng. Softw. 2016, 95, 51–67. [Google Scholar] [CrossRef]
  31. Mirjalili, S.; Hatamlou, A.; Yang, X.-S. Mixed variable structural optimization using grey wolf optimizer. Eng. Optim. 2016, 48, 663–686. [Google Scholar]
  32. Azizivahed, A.; Narimani, H.; Naderi, E.; Fathi, M.; Narimani, M.R. A hybrid evolutionary algorithm for secure multi-objective distribution feeder reconfiguration. Energy 2017, 138, 355–373. [Google Scholar] [CrossRef]
Figure 1. Pseudocode of the proposed method.
Wevj 16 00412 g001
Figure 2. A 95-node test system’s single line diagram.
Wevj 16 00412 g002
Figure 3. The test network’s average hourly load both before and after the DRP.
Wevj 16 00412 g003
Figure 4. Obtained DG units’ active power.
Wevj 16 00412 g004
Figure 5. Obtained capacitors’ reactive power.
Wevj 16 00412 g005
Figure 6. Active power of EVCS 1 during charging and discharging.
Wevj 16 00412 g006
Figure 7. Active power of EVCS 3 during charging and discharging.
Wevj 16 00412 g007
Figure 8. Obtained DG units’ active power.
Wevj 16 00412 g008
Figure 9. Obtained capacitors’ reactive power.
Wevj 16 00412 g009
Figure 10. Active power of EVCS 2 during charging and discharging.
Wevj 16 00412 g010
Figure 11. Active power of EVCS 4 during charging and discharging.
Wevj 16 00412 g011
Figure 12. Pareto front for two-objective optimization in scenario 1.
Wevj 16 00412 g012
Figure 13. Pareto front for two-objective optimization in scenario 2.
Wevj 16 00412 g013
Table 1. Best obtained results by the proposed IWO method.
Case StudiesENS (kWh/Year)Operational Cost (USD)
ENS optimization381.25137,858.25
Operational cost optimization485.21136,535.23
Two-objective optimization (BCS)386.25137,453.25
Table 2. Obtained results by different methods for ENS optimization.
AlgorithmsBest
Solution
Mean ValueWorst
Solution
Standard
Deviation
CPU Time (s)
ESGA396.43406.25421.209.3882
ICA390.35395.15406.316.296
IWO381.25386.24396.154.5188
Table 3. Obtained results by different methods for operational cost optimization.
AlgorithmsBest SolutionMean ValueWorst
Solution
Standard
Deviation
CPU Time (s)
ESGA136,620.56136,667.52136,725.4233.3664
ICA136,599.23136,641.15136,695.5631.3578
IWO136,535.23136,575.23136,620.5229.5969
Table 4. List of open switches obtained for ENS optimization.
HourOpen Switches
Sw1Sw2Sw3Sw4Sw5Sw6Sw7Sw8Sw9Sw10Sw11
1441153925526686557628
2440132282506660747583
37740122248526665858727
47043152026331960747127
56840152249521986547630
6143793748351765558729
737793825526758558730
8343153949521986553230
9378153682521960727683
1044388149506765557130
11704383946346665557628
12443152226841960748730
137043153944351965557628
14441153949846765557130
1545792082526764747683
16340132249506658557583
17243153849526765553283
18443153982521965747530
1934293849528065743228
2035122225356765727630
2147793748351964558783
22707153845346760747530
237040153926356665558783
24443103823526665747530
Table 5. Best obtained results by the proposed IWO method without uncertainty.
Case StudiesENS (kWh/Year)Operational Cost (USD)
ENS optimization367.45137,545.25
Operational cost optimization453.21136,215.23
Two-objective optimization (BCS)373.25137,196.19
Table 6. Best obtained results by the proposed IWO method with uncertainty.
Case StudiesENS (kWh/Year)Operational Cost (USD)
ENS optimization374.15138,256.16
Operational cost optimization473.16136,273.19
Two-objective optimization (BCS)379.25137,379.56
Table 7. List of open switches obtained for two-objective optimization.
HourOpened Switches
Sw1Sw2Sw3Sw4Sw5Sw6Sw7Sw8Sw9Sw10Sw11
1777148182841956557530
2684098126336663557530
3440158123848064557628
47078143723846764858730
5440142226506764553230
66878153949351965857530
7687152226356764553230
8707893624506763553228
947103726841962557630
1047153926521960553230
11478103744841958723230
1246143782846765857683
13707152282356758553229
14478153926841964853227
15478152226351664557530
1646153782336764728729
1715153682356759853230
186878143626346765723283
1945153945846764857130
207043793726506756747627
21705153949506760557683
22707158182351963743283
23478792226846764557527
247078142249501964857630
Disclaimer/Publisher’s Note: The statements, opinions and data contained in all publications are solely those of the individual author(s) and contributor(s) and not of MDPI and/or the editor(s). MDPI and/or the editor(s) disclaim responsibility for any injury to people or property resulting from any ideas, methods, instructions or products referred to in the content.

