Abstract
The rapid evolution of the transport industry requires a deep understanding of user preferences for emerging mobility solutions, particularly carsharing (CS) and autonomous vehicles (AVs). This study employs machine learning techniques to model transport mode choice, with a focus on traffic safety perceptions of people towards CS and privately shared autonomous vehicles (PSAVs). A stated preference (SP) survey is conducted to collect data on travel behavior, incorporating key attributes such as trip time, trip cost, waiting and walking time, privacy, cybersecurity, and surveillance concerns. Sociodemographic factors, such as income, gender, education, employment status, and trip purpose, are also examined. Three gradient boosting models—CatBoost, XGBoost, and LightGBM are applied to classify user choices. The performance of models is evaluated using accuracy, precision, and F1-score. The XGBoost demonstrates the highest accuracy (77.174%) and effectively captures the complexity of mode choice behavior. The results indicate that CS users are easily classified, while PSAV users present greater classification challenges due to variations in safety perceptions and technological acceptance. From a traffic safety perspective, the results emphasize that companionship, comfort, privacy, cybersecurity, safety in using CS and PSAVs, and surveillance significantly influence CS and PSAV acceptance, which leads to the importance of trust in adopting AVs. The findings suggest that ensuring public trust occurs through robust safety regulations and transparent data security policies. Furthermore, the envisaged benefits of shared autonomous mobility are alleviating congestion and promoting sustainability.
1. Introduction
The transport sector has undergone a significant transformation in recent decades, driven by rapid technological advancements that have introduced novel mobility solutions [1,2]. Among these innovations, carsharing (CS) services and full autonomous vehicles (AVs) have gained substantial attention due to their potential to reshape urban mobility [3,4]. These emerging transport mode services offer alternatives to traditional car ownership by enhancing efficiency, safety, sustainability, and flexibility. The CS and the AVs are anticipated to be essential in creating sustainable and intelligent transportation systems as urbanization increases, traffic congestion grows, and environmental concerns rise [5,6]. Furthermore, one of the most important factors impacting AV user acceptance is safety concerns, which continue to be a major factor in travel behavior and decision-making [7,8].
CS services provide users with on-demand vehicle access, thereby reducing the number of private vehicles on the road, alleviating congestion, and mitigating environmental impacts, especially at city centers [9,10]. Meanwhile, AVs have the potential to significantly increase road safety, fuel economy, and traffic efficiency [11,12]. By minimizing human error, one of the leading causes of road accidents, autonomous driving technology has the potential to significantly reduce traffic fatalities and injuries [13]. However, the perceived safety of AVs remains a major barrier to widespread acceptance, as users express concerns regarding system reliability, cybersecurity threats, and the ability of automated systems to handle complex driving scenarios [14,15].
Numerous studies have examined the factors influencing the acceptance of CS and AVs, emphasizing elements such as convenience, cost, environmental awareness, and trust in technology [16,17]. The interaction between safety perceptions, behavioral tendencies, and demographic characteristics in shaping mode choice remains underexplored. Conventional discrete choice models have provided valuable insights into user preferences [18,19]. Conventional discrete choice models often fail to capture the complexity of decision making in the evolving transport landscape. In order to overcome these constraints, machine learning (ML) has become a powerful analytical technique that makes it possible to analyze large, diverse datasets and find hidden patterns and interdependencies among the variables driving transport decisions [20,21,22]. Previous research has demonstrated the effectiveness of ML models, ranging from traditional classifiers such as logistic regression and decision trees to advanced algorithms like Random Forest, gradient boosting, and Neural Networks, in improving prediction accuracy for mode choice behavior [21,23,24]. Brahimi et al. [25] use ML models and deep learning to predict the usage of carsharing vehicles at stations. Hu, Tang, Tong and Zhao [21] examine the spatiotemporal properties of electric vehicles in carsharing using ML models. They found a connection between land use and the use of electric carsharing vehicles.
The AVs will be used differently by stakeholders, such as shared autonomous vehicles (SAVs) where riders share the same vehicle, or the AV fleet is shared by the public [26]. In this study, privately shared autonomous vehicles (PSAVs) stands for an AV owned by a company or any relevant representative body that can be used like a private taxi (i.e., the car is shared, and the ride is private) [27]. It is noted that PSAVs represent full automation (Level 5) according to the SAE [28], allowing users to experience autonomous mobility, whereas traditional CS services rely entirely on human drivers. The distinction between these two services requires attention by travelers, where influential factors are considered, such as safety concerns due to the technology. Furthermore, studying the preferences of people towards these two services is demanded.
ML analysis is a powerful method in different fields, as shown in Table 1. However, studies that apply ML to analyze the traveling variables, sociodemographic variables, and safety-related concerns influencing the acceptance of CS and PSAVs services are underexplored. Previous studies have focused on using statistical and mathematical models that have limitations in prediction due to the complexity of problems. The added value of this research to the literature is summarized in applying three high-performance machine learning (ML) models—CatBoost, XGBoost, and LightGBM—to classify user choices between CS and PSAVs. Furthermore, applying ML models overcomes the limitations of other statistical methods. Moreover, this study has not been conducted before, where the factors that impact the acceptance of travelers to CS and PSAVs are examined using ML models.
This study aims to identify the key determinants influencing transport mode selection, assess the role of safety-related concerns in shaping user preferences, and evaluate the comparative performance of machine learning algorithms in predicting travel behavior. By integrating demographic, behavioral, and trip-related variables, this research seeks to provide actionable insights for researchers, urban planners, vehicle manufacturers, and mobility service providers. This research answers the following questions:
- Q1: Do people’s selection of PSAVs and CS vary by demographic and traveling variables?
- Q2: How do travelers inside cities perceive the safety of CS and PSAVs?
- Q3: Do machine learning models predict whether a traveler is likely to accept CS or PSAVs based on safety perceptions?
- Q4: What are the factors that impact the acceptance of CS and PSAVs?
This research article is organized as follows: Section 1 presents the introduction, which includes previous research gaps, current research contributions, and research aims. The literature review is presented in Section 2, which presents previous related research. The methodology, which explains the tools and techniques used, is presented in Section 3. Section 4 presents the results and discussions. Section 5 presents this study’s summary and conclusions.
2. Related Work
The technology of vehicles is developing fast. Despite the current unavailability of AVs on the market, pilot projects have been launched to study the feasibility, safety, and user acceptance of AVs and autonomous shuttles, such as the Smart Columbus EasyMile shuttle program in Ohio [29], the May Mobility deployments in Ann Arbor [30], Michigan, and the CAVForth autonomous bus service in Scotland [31]. Additionally, the general public lacks knowledge about these pilot projects, and they are more involved in automation level 4, such as Cruise and Waymo in San Francisco. In this section, related research works are discussed and presented.
In recent years, CS and AV services have attracted the attention of researchers and city planners as a practical way to address issues with transport in cities, such as traffic, parking restrictions, and environmental concerns [32,33]. Safety considerations play a crucial role in shaping travel behavior, particularly in emerging mobility services such as CS and PSAVs [34]. Extensive research has explored the impact of travel behavior variables, sociodemographic variables, and safety perceptions on transport mode choices, addressing concerns related to technological reliability, accident risks, cybersecurity, and personal security [35,36]. This section provides an overview of previous relevant studies on traveler preferences towards CS and AVs, and safety-related factors influencing CS and AV adoption while also examining the role of machine learning in predicting travel behavior.
A study by Kyriakidis et al. [37] was conducted to analyze the public perceptions of AVs based on survey responses from eight European countries. The authors found that safety remains a primary determinant of AV adoption, with demographic factors such as age, gender, education, and household size influencing willingness to use AVs. Vulnerable road users, including the elderly and individuals with disabilities, expressed a preference for human supervision in AVs, highlighting broader concerns related to reliability, cost, and driving experience. These insights suggest that regulatory frameworks should consider both safety and user comfort in AV implementation. A study by Stoiber et al. [38] explored user preferences for pooled AVs through an online choice experiment with 709 participants in Switzerland. The study assessed both short- and long-term mobility decisions based on a scenario of full AV market penetration. The study results indicate that 61% of respondents preferred shared AVs over private autonomous cars, reinforcing the potential of pooled AV services to reduce private vehicle dependence. Additionally, integrated measures addressing cost, travel time, and comfort were identified as critical factors in promoting shared mobility solutions [38]. Zhou et al. [39] conducted a study to examine consumer preferences toward CS and the potential adoption of shared automated vehicles (SAVs) through a stated preference survey in Australia. A mixed logit model was applied, and the study reveals substantial preference heterogeneity, with prior experience in carsharing increasing multimodal travel choices while reducing private vehicle reliance. The authors show that elderly people, women, and non-drivers—who are generally viewed as major SAV beneficiaries—show lower levels of acceptability, underlining potential challenges to broad adoption and the importance of focused policy measures.
In a study by Kolarova et al. [40], the travelers were more likely to use AVs than conventional cars. Hao and Yamamoto [32] found that car owners are less likely to use CS than people who do not own cars in urban areas. The AVs are still not on the market, and researchers use mathematical models based on questionnaires and surveys to understand the behavior of people towards AVs as part of a transport system. It was found that personal experiences impact the acceptance of CS and AVs, as stated Müller [41]. Schoettle and Sivak [42] examined how travelers in the USA, UK, and Australia deal with the availability of AVs in the market. The authors found that preference towards AVs changes across gender; for example, women are more willing to use AVs than men. Moreover, a study by Howard and Dai [43] states that men who are highly educated, own luxury cars, and are high-income earners are more willing to use AVs compared to other groups. Additionally, studies by by Bansal et al. [44] and Stoma et al. [45] state that men and high-income people are more likely to use SAVs. Women hesitate to buy AVs due to safety factors; therefore, they are less likely to pay more money for automation, as stated by Louw et al. [46].
Scholars use mixed logit models to understand the expected behavior of people when AVs are in the market. Chee et al. [47] find that AVs are accepted by users if the trip time, trip cost, and waiting time are competent. In Japan, a study by Das et al. [48] shows that around 20–30% of trips might change when AVs are in the market, based on the results of a nested logit model. Moreover, the author states that AVs are impacted by job types; for example, part-time workers are more willing to use AVs. In shared mobility, CS is considered an option that attracts travelers in urban areas. The CS is considered a cost-effective option in cities more than privately owned cars, where the cost of parking and using infrastructure is eliminated [49,50]. Pawełoszek [51] shows that CS is a solution to traffic congestion in city centers where people can rent a car for a short period, parking is utilized, and traffic congestion is alleviated. Efthymiou et al. [52] show that CS users are among the youngest and educated ones. Meanwhile, the study of [53] shows that CS is used by students who own a driving license and have low income, and men are the main users of CS. Zhou, Zheng, Whitehead, Washington, Perrons, Page and Practice [39] conducted a study to examine consumer preferences toward CS and the potential adoption of shared automated vehicles (SAVs) through a stated preference survey in Australia. A mixed logit model was applied, and the study reveals substantial preference heterogeneity, with prior experience in carsharing increasing multimodal travel choices while reducing private vehicle reliance. The authors show that elderly people, women, and non-drivers—who are generally viewed as major SAV beneficiaries—show lower levels of acceptability, underlining potential challenges to broad adoption and the importance of focused policy measures.
Lee [54] analyzes the changing dynamics of transportation mode choice in the AV era through a combination of discrete choice modeling (DCM) and machine learning (ML) techniques. A stated choice experiment in the U.S. reveals that AV market shares are influenced by a range of socio-demographic and behavioral factors. The study utilizes stochastic gradient boosting to enhance feature interpretability, uncovering non-linear relationships between user characteristics and mode choice. Additionally, methodological limitations in ML-based mode choice modeling were critically assessed, highlighting areas for future refinement. Pineda-Jaramillo et al. [55] compare traditional multinomial logit models with ML approaches in travel mode choice prediction. In their study, based on household survey data from the Aburrá Valley, Colombia, they find that an optimized gradient boosting model outperformed both logit and Random Forest models. Key determinants of mode choice included travel time, parking availability, vehicle ownership, age, and gender, demonstrating the potential of machine learning as a policy tool for promoting sustainable transport options. Teusch et al. [56] prepare a systematic literature review of machine learning applications in shared mobility, covering methods, datasets, and decision-support systems. The authors highlight the gaps in ML studies on carsharing and ride hailing. Brahimi, Zhang, Dai and Zhang [25] study the carsharing data to predict the usage of vehicles at stations. The authors compare ML models and deep learning models. They find that CNN-LSTM achieved the highest prediction accuracy; weather conditions are more influential than time-based variables. Baumgarte et al. [57] compare 20 groups of users of carsharing, and they find that these groups are different in the spatial and temporal behavior usage of carsharing. The results support a tailored business model. Wang and Ross [58] compare the multinomial logit model and the XGBoost in predicting travel mode choice. The machine learning model XGBoost outperforms the multinomial logit model in prediction and accuracy. A study by Zhao et al. [59] proposed ML techniques that are used to examine response heterogeneity, a high-accuracy classifier to predict mode-switching behavior. The study emphasizes that drivers are sensitive to having more pickups on roads than other people who use other transport modes. Hu, Tang, Tong and Zhao [21] examined the spatiotemporal characteristics of electric vehicles in carsharing. The authors apply ML techniques, and the findings demonstrate a connection between the behavior of carsharing users and land use. Qin et al. [60] studied commuters’ preferences for AVs, and they found that travel experience improves AV perception. Huang et al. [61] applied ML techniques to study the behavior of SAV users with the supply. The authors found that the zone-based RL relocation outperforms car-based; this aligns with urban travel behavior and heterogeneity.
In line with the power of the ML model in the transport field, Alencar et al. [62] examined demand forecasting in carsharing services using LSTM, Prophet, and ensemble models (e.g., XGBoost, CatBoost). Multivariate LSTM with weather data significantly reduces error. Boosting models perform best for short-term (12 h) forecasts, while Prophet and SARIMA excel in long-term (7-day) predictions. The study highlights the benefits of incorporating external variables. Martín-Baos et al. [63] conduct a systematic and methodologically rigorous comparison of machine learning (ML) models—including XGBoost, Random Forests, and Deep Neural Networks (DNNs)—against multinomial logit models across both real-world and synthetic datasets. The authors advocate for hybrid approaches that combine the strengths of both ML and RUM frameworks and propose AutoML for efficient algorithm selection and the integrated estimation of behavioral parameters. This study emphasizes the complementary role of ML in enhancing, rather than replacing, traditional econometric models in travel mode choice analysis. Zhao et al. [64] conduct a methodologically rigorous comparison of machine learning (ML) and logit models for travel mode choice, using SP survey data. While Random Forest achieved superior predictive accuracy over multinomial and mixed logit models, behavioral outputs (e.g., marginal effects, arc elasticities) from ML—particularly tree-based models—are often inconsistent or behaviorally implausible unless adjusted. Both approaches generally aligned in variable influence direction and importance. The study highlights a tradeoff between predictive performance and behavioral interpretability, suggesting that ML may serve as an exploratory complement to logit models in travel behavior research. Fafoutellis et al. [65] examined the user acceptability of Autonomous Mobility-on-Demand services with ride sharing using interpretable machine learning. Employing Random Forests and gradient boosting on survey data from Athens, the study achieved over 80% prediction accuracy. Key determinants include travel attributes, mobility, AV-perception profiles, and demographics. Findings reveal that weather, schedule flexibility, and commuter status influence willingness to share and pay, supporting the utility of explainable ML in transport behavior modeling. Zhu et al. [66] proposed AMGC-Seq2Seq, a novel deep learning model integrating multi-graph convolution and attention mechanisms to predict multistep flows in carsharing systems. By simultaneously capturing spatial and temporal dependencies, the model outperforms existing methods on a large-scale real-world dataset. The study underscores the efficacy of joint spatiotemporal modeling for accurate demand forecasting.
In sustainability, AVs and CS participate in the reduction in greenhouse gas emissions as well as promote eco-friendly transport modes, as stated by Hao and Yamamoto [32]. Particularly, the transport sector is the cause of almost one-third of the greenhouse gas emissions in the world, as stated by the WHO, because of the use of internal combustion engines, traffic congestion, and the rise in car ownership worldwide. Furthermore, using CS and AVs, which are on-demand transport systems, can help alleviate the negative impact of conventional transport modes as well as promote sustainable travel behavior in cities [33]. CS and AVs’ influences are realized in the reduction in the pollution resulting from alleviating traffic congestion, increasing the efficiency of fuel, electric vehicles, less parking, the development of engines, and optimizing the fleet size of AVs and CS [33,67]. Table 1 summarizes the methods and the main variables used in the relevant research.

Table 1.
Previous relevant studies.
Table 1.
Previous relevant studies.
| Reference | Description | Methods | Main Variables |
|---|---|---|---|
| Zhou, Zheng, Whitehead, Washington, Perrons, Page and Practice [39] | Examination of consumer preferences toward CS and the potential adoption of SAVs | Discrete choice modeling | Travel time attributes, trip cost attributes, transport mode variables, sociodemographic variables |
| Kolarova, Steck and Bahamonde-Birke [40] | Assessment of the effect of autonomous driving on the value of travel time savings | Discrete choice modeling | Travel time attributes, trip cost attributes, perceptions towards AVs, transport mode variables, sociodemographic variables |
| Hao and Yamamoto [32] | Review study on SAV, AV, and car sharing | Systematic review | User preferences, safety, user experiences |
| Müller [41] | Technology acceptance of autonomous vehicles, battery electric vehicles, and carsharing | Technology Acceptance Model, Partial Least Squares Structural Equation Modeling | Objective usability, innovations, perceived usefulness of the vehicle, environmental protection, and enjoyment |
| Schoettle and Sivak [42] | The acceptance of people to AVs | Descriptive statistical analysis | Safety, willing to pay, attitudinal perception |
| Howard and Dai [43] | Exploration of the perceptions of people towards AVs | Descriptive statistical analysis | Sociodemographic variables, attitudinal variables |
| Bansal, Kockelman and Singh [44] | Perception of people of AVs | Discrete choice modeling | Sociodemographic, travel behavior, technological familiarity, and attitudinal variables |
| Stoma, Dudziak, Caban and Droździel [45] | Automotive industry users and their opinions on the AVs | Survey-based research design | Sociodemographic, awareness, perception, and willingness to use new technology |
| Louw, Madigan, Lee, Nordhoff, Lehtonen, Innamaa, Malin, Bjorvatn and Merat [46] | The willingness of travelers to use different functions of AVs | Survey design and statistical analysis | Sociodemographic, experience with Advanced Driver Assistance Systems (ADAS) |
| Chee, Susilo, Wong and Pernestål [47] | The willingness to pay for using AVs | Structural equation modeling | Sociodemographic, travel behavior variables, and attitudinal variables |
| Das, Sekar, Chen, Kim, Wallington and Williams [48] | The impact of AVs on travel time | Discrete choice modeling | Sociodemographic, travel behavior variables, attitudinal variables, time use variables |
| Pawełoszek [51] | The barriers facing carsharing users | Descriptive statistics and sentiment analysis | User rating, gender, response time, application updates |
| Lee [54] | Analysis of the changing dynamics of transportation mode choice in the AV | Machine learning and discrete choice modeling | Sociodemographic variables, traveling behavior variables, perception and attitude towards AVs, transport mode variables |
| Pineda-Jaramillo, Arbeláez-Arenas and Development [55] | Exploration of the commuter preferences towards AVs | Mixed logit model; sensitivity analysis | Travel time/cost, AV perception, ridesharing, commuting behavior, AV familiarity |
| Brahimi, Zhang, Dai and Zhang [25] | Investigation of predicting transport mode choice in urban areas | ML models (gradient boosting model), and discrete choice modeling | Travel time, parking type at the destination, age, the number of motorized vehicles per household, and gender |
| Baumgarte, Brandt, Keller, Röhrich and Schmidt [57] | Predicting the usage of vehicles of carsharing fleets at stations | Machine learning and deep learning | Car usage history, environmental conditions, and temporal information |
| Qin, Yu and Zhang [60] | Carsharing users and analyzing usage patterns | Clustering and segmentation of carsharing user data; spatial usage pattern analysis | User characteristics, spatial behavior, frequency, usage mode (station-based vs. free-floating) |
| Hu, Tang, Tong and Zhao [21] | The relationship between the behavior of electric vehicle carsharing and land use | Interpretable ML on EVCARD data (50k EVs); clustering of temporal patterns and land-use influence | Trip records, land use (healthcare, lifestyle, culture, business), temporal usage |
| Huang, Liu, Zhang, Liu and Hu [61] | The behavior of SAV users based on the parking space | RL-based SAV relocation with car/zone agents | Parking use, relocation profit, historical demand, zone classification (residential, industrial, etc.) |
| Alencar, Pessamilio, Rooke, Bernardino and Borges Vieira [62] | Demand forecasting for different carsharing models (station-based and free-floating) | LSTM (uni- and multivariate), Prophet, XGBoost, CatBoost, LightGBM, SARIMA | Historical carsharing demand; meteorological data (temperature, precipitation) |
| Martín-Baos, López-Gómez, Rodriguez-Benitez, Hillel and García-Ródenas [63] | A systematic comparison of ML and Random Utility Models (RUMs) for travel mode choice prediction and behavioral analysis | Multinomial logit model, DNN, RF, XGBoost, SHAP, WTP estimation; AutoML; synthetic data benchmarking | Transport mode attributes, socio-demographics |
| Zhao, Yan, Yu and Van Hentenryck [64] | A comparison for travel mode choice modeling | Multinomial logit, mixed logit; Random Forest; partial dependence plots; marginal effects; arc elasticities. | Transport mode-specific attributes; socio-demographic variables |
| Fafoutellis, Mantouka, Vlahogianni and Oprea [65] | Modeling of user acceptability and mode choice for Autonomous Mobility-on-Demand (AMoD) services with on-board ridesharing under different weather scenarios | Interpretable machine learning (Random Forest, gradient boosting), permutation feature importance, partial dependence plots | Travel time, cost, walking time, weather, user mobility profile, AV perception, demographic variables |
| Zhu, Luo, Liu, Fan, Song, Yu and Du [66] | Addressing multistep flow prediction in carsharing systems | Attention-based multi-graph convolutional sequence-to-sequence (AMGC-Seq2Seq) | Temporal and spatial flow data, graph-based relational data between stations |
In summary, this research applies a novel approach where CS and PSAVs are studied using ML models. Similar studies that have used machine learning are limited. Moreover, the previous studies demonstrate statistical and mathematical models to study the preferences of people towards CS and AVs. Moreover, a lot of previous studies show that ML models are superior compared to discrete choice modeling and other statistical methods. Limited studies focus solely on CS and AVs. Studies that focus on travel mode choice mainly used discrete choice modeling and survey design. The traditional methods have limitations in prediction and accuracy because of the complexity of the problem. The limitations of the traditional statistical methods due to the complexity of research problems concerning AVs are overcome by machine learning models. In this study, the safety perceptions of travelers in urban areas, traveling factors, sociodemographic variables of travelers in urban areas of Budapest, Hungary, are studied. Moreover, the travelers’ behaviors towards CS and PSAV are examined. This study fills the gap in the literature where there is a scarcity of research that finds the impact of certain factors on the choice of CS and PSAV services using machine learning.
This study employs machine learning techniques—CatBoost, XGBoost, and LightGBM—to analyze the factors influencing mode choice between CS and PSAVs. By integrating demographic, behavioral, and safety-related variables, this approach aims to provide a comprehensive understanding of the complex decision-making processes involved in adopting these emerging mobility solutions.
3. Methodology
This section presents the methods used in conducting this research. The methodology is divided into two subsections as shown in Figure 1, as follows: data collection and data analysis.
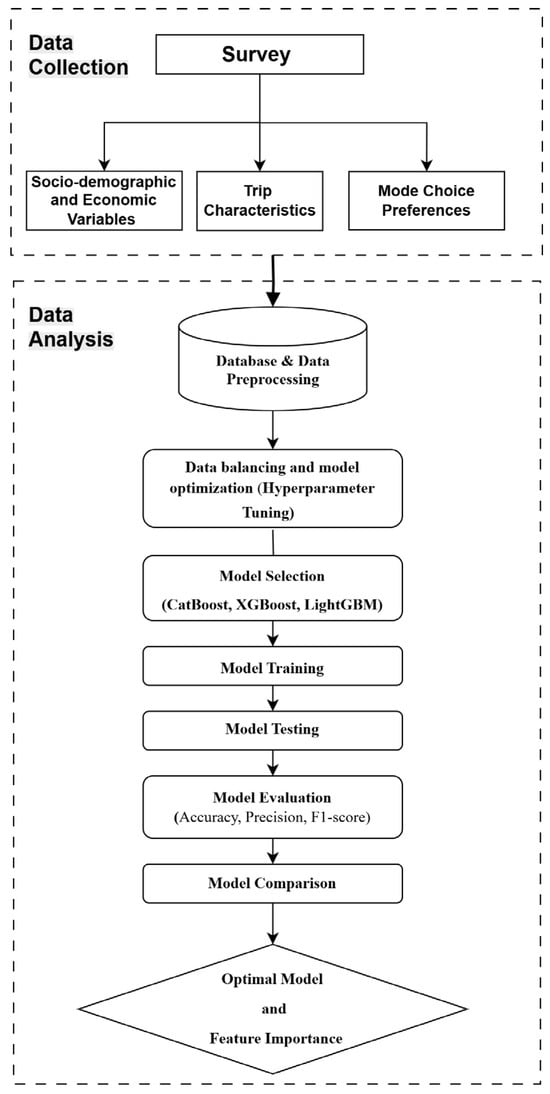
Figure 1.
Research approach.
3.1. Data Collection
The dataset used in this study was taken from a stated preference (SP) survey conducted online in 2021 in Budapest, Hungary. A total of 1840 responses were used in this research. The dataset encompasses both numerical and categorical variables, with columns that describe user preferences, transport mode choices, and socio-demographic features. The SP survey contains three parts: sociodemographic variables, main trip characteristics, preferred factors during travel, and transport mode alternatives. It is worth mentioning that the ethical practices, such as participants’ privacy and anonymity, were considered when the survey was distributed and presented based on Ethics and Data Protection document by European Commission [68], and Hungarian Academy of Sciences’ Science Ethics Code [69].
The collected data includes the following variables that are grouped in sections, as shown in Table 2. Sociodemographic variables, trip characteristics, preferences towards travel, and transport alternatives based on specific attributes were collected.

Table 2.
The SP survey contents.
The survey questions are shown in Table 3 and can be retrieved from URL: https://jhamadneh.limequery.com/463516?lang=en (accessed on 20 January 2025).

Table 3.
The SP survey questions.
3.1.1. Descriptive Statistics
The number of received responses is 1840 after filtering the data. The sociodemographic data include income, job, educational level, age, gender, and car ownership. In total, 9.30% of age groups are 15–24 years old, 84.7% are 25–54 years old, 4.5% are 55–64 years old, and 1.6% are 65 years old and above. People with low income represent 27.20% of the respondents, while middle-income respondents are 29.40%. The proportion of high-income respondents is 30.70%. Respondents who have work are 70.70% of the respondents, working either full-time, part-time, or self-employed. Students represent 13.10% of the survey participants, retired people are 3.80% of the participants, unemployed resp are 8.00%, and other categories are 4.20% of the participants. Female participants are 44.70%, and male participants are 55.30%. In car ownership, 58.8% of participants own cars. In total, 38.00% of participants hold high graduate studies, while 42.20% hold undergraduate studies. In total, 11.20% are high school holders, and only 8.6% hold different education levels.
- Q1: Do people’s selection of PSAVs and CS vary by demographic and traveling variables?
Table 4 shows how travelers’ preferences change across age groups. Age group of 25–34 years is more likely to use CS and PSAVs than other groups.

Table 4.
Travelers’ choices across age groups.
Table 5 shows the number of responses towards CS and PSAV per trip purpose. For example, 8.64% of responses demonstrate that educational trips are more preferred to be made by CS than PSAVs, while 8.42% of responses demonstrate that educational trips are more preferred to be made by PSAVs than CS. It is noted from Table 5 that travelers have small differences in using CS and PSAVs in their travel to educational trips. On the contrary, there are differences in using CS and PSAVs to and from home, shopping, leisure, and work trips. Shopping and work trips are preferred to be made by PSAVs, while home and leisure trips are preferred to be made by CS.

Table 5.
Trip purpose by CS and PSAVs.
Figure 2 and Figure 3 show the distribution of responses across gender types. It is shown that female participants are more likely than male participants to use PSAVs and CS for educational and entertainment trips than male participants.
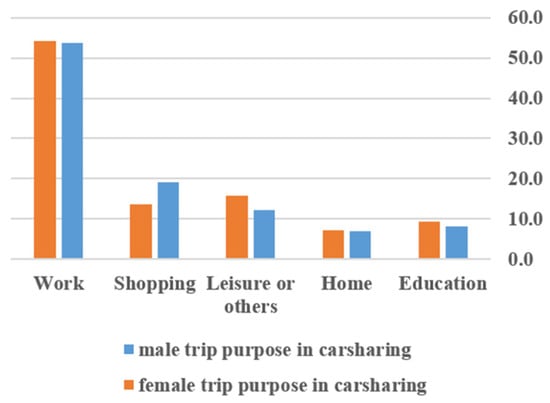
Figure 2.
Trip purpose by CS across gender.
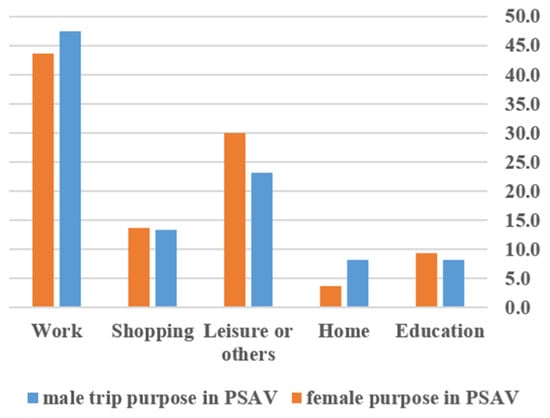
Figure 3.
Trip purpose by PSAV across gender.
Figure 4 shows the traveler’s transport modes and income classes. It is shown that various transport modes are used across different classes of income. For example, a car as a passenger is used by high-income people, a car as a driver is mainly used by high- and middle-income classes, a bike is used by high-income people, public transport is mainly used by low-income people, and walking is used by high- and middle-income people.
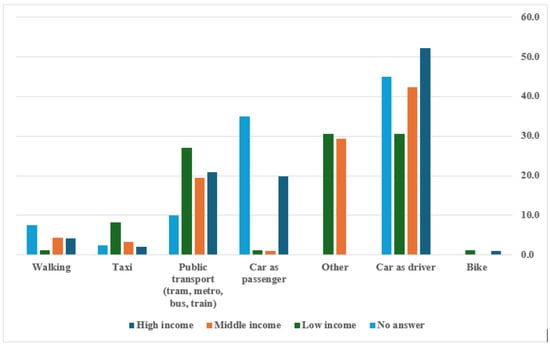
Figure 4.
Income classes of respondents across travelers’ current transport mode.
Figure 5 presents transport mode margins where travelers select to conduct their main trips in urban areas. This share demonstrates that people are more willing to choose CS over PSAVs.
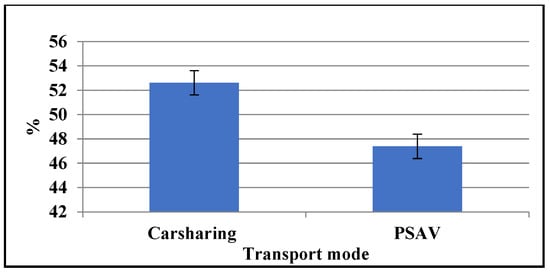
Figure 5.
Transport mode shares by travelers.
Figure 6 presents the preferences of travelers towards CS and PSAV regarding whether the camera is installed on board or not. The selection of travelers demonstrates that travelers choose CS over PSAV when a surveillance camera is installed on board. On the other hand, there are still considerable shares of using PSAVs in their travel to their main trips when camera is not installed on board. The factors that impact the preferences of people are explained by the result of machine learning.
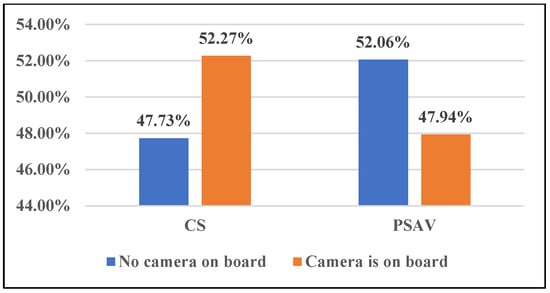
Figure 6.
Transport mode shares by travelers by the availability of cameras on board.
- Q2: How do travelers inside cities perceive the safety of CS and PSAVs?
Figure 7 and Figure 8 show the preferences of travelers on their main trip when they choose to travel by CS and PSAVs, respectively. The classifications are as follows: 1—Extremely not important, 2—Moderately not important, 3—Little not important, 4—Mildly not important, 5—Partially not important, 6—Partially important, 7—Mildly important, 8—Little more important, 9—Moderately important, and 10—Extremely important. It is shown that large percentage of people choose safety preferences (safety, reliability, and privacy) as priority when choosing CS and PSAVs in conducting trips inside urban areas. Travelers do not see companion onboard as a safety issue. This demonstrates that travelers are open to social communication, they feel comfortable with ride sharing, or they pre-choose companions to travel with.
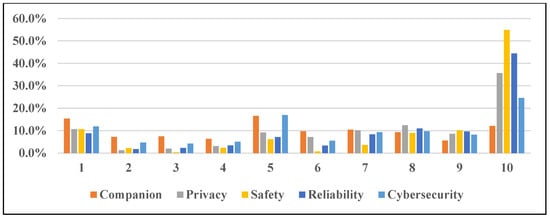
Figure 7.
CS and safety preferences of travelers in urban areas.
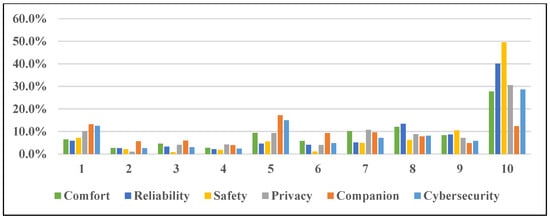
Figure 8.
PSAV and safety preferences of travelers in urban areas.
Figure 9 shows the preferences of people driving or riding to their main trips in urban areas. It is shown from Figure 9 that companion is the least important factor based on the number of responses (48.1% of responses based on scale 6 and more), while safety occupies the highest level of importance, followed by reliability (79.5% and 78.2% of responses, respectively, based on scale 6 and more). Privacy is the third important factor (71.2% of responses based on scale 6 and more), and comfort and cybersecurity are nearly equally important (69.2% and 59.0% of responses based on scale 6 and more).
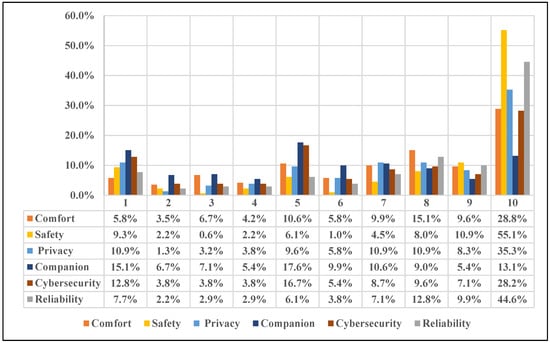
Figure 9.
Safety preferences of travelers on their main trip in urban areas.
Figure 10 demonstrates the differences in preferences across CS and PSAVs. People show higher importance of CS safety factors (physical safety, reliability, comfort, privacy, companion, and cybersecurity).
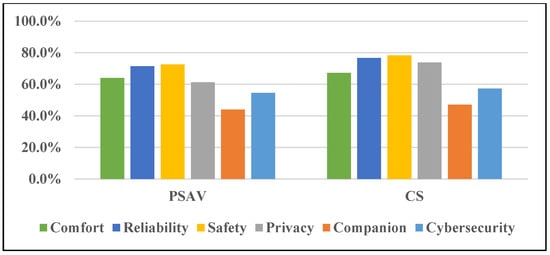
Figure 10.
Safety preferences of travelers across CS and PSAVs.
3.1.2. Data Processing
In the data collection, categorical variables were encoded using Label Encoding to transform non-numeric features into a numeric form that is consistent with the input format of machine learning models. Whether a passenger chooses CS or PSAVs is the desired variable. As seen in Figure 11, a correlation matrix is created to examine the connections between the attributes and the target variable. The correlation matrix shows the strength and direction of correlations between variables. This analysis provides important insights into how different factors, such as trip cost, waiting time, and sociodemographic variables (e.g., income and education), are interrelated. Therefore, key features are identified that strongly influence user preferences and subsequently focus on the most relevant predictors in the ML models.
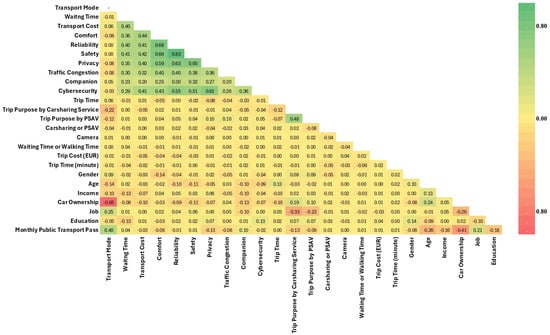
Figure 11.
Correlation matrix.
To assess multicollinearity and identify potential associations among input variables and the target, a correlation matrix was constructed, as illustrated in Figure 11. This matrix quantifies the pairwise linear relationships between all continuous variables, offering an initial diagnostic of feature interactions prior to model development. The strength and direction of these correlations, ranging from strongly positive to strongly negative, enable the identification of redundant or highly collinear predictors, which may adversely affect model interpretability or lead to overfitting in certain algorithms, particularly those sensitive to correlated inputs (e.g., linear models). Importantly, this preliminary analysis aids in highlighting key features, such as trip cost, waiting time, and select sociodemographic factors (e.g., income, education) that exhibit notable associations with each other and with the dependent variable. This information serves as a foundational step for refining the feature selection process and informing the application of machine learning models by emphasizing variables with substantive behavioral relevance while mitigating potential multicollinearity effects.
3.1.3. Data Balancing and Model Optimization
The Synthetic Minority Over-Sampling Technique (SMOTE) was applied. SMOTE is used to alleviate the impact of class imbalance observed within the dataset [70]. SMOTE improves class distribution by generating synthetic instances of the minority class. SMOTE prevents bias toward the majority class in the predictive model [70]. This method improves model stability and generalizability by ensuring a more equitable representation of both classes within the training set [71]. Furthermore, optimizing the hyperparameters of XGBoost, LightGBM, and CatBoost is a critical step in enhancing model performance [72]. Various hyperparameter tuning methodologies exist, including Grid Search, Random Search, Evolutionary Algorithms, and Bayesian Optimization [73]. Grid Search and Evolutionary Algorithms perform an exhaustive search across the parameter space, where their computational cost can be prohibitive. Random Search can produce a well-approximated configuration but does not ensure the identification of a globally optimal solution while being computationally more efficient [74]. In this study, Grid Search, including multiple trials, is utilized to thoroughly optimize and refine the booster parameters of XGBoost, LightGBM, and CatBoost hyperparameters through intently iterating through key elements within the training dataset. Such systematic tuning improves model generalization, predictive accuracy, and computational efficiency. Together with SMOTE for class balancing and fine tuning of hyperparameters, this methodology guarantees that the resulting predictive models are robust, well-calibrated, high-performing, and significantly reduce the risk of overfitting and underfitting.
3.2. Data Analysis: Model Selection and Training
Data analysis includes three ML classifiers, model selection, and model training to be used in predicting the travelers’ preferences towards CS and PSAVs. The models are CatBoost, XGBoost, and LightGBM.
3.2.1. CatBoost
CatBoost is a gradient boosting algorithm based on decision trees, specifically designed to efficiently handle categorical features while mitigating prediction bias. One of its primary advantages is its ability to process categorical variables directly without extensive preprocessing, thus improving both prediction accuracy and model generalization [75].
Categorical features are discrete variables, typically represented as strings, where each unique value corresponds to a specific category. These features cannot be directly utilized as numerical inputs and must undergo a transformation process. CatBoost addresses this by applying an encoding technique that involves scrambling the order of the dataset, denoted as D = [(xi, yi)] I = 1..., n. The scrambled sequence, σ = (σ1…, σn), was then used to compute the categorical feature value iteratively. The calculation follows Equation (1):
where z represents the prior term, and α > 0 is the weight coefficient of the prior term. The inclusion of this prior term helps to reduce the noise associated with low-frequency categorical features. In regression problems, this prior term corresponds to the mean value of the dataset labels.
One of the challenges in gradient boosting decision trees (GBDTs) is the presence of gradient bias and overfitting, which arise from using the same data points for gradient estimation. To overcome this, CatBoost employs the Ordered Boosting method, which transforms the gradient estimation process from biased to unbiased. This method first generates a random permutation σ = [1, n] to sort the original dataset, initializing n different models M1, M2…, Mn. Each model Mi was trained using only the top i samples of the permutation, ensuring that the unbiased gradient estimate of the jth sample was obtained by model Mj−1 at each iteration. This approach effectively reduces overfitting and enhances model robustness [76].
3.2.2. XGBoost
It represents an ensemble of decision trees built upon the principles of gradient boosting, with a primary focus on scalability [74]. Much like traditional gradient boosting, XGBoost constructs an iterative expansion of the objective function by minimizing a specific loss function. Notably, XGBoost exclusively employs decision trees as base classifiers, employing a modified loss function to regulate the complexity of these trees. These gradient-boosted decision trees, also known as ensemble techniques, have proven to be highly effective in various fields. Within the context of XGBoost, the formulation involving K tree functions is expressed in Equation (2).
where
| signifies the estimated crash severity after the iterations. | |
| k | represents the number of additive trees. |
| t | denotes the number of iterations. |
| . | |
| represents the predicted response value for the final iteration. | |
| characterizes the tree function for the ith iteration. |
The objective function for minimizing the loss l (, ) is structured as in Equations (3) and (4):
Here, acts as the regularization term, preventing overfitting and reducing complexity. T signifies the number of leaves, represents the L2 norm of the jth leaf scores, and n reflects the total number of crashes in the sample data. This comprehensive approach combines the foundational concepts of gradient boosting and the specialized attributes of XGBoost to create a powerful tool for enhancing prediction accuracy and scalability in machine learning applications.
3.2.3. LightGBM
This study capitalizes LightGBM, a renowned gradient boosting algorithm recognized for its exceptional speed and efficiency. LightGBM, introduced by Ke et al. [77], is a comprehensive library that encompasses gradient boosting and introduces multiple innovative features. LightGBM operates as a supervised model, striving to determine an approximate function f*(x) for a given dataset D = [(xi, yi)]. This function aims to minimize the loss function L (y, f(x)), as depicted in Equation (5).
It leverages regression trees, denoted as ft(x), combining them based on certain rules or probabilities to approximate f*(x), as articulated in Equation (6).
While LightGBM excels at modeling the statistical characteristics of samples for accurate classification and regression, it encounters challenges with unbalanced datasets, which are frequently encountered in intrusion detection scenarios.
3.2.4. Performance Evaluation Metrics
In this study, the performance of three distinct machine learning models, CatBoost, XGBoost, and LightGBM, was rigorously assessed. Each model was trained using a training set, and predictions were made on the test set. Model performance was evaluated by using various metrics, including accuracy, precision, and F1-score. The accuracy score provides the proportion of correct predictions, while precision and F1-score offer a more detailed view of how well each model performs across different classes [78]. These metrics were computed for each classifier.
Equations (7)–(9) represent mathematical formulations used for metric evaluation, as follows:
where true positive (TP) denotes positive samples predicted by the model as positive classes, and false positive (FP) denotes negative samples predicted by the model as a positive class; false negative (FN) denotes positive samples predicted by the model as a negative class.
The dataset was partitioned into a training set (80%) and a testing set (20%) using stratified sampling to maintain class balance across both subsets. This split ensures that the model was trained on a representative sample and evaluated on unseen data for robust performance assessment.
To enhance predictive accuracy and ensure model robustness, hyperparameter optimization was conducted for the gradient boosting models applied in this study—CatBoost, XGBoost, and LightGBM—using a grid search with 3-fold cross-validation and accuracy as the evaluation metric. For XGBoost, the parameter grid included n estimators ∈ [100, 200], learning rate ∈ [0.05, 0.1, 0.2], and max depth ∈ [3, 6, 10]. Similarly, LightGBM was tuned over n estimators ∈ [100, 200], learning rate ∈ [0.05, 0.1, 0.2], and max depth ∈ [10, 20, None]. While CatBoost maintains strong performance with default settings and is inherently robust to overfitting, standard parameters were reviewed and confirmed through preliminary validation, with iterations = 100, learning rate = 0.1, and depth = 6 used as the baseline configuration.
These models are selected for their capability to handle heterogeneous data, model complex non-linear relationships, and provide interpretable feature importance metrics. The best-performing configurations were subsequently evaluated on the test set, and feature importance was derived from the highest-scoring model to inform the analysis of mode choice determinants.
4. Results and Discussion
This section presents the findings of the machine learning models applied to predict user mode choice between CS and PSAVs, focusing on traffic safety perceptions and behavioral-demographic influences. The performance evaluation of the models, classification metrics, and feature importance is discussed in detail.
4.1. Model Performance and Comparative Analysis
The predictive performance of the applied machine learning models—XGBoost, CatBoost, and LightGBM—is evaluated using test accuracy, precision, and F1-score. Table 2 presents a comparative summary of the models’ performance metrics.
- Q3: Do machine learning models predict whether a traveler is likely to accept CS or PSAVs based on safety perceptions?
The ML models demonstrate a high level of accuracy in modeling the preference of people towards CS and PSAVs. The model metrics and classification performance are shown in Table 6 and Table 7.

Table 6.
Model performance evaluation.
The three models predict travelers’ acceptance of CS and PSAV based on the model metrics mentioned above. Among the tested models, XGBoost achieved the highest predictive performance, with an accuracy of 77.17%, followed by CatBoost (76.36%) and LightGBM (73.10%). The high accuracy and precision of XGBoost suggest its superior ability to capture the complex relationships within the dataset. Figure 12 illustrates the comparative performance of the models, demonstrating the slight variation in classification accuracy. While all models performed competitively, the relatively lower performance of LightGBM may indicate its reduced capacity to generalize under the given data distribution.
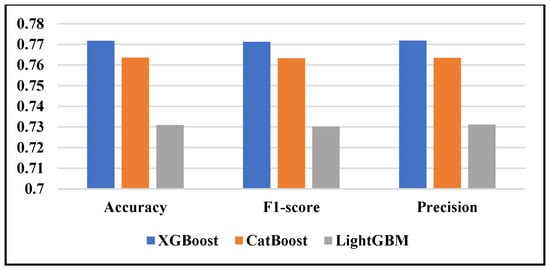
Figure 12.
Performance of models.
4.2. Classification Metrics
A detailed evaluation of the models’ classification performance is provided in terms of precision, recall, and F1-score for both CS and PSAVs, as shown in Table 7. The results reveal that all models exhibit higher recall for CS users than for PSAV users, suggesting a stronger ability to correctly classify CS users.

Table 7.
Evaluation of the models’ classification performance.
Table 7.
Evaluation of the models’ classification performance.
| XGBoost | LightGBM | CatBoost | ||||
|---|---|---|---|---|---|---|
| CS | PSAV | CS | PSAV | CS | PSAV | |
| Precision | 0.77 | 0.77 | 0.73 | 0.73 | 0.77 | 0.76 |
| Recall | 0.81 | 0.73 | 0.78 | 0.68 | 0.79 | 0.73 |
| F1-score | 0.79 | 0.75 | 0.75 | 0.70 | 0.78 | 0.74 |
XGBoost achieves a precision of 0.77 for both CS and PSAV, with an F1-score of 0.79 for CS and 0.75 for PSAVs, indicating balanced classification performance. CatBoost performs slightly low, with an F1-score of 0.78 for CS and 0.74 for PSAV, showing a small reduction in predictive power compared to XGBoost. LightGBM exhibits the lowest recall for PSAV (0.68), which may imply a greater tendency to misclassify PSAV users compared to the other models.
The classification results indicate that, while all models perform well, XGBoost consistently outperforms the others in detecting and correctly classifying users of both transport modes.
4.3. Feature Importance Analysis
Feature importance analysis is based on the metrics of how each variable improves model accuracy. When the data is split into smaller groups, the model tests the improvements that occurred and the frequency of choosing a variable in the dataset on the accuracy. The feature importance is used to explain the model and the selection of the most impacted variables on the prediction, dropping the lowest importance from the model and specifying the driving features.
To understand the key factors influencing users’ mode choice decisions, feature importance analysis is conducted using the XGBoost model, which demonstrates the highest predictive performance. Figure 13 presents the ranked importance of input features, highlighting the most influential variables in mode choice prediction. The feature importance in XGBoost is computed based on the Gain, which quantifies the relative contribution of each feature by measuring the improvement in the model’s objective function brought by splits involving that feature across all decision trees in the ensemble.
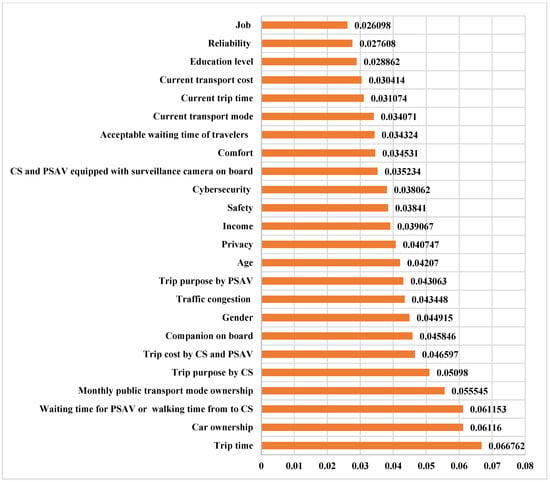
Figure 13.
Feature importance of XGBoost.
The results provide valuable insights into the behavioral and demographic factors influencing user preferences in CS and PSAVs. The superior performance of XGBoost suggests that decision tree-based ensemble methods are well-suited for capturing the complexity of travel behavior. The classification results indicate that CS users are more accurately identified, PSAV users present greater classification challenges, likely due to variations in safety perceptions and technological acceptance.
- Q4: What are the factors that impact the acceptance of CS and PSAVs?
The factors that have influence on the selection of CS and PSAVs are shown in Figure 13 with different levels of impacts; for example, trip time is the most influential factor that controls the use of CS and PSAVs, while job variable has the least impact on using CS and PSAVs.
The influential factors are divided into three groups for ease of understanding: group 1 is traveling variables, group 2 is sociodemographic variables, and group 3 is safety variables. Each variable in each group shows an importance value different than the others. This demonstrates that every variable has an impact on the acceptance or the use of CS and PSAV.
Group 1 (traveling variables) includes trip time, waiting time for the PSAV or walking time to and from CS, trip purpose by CS, trip purpose by the PSAV, trip cost, traffic congestion, waiting time, current transport mode, usual transport cost, usual main trip time, and camera on board of CS and the PSAV. From Figure 13, the highest influential factor is the trip time using CS and PSAVs (6.68%); the duration of the trip plays a critical role in users’ mode choice. The third influential factor in the adoption of CS and PSAVs is walking and waiting time (6.12%). It is shown from the results that trip cost (4.66%) is the sixth influential factor that impacts the use of CS and PSAVs after the trip purpose of using CS (5.09%). Meanwhile, the trip purpose by PSAVs is the tenth influential factor, which means that people are still studying using PSAVs based on destinations. Traffic congestion is the ninth influential factor that people consider when using CS and PSAVs. In addition, the availability of a camera on board CS and PSAVs slightly impacts the use of CS and PSAVs compared to the other 24 factors.
Moreover, the people consider their current characteristics when they decide to choose CS and PSAVs, such as waiting time and the type of transport mode that a traveler uses impact using PSAV and CS, and this applies to the amount of money a traveler pays to use the current transport mode as well as the current trip time using the current transport mode. This leads to the conclusion that the current travel patterns influence the use of other transport modes in the future, such as CS and PSAVs. The importance of these variables occupies almost the least importance compared to other factors, as shown in Figure 13.
Group 2 (sociodemographic variables) includes car ownership, monthly public transport pass ownership, gender, age, income, education, and job variables. The car ownership (6.12%) is the second influential factor; users with private vehicles may be less inclined to use CS or PSAVs. Users of public transport mode are more likely to use shared mobility, as demonstrated in this study, where monthly public transport pass ownership occupies the fourth important factor in influencing the use of PSAVs and CS (5.55%). Gender, age, and income demonstrate medium importance based on Figure 13; their values are 4.49%, 4.20%, and 3.90%, respectively. The education level and job are shown to have the lowest values of importance based on Figure 13. The values of importance are 2.60% for job and 2.89% for education level.
For Group 3 (traveling variables), Figure 13 shows the following percentages: companion (4.58%), privacy concerns (4.07%), safety perceptions (3.84%), and cybersecurity awareness (3.81%). All of these highlight users’ concerns regarding personal security and data protection in shared mobility services. Meanwhile, reliability is almost the least important factor in the model.
These findings emphasize that both trip-related factors (e.g., Group 1), personal attributes (e.g., Group 2), and safety-related factors (e.g., Group 3) strongly influence mode choice. Notably, safety factors, as demonstrated in Group 3, emerge as significant determinants, reflecting users’ hesitations regarding data protection in PSAV services.
From a traffic safety perspective, concerns regarding privacy, cybersecurity, and the presence of surveillance cameras emerged as notable determinants in PSAV acceptance. These findings align with previous research suggesting that trust in autonomous vehicle systems is a critical factor in acceptance decisions [27,79]. Additionally, the strong influence of trip time, cost, and congestion highlights the importance of service efficiency in shaping user choices.
In comparison with the previous studies, the findings of this study demonstrate that trip time and trip cost parameters are the most significant factors that impact transport mode selection, as shown in a study conducted by Krueger et al. [80], Yap et al. [81], Becker and Axhausen [82]. Car owners are less willing to use alternative modes of transport as mentioned in studies by Krueger, Rashidi and Rose [80], and Becker et al. [83]. Other features mentioned in Figure 13 are introduced by scholars with variable impacts on the transport mode choice.
4.4. Limitations and Recommendations
While shared autonomous mobility offers promising benefits in terms of congestion reduction and environmental efficiency, ensuring public trust through robust safety regulations and transparency in data security remains imperative. One of the limitations of this study is that the participants do not represent the population of Hungary. To generalize the findings, extension of the data is needed, or at least the gaps need to be filled in sample proportions, for example, as the percentage of 65+ year-old participants. Moreover, this study focuses only on urban areas and studies one use of AVs (i.e., PSAVs).
Future studies can be focused on more relevant variables that impact the use of AVs and CS, such as internal vehicle design, rural areas, the fleet size of AVs and CS, and others. Moreover, the availability of AVs on the market will provide real data that can lead to a study on whether the adoption of AVs is attained or not. Further research could explore the role of real-world safety incidents and regulatory measures in shaping public perception and acceptance trends. Future research should explore the long-term impact of real-world PSAV deployment, integrating empirical safety data and user feedback to refine predictive models and enhance the public acceptance of autonomous mobility solutions. This study focuses on gradient boosting algorithms without empirical comparison to other established classification approaches, such as support vector machines or Neural Networks. Future research is encouraged to undertake comprehensive benchmarking across diverse algorithmic paradigms and to incorporate advanced explainability frameworks such as SHAP values to enhance model transparency, interpretability, and generalizability.
5. Conclusions
This study applied machine learning techniques to analyze the behavioral and demographic factors influencing user mode choice between CS and PSAV services, with a focus on travel behavior factors impacting the preferences of travelers in urban areas. The findings provide critical insights into the determinants of mobility preferences, highlighting the interplay between trip characteristics, personal attributes, and safety concerns in shaping user decisions. Among the models evaluated, gradient boosting algorithms, particularly XGBoost, demonstrated superior predictive performance, effectively capturing the complexity of mode choice behavior. The analysis revealed that trip duration, car ownership, walking and waiting times, and trip costs are key determinants of users’ mobility preferences. Furthermore, traffic safety concerns, privacy considerations, and cybersecurity risks emerged as significant factors influencing the acceptance of PSAVs, underscoring the role of perceived security in shaping attitudes toward autonomous mobility. From a traffic safety perspective, the findings highlight the importance of addressing user apprehensions regarding data privacy, surveillance, and technological reliability in PSAV acceptance. While the applied gradient boosting models yielded strong predictive performance, future investigations should extend the methodological framework by evaluating alternative machine learning techniques to ensure the robustness and transferability of findings. Moreover, the integration of explainable AI tools and real-world observational data will be critical to improving model validity and fostering greater public confidence in autonomous mobility technologies.
This study serves as the theoretical framework for utilizing ML models in modeling travelers’ preferences towards CS and PSAVs. This study lays the groundwork for researchers to build on this study for future research, such as using experimental data or using ML models in modeling travel choice modes.
Author Contributions
Conceptualization, J.H. and N.H.; methodology, J.H. and N.H.; software, N.H.; validation, N.H.; formal analysis, J.H. and N.H.; investigation, JH; data curation, N.H.; writing—original draft preparation, J.H. and N.H.; writing—review and editing, J.H. and N.H.; visualization, N.H.; supervision, J.H. All authors have read and agreed to the published version of the manuscript.
Funding
This research received no external funding.
Institutional Review Board Statement
Ethical review and approval were waived for this study by the Vice Dean of the Transportation and Vehicle Engineering Faculty, the Discipline Committee of Budapest University of Technology and Economics, the Ethics Committee of Szeged University, and the Hungarian Medical Research Council that the research falls within a category where it was deemed exempt from requiring ethical approval. The study was conducted in accordance with the Declaration of Helsinki. Furthermore, and ethical approval for this study is not required in Hungary based on CLIVth Health Act of 1997—Chapter VIII, Section 157 since participants were neither subjected to interventions nor were they imposed by a code of conduct which would be protected by the Hungarian Medical Research Council. Data are treated confidentially, and individuals could not be identified from published data.
Informed Consent Statement
Informed consent was obtained from all subjects involved in this study.
Data Availability Statement
Data is available upon request from the corresponding author.
Conflicts of Interest
The authors declare no conflicts of interest.
References
- Sperling, D. Three Revolutions: Steering Automated, Shared, and Electric Vehicles to a Better Future; Island Press: Washington, DC, USA, 2018. [Google Scholar]
- Hancock, P.A.; Nourbakhsh, I.; Stewart, J. On the future of transportation in an era of automated and autonomous vehicles. Proc. Natl. Acad. Sci. USA 2019, 116, 7684–7691. [Google Scholar] [CrossRef] [PubMed]
- Campisi, T.; Severino, A.; Al-Rashid, M.A.; Pau, G. The development of the smart cities in the connected and autonomous vehicles (CAVs) era: From mobility patterns to scaling in cities. Infrastructures 2021, 6, 100. [Google Scholar] [CrossRef]
- Axsen, J.; Sovacool, B.K. The roles of users in electric, shared and automated mobility transitions. Transp. Res. Part D Transp. Environ. 2019, 71, 1–21. [Google Scholar] [CrossRef]
- Luca, O.; Andrei, L.; Iacoboaea, C.; Gaman, F. Unveiling the hidden effects of automated vehicles on “do no significant harm” components. Sustainability 2023, 15, 11265. [Google Scholar] [CrossRef]
- Chen, Y.; Li, C.; Wang, W.; Zhang, Y.; Chen, X.M.; Gao, Z. The landscape, trends, challenges, and opportunities of sustainable mobility and transport. npj Sustain. Mobil. Transp. 2025, 2, 8. [Google Scholar] [CrossRef]
- Garus, A.; Mourtzouchou, A.; Suarez, J.; Fontaras, G.; Ciuffo, B. Exploring Sustainable Urban Transportation: Insights from Shared Mobility Services and Their Environmental Impact. Smart Cities 2024, 7, 1199–1220. [Google Scholar] [CrossRef]
- Hou, N.; Shollock, B.; Petzoldt, T.; M’Hallah, R. Qualitative insights into travel behavior change from using private cars to shared cars. Int. J. Sustain. Transp. 2025, 19, 262–276. [Google Scholar] [CrossRef]
- Roblek, V.; Meško, M.; Podbregar, I. Impact of car sharing on urban sustainability. Sustainability 2021, 13, 905. [Google Scholar] [CrossRef]
- Liyanage, S.; Dia, H.; Abduljabbar, R.; Bagloee, S. Flexible mobility on-demand: An environmental scan. Sustainability 2019, 11, 1262. [Google Scholar] [CrossRef]
- Sharma, A.; Zheng, Z. Connected and automated vehicles: Opportunities and challenges for transportation systems, smart cities, and societies. In Automating Cities: Design, Construction, Operation and Future Impact; Springer: Singapore, 2021; pp. 273–296. [Google Scholar]
- Bathla, G.; Bhadane, K.; Singh, R.K.; Kumar, R.; Aluvalu, R.; Krishnamurthi, R.; Kumar, A.; Thakur, R.; Basheer, S. Autonomous vehicles and intelligent automation: Applications, challenges, and opportunities. Mob. Inf. Syst. 2022, 2022, 7632892. [Google Scholar] [CrossRef]
- Chougule, A.; Chamola, V.; Sam, A.; Yu, F.R.; Sikdar, B. A comprehensive review on limitations of autonomous driving and its impact on accidents and collisions. IEEE Open J. Veh. Technol. 2023, 5, 142–161. [Google Scholar] [CrossRef]
- Al Mansoori, S.; Al-Emran, M.; Shaalan, K. Factors affecting autonomous vehicles adoption: A systematic review, proposed framework, and future roadmap. Int. J. Human–Computer Interact. 2024, 40, 8397–8418. [Google Scholar] [CrossRef]
- Chen, Y.; Khan, S.K.; Shiwakoti, N.; Stasinopoulos, P.; Aghabayk, K. Integrating perceived safety and socio-demographic factors in UTAUT model to explore Australians’ intention to use fully automated vehicles. Res. Transp. Bus. Manag. 2024, 56, 101147. [Google Scholar] [CrossRef]
- Chen, Y.; Shiwakoti, N.; Stasinopoulos, P.; Khan, S.K. State-of-the-art of factors affecting the adoption of automated vehicles. Sustainability 2022, 14, 6697. [Google Scholar] [CrossRef]
- Hamiditehrani, S.; Scott, D.M.; Sweet, M.N. Shared versus pooled automated vehicles: Understanding behavioral intentions towards adopting on-demand automated vehicles. Travel Behav. Soc. 2024, 36, 100774. [Google Scholar] [CrossRef]
- Lee, S.; Wang, L. Consumer Preferences and Determinants of Transportation Mode Choice Behaviors in the Era of Autonomous Vehicles. Trans. Transp. Sci. 2024, 15, 37–47. [Google Scholar] [CrossRef]
- Sadeghpour, M.; Beyazıt, E. The new frontier of urban mobility: A scenario-based analysis of autonomous vehicles adoption in urban transportation. Transp. Plan. Technol. 2025, 48, 43–66. [Google Scholar] [CrossRef]
- Püschel, J.; Barthelmes, L.; Kagerbauer, M.; Vortisch, P. Comparison of discrete choice and machine learning models for simultaneous modeling of mobility tool ownership in agent-based travel demand models. Transp. Res. Rec. J. Transp. Res. Board 2024, 2678, 376–390. [Google Scholar] [CrossRef]
- Hu, B.; Tang, J.; Tong, D.; Zhao, H. Revealing spatiotemporal characteristics of EV car-sharing systems: A case study in Shanghai, China. Travel Behav. Soc. 2024, 36, 100808. [Google Scholar] [CrossRef]
- Ghorbani, A.; Nassir, N.; Lavieri, P.S.; Beeramoole, P.B.; Paz, A. Enhanced utility estimation algorithm for discrete choice models in travel demand forecasting. Transportation 2025, 1–28. [Google Scholar] [CrossRef]
- Yu, D.; Li, Z.; Zhong, Q.; Ai, Y.; Chen, W. Demand Management of Station-Based Car Sharing System Based on Deep Learning Forecasting. J. Adv. Transp. 2020, 2020, 8935857. [Google Scholar] [CrossRef]
- Rahman, M.M.; Paul, K.C.; Hossain, M.A.; Ali, G.M.N.; Rahman, M.S.; Thill, J.-C. Machine learning on the COVID-19 pandemic, human mobility and air quality: A review. IEEE Access 2021, 9, 72420–72450. [Google Scholar] [CrossRef]
- Brahimi, N.; Zhang, H.; Dai, L.; Zhang, J. Modelling on Car-Sharing Serial Prediction Based on Machine Learning and Deep Learning. Complexity 2022, 2022, 8843000. [Google Scholar] [CrossRef]
- Hamadneh, J.; Esztergár-Kiss, D. Multitasking Onboard of Conventional Transport Modes and Shared Autonomous Vehicles. Transp. Res. Interdiscip. Perspect. 2021, 12, 100505. [Google Scholar] [CrossRef]
- Hamadneh, J.; Szabolcs, D.; Esztergár-Kiss, D. Stakeholder viewpoints analysis of the autonomous vehicle industry by using multi-actors multi-criteria analysis. Transp. Policy 2022, 126, 65–84. [Google Scholar] [CrossRef]
- International, S. SAE International’s Levels of Driving Automation for on-Road Vehicles. Available online: http://www.sae.org/misc/pdfs/automated_driving.pdf (accessed on 14 June 2023).
- Turnbull, K.F. Enhancing mobility with automated shuttles and buses. In Road Vehicle Automation 10, Proceedings of the Automated Road Transportation Symposium, Garden Grove, CA, USA, 18–21 July 2022; Springer: Cham, Switzerland, 2022; pp. 72–78. [Google Scholar]
- Twumasi-Boakye, R.; Cai, X.; Fishelson, J.; Broaddus, A. Simulation of potential use cases for shared mobility services in the city of Ann arbor. Transp. Res. Rec. 2021, 2675, 848–860. [Google Scholar] [CrossRef]
- Fonzone, A.; Fountas, G.; Downey, L. Automated bus services–To whom are they appealing in their early stages? Travel Behav. Soc. 2024, 34, 100647. [Google Scholar] [CrossRef]
- Hao, M.; Yamamoto, T. Shared autonomous vehicles: A review considering car sharing and autonomous vehicles. Asian Transp. Stud. 2018, 5, 47–63. [Google Scholar] [CrossRef]
- Greenblatt, J.B.; Shaheen, S. Automated vehicles, on-demand mobility, and environmental impacts. Curr. Sustain./Renew. Energy Rep. Vol. 2015, 2, 74–81. [Google Scholar] [CrossRef]
- Hamadneh, J.; Hamdan, N.; Mahdi, A. Users’ Transport Mode Choices in the Autonomous Vehicle Age in Urban Areas. J. Transp. Eng. Part A Systems. 2024, 150, 04023128. [Google Scholar] [CrossRef]
- Lee, D.; Hess, D.J. Public concerns and connected and automated vehicles: Safety, privacy, and data security. Humanit. Soc. Sci. Commun. 2022, 9, 90. [Google Scholar] [CrossRef]
- Naiseh, M.; Clark, J.; Akarsu, T.; Hanoch, Y.; Brito, M.; Wald, M.; Webster, T.; Shukla, P. Trust, risk perception, and intention to use autonomous vehicles: An interdisciplinary bibliometric review. AI Soc. 2024, 40, 1091–1111. [Google Scholar] [CrossRef]
- Kyriakidis, M.; Sodnik, J.; Stojmenova, K.; Elvarsson, A.B.; Pronello, C.; Thomopoulos, N. The role of human operators in safety perception of av deployment—Insights from a large european survey. Sustainability 2020, 12, 9166. [Google Scholar] [CrossRef]
- Stoiber, T.; Schubert, I.; Hoerler, R.; Burger, P. Will consumers prefer shared and pooled-use autonomous vehicles? A stated choice experiment with Swiss households. Transp. Res. Part D Transp. Environ. 2019, 71, 265–282. [Google Scholar] [CrossRef]
- Zhou, F.; Zheng, Z.; Whitehead, J.; Washington, S.; Perrons, R.K.; Page, L. Preference heterogeneity in mode choice for car-sharing and shared automated vehicles. Transp. Res. Part A Policy Pract. 2020, 132, 633–650. [Google Scholar] [CrossRef]
- Kolarova, V.; Steck, F.; Bahamonde-Birke, F.J. Assessing the effect of autonomous driving on value of travel time savings: A comparison between current and future preferences. Transp. Res. Part A Policy Pract. 2019, 129, 155–169. [Google Scholar] [CrossRef]
- Müller, J.M. Comparing technology acceptance for autonomous vehicles, battery electric vehicles, and car sharing—A study across Europe, China, and North America. Sustainability 2019, 11, 4333. [Google Scholar] [CrossRef]
- Schoettle, B.; Sivak, M. A survey of public opinion about connected vehicles in the US, the UK, and Australia. In Proceedings of the 2014 International Conference on Connected Vehicles and Expo (ICCVE), Vienna, Austria, 3–7 November 2014; pp. 687–692. [Google Scholar]
- Howard, D.; Dai, D. Public perceptions of self-driving cars: The case of Berkeley, California. In Proceedings of the Transportation Research Board 93rd Annual Meeting, Washington, DC, USA, 12–16 January 2013; pp. 1–16. [Google Scholar]
- Bansal, P.; Kockelman, K.M.; Singh, A. Assessing public opinions of and interest in new vehicle technologies: An Austin perspective. Transp. Res. Part C Emerg. Technol. 2016, 67, 1–14. [Google Scholar] [CrossRef]
- Stoma, M.; Dudziak, A.; Caban, J.; Droździel, P. The future of autonomous vehicles in the opinion of automotive market users. Energies 2021, 14, 4777. [Google Scholar] [CrossRef]
- Louw, T.; Madigan, R.; Lee, Y.M.; Nordhoff, S.; Lehtonen, E.; Innamaa, S.; Malin, F.; Bjorvatn, A.; Merat, N. Drivers’ intentions to use different functionalities of conditionally automated cars: A survey study of 18,631 drivers from 17 countries. Int. J. Environ. Res. Public Health 2021, 18, 12054. [Google Scholar] [CrossRef]
- Chee, P.N.E.; Susilo, Y.O.; Wong, Y.D.; Pernestål, A. Which factors affect willingness-to-pay for automated vehicle services? Evidence from public road deployment in Stockholm, Sweden. Eur. Transp. Res. Rev. 2020, 12, 20. [Google Scholar] [CrossRef]
- Das, S.; Sekar, A.; Chen, R.; Kim, H.C.; Wallington, T.J.; Williams, E. Impacts of Autonomous Vehicles on Consumers Time-Use Patterns. Challenges 2017, 8, 32. [Google Scholar] [CrossRef]
- Litman, T. Autonomous Vehicle Implementation Predictions: Implications for Transport Planning; Transportation Research Board: Washington, DC, USA, 2020. [Google Scholar]
- Lempert, R.; Zhao, J.; Dowlatabadi, H. Convenience, savings, or lifestyle? Distinct motivations and travel patterns of one-way and two-way carsharing members in Vancouver, Canada. Transp. Res. Part D Transp. Environ. 2019, 71, 141–152. [Google Scholar] [CrossRef]
- Pawełoszek, I. Towards a smart city—The study of car-sharing services in poland. Energies 2022, 15, 8459. [Google Scholar] [CrossRef]
- Efthymiou, D.; Chaniotakis, E.; Antoniou, C. Factors affecting the adoption of vehicle sharing systems. In Demand for Emerging Transportation Systems; Elsevier: Amsterdam, The Netherlands, 2020; pp. 189–209. [Google Scholar]
- Ferrero, F.; Perboli, G.; Rosano, M.; Vesco, A. Car-sharing services: An annotated review. Sustain. Cities Soc. 2018, 37, 501–518. [Google Scholar] [CrossRef]
- Lee, S. Transportation Mode Choice Behavior in the Era of Autonomous Vehicles: The Application of Discrete Choice Modeling and Machine Learning. Ph.D. Thesis, Portland State University, Portland, OR, USA, 2022. [Google Scholar]
- Pineda-Jaramillo, J.; Arbeláez-Arenas, Ó. Assessing the performance of gradient-boosting models for predicting the travel mode choice using household survey data. J. Urban Plan. Dev. 2022, 148, 04022007. [Google Scholar] [CrossRef]
- Teusch, J.; Gremmel, J.N.; Koetsier, C.; Johora, F.T.; Sester, M.; Woisetschläger, D.M.; Müller, J.P. A systematic literature review on machine learning in shared mobility. IEEE Open J. Intell. Transp. Syst. 2023, 4, 870–899. [Google Scholar] [CrossRef]
- Baumgarte, F.; Brandt, T.; Keller, R.; Röhrich, F.; Schmidt, L. You’ll never share alone: Analyzing carsharing user group behavior. Transp. Res. Part D Transp. Environ. 2021, 93, 102754. [Google Scholar] [CrossRef]
- Wang, F.; Ross, C.L. Machine learning travel mode choices: Comparing the performance of an extreme gradient boosting model with a multinomial logit model. Transp. Res. Rec. 2018, 2672, 35–45. [Google Scholar] [CrossRef]
- Zhao, X.; Yan, X.; Van Hentenryck, P. Modeling heterogeneity in mode-switching behavior under a mobility-on-demand transit system: An interpretable machine learning approach. arXiv 2019, arXiv:1902.02904. [Google Scholar]
- Qin, H.; Yu, B.; Zhang, Y. Exploring commuters’ mode preference to autonomous vehicles based on a personalized travel experience survey. Transportation 2024, 1–34. [Google Scholar] [CrossRef]
- Huang, K.; Liu, C.; Zhang, C.; Liu, Z.; Hu, H. Shared autonomous vehicle operational decisions with vehicle movement and user travel behaviour. Travel Behav. Soc. 2024, 37, 100848. [Google Scholar] [CrossRef]
- Alencar, V.A.; Pessamilio, L.R.; Rooke, F.; Bernardino, H.S.; Borges Vieira, A. Forecasting the carsharing service demand using uni and multivariable models. J. Internet Serv. Appl. 2021, 12, 4. [Google Scholar] [CrossRef]
- Martín-Baos, J.Á.; López-Gómez, J.A.; Rodriguez-Benitez, L.; Hillel, T.; García-Ródenas, R. A prediction and behavioural analysis of machine learning methods for modelling travel mode choice. Transp. Res. Part C Emerg. Technol. 2023, 156, 104318. [Google Scholar] [CrossRef]
- Zhao, X.; Yan, X.; Yu, A.; Van Hentenryck, P. Prediction and behavioral analysis of travel mode choice: A comparison of machine learning and logit models. Travel Behav. Soc. 2020, 20, 22–35. [Google Scholar] [CrossRef]
- Fafoutellis, P.; Mantouka, E.G.; Vlahogianni, E.I.; Oprea, G.-M. Acceptability modeling of autonomous mobility on-demand services with on-board ride sharing using interpretable machine learning. Int. J. Transp. Sci. Technol. 2022, 11, 752–766. [Google Scholar] [CrossRef]
- Zhu, H.; Luo, Y.; Liu, Q.; Fan, H.; Song, T.; Yu, C.W.; Du, B. Multistep flow prediction on car-sharing systems: A multi-graph convolutional neural network with attention mechanism. Int. J. Softw. Eng. Knowl. Eng. 2019, 29, 1727–1740. [Google Scholar] [CrossRef]
- Shaheen, S.; Bouzaghrane, M.A. Mobility and Energy Impacts of Shared Automated Vehicles: A Review of Recent Literature. Curr. Sustain./Renew. Energy Rep. 2019, 6, 193–200. [Google Scholar] [CrossRef]
- European Commission. Ethics and Data Protection. 2021. Available online: https://www.enlivenproject.eu/survival-kit/methods/ethics_data_protection/ethics_data_protection.html (accessed on 5 July 2021).
- Fésüs, L. Science Ethics Code of the Hungarian Academy of Sciences. 2013. Available online: https://embassy.science/wiki/Resource:8221b7e8-d873-4c67-8576-c4f60247b5ac#:~:text=This%20set%20of%20guidelines%20from,fair%20authorship%20procedures%3B%20and%20reporting (accessed on 14 June 2025).
- Elreedy, D.; Atiya, A.F. A comprehensive analysis of synthetic minority oversampling technique (SMOTE) for handling class imbalance. Inf. Sci. 2019, 505, 32–64. [Google Scholar] [CrossRef]
- Chen, H.; Cheng, Y. Travel mode choice prediction using imbalanced machine learning. IEEE Trans. Intell. Transp. Syst. 2023, 24, 3795–3808. [Google Scholar] [CrossRef]
- Yang, L.; Shami, A. On hyperparameter optimization of machine learning algorithms: Theory and practice. Neurocomputing 2020, 415, 295–316. [Google Scholar] [CrossRef]
- Alibrahim, H.; Ludwig, S.A. Hyperparameter optimization: Comparing genetic algorithm against grid search and bayesian optimization. In Proceedings of the 2021 IEEE Congress on Evolutionary Computation (CEC), Krakow, Poland, 28 June–1 July 2021; pp. 1551–1559. [Google Scholar]
- Chen, T.; Guestrin, C. Xgboost: A scalable tree boosting system. In Proceedings of the 22nd Acm Sigkdd International Conference on Knowledge Discovery and Data Mining, San Francisco, CA, USA, 13–17 August 2016; pp. 785–794. [Google Scholar]
- Prokhorenkova, L.; Gusev, G.; Vorobev, A.; Dorogush, A.V.; Gulin, A. CatBoost: Unbiased boosting with categorical features. Adv. Neural Inf. Process. Syst. 2018, 31. [Google Scholar] [CrossRef]
- Chang, X.; Wu, J.; Liu, H.; Yan, X.; Sun, H.; Qu, Y. Travel mode choice: A data fusion model using machine learning methods and evidence from travel diary survey data. Transp. A Transp. Sci. 2019, 15, 1587–1612. [Google Scholar] [CrossRef]
- Ke, G.; Meng, Q.; Finley, T.; Wang, T.; Chen, W.; Ma, W.; Ye, Q.; Liu, T.-Y. Lightgbm: A highly efficient gradient boosting decision tree. In Proceedings of the Advances in Neural Information Processing Systems 30 (NIPS 2017), Long Beach, CA, USA, 4–9 December 2017; Volume 30. [Google Scholar]
- Yacouby, R.; Axman, D. Probabilistic extension of precision, recall, and f1 score for more thorough evaluation of classification models. In Proceedings of the First Workshop on Evaluation and Comparison of NLP Systems, Online, 20 November 2020; pp. 79–91. [Google Scholar]
- Yuen, K.F.; Ma, F.; Wang, X.; Lee, G. The role of trust in influencing consumers’ adoption of automated vehicles: An application of the health belief model. Int. J. Sustain. Transp. 2020, 15, 837–849. [Google Scholar] [CrossRef]
- Krueger, R.; Rashidi, T.H.; Rose, J.M. Preferences for shared autonomous vehicles. Transp. Res. Part C Emerg. Technol. 2016, 69, 343–355. [Google Scholar] [CrossRef]
- Yap, M.D.; Correia, G.; Van Arem, B. Preferences of travellers for using automated vehicles as last mile public transport of multimodal train trips. Transp. Res. Part A Policy Pract. 2016, 94, 1–16. [Google Scholar] [CrossRef]
- Becker, F.; Axhausen, K.W. Predicting the use of automated vehicles: [First results from the pilot survey]. In Proceedings of the 17th Swiss Transport Research Conference (STRC 2017), Ascona, Switzerland, 17–19 May 2017. [Google Scholar]
- Becker, H.; Ciari, F.; Axhausen, K.W. Comparing car-sharing schemes in Switzerland: User groups and usage patterns. Transp. Res. Part A Policy Pract. 2017, 97, 17–29. [Google Scholar] [CrossRef]
Disclaimer/Publisher’s Note: The statements, opinions and data contained in all publications are solely those of the individual author(s) and contributor(s) and not of MDPI and/or the editor(s). MDPI and/or the editor(s) disclaim responsibility for any injury to people or property resulting from any ideas, methods, instructions or products referred to in the content. |
© 2025 by the authors. Published by MDPI on behalf of the World Electric Vehicle Association. Licensee MDPI, Basel, Switzerland. This article is an open access article distributed under the terms and conditions of the Creative Commons Attribution (CC BY) license (https://creativecommons.org/licenses/by/4.0/).