Article

Techno-Economic Assessment of Alternative-Fuel Bus Technologies Under Real Driving Conditions in a Developing Country Context †

by
Marc Haddad
1,* and
Charbel Mansour
2
1
Department of Industrial and Mechanical Engineering, Lebanese American University, 211 East 46th Street, New York, NY 10017, USA
2
Argonne National Laboratory, 9700 South Cass Avenue, Lemont, IL 60439, USA
*
Author to whom correspondence should be addressed.
This article is a updated and expanded version of a paper entitled “Rethinking bus transit in a developing country of the Middle East: Energy consumption and emissions of alternative fuel bus technologies in the Greater Beirut Area”, which was presented at International Conference on Innovative Applied Energy IAPE’19, Oxford, UK, 14–15 March 2019.
World Electr. Veh. J. 2025, 16(6), 337; https://doi.org/10.3390/wevj16060337
Submission received: 28 April 2025 / Revised: 8 June 2025 / Accepted: 15 June 2025 / Published: 19 June 2025
(This article belongs to the Special Issue Zero Emission Buses for Public Transport)

Abstract

:
The long-standing need for a modern public transportation system in Lebanon, a developing country of the Middle East with an almost exclusive dependence on costly and polluting passenger cars, has become more pressing in recent years due to the worsening economic crisis and the onset of hyperinflation. This study investigates the potential reductions in energy use, emissions, and costs from the possible introduction of natural gas, hybrid, and battery-electric buses compared to traditional diesel buses in local real driving conditions. Four operating conditions were considered including severe congestion, peak, off-peak, and bus rapid transit (BRT) operation. Battery-electric buses are found to be the best performers in any traffic operation, conditional on having clean energy supply at the power plant and significant subsidy of bus purchase cost. Natural gas buses do not provide significant greenhouse gas emission savings compared to diesel buses but offer substantial reductions in the emission of all major pollutants harmful to human health. Results also show that accounting for additional energy consumption from the use of climate-control auxiliaries in hot and cold weather can significantly impact the performance of all bus technologies by up to 44.7% for electric buses on average. Performance of all considered bus technologies improves considerably in free-flowing traffic conditions, making BRT operation the most beneficial. A vehicle mix of diesel, natural gas, and hybrid bus technologies is found most feasible for the case of Lebanon and similar developing countries lacking necessary infrastructure for a near-term transition to battery-electric technology.

1. Introduction

Over the past two decades, public transportation systems worldwide have increasingly adopted cleaner-burning alternative fuels, beginning with compressed natural gas (CNG) and expanding to hybrid and battery-electric technologies. In the United States, for example, more than 55% of public transit buses now operate on fuels cleaner than diesel, including natural gas, battery-electric, and hydrogen fuels [1]. This is mirrored in Europe and some parts of Latin America and Asia where decarbonization of bus fleets at national and subnational levels is already underway [2], driven mainly by climate-change legislation and the need to respond to rising conventional fuel prices. As a result, a major shift to zero-emission transit buses is gaining traction globally [3], with ambitious targets for mitigating adverse impacts from transportation by timeframes between 2025 and 2050 [4].
Despite these advancements, most developing countries have yet to benefit from this transition, constrained by technical, economic, and institutional barriers [5]. The high capital cost of new bus technologies [6], lack of policy frameworks and incentives [7], and insufficient infrastructure for alternative fuel distribution and vehicle charging [8,9] are among the most pressing challenges. This is the case in Lebanon where 99.1% of the fuel used in transportation consists of gasoline and diesel, and where commuters have to rely almost exclusively on the use of passenger vehicles due to the absence of a formal public transportation system, contributing to severe congestion, elevated pollution levels, and unsustainable energy use [10]. Compounding this situation are the severe deficiencies in energy supply and distribution infrastructure, and a lagging regulatory environment, making the Lebanese context an ideal case for understanding the real-world performance of alternative fuel bus technologies in the wider context of developing countries.
Public transportation in Lebanon consists mostly of informal services by private operators of older-model diesel and gasoline buses, minivans, and taxis operating ad hoc without government oversight or organization, highlighting the need for more efficient and cleaner-fuel vehicles [11]. In 2010, buses represented only 1% of Lebanon’s vehicle fleet yet accounted for 5.6% of total road transport energy use [12]. Furthermore, the growth of energy consumption in Lebanon’s road transport sector was estimated to increase by 42.7% in 2040 compared to 2020 due to the expected increase in transport activity [13]. As a result, road transport in Lebanon currently accounts for around 23% of direct GHG emissions and is one of the highest contributors of harmful pollutant emissions among all sectors, with some pollutant levels like SO2 and NOx increasing by over 50% between 2005 and 2015 [14].
Exacerbating these challenges is the ongoing economic crisis where the national currency has lost over 90% of its value since 2019, together with the gradual lifting of fuel subsidies since 2021, leading to a surge in gasoline and diesel prices by over 1500% and making car use financially unsustainable for the average commuter. Consequently, government plans are underway to revitalize the public transport sector, with options being considered for operating regular buses running with normal traffic as a first step. These plans also included potential construction of dedicated lanes for a bus rapid transit (BRT) system to serve the congested Greater Beirut Area (GBA) where over 40% of the population resides [15]. In parallel, the recently discovered potential of offshore natural gas reserves in Lebanon has raised local interest in exploring the use of cleaner and cheaper fuels in road transportation [16].
Therefore, this study provides an assessment of alternative bus technologies that can help address the energy, environmental, and cost challenges that face the public transportation system in Lebanon as a case study for other similar contexts. The novelty of this study is in providing targeted policy recommendations based on an integrated assessment of energy consumption, GHG and pollutant emissions, and capital, operating, and maintenance costs in a comprehensive techno-economic analysis under real driving and weather conditions of multiple types of alternative fuel buses considered most feasible for the context of developing countries. Few such studies have been conducted in this context, and no previous results exist for the case of the road transport sector in Lebanon where concerns about energy supply, regulatory frameworks, and economic considerations persist. Specifically, this study provides (a) an assessment of the energy and environmental performance of diesel, CNG, parallel-hybrid, and battery-electric buses in real-world conditions and (b) a total cost of ownership assessment of the actual savings potential for each bus technology relative to conventional diesel buses in the local context for Lebanon. The modeling approach for these assessments is detailed in Section 2, and the results are presented and discussed in Section 3. Policy recommendations for the transition to alternative-fuel buses are extracted for the context of Lebanon and similar developing countries in Section 4.

2. Modeling Methodology

The techno-economic assessment methodology adopted in this study consists, first, of assessing the energy consumption and environmental impacts of the different bus technologies considered and, second, in quantifying and comparing the costs incurred to achieve the desired savings and benefits compared to the reference diesel bus.
The bus technologies considered in the analysis include diesel, CNG, parallel-hybrid, and battery-electric, selected based on their feasibility for implementation in Lebanon from both infrastructural and economic perspectives. Hydrogen fuel-cell technology was not considered viable at this stage due to the complete lack of hydrogen fueling infrastructure in the country and the high costs associated with hydrogen production, storage, and distribution. Similarly, plug-in hybrid buses were excluded due to their higher procurement costs compared to conventional hybrids.
A modeling of the energy consumption and emissions was first conducted using the software tool “Advanced Vehicle Simulator” (ADVISOR) developed by the National Renewable Energy Laboratory [17], adapted to reflect local conditions in Lebanon. This was done by considering road slope and ensuring vehicle load assumptions reflect local occupancy levels and auxiliary system use, with sensitivity analyses performed to test robustness under different passenger loading conditions. The modeling was done in a real-world setting by capturing the variations in driving and weather circumstances specific to Lebanon’s local driving and climate conditions. A Euro-V-compliant 12 m bus is used as a common platform for all considered bus technologies. Fuel consumption is modeled on a tank-to-wheel (TTW) basis for all considered technologies, except for electric bus technology that is modeled on a well-to-wheel (WTW) basis to account for emissions at the power plant. This was done using the software tool “Greenhouse gases, Regulated Emissions, and Energy use in Transportation” (GREET) model developed by Argonne National Laboratory [18], adapted to reflect local conditions in Lebanon. The adapted model uses a detailed mapping of fuel pathways developed by the authors, and the actual electricity generation mix in Lebanon which is currently dominated by diesel and heavy fuel oil (HFO). The modeling methodology is represented in Figure 1 and further detailed in [19].
The modeling requires the following inputs shown in the figure:
(a)
Data about local weather conditions to account for additional fuel consumption from the use of climate control auxiliaries for heating and cooling the bus cabin in winter and summer seasons, respectively.
(b)
Data about local driving patterns on the bus route, represented by the variation of bus speed over time (known as the vehicle driving cycle) and reflecting the stop duration and frequency along the bus route for the trip length, capturing the traffic conditions and driver behavior. This is to account for real-world fuel consumption from local traffic patterns (namely peak traffic, off-peak, severe congestion, and a BRT-type of operation on a dedicated lane as is currently under consideration for the GBA).
The data for local driving patterns were developed by first conducting an on-road travel survey using a GPS device placed on board buses currently in operation in the GBA as part of the existing informal bus network. Data were collected over a period of five months on weekdays from 5:00 a.m. to 7:30 p.m., with sample data collection for late evening and night times, weekends, and holidays. The collected data capture bus operation during busy work commutes, which typically involve low speeds and frequent stops of relatively short duration. In addition, the data collection over an extended duration of several months helped capture variability in traffic conditions and driving patterns, including differences across weekdays and weekends.
The BRT driving cycle was developed using design data as described in [20], which has fewer stops (every one kilometer) and allows for relatively higher speeds. The collected data serves as the basis for constructing representative driving cycles for all modes of bus operation, following a similar methodology as for passenger vehicles detailed by the authors in [21]. Drive cycles were generated using the microtrip-based method, and key parameters (speed, acceleration, idle time, and stops/km) closely matched the full dataset, with low error margins. As a result, four driving cycles were modeled, representing the different types of traffic conditions encountered in GBA at different times of the day, namely:
  • Severe congestion conditions characterized mainly by very low speeds (6 km/h on average) and very long idle times (67% of trip time), as observed in GBA during work commute times.
  • Peak traffic conditions characterized mainly by low speeds (11 km/h on average) and long idle times (36% of trip time) with frequent acceleration and deceleration, which are typical throughout the day outside of work commute times.
  • Off-peak traffic conditions characterized mainly by free-flow speeds (20 km/h on average, 21% idle time) on urban roads and highways, observed during late evening times and non-working days; and
  • BRT service conditions characterized mainly by relatively higher speeds (36 km/h on average, 23% idle time) on the proposed dedicated highway lanes.
(c)
Vehicle characteristics for the energy and emissions modeling of the considered bus technologies, such as the mass of the vehicle and its main components and the vehicle’s powertrain control strategies dictating the consumption of the fuel and the electric energy stored in the battery. The required vehicle characteristics were obtained from original equipment manufacturer (OEM) bus data sheets. The characteristics of the reference bus are shown in Table 1, and the total mass of each of the considered bus technologies is shown in Table 2.
The power consumption of bus auxiliary systems, such as doors and air conditioning, were accounted for in the bus models as they can significantly affect fuel consumption. The auxiliaries’ power loads are presented in Table 3.
(d)
Fuel pathway for charging electric buses, modeled for the case of Lebanon using all stationary and transportation processes needed to generate electricity at the power plant and distributing it to electric chargers at the stations. For stationary processes such as fuel storage, processing, production, and distribution at the pump, the data required consist of process efficiencies for quantifying the energy needed and the environmental emissions from the process. For fuel transportation processes, the data consist of energy intensities to transport the fuel. The required data were obtained from the concerned government ministries, oil-importing companies, and governmental oil authorities, as detailed in [22].
Following the technical assessment, a cost assessment was developed to estimate the total cost of ownership, operation and maintenance (O&M), and installation of refueling and charging infrastructure for the considered bus technologies. Applicable estimates and assumptions used in this study are detailed in Table 4.
The costs of unexpected failures are not considered for any technology as they are outside the scope of this study. The fleet operating and management costs and all associated labor costs are assumed equal for all bus technologies due to lack of data and, therefore, not considered in the cost assessment. All capital investments (vehicle and infrastructure) are assumed to be made at the start of operations.

3. Results and Discussion

The modeling results presented in this section consist of energy consumption, greenhouse gas emissions, and total costs for each of the considered bus technologies. A cost–benefit analysis is then presented to prioritize the different bus technologies by their environmental contributions in terms of savings in GHG emissions relative to the reference diesel bus.

3.1. Energy Consumption

The energy consumption results for each of the considered bus technologies in normal (off-peak) GBA driving conditions are shown in Figure 2a. The diesel bus is considered the reference bus against which the fuel consumptions of all other technologies are compared in terms of liter gasoline equivalent (lge) per 100 km. Note that these results are for full bus occupancy as a conservative estimate.
As shown in Figure 2a, battery electric buses are the most efficient technology out of all those considered, as they consume 61.1% less liter gasoline equivalent (lge) per 100 km than diesel (noting that electric bus consumes no actual fuel on board, so the reflected consumption is only to account for the power used from the battery). Hybrid technology is 19.9% more fuel efficient than diesel due to the partial reliance on the electric energy supplied by the battery on board, as well as on the brake energy recovery system available in these powertrains. A CNG bus is 23.2% more energy consuming than diesel due to the lower energy content of natural gas compared to diesel fuel. However, CNG technology produces fewer of the pollutant emissions harmful to human health, as discussed in the next section on emissions.
Figure 2b shows the variation in energy performance of the reference diesel bus technology under different driving conditions. The results show that improved fuel consumption is achieved as the driving conditions become more free-flowing relative to severe congestion [27], from 41% fuel savings for peak traffic conditions to 80% for BRT operation. This shows that BRT operation is significantly more fuel efficient than standard bus operation even in off-peak traffic. The differences are mainly due to the higher average speeds possible on BRT dedicated lanes and the typically fewer number of stops in BRT service, contributing to higher powertrain efficiency. A similar trend is observed for all other bus technologies, with smaller variation for electric buses since they are the most robust against variations in driving conditions [12].
All technologies become less efficient when accounting for the use of climate control auxiliaries for cooling or heating the cabin due to the required additional fuel consumption for this purpose. In mass transit, the use of climate control auxiliaries is essential for ensuring passenger comfort in the cabin, which can in turn affect ridership levels. This is why it is important to assess the impact of climate control on the actual performance of bus technologies compared to that reported by OEMs. On average across the four driving scenarios, modeling results show additional consumption of 29.2% for diesel bus, 26.4% for CNG, 40.8% for hybrid, and 44.7% for electric buses from the use of climate control auxiliaries compared to operation without climate control. This shows that electrified buses are significantly more impacted by the use of climate control auxiliaries, which contributes to increasing their O&M costs. Furthermore, this significantly affects the driving range of electric bus, requiring schedule adjustments to charge the bus more frequently in extreme weather conditions [28].
Note that while the results above are specific to the bus configurations in this study and are also context specific for the case of Lebanon’s relatively mild weather conditions and particular traffic conditions, they are nonetheless generally comparable to those found in the literature for similar bus technologies and weather and traffic conditions [29].

3.2. GHG and Pollutant Emissions

The modeling results for GHG emissions (CO2, CH4, and N2O) are shown in Figure 3 for all bus technologies under the four driving scenarios considered. The emissions are estimated for the worst-case scenario (full bus capacity and operating with the use of climate control auxiliaries). Emission calculations for electric bus technology are conservatively done on a WTW basis instead of a TTW (or tailpipe) basis in order to level the comparison with the other technologies, since electric buses have no tailpipe emissions as the use of the battery for on-road operation does not consume hydrocarbon fuels. Two scenarios for electric buses are modeled to reflect the current (year 2025) “dirty” electricity production mix (labeled Mix 2015 as it hasn’t changed since the reference year 2015) in Lebanon, which currently still relies on the use of heavy fuel oil (HFO) and diesel to generate electricity in power plants; and, a cleaner future scenario (year 2030) relying on natural gas and a share of renewable energy sources (Mix 2030), as per existing government plans [30].
Following the estimated energy consumption trends, the lowest GHG emissions for all bus technologies occur under BRT operation and are significantly lower than those estimated under severe congestion conditions. Electric buses, which have zero tailpipe emissions under all driving conditions, consume electric energy from power plants when recharging batteries on board and, therefore, have the highest contribution to GHG emissions under the current polluting Mix 2015. However, under the cleaner Mix 2030, electric buses become the greenest technology in all operating conditions. CNG and hybrid bus technologies have comparable performances in more flowing traffic (less than 5% difference in their GHG emissions in off-peak and BRT operation), but the differences become significantly pronounced in congested traffic (reaching 62.7% higher GHG emissions for CNG in severe congestion). This is due to the additional fuel consumption for CNG technology, while hybrid buses can rely more on zero-emission battery power in those conditions.
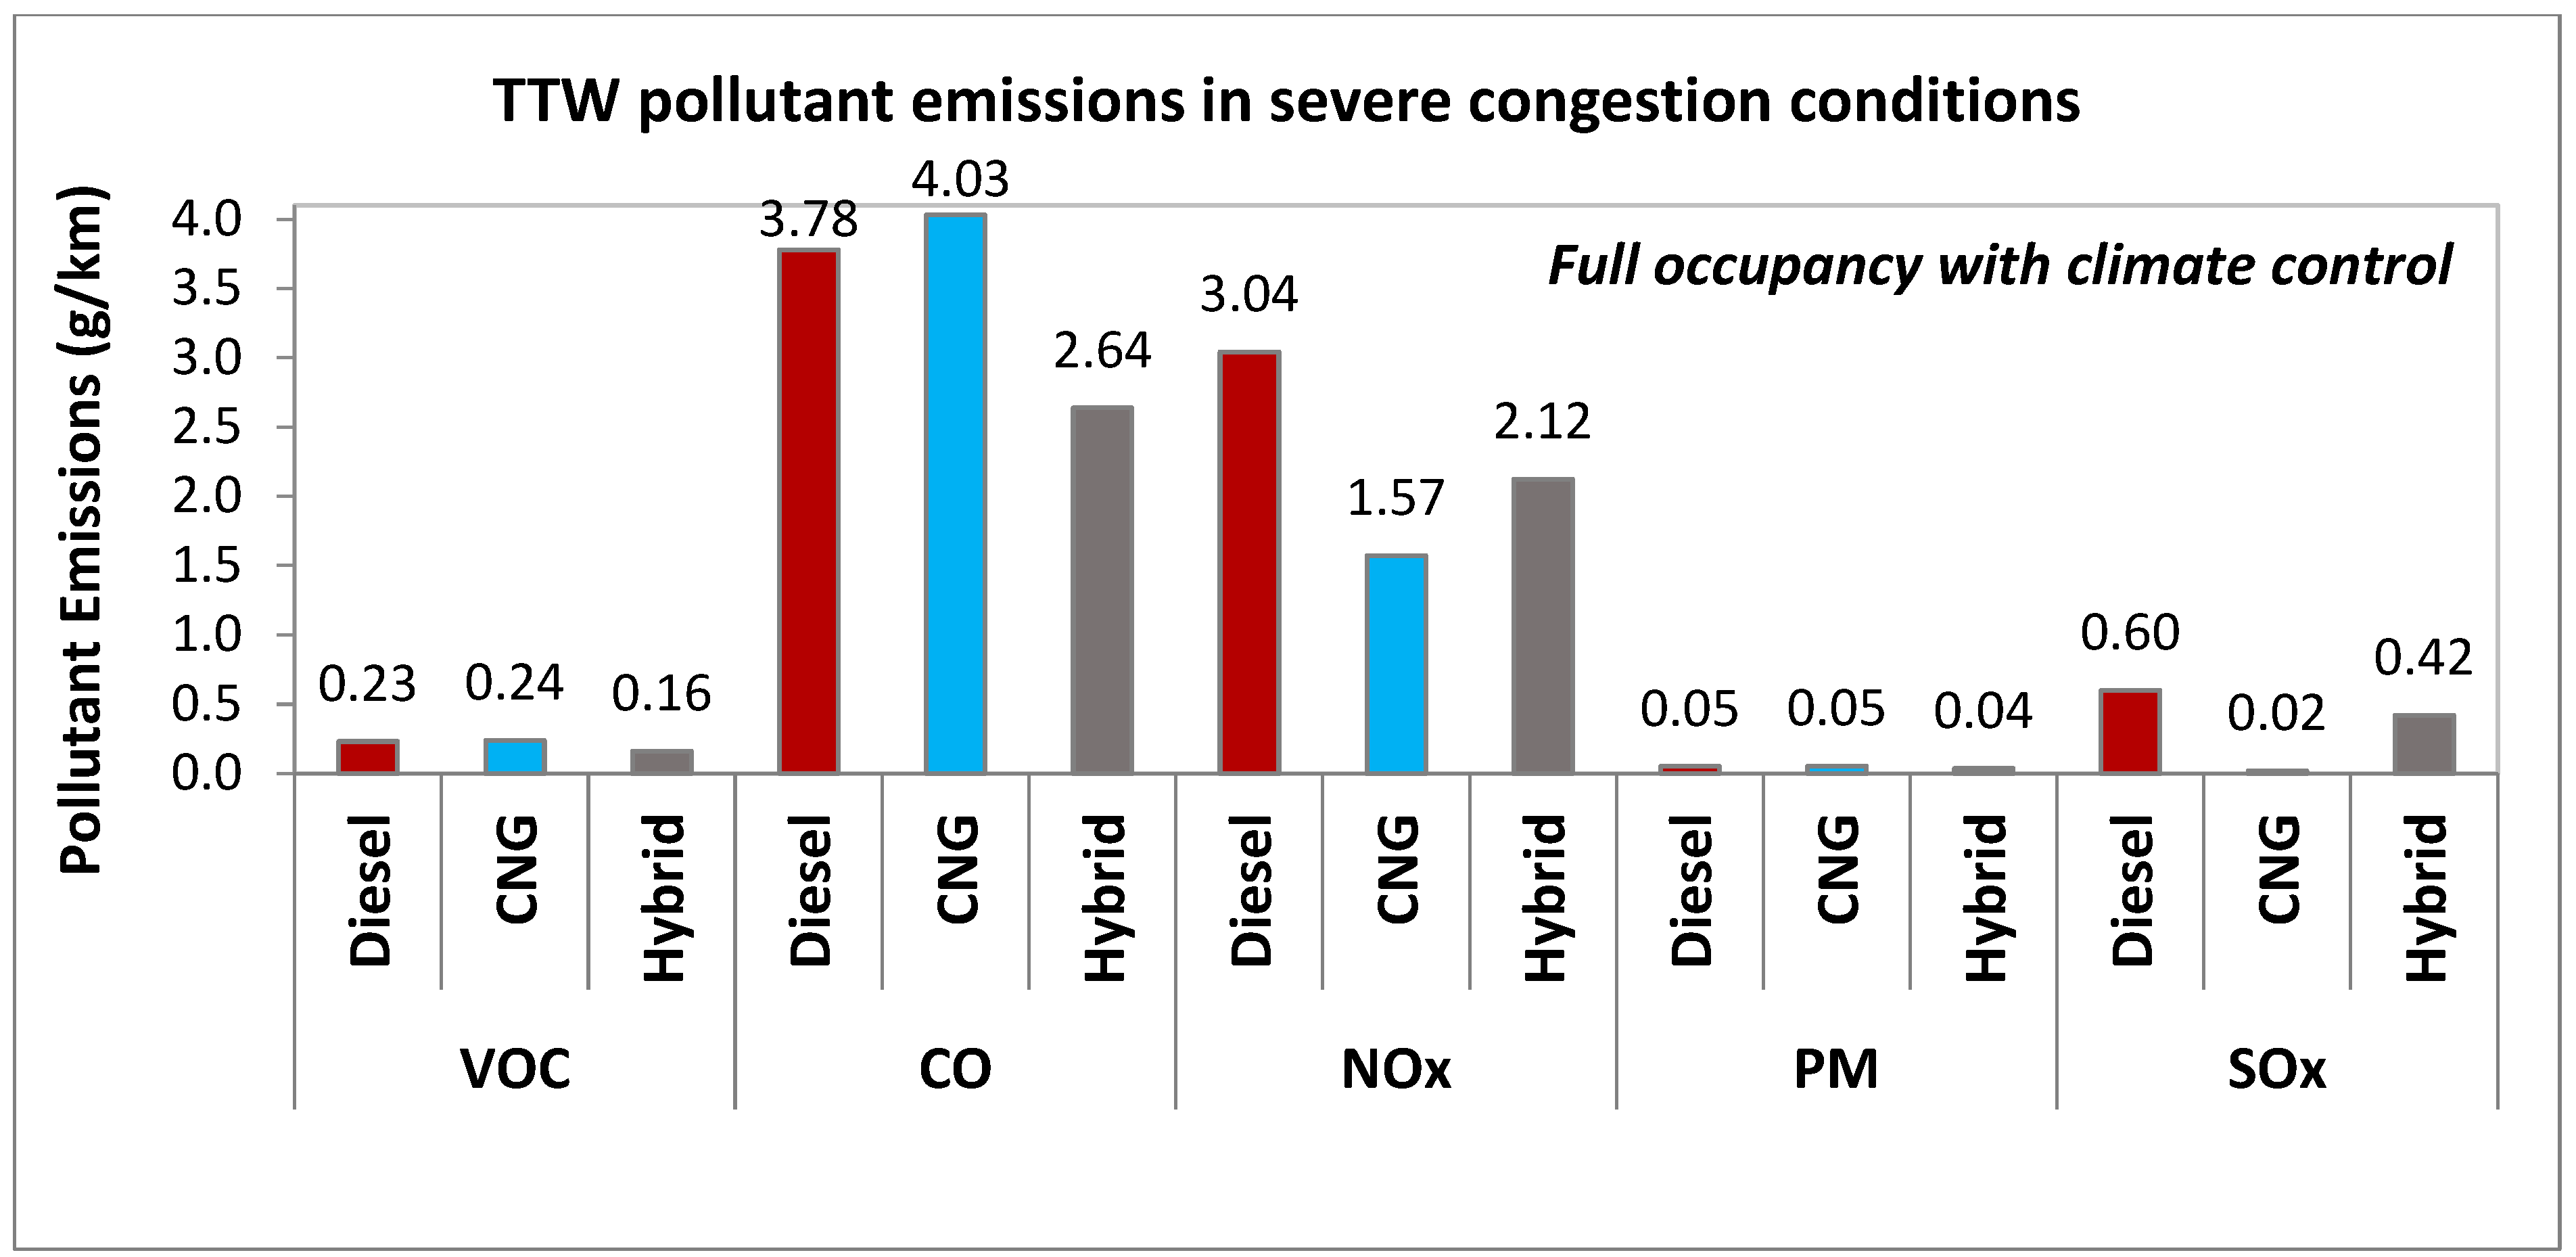
Pollutant emission results are summarized in Figure 4 for atmospheric pollutants relevant to air quality, namely, volatile organic compounds (VOC), carbon monoxide (CO), nitrogen oxides (NOx), sulfur oxides (SOx), and particulate matter (PM), estimated on a TTW basis to reflect their impact on human health inside the city. The results shown are for severe congestion conditions with use of climate-control auxiliaries as a conservative estimate of the worst-case scenario, noting that electric bus technology has zero tailpipe emissions and therefore does not appear in the figure below. Hybrid technology comes out as the better performer for VOC, CO, and PM; however, this only holds true for the severe congestion conditions shown below. Under all other driving conditions, CNG technology is comparable or better than hybrid buses for all pollutant emissions [12]. This makes CNG buses relatively attractive for cleaning up polluted cities in developing countries, as is the case of Lebanon’s GBA, especially since road transport in Lebanon is the largest contributor to CO emissions [31].
And as with GHG emissions, dedicated lane service with a BRT type of operation can make all bus technologies even more effective contributors to cleaning the air quality inside the city (see [12] for a detailed comparison of all pollutant emissions).
It is also noteworthy that under the 2030 electricity production mix, the WTW modeling results show a significantly reduced impact at power plants due to the reliance on natural gas and renewables as less-polluting energy sources for power generation [12]. This means that the introduction of electric bus technology can clean up the environment inside the city without negatively impacting urban areas where power plants are located, especially when also considering the reduction in car use for commuting as urban and suburban residents are given the option to switch to modern public buses [32].

3.3. Total Costs

Table 5 provides the estimated total costs for each bus technology, including bus purchase, operating and maintenance (O&M), and applicable infrastructure costs computed over the service life of the bus for each of the four considered driving conditions. These costs do not include any government subsidy as per the baseline scenario defined in Section 2.
Table 6 breaks down the total costs above to present the estimated acquisition costs per bus kilometer for each technology computed over the service life of the bus.
All alternative-fuel bus technologies have a higher acquisition cost than diesel buses as the most mature technology, with electric buses being significantly higher due to the cost of the large battery pack. This is a discouraging factor for operators when it comes to transitioning away from diesel bus technology, but which can be compensated for with government subsidies, battery-swapping stations, and/or optimal battery sizing adapted for local driving and route service conditions [33].
A second breakdown of the total costs is given in Table 7, which summarizes the estimated O&M costs per bus-kilometer traveled over the estimated average mileage of 100,000 km per year under each operating condition for each of the considered technologies.
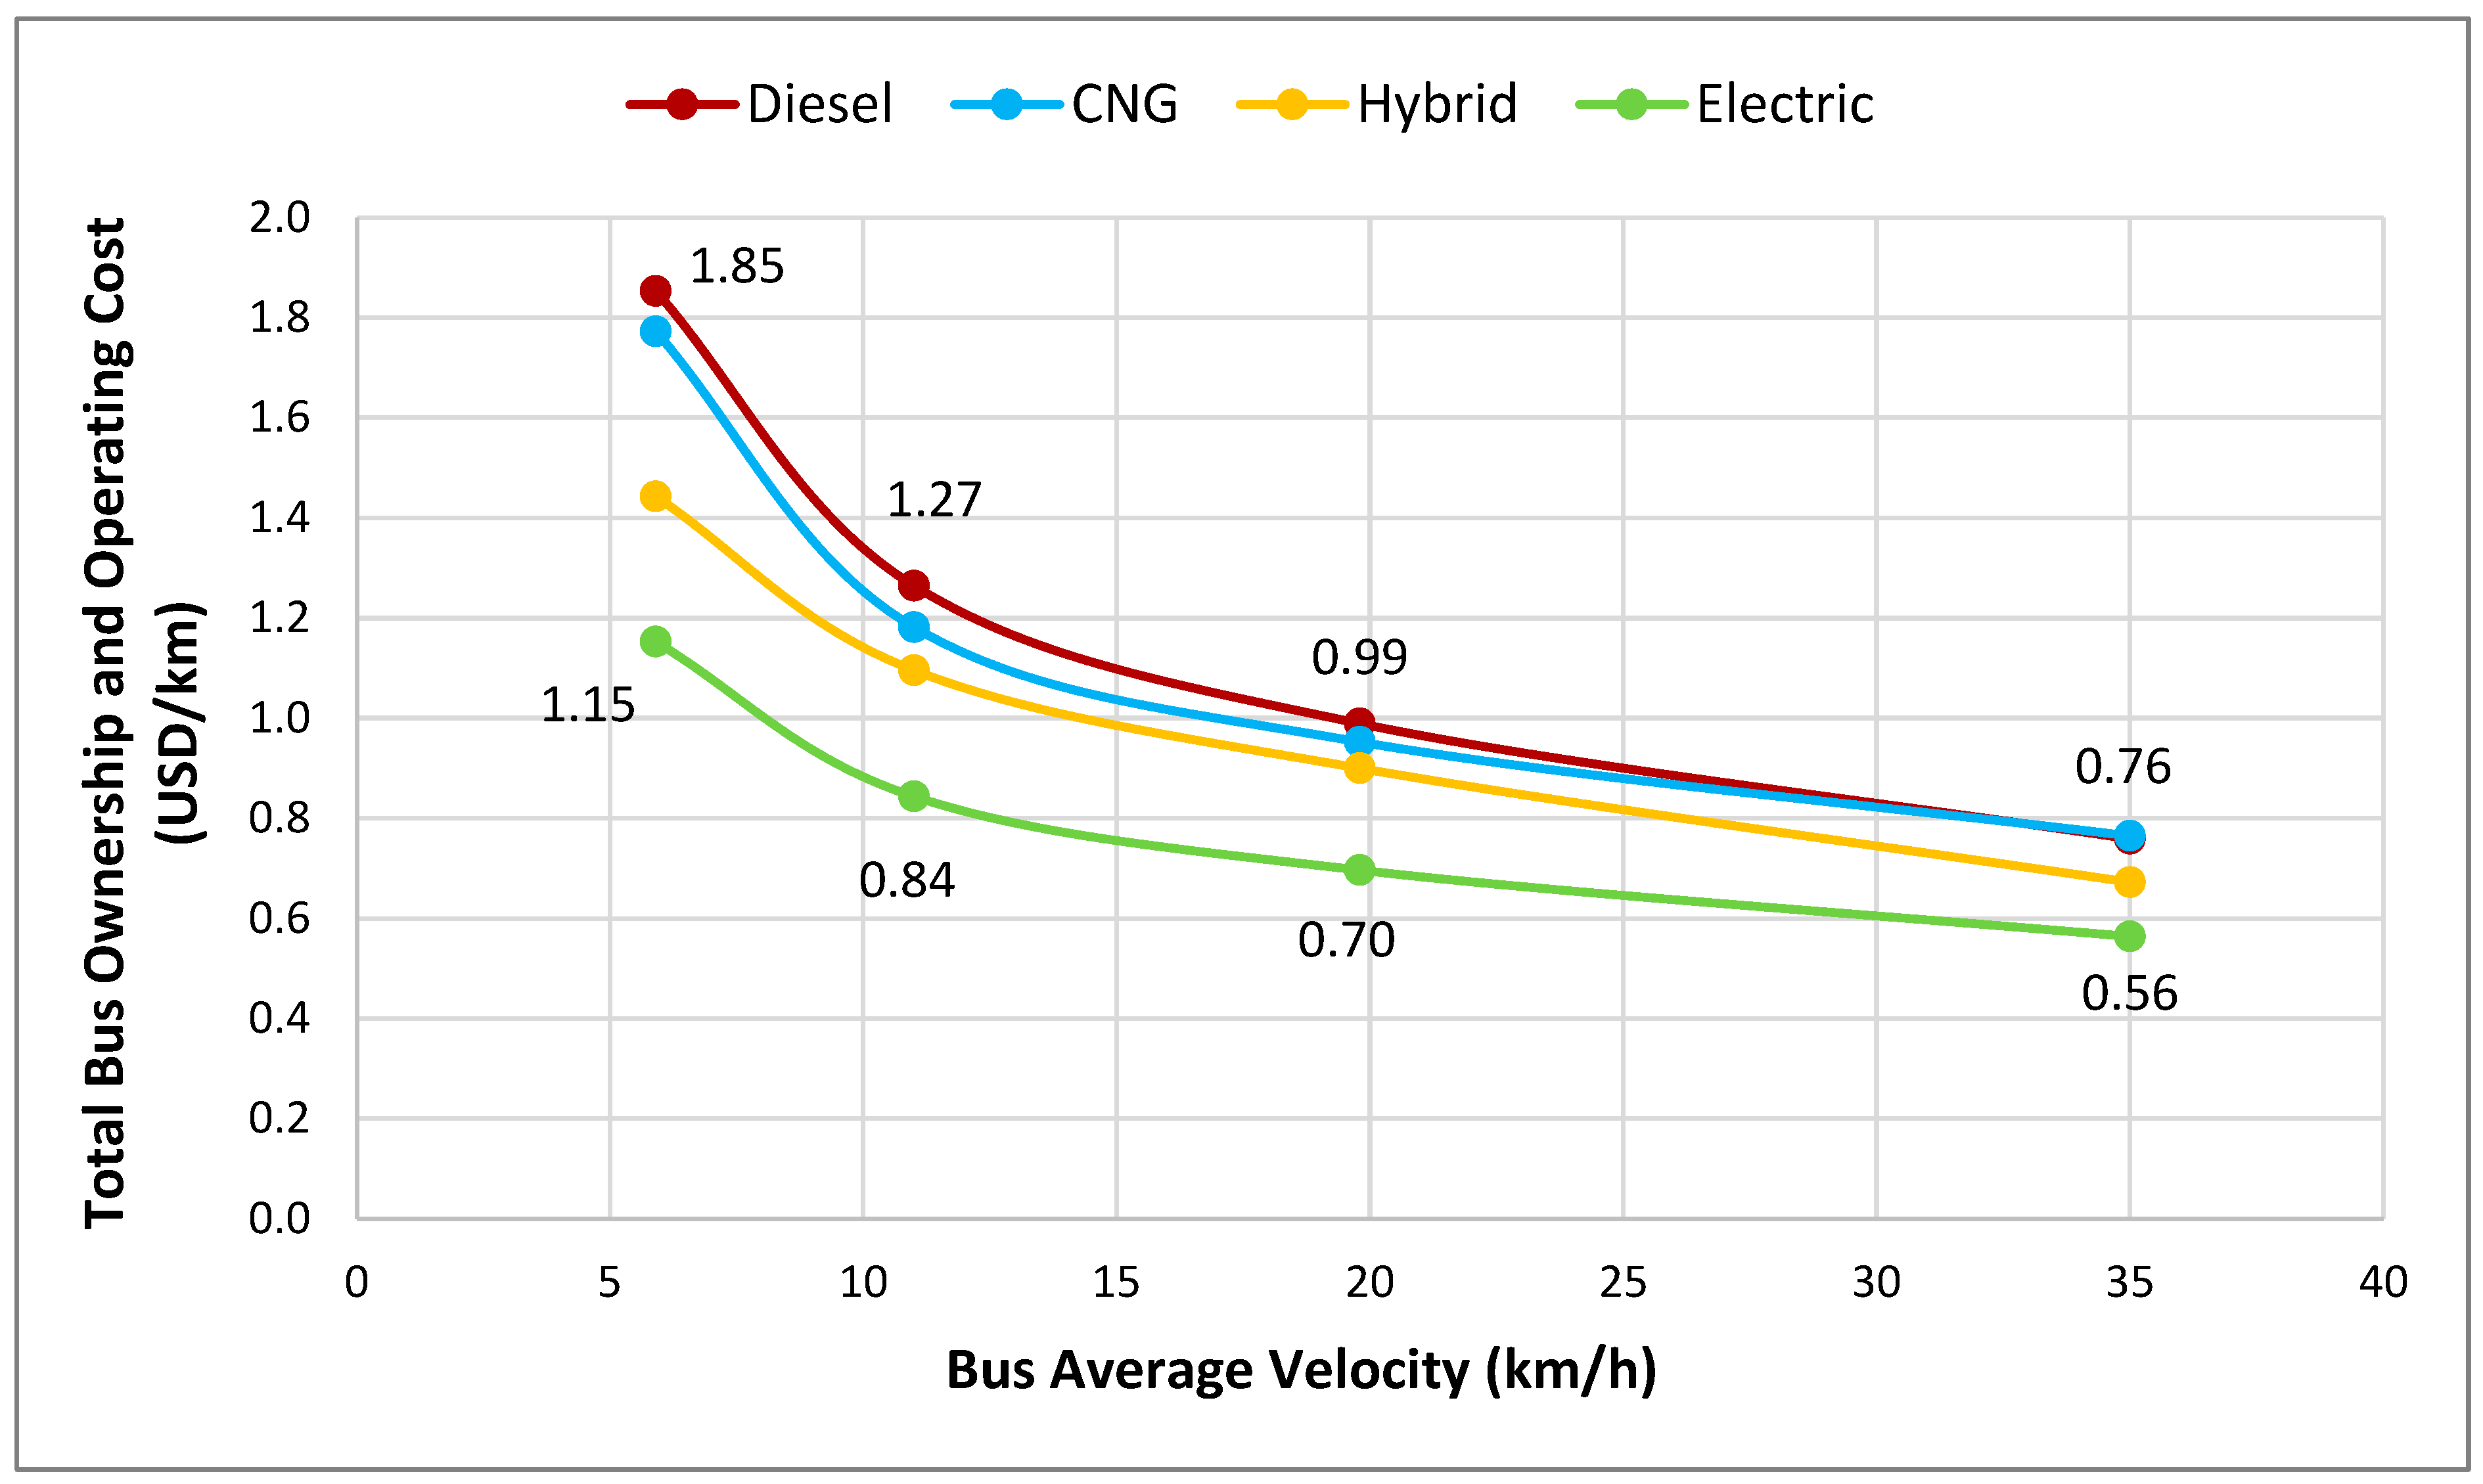
The results show two main trends: first, that electric buses have the lowest operating cost out of all the evaluated technologies, less than diesel by about 29.3% in normal (off-peak) driving conditions. This is expected since there are fewer components in the electric bus powertrain than in other bus technologies with conventional engines, where a number of moving parts also require frequent replacement [34]. The second observed trend is that driving conditions greatly impact bus operating costs for all technologies, as illustrated in Figure 5. Specifically, bus O&M costs for every bus technology are greatly reduced when operating at higher average speeds as can be achieved in BRT operation on dedicated lanes, ranging between a 51.3% reduction for electric buses and 58.9% for diesel. This is because there is less fuel consumption and less wear and tear in free-flow conditions, with all engine technologies operating at higher efficiency [35].
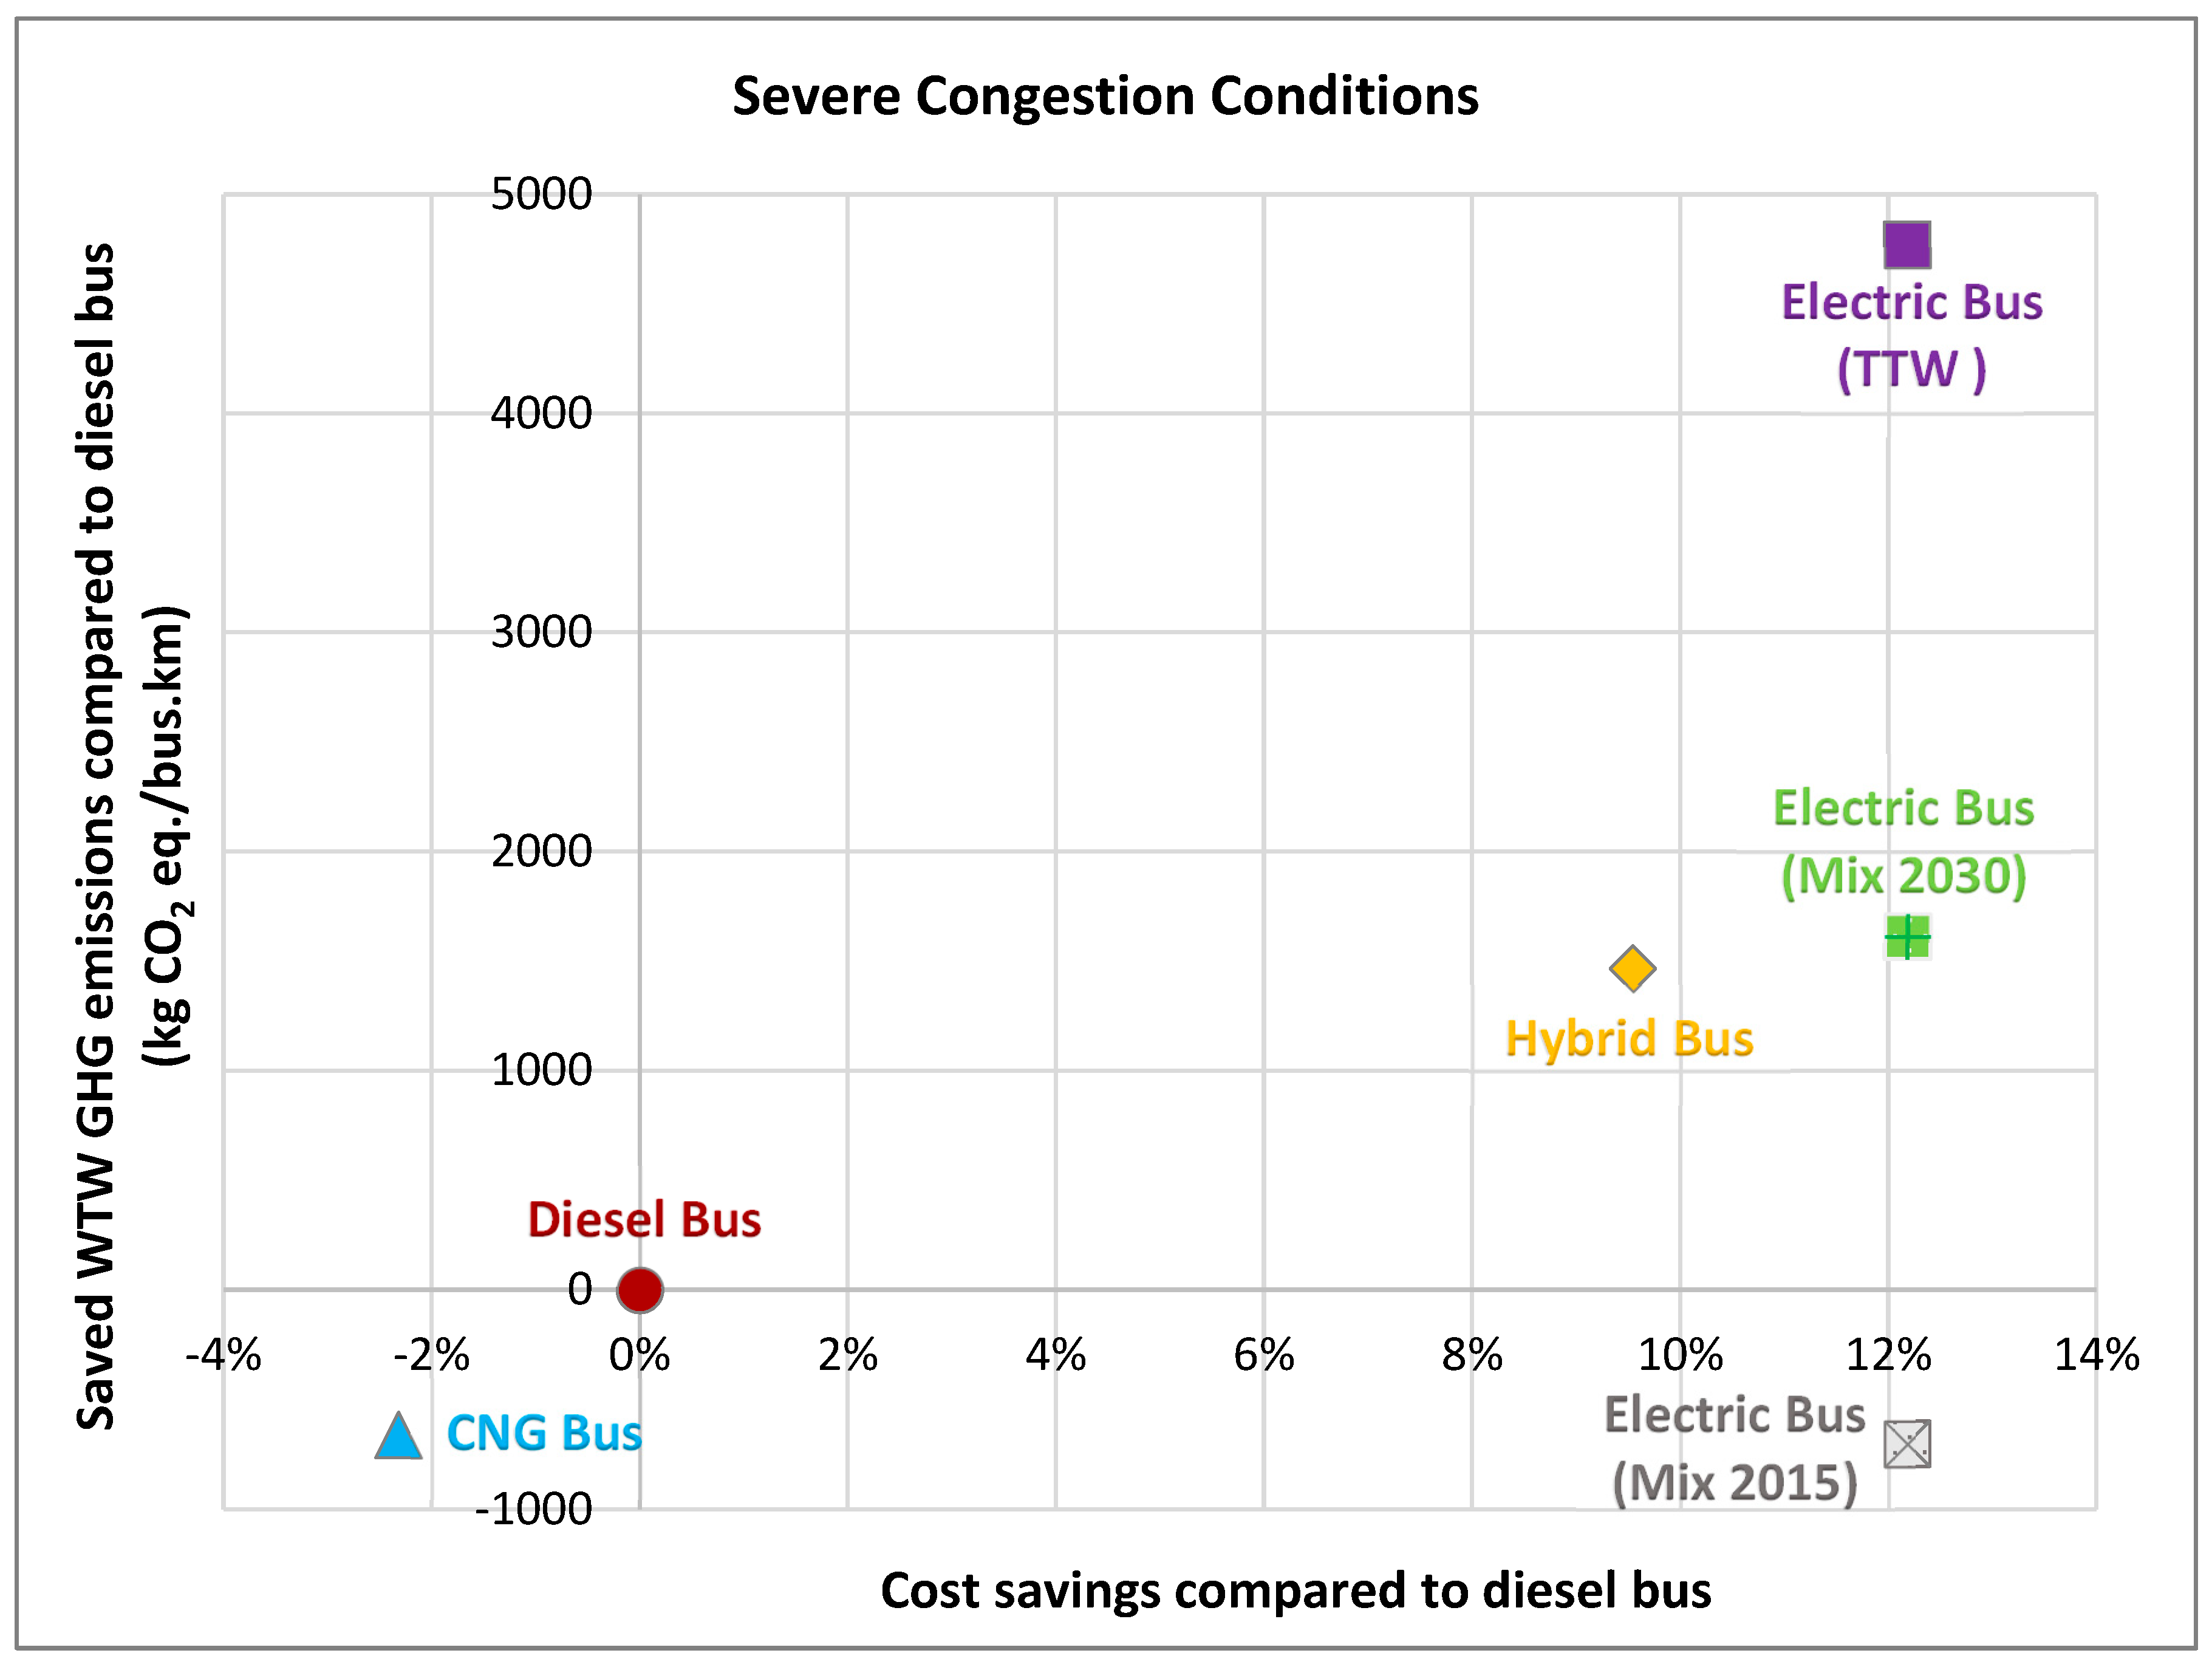
The WTW GHG emission savings for each technology over the reference diesel bus were attributed to the corresponding total bus cost in order to prioritize the different technologies by their environmental-to-cost performance. The results are illustrated in Figure 6 for severe congestion conditions as the more common operating condition during work commutes in GBA.
Results show that hybrid buses provide positive environmental-to-cost performance over diesel buses, while CNG buses are not competitive in severe congestion due to their lower engine efficiency in these conditions. Electric buses are only effective using the 2030 electricity production mix, but their performance is only comparable to hybrid technology in the considered scenario of zero government subsidies for bus technologies (about 10% more reduction in GHG emissions for 3% less total cost than hybrid buses). This is due to the lower maintenance cost of electric buses compared to the other conventional engine technologies. This means a clean electricity mix is essential to be able to operate electric buses in an environmentally beneficial way, but also that this technology is not very competitive without government subsidies. However, battery technologies are advancing at an accelerated pace, which is expected to extend battery service life. In this case, zero battery replacement cost could be assumed over the vehicle service life, which would make electric and hybrid technologies even more cost-effective.
Note that even under the current dirty electricity mix 2015, electric buses are more cost-effective than diesel buses, though not more environmentally beneficial. The TTW results are only shown to illustrate the importance of considering power-plant emissions since TTW figures overestimate the environmental benefits of battery-electric technology, in this case by about 67% additional GHG reduction than on a WTW basis. But it is also important to note that since the above figure only illustrates performance in worst-case (severe congestion) conditions, then the overall performance of each bus technology will be more beneficial when averaging it out over all modes of operation.
Furthermore, the transition to alternative-fuel bus technologies typically benefits from a number of incentive schemes, many of which are already commonplace worldwide to encourage new technology adoption [36], such as tax exemptions and reduced customs and registration fees [5]. The incentives mainly intend to reduce the bus purchase and ownership costs, which can be substantially higher for newer bus technologies compared to conventional diesel buses. For example, in neighboring Jordan, a country facing similar economic challenges, the government recently reduced the sales tax and customs duties by more than 50% for operators replacing their buses with newer models, making electric buses more competitive and increasing their adoption rates [37].
Along those lines, Table 8 presents the estimated economic incentives for each technology based on the proposed bus purchase cost subsidy scheme under a potential external funding scenario for Lebanon (as introduced in Section 2). Note that this assumes the same level of purchase subsidy across all technologies, which gives battery-electric technology a competitive advantage over other bus technologies since the electric-vehicle purchase cost is highest due to the high cost of the battery.
Table 9 presents the subsidized total costs (including purchase, O&M, and infrastructure costs with government subsidies) for each bus technology, computed over the service life of the bus based on the defined government subsidy scheme for all driving conditions.
The subsidized total cost figures show a marked improvement in the competitiveness of diesel bus technology, becoming much more efficient when operated in a BRT system and bridging the gap with electric buses since diesel engines have their highest efficiency in free-flow conditions. This also means CNG technology becomes even less competitive compared to diesel in BRT operation. This is due to the relatively higher ownership costs of the bus technology, in addition to the higher fuel consumption due to the higher weight of the storage tanks (heavy high-pressure vessels) as a consequence of the lower fuel-energy density of natural gas. However, it should be kept in mind that the environmental performance of CNG is much better than diesel when it comes to cleaning up highly polluted cities, as is common in developing countries, specifically for NOx and SOx pollutants.
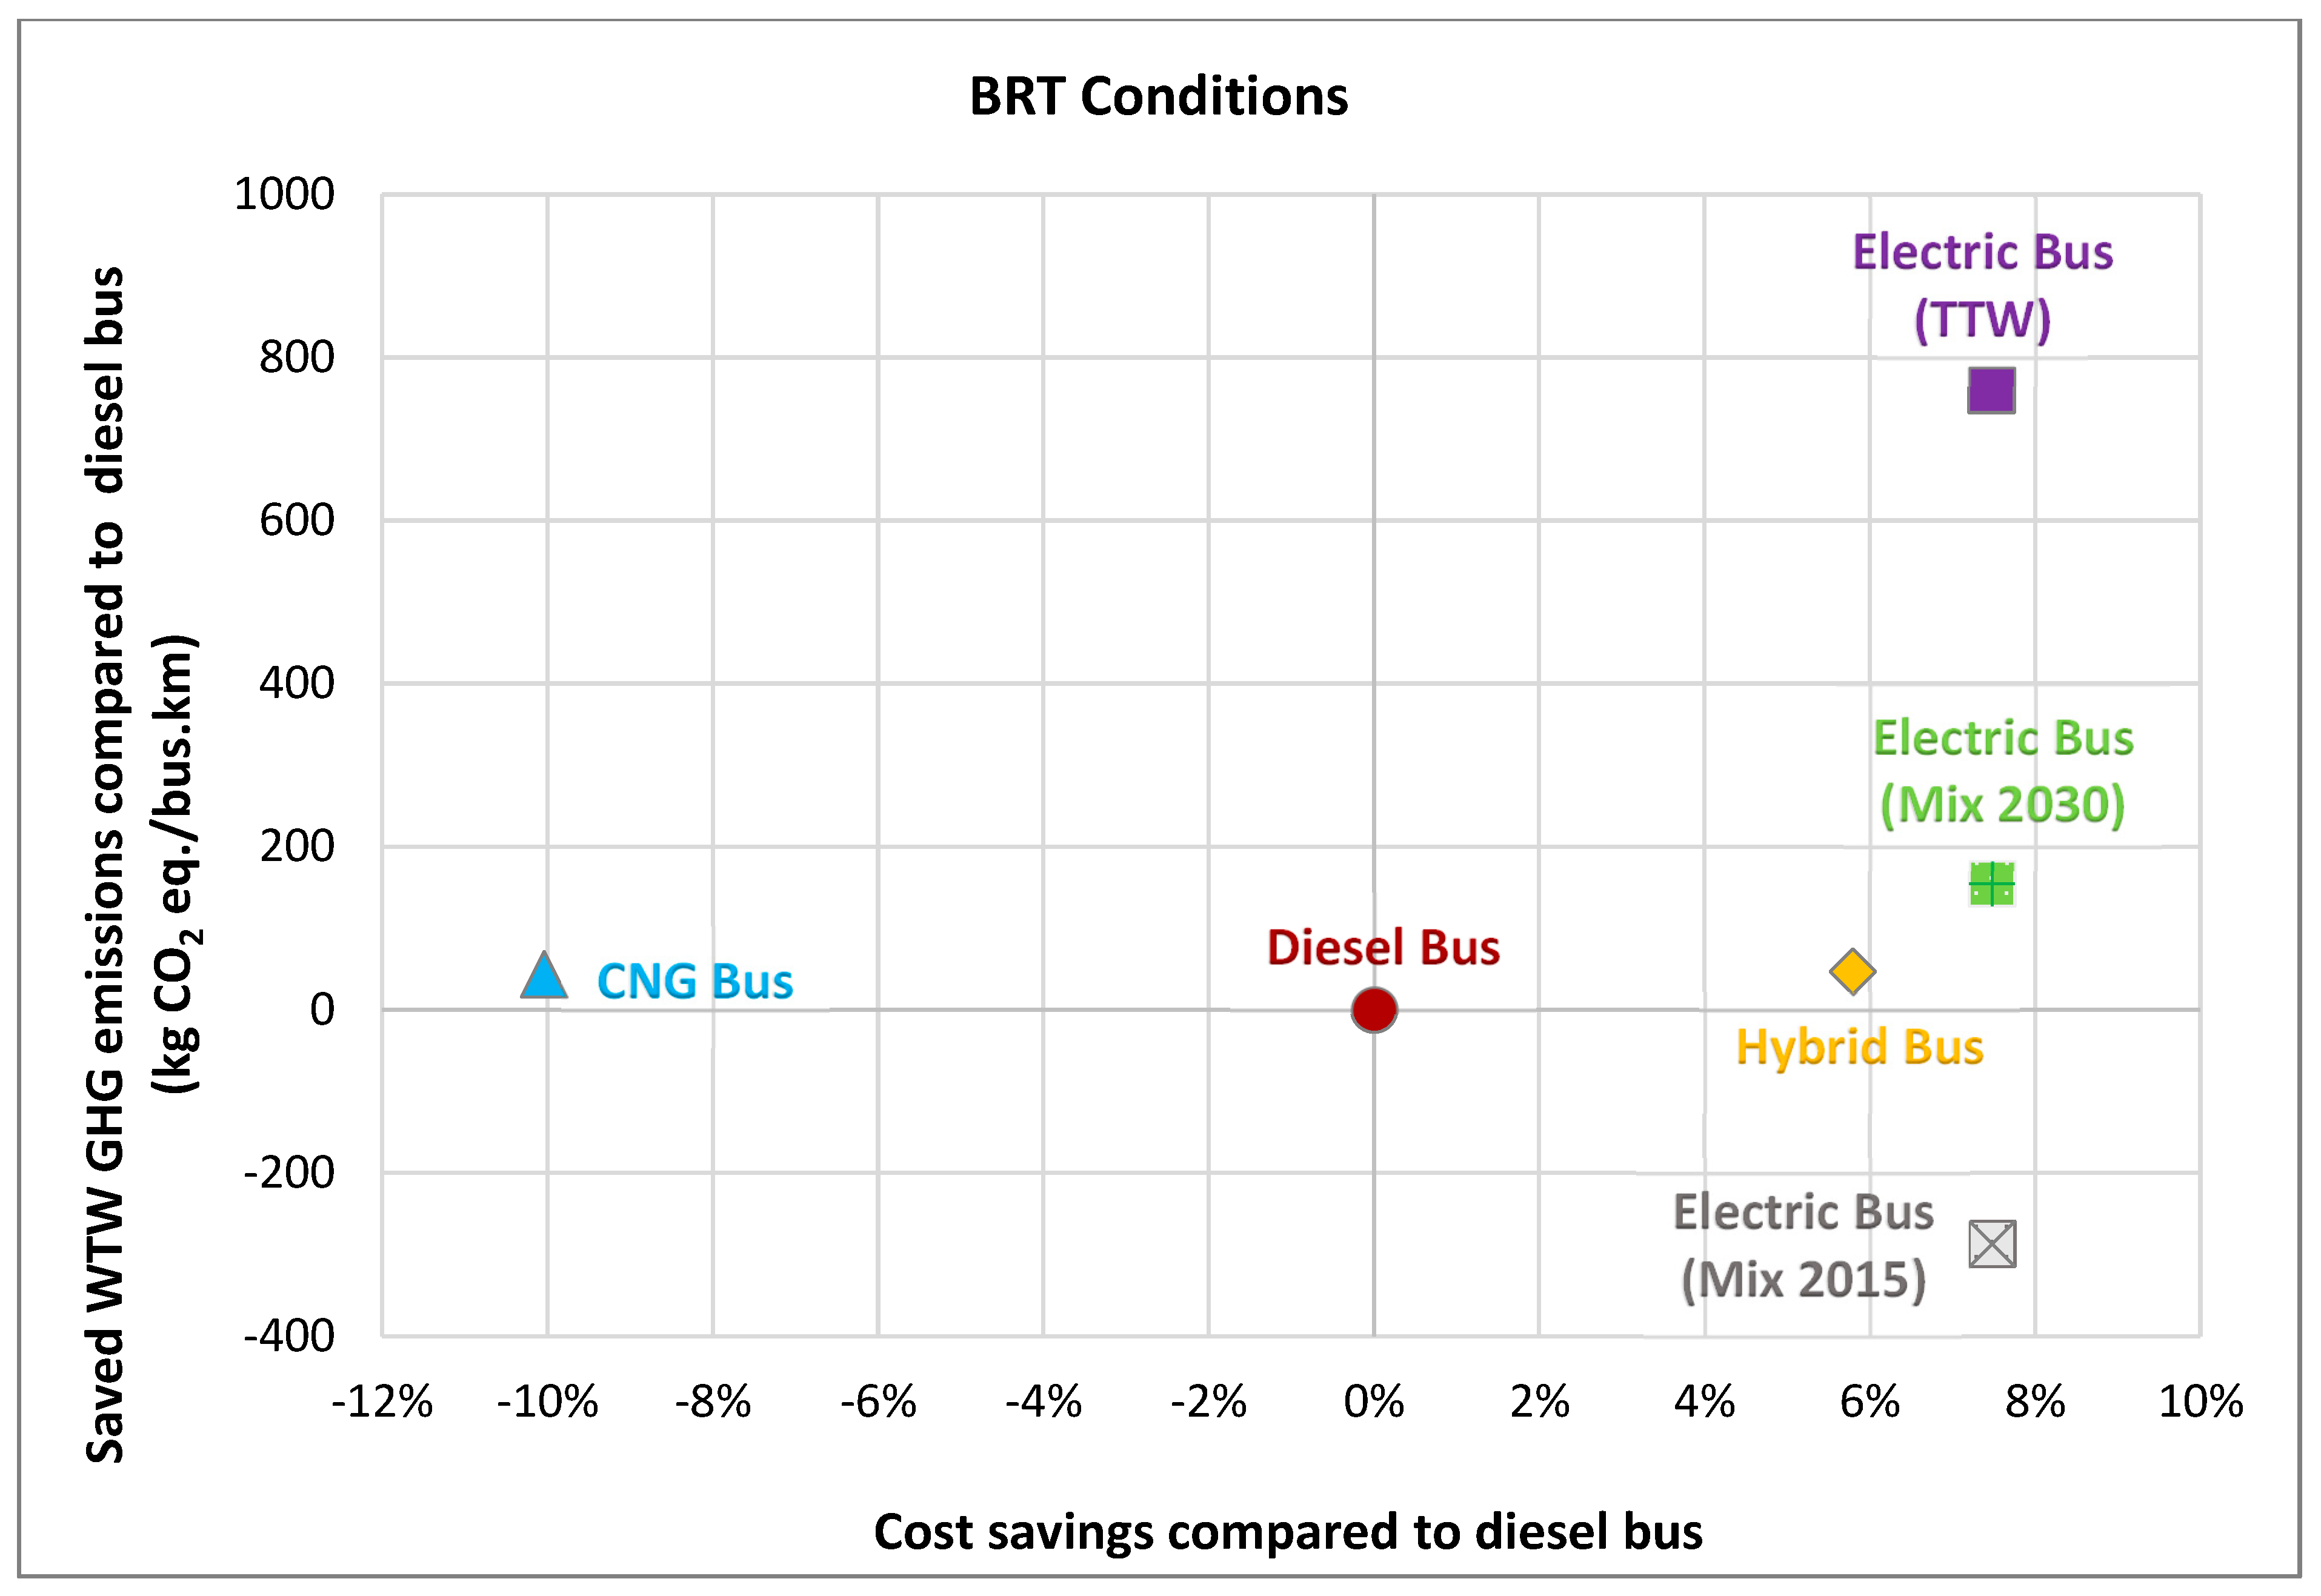
The performance of the considered technologies under free-flow conditions typical of BRT operation on a dedicated lane are illustrated in Figure 7. Only subsidized costs will be considered further in this study based on previous experience in developed countries where government support has been typically needed to ensure adoption of new vehicle technologies.
As discussed above, diesel buses under BRT conditions are able to bridge the gap with hybrid and electric technologies for both environmental and cost savings due to their improved engine efficiency in free-flow conditions, and put further distance with CNG technology, but only in terms of cost savings. And while battery-electric buses remain the top-performing technology with approximately 8% cost savings over diesel, this is only due to the high (80%) and equal subsidy level across all technologies, which is not reasonable in developing countries. This is in agreement with other studies in similar contexts [38,39,40]. For subsidy levels below approximately 60% of the bus purchase cost, electric bus technology becomes more costly to own and operate than diesel in BRT operation, while hybrid technology requires at least a 50% subsidy to remain cost competitive compared to diesel buses.
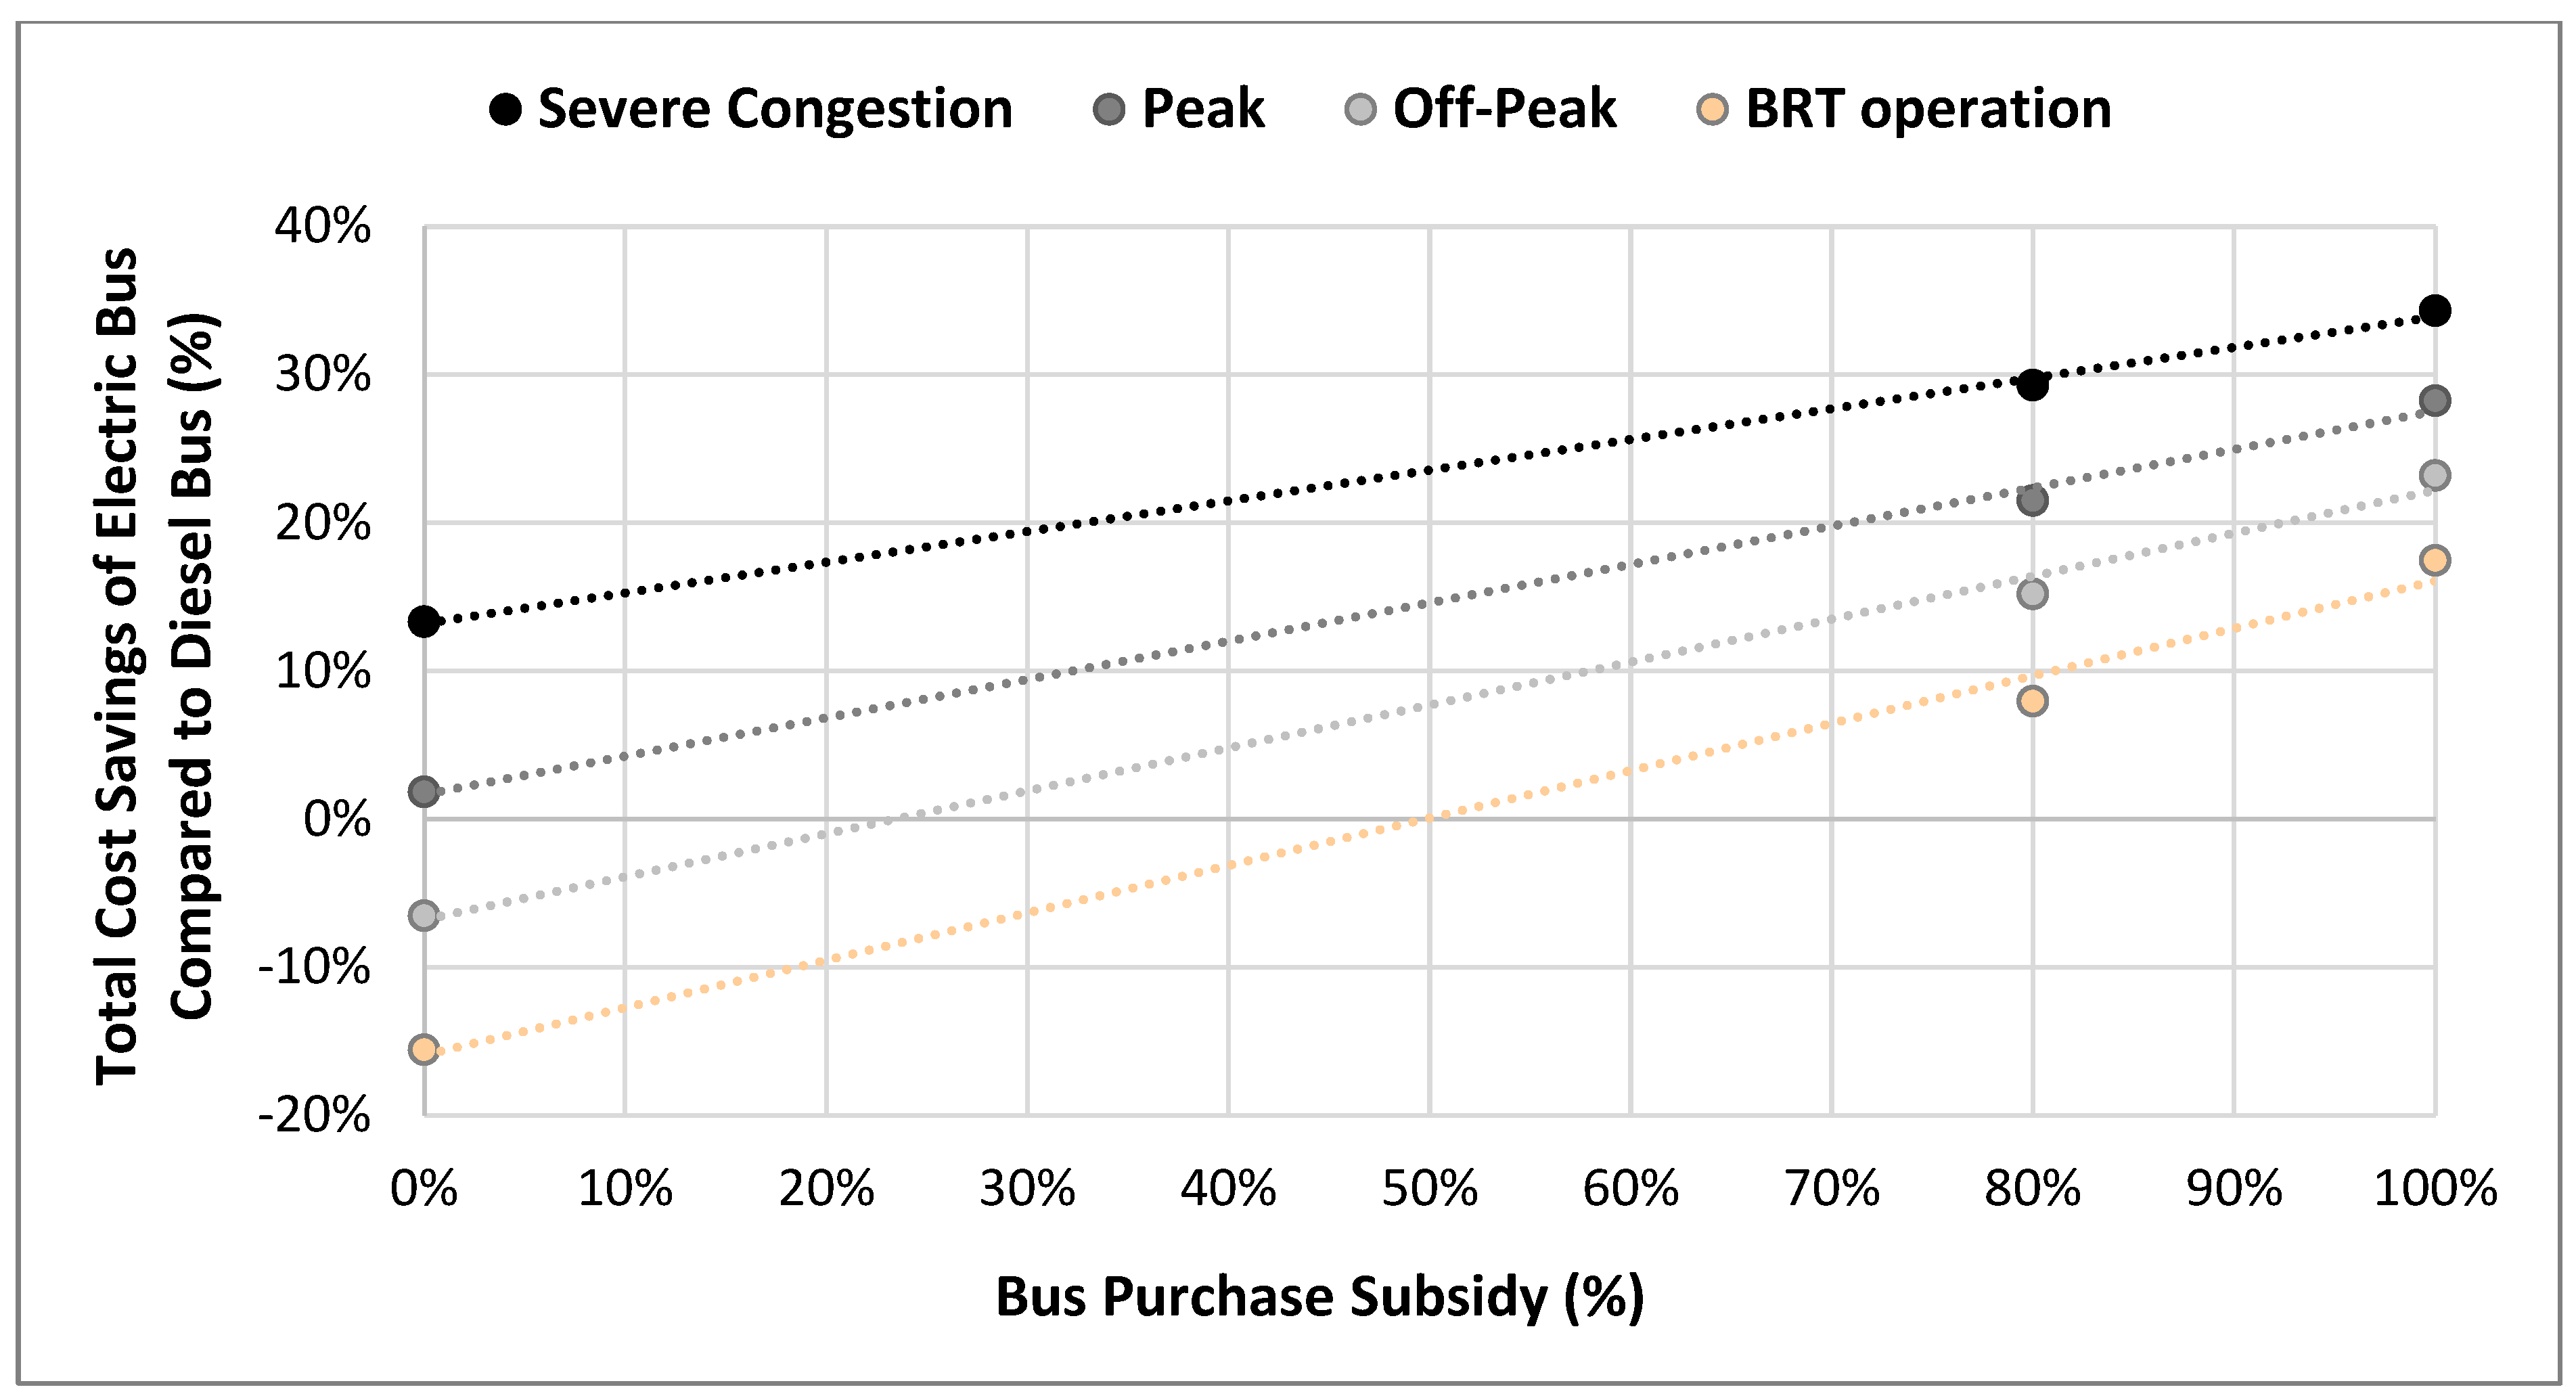
Figure 8 further illustrates a sensitivity analysis on the required subsidy levels for electric bus technology relative to the reference diesel bus over the service life of the bus under all driving conditions. The results show that electric buses are always cost-effective in congested driving conditions, even when no subsidy is considered. However, diesel buses are more cost-competitive in less congested conditions, unless significant subsidies of approximately 30% and above are provided on the bus purchase cost for electric technology in this case. Note that purchase and O&M costs of electric bus technology are on a decreasing trend as the technology is improved and adoption reaches economies of scale, which can make it competitive under all driving conditions for lower subsidy figures [41].
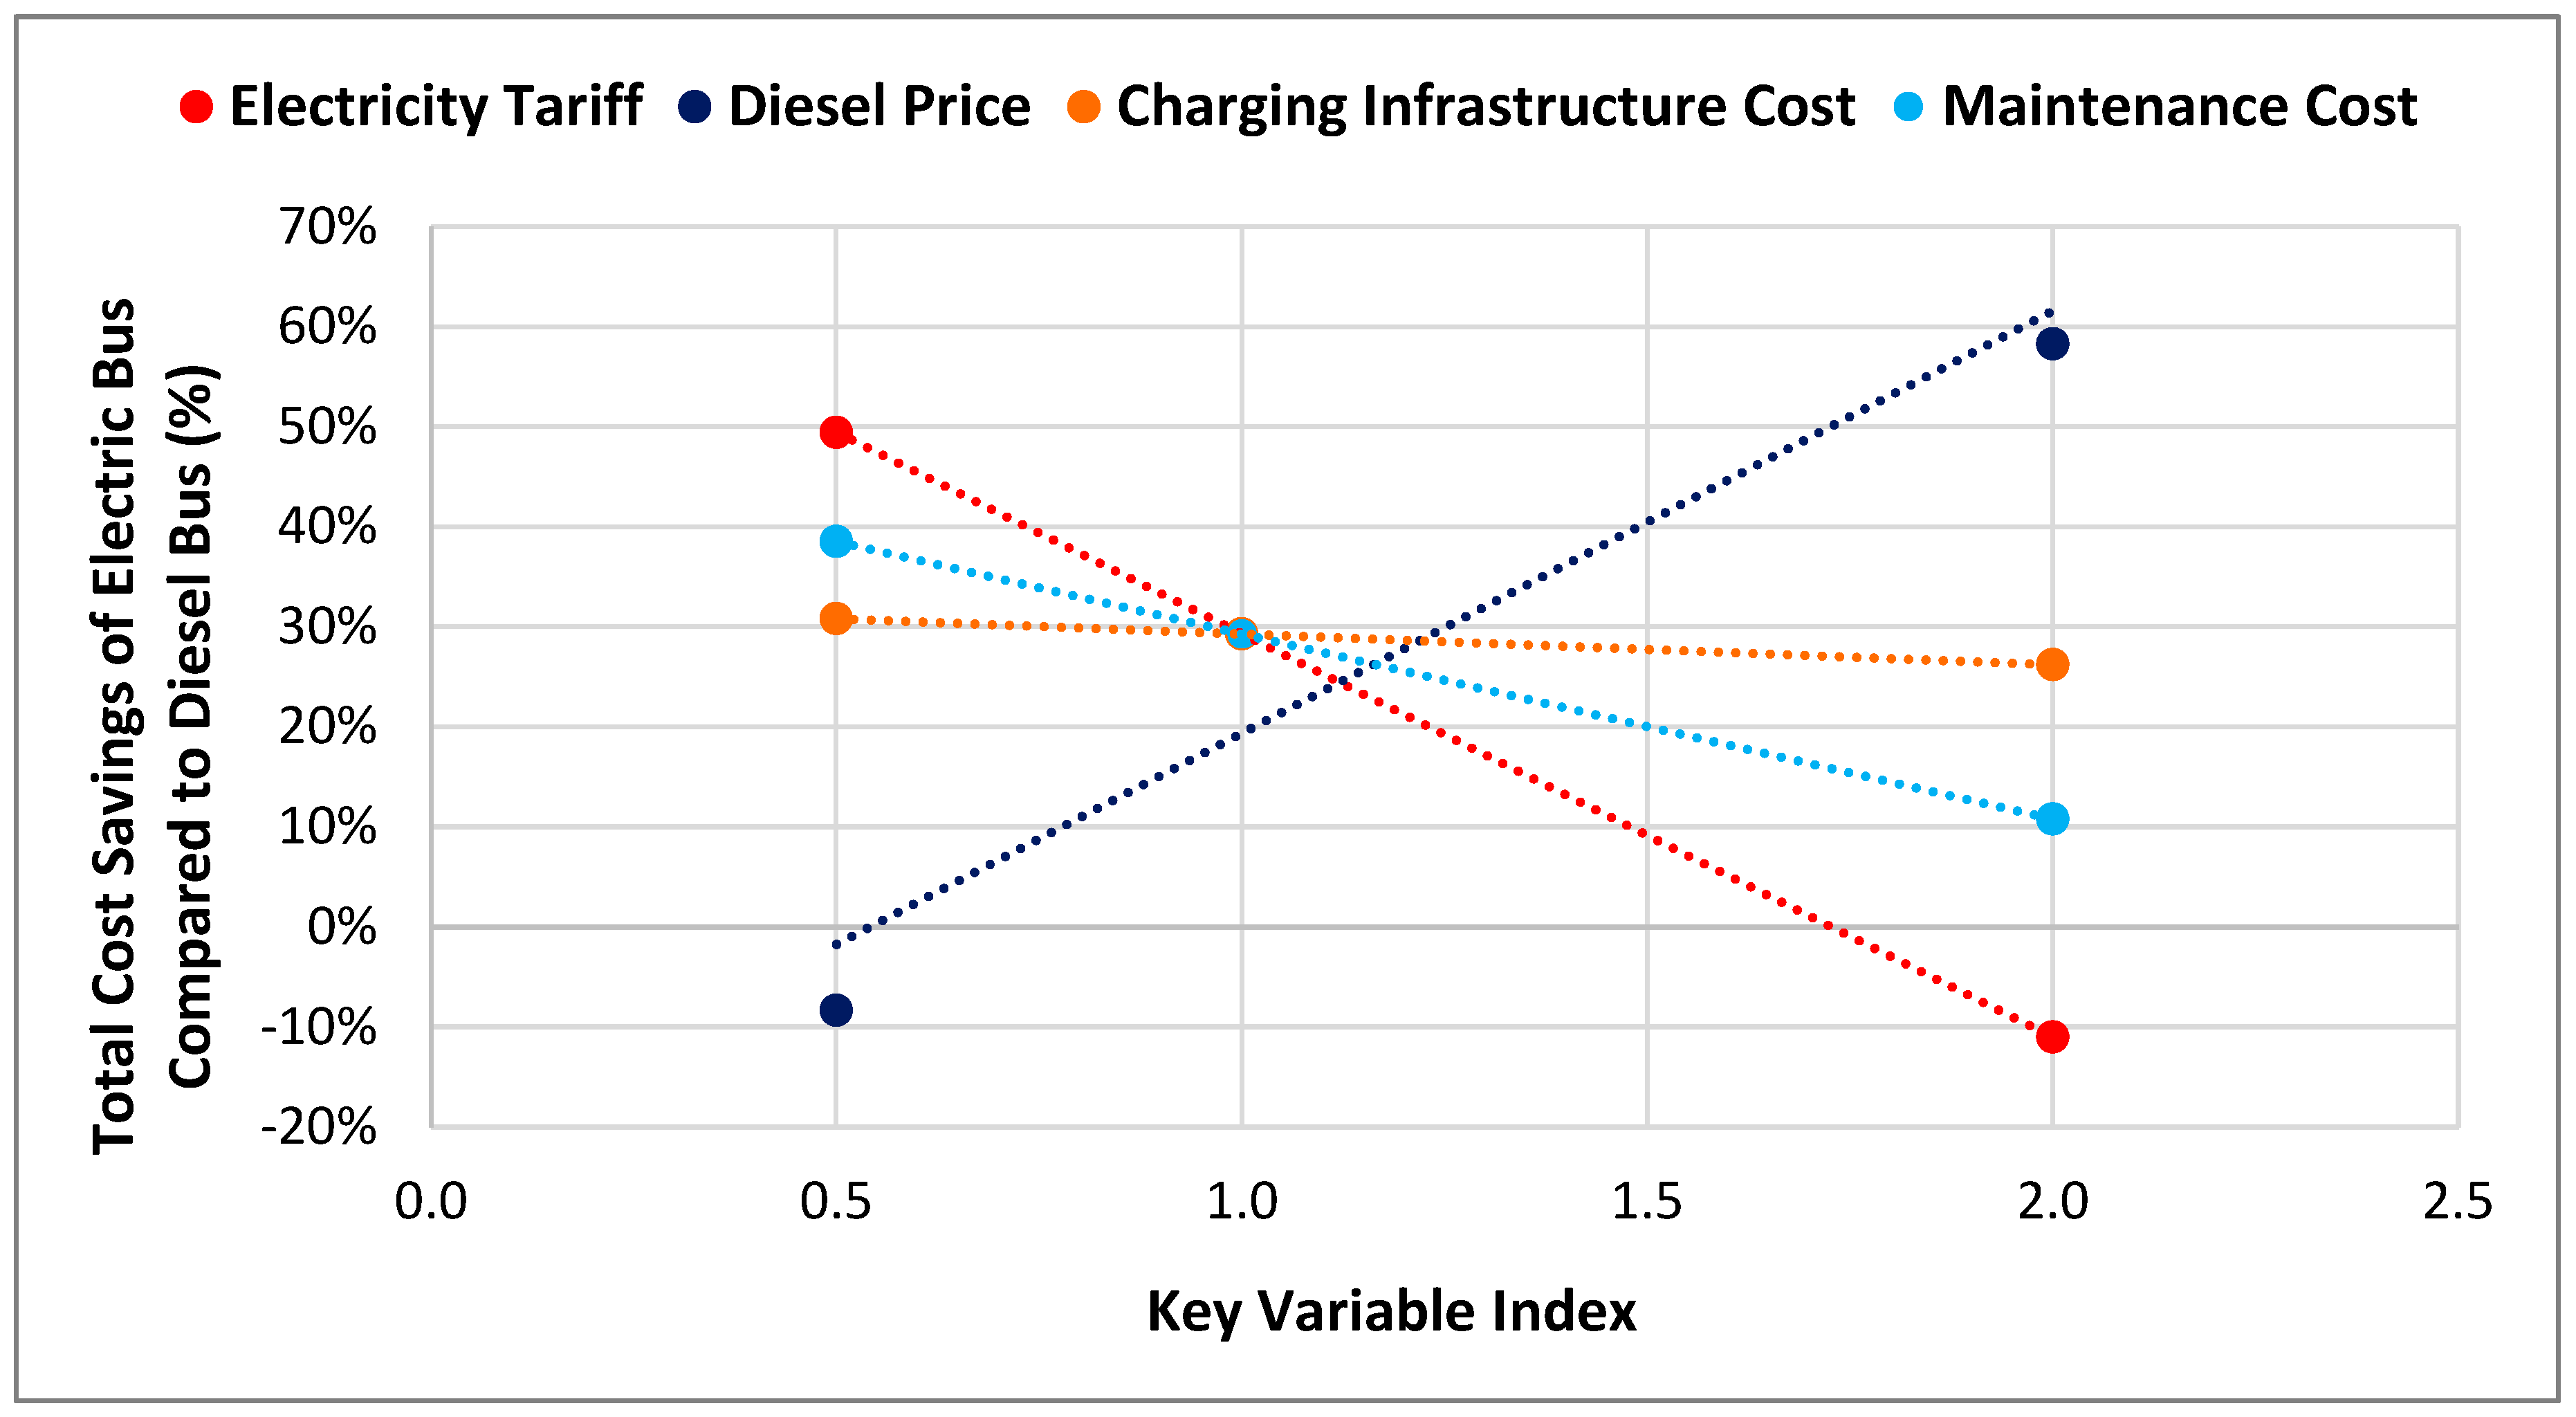
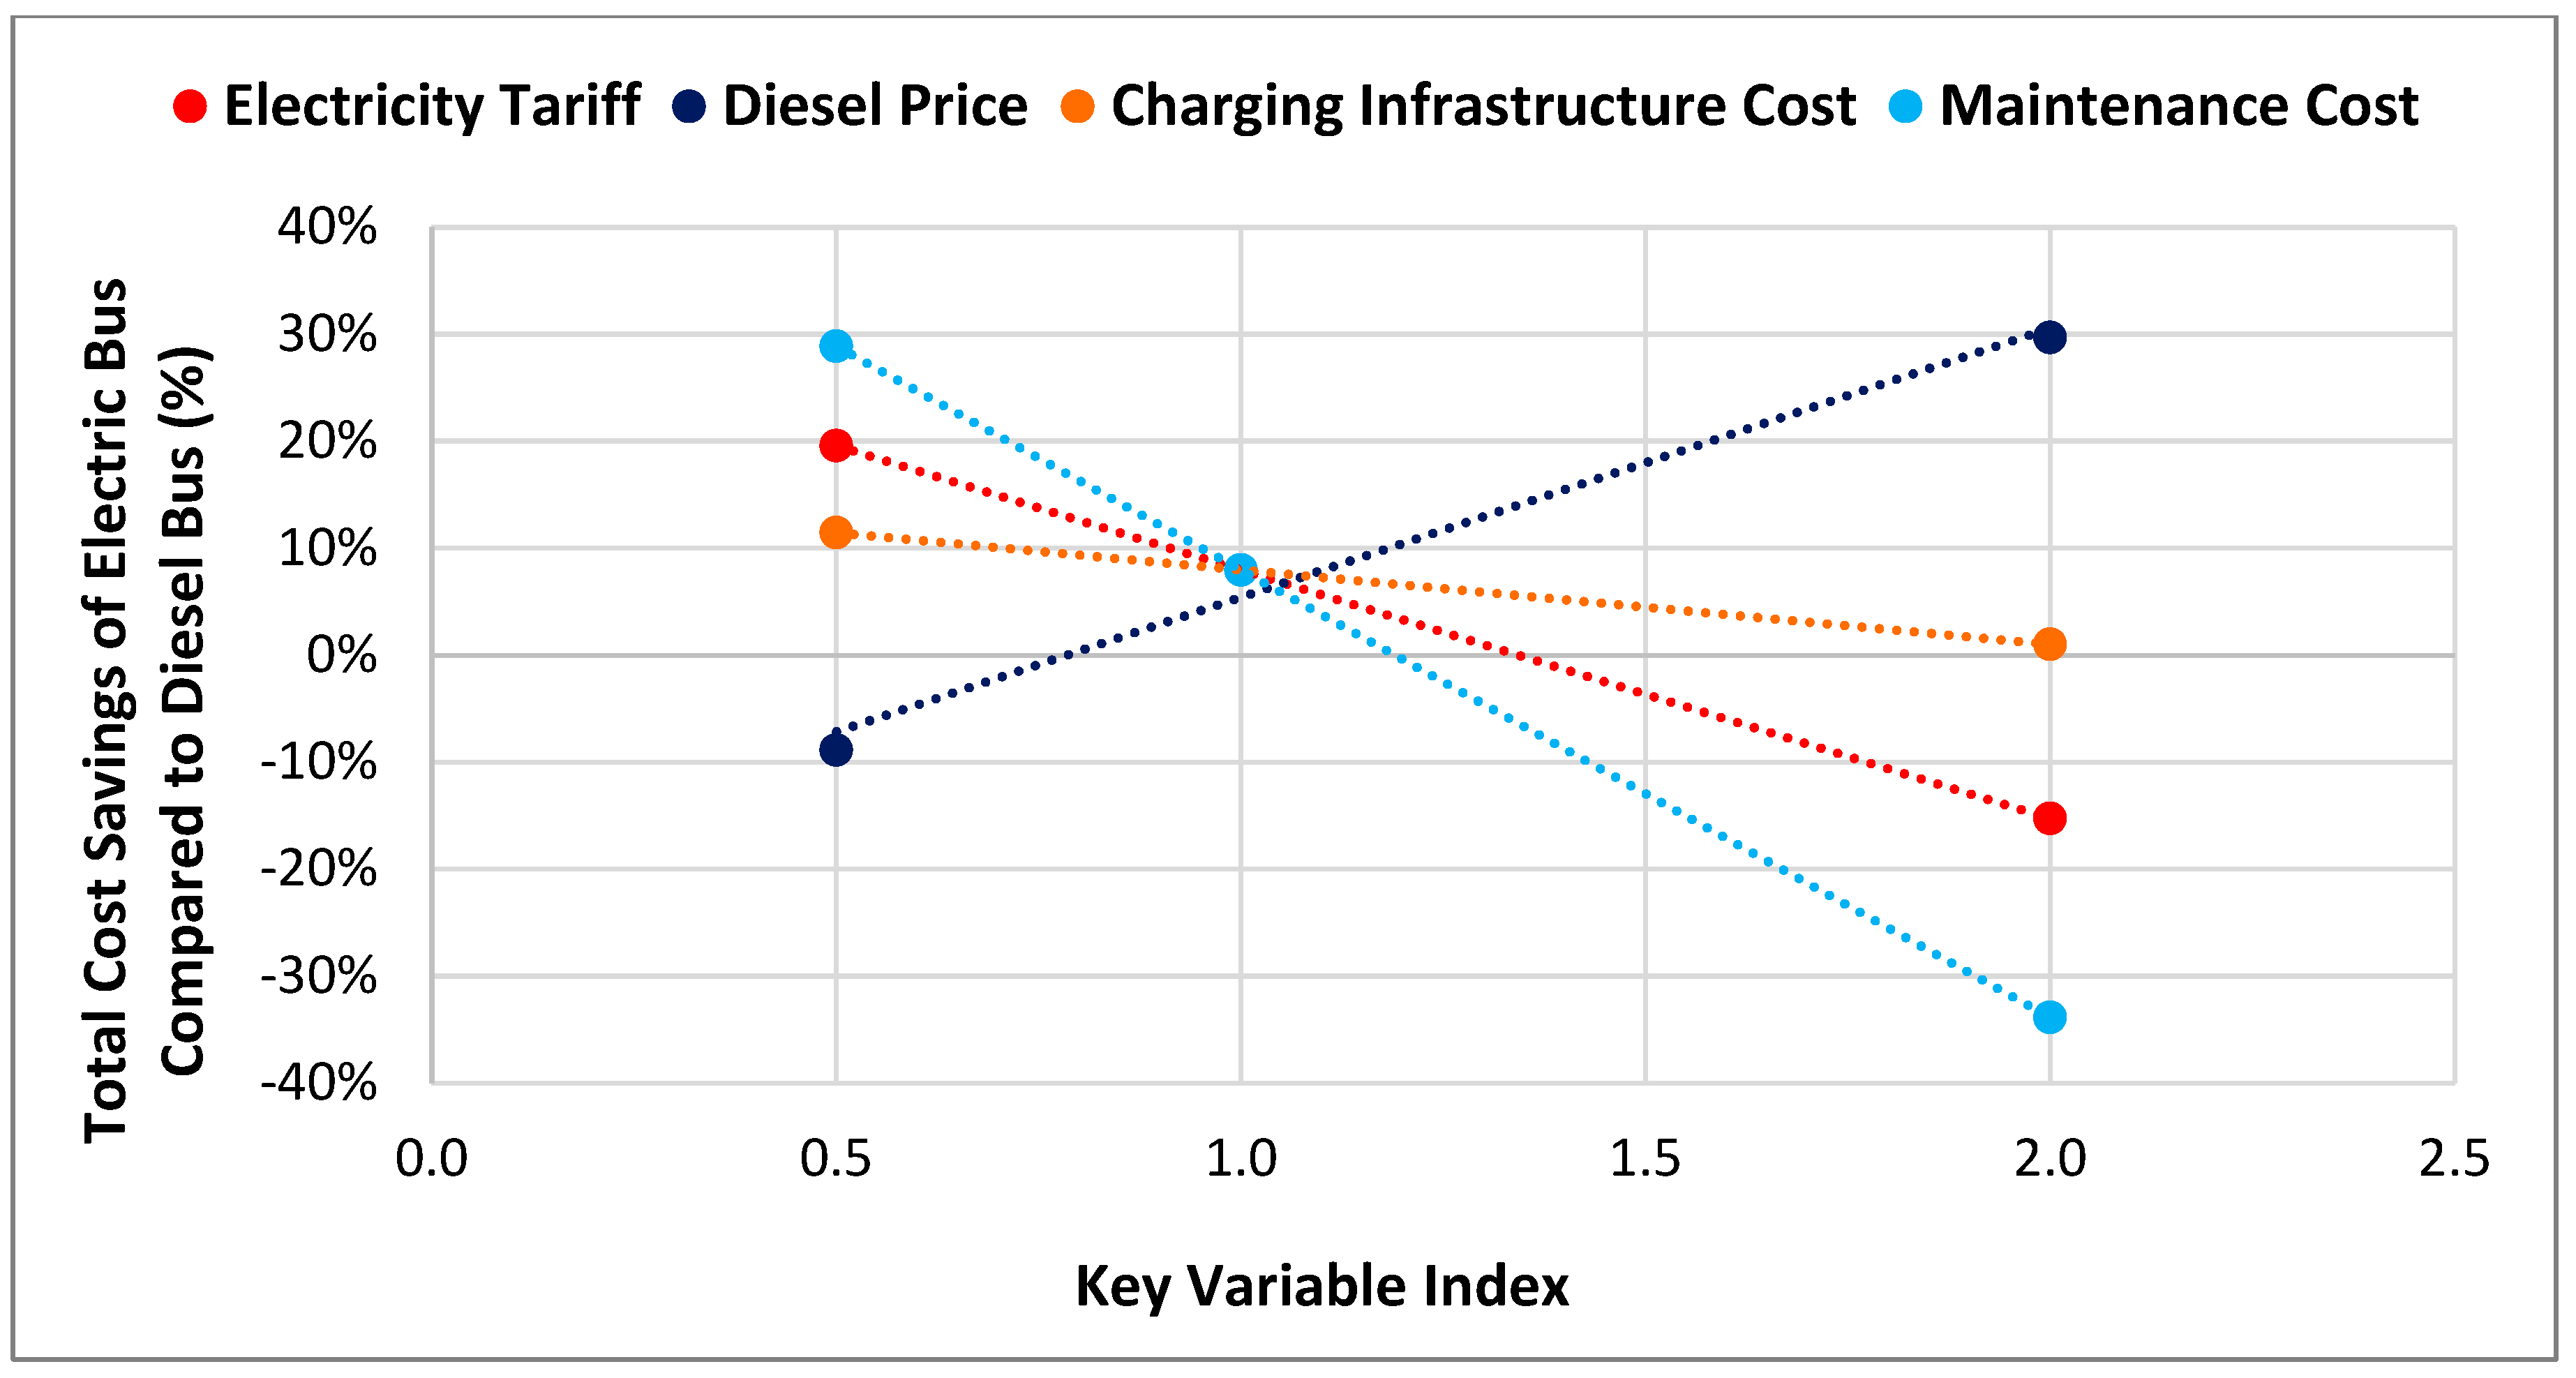
Similarly, for the dominant electric bus technology, additional sensitivity analyses on key variables (the price of diesel fuel, electricity tariff, charging infrastructure cost, and maintenance cost) were done to assess their impact on the total cost of electric bus relative to diesel under the two extremes of operating conditions (severe congestion and BRT operation on dedicated lane), as shown in Figure 9 and Figure 10, respectively. The key parameters were varied between half and double their initial values of 0.73 USD/L for diesel fuel, 0.13 USD/kWh for electricity tariff, 50,000 USD/bus for infrastructure cost, and 0.36 USD/km for maintenance costs.
Some important conclusions can be drawn for the case of Lebanon from the sensitivity analysis shown—most notably that bus maintenance costs and diesel prices have the highest impacts on the total potential cost savings of electric bus technology. For example, if the diesel price increases to double its current value of 0.73 USD/L, the cost savings of electric buses relative to diesel buses ranges between +30% in BRT operation and +60% in severe congestion conditions.
Similarly, cost savings between +30% and +40% can be achieved if maintenance costs are reduced by half of the assumed value for electric buses, which in this study are considered identical to those of diesel buses because of the lack of available maintenance cost data for electric buses. Note, however, that maintenance costs of electric bus technology are expected to be lower than those of diesel buses, due to having fewer components in the electric bus powertrain [25]. Therefore, the results presented in this study underestimate the cost savings of electric bus technology and are used as a conservative estimate.
Similar trends and substantial savings in the cost for electric bus technology are observed if the electricity tariff is incentivized for mass transit, ranging between +20% and +50% in cost savings under BRT and severe congestion conditions, respectively, if the electricity tariff is reduced to half of its current value of 0.13 USD/kWh.
However, electric bus costs are not remarkably sensitive to the variation in the charging infrastructure cost as considered in this study, since this cost component (estimated at USD 50,000 per CNG or electric bus technology from previous studies) has a relatively small contribution to the capital cost. It is worth noting, however, that this assumption underestimates the complexity and associated potential costs of deploying infrastructure for operating these new technologies, which goes beyond the costs of the charging equipment to include ancillary costs related to facility upgrades and the training of personnel on bus maintenance and operational procedures, but which are outside the scope of this study.

4. Policy Recommendations

The price of diesel fuel and the electricity tariff are the two most critical elements currently impacting motorized transportation in Lebanon due to the severe economic and financial crises facing the country. It is expected that the costs of these energy resources will increase significantly and incur further taxation in the near term. Therefore, these parameters were further evaluated for all of the considered bus technologies in their subsidized scenario (where vehicle purchase cost is subsidized equally), with averaging across the four driving conditions so as to choose the best-performing technology under all possible cost regimes, as shown in Figure 11.
The price of natural gas is fixed at 0.5 USD/lge (liter gasoline equivalent) in this assessment in line with expected price implications from the potential extraction of Lebanon’s offshore natural gas reserves in the future. However, due to the rising prices of natural gas globally, a sensitivity analysis was also conducted on the price of natural gas.
As the figure shows, electric buses are the dominant technology when electricity tariffs are low. But as the economic crisis forced the lifting of fuel subsidies, electric buses lose some of their competitive edge over the other considered technologies. Specifically, as subsidies were lifted so that diesel became more expensive by a minimum of 33%, CNG buses became the technology of choice, as shown above.
Similarly, hybrid-electric technology became more competitive than electric buses when electricity tariffs increased with the lifting of subsidies, but only if diesel prices remained low. Therefore, electrified bus technologies are at a disadvantage in the context of high diesel prices and electricity tariffs, which means one of the two energy sources needs to be subsidized for transport operators to make hybrid or electric bus cost competitive for them to operate. This is in addition to the subsidy of the vehicle purchase cost, which corresponds to a bigger amount for electrified technologies compared to CNG and diesel buses due to the high cost of the battery.
But if natural gas prices remain relatively stable near 0.5 USD/lge (liter gasoline equivalent) as assumed here, while diesel prices increase significantly at the same time, then it would become imperative to switch power plants to run on natural gas as a cheaper and cleaner source of energy than the current mix reliant on diesel and HFO. This would in turn decrease the cost of electricity supply, favoring electric bus technology again. This is within government plans for cleaner electricity generation by 2030 and, therefore, would theoretically drive the selection of CNG and electric buses over other technologies for the near to medium term in Lebanon.
However, the cost of new infrastructure to operate CNG buses can be significant, especially if there are no existing natural gas storage facilities and a distribution network to connect to refueling stations, where compression equipment for refueling are also needed. Similarly, the transition to electric buses requires an upgrade of the current electricity supply capacity and distribution network and the implementation of new charging infrastructure. This is not the case for hybrid-electric technology, which does not require different facilities or refueling infrastructure than those currently used for diesel buses, giving hybrids a clear advantage for Lebanon and similar developing countries in the near term [42].
As a result, it is evident that while electric buses are the technology of choice for reducing emissions, their near-term feasibility and potential benefits are compromised in developing countries due to the lack of a reliable power supply and clean electricity production, in addition to high electricity tariffs. Indeed, in Lebanon’s case, there has yet to be any progress on the 2030 plans to clean up the energy mix and build a charging infrastructure and no current plans to subsidize the cost of electricity for transportation. This seriously hampers the widescale adoption of electric bus technology for mass transportation and ultimately means that electric buses are more feasible as a long-term option in this context, while hybrid-electric buses provide a cost-effective solution in the near to medium term.
Additionally, a sensitivity analysis on the price of natural gas showed that CNG buses would no longer be competitive if the price increases above 0.6 USD/lge (liter gasoline equivalent), which means this technology would be most cost-competitive for countries with access to their own natural gas resources, where the price of natural gas is relatively low. It also means that to keep CNG technology advantageous, it is important to minimize O&M costs, such as by running CNG buses on dedicated lanes in order to maximize their energy consumption and environmental performance.
Therefore, and based on the above analysis, it can be concluded that for the case of Lebanon and similar developing countries, a vehicle mix including diesel, hybrid-electric, and CNG bus technologies will be necessary in the short to medium terms, at least as a transition toward fully electric and other promising technologies in the long term. Moreover, for cities where a BRT type of operation is not available, as is the case in contexts typical of developing countries, hybrid buses remain the most beneficial of the mix in terms of reduced GHG emissions. This is because electrified bus technologies are less sensitive to variations in driving conditions—noting, however, that this advantage is slightly reduced when using climate-control auxiliaries.
Finally, it is important to note that in the developing country context, all alternative-fuel bus technologies face additional challenges and barriers to their adoption and successful deployment and operation, despite their promising potential [43]. As part of the development of policy recommendations in this study, expert consultation meetings were conducted to identify existing challenges facing bus operators under current conditions, as well as potential barriers under a future centralized and coordinated mass transit system. A root-cause analysis of the classified existing and potential barriers was conducted along with a mapping to common enabling measures and solutions. Two main categories of barriers were identified: economic and financial barriers, and non-financial barriers that consist of the technical/infrastructural, regulatory, institutional capacity, and social awareness barriers. Table 10 summarizes the economic and financial barriers and the corresponding enabling policies and measures recommended for the effective deployment of the assessed bus technologies in this context.
Other potential enablers for the adoption of electric buses are mechanisms for competitive procurement and tendering [44,45], as they lower operating costs and make new bus technologies more attractive. However, these were not considered in this study as they do not currently apply to the Lebanese context due to the absence of public transportation. It is also relevant to note for the case of Lebanon and similar developing countries that the proposed enablers can still be feasible even if the government is unable to forego all revenues from tax exemptions due to economic considerations. This is because the exemptions could be provided for an initial transition period only, or on a partial basis, as long as the technology is shown to be profitable after the initial support period [36]. However, the proposed measures underlie a need to shift from traditional government policy where the transport sector is viewed as a source of income, such as through the reliance on direct revenues from tariffs levied on fuel and vehicle imports, to a new mindset of promoting a green and modern mass-transit system that can in turn enable sustainable economic growth.
But financial measures alone cannot guarantee the success of deploying alternative-fuel bus technologies, especially in a developing country context where technical and policy barriers typically abound. In Lebanon’s case, these include challenges on both the government and operator sides, most notably the long-standing lack of planning, regulation, and management of public transportation by the government and the lack of technical expertise with operating and maintaining new bus technologies by private operators. Enabling measures in this case start with the development of proper standards and policies to regulate the introduction of alternative-fuel vehicle technologies into the market [46], extending to fostering the development of a suitable ecosystem and a circular economy for the widescale adoption of the new technology. For example, there is an immediate need for new regulations for the safe handling and maintenance of high-voltage circuits and motors in the powertrains of battery-electric technology and a longer-term need to organize the development of a local industry for properly recycling or refurbishing batteries at the end of their lifecycle. This applies equally to CNG technology where non-OEM conversion of diesel engines to CNG technology are common in developing countries in order to save costs, which may lead to leakage and safety issues. Therefore, it is vital in this context to enact regulations and standards early on in the transition to new technologies and to foster the proper ecosystem for their deployment and operation over their entire lifecycle.

5. Conclusions

This study assessed the potential savings in terms of energy use, greenhouse gas (GHG) and pollutant emissions, and costs of compressed natural gas (CNG), parallel hybrid, and electrified bus technologies relative to diesel buses. The modeling was done in real driving conditions for Lebanon’s Greater Beirut Area (GBA) using the software tool ADVISOR for a Euro-V-compliant 12 m bus. Electric-bus technology was modeled on a well-to-wheel basis to account for emissions at the power plant using the software tool GREET.
Results show that the performance of battery-electric bus technology is compromised under the current polluting mix for electricity supply but can become the most beneficial technology when using electricity from a cleaner resource mix based on natural gas and renewables [47]. Parallel hybrid-electric technology also presents substantial emission reductions compared to diesel buses, making it the second preferred choice except for NOx and SOx pollutant emissions where CNG buses are cleaner. All of the considered technologies are more fuel efficient and therefore less polluting under free-flow traffic conditions similar to BRT operation on a dedicated lane, as opposed to standard bus operation in traffic, with electric bus performance being the most robust to variations in driving conditions. However, all bus technologies are significantly affected when operating in hot- or cold-weather conditions, which require the use of climate-control auxiliaries, incurring additional fuel consumption and thereby reducing overall performance.
A cost–benefit analysis was conducted to prioritize the environmental-to-cost performance of the assessed bus technologies, and it was found that battery-electric and hybrid-electric are the most efficient in terms of emission savings and costs. However, this is dependent on subsidizing the purchase cost of the vehicle at the same rate as for the less costly CNG and diesel bus technologies. CNG buses become more competitive in BRT operation, but only if the price of natural gas is subsidized for public transport.
Finally, the successful implementation of alternative-fuel vehicle technologies faces a number of financial and non-financial barriers in developing countries, such as the cost of backbone infrastructure for natural gas and electricity and the need for a comprehensive strategy with necessary regulations and standards to sustainably deploy and operate these new technologies over their entire lifecycle.
Future work is to assess the feasibility of implementing electric-bus technology in developing countries like Lebanon without reliable electricity supplies, such as by considering the costs and benefits of decentralizing electricity charging for mass transit. A potential scenario under consideration is to explore solar charging for individual or multiple bus lines using an optimization approach that can maximize environmental benefits while minimizing total costs and disruptions to the service schedule.

Author Contributions

Conceptualization, M.H.; Methodology, M.H. and C.M.; Validation, C.M.; Formal analysis, M.H. and C.M.; Investigation, M.H.; Writing—original draft, M.H.; Writing—review & editing, M.H.; Visualization, M.H. and C.M.; Supervision, M.H.; Project administration, M.H. and C.M.; Funding acquisition, C.M. All authors have read and agreed to the published version of the manuscript.

Funding

This study was funded by the United Nations Development Program (UNDP) under SODEL Project Component II Project Ref. No. 00083213, with support from the Lebanese Ministry of Energy and Water (MOEW) and the participation of local stakeholder companies and agencies that supplied valuable data and feedback.

Data Availability Statement

The original contributions presented in this study are included in the article. Further inquiries can be directed to the corresponding author.

Conflicts of Interest

The authors declare no conflict of interest.

References

  1. APTA. 2021 Public Transportation Fact Book. 2021. Available online: https://www.apta.com/wp-content/uploads/APTA-2021-Fact-Book.pdf (accessed on 30 March 2025).
  2. Xie, Y.; Delgado, O. Decarbonizing Bus Fleets: How Subnational Targets Can Aid in Phasing out Combustion Engines. ICCT Blog. 2022. Available online: https://theicct.org/bus-fleets-targets-jan22/ (accessed on 30 March 2025).
  3. Janjamraj, N.; Changsarn, C.; Hiranvarodom, S.; Bhumkittipich, K. The Practical Learning on Electric Bus Conversion to Support Carbon Neutrality Policy in Thailand’s Transport Sector. World Electr. Veh. J. 2025, 16, 181. [Google Scholar] [CrossRef]
  4. Wappelhorst, S.; Rodríguez, F. Decarbonizing Bus Fleets: Global Overview of Targets for Phasing out Combustion Engine Vehicles. ICCT Blog. 2021. Available online: https://theicct.org/decarbonizing-bus-fleets-global-overview-of-targets-for-phasing-out-combustion-engine-vehicles/ (accessed on 30 March 2025).
  5. Samawi, G.A.; Bwaliez, O.M.; Jreissat, M.; Kandas, A. Advancing Sustainable Development in Jordan: A Business and Economic Analysis of Electric Vehicle Adoption in the Transportation Sector. World Electr. Veh. J. 2025, 16, 45. [Google Scholar] [CrossRef]
  6. Krelling, C.; Badami, M.G. Cost-effectiveness analysis of compressed natural gas implementation in the public bus transit fleet in Delhi, India. Transp. Policy 2022, 115, 49–61. [Google Scholar] [CrossRef]
  7. Teixeira, A.C.R.; Machado, P.G.; Borges, R.R.; Mouette, D. Public policies to implement alternative fuels in the road transport sector. Transp. Policy 2020, 99, 345–361. [Google Scholar] [CrossRef]
  8. Liu, H.C.; You, X.Y.; Xue, Y.X.; Luan, X. Exploring critical factors influencing the diffusion of electric vehicles in China: A multi-stakeholder perspective. Res. Transp. Econ. 2017, 66, 46–58. [Google Scholar] [CrossRef]
  9. Ito, N.; Takeuchi, K.; Managi, S. Willingness-to-pay for infrastructure investments for alternative fuel vehicles. Transp. Res. Part D Transp. Environ. 2013, 18, 1–8. [Google Scholar] [CrossRef]
  10. UN-Habitat Lebanon. Guide for Mainstreaming Transport and Mobility in Lebanon’s National Urban Policy. 2021. Available online: https://unhabitat.org/guide-for-mainstreaming-transport-and-mobility-in-lebanons-national-urban-policy (accessed on 30 March 2025).
  11. Haddad, M.; Mansour, C.; Stephan, J. Unsustainability in emergent systems: A case study of road transport in the Greater Beirut Area. In Proceedings of the International Conference on Industrial Engineering and Operations Management (IEOM), Dubai, United Arab Emirates, 3–5 March 2015; pp. 1–10. [Google Scholar]
  12. Haddad, M.; Mansour, C. Rethinking bus transit in a developing country of the Middle East: Energy consumption and emissions of alternative fuel bus technologies in the Greater Beirut Area. In Proceedings of the International Conference on Innovative Applied Energy IAPE’19, Oxford, UK, 14–15 March 2019. [Google Scholar]
  13. Haddad, M.; Mansour, C.; Afif, C. Future Trends and Mitigation Options for Energy Consumption and Greenhouse Gas Emissions in a Developing Country of the Middle East Region: A Case Study of Lebanon’s Road Transport Sector. Environ. Model. Assess. 2018, 23, 263–276. [Google Scholar] [CrossRef]
  14. Baayoun, A.; Itani, W.; El Helou, J.; Halabi, L.; Medlej, S.; El Malki, M.; Moukhadder, A.; Aboujaoude, L.K.; Kabakian, V.; Mounajed, H.; et al. Emission inventory of key sources of air pollution in Lebanon. Atmos. Environ. 2019, 215, 116871. [Google Scholar] [CrossRef]
  15. CDR. Environmental and Social Impact Assessment (ESIA) for the Bus Rapid Transit (BRT) System between Tabarja and Beirut and Feeders Buses Services. 2017. Available online: https://documents1.worldbank.org/curated/en/811741508852056569/pdf/SFG3709-EA-P160224-Box405306B-PUBLIC-Disclosed-10-24-2017.pdf (accessed on 2 June 2024).
  16. Ghalayini, R.; Nader, F.H.; Bou Daher, S.; Hawie, N.; Chbat, W.E. Petroleum Systems of Lebanon: An Update and Review. J. Pet. Geol. 2018, 41, 189–214. [Google Scholar] [CrossRef]
  17. NREL. Using an Advanced Vehicle Simulator (ADVISOR) to Guide Hybrid Vehicle Propulsion System Development; NREL: Golden, CO, USA, 1996.
  18. ANL. GREET Model. 2015; Argonne National Laboratory. Available online: https://greet.es.anl.gov/ (accessed on 30 March 2025).
  19. Haddad, M.; Mansour, C. Energy and Emission Modelling for Climate Change Mitigation from Road Transportation in the Middle East: A Case Study from Lebanon. In Climate Change and Energy Dynamics in the Middle East: Modeling and Simulation-Based Solutions; Qudrat-Ullah, A.A.K.H., Ed.; Springer Nature: Cham, Switzerland, 2019; pp. 47–78. ISBN 9783030112028. [Google Scholar] [CrossRef]
  20. World Bank. Greater Beirut Urban Transport Project (PID/ISDS). 2017. Available online: http://documents1.worldbank.org/curated/en/429341509037271393/Project-Information-Document-Integrated-Safeguards-Data-Sheet-Greater-Beirut-Urban-Transport-Project-P160224-Sequence-No-00.docx (accessed on 30 March 2025).
  21. Mansour, C.; Haddad, M.; Zgheib, E. Assessing consumption, emissions and costs of electrified vehicles under real driving conditions in a developing country with an inadequate road transport system. Transp. Res. Part D Transp. Environ. 2018, 63, 498–513. [Google Scholar] [CrossRef]
  22. Mansour, C.; Haddad, M. Well-to-wheel assessment for informing transition strategies to low-carbon fuel-vehicles in developing countries dependent on fuel imports: A case-study of road transport in Lebanon. Energy Policy 2017, 107, 167–181. [Google Scholar] [CrossRef]
  23. BloombergNEF. Lithium-Ion Battery Pack Prices Hit Record Low of $139/kWh. Available online: https://about.bnef.com/blog/lithium-ion-battery-pack-prices-hit-record-low-of-139-kwh/ (accessed on 27 May 2025).
  24. Belli, P.; Anderson, J.; Barnum, H.; Dixon, J.; Tan, J.-P. Economic Analysis of Investment Operations: Analytical Tools and Practical Applications; Belli, P., Ed.; World Bank Institute: Washington, DC, USA, 2001; ISBN 0821348507. Available online: https://documents1.worldbank.org/curated/en/792771468323717830/pdf/298210REPLACEMENT.pdf (accessed on 30 March 2025).
  25. Tong, F.; Hendrickson, C.; Biehler, A.; Jaramillo, P.; Seki, S. Life cycle ownership cost and environmental externality of alternative fuel options for transit buses. Transp. Res. Part D Transp. Environ. 2017, 57, 287–302. [Google Scholar] [CrossRef]
  26. CIVITAS. Smart Choices for Cities: Alternative Fuel Buses. 2017. Available online: http://civitas.eu/sites/default/files/civ_pol-08_m_web.pdf (accessed on 30 March 2025).
  27. Wang, P.; Liu, Q.; Xu, N.; Ou, Y.; Wang, Y.; Meng, Z.; Liu, N.; Fu, J.; Li, J. Energy Consumption Estimation Method of Battery Electric Buses Based on Real-World Driving Data. World Electr. Veh. J. 2024, 15, 314. [Google Scholar] [CrossRef]
  28. Göhlich, D.; Ly, T.A.; Kunith, A.; Jefferies, D. Economic assessment of different air-conditioning and heating systems for electric city buses based on comprehensive energetic simulations. World Electr. Veh. J. 2015, 7, 398–406. [Google Scholar] [CrossRef]
  29. Lajunen, A. Energy consumption and cost-benefit analysis of hybrid and electric city buses. Transp. Res. Part C Emerg. Technol. 2014, 38, 1–15. [Google Scholar] [CrossRef]
  30. MOEW. Policy Paper for the Electricity Sector (Issue June). 2010. Available online: https://climatechange.moe.gov.lb/viewfile.aspx?id=121%0A (accessed on 30 March 2025).
  31. Al Shami, A.; Al Aawar, E.; Baayoun, A.; Saliba, N.A.; Kushta, J.; Christoudias, T.; Lakkis, I. Updated national emission inventory and comparison with the Emissions Database for Global Atmospheric Research (EDGAR): Case of Lebanon. Environ. Sci. Pollut. Res. 2022, 29, 30193–30205. [Google Scholar] [CrossRef]
  32. UN-Habitat Lebanon. Lebanon’s National Urban Policy Synthesis Report: Intersection of Housing and Transport. 2021. Available online: https://unhabitat.org/lebanons-national-urban-policy-synthesis-report-intersection-of-housing-and-transport (accessed on 30 March 2025).
  33. Basma, H.; Haddad, M.; Mansour, C.; Nemer, M.; Stabat, P. Energy analysis of city and intercity electric buses and their battery size requirements. In Proceedings of the 2021 IEEE Transportation Electrification Conference and Expo, ITEC 2021, Chicago, IL, USA, 21–25 June 2021; pp. 881–886. [Google Scholar]
  34. García, A.; Monsalve-Serrano, J.; Lago Sari, R.; Tripathi, S. Life cycle CO₂ footprint reduction comparison of hybrid and electric buses for bus transit networks. Appl. Energy 2022, 308, 118354. [Google Scholar] [CrossRef]
  35. Dyr, T.; Misiurski, P.; Ziółkowska, K. Costs and benefits of using buses fuelled by natural gas in public transport. J. Clean. Prod. 2019, 225, 1134–1146. [Google Scholar] [CrossRef]
  36. Frenzel, I.; Anderson, J.E.; Lischke, A.; Eisenmann, C. Renewable fuels in commercial transportation: Identification of early adopter, user acceptance, and policy implications. Case Stud. Transp. Policy 2021, 9, 1245–1260. [Google Scholar] [CrossRef]
  37. Al-dalain, R.; Al-oran, O.; Hamadneh, J.; Beithou, N.; Bani-khalid, M. Toward Sustainability: The Role of Tax Policies in Enhancing the Cost-Competitiveness of Electric Vehicles in Jordan. World Electr. Veh. J. 2025, 16, 301. [Google Scholar] [CrossRef]
  38. Imam, R.; Kang, S.C.; Quezada, D. Exploring low-carbon bus options for urban brt systems: The case of Amman. J. Public Transp. 2020, 22, 57–75. [Google Scholar] [CrossRef]
  39. Triatmojo, A.; Safrudin, A.; Posada, F.; Kusumaningkatma, M.; Minjares, R. Evaluation of Factors That Affect Total Cost of Ownership in Support of Transjakarta’s Electric Bus Adoption Plans. In the International Council on Clean Transportation (Issue April). 2023. Available online: https://theicct.org/wp-content/uploads/2023/04/E-bus-TCO-in-Indonesia-REVISED-Working-Paper-12-A4-v4-FINAL-FOR-PUBLICATION94.pdf (accessed on 5 June 2025).
  40. Majumder, S.; De, K.; Kumar, P.; Sengupta, B.; Kumar Biswas, P. Techno-commercial analysis of sustainable E-bus-based public transit systems: An Indian case study. Renew. Sustain. Energy Rev. 2021, 144, 111033. [Google Scholar] [CrossRef]
  41. McCluskey, J.; Druitt, T.; Larkin, C. Sustainability in transit: Assessing the economic case for electric bus adoption in the UK. Transp. Policy 2025, 162, 493–508. [Google Scholar] [CrossRef]
  42. Ally, J.; Pryor, T. Life cycle costing of diesel, natural gas, hybrid and hydrogen fuel cell bus systems: An Australian case study. Energy Policy 2016, 94, 285–294. [Google Scholar] [CrossRef]
  43. Abas, P.E.; Tan, B. Modeling the Impact of Different Policies on Electric Vehicle Adoption: An Investigative Study. World Electr. Veh. J. 2024, 15, 52. [Google Scholar] [CrossRef]
  44. Jagiełło, A.; Wołek, M.; Bizon, W. Comparison of Tender Criteria for Electric and Diesel Buses in Poland—Has the Ongoing Revolution in Urban Transport Been Overlooked? Energies 2023, 16, 4280. [Google Scholar] [CrossRef]
  45. Mouwen, A.; Van Ommeren, J. The effect of contract renewal and competitive tendering on public transport costs, subsidies and ridership. Transp. Res. Part A Policy Pract. 2016, 87, 78–89. [Google Scholar] [CrossRef]
  46. Jreige, M.; Abou-Zeid, M.; Kaysi, I. Consumer preferences for hybrid and electric vehicles and deployment of the charging infrastructure: A case study of Lebanon. Case Stud. Transp. Policy 2021, 9, 466–476. [Google Scholar] [CrossRef]
  47. Yusof, N.K.; Abas, P.E.; Mahlia, T.M.I.; Hannan, M.A. Techno-economic analysis and environmental impact of electric buses. World Electr. Veh. J. 2021, 12, 31. [Google Scholar] [CrossRef]
Figure 1. Modeling methodology.
Wevj 16 00337 g001
Figure 2. (a) Energy use of the assessed bus technologies under different types of driving conditions; (b) Energy use of the reference diesel bus under different types of driving conditions.
Wevj 16 00337 g002
Figure 3. Well-to-wheel GHG emissions of the assessed bus technologies.
Wevj 16 00337 g003
Figure 4. Pollutant emissions of the assessed bus technologies in severe congestion conditions.
Wevj 16 00337 g004
Figure 5. Total bus ownership and operating costs as a function of bus average velocity.
Wevj 16 00337 g005
Figure 6. Environmental-to-cost performance of alternative-fuel bus technologies relative to diesel buses in severe congestion operation without subsidies.
Wevj 16 00337 g006
Figure 7. Environmental-to-cost performance of alternative-fuel bus technologies relative to diesel buses in subsidized BRT operation.
Wevj 16 00337 g007
Figure 8. Total cost savings of electric buses relative to diesel buses as function of bus purchase subsidy.
Wevj 16 00337 g008
Figure 9. Sensitivity analysis for total cost savings of electric buses relative to diesel buses in severe congestion operation.
Wevj 16 00337 g009
Figure 10. Sensitivity analysis for total cost savings of electric buses relative to diesel buses in BRT operation.
Wevj 16 00337 g010
Figure 11. Sensitivity analysis on the total cost of fuel-bus technologies as a function of electricity tariff and diesel price for a fixed natural gas price of 0.5 USD/lge.
Wevj 16 00337 g011
Table 1. Characteristics of the reference bus.
Glider Mass (kg)Aerodynamic Drag Coefficient (-)Frontal Area (m²)
10,6000.527.5
Table 2. Total mass of bus vehicle (kg).
Diesel BusCNG BusParallel Hybrid BusElectric Bus
14,51514,80015,45016,250
Table 3. Auxiliaries’ power consumption.
Fuel Bus TechnologyElectro-Mechanical Auxiliaries’ Power LoadClimate Control Auxiliaries’ Power Load
Diesel and CNG buses9000 W13,400 W
Hybrid and electric buses5250 W14,000 W
Table 4. Cost analysis assumptions and estimates.
ParameterEstimates and Assumptions
Annual mileageEstimated at 100,000 km based on consultation with local operators.
Bus purchase costsEstimated from a Lebanese market survey for diesel buses and from worldwide industry data for alternative-fuel bus technologies, as follows: USD 264,000 for diesel bus; USD 300,000 for CNG bus; USD 360,000 for parallel hybrid bus; and USD 492,000 for electric bus (with 122 kWh battery).
Battery costs (O&M)Estimated from 2023 worldwide industry data at 150 USD/kWh [23]. Batteries assumed to be replaced once over the bus service life.
Discount rateAssumed to be 12% per year in line with best practice for developing countries [24].
Fuel costs (O&M)Computed from vehicle energy consumption results under local real driving conditions, based on average historical fuel prices of 0.73 USD/L for diesel, 0.5 USD/lge (liter gasoline equivalent) for natural gas, and 0.13 USD/kWh for average electricity tariff.
Government subsidyAssumed zero subsidy in the baseline scenario due to the severe economic crisis and the substantial outstanding debt facing the Lebanese government. A subsidy was considered under a second hypothetical external funding scenario of 80% of the bus purchase cost in line with common practice by transit authorities in developed countries. Customs and excise fees (5% of bus purchase cost) and registration fees (2% of us purchase cost) are currently waived by the government for public transit and therefore not included in the total cost calculation of either scenario.
Infrastructure costsEstimated at USD 50,000 per bus for CNG and electric buses [25]. Note that the capital costs of backbone infrastructure for natural gas and electricity are not accounted for in this study as they are not dedicated for transportation use. Only fast-fill and time-fill station capital costs (excluding cost of land but including cost of storage, compression, dispensing, and metering equipment for natural gas and power recharging equipment for electricity) are considered. Note also that the capital and operating costs of bus stations, depots, maintenance yards, and other supporting infrastructure are assumed to be the same for all bus technologies and therefore not considered in the comparative analysis.
Insurance fees (O&M)Computed according to commonly adopted methods locally at USD 1200 per year.
Maintenance and repair costs (O&M)Estimated from local bus operator data and published case studies in U.S. and European contexts [26], including cost of diesel particulate filter (DPF).
Other costsLocal VAT is 11% and road usage fees are USD 60 every 6 months.
Service lifeEstimated at 1,200,000 km–1,500,000 km over 12–15 years for all bus technologies, and estimated over 20 years for the CNG refueling stations and electricity recharging infrastructure.
Bus occupancyEstimated at half of the bus full capacity as an average occupancy across different periods of operation (peak and off-peak).
Salvage valueAssumed zero at the end of bus service life.
Table 5. Total costs of the evaluated bus technologies in USD/bus.km.
Bus Technology/Driving ConditionDieselCNGHybridElectric
Severe congestion 2.372.432.152.08
Peak1.781.841.801.77
Off-peak1.511.611.601.63
BRT1.281.421.371.49
Table 6. Acquisition costs of the bus technologies in USD/bus.km.
Bus TechnologyDieselCNGHybridElectric
Acquisition costs0.520.590.700.87
Table 7. O&M costs of the bus technologies in USD/bus.km.
Bus Technology/Driving ConditionDieselCNGHybridElectric
Severe congestion 1.851.771.441.15
Peak1.271.181.100.84
Off-peak0.990.950.900.70
BRT0.760.770.670.56
Table 8. Government subsidy costs of the bus technologies in USD/bus.km.
Bus TechnologyDieselCNGHybridElectric
Government subsidy0.410.470.560.70
Table 9. Subsidized total costs of the evaluated bus technologies in USD/bus.km.
Bus Technology/Driving ConditionDieselCNGHybridElectric
Severe congestion 1.961.961.581.39
Peak1.371.361.241.08
Off-peak1.091.141.040.93
BRT0.860.950.810.80
Table 10. Financial barriers and enablers for the deployment of the assessed bus technologies.
Economic and Financial BarriersEnabling Policies and Measures
Lack of financial incentives for transitioning to new model bus technologiesProvide financial incentives for the bus purchase cost to private-sector operators to transition from the legacy diesel buses to new model hybrid, electric, and CNG bus technologies
Maintain current exemptions from customs, excise, and registration fees for new bus purchases
Exempt hybrid, CNG, and electric buses from value-added tax (VAT)
Subsidize electricity tariffs and the price of natural gas for the mass-transit sector
High cost of building maintenance expertise with alternative fuel bus technologies by traditional operators of diesel busesExempt imported spare parts of hybrid, electric, and CNG buses from customs and excise fees and value-added tax (VAT)
High implementation costs of charging and refueling infrastructure required for electric and CNG busesBuild a small-scale natural gas distribution infrastructure to serve the main bus depots
Upgrade bus facilities to accommodate refueling/charging stations
Disclaimer/Publisher’s Note: The statements, opinions and data contained in all publications are solely those of the individual author(s) and contributor(s) and not of MDPI and/or the editor(s). MDPI and/or the editor(s) disclaim responsibility for any injury to people or property resulting from any ideas, methods, instructions or products referred to in the content.

