Article

A Framework for Optimal Sizing of Heavy-Duty Electric Vehicle Charging Stations Considering Uncertainty

1
Smart Grid Energy Research Center, University of California, Los Angeles, Los Angeles, CA 90095, USA
2
Electrical and Computer Engineering Department, California State University, Northridge, Los Angeles, CA 91330, USA
*
Author to whom correspondence should be addressed.
World Electr. Veh. J. 2025, 16(6), 318; https://doi.org/10.3390/wevj16060318
Submission received: 4 May 2025 / Revised: 31 May 2025 / Accepted: 5 June 2025 / Published: 8 June 2025
(This article belongs to the Special Issue Fast-Charging Station for Electric Vehicles: Challenges and Issues)

Abstract

The adoption of heavy-duty electric vehicles (HDEVs) is key to achieving transportation decarbonization. A major component of this transition is the need for new supporting infrastructure: electric charging stations (CSs). HDEV CSs must be planned considering charging requirements, economic constraints, the rollout plan for HDEVs, and local utility grid conditions. Together, these considerations highly differentiate HDEV CS planning from light-duty CS planning. This paper addresses the challenges of HDEV CS planning by presenting a framework for determining the optimal sizing of multiple HDEV CSs using a multi-period expansion model. The framework uses historical data from depots and applies a mixed-approach optimization solver to determine the optimal sizes of two types of CSs: one that relies entirely on power generated by a PV system with local battery storage, and another that relies entirely on utility grid power supply. A two-layer uncertainty model is proposed to account for variations in PV power generation, HDEV arrival/departure times, and charger failures. The multi-period expansion strategy achieves up to a 78% reduction in total annual costs during the first deployment period, compared to fully expanded CSs.

1. Introduction

Transportation decarbonization is a crucial step towards eliminating greenhouse gas emissions and mitigating the global impacts of climate change [1]. It is also an important driver of local air quality improvement, as zero-emission vehicles—unlike their ICE counterparts—do not emit tailpipe pollutants that harm human health [2].
Light-duty vehicle decarbonization is well underway. Globally, EVs, the leading zero-emission vehicle technology, constituted 14% of new light-duty vehicle sales in 2022—and this number is projected to grow to over 60% by 2030 [3]. The decarbonization of medium-duty vehicles, and particularly HDV, is in the early stages [4]. HDVs pose unique challenges to decarbonization, such as shorter downtimes for charging, cargo capacity constraints, and high capital costs [5]. However, HDEV adoption has been gaining momentum in response to climate directives and improvements in technology [6,7]. To support this transition, transportation stakeholders and private operators must strategically plan HDEV CSs [8]. LDEV studies, which comprise most of the literature, tend to consider both placement and sizing of CSs as well as address both in their planning problem [9]. LDEV chargers can even be home-based, whereas a typical HDEV charger, which can range from 50 kW to 350 kW, requires considerable utility grid capacity and access to three-phase power [10]. Consequently, unlike LDEVs, HDEV CSs cannot be freely deployed within the road network. Alternatively, incentives for public charging often lead to the installation of public HDEV CSs in rest areas along highways, significantly limiting placement options [11]. Further, due to the relatively high per-vehicle energy demands of HDEVs, their consistent operational patterns, and the frequent collocation of multiple vehicles at depots, HDEV charging is typically concentrated at depot-based stations [12]. These factors suggest that the placement problem for HDEV CSs is more straightforward compared to that of LDEVs, whereas determining their size is more complicated. Therefore, it is most practical to focus on the sizing of HDEV CSs, as opposed to modeling both CS sizing and placement.
While the sizing of LDEV’s and HDEV’s CSs shares some similarities, there are fundamental differences in the prioritization of parameters such as utility grid topology, road network topology, energy management, and charger selection. Unlike LDEVs, which generally have battery capacities within a narrow range, HDEVs show a much broader capacity spectrum, ranging from around 240 kWh to nearly 750 kWh [13]. This variability necessitates the deployment of high-power chargers within HDEV CSs to accommodate diverse charging needs [14]. These high-power rates can lead to distribution grid voltage fluctuations [15]. To mitigate these impacts, HDEV CSs’ energy management algorithm must be designed based on specific behavior of HDEV fleets such as their commercial nature, particularly during peak demand periods. Moreover, while light-duty vehicles are primarily used for personal transportation, HDVs serve various commercial functions such as freight transport, construction, and municipal services. Given the commercial nature of HDEVs, efficient and reliable charging infrastructure is essential to ensure fleet profitability and minimize operational disruptions [16]. Further, due to the high-power chargers required for HDEVs, other CS components such as transformers and inverters must also be scaled accordingly, particularly when integrating onsite energy generation. As a result, the economic design of HDEV CSs takes on greater importance compared to LDEV CSs. These factors indicate that the sizing of HDEV CSs must be more precise and accurate, and the general approaches used in LDEV sizing problems cannot be considered a solution for all classes of vehicles unless accurately modeled.
The power requirements for HDEV CSs are also substantially higher: a large size LDEV CS with fifty level 2 chargers requires around 1 MW, while installing ten 350 kW chargers demands a peak power of over 3 MW [17]. Upgrading the utility grid to support this capacity can take up to four years [10], making the utility grid capacity factor a higher priority for sizing HDEV CSs. One path to overcome this challenge is the integration of RE sources, such as PV systems and BS, with EVs. Fully supplying a CS with RE resources like PV systems introduces the concept of RE-based CSs [18]. This integration is already viewed as a promising solution to both minimize emissions from electricity generated for EV CSs and reduce the dependency on the utility grid [19,20,21]. Recently, commercial projects like JETSI—the first pilot project funded in California to successfully deploy fifty HDEVs and infrastructure at scale—also identified onsite energy generation like PV systems and energy storage as a charging solution [22].
Tietz et al. (2025) [4] propose a methodology to evaluate the required CS infrastructure for HDEVs in Germany. Their analysis employs a multi-agent simulation framework to model the dynamic movement of HDEVs and their charging needs, while considering European driving and rest time regulations. Their findings highlight the substantial number of chargers required to meet HDEV charging demand. However, they do not consider grid integration challenges associated with the high number of chargers, nor do they investigate alternative energy sources, such as PV systems and energy storage, as potential solutions for supporting the CS.
The construction of HDEV CSs can be challenging due to the high investment and long payback period involved [23]. Therefore, developing a multi-period expansion plan for the construction of CSs, which aligns with a realistic rollout plan of new HDEVs, is an ideal approach for reducing costs [24]. Beyond model development, the right methodology is central to optimally sizing CSs. The problem of determining appropriate CS size is inherently nonlinear and subject to numerous constraints [25]. In the literature, meta-heuristic algorithms have gained considerable attention for addressing this type of problem in the literature [26,27]. For example, Zi-fa et al. utilized PSO to determine the optimal size of LDEV CSs and reduce the investment cost [9,28]. While that study considered the influences of geographic information on the investment cost, it did not include multi-period expansion planning. These algorithms are well-suited to the problem as they require minimal to no prior information about the problem’s nature, nor any training data [29]. However, there is no guarantee that meta-heuristic algorithms can find the best solution [30].
While many software platforms provide tools for optimizing energy systems, they have several limitations that make them unsuitable for this study and broader application. HOMER is the most widely used software in this field [31,32,33]. However, it optimizes individual CSs rather than simultaneously optimizing multiple CSs, limiting its applicability for large-scale, multi-period CS planning [31].
The stochastic nature of renewable resources, such as PV systems, combined with the uncertain arrival and departure times of HDEVs at CSs, introduces significant uncertainty in system operation and power supply. These uncertainties can generally be categorized into two types: (1) uncertainty in the data used for deterministic optimization, and (2) uncertainty related to charger failures. There is no existing study comprehensively addressing both categories of uncertainty in the sizing of HDEV CSs. Many studies have focused on addressing different uncertainties in planning and scheduling LDEV CSs, while there are far fewer that address uncertainties in HDEVs like electric buses and trucks [34,35]. For example, the work by [36] evaluated optimizing CS locations and fleet size under random charging demand considering weather, traffic, and road conditions. The authors generated 50 sample scenarios for charging demand using a normal distribution and noted the increase in computation time with more scenarios. In [37], the authors developed joint robust optimization models for locating fast chargers at bus stops and developing charging schedules. They used the worst-case scenario for handling uncertainties in travel time due to traffic congestion and driver behavior.
Another element of uncertainty is that PV energy generation changes with the time of the day, cloud cover, and season. This can severely impact the planning of RE-based CSs [38]. The addition of BS can improve the utilization of PV energy and can be used to smooth the PV profile. The authors in [39] studied the scheduling of charging activities of HDEVs with RE sources and uncertainty. They considered a normal distribution for RE generation and simulated different variance settings 20 times. Finally, to achieve a reliable number for the chargers within a CS, it is important to consider the impact of charger failure, which is still a widespread challenge. Rempel et al. investigated the reliability of public EV chargers in the Greater Bay Area, California. They analyzed 655 chargers and found that 27.5% were either not functional or the cable was too short to reach the EV inlet [40].
Recent studies have attempted to develop HDEV-dedicated frameworks to size CSs. Shams Ashkezari et al. introduced a GA-based framework to co-optimize charger number, RE sources, and BS, focusing on reducing costs, idle time, and unmet charging demand [41]. While comprehensive in scope, their framework does not tolerate any uncertainty and assumed static traffic demand. Mishra et al. developed a simulation-based framework that uses real-world telemetry data and a novel technique based on charge acceptance curve to design multi-port megawatt-scale CSs [14]. However, their framework is not capable of sizing for onsite RE sources or local BS. Similarly, Jackson et al. proposed a bi-level optimization framework that accounts for converter-level losses and power system constraints, offering a detailed exploration of BS and grid interaction trade-offs [42]. This model also does not consider onsite RE sources or uncertainty factors. In another study that does not include onsite RE sources or local BS, Mohamed et al. introduce an energy management algorithm to reduce total cost of ownership and grid stress, particularly under limited utility grid capacity [43]. In addition to the aforementioned shortcomings, none of these frameworks account for the significant impact of a multi-period expansion strategy, which is central to aligning infrastructure growth with gradual HDEV fleet adoption—as well as minimizing initial capital costs.
This paper thoroughly addresses the problem of capacity design and sizing for multiple HDEV CSs, considering RE integration, uncertainty, and multi-period expansion. To ensure robustness and guarantee the best solution, a mixed-approach optimization, including metaheuristic and systematic search approaches, is employed. These techniques jointly optimize CSs’ size to minimize both the investment and recurrent costs while ensuring that HDEVs can complete their tours without any trip failures. The major contributions of this paper in comparison to existing studies are as follows:
(1)
This study introduces a dedicated framework for simultaneously sizing multiple HDEV CSs. The framework utilizes historical commuting data for different depots and their rollout plans for deploying HDEVs in place of ICE HDVs. It proposes a multi-period expansion plan for CSs and is designed to adapt to various scenarios for modeling HDEV behavior. The framework provides a comprehensive overview of HDEV SOCs as well as energy/power at all times.
(2)
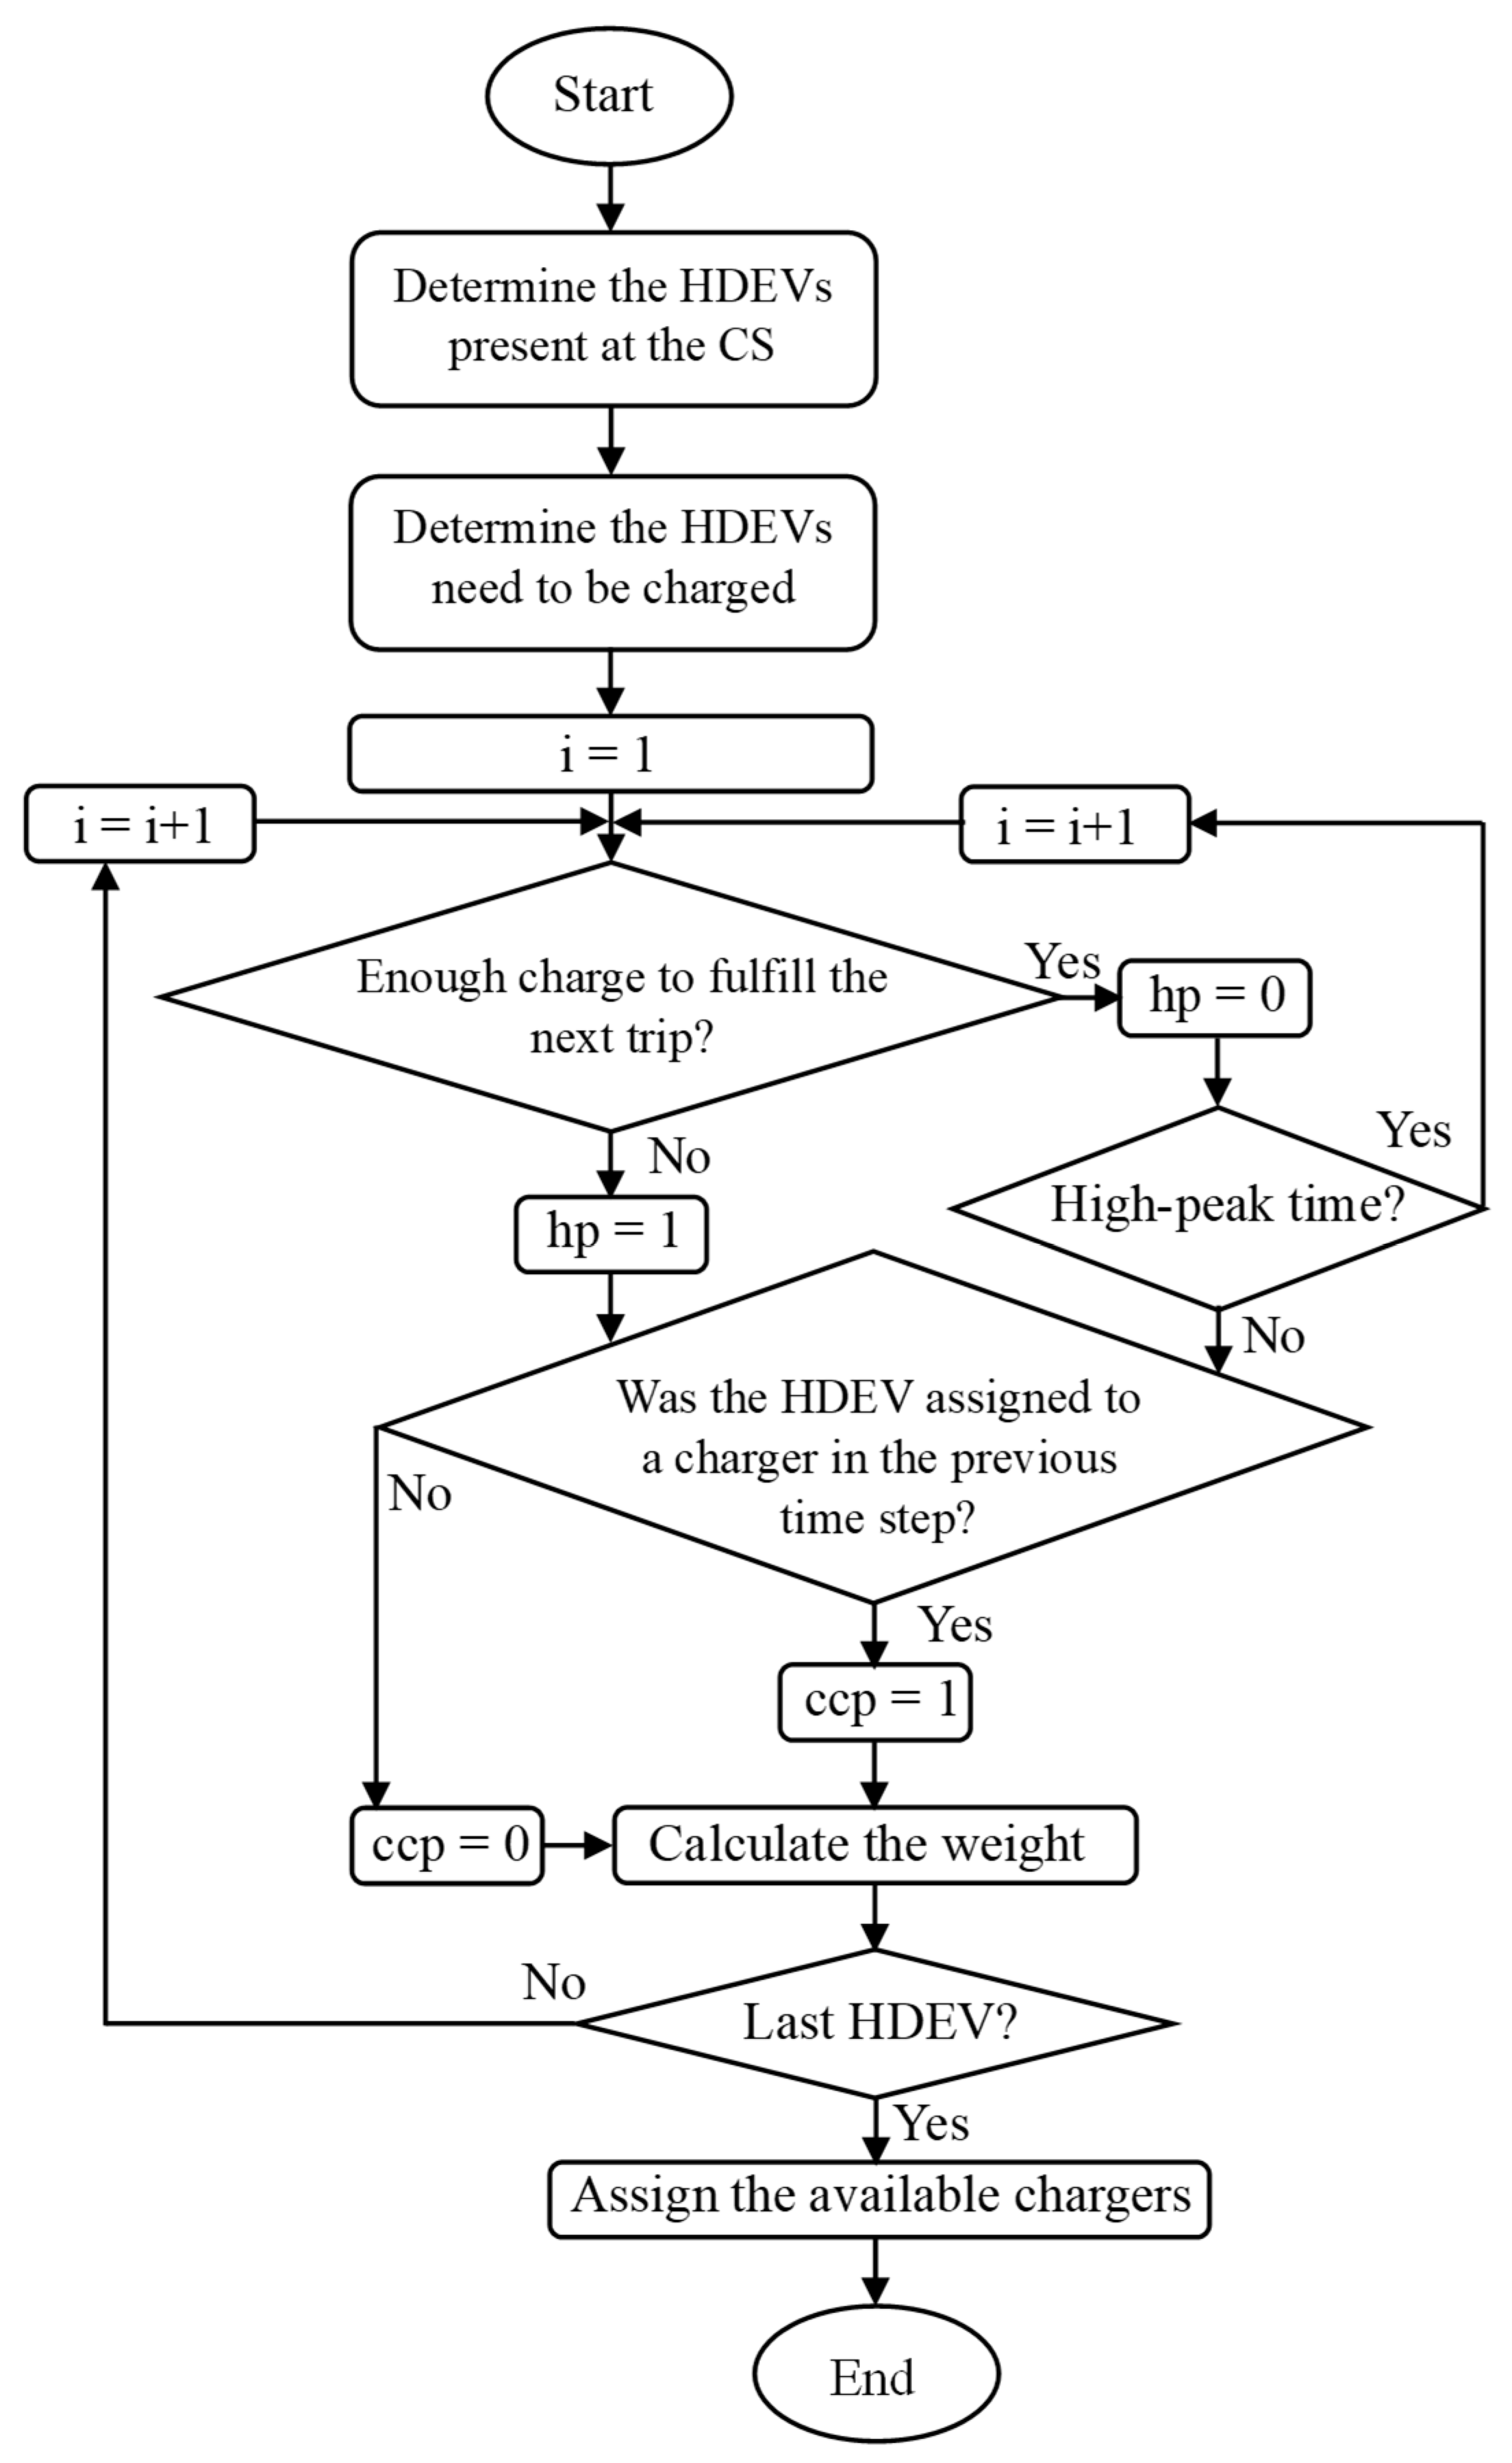
Two types of HDEV CSs are demonstrated and analyzed: utility-based and RE-based CSs. Utility-based CSs rely entirely on grid power, while RE-based CSs are exclusively supplied by onsite PV generation and local BS. For each type, queue-based energy management algorithms are proposed to assign chargers to HDEVs and manage the charging or discharging processes. These algorithms can manage the interaction between the CS and the utility grid or RE sources and storage systems. They consider arrival time, departure time, SOC, and priority of HDEVs. Utility-based CSs also consider the charging model of the corresponding utilities, while RE-based CSs consider the availability of PV generation and the SOC of local BS in their management algorithm.
(3)
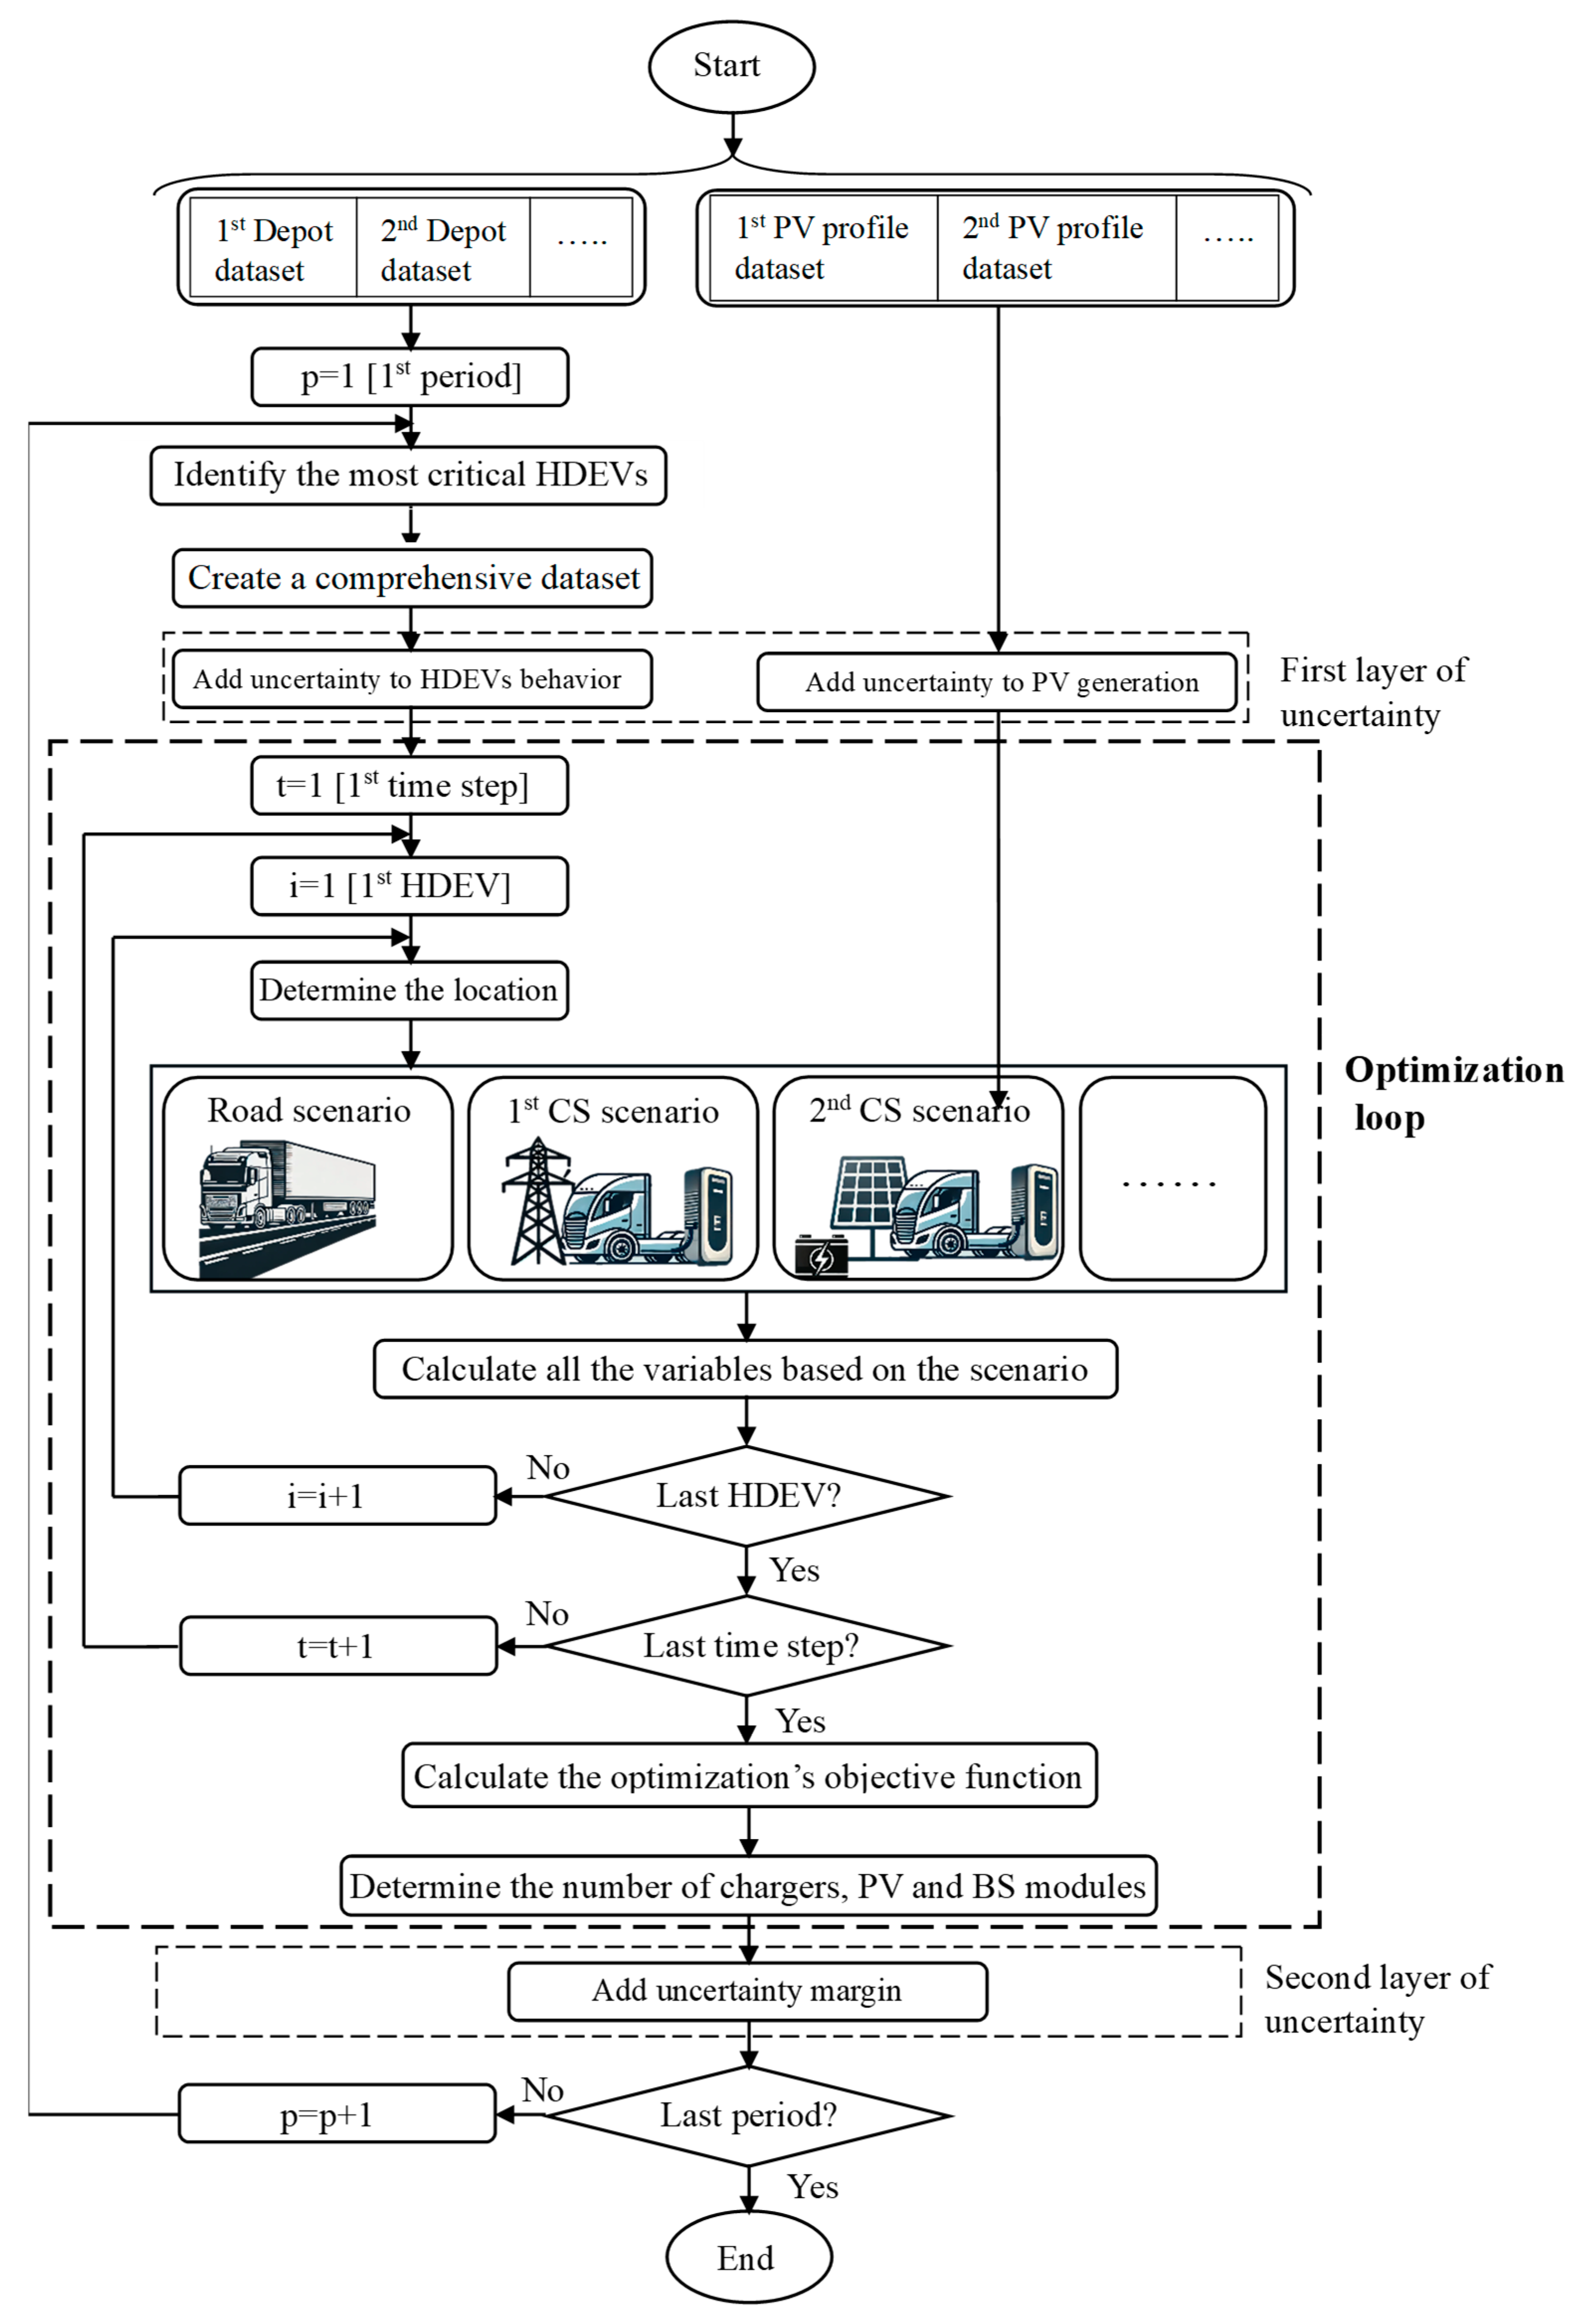
A two-layer uncertainty model is proposed to address issues associated with PV systems, HDEV behavior, and charger failure. In the first layer, the model simulates worst-case scenarios using depot-specific HDEV schedules and PV generation profiles through a deterministic approach. The second layer resizes the CS components to add a safety margin based on the outputs of the optimization loop, ensuring any charger failures do not hinder the operation of CSs.
The paper’s structure is defined as follows. The proposed framework and energy management algorithm for different types of CSs are described in Section 2. Section 3 presents the optimization problem and deployed methodologies. An innovative process for adding uncertainty to the framework is presented in Section 4. The proposed framework is applied to an example case study in Section 5. Finally, Section 6 presents the conclusions.

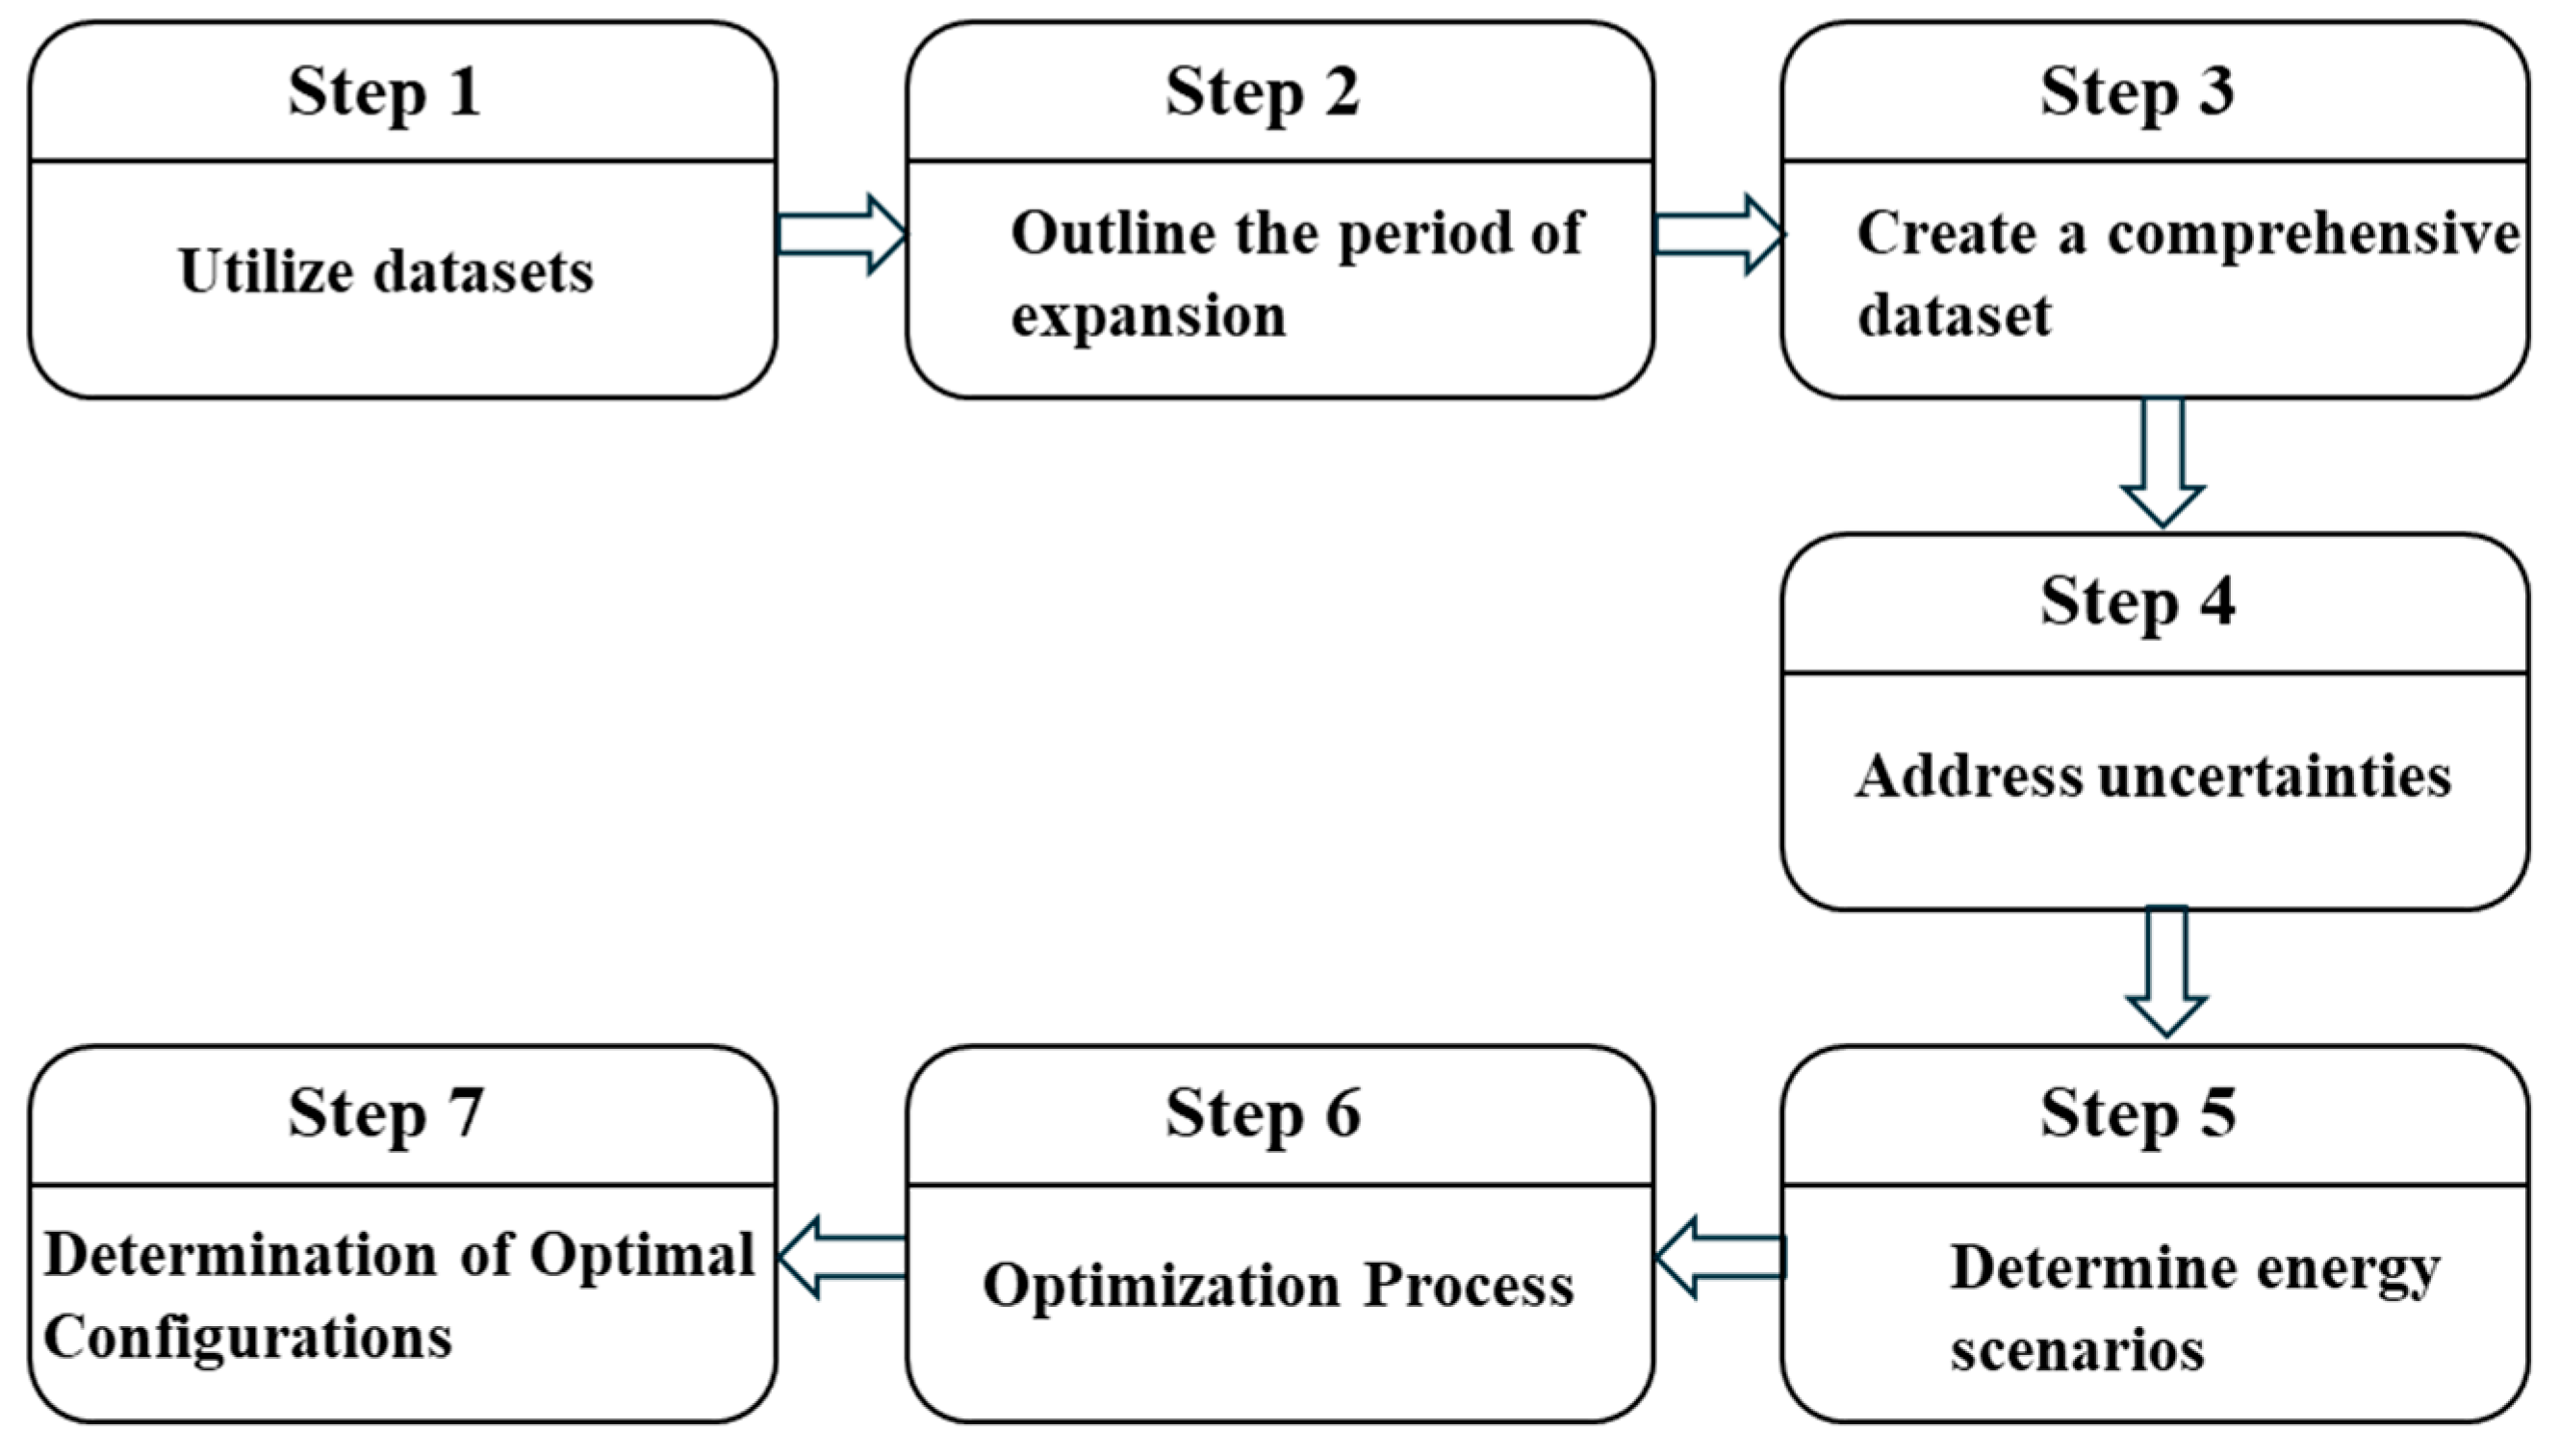
2. Framework of the Planning

This section introduces a novel framework for determining the optimal sizes of CSs within HDEV depots. The framework is designed to plan with a multi-period deployment model, aligning with fleet operators’ strategies for electrification. It addresses the complexities associated with both utility-based and RE-based CSs, considering uncertainties. The framework is designed in seven steps as shown in Figure 1. The steps are elaborated in the rest of this section.

2.1. Utilize Datasets

The framework is primarily designed to utilize historical depot datasets, including arrival times, departure times, and trip mileage for HDVs based at each depot. Due to the commercial nature of most HDV trips, these datasets can be used to predict the behavior of HDEVs that will use the depot-based CSs in the future. The framework is also inherently adaptable to other regions or fleet types. If historical depot data are not available, synthetic datasets can be generated using fleet simulation tools, public transportation schedules, or travel surveys.

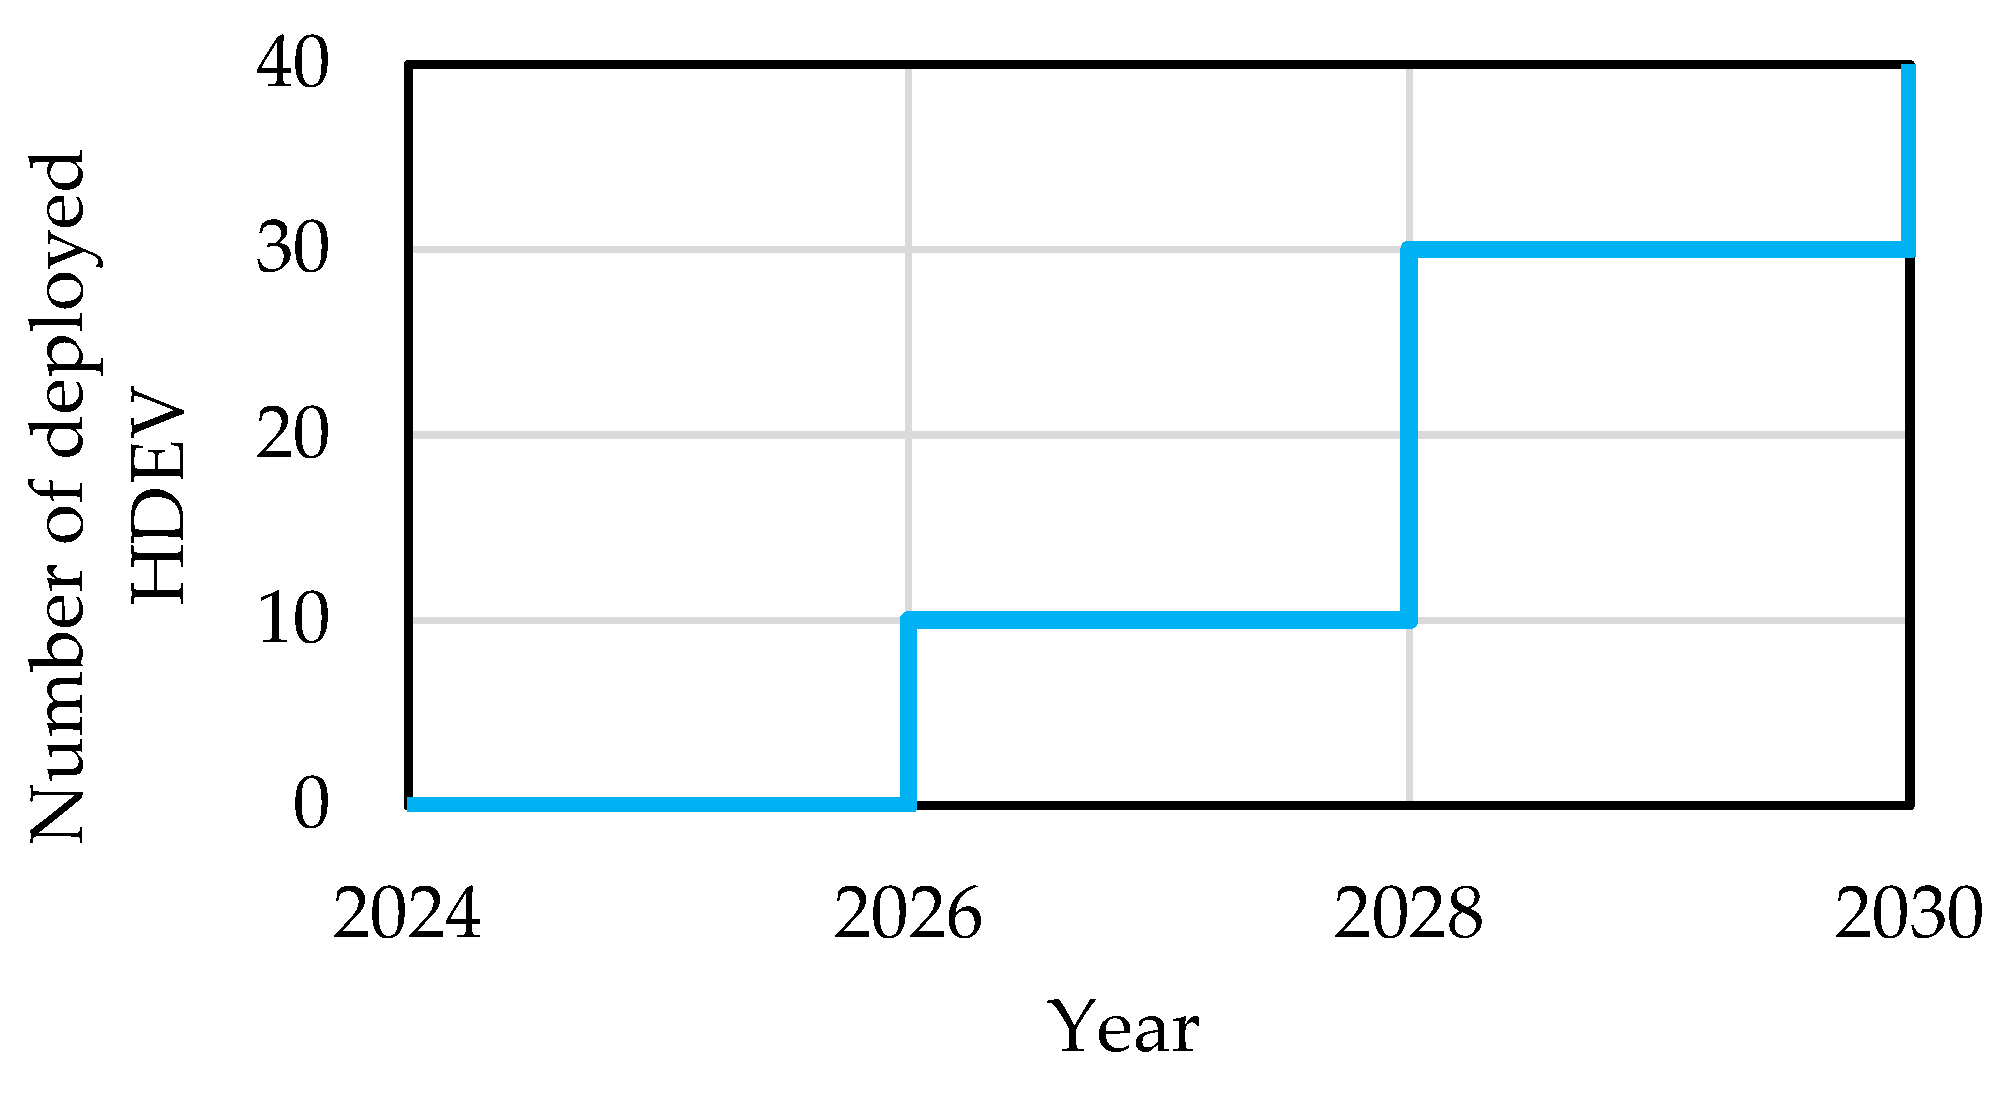
2.2. Outline the Period of Expansion

The framework supports multi-period deployment, aligning with fleet operators’ electrification strategies and providing flexibility in the face of policy and technology uncertainty. In each period, additional HDEVs are introduced into the fleet. To support this process, the framework identifies the most critical ICE HDVs among the HDVs exist in previous step dataset based on the highest average mileage. It then uses their information and plans the expansion based on the worst-case scenario. The rest of HDEVs are eliminated from depots’ datasets.

2.3. Create a Comprehensive Dataset

Each depot has its own historical trip dataset. By combining datasets from all depots, the framework constructs a comprehensive dataset. This dataset can determine the status of all HDEV such as location, batteries’ SOC, next trip mileage, etc., at all time steps.

2.4. Address Uncertainties

To ensure the robustness of the proposed solution, two layers of uncertainty are integrated into the framework to model worst-case scenarios. The first layer addresses uncertainties in PV generation and HDEV activity, while the second layer considers uncertainties related to charger failures. Detailed methodologies for incorporating these uncertainties are elaborated in Section 3.

2.5. Determine Energy Scenarios

To analyze the performance of CSs and the status of HDEVs during the simulation period, the model must determine the logic of energy transfer between its different components—such as HDEVs, chargers, PV systems, and BS. This paper refers to these logics as energy scenarios, and it allows for their definition based on different CS locations or when HDEVs are on the road. Depending on the preferences of the fleet operator or depot owner, and considering geographical specifics, a decision can be made to establish either a conventional CS powered by the utility grid, or a RE-based CS powered by onsite PV systems and BS. This paper presents a queue-based energy management algorithm for each of these two types of CSs. In this algorithm, each HDEV at the CS is assigned a weight coefficient, resulting in a queue organized by these weights. The HDEVs with the highest weight coefficients are prioritized and allocated to the available chargers to start the charging process.

2.5.1. Utility-Based CSs Energy Scenario

High-capacity substations are critical nodes in the electrical grid, designed to handle large loads, making them ideal for fully supplying a HDEV CS [44].
As illustrated in Figure 2, the procedure starts with identifying the HDEVs present at the CS using their unit numbers. HDEVs that are not fully charged are identified, while HDEVs with a fully charged battery are excluded from the charging queue. The remaining HDEVs are assessed to determine if they can complete their next trip without additional charging, based on Equation (1). If a HDEV cannot complete its next trip without charging, its high-priority (hp) coefficient is set to one. During the peak periods with higher electricity rates, HDEVs without a high-priority coefficient of one are removed from the queue.
Next, HDEVs that were connected to chargers in the previous time step have their charger connection priority (ccp) set to one, ensuring uninterrupted charging. Each HDEV is then assigned a waiting priority coefficient (wp) using Equation (2). This ensures as time gets closer to the departure time of HDEVs, they move up in the queue. Finally, the weight coefficient for all HDEVs in the CS’s queue is calculated and assigned using Equation (3). Priority is given to HDEVs with the highest weight coefficients, which are then connected to the available chargers to initiate charging. If charging is to take place, the amount of transferred energy and the power rate are determined. As a result, the new SOC for that HDEV at the end of the time step is calculated using Equation (4).
The relevant equations are as follows:
S O C n e x t , t r i p , i = L n e x t , t r i p , i × η V B t , i / E V B t , i
w p i = ( t t a r r , i ) / ( t d e p , i t a r r , i )
W q u e u e , i = w 1 × h p i + w 2 × c c p i + w 3 × w p i
S O C t i = S O C t 1 i + c c p   i × P C H , r a t e d × t × η B t , i / E B t , i

2.5.2. RE-Based CS Energy Scenario

In this subsection, the proposed energy management flow for RE-based CSs is illustrated, and the formulation is detailed below. The methodology for determining the number of PV and BS modules is elaborated on in Section 4.
Assuming the energy generation profile for a single PV module is available, the PV energy generation profile for that CS can be achieved by simply scaling it by the number modules assigned to that CS using Equation (5). Subsequently, the number of chargers that can be supported by the PV is calculated using Equation (6).
P P V , j = N P V , j × P P V , m o d u l e
N C H , P V , j ( t ) = P P V , j ( t ) / P C H , r a t e d
Based on the number of BS modules assigned to the CS, the total capacity of the BS can be calculated using Equation (7). Subsequently, the maximum power that can be injected or extracted from the BS at each time step, given the energy stored and its physical characteristics, is determined using Equation (8). Finally, the maximum number of chargers that can be supplied by the BS at the jth CS at each time step is calculated using Equation (9).
E B S , j = N B S , j × E B S , m o d u l e
P m a x , B S , j t = C r a t e d c × S O C B S , j ( t ) × E B S , j
N C H , B S , j ( t ) = η B S × P m a x , B S , j ( t ) / P C H , r a t e d
The number of available chargers at the jth CS can be calculated by selecting the smaller of either the number of chargers that can be supplied by the PV system plus the BS or the number of chargers physically assigned at the CS, using Equation (10).
N c h a r , j = m i n ( N C H , j , f l o o r ( N C H , P V , j t + N C H , B S , j ( t ) ) )
Analogous to a CS supplied by the utility grid, Equations (1)–(4) are employed to allocate chargers to each HDEV without considering high-peak-price constraint. Equation (11) calculates if the PV alone can supply the load. If so, the PBS,j sign value is positive and the remaining energy is transferred to BS, as in Equation (12). If not, the PBS,j sign value is negative and the remaining energy will be supplied by the BS considering discharge efficiency, as in Equation (13).
P B S , j t = P P V , j t P l o a d , j ( t )
S O C B S , j t + 1 = S O C B S , j t + P B S , j t × t
S O C B S , j t + 1 = S O C B S , j t + P B S , j t × t η B S

2.5.3. On the Road Energy Scenario

This scenario can be tailored to each fleet’s specific requirements and the new SOC for each HDEV can be calculated using Equation (14).
S O C V B t , i ( t ) = S O C V B t , i ( t 1 ) L p r e m i l e , i × η V B t , i / E V B t , i

2.6. Optimization Process

Following the creation of the comprehensive dataset, the optimization process commences. At each time step, the status of all HDEVs is analyzed, and relevant variables, such as their battery SOC, are updated based on their location and the executed energy scenario. The framework also calculates the performance of each CS, including total energy consumption, power usage, and the SOC of BS, along with the energy transfer flow among different components at each time step.

2.7. Determination of Optimal Configurations

The outcome of this step is the determination of the optimal number of chargers for each CS, as well as the number of PV and BS modules if an RE-based CS is employed. Subsequently, a second layer of uncertainty analysis is implemented to ensure the robustness of the solution. The detailed operational flow of this stepwise framework is depicted in Figure 3.

3. Uncertainty Modeling

As illustrated in Figure 3, two layers of uncertainty are considered in this paper to ensure a reliable outcome and avoid trip failures. The first layer involves modeling uncertainty in the input data. A conservative approach to selecting uncertainties is employed, ensuring that the scenarios considered are the worst case. The second layer addresses the uncertainty in the operational failure of the output data. The processes and formulations for each layer are explained below.

3.1. First Layer of Uncertainty Modeling

3.1.1. Photovoltaic Generation

To assess the reliability of deterministic size optimization results, the power produced by a PV module can be modeled by Equation (15) [45].
P P V , m o d u l e = η P V × I × A P V
The equation accounts for overall uncertainty in generation by modeling uncertainties in irradiation and PV module efficiency separately. This study utilizes a 10% uncertainty in solar irradiation as well as a 10% uncertainty for PV system efficiency—values that are applied by the author Maheri in an exploratory study on hybrid renewable systems [45]. Consequently, during the sizing process, only 81% of the actual generation capacity of the PV modules is utilized for sizing. This coefficient is incorporated in Equation (5).

3.1.2. HDEV Activity

The framework also creates two new comprehensive datasets to explore two levels of uncertainty based on the comprehensive dataset reflected in step 3 of Figure 1. These new datasets introduce uncertainty in the arrival and departure times of the HDEVs to capture potential worst-case HDEV behavior. The uncertainty introduced by reducing dwell times indirectly captures scenarios where certain vehicles may be reassigned to different routes or possibility of destination changes among some HDEVs.
Reducing the dwell time of HDEVs at CSs increases the risk of trip failure, as the HDEVs have less time to charge their batteries. Therefore, the new datasets are created by shrinking the dwell time of the HDEVs, which is achieved by delaying the arrival time and forcing an earlier departure time for trips. These scenarios are modeled by adding a fixed time step to the arrival time and subtracting the same time step from the departure time. In this paper, both one and three time steps are used to create the two new datasets alongside the original dataset. This approach ensures a comprehensive evaluation of the system under different levels of uncertainty, thereby enhancing the robustness and reliability of the proposed framework. As a result, three dataset variations—case 1, case 2, and case 3—are defined, with the framework simulated separately for each case to assess its performance under different uncertainty conditions.

3.2. Second Layer of Uncertainty Modeling

While the first layer of uncertainty is applied to the input data, the second layer operates on the output data during step 7 of the framework, as illustrated in Figure 1. This second layer of uncertainty, that of potential charger downtime or malfunctioning, is also incorporated into the model. Although not typically accounted for in EV CS modeling studies [14], non-functioning chargers can be a very real challenge for EV drivers [46,47]. Further, for commercial and HDEVs, malfunctioning chargers can mean that the originally determined number of chargers is insufficient, leading to delays or even trip failures. Thus, to ensure that HDEV operations can be preserved even if chargers experience maintenance issues, this paper accounts for a second layer of uncertainty via Equation (16), utilizing a proxy for potentially non-functioning chargers [40]:
N C H , a f t e r = η N F C × j = 1 N C S N C H , j

4. Optimization Procedure

This section outlines the optimal system sizing method used in this paper. In this procedure, different numbers of chargers, PV modules, and BS modules are assigned to CSs at each iteration. The framework described in Section 2 then analyzes the performance of each configuration by calculating the objective function for each iteration. Finally, it identifies the best configuration by finding the minimum objective function value.

4.1. Objective Function

In this paper, the total annual cost is used as an objective function. The total annual cost includes both the annual capital cost and the annual operation and maintenance cost as formulated by Equation (17) [48].
F = C C a p + C O M

4.1.1. Annual Capital Cost

The current total price of purchasing and installing all items is called initial capital cost. However, some of these items will need to be replaced during the lifespan of the project. To map those costs and create the present worth of each item, the single payment present worth factor can be used. Assuming a 20-year lifespan for this project, lifespans of 25 years, 15 years, and 20 years are assumed for the PV system, BS, and the chargers, respectively [49]. Therefore, the only component that will need to be replaced during the project is the BS. Thus, the present worth of the BS system is calculated by the following equations [48]:
C C , B S = C i n i t , B S × S P P W F B S
S P P W F B S = 1 + 1 1 + i n t 15
To convert this cost to annual capital cost, it needs to be multiplied by CRF as described by Equation (20). The CRF is a financial formula used to calculate the amount that needs to be set aside annually to cover the initial investment.
C R F = i n t × ( 1 + i n t ) n ( 1 + i n t ) n 1
where n denotes the lifespan of the project. By multiplying the capital cost into CRF, the annual expenses for the CSs are derived based on Equation (21).
C C a p = C R F × ( C C , C H × j = 1 N C S N C H , j + C C , P V × j = 1 N R E C S N P V , j + C C , B S × j = 1 N R E C S N B S , j )

4.1.2. Annual Operation and Maintenance Cost

To calculate the annual operation and maintenance cost, Equation (22) can be utilized. Equation (22) also implicitly accounts for the effects of component degradation over time, including reduced performance and increased servicing needs. This equation includes the OM cost of each component as well as the electricity bill of the CSs supplied by utility grids.
C O M = C O M , C H × j = 1 N C S N C H , j + C O M , P V × j = 1 N R E C S N P V , j + C O M , B S × j = 1 N R E C S N B S , j + C b i l l × 12
The monthly electricity bill (Cbill) for a CS typically includes time-of-use fees, which vary based on the time of day electricity is consumed (USD/kWh) and are determined by the utility provider. For SCE, the utility used in this paper, there are three fee periods: High Peak, Mid Peak, and Low Peak [50]. The monthly bill is formulated as shown in Equation (23):
C b i l l = E H i g h × C H i g h + E M i d × C M i d + E L o w × C L o w

4.2. Design Constraints

To ensure no trip failures for any HDEVs within this framework, the SOC of all HDEVs must be above the minimum SOC limit at all the times, as expressed by Equation (24):
t = 1 T i = 1 N H S O C i t > S O C m i n
Additionally, the SOC and operational power of the BS must be within specified ranges [51]:
S O C L S O C B S ( t ) S O C H
C r a t e c × S O C B S , j ( t ) × E B S P B S , j ( t ) C r a t e d c × S O C B S , j ( t ) × E B S

4.3. Optimization Method

Optimizing the size of HDEV CSs combined with onsite generation via PV systems and BS presents a highly complex and nonlinear problem [52]. This complexity makes it challenging to solve even with nonlinear integer programming approaches. Therefore, a mixed-approach optimization solver is used for this analysis.
The flow chart of the solver is shown in Figure 4. The process begins with the application of metaheuristic algorithms to explore the solution space and generate feasible CS configurations. However, due to the limitations of heuristic methods in guaranteeing a global optimum, further refinement is necessary. Each algorithm produces its best solution, evaluated based on the objective function. The solution with the lowest objective function value among the three is selected as the initial solution.
From this initial solution, a systematic reduction approach is applied, iteratively decreasing the number of chargers while ensuring that Equation (24) is satisfied at all time steps. The process continues until a point is reached where further reducing the number of chargers results in at least one failed HDEV trip due to low SOC. At this stage, the last feasible solution is identified as the best solution.
This mixed approach effectively combines the exploratory power of metaheuristics with the precision of systematic search refinement, delivering the global best solution for HDEV CS planning.

5. Case Study

This paper includes a case study with two datasets from depots that will host CSs when its HDVs are electrified. These datasets were developed by the UCLA Smart Grid Energy Research Laboratory to model two depots serving HDEVs in Southern California, incorporating a range of constraints to simulate realistic warehouse fleet scenarios [10].
One depot, located near the Port of Long Beach, features a designed CS1 connected to the SCE utility grid, with monthly electricity bills based on SCE fees. The second depot, situated in the Ontario region, will establish a completely RE-based CS independent of the utility grid—CS2. The datasets include forty HDVs, which are assumed to transition to HDEVs over a 6-year timeframe (2024–2030) in three periods, as shown in Figure 5. This process is meant to mimic a HDEV rollout plan for fleet operators who may be adopting HDEVs in order to comply with California’s evolving regulations [53].
While the HDEVs might visit different depots and locations during their trips, it is assumed they only use these two CSs for charging. All chargers in this paper have equal power ratings. The PV system’s energy generation profile for the RE-based CS in Ontario, California (latitude: 34.03″ N, longitude: 117.33″ W), is based on a 31 MW PV system scaled by 100 kW modules. The CS’s BS uses lithium-ion technology with a base module size of 100 kWh. All algorithms for this case study were implemented in Python 3.13.2 for a simulation period of one month. The simulation parameters are listed in Table 1.

5.1. Adding the First Layer of Uncertainty

5.1.1. PV Generation

The PV generation is simulated based on generation in December, the month with the lowest potential solar irradiance. This ensures a conservative design that will be sufficient across all months. The profile is then decreased by 19%, the logic for which is described in Section 3. This profile remains constant across all periods of development.

5.1.2. HDEV Activity

There are three periods of HDEV transition. The CSs must be capable of supporting 10, 30, and 40 HDEVs in the first, second, and third periods, respectively. For each period, the HDVs with the highest average daily mileage are selected from the original dataset to electrify. To incorporate uncertainty, the arrival and departure times of HDEVs at each depot are adjusted by shrinking them by one time step (20 min) and three time steps (60 min) under the constraint that the minimum stay time is at least 2 h (120 min). The original dataset is referred to as case 1, the one-time step adjusted dataset as case 2, and the three-time step adjusted dataset as case 3 for each period.

5.2. Optimization Results of Sizing for Each Expansion Period

To identify optimal solutions, the mixed-approach optimization solver is employed. PSO, GA, and ABC, which are popular metaheuristic algorithms, are used to determine the initial solutions.
The results are shown in Table 2, where the optimal number of components in all cases is increased by 27% to account for the second layer of uncertainty and charger failure. Under an optimistic case (case 1), the required number of chargers at CS1, which is a utility-based CS, is 3 for the first period, increasing to 5 in the second period and 6 in the third period. Additionally, the numbers of required chargers, PV modules, and BS modules at CS2 are [1, 6, 6] for the first period, increasing to [5, 15, 11] in the second period and [7, 20, 15] in the third period. Conversely, under a conservative case (case 3), the number of required chargers at CS1 is 3 for the first period, increasing to 5 in the second period and 10 in the third period. The required numbers of chargers, PV modules, and BS modules at CS2 are [2, 8, 6] for the first period, increasing to [5, 16, 19] in the second period and [11, 35, 36] in the third period. The results show the impact of uncertainty consideration in the CSs’ configuration selection.
The proposed framework is designed to be modular and adaptable, allowing for the integration of customized energy management algorithms within each CS. Such adaptability enhances both the feasibility and scalability of the framework for multi-CS deployments across varied operational and geographic contexts. The energy management algorithms deployed in this case study are a utility-based for CS1 and a RE-based for CS2, as described in Section 2. Figure 6 and Figure 7 show the model results for the last period of expansion under case 3. Figure 6 illustrates the number of HDEVs at CS1, the number of HDEVs requiring charge, and the activity of chargers at each time step. While the number of HDEVs at CS1 sometimes reaches 31 and the number of HDEVs needing charge peaks at 21, the proposed energy algorithm can manage this demand with only 10 chargers. Further, Figure 7 shows the number of HDEVs, the number of HDEVs requiring charge, the activity of chargers, and the SOC of the local BS at CS2. As seen in Figure 7a, the number of HDEVs present at CS2 can be as high as 40, and the number of HDEVs needing charge can reach 24. However, Figure 7b demonstrates that the proposed energy algorithm for RE-based CSs can handle all these requirements with only 11 chargers, depicted by the solid black line. Additionally, the maximum number of chargers that can be activated at each moment by the combination of PV and BS is shown with a dashed line, indicating that the system is capable of supporting up to 25 chargers at certain times. Nevertheless, the energy algorithm avoids deploying the maximum capacity to maintain the SOC of the BS at a reliable level, as shown in Figure 7c.

5.3. Evaluation Results

Figure 8 demonstrates the performance of the proposed framework, which accounts for uncertainty, compared to unoptimized models. An unoptimized system might either use the number of chargers equal to the maximum number of HDEVs present at the CSs, which is 71, or the maximum number of HDEVs needing charge at any given time interval, which is 45. These options—installing either 71 or 45 chargers—would have USD 2,829,591 or USD 1,760,057 in total annual costs, respectively. The simulation results, as shown in Figure 8a, indicate that the total annual cost for establishing CSs using the proposed framework would be USD 193,804 for the first two years, increasing to USD 412,766 for second period, and finally reaching USD 872,820 for the last period. This represents a substantial saving compared to the unoptimized options. This implies that the proposed model achieves savings of at least 89%, 76%, and 50% for the first, second, and third periods, respectively.
The proposed multi-period expansion strategy significantly enhances the economic feasibility of HDEV CS deployment by aligning infrastructure investments with fleet rollout timelines. As shown in Figure 8, the CS can be initially deployed at a fraction of the final size—reducing their initial annual cost by up to 78% in the first period compared to fully built-out CSs —while still meeting operational demands. Moreover, the framework’s scalability is demonstrated through its ability to dynamically adjust CS size across expansion periods, accommodating increasing fleet demands without overbuilding. This staged, data-driven approach provides a flexible and cost-effective planning solution for fleet operators managing large-scale HDEV electrification.
Similarly, Figure 8b–d illustrate that the number of chargers, PV system capacity, and local BS can be as low as [5, 0.8 MW, 0.6 MWh] for the first period. These capacities then increase to [10, 1.6 MW, 1.9 MWh] and [1, 3.5 MW, 3.6 MWh] for the second and third periods of expansion according to the fleet operator’s development milestone plan. In contrast, the other two models would require [45, 7.7 MW, 7.9 MWh] and [71, 12.8 MW, 13.1 MWh] for the respective periods.

6. Conclusions

The primary goal of this paper is to enable cost-effective fleet decarbonization by finding a solution to the challenge of properly sizing HDEV CSs. Therefore, a novel framework is proposed to capture the distinct operational and technical characteristics of HDEVs, such as larger battery capacities, commercial usage patterns, and higher charging power requirements. Unlike conventional approaches developed for LDEVs, this framework considers HDEV-specific dwell times and their impact on trip failure risk, which is critical for ensuring route reliability. It also leverages historical depot traffic records as a representative baseline for HDEV behavior, recognizing that these patterns are generally repeatable over time.
The framework utilizes historical data from depots and applies a mixed-approach algorithm to determine the optimal number of chargers, PV modules, and BS modules for each CS. Based on the paper’s case study, this approach leads to significant savings between 50% and 89% in total annual costs at different stages of expansion. A key feature of the framework is its multi-period expansion strategy, which allows for a more cost-effective initial investment. By optimizing the CS design for the first period, investors can start with just 22% of the final annual cost, while still adhering to the development milestones of the CS owner and fleet operator.
The framework addresses location-specific utility grid power supply limitations by integrating RE-based CSs that fully rely on onsite PV systems and local BS, alongside traditional utility-based CSs. The dedicated energy management algorithms for these two types of CSs efficiently manage charging, ensuring that all HDEVs within a depot are serviced with only 10 chargers for CS1 and 11 chargers for CS2, even when the number of HDEVs present is as high as 31 and 40, respectively.
In practice, both RE-based and utility-based CSs faced challenges. Even when using the proposed framework, the required PV and BS capacity for a fully renewable-based CS can reach as high as 3.6 MWh, which demands multiple acres of land. This amount of space may not be readily available around depots located in dense urban areas. Conversely, fully relying on the utility grid can be constrained by insufficient local grid capacity or long upgrade timelines. These trade-offs suggest a hybrid CS configuration as a more realistic and flexible solution for supporting HDEV charging.
The two-layer uncertainty model captures variations in PV power generation, HDEV arrival and departure times, and potential charger failures. The findings highlight the critical importance of incorporating uncertainty parameters into the management and sizing of HDEV CSs. This approach not only enhances the resilience and reliability of CSs in unexpected scenarios but also ensures successful trips for all HDEVs using these CSs.
Although this study utilizes real-world data from two specific depots, the proposed framework is generalizable to other fleet scenarios. By adjusting input datasets or using region-specific synthetic traffic patterns, the model can be applied in diverse geographic locations or operational contexts.
Despite these advantages, the proposed method also has some limitations. First, it assumes that historical HDEV behavior is a reliable predictor of future activity, which may not hold if a new fleet starts to use the depot with different commercial targets. Therefore, if future fleets introduce entirely different usage patterns, the historical dataset may no longer be representative. Additionally, the framework only considers fully RE-based or fully utility-based CSs and does not analyze hybrid CS configurations. As noted above, another practical limitation is that RE-based CSs utilizing PV may require large areas of land, yet the land footprint and site feasibility have not been examined in this model.
Future work may extend this framework by incorporating vehicle-to-grid capabilities for HDEVs and deploying advanced AI-based energy management algorithm for each CS. Additionally, it may develop and evaluate hybrid CS configurations that dynamically integrate utility grid power and onsite renewable energy, as well as analyze land use and environment constraints for PV-based CSs.

Author Contributions

Supervision, R.G.; methodology, R.Z.; validation, K.S.; writing—original draft preparation, R.Z., R.S. and S.N.G.; writing—review and editing, R.Z., R.S. and S.N.G. All authors have read and agreed to the published version of the manuscript.

Funding

This work was supported by the Department of Mechanical and Aerospace Engineering, University of California at Los Angeles, under Grant 69763 and Grant 45779.

Data Availability Statement

The raw data supporting the conclusions of this article will be made available by the authors on request.

Conflicts of Interest

The authors declare no conflicts of interest.

Abbreviations

The following abbreviations are used in this manuscript:
ABCArtificial bee colony
BSBattery storage
CSCharging station
EVElectric vehicle
GAGenetic algorithm
HDEVHeavy-duty electric vehicle
HDVHeavy-duty vehicle
HOMERHybrid optimization model for electric renewables
ICEInternal combustion engine
LDEVsLow-duty electric vehicles
OMAnnual operation and maintenance
PSOParticle swarm algorithm
PVPhotovoltaic
RERenewable energy
SCESouthern California Edison
SOCState of charge
Variables
APVPV module surface area (m2)
CRF Capital recovery factor
CbillThe monthly electricity bill (USD)
CC,BSCapital cost of a BS module (USD)
CC,CHCapital cost of a charger (USD)
CC,PVCapital cost of a PV module (USD)
CHighUtility billing rates during high peak (USD/kWh)
Cinit,BSInitial capital cost of BS (USD)
CLowUtility billing rates during low peak (USD/kWh)
CMidUtility billing rates during mid peak (USD/kWh)
CCapAnnual capital cost
COMAnnual OM cost
COM,BSOM cost of a BS module (USD/yr)
COM,CHOM cost of a charger (USD/yr)
COM,PVOM cost of a PV module (USD/yr)
CcrateMaximum charging C-rate of BS
C r a t e d c Maximum discharging C-rate of BS
EBS,jTotal BS capacity (kWh) at the jth CS
EBS,moduleCapacity of each BS module (kWh)
EHighThe amount of energy consumed during high peak (kWh)
ELowThe amount of energy consumed during low peak (kWh)
EMidThe amount of energy consumed during mid peak (kWh)
EVBt,iBattery size of ith HDEV (kWh)
F Total annual cost (USD)
i Index for HDEV
int Interest rate
I Solar irradiation (W/m2)
j Index for CS
Lnext,trip,iNext trip distance of ith HDEV (miles)
Lpremile,iMileage covered since the previous time step by ith HDEV (miles)
n Lifespan of the project (yr)
NBS,jNumber of assigned BS modules at the jth CS
Nchar,jNumber of available chargers at the jth CS
NCH,beforeTotal number of chargers before incorporating non-functioning chargers’ impact
NCH,afterTotal number of chargers after incorporating non-functioning chargers’ impact
NCH,jNumber of physically assigned chargers at the jth CS
NCH,BS,jFloat number of chargers that can be supplied by the BS at jth CS
NCH,PV,jFloat number of chargers that can be supplied by the PV system at jth CS
NCSNumber of CSs
NRECSNumber of RE-based CSs
NHNumber of HDEVs
NP,jNumber of HDEVs present at the jth CS
NPV,jNumber of assigned PV modules at the jth CS
NTC,jNumber of HDEVs that need charging at the jth CS
PBS,jCharge/discharge power of BS at the jth CS (kW)
PCH,ratedRated power of each charger (kW)
Pload,jTotal power required by the active chargers at the jth CS (kW)
Pmax,BS,jMaximum possible throughput power of BS at the jth CS (kW)
PPV,jTotal PV capacity (kW)
PPV,moduleCapacity of each PV module (kW)
SOCBS,jSOC of BS at the jth CS
SOCHMaximum allowable limit SOC for each BS
SOCLMinimum allowable limit SOC for each BS
SOCnext,trip,iRequired charge for the ith HDEV to complete the next trip (%)
SOCVBt,iSOC of ith HDEV’s battery
SPPWFBSSingle payment present worth factor of BS
t Index for step time
tarr,iArrival time of ith HDEV
tdep,iDeparture time of ith HDEV
T Number of time steps
η B S BS energy conversion efficiency (%)
η N F C Non-functioning charger proxy
η P V Overall PV module efficiency
η V B t , i Fuel efficiency of ith HDEV (kWh/mile)
t Time step duration (h)

References

  1. Clar-Garcia, D.; Campello-Vicente, H.; Fabra-Rodriguez, M.; Velasco-Sanchez, E. Research on Battery Electric Vehicles’ DC Fast Charging Noise Emissions: Proposals to Reduce Environmental Noise Caused by Fast Charging Stations. World Electr. Veh. J. 2025, 16, 42. [Google Scholar] [CrossRef]
  2. Garcia, E.; Johnston, J.; McConnell, R.; Palinkas, L.; Eckel, S.P. California’s Early Transition to Electric Vehicles: Observed Health and Air Quality Co-Benefits. Sci. Total Environ. 2023, 867, 161761. [Google Scholar] [CrossRef] [PubMed]
  3. Graham, P. Electric Vehicle Projections 2024: Update to the 2022 Projections Report 2024. Available online: https://aemo.com.au/-/media/files/major-publications/isp/2025/stage-2/electric-vehicle-projections-2024.pdf (accessed on 4 May 2025).
  4. Tietz, T.; Fay, T.-A.; Schlenther, T.; Göhlich, D. Electric Long-Haul Trucks and High-Power Charging: Modelling and Analysis of the Required Infrastructure in Germany. World Electr. Veh. J. 2025, 16, 96. [Google Scholar] [CrossRef]
  5. Aryanpur, V.; Rogan, F. Decarbonising Road Freight Transport: The Role of Zero-Emission Trucks and Intangible Costs. Sci. Rep. 2024, 14, 2113. [Google Scholar] [CrossRef]
  6. California Air Resources Board. California Meets Its Target for Zero-Emissions Truck Sales Two Years Ahead of Schedule; California Air Resources Board: Sacramento, CA, USA, 2023.
  7. United States Joint Economic Committee. Electrifying Heavy-Duty Vehicles Will Benefit the U.S. Economy, Environment, and Public Health; United States Joint Economic Committee: Washington, DC, USA, 2024.
  8. Danese, A.; Torsæter, B.N.; Sumper, A.; Garau, M. Planning of High-Power Charging Stations for Electric Vehicles: A Review. Appl. Sci. 2022, 12, 3214. [Google Scholar] [CrossRef]
  9. Liu, Z.; Zhang, W.; Ji, X.; Li, K. Optimal Planning of Charging Station for Electric Vehicle Based on Particle Swarm Optimization. In Proceedings of the 2012 IEEE PES Innovative Smart Grid Technologies (ISGT), Washington, DC, USA, 16–20 January 2012; pp. 1–5. [Google Scholar]
  10. Borlaug, B.; Muratori, M.; Gilleran, M.; Woody, D.; Muston, W.; Canada, T.; Ingram, A.; Gresham, H.; McQueen, C. Heavy-Duty Truck Electrification and the Impacts of Depot Charging on Electricity Distribution Systems. Nat. Energy 2021, 6, 673–682. [Google Scholar] [CrossRef]
  11. Burke, A. Assessment of Requirements, Costs, and Benefits of Providing Charging Facilities for Battery-Electric Heavy-Duty Trucks at Safety Roadside Rest Areas; Institute of Transportation Studies: Davis, CA, USA, 2022. [Google Scholar]
  12. Bruchon, M.; Borlaug, B.; Liu, B.; Jonas, T.; Sun, J.; Le, N.; Wood, E. Depot-Based Vehicle Data for National Analysis of Medium- and Heavy-Duty Electric Vehicle Charging; National Renewable Energy Laboratory (NREL): Golden, CO, USA, 2024. [CrossRef]
  13. Shariatio, O.; Coker, P.J.; Smith, S.T.; Potter, B.; Holderbaum, W. An Integrated Techno-Economic Approach for Design and Energy Management of Heavy Goods Electric Vehicle Charging Station with Energy Storage Systems. Appl. Energy 2024, 369, 123596. [Google Scholar] [CrossRef]
  14. Mishra, P.; Miller, E.; Santhanagopalan, S.; Bennion, K.; Meintz, A. A Framework to Analyze the Requirements of a Multiport Megawatt-Level Charging Station for Heavy-Duty Electric Vehicles. Energies 2022, 15, 3788. [Google Scholar] [CrossRef]
  15. El Helou, R.; Sivaranjani, S.; Kalathil, D.; Schaper, A.; Xie, L. The Impact of Heavy-Duty Vehicle Electrification on Large Power Grids: A Synthetic Texas Case Study. Adv. Appl. Energy 2022, 6, 100093. [Google Scholar] [CrossRef]
  16. Forrest, K.; Mac Kinnon, M.; Tarroja, B.; Samuelsen, S. Estimating the Technical Feasibility of Fuel Cell and Battery Electric Vehicles for the Medium and Heavy Duty Sectors in California. Appl. Energy 2020, 276, 115439. [Google Scholar] [CrossRef]
  17. Borlaug, B.; Chaudhari, K.; Fitzgerald, R.; Garikapati, V.; Ge, Y.; Moniot, M.; Rames, C.; Reinicke, N.; Wang, J.; Wood, E. Autonomous Energy Systems: Transportation. 2020. Available online: https://www.nrel.gov/grid/autonomous-energy (accessed on 4 May 2025).
  18. Ugirumurera, J.; Haas, Z.J. Optimal Capacity Sizing for Completely Green Charging Systems for Electric Vehicles. IEEE Trans. Transp. Electrif. 2017, 3, 565–577. [Google Scholar] [CrossRef]
  19. Gowda, S.N.; Ahmadian, A.; Anantharaman, V.; Chu, C.-C.; Gadh, R. Power Management via Integration of Battery Energy Storage Systems with Electric Bus Charging. In Proceedings of the 2022 IEEE Power & Energy Society Innovative Smart Grid Technologies Conference (ISGT), New Orleans, LA, USA, 24–28 April 2022; pp. 1–5. [Google Scholar]
  20. Zahedi, R.; Ahmadian, A.; SedghiSigarchi, K.; Gadh, R. An Optimal Methodology for Mitigating the Impacts of EVs and Solar Systems on the Grid by Utilizing Existing Residential Battery Storage Capacity with No Further Grid Upgrades. In Proceedings of the 2023 IEEE Transportation Electrification Conference & Expo (ITEC), Detroit, MI, USA, 21–23 June 2023; pp. 1–5. [Google Scholar]
  21. Shi, W.; Li, N.; Chu, C.-C.; Gadh, R. Real-Time Energy Management in Microgrids. IEEE Trans. Smart Grid 2015, 8, 228–238. [Google Scholar] [CrossRef]
  22. Home|JETSI. Available online: https://www.jetsiproject.com/ (accessed on 27 June 2024).
  23. Hu, D.; Huang, L.; Liu, C.; Liu, Z.-W. Locating and Sizing Charging Station in Multi-Period to Promote Electric Vehicles Adoption in Urban Areas. Energy Rep. 2024, 11, 3581–3598. [Google Scholar] [CrossRef]
  24. Cui, J.; Cao, Y.; Wang, B.; Wu, J. Multi-Stage Adaptive Expansion of EV Charging Stations Considering Impacts from the Transportation Network and Power Grid. Appl. Energy 2025, 386, 125544. [Google Scholar] [CrossRef]
  25. Yang, B.; Li, J.; Shu, H.; Cai, Z.; Tang, B.; Huang, X.; Zhu, M. Recent Advances of Optimal Sizing and Location of Charging Stations: A Critical Overview. Int. J. Energy Res. 2022, 46, 17899–17925. [Google Scholar] [CrossRef]
  26. Zhang, C.; Sedghisigarchi, K.; Sheinberg, R.; Gowda, S.N.; Gadh, R. Enhancing Voltage Stability in Distribution Networks through Metaheuristic Algorithm-Based Reactive Power Compensation from MDHD EVs. In Proceedings of the 2024 IEEE Power & Energy Society Innovative Smart Grid Technologies Conference (ISGT), Washington, DC, USA, 19–22 February 2024; pp. 1–5. [Google Scholar]
  27. Zahedi, R.; Lord, N.; SedghiSigarchi, K.; Gadh, R. Simultaneous Optimal Sizing of Multi Heavy-Duty Electric Charging Infrastructures Connected to Different Electric Utilities Considering Demand Charges. In Proceedings of the 2024 IEEE International Conference on Smart Mobility (SM), Niagara Falls, ON, Canada, 16–18 September 2024; pp. 93–98. [Google Scholar]
  28. Zahedi, R.; Gharehpetian, G.B. Optimal Sizing of Floating Photovoltaic System Equipped with Hydrogen Tank and Battery ESS. In Proceedings of the 2019 Smart Grid Conference (SGC), Tehran, Iran, 18–19 December 2019; pp. 1–5. [Google Scholar]
  29. Reddy, A.K.V.K.; Narayana, K.V.L. Meta-Heuristics Optimization in Electric Vehicles-an Extensive Review. Renew. Sustain. Energy Rev. 2022, 160, 112285. [Google Scholar] [CrossRef]
  30. Yang, X.S. Review of Meta-Heuristics and Generalised Evolutionary Walk Algorithm. Int. J. Bio-Inspired Comput. 2011, 3, 77–84. [Google Scholar] [CrossRef]
  31. Sinha, S.; Chandel, S.S. Review of Software Tools for Hybrid Renewable Energy Systems. Renew. Sustain. Energy Rev. 2014, 32, 192–205. [Google Scholar] [CrossRef]
  32. Bahramara, S.; Moghaddam, M.P.; Haghifam, M.R. Optimal Planning of Hybrid Renewable Energy Systems Using HOMER: A Review. Renew. Sustain. Energy Rev. 2016, 62, 609–620. [Google Scholar] [CrossRef]
  33. Khan, A.; Javaid, N. Jaya Learning-Based Optimization for Optimal Sizing of Stand-Alone Photovoltaic, Wind Turbine, and Battery Systems. Engineering 2020, 6, 812–826. [Google Scholar] [CrossRef]
  34. Khaki, B.; Chung, Y.-W.; Chu, C.; Gadh, R. Probabilistic Electric Vehicle Load Management in Distribution Grids. In Proceedings of the 2019 IEEE Transportation Electrification Conference and Expo (ITEC), Detroit, MI, USA, 19–21 June 2019; pp. 1–6. [Google Scholar]
  35. Khaki, B.; Chung, Y.-W.; Chu, C.; Gadh, R. Nonparametric User Behavior Prediction for Distributed Ev Charging Scheduling. In Proceedings of the 2018 IEEE Power & Energy Society General Meeting (PESGM), Portland, OR, USA, 05–10 August 2018; pp. 1–5. [Google Scholar]
  36. An, K. Battery Electric Bus Infrastructure Planning under Demand Uncertainty. Transp. Res. Part C Emerg. Technol. 2020, 111, 572–587. [Google Scholar] [CrossRef]
  37. Hu, H.; Du, B.; Liu, W.; Perez, P. A Joint Optimisation Model for Charger Locating and Electric Bus Charging Scheduling Considering Opportunity Fast Charging and Uncertainties. Transp. Res. Part C Emerg. Technol. 2022, 141, 103732. [Google Scholar] [CrossRef]
  38. Xie, R.; Wei, W.; Khodayar, M.E.; Wang, J.; Mei, S. Planning Fully Renewable Powered Charging Stations on Highways: A Data-Driven Robust Optimization Approach. IEEE Trans. Transp. Electrif. 2018, 4, 817–830. [Google Scholar] [CrossRef]
  39. Karmali, L.P.; Gholami, A.; Nezamoddini, N. Integrated Optimization of Production Planning and Electric Trucks Charging and Discharging Scheduling. Sustain. Energy Grids Netw. 2024, 39, 101397. [Google Scholar] [CrossRef]
  40. Rempel, D.; Cullen, C.; Bryan, M.M.; Cezar, G.V. Reliability of Open Public Electric Vehicle Direct Current Fast Chargers. Hum. Factors 2023, 66, 2528–2538. [Google Scholar] [CrossRef]
  41. Ashkezari, L.S.; Mouli, G.R.C.; Yorke-Smith, N.; Bauer, P. Multiobjective System Sizing for Heavy-Duty Electric Vehicle Charging Stations. In Proceedings of the 2024 IEEE International Conference on Electrical Systems for Aircraft, Railway, Ship Propulsion and Road Vehicles and International Transportation Electrification Conference (ESARS-ITEC), Naples, Italy, 26–29 November 2024. [Google Scholar] [CrossRef]
  42. Jackson, D.; Cao, Y.; Beil, I. Bi-Level Optimization Framework for Heavy-Duty Electric Truck Charging Station Design. In Proceedings of the 2022 IEEE Transportation Electrification Conference & Expo (ITEC), Anaheim, CA, USA, 15–17 June 2022; pp. 563–568. [Google Scholar] [CrossRef]
  43. Mohamed, A.A.S.; Ingalalli, A.; Ur Rehman, W.; Bhavaraju, V. Sizing of Fast Charging Infrastructure Site for Commercial Electric Vehicle Fleet Considering Smart Charge Management. In Proceedings of the 2024 IEEE Transportation Electrification Conference & Expo (ITEC), Chicago, IL, USA, 19–21 June 2024. [Google Scholar] [CrossRef]
  44. Danese, A.; Garau, M.; Sumper, A.; Torsæter, B.N. Electrical Infrastructure Design Methodology of Dynamic and Static Charging for Heavy and Light Duty Electric Vehicles. Energies 2021, 14, 3362. [Google Scholar] [CrossRef]
  45. Maheri, A. A Critical Evaluation of Deterministic Methods in Size Optimisation of Reliable and Cost Effective Standalone Hybrid Renewable Energy Systems. Reliab. Eng. Syst. Saf. 2014, 130, 159–174. [Google Scholar] [CrossRef]
  46. Ferris, D. Politico. 2023. Available online: https://www.politico.com/live-updates/2023/11/14/congress/house-passes-johnson-bill-to-avert-shutdown-00127099 (accessed on 4 May 2025).
  47. California Air Resources Board. Electric Vehicle Supply Equipment Standards Technology Review; California Air Resources Board: Sacramento, CA, USA, 2022.
  48. Maleki, A.; Ameri, M.; Keynia, F. Scrutiny of Multifarious Particle Swarm Optimization for Finding the Optimal Size of a PV/Wind/Battery Hybrid System. Renew. Energy 2015, 80, 552–563. [Google Scholar] [CrossRef]
  49. Tervo, E.; Agbim, K.; DeAngelis, F.; Hernandez, J.; Kim, H.K.; Odukomaiya, A. An Economic Analysis of Residential Photovoltaic Systems with Lithium Ion Battery Storage in the United States. Renew. Sustain. Energy Rev. 2018, 94, 1057–1066. [Google Scholar] [CrossRef]
  50. RATE SCHEDULES TOU-EV-7, TOU-EV-8, TOU-EV-9. Available online: https://www.sce.com/sites/default/files/inline-files/TOU-EV-7_8_9%20Rate%20Fact%20Sheet_WCAG%20(2).pdf (accessed on 7 July 2024).
  51. Li, J.; He, S.; Yang, Q.; Ma, T.; Wei, Z. Optimal Design of the EV Charging Station with Retired Battery Systems against Charging Demand Uncertainty. IEEE Trans. Industr. Inform. 2022, 19, 3262–3273. [Google Scholar] [CrossRef]
  52. Wu, C.-H.; Lee, W.-C.; Ke, J.-C.; Liu, T.-H. Optimization Analysis of an Unreliable Multi-Server Queue with a Controllable Repair Policy. Comput. Oper. Res. 2014, 49, 83–96. [Google Scholar] [CrossRef]
  53. Advanced Clean Fleets Regulation Summary. California Air Resources Board. 2023. Available online: https://ww2.arb.ca.gov/our-work/programs/advanced-clean-fleets (accessed on 4 May 2025).
  54. Sbordone, D.; Bertini, I.; Di Pietra, B.; Falvo, M.C.; Genovese, A.; Martirano, L. EV Fast Charging Stations and Energy Storage Technologies: A Real Implementation in the Smart Micro Grid Paradigm. Electr. Power Syst. Res. 2015, 120, 96–108. [Google Scholar] [CrossRef]
  55. Liimatainen, H.; van Vliet, O.; Aplyn, D. The Potential of Electric Trucks–An International Commodity-Level Analysis. Appl. Energy 2019, 236, 804–814. [Google Scholar] [CrossRef]
  56. Alternative Fuels Data Center: Operation and Maintenance for Electric Vehicle Charging Infrastructure. Available online: https://afdc.energy.gov/fuels/electricity-infrastructure-maintenance-and-operation (accessed on 8 July 2024).
  57. Cole, W.; Frazier, A.W.; Augustine, C. Cost Projections for Utility-Scale Battery Storage: 2021 Update; National Renewable Energy Lab.(NREL): Golden, CO, USA, 2021. [Google Scholar]
  58. IRENA. Renewable Power Generation Costs in 2020; eBook Partnership; International Renewable Energy Agency: Abu Dhabi, United Arab Emirates, 2022; ISBN 9292603795. [Google Scholar]
Figure 1. Stepwise conceptual framework outline of the proposed planning framework.
Wevj 16 00318 g001
Figure 2. The flow chart of the proposed energy management algorithm for assigning weight to HDEVs.
Wevj 16 00318 g002
Figure 3. The detailed operational flow of the proposed CS planning framework.
Wevj 16 00318 g003
Figure 4. The flowchart of the deployed mixed-approach optimization solver.
Wevj 16 00318 g004
Figure 5. Multi-period HDEV rollout plan timeline assumed in the case study.
Wevj 16 00318 g005
Figure 6. HDEV (a) and charger (b) activities at utility-based CS (CS1).
Wevj 16 00318 g006
Figure 7. HDEV (a), charger (b), and BS (c) activities at RE-based CS (CS2).
Wevj 16 00318 g007aWevj 16 00318 g007b
Figure 8. Total annual cost (a), number of chargers (b), PV size (c), and BS size (d) for multi-period CS expansion using the proposed framework, compared with other methods.
Wevj 16 00318 g008
Table 1. The simulation parameters [40,54,55,56,57,58].
SymbolValueUnit
CC,BS626USD/kWh
CC,CH960USD/unit
CC,PV111.9USD/kW
COM,BS2.5%* CC,BSUSD
COM,CH800USD/unit/yr
COM,PV13USD/kW/yr
C r a t e d c 1-
CHigh0.16799USD/kWh
CMid0.09729USD/kWh
CLow0.04595USD/kWh
E B S , m o d u l e 100 kWh
EVBt550 kWh
j4%
n20 Yr
PCH,rated180 kW
P P V , m o d u l e 100 kW
S O C H 0.95-
S O C L 0.05-
η B S 0.9-
η N F C 1.27-
η V B t 2.22 kWh/mil
t 20 min
Table 2. Optimal number of components for different cases at each period taking into accounts two layers of uncertainty.
Period 1Period 2Period 3
Case 1Case 2Case 3Case 1Case 2Case 3Case 1Case 2Case 3
Chargers at CS13335556610
Chargers at CS21125557711
PV modules668151616202035
BS modules666111219152436
Disclaimer/Publisher’s Note: The statements, opinions and data contained in all publications are solely those of the individual author(s) and contributor(s) and not of MDPI and/or the editor(s). MDPI and/or the editor(s) disclaim responsibility for any injury to people or property resulting from any ideas, methods, instructions or products referred to in the content.

