Article

Modelling of Energy Management Strategies in a PV-Based Renewable Energy Community with Electric Vehicles

by
Shoaib Ahmed
1,2,*,
Amjad Ali
3,4,
Sikandar Abdul Qadir
3,
Domenico Ramunno
5 and
Antonio D’Angola
1,*
1
Department of Engineering, University of Basilicata, Via dell’Ateneo Lucano, 10, 85100 Potenza, PZ, Italy
2
Department of Information and Electrical Engineering and Applied Mathematics (DIEM), University of Salerno, Via Giovanni Paolo II, 132, 84084 Fisciano, SA, Italy
3
Interdisciplinary Research Centre for Sustainable Energy Systems (IRC-SES), King Fahd University of Petroleum & Minerals, Dhahran 31261, Saudi Arabia
4
Electrical Engineering Department, King Fahd University of Petroleum & Minerals, Dhahran 31261, Saudi Arabia
5
Ramunno S.r.l., C.da Caolo Zona p.i.p, 85057 Tramutola, PZ, Italy
*
Authors to whom correspondence should be addressed.
World Electr. Veh. J. 2025, 16(6), 302; https://doi.org/10.3390/wevj16060302
Submission received: 29 April 2025 / Revised: 18 May 2025 / Accepted: 25 May 2025 / Published: 29 May 2025

Abstract

:
The Renewable Energy Community (REC) has emerged in Europe, encouraging the use of renewable energy sources (RESs) within localities, bringing social, economic, and environmental benefits. RESs are characterized by various loads, including household consumption, storage systems, and the increasing integration of electric vehicles (EVs). EVs offer opportunities for distributed RESs, such as photovoltaic (PV) systems, which can be economically advantageous for RECs whose members own EVs and charge them within the community. This article focuses on the integration of PV systems and the management of energy loads for different participants—consumers and prosumers—along with a small EV charging setup in the REC. A REC consisting of a multi-unit building is examined through a mathematical and numerical model. In the model, hourly PV generation data are obtained from the PVGIS tool, while residential load data are modeled by converting monthly electricity bills, including peak and off-peak details, into hourly profiles. Finally, EV hourly load data are obtained after converting the data of voltage and current data from the charging monitoring portal into power profiles. These data are then used in our mathematical model to evaluate energy fluxes and to calculate self-consumed, exported, and shared energy within the REC based on energy balance criteria. In the model, an energy management system (EMS) is included within the REC to analyze EV charging behavior and optimize it in order to increase self-consumption and shared energy. Following the EMS, it is also suggested that the number of EVs to be charged should be evaluated in light of energy-sharing incentives. Numerical results have been reported for different seasons, showing the possibility for the owners of EVs to charge their vehicles within the community to optimize self-consumption and shared energy.

1. Introduction

Renewable Energy Communities (RECs) are on the rise across Europe, encouraging the use of renewable energy sources (RESs) within localities, resulting in social, economic, and environmental benefits. The RESs have positive impacts on the environment as compared to non-RESs like fossil fuel-based energy sources [1]. This work is also focused on the integration of photovoltaic (PV) and electric vehicles (EVs), following the modeling and energy management strategies.

1.1. Background Study

Recently, environmental problems have become more severe and widespread, necessitating societal transformation. The energy paradigm shift, which substitutes cleaner, more sustainable, and less resource-intensive renewable energy sources (RESs) for non-renewable energy and pollution-producing sources, is one of the most pressing of these. Furthermore, these cutting-edge technologies are already regarded as dependable and cost-effective, as per the different countries [2]. By switching to renewable energy sources, societies can lessen their adverse effects on the environment, encourage sustainable growth, and clear the path for a robust and equitable energy future. By 2050, the European Union (EU) plans to push toward a decarbonized European energy system [3]. Several intermediate climate and energy milestones have been defined for 2020 and 2030 for this goal. By 2030, compared to the baseline year of 1990, the most recent goals call for a 32% share of RESs in final energy consumption, a 40% decrease in greenhouse gas emissions, and a 32.5% increase in energy efficiency as per the clean energy package of the EU [4]. The European Union’s GHG emission standards and sustainability objectives are established by the Renewable Energy Directive, usually referred to as Directive (EU) 2018/2001 or RED II. The idea of renewable energy communities is also defined in this RE Directive [5], which has the goal of providing EU Member States with social, environmental, and financial benefits. One important element in encouraging the broader use of on-site RESs is the establishment of RECs [6]. To clear the way for a sustainable energy future, a variety of RESs, including solar photovoltaic (PV), wind, and biomass, have been extensively promoted in recent years [7]. RESs are available in many countries, but they exhibit different characteristics. Solar energy is one of the most well-known power systems for RESs [8]. Among solar energy technologies, solar photovoltaic (PV) has become the most prevalent technology due to its low cost and minimal maintenance requirements [9]. Within RECs, EU Member States will be able to produce, consume, store, sell, and share energy, which could result in lower energy costs, contribute to overcoming climate issues, and foster community involvement. Through this, the package also supports and aims to increase energy sharing within the community and maximize self-consumption by implementing several regulatory innovations [10]. Energy communities are predicted to hold roughly 17% of installed wind capacity and 21% of solar capacity by 2030, as per a report from the EU’s Joint Research Centre [11].
About the RECs, there could be EVs and EV charging infrastructure in RECs, and the energy used for EV charging is taken into account when determining the shared energy consumption inside the REC [12]. The energy crisis and environmental concerns have contributed to the rise in popularity of EVs as a substitute for conventional automobiles with internal combustion engines [13,14]. Globally, the development of EVs has increased due to growing worries about climate change and energy security. Strong financial incentives for EV development have been offered by major nations like Norway, France, Ireland, Spain, the United Kingdom, Belgium, Japan, the United States, Canada, China, and India [15,16]. Thanks to the recent advancement of the smart grid concept, EVs now serve a more complex role in the electrical grid [17,18]. EVs have numerous uses in microgrids (MGs), and the smart grids have different strategies [19]. Authors in reference [20] present the range of EV integration possibilities available for community MGs. They also discuss the challenges and uncertainties surrounding the adoption of EVs. In reference [21], a model is presented that aims to explore how Vehicle-to-Grid (V2G) technology and intelligent electric vehicle (EV) charging can increase photovoltaic (PV) power self-consumption. An innovative idea that has the potential to completely change the electrical system is the integration of V2G electric vehicles. Integration of V2G creates new possibilities and opportunities as the technology makes it possible to feed electricity from car batteries back into buildings or the electrical grid—a process referred to as bidirectional charging. It makes it possible for automobiles to store energy and make up for grid imbalances and is considered a method of energy storage, carbon footprint reduction, and energy security [22,23]. Moreover, charging EVs has also become an emerging topic as the idea that EV chargers are a necessary component of existing and future structures which is further supported by the recast Energy Performance of Buildings Directive, which anticipates installing appropriate charging infrastructure for existing buildings undergoing extensive renovations as well as pre-cabling for EV charging in new buildings [24]. As for the RECs, it is a good option to install their chargers for EVs, as sharing community-owned chargers with outside users can be advantageous for both parties in the setting up of RECs. Eventually, it should boost communal self-consumption, providing members with extra financial advantages through incentives for energy sharing. In addition, external users should profit from a lower charging service fee than they would if they charged EVs somewhere else. Therefore, it is essential to develop an EV charging infrastructure specifically tailored to RECs with local RES generation, enabling accurate energy sharing and access to associated incentives [25].
This work investigates Photovoltaic (PV) integration and EV charging in RECs, considering the self-consumption and energy sharing scenarios with REC members. This introduces here the role of energy management systems (EMS). Within the MG or energy community, EMS is utilized to track and optimize energy output, consumption, and storage [26,27]. Participants now have more flexibility in producing, purchasing, and selling electricity. The development of an EMS that can effectively assist energy communities in their endeavors to monitor, optimize both individual and collective self-consumption, engage in peer-to-peer trading, and regulate additional factors [28,29]. The EMS performs a variety of tasks, including data analysis, predictive modeling, optimization, and network reconfiguration [30]. In the end, this will result in high levels of satisfaction and conformity to normative requirements. In the model, a photovoltaic (PV)-based REC has been considered, and the time-dependent evolution of the system has been evaluated on an hourly basis, starting from the loads of consumers and prosumers and including an EV charging setup in the renewable energy community (REC). Hourly load data are necessary as per the Italian regulatory framework, and profiles are obtained from the monthly electricity bills using mathematical modeling. EV hourly load profiles are taken from the EV charging portal of a real charging system. Self-consumed, sold, and shared energy is evaluated by using the time-dependent model on an hourly basis in a one-year scenario. In the model, a proper energy management system (EMS) is included within the REC to optimize the system starting from photovoltaic (PV), electric vehicles (EVs), and load profiles. The EMS suggests charging the number of EVs based on capacity, considering the seasons, and evaluates the advantages of REC that incorporate EV owners, allowing them to charge their EVs within the community during the day to increase the contribution of energy sharing incentives. This offers a thorough evaluation of the possible benefits and effects of incorporating external load profiles to increase shared energy in cases of excess power generation.

1.2. Novelty and Motivation of Work

The research work addresses the growing need for implementing sophisticated energy management systems (EMS) in photovoltaic (PV)-based RECs in which EV charging setups are included alongside residential appliances. This study investigates the behavior of EVs in the REC context, looking into how Photovoltaic (PV) energy might be maximized to satisfy household demands, shared energy, as well as EV charging needs. In addition, the study offers perspectives on figuring out the maximum number of EVs that can be supported in a REC.
REC represents a new and innovative model and an approach to increase the penetration of renewable energy production. REC modeling is an emerging topic, and few attempts [25,31] have been carried out to investigate the time-dependent evolution of energy fluxes in RECs, which is the most important part of their design. Moreover, EV mobility is suffering from slow progress and implementation, but in the future, EVs will assume a relevant role, becoming a principal element of RECs. The originality of our numerical model consists of examining hourly basis energy flow dynamics to optimize prosumer self-consumption and enable energy sharing with other community members. Additionally, this provides a novel viewpoint on combining EVs and photovoltaic (PV) in RECs to establish a sustainable EMS.
The motivation behind this research is the need for a sustainable energy management system (EMS), which manages PV energy for EV charging, manages REC load demands efficiently, and supports the sharing of energy to give advantages to REC and members. This study intends to promote the sustainable integration of PV and EVs into local energy systems by developing a resilient, self-sustaining REC that maximizes RESs like PV and is in line with more general sustainability objectives.

1.3. Contributions and Organization

Among the principal contributions are (1) designing a PV system plant to determine its capacity and using that to collect hourly data. (2) Converting electricity bill data into hourly load profiles for the whole year, considering the Peak–Off-Peak ranges (F1, F2, and F3). (3) Taking the EV hourly data from the EV charging portal used in our model. (4) Developing a time-dependent REC model focusing on the participants like prosumers and consumers and deciding the number of prosumers as per the high load profile. (5) Creating a strong EMS that gives PV self-consumption top priority to fulfill participants’ demands and EV charging requirements, thereby lowering grid dependency and improving community members’ prospects for energy sharing. (6) Examining how EV charging loads affect REC by implementing criteria to ascertain the ideal number of EVs that a community can support while still satisfying home demand. Moreover, a seasonal impact is observed in energy fluxes and self-sufficiency. (7) Putting in place energy-sharing systems that allow prosumers and consumers to share PV-generated energy in an efficient and fair manner, encouraging resilience and balanced load management.
This paper is organized into different sections. Section 2 presents the background study, covering PV system design, capacity evaluation, EV charging, and load profiling by collecting and monitoring data from the portal, along with the load data of consumers and prosumers in the REC. Section 3 describes the model in detail with PV integration supplying electricity to consumers and prosumers and EVs. It also introduces the formulas for finding the energy consumption, energy selling, and energy sharing within the community through the grid. Section 4 presents and discusses the results of energy flows, including energy self-consumption, energy sharing, and surplus or deficit of energy. Section 5 concludes the study, summarizing the key findings and outlining directions for future work.

2. Background Study and Work

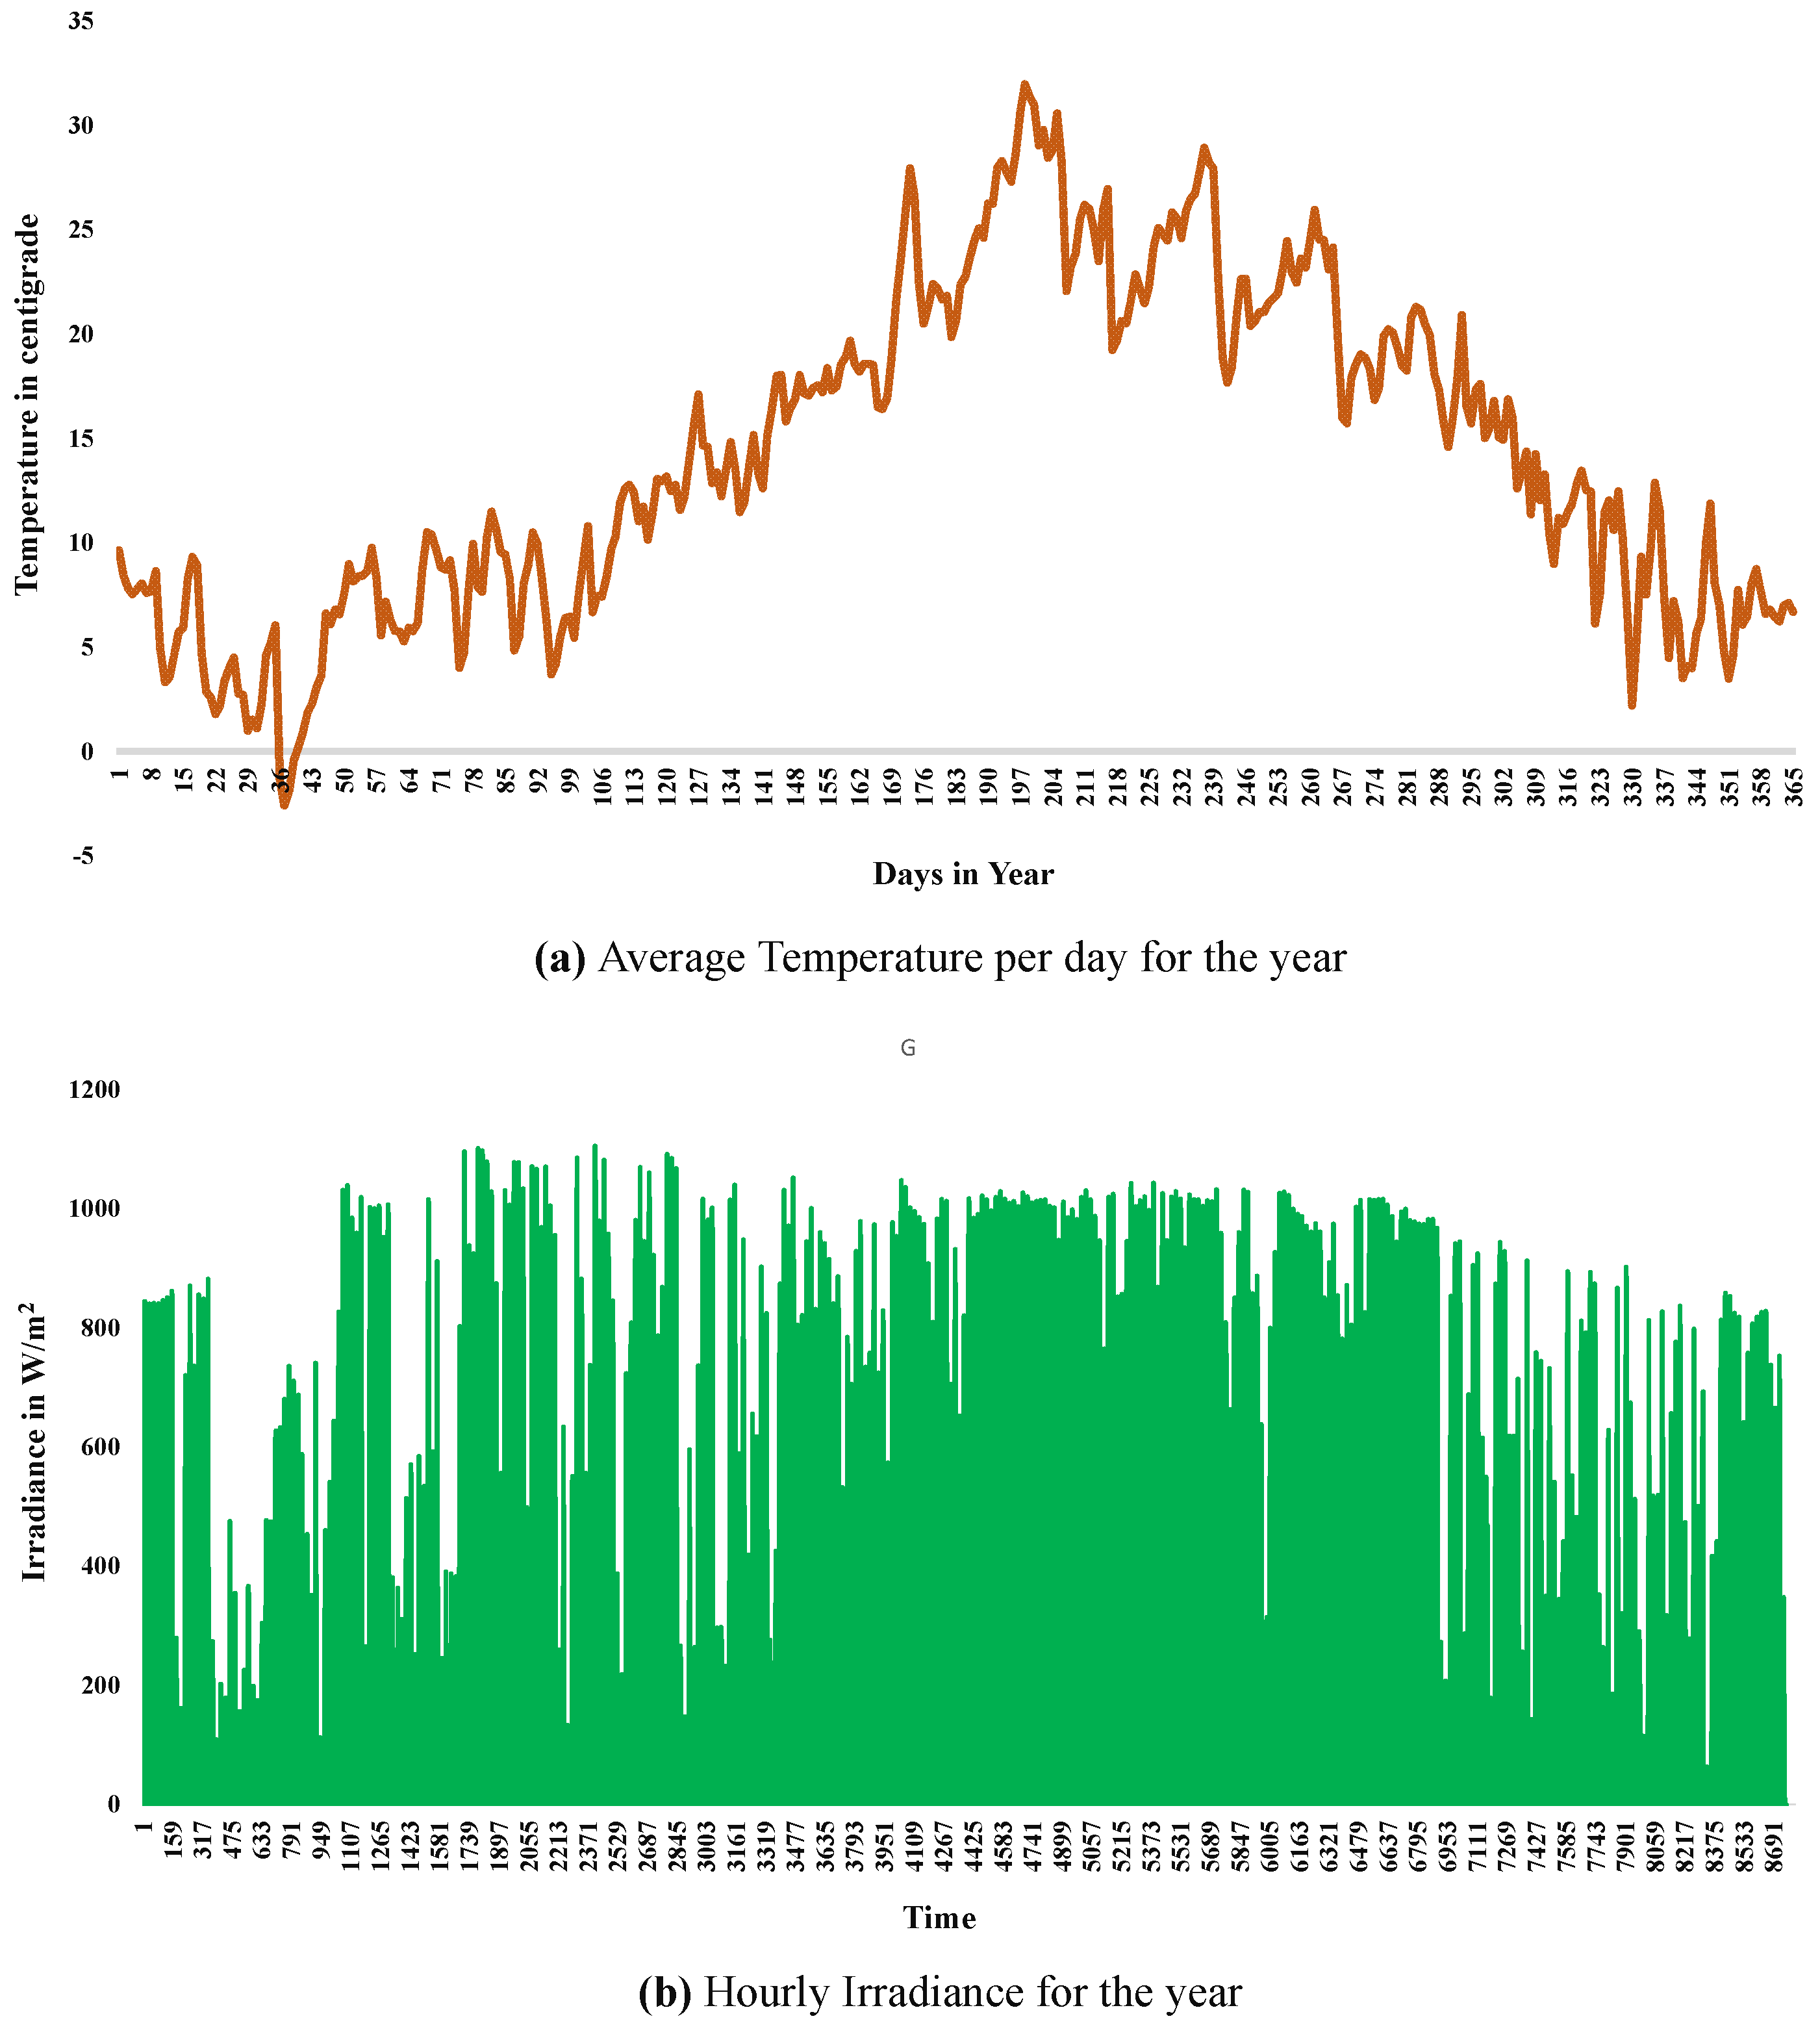
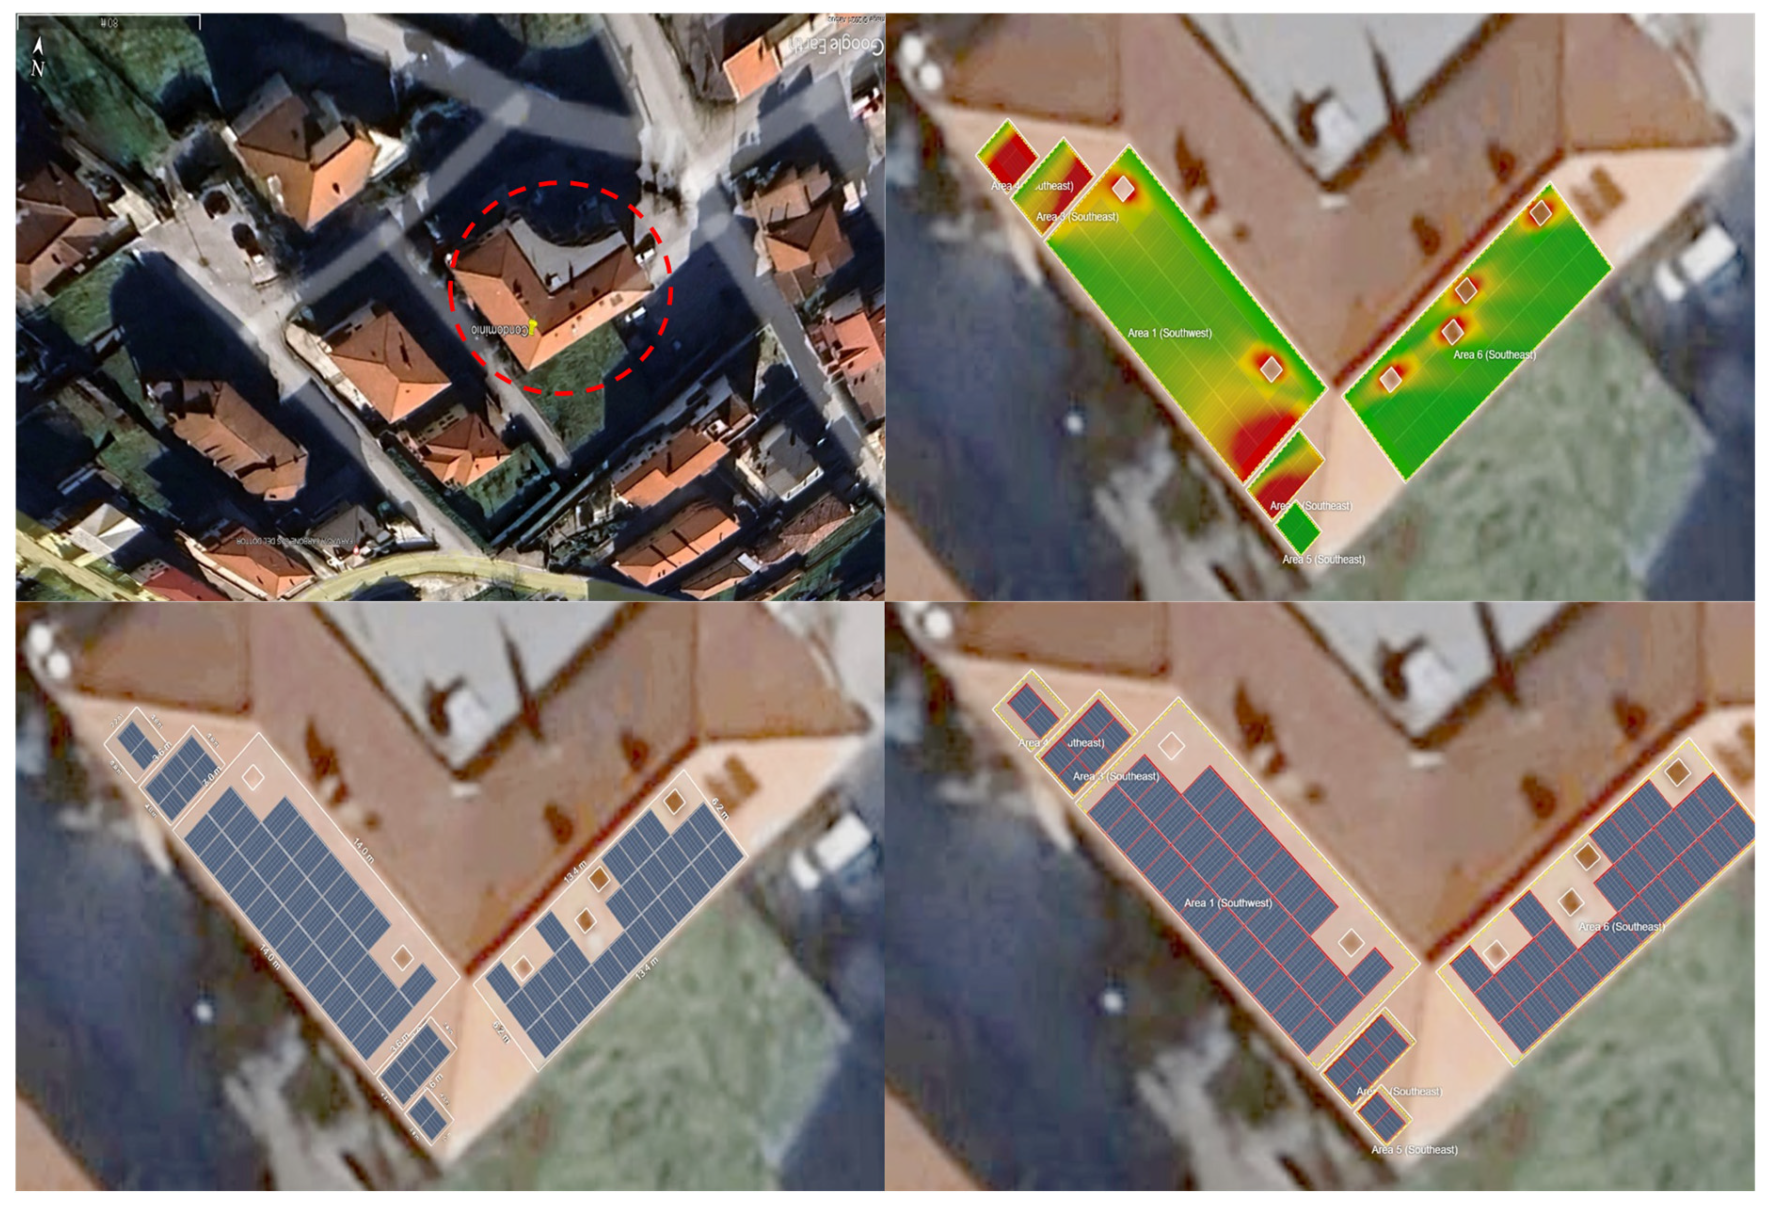
2.1. Photovoltaic System

Solar photovoltaic (PV) is currently the most widely used renewable energy source globally, based on the number of installations. Because of the continuous decline in the cost of PV panels and the increase in solar cell efficiency, its capacity is frequently growing [32,33]. Italian PV capacity also grows, with southern regions, such as Sicily and Calabria, having higher Direct Normal Irradiation (DNIs). The national PV power map indicates strong potential, with the best output taking place in the middle and southern regions, where irradiance and temperature are higher [34]. In our model, we probed a case located in Tramutola, Potenza, southern Italy. The irradiance (G in W/m2) and ambient temperature (T in °C) values are shown in Figure 1. These values are obtained by the PVGIS online tool [35] and the NASA data base through HOMER Grid x64 1.11.4 (Pro Edition) [36]. A site that receives intense direct sunlight with better G and T values results in an increased amount of electricity that solar PV systems can produce.
Apart from this, the system is designed for the given area, as shown in Figure 2 [37]. The maximum capacity of the solar PV plant has been calculated based on the roof area and a nominal power of 32 kW, utilizing 76,425 W panels. Based on the system design and the capacity, the hourly PV data are taken from the PVGIS tool [35]. PV production could be individual for the prosumers or via a common plant installed on the building’s roof, but in our case, we have considered a common PV plant for ease of installation, contribution, and economic reasons.

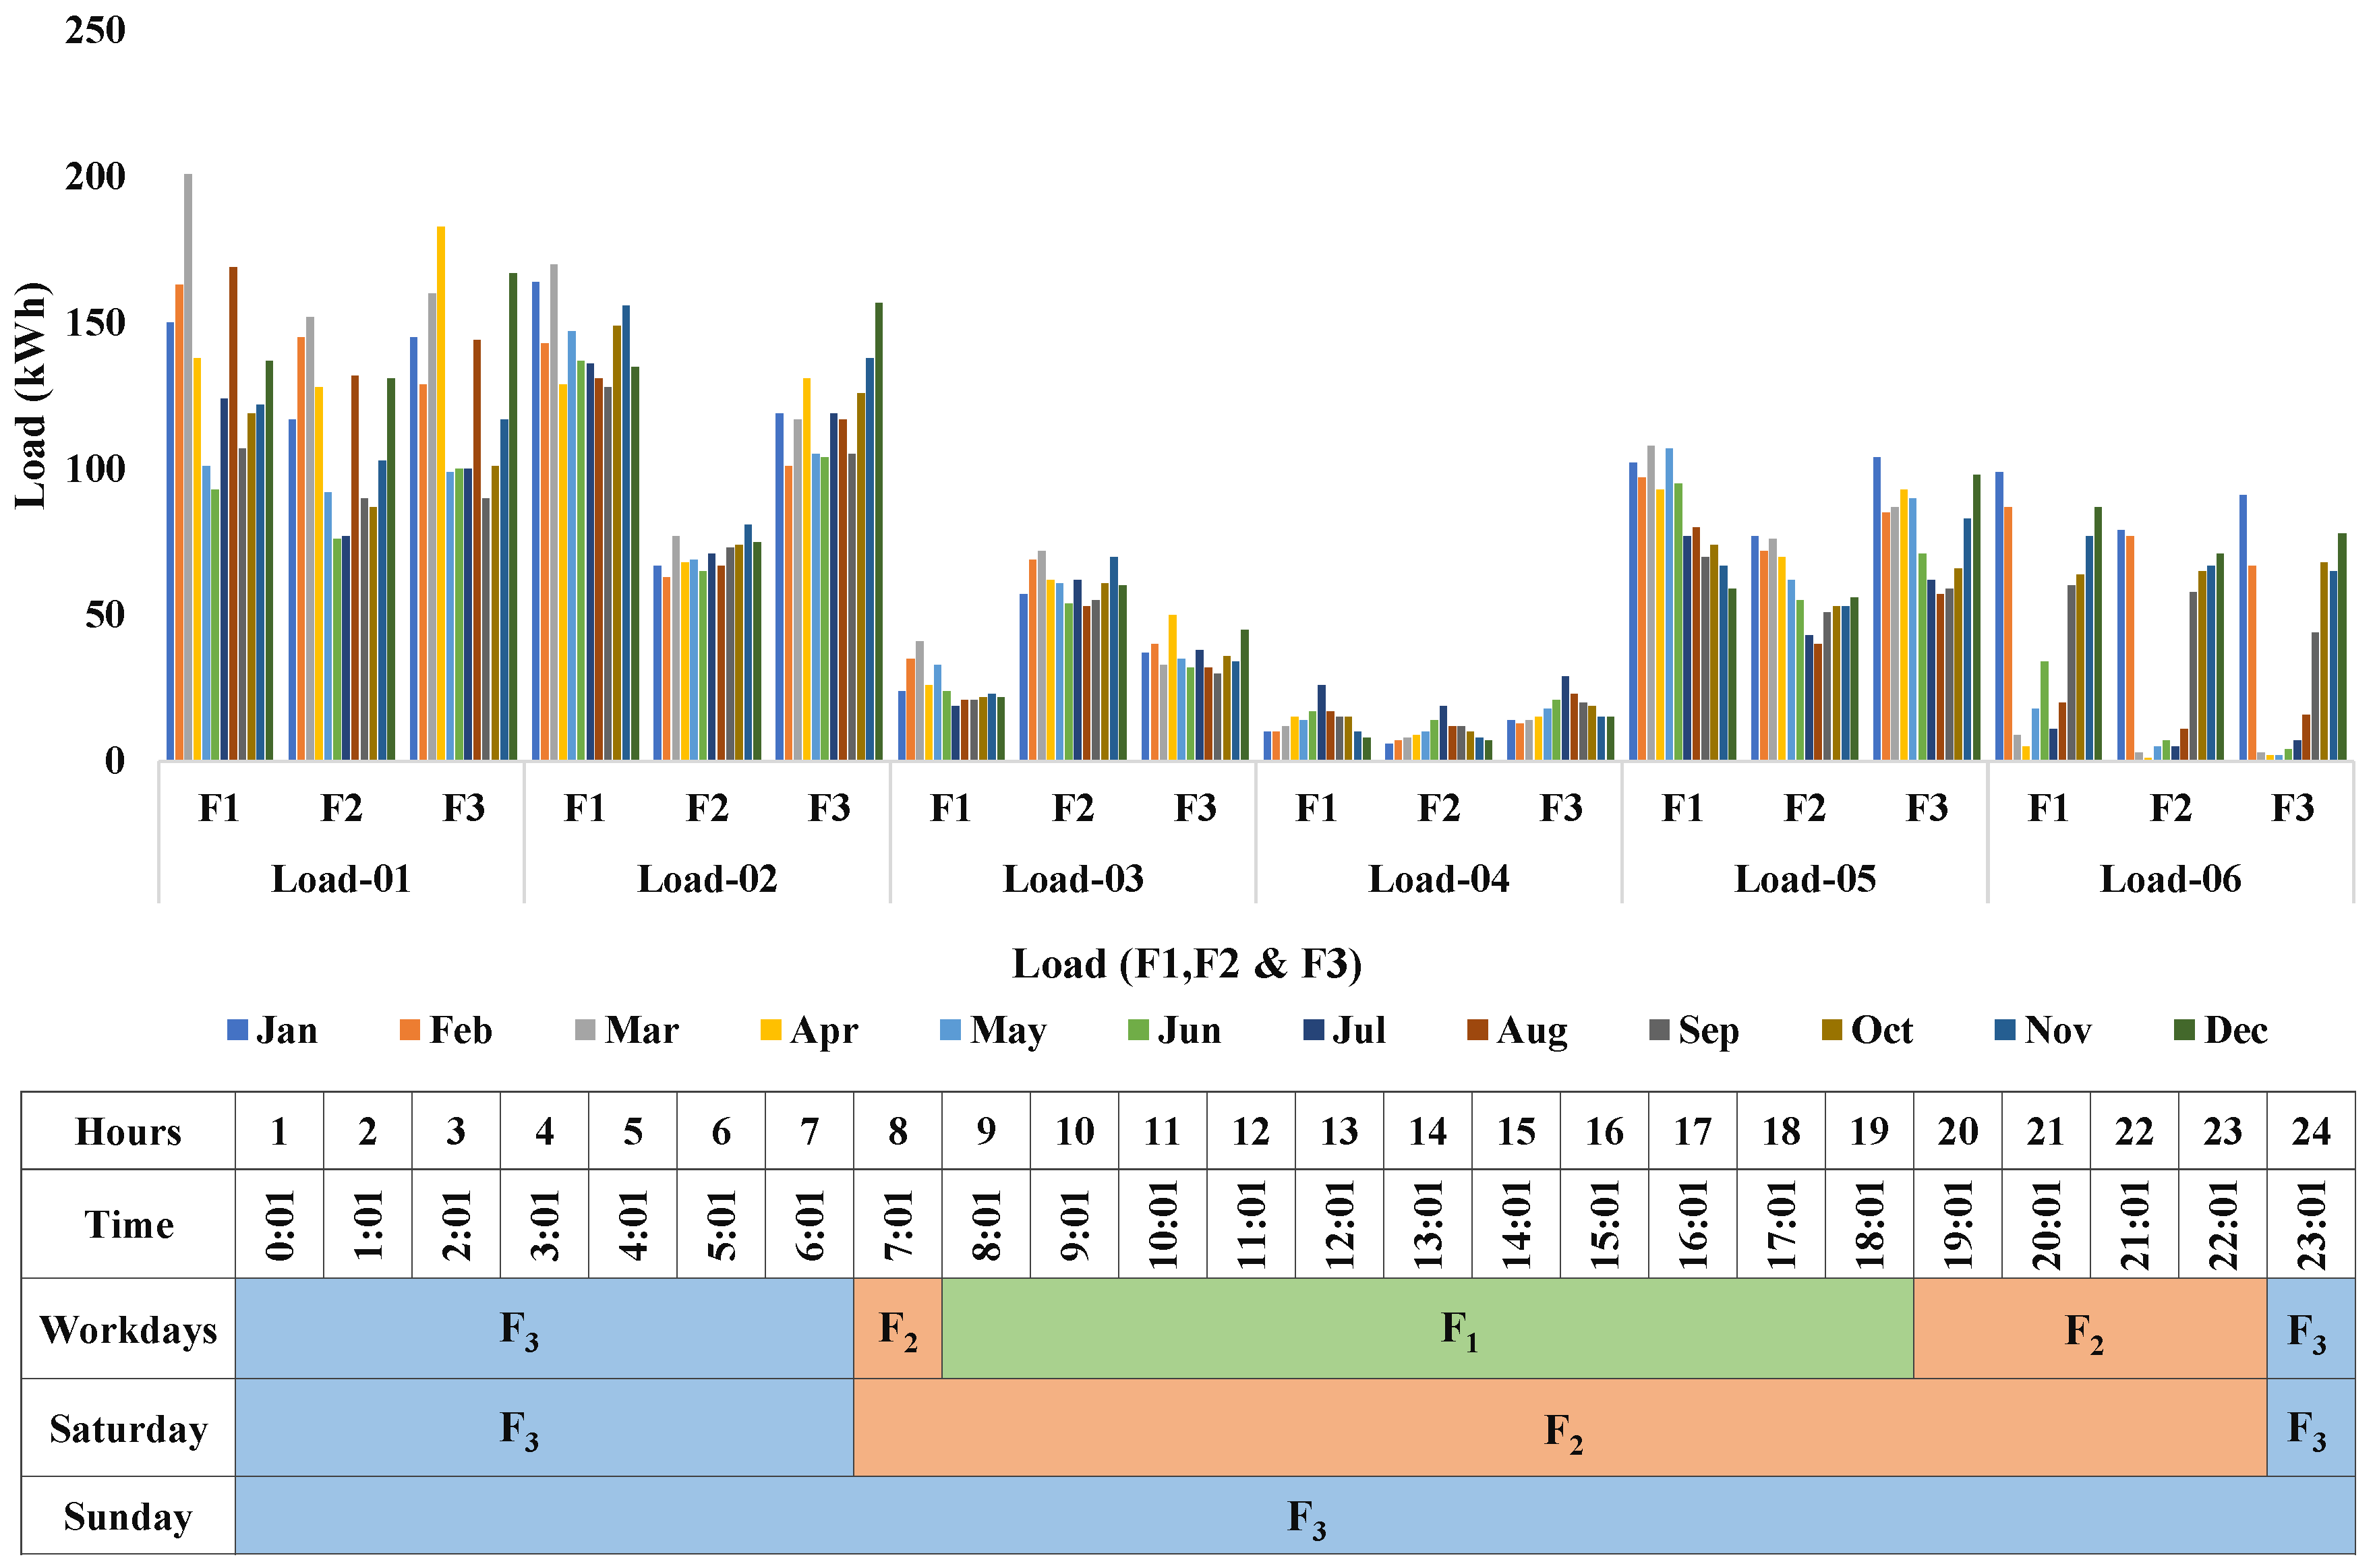
2.2. Energy Consumption and Load Data of Participants Details

ECs are constituted by energy consumers and prosumers (self-consumption) [12,38]. The research work on RECs has been on the rise in European countries due to many advantages, like incentives for shared energy and ancillary services. However, designing an energy community is a difficult task in many nations since no metering infrastructure delivers data at an hourly or sub-hourly resolution level for low-voltage users (such as residential and commercial customers) [39], and, at the same time, the design typically considers only statistically based load and meteorological data on an hourly basis. This work also deals with the same challenge and focuses on obtaining the hourly energy consumption data to be used in the REC model. In the model, we consider a REC constituted by a single building with six users. The load profile of each user has been taken from the monthly bills with Peak–Off-Peak ranges (F1, F2, and F3). These load profiles are then converted on an hourly basis by recurring to an original algorithm in which the time-dependent load profiles respect energy conservation for all the Peak–Off-Peak ranges. This helps in putting the input to see the behavior and energy exchanges flow in the community on an hourly basis. Moreover, the data and the difference between the time of use as F1, F2, and F3 in different days like Saturday, Sunday, and working days, as per the Italian framework, are depicted in Figure 3.
The formulation used for converting the load on an hourly basis is given as follows:
L m , F x , h = n = 1 8760 L F x , m T F x , m h
where L m , F x , h is the converted hourly load in Fx (F1, F2, and F3) for the different months (m) for the whole year, and all the participants’ load data (L) from the electricity bills and the time (T) for the specific month. It is a simple ratio of L F x , m and T F x , m h which converts the load on an hourly basis for the whole year, differentiating as per F1, F2, and F3. The converted load of one user for three days for December, with three different days (Friday or workday, Saturday, and Sunday) highlighting the difference between F1, F2, and F3, is also depicted in Figure 4 for more clarification. Apart from this, Table 1 is also added for all the months for one user to show the load conversion details for all the months on an hourly basis.

2.3. Electric Vehicles (EVs) and Charging Infrastructure

Recent development of the smart grid concept, electric vehicles now play a more complex role in the electrical grid [18]. Moreover, EVs have the potential to completely replace internal combustion engine vehicles as battery technology develops and EVs become more widely available and affordable. EVs have a wide range of advantages and applications in MG and the smart grid. There are different types of EVs, showing the differences in electrification between the different types of EVs depicted in Figure 5a–d, showing their internal pictorial view. Additionally, Figure 5e shows the differences in all EVs as per the GHG emissions, and BEV is 100% electrified [40,41].
Furthermore, given the rising popularity of EVs, this report also discusses the expanding demand for EV charging stations. There may be EVs and EV charging infrastructure in RECs, and the energy used for EV charging is managed by a proper EMS [12]. EV charging points must be installed and available to ensure convenient charging for EVs. Level 1, Level 2, and Level 3 are the three primary levels into which it is generally classified. Using a typical home outlet, Level 1 charging is the slowest. Level 2 chargers are found in public charging stations and households, and they are faster. The fastest is DC rapid charging, which is frequently offered at certain charging stations [42]. In this work, a battery electric vehicle (BEV) is considered with a charging point, both with single-phase and three-phase ports. The charging behavior and load profile could be seen from the charging service operation ABB portal [43]. The contract capacity is around 29.4 kW with a single phase of 7.4 kW rated output power and a three-phase of 22 kW rated output power. The peak demand for the day following the ABB charging portal is 11.04 kW for the EV used in our analysis. The data are taken from the charging portal to see the load and charging behavior. Moreover, the data of current and voltage have been considered from the EV charging portal, converted to power by using Equation (3). The voltage of a single-phase power supply system can be as high as 230 V. However, it is 400 V for three-phase system, but it can reach up to a voltage of up to 415 V. The current value depends on the load of the EV during charging. These values of voltage, current, and power are shown in Figure 6. The load data (kW) is then used in our model to evaluate energy fluxes.
P ( 1 ) = V · I · c o s φ
P ( 3 ) = 3 · V · I · c o s φ

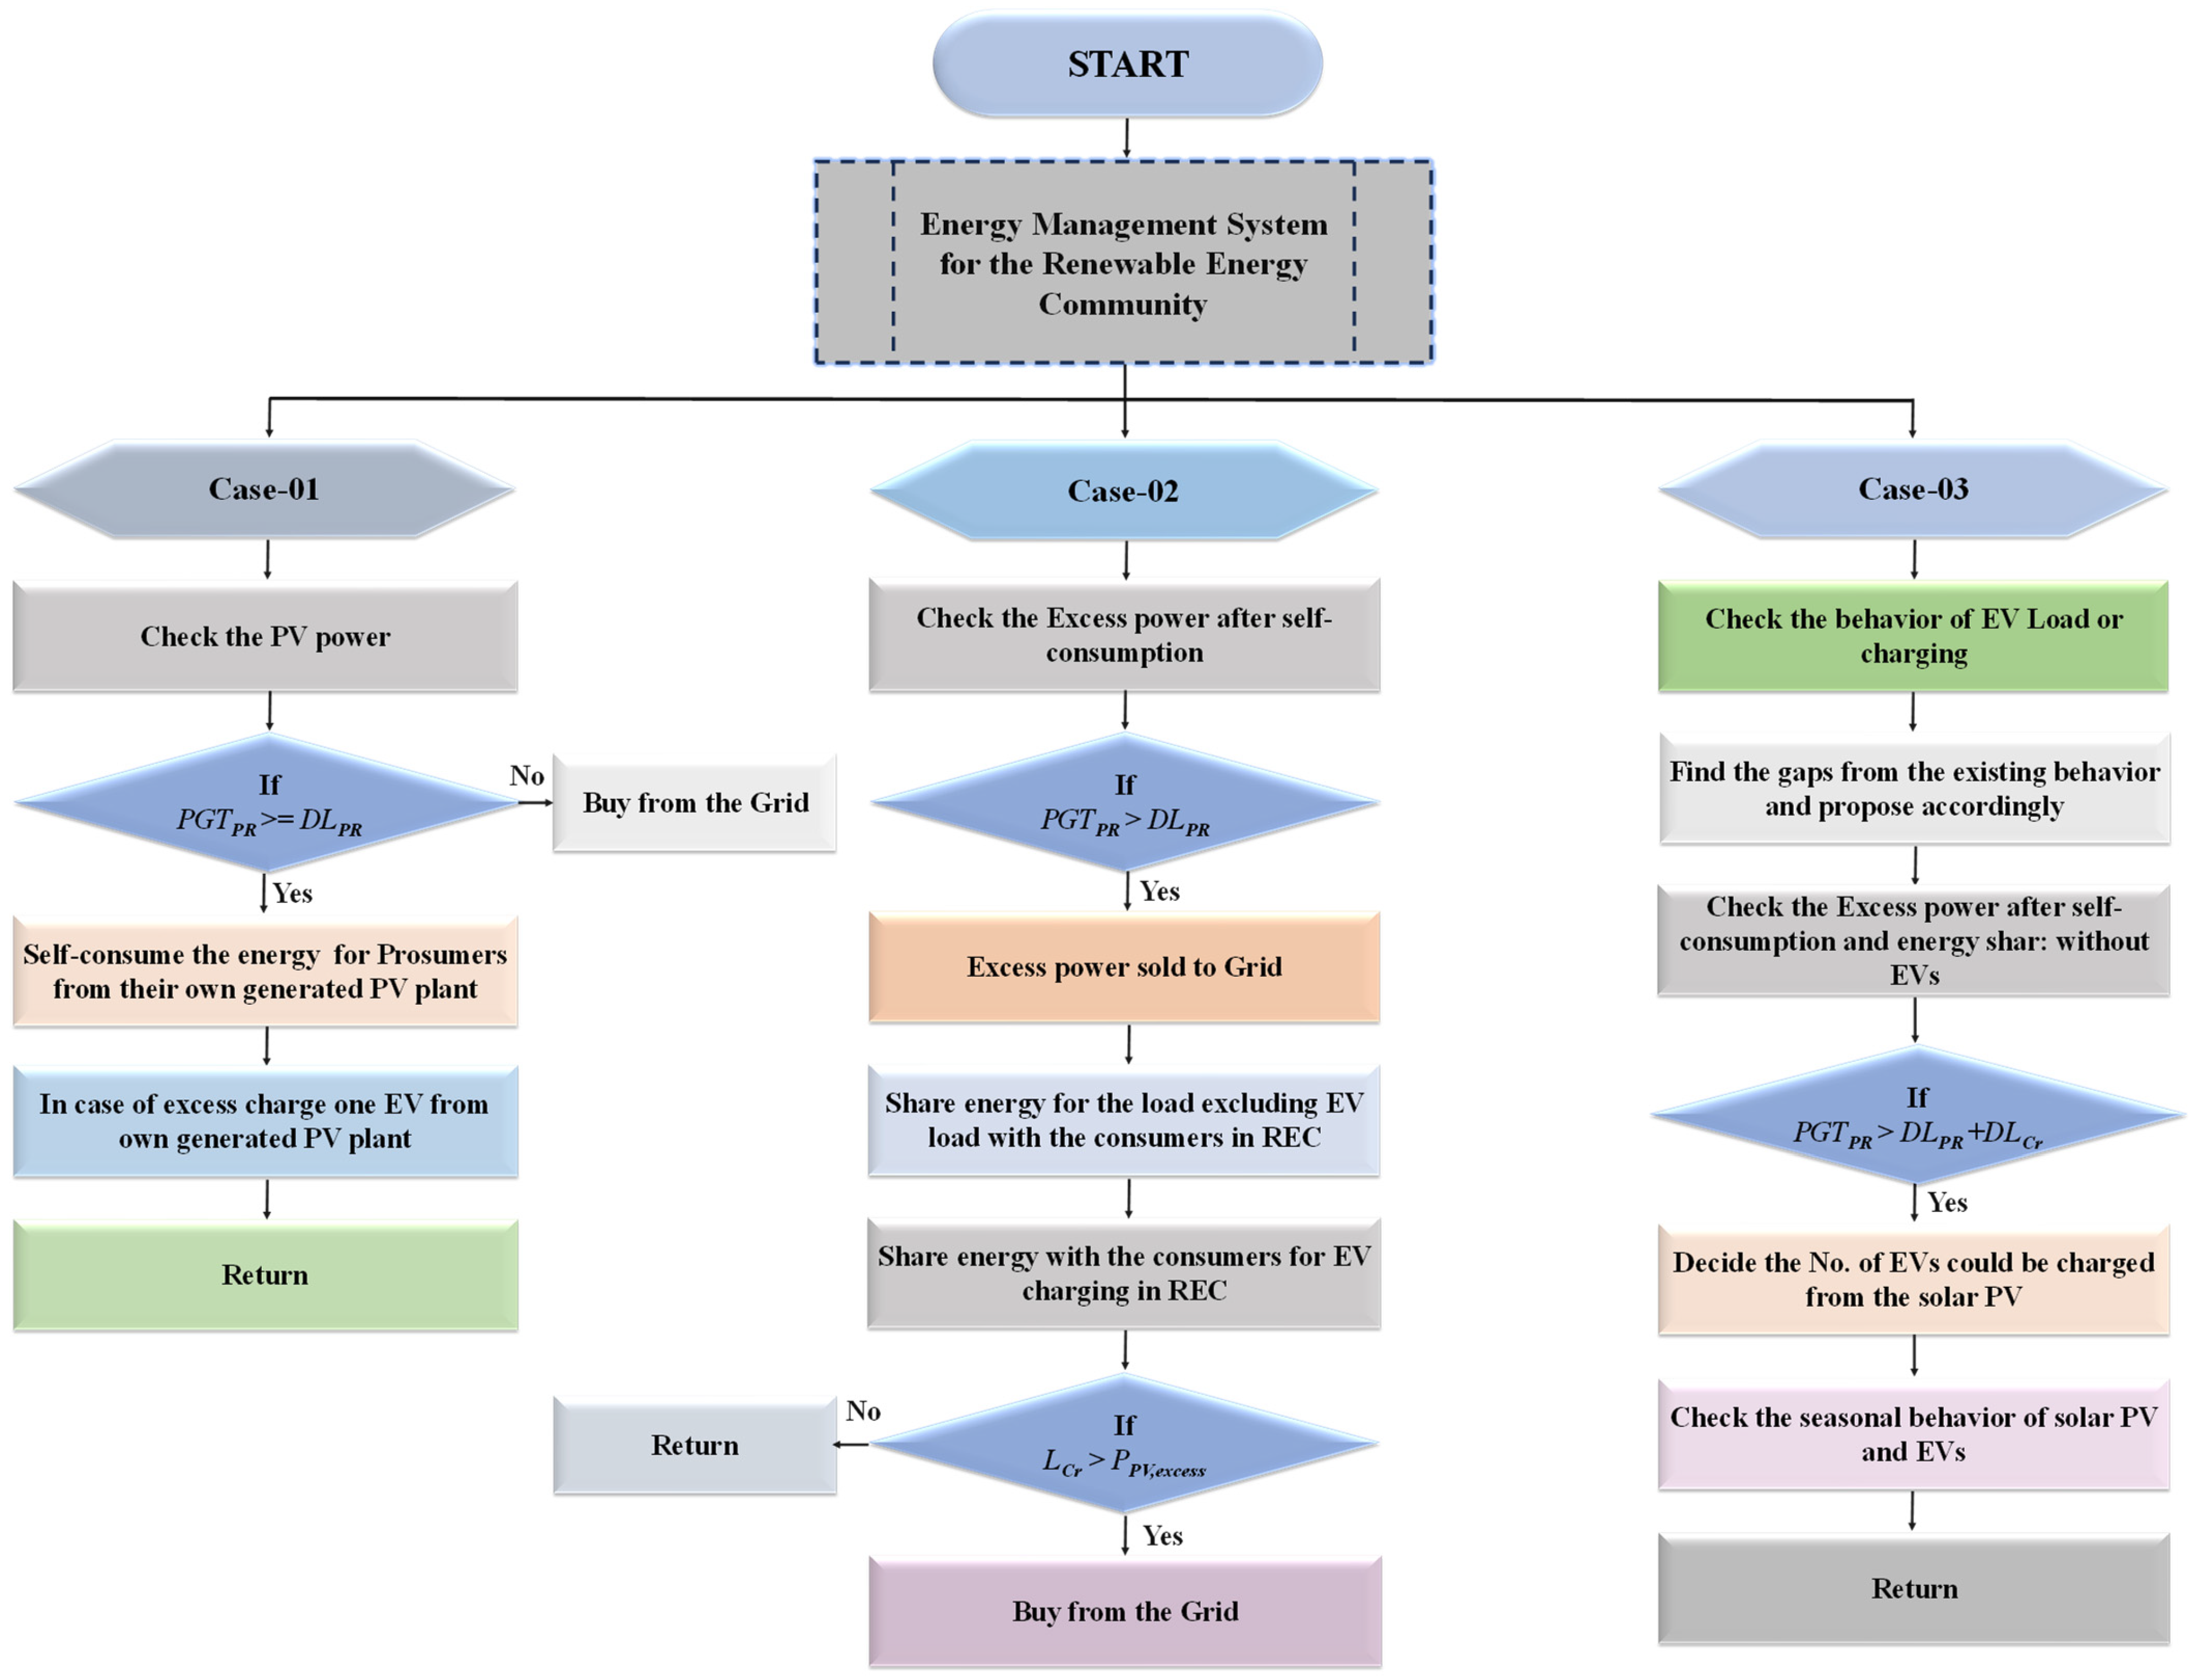
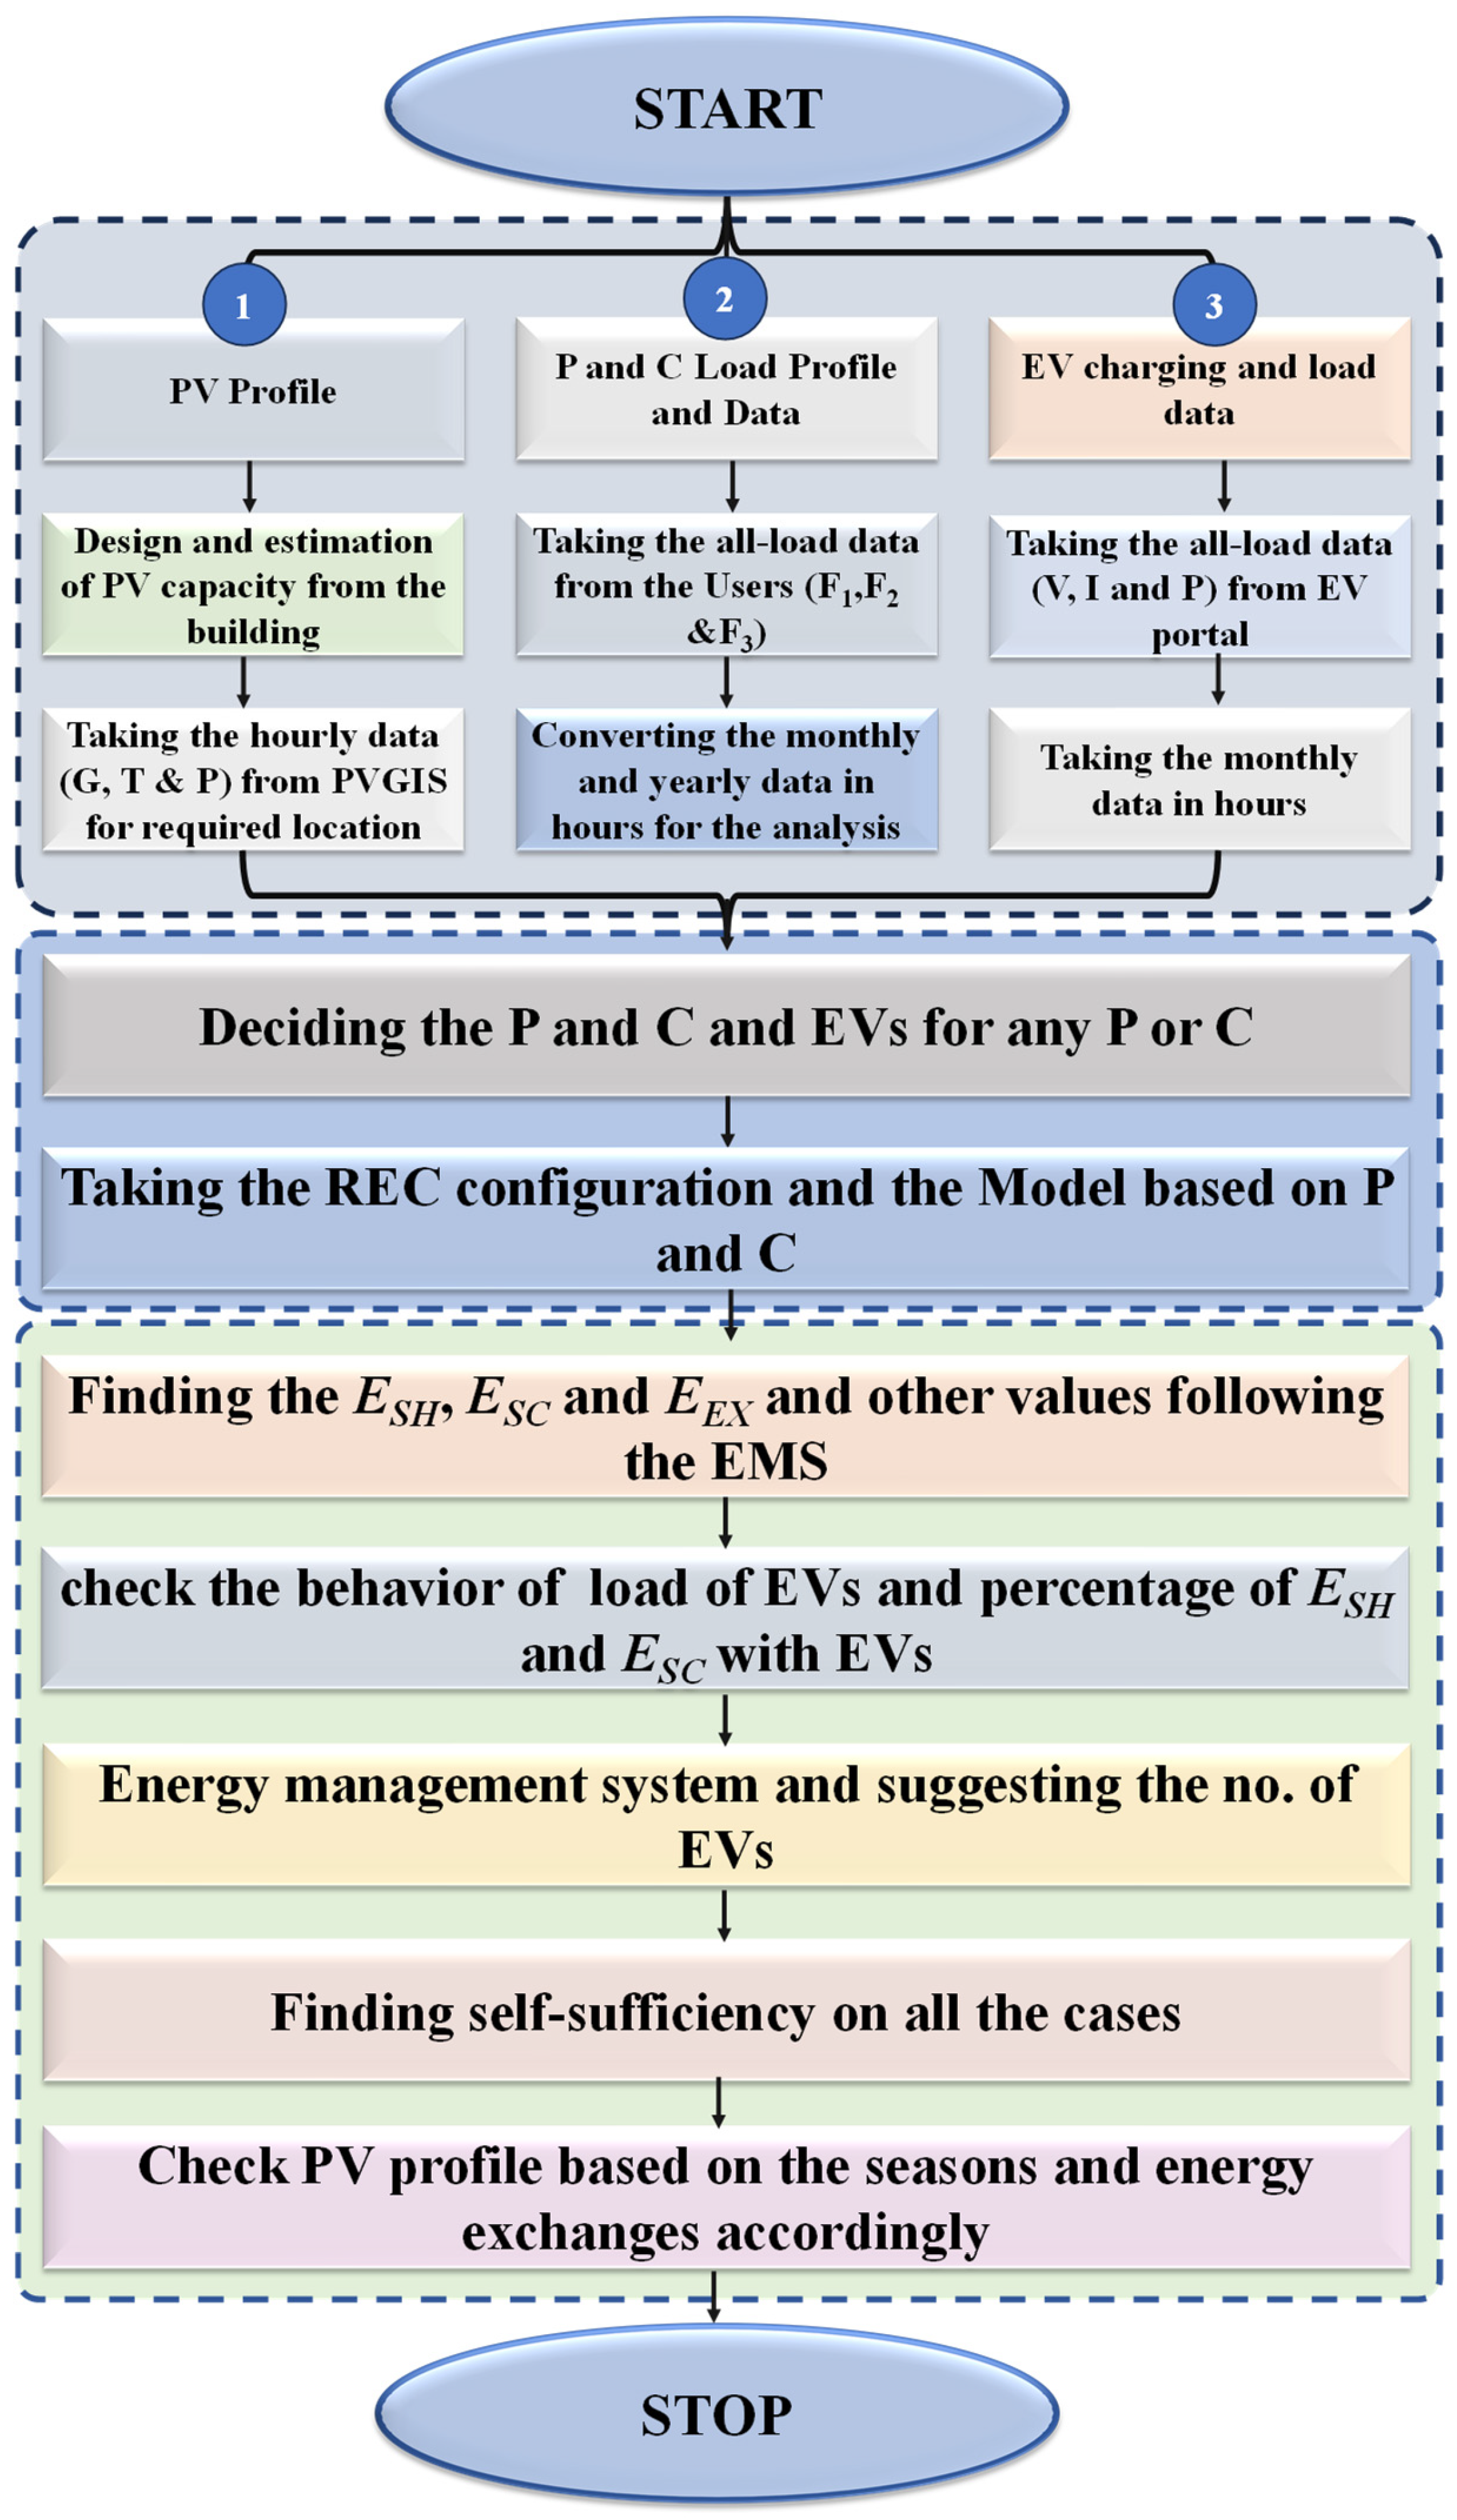
3. Modeling and Methods

The REC is developed with six participants with different roles like prosumers and consumers having electrical load on an hourly basis as PL and CL and two EVs (one EV for consumer and another one for prosumer side) The REC refers to a primary substation subtend to a geographical area in Tramutola, the south of Italy. A sketch of the REC mathematical model is shown in Figure 7. The main target of the REC (left side of sketch) is to maximize self-consumption and energy sharing rather than selling energy to the grid. Shared energy can be increased by charging EVs to optimize incentives and self-consumption. The maximum power admitted for the REC is 1 MW, as per the Italian regulatory framework [44].
As discussed, the work illustrates a time-dependent mathematical model for investigating the behavior of a REC and calculating energy flows. The parameters calculated are self-consumption, shared energy, exported energy, and imported energy. The load of prosumers can be partially or fully satisfied by the photovoltaic (PV) production, and it represents the self-consumption. Excess PV generation, which can be supplied to the grid, is considered as exported or sold energy, and if consumers require energy at that time (hourly basis), the minimum between excess energy and the load energy is considered as shared energy. These parameters are considered for the analysis to check the profitability of REC, as there are incentives on an hourly basis for shared energy, as per the Italian framework. The possibility of sharing excess power to the grid and distributing it among REC members with additional financial incentives could boost profitability. The idea of selling energy is not new or unusual; nevertheless, sharing energy has gained distinction due to financial rewards provided to consumers and prosumers who are members of RECs. Consumers can use energy at the same cost, but within REC, they earn a portion of the benefit of the incentive. Prosumers additionally obtain an additional benefit from the incentive because of the shared energy and lower energy transit costs. These incentivize residents to engage in the REC and reap the rewards of using the energy from RESs. So, considering these incentives, our main priority is that the prosumer must self-consume their own generated PV power and share the excess energy with REC participants. For this, the energy management system is required to check the energy balance and manage properly, resulting the high profitability due to maximum self-consumption and energy sharing. The flowchart for the energy management system (EMS) for our REC model is illustrated in Figure 8.
In the flowchart, PGTPR is the PV power of the prosumer; DLPR is the load demand of the prosumer; and DLCR is the load demand of the consumer. Moreover, the Energy Management System for the proposed REC is illustrated in the steps below:
  • Step 1: Taking the participants as prosumers with high-load profiles from all users for REC to increase self-consumption.
  • Step 2: Prosumers must use their energy from their own generated PV plant, and in case of deficit or at night, it must be supplied from the grid.
  • Step 3: In case of excess power, it must charge the EVs of the prosumer (one in our case); otherwise charged from the grid.
  • Step 4: Again, in case of excess power after charging, it must be sold to the grid and shared with other community members.
  • Step 5: Check the energy balance as per the load demand and PV generation. In case of excess, charge one EV on the consumer side, resulting in energy sharing.
  • Step 6: See the behavior of charging and load and decide the maximum number of EVs that could be charged based on the time and days of charging in a week, in different seasons, on both the consumer and prosumer side. Also checking self-consumption and energy sharing, following the REC constraints and load demand.
The equations for the various parameters, including self-consumed energy, sold energy, and shared energy, are used in our REC modeling. Starting from self-consumption, Equations (4)–(6) are given as follows:
E S C _ 1 = i = 1 n m i n ( P G T P R ( t ) h ; P L , P r ( t ) h )
E S C _ 2 = i = 1 n m i n ( P G T P R ( t ) h P L , P r ; P L , P r , E V ( t ) h )
E S C _ T = i = 1 n m i n ( P G T P R ( t ) h ; P L , P ( t ) h ) + i = 1 n m i n ( P G T P R ( t ) h P L , P r ; P L , P r , E V ( t ) h )
where i represents the i-th prosumer; P G T P r represents the PV power from their own PV plant; P L , P r represents a load of prosumers from their houses; and P L , P r , E V represents the EV load in prosumer premises. Moreover, the second main part in the modeling is selling excess energy after the self-consumption of the prosumer household load and EV load, which could be computed as in the following equation.
E E X = m a x P G T P R ( t ) h E S C _ T   ( t ) h , 0
From Equation (7), the energy shared could be computed by following the equations:
E S H _ T = min ( E E X ( t ) h ; L C B ( t ) h
L C B = i = 1 N p = 3 P L r e s , i , h + i = 1 N p = n P L E V , i , h + j = 1 N c = 3 C L L , j ,   h + j = 1 N c = 3 C L E V , j ,   h
where E E X is the sold energy or excess energy produced by the photovoltaic (PV) plant in kWp; L C B is the load on the cabin, which is the addition of the remaining hourly load by the prosumer’s houses ( P L r e s , i , h ) ; the remaining hourly load of the prosumer’s EV ( P L E V , i , h ) , consumer household load ( C L L , j   h ) , and consumer EV load ( C L E V , j ,   h ) , whereas P L r e s , i , h and P L E V , i , h are the net or remaining prosumer loads not satisfied by the PV plant. Finally, the net power after self-consumption and energy sharing is computed by using Equation (10):
E N e t = m a x P G T P R ( t ) h E S C _ T   ( t ) h E S H _ T ( t ) h , 0
All the modeling is carried out by following the energy balance using Equation (11). Shared energy is virtual and is taken from the sold energy for sharing with the participants. However, there is an incentive for it. So, this approach is considered solely for the calculation purposes to examine the checks and balances of energy fluxes. This energy balance is important in checking the energy exchange flow for how much energy is generated, utilized, exported, and imported [45].
P G T R E C + P I m p , R E C = P L , P r + P L , P r , E V + C L , C r + C L . C r , E V   + P E x p , R E C
where P G T R E C is the energy from the PV plant of prosumers in REC; P I m p , R E C is the power imported from the grid; P L , P r is the load of prosumer; P L , P r , E V is the load of EV for the prosumers; C L , C r is the load of the consumer; C L . C r , E V is the load of EVs for the consumers; and P E x p , R E C is the power exported or sold to the grid. Moreover, self-sufficiency (SS) is also calculated by using Equation (12). It is the ratio of the total load energy demand to the loads locally supplied by RES (PV in our case), and it may be computed for any time [46].
S S   ( % ) = E L o c a l c o n s u m e d E d e m a n d
E L o c a l c o n s u m e d = P G T P V E E X
where E L o c a l c o n s u m e d is the energy directly consumed by the REC from the PV system and E d e m a n d includes the household loads or EV charging load and other appliances.
Moreover, the overall workflow has been described in Figure 9. It starts with hourly data evaluation (load and PV production), then the designing phase to find the capacity of the PV plant. The next step is the design of the REC model as per the Italian regulatory framework, including the number of prosumers and consumers and the calculation of energy flows. After that, the proper energy management system was completed following the energy balance equation formula. Additionally, self-sufficiency has been calculated for all the cases, and the results have been taken for the different seasons to see the impact on energy fluxes.

4. Results and Discussion

By using mathematical modeling and the equations outlined in the previous section, numerical results have been obtained for further analysis. As per the requirement in REC, we first selected the number of prosumers and consumers as per the load. Three prosumers were finalized as per their high load profiles from all participants to increase self-consumption as mentioned in Table 2.

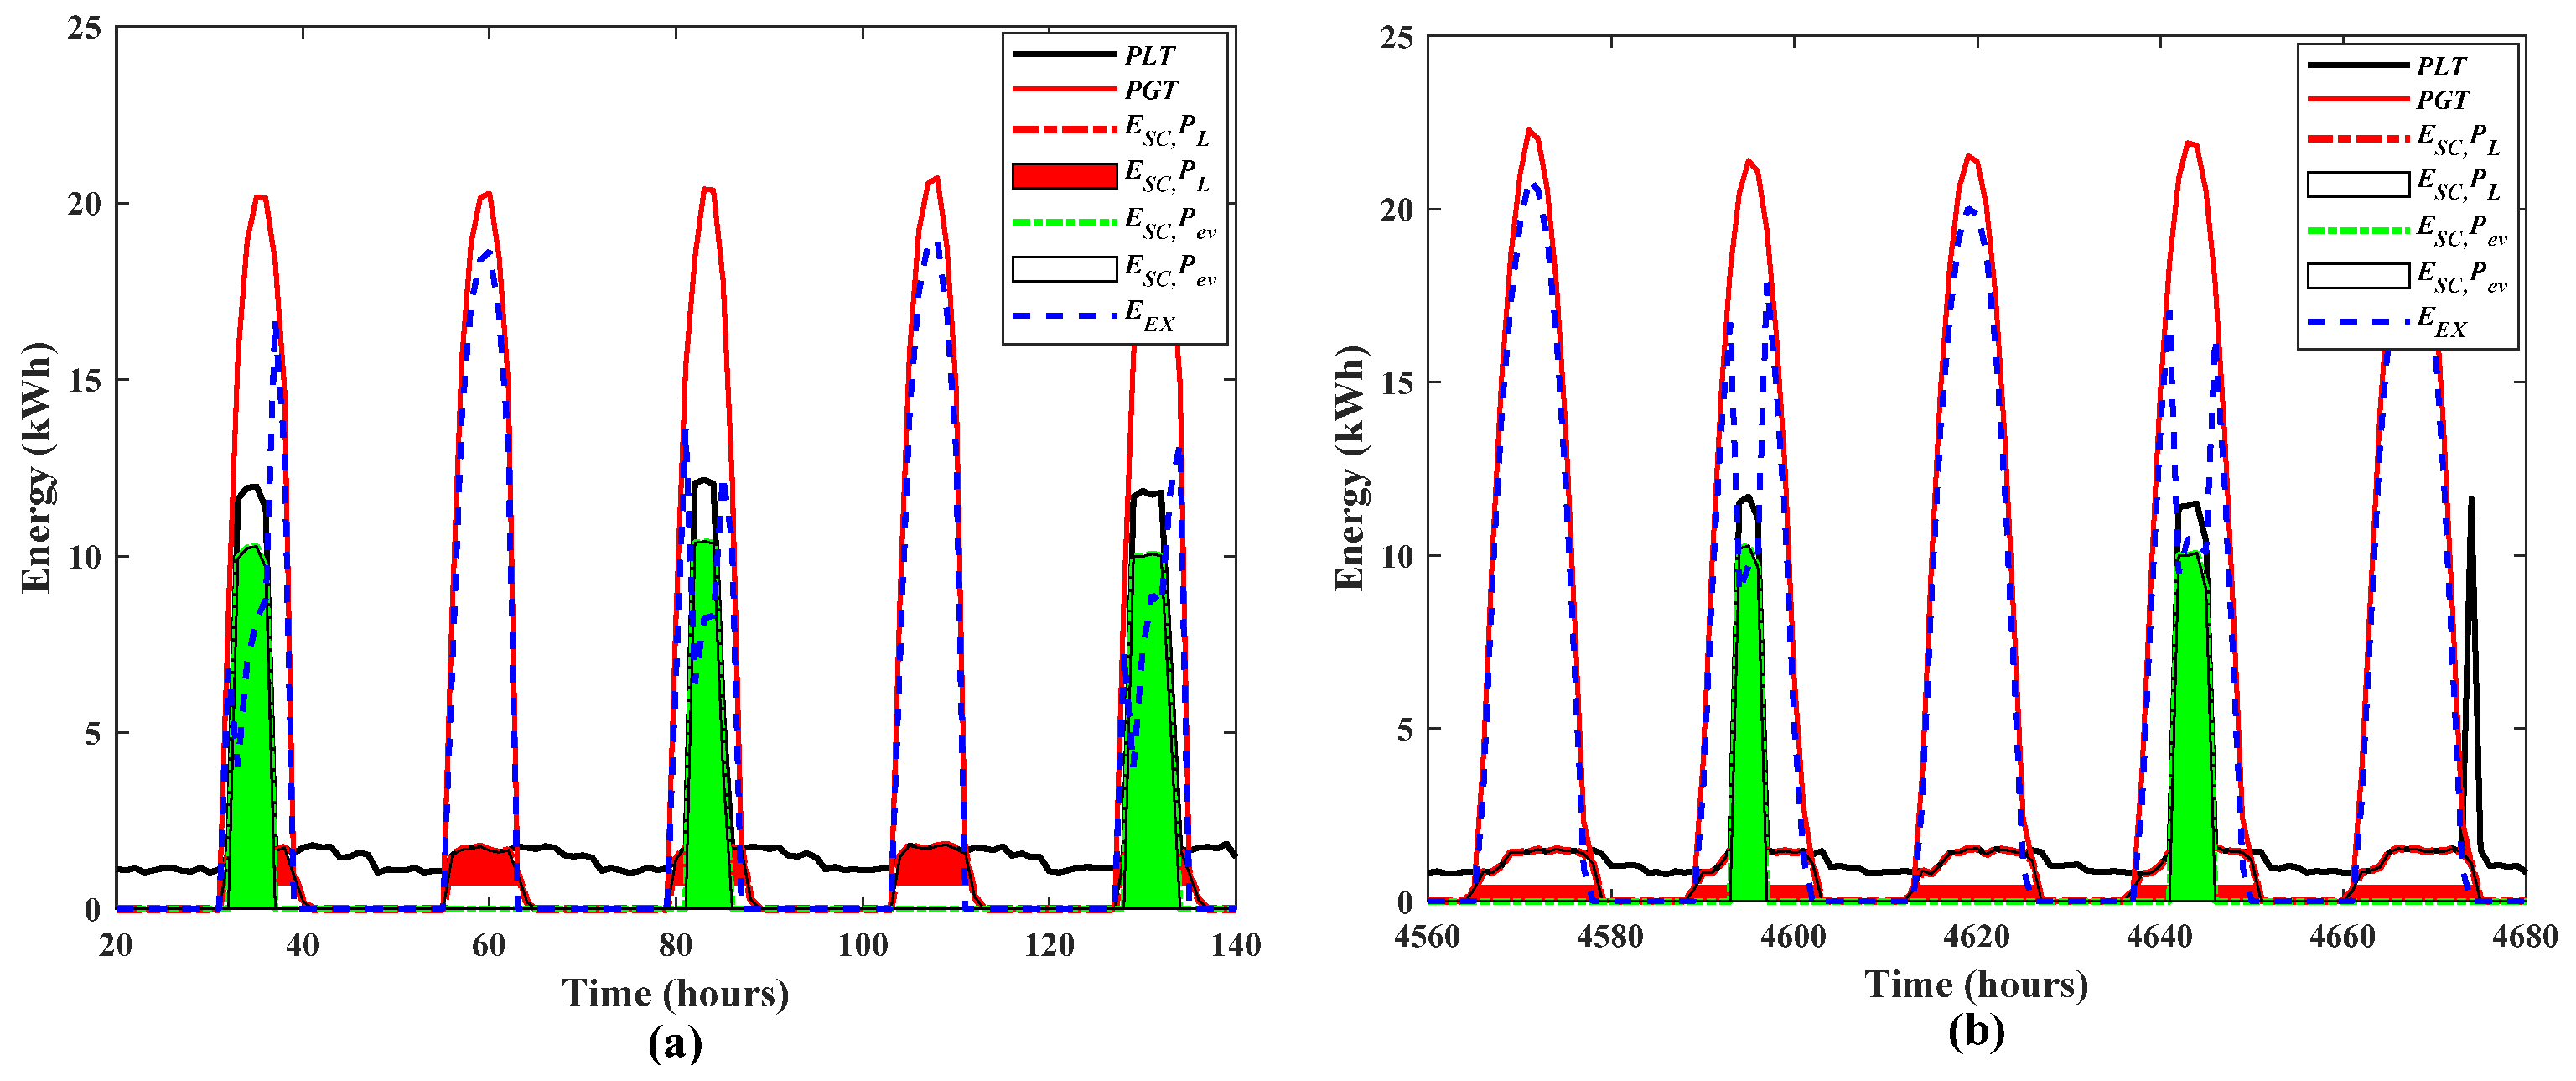
4.1. Case 1: Prosumer Self-Consumption for Their Load and One EV

After selecting the number of prosumers and consumers, the model was simulated to find self-consumption by the prosumers for their load and the EV charging. As per the conditions, it mainly consumes all the load from the PV power generated by its own PV plant and then supplies EV for charging. The results of energy flows for self-consumption with prosumer load and with one EV are depicted in Figure 10. The results are taken randomly for different seasons from the whole year. As in Figure 10a, the results are for winter seasons from 20 to 140 h, and in Figure 10b, for the summer seasons from 4560 to 4680 h.
Moreover, the parameters are also calculated like energy self-consumption for prosumer loads, including EV load and the remaining excess power after self-consumption, which will then be exported to the grid and shared with other REC members for their loads, like household and EV, as shown in Table 3. From the results, it could be seen that almost all the prosumer load and one EV load are supplied from the PV. And the remaining load at other times, when there is no generation, or there is a deficit from PV, will be imported from the grid. It could also be seen from the results that there is still a high amount of PV power which is exported to the grid; here, we will share this extra energy with the consumers in the REC through the grid.

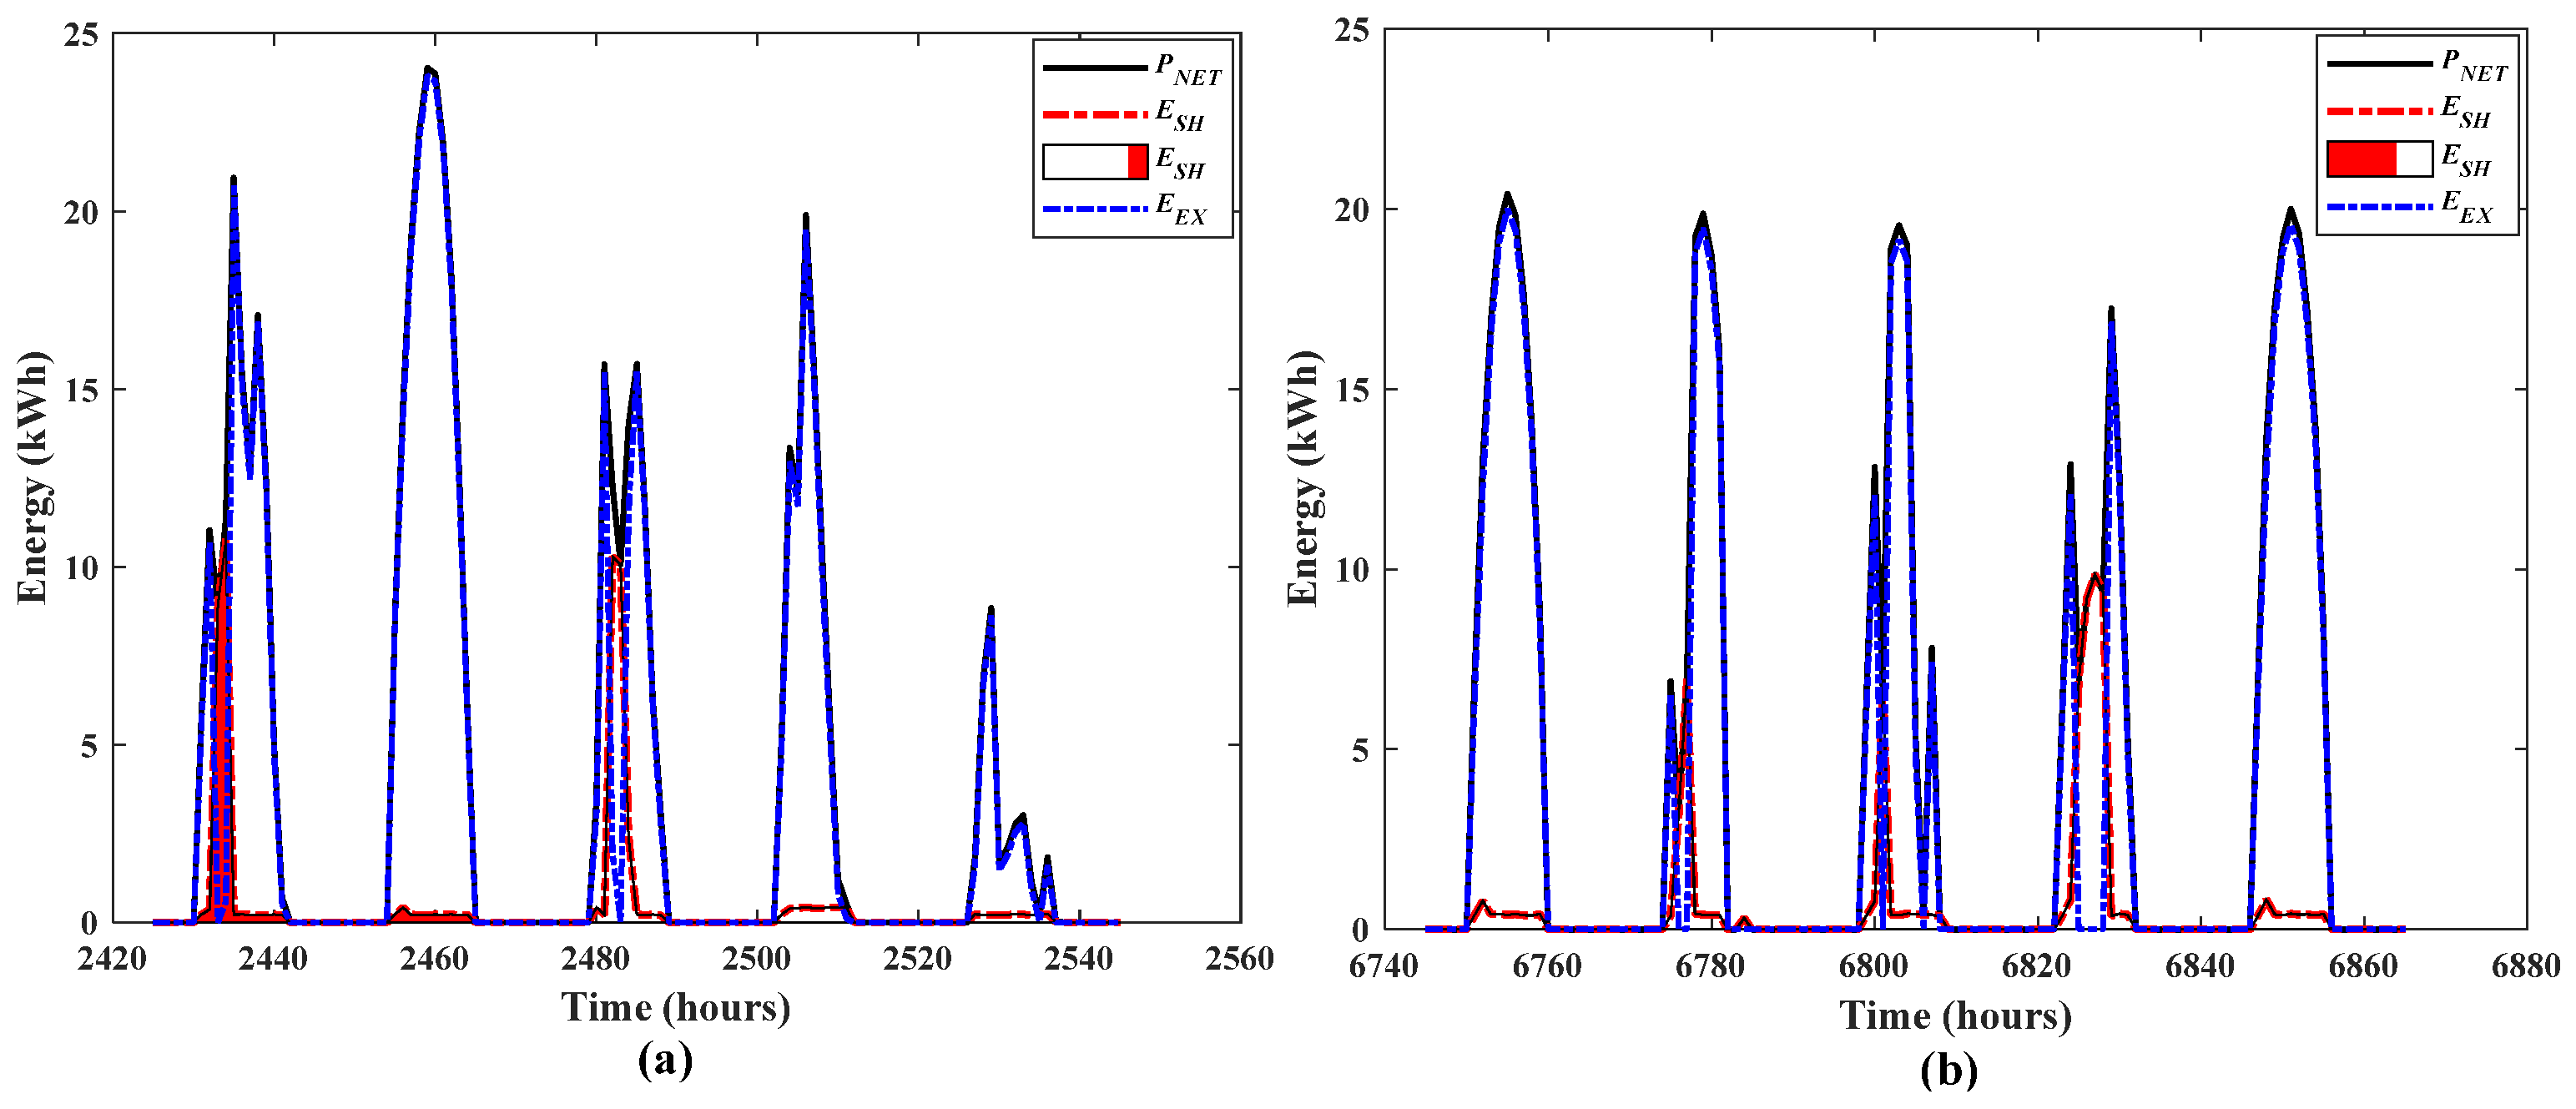
4.2. Case 2: Energy Sharing with Consumers for Their Load and One EV

As in REC, sharing energy with consumers or even prosumers is an important and motivating factor due to the incentives and savings. The energy flows, including shared energy, excess energy after self-consumption, remaining energy, and the total load on the cabin, are depicted in Figure 11. Here, the results are taken randomly for the other two seasons from the whole year. As in Figure 11a, the results are for the spring season from 2420 to 2560 h, and in Figure 11b, for the autumn season from 4740 to 6880 h. Moreover, the parameters have been calculated following the energy balance equation as mentioned in Table 4.
After self-consumption, the energy is shared from the exported energy with the consumers of REC and the EV within the consumer premises. In this case, the shared energy for the EV to the consumer side is less as compared to energy self-consumption of the EV in prosumer premises. This could be improved by following the energy management system, and if the timing of EV could be changed, as it should not be charged simultaneously. After doing this, the sharing of energy could be increased, and eventually the benefits, like incentives in the REC. Moreover, the graph with energy self-consumption and energy sharing is plotted as shown in Figure 12. Also, Table 5 depicts the energy values computed are self-consumption, energy-sharing, net load of Prosumer and Consumer, energy exported, energy imported, and energy balance.
From the above results, almost all the prosumer loads, including one EV, are satisfied from their own PV plant, and then the excess after self-consumption is shared among the REC consumers, including their household and EV load. After sharing and self-consumption, there is still the remaining power, which is the final exported power equal to 32,008 kWh. This exported power could also be shared with other members who are not part of the REC but can join in the future to be part of the REC, or there is an option to increase the charging points so that external people can charge from them. Again, it will increase the revenue, resulting in economic, social, and environmental benefits. Moreover, from the results, it can be seen then when EVs for both prosumer and consumer are charged, the power is almost utilized from the PV during the day of charging and another load. This again shows the positive impact of RECs, that energy self-consumption and energy sharing are increased by using the EVs for charging purposes. However, an issue is addressed from the EV load profile as there is no proper charging scheme, as it is mostly charged 2–3 times a week, and at any time. From this behavior, the EV charging behavior could be improved by properly charging it from the charging station, following the proper time management and energy management. This would eventually decide the number of EVs that could be charged from the stations, resulting in increased economic benefits through the utilization of RES, like PV in our case.

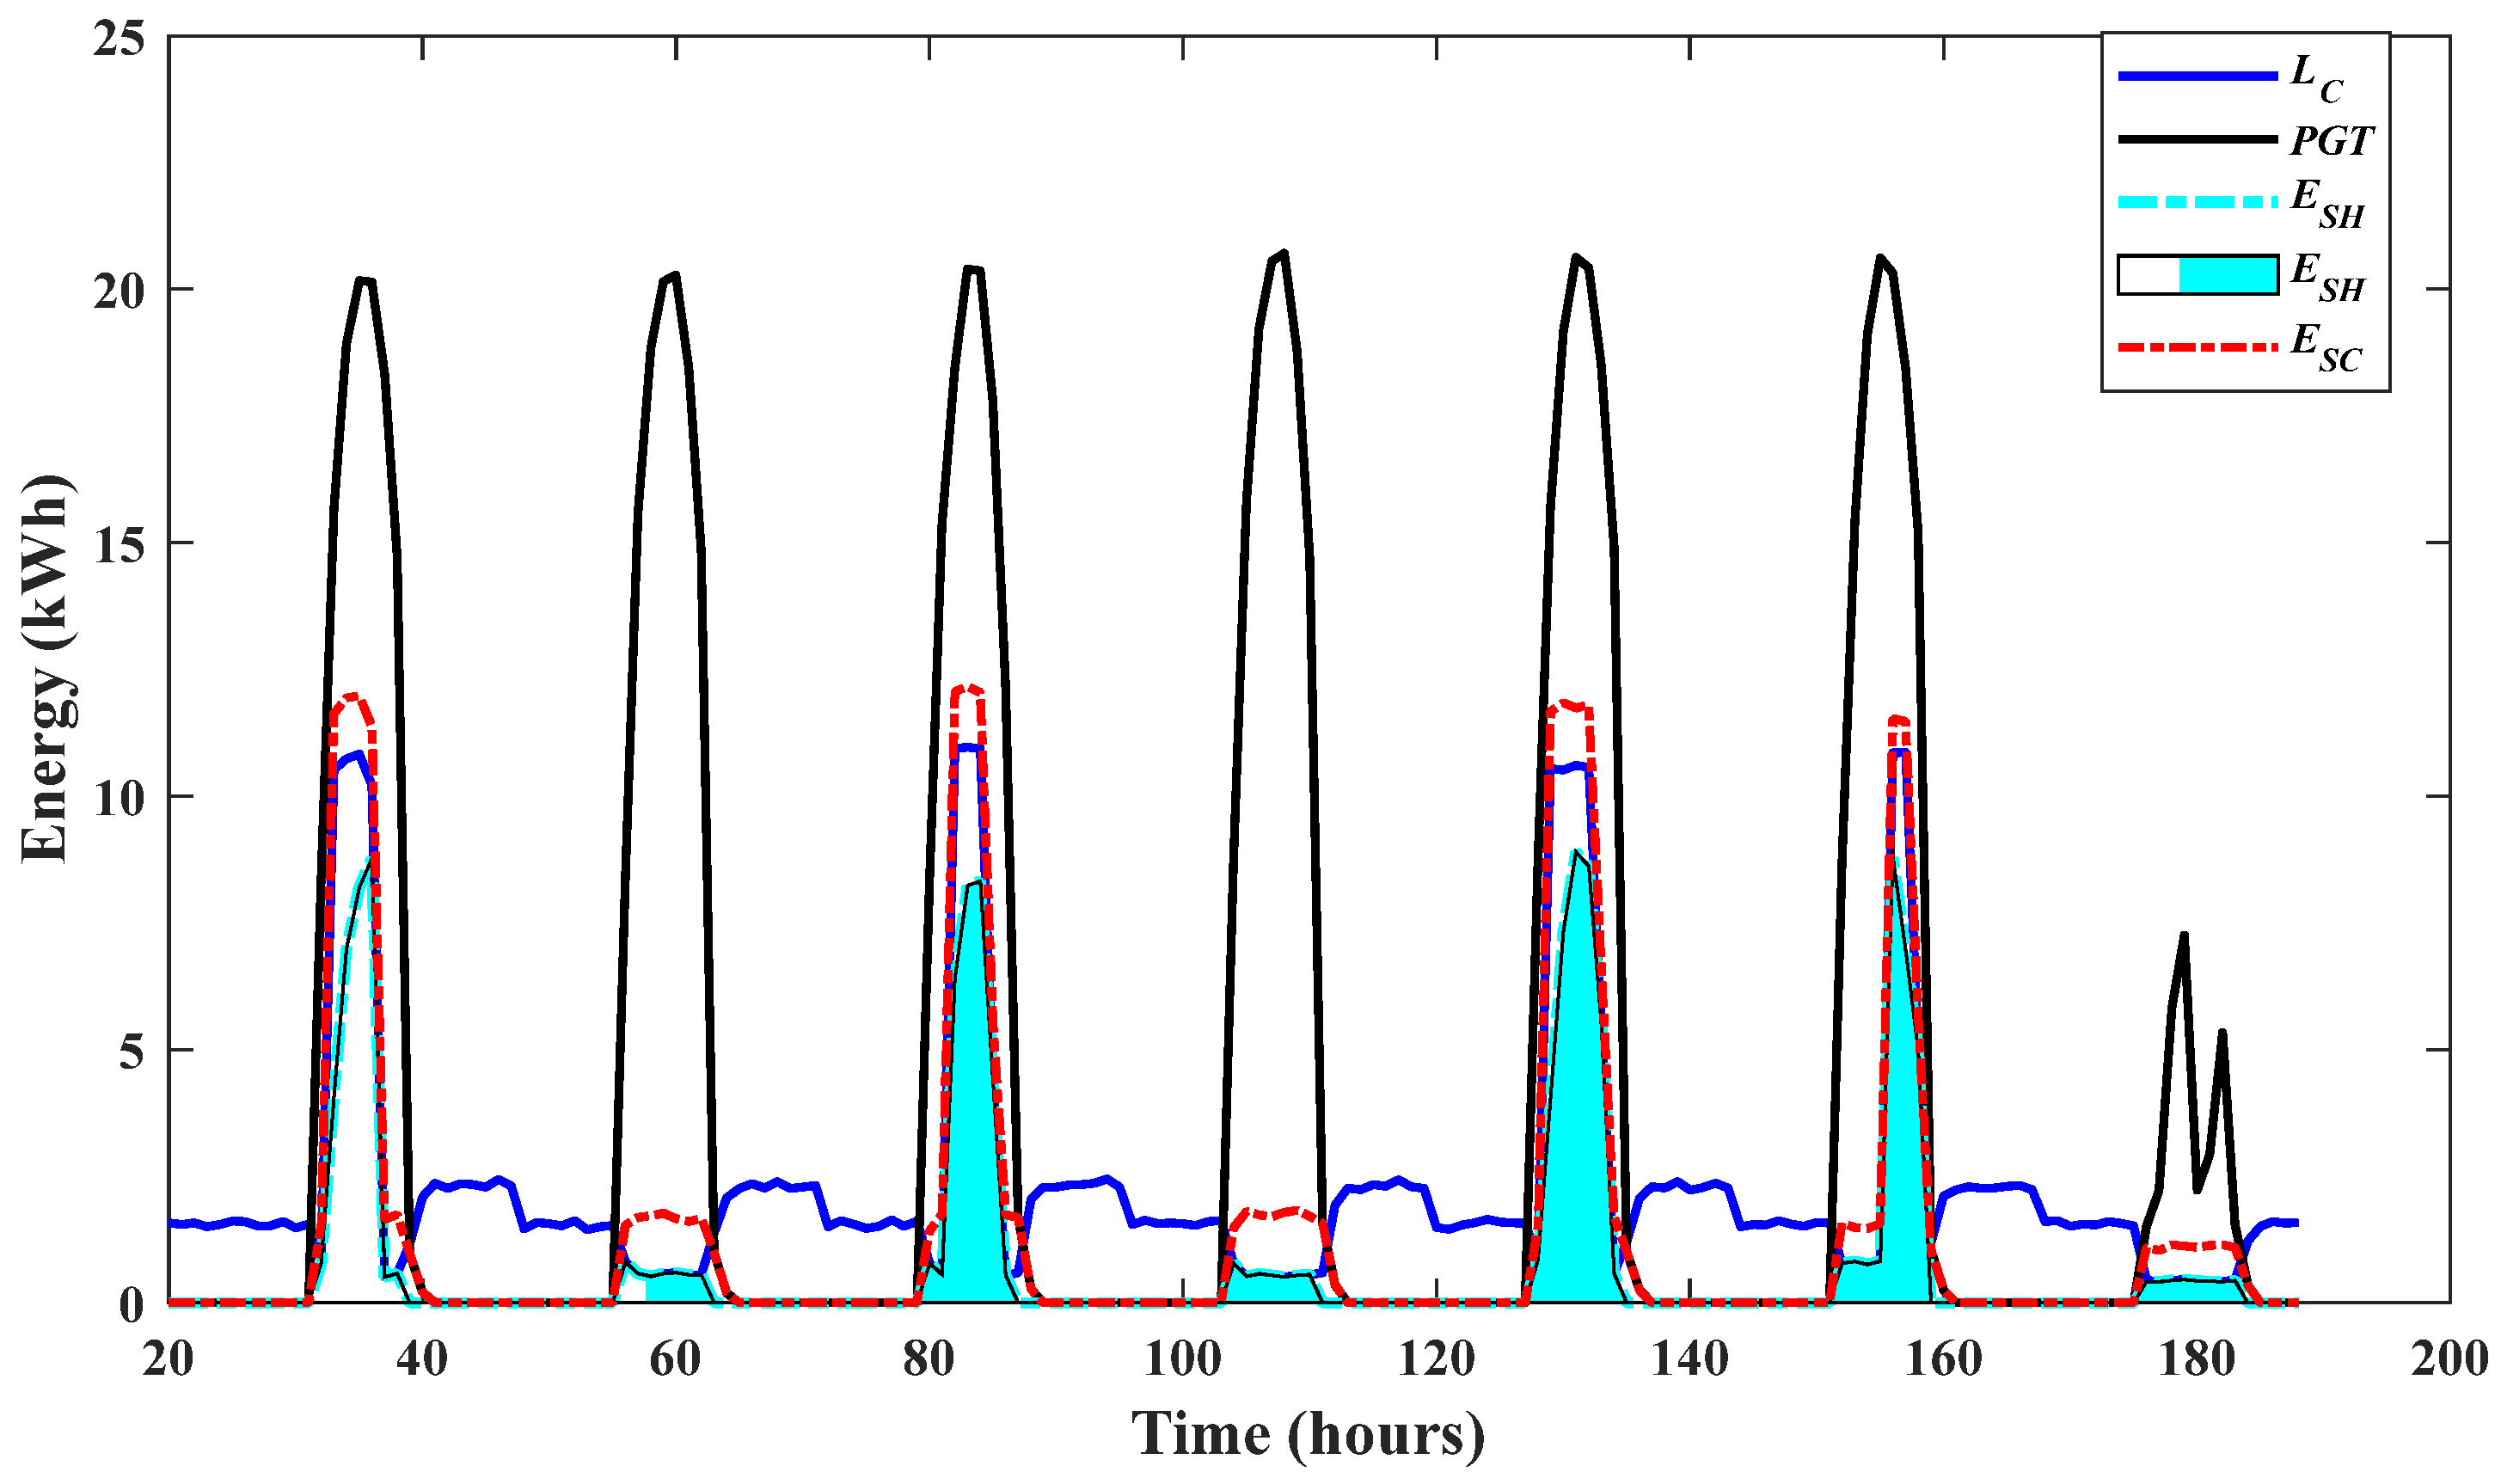
4.3. Case 3: Base Case and Proposed Number of EVs

In this case, we have considered the energy excess profile after self-consumption and energy sharing without EV charging to see the behavior by deciding how many EVs could be charged, increasing the self-consumption and energy sharing in the community with both the prosumers and consumers. The graphs are one with all the energy flows, including self-consumption, energy sharing, and excess energy, as shown in Figure 13a, and the other with only excess power as depicted in Figure 13b. The parameters calculated are also depicted in Table 6 for more clarification.
In our case for the analysis, we are taking 3 h for self-consumption and 4 h for energy sharing and charging the EVs for 3 days in a week to see the energy self-consumption and sharing behavior by considering the proper time management. The results are taken for analysis for one week in January (Winter season), with this case as shown in Figure 14. When we checked the charging for two EVs at the same time, it exceeded the load demand from the peak PV power. However, we checked EV with existing capacity and one with lower capacity (around 5–6 kW of load), then it seems like a good option. Additionally, there is also capacity for charging from solar PV, so another EV is also placed for charging purposes, but after the charging of the first two EVs, two more EVs were also added for charging. Therefore, 4 EVs (two with existing and two with half of the existing capacity) could be charged per day with 3 to 4 h of charging in different time slots. Now it depends upon the REC whether they have prosumers with EVs to increase self-consumption, or the consumers to increase energy sharing, or even there could be a charging setup so that externals could take advantage of charging from the REC charging point.
Moreover, the energy parameters, including all the values, have been presented in Table 7 for further illustration.
As discussed, the base case is taken only for January for one week to check self-consumption and energy sharing. Four EVs (one with an existing capacity and another with lower capacity) are considered for self-consumption, and the other four are considered for energy sharing. All the computations are made following the energy balance equation and different charging time slots, so that no overloading issue happens within the REC. From the results, it could be seen that, if we consider charging for three days, then a total of eight EVs could be utilized for the charging purpose, and even one day is remaining, from which again one to two EVs can be charged. Apart from this, self-consumption and energy sharing could be changed if we analyze it in all the seasons because there is a difference in solar sunny hours for different seasons, so for other seasons results have been taken with the same charging time and number of days and the average capacity of EVs from the model as depicted in Table 8.
It could be seen from Table 8 that the values of energy sharing, energy self-consumption, and self-sufficiency are changed as compared to the previous base case. This is due to the variation in seasons and the sunny hours, respectively. Self-sufficiency is shown to increase almost 100% for self-consumption and increased shared energy with the existing capacity in summer and autumn seasons as compared to the winter season. This shows EVs could be a better option for the RECs to be added, resulting in the maximization of self-consumption and energy sharing, and thus resulting in the social, environmental, and economic benefits.

5. Conclusions and Future Work

This paper focuses on the REC with different prosumers and consumers, including the possibility of charging EVs. Prosumers generate their power from PV. As for PV production, the first system is designed to find the PV capacity, and then hourly based production data are taken from the PVGIS 5 software. Regarding the loads, the hourly based data are calculated by using the algorithm from the electricity bills. For the EV hourly data, the voltage and current values were taken from the EV charging portal and then converted into power or energy. After taking data, energy exchanges like self-consumption, shared energy, and energy exported have been computed in the REC modeling. With emphasis on electric vehicle (EV) hourly based charging load and other hourly based household loads, this study also focuses on the energy management system for an REC that integrates PV to support energy flows among prosumers and consumers. To maintain energy balance within the REC, the EMS dynamically distributes power to satisfy household demands and EV charging requirements. Any power shortfall is made up by grid imports, while excess PV generation is distributed among other REC consumers and sold back to the grid when there is an excess of energy. Additionally, after meeting home needs, extra energy is used for EV charging, considering for the other members who could be part of REC or for the EVs charging purpose if EVs increase or there is an option to open EV charging service station to utilize load from excess PV in REC, resulting in social, economic, and environmental benefits.
This comprehensive approach of energy flow management, which prioritizes prosumer self-consumption and facilitates energy sharing with the consumers within the REC and optimizes EV charging procedures following the proper time management, is what makes this work distinctive. This strategy maximizes the use of PV energy while reducing dependency on the grid and increasing self-sufficiency by methodically reserving excess energy for EV charging after satisfying the prosumer and consumer, and community demands. By smoothly managing excess and deficit scenarios through actual coordination between PV, the grid, and community energy needs, the system also guarantees dynamic energy balance. Furthermore, the suggested approach for the number of EVs for charging purposes is discussed. The approach is flexible and scalable, allowing EV owners to be part of REC by charging their EVs. By encouraging self-consumption and energy sharing from RESs like PV, it decreases the grid dependency and offers a scalable framework for future RECs with rising usage of EVs and advances the goals of the global energy transition. Moreover, this work could be extended in the future as follows:
  • Techno-economic and feasibility analysis with the integration of PV and EVs in RECs.
  • Integration of V2G technologies, which is a good option and an opportunity for the RECs. It enables electric vehicles (EVs) to draw electricity from the grid to charge their batteries as well as send unused energy back to the grid when required. This bidirectional flow of energy plays a significant role in RECs, which aim to boost sustainability, reliability, and energy independence.
  • Integration of energy storage systems, which could be a better option to increase self-sufficiency.

Author Contributions

Conceptualization, S.A. and A.D.; methodology, S.A. and A.D.; formal analysis, S.A., A.D. and A.A.; investigation, S.A., A.D. and. A.A.; resources, S.A., D.R. and S.A.Q.; data curation, S.A. and S.A.Q.; writing—original draft preparation, S.A.; writing—review and editing, S.A., A.D. and A.A.; visualization, A.D., D.R. and A.A.; supervision, A.D., D.R. and A.A.; project administration, A.D.; funding acquisition, D.R. and A.D. All authors have read and agreed to the published version of the manuscript.

Funding

This research received no external funding.

Data Availability Statement

The raw data supporting the conclusions of this article will be made available by the authors on request.

Acknowledgments

This work has been carried out by PhD student Shoaib Ahmed. He would like to express his gratitude to the administrative university, the University of Salerno, Italy, and the National PhD Program in Photovoltaics (PV) in Italy, for the support. Moreover, he is also sincerely thankful to the industry partner (Ramunno S.r.l.) for their support, guidance, and the load and EV data used in the model.

Conflicts of Interest

Domenico Ramunno was employed by Ramunno S.r.l., C.da Caolo Zona p.i.p. The remaining authors declare that the research was conducted in the absence of any commercial or financial relationships that could be construed as a potential conflict of interest..

Nomenclature

Acronyms
CECCitizen Energy Community
DNIsDirect Normal Irradiation
DCDirect Current
DSMDemand side management
DRDemand Response
DREsDistributed Renewable Energy resources
DGsDistributed Generators
ECEnergy Community
EMSEnergy Management System
EEEnergy efficiency
EUEuropean Union
EVElectric Vehicle
GHGGreenhouse gases
MG/MGsMicrogrid/Microgrids
PVPhotovoltaic
PVGISPhotovoltaic Geographical Information System
P2Ppeer-to-peer
RERenewable Energy
RECRenewable Energy Community
RED IIRenewable Energy Directive
RESsRenewable energy sources
RETRenewable energy technology
ToUTime of Use
V2GVehicle to grid
Greek letters/Symbols/Superscript/Subscript
CLConsumer load
DLLoad demand
DL, CrLoad demand of consumer
DL, PrLoad demand of Prosumer
ESC, 1self-consumption with prosumer load excluding EV
ESC, 2self-consumption with prosumer EV load
ESC, TTotal self-consumption
ESH, TTotal Shared energy
EEXExtra or exported energy
ENetThe net energy (kWh)
ESH, 1Shared energy with the consumer excluding EV load
ESH, 2Shared energy with the consumer for EV load
LCBLoad on cabin
LN, PNet load of prosumer after self-consumption
LN, CNet load of consumers after sharing of energy
LN, P, TTotal net or remaining load of prosumer
LN, C, TTotal net or remaining load of consumer
PL Prosumer load
PGTTotal energy generated from PV plant
PLTTotal load of prosumer
PImp, RECPower imported from the grid
TTemperature
VVoltage

References

  1. Ahmed, S.; Ali, A. A Review of Renewable Energy Communities: Concepts, Scope, Progress, Challenges, and Recommendations. Sustainability 2024, 16, 1749. [Google Scholar] [CrossRef]
  2. Kamran, M. Current Status and Future Success of Renewable Energy in Pakistan. Renew. Sustain. Energy Rev. 2018, 82, 609–617. [Google Scholar] [CrossRef]
  3. Gandhi, O.; Kumar, D.S.; Rodríguez-Gallegos, C.D.; Srinivasan, D. Review of Power System Impacts at High PV Penetration Part I: Factors Limiting PV Penetration. Sol. Energy 2020, 210, 181–201. [Google Scholar] [CrossRef]
  4. Ceglia, F.; Marrasso, E.; Roselli, C.; Sasso, M. Small Renewable Energy Community: The Role of Energy and Environmental Indicators for Power Grid. Sustainability 2021, 13, 2137. [Google Scholar] [CrossRef]
  5. The European Parliament and the Council of the European Union. Directive (EU) 2018/2001 of the European Parliament and of the Council of 11 December 2018 on the Promotion of the Use of Energy from Renewable Sources. Off. J. Eur. Union 2018, 328, 82–209. [Google Scholar]
  6. Sassone, A.; Ahmed, S.; Ciocia, A.; Malgaroli, G.; D’Angola, A. The Role of Participant Distribution and Consumption Habits in the Optimization of PV Based Renewable Energy Communities. Energy Eng. 2025, 122, 1–19. [Google Scholar] [CrossRef]
  7. D’Angola, A.; Zaffina, R.; Enescu, D.; Di Leo, P.; Fracastoro, G.V.; Spertino, F. Best Compromise of Net Power Gain in a Cooled Photovoltaic System. In Proceedings of the 2016 51st International Universities Power Engineering Conference (UPEC), Coimbra, Portugal, 6–9 September 2016; pp. 1–6. [Google Scholar]
  8. Shahsavari, A.; Akbari, M. Potential of Solar Energy in Developing Countries for Reducing Energy-Related Emissions. Renew. Sustain. Energy Rev. 2018, 90, 275–291. [Google Scholar] [CrossRef]
  9. Ahmed, S.; Ali, A.; Ansari, J.A.; Qadir, S.A.; Kumar, L. A Comprehensive Review of Solar Photovoltaic Systems: Scope, Technologies, Applications, Progress, Challenges and Recommendations. IEEE Access 2025, 13, 69723–69750. [Google Scholar] [CrossRef]
  10. Gruber, L.; Bachhiesl, U.; Wogrin, S. The Current State of Research on Energy Communities. Elektrotech. Inform. 2021, 138, 515–524. [Google Scholar] [CrossRef]
  11. Energy Communities—Publications Office of the EU. Available online: https://op.europa.eu/en/publication-detail/-/publication/a2df89ea-545a-11ea-aece-01aa75ed71a1/language-en (accessed on 14 November 2024).
  12. Ahmed, S.; Ali, A.; Ciocia, A.; D’Angola, A. Technological Elements behind the Renewable Energy Community: Current Status, Existing Gap, Necessity, and Future Perspective—Overview. Energies 2024, 17, 3100. [Google Scholar] [CrossRef]
  13. Propfe, B.; Kreyenberg, D.; Wind, J.; Schmid, S. Market Penetration Analysis of Electric Vehicles in the German Passenger Car Market towards 2030. Int. J. Hydrogen Energy 2013, 38, 5201–5208. [Google Scholar] [CrossRef]
  14. Palencia, J.C.G.; Otsuka, Y.; Araki, M.; Shiga, S. Scenario Analysis of Lightweight and Electric-Drive Vehicle Market Penetration in the Long-Term and Impact on the Light-Duty Vehicle Fleet. Appl. Energy 2017, 204, 1444–1462. [Google Scholar] [CrossRef]
  15. Fu, S.; Fu, H. A Method to Predict Electric Vehicles’ Market Penetration as Well as Its Impact on Energy Saving and CO2 Mitigation. Sci. Prog. 2021, 104, 00368504211040286. [Google Scholar] [CrossRef] [PubMed]
  16. Agency, I.E. Global EV Outlook 2021; OECD Publishing: Paris, France, 2021. [Google Scholar]
  17. Das, H.S.; Rahman, M.M.; Li, S.; Tan, C.W. Electric Vehicles Standards, Charging Infrastructure, and Impact on Grid Integration: A Technological Review. Renew. Sustain. Energy Rev. 2020, 120, 109618. [Google Scholar] [CrossRef]
  18. Tan, K.M.; Ramachandaramurthy, V.K.; Yong, J.Y. Integration of Electric Vehicles in Smart Grid: A Review on Vehicle to Grid Technologies and Optimization Techniques. Renew. Sustain. Energy Rev. 2016, 53, 720–732. [Google Scholar] [CrossRef]
  19. Beyazıt, M.A.; Taşcıkaraoğlu, A.; Catalão, J.P.S. Cost Optimization of a Microgrid Considering Vehicle-to-Grid Technology and Demand Response. Sustain. Energy Grids Networks 2022, 32, 100924. [Google Scholar] [CrossRef]
  20. Mathur, D.; Kanwar, N.; Goyal, S.K. Impact of Electric Vehicles on Community Microgrid. In AIP Conference Proceedings; AIP Publishing: Melville, NY, USA, 2020; Volume 2294. [Google Scholar]
  21. Van Der Kam, M.; van Sark, W. Smart Charging of Electric Vehicles with Photovoltaic Power and Vehicle-to-Grid Technology in a Microgrid; a Case Study. Appl. Energy 2015, 152, 20–30. [Google Scholar] [CrossRef]
  22. Dubarry, M.; Devie, A.; McKenzie, K. Durability and Reliability of Electric Vehicle Batteries under Electric Utility Grid Operations: Bidirectional Charging Impact Analysis. J. Power Sources 2017, 358, 39–49. [Google Scholar] [CrossRef]
  23. Menyhart, J. Electric Vehicles and Energy Communities: Vehicle-to-Grid Opportunities and a Sustainable Future. Energies 2025, 18, 854. [Google Scholar] [CrossRef]
  24. Chen, T.; Zhang, X.-P.; Wang, J.; Li, J.; Wu, C.; Hu, M.; Bian, H. A Review on Electric Vehicle Charging Infrastructure Development in the UK. J. Mod. Power Syst. Clean Energy 2020, 8, 193–205. [Google Scholar] [CrossRef]
  25. Velkovski, B.; Gjorgievski, V.Z.; Markovski, B.; Cundeva, S.; Markovska, N. A Framework for Shared EV Charging in Residential Renewable Energy Communities. Renew. Energy 2024, 231, 120897. [Google Scholar] [CrossRef]
  26. Thirunavukkarasu, G.S.; Seyedmahmoudian, M.; Jamei, E.; Horan, B.; Mekhilef, S.; Stojcevski, A. Role of Optimization Techniques in Microgrid Energy Management Systems—A Review. Energy Strateg. Rev. 2022, 43, 100899. [Google Scholar] [CrossRef]
  27. Zia, M.F.; Elbouchikhi, E.; Benbouzid, M. Microgrids Energy Management Systems: A Critical Review on Methods, Solutions, and Prospects. Appl. Energy 2018, 222, 1033–1055. [Google Scholar] [CrossRef]
  28. Wieczorek, A. Community Energy 2.0 A Support Tool for Advisers and Process Moderators.
  29. Venayagamoorthy, G.K.; Sharma, R.K.; Gautam, P.K.; Ahmadi, A. Dynamic Energy Management System for a Smart Microgrid. IEEE Trans. Neural Netw. Learn. Syst. 2016, 27, 1643–1656. [Google Scholar] [CrossRef]
  30. Banna, H.U.; Verma, V.; Solanki, S.K.; Solanki, J. Proactive Anomaly Source Identification Using Novel Ensemble Learning with Adaptive Mitigation Measures for Microgrids. Electr. Power Syst. Res. 2023, 218, 109157. [Google Scholar] [CrossRef]
  31. Surmann, A.; Walia, R.; Kohrs, R. Agent-Based Bidirectional Charging Algorithms for Battery Electric Vehicles in Renewable Energy Communities. Energy Inform. 2020, 3, 1–12. [Google Scholar] [CrossRef]
  32. Gielen, D.; Kempener, R.; Taylor, M.; Boshell, F.; Seleem, A. Letting in the Light: How Solar PV Will Revolutionize the Electricity System. Int. Renew. Energy Agency (IRENA) Abu Dhabi 2016. [Google Scholar]
  33. Honrubia-Escribano, A.; García-Sánchez, T.; Gómez-Lázaro, E.; Muljadi, E.; Molina-García, A. Power Quality Surveys of Photovoltaic Power Plants: Characterisation and Analysis of Grid-code Requirements. IET Renew. Power Gener. 2015, 9, 466–473. [Google Scholar] [CrossRef]
  34. Global Solar Atlas. Available online: https://globalsolaratlas.info/download/italy (accessed on 30 October 2024).
  35. JRC Photovoltaic Geographical Information System (PVGIS)—European Commission. Available online: https://re.jrc.ec.europa.eu/pvg_tools/en/ (accessed on 25 December 2023).
  36. POWER|DAV. Available online: https://power.larc.nasa.gov/data-access-viewer/ (accessed on 5 December 2024).
  37. SMA Solar Technology AG—Sunny Portal. Available online: https://www.sunnyportal.com/Templates/Start.aspx?SilentLogin=true&error=login_required&iss=https%3A%2F%2Flogin.sma.energy%2Fauth%2Frealms%2FSMA (accessed on 5 December 2024).
  38. Sousa, J.; Lagarto, J.; Camus, C.; Viveiros, C.; Barata, F.; Silva, P.; Alegria, R.; Paraíba, O. Renewable Energy Communities Optimal Design Supported by an Optimization Model for Investment in PV/Wind Capacity and Renewable Electricity Sharing. Energy 2023, 283, 128464. [Google Scholar] [CrossRef]
  39. Giannuzzo, L.; Minuto, F.D.; Schiera, D.S.; Lanzini, A. Reconstructing Hourly Residential Electrical Load Profiles for Renewable Energy Communities Using Non-Intrusive Machine Learning Techniques. Energy AI 2024, 15, 100329. [Google Scholar] [CrossRef]
  40. Qadir, S.A.; Ahmad, F.; Al-Wahedi, A.M.A.B.; Iqbal, A.; Ali, A. Navigating the Complex Realities of Electric Vehicle Adoption: A Comprehensive Study of Government Strategies, Policies, and Incentives. Energy Strateg. Rev. 2024, 53, 101379. [Google Scholar] [CrossRef]
  41. Ajanovic, A.; Haas, R. Dissemination of Electric Vehicles in Urban Areas: Major Factors for Success. Energy 2016, 115, 1451–1458. [Google Scholar] [CrossRef]
  42. Ahmad, F.; Alam, M.S.; Asaad, M. Developments in XEVs Charging Infrastructure and Energy Management System for Smart Microgrids Including XEVs. Sustain. Cities Soc. 2017, 35, 552–564. [Google Scholar] [CrossRef]
  43. Terra AC Wallbox—Wall-Mounted Electric Charging Station|Products|ABB. Available online: https://new.abb.com/ev-charging/it/prodotti/terra-ac-a-parete (accessed on 14 May 2025).
  44. GSE Regole Operative CER. 2024. Available online: https://www.rinnovabili.it/energia/fotovoltaico/energy-release/ (accessed on 14 May 2025).
  45. Spertino, F.; Ahmad, J.; Chicco, G.; Ciocia, A.; Di Leo, P. Matching between Electric Generation and Load: Hybrid PV-Wind System and Tertiary-Sector Users. In Proceedings of the 2015 50th International Universities Power Engineering Conference (UPEC), Stoke-on-Trent, UK, 1–4 September 2015; pp. 1–6. [Google Scholar]
  46. Molina, M.B.T.; Prodanovic, M. Profitability Assessment for Self-Sufficiency Improvement in Grid-Connected Non-Residential Buildings with on-Site PV Installations. In Proceedings of the 2013 International Conference on Clean Electrical Power (ICCEP), Alghero, Italy, 11–13 June 2013; pp. 353–360. [Google Scholar]
Figure 1. G and T for the selected location in Tramutola, Potenza, Italy.
Wevj 16 00302 g001
Figure 2. PV system design for finding the capacity [37].
Wevj 16 00302 g002
Figure 3. Consumer and prosumer load data. Peak–Off-Peak ranges F1, F2, F3, and their time-dependent distribution in a week.
Wevj 16 00302 g003
Figure 4. Converted hourly load profiles as per F1, F2, F3 time-dependent distribution for workday, Saturday, and Sunday in December.
Wevj 16 00302 g004
Figure 5. Classification of EVs [40,41].
Wevj 16 00302 g005
Figure 6. EV parameters and details from the charging portal.
Wevj 16 00302 g006
Figure 7. REC sketch with prosumers, consumers, and the grid.
Wevj 16 00302 g007
Figure 8. Flowchart for the EMS in our REC model.
Wevj 16 00302 g008
Figure 9. REC system sketch.
Wevj 16 00302 g009
Figure 10. Random hourly based results of prosumer self-consumption (a) for winter (b) for summer.
Wevj 16 00302 g010
Figure 11. Random values of energy sharing for consumers with load including EV (a) for spring (b) for autumn.
Wevj 16 00302 g011
Figure 12. Energy flows within REC with P and C for their loads, including EVs.
Wevj 16 00302 g012
Figure 13. Base case; (a) profile after self-consumption and energy sharing, excluding EVs, (b) excess power after self-consumption and energy sharing.
Wevj 16 00302 g013
Figure 14. (a) EV energy self-consumption and sharing behavior with two EVs of existing capacity, (b) Total EV energy self-consumption and energy sharing, (c) remaining energy sold to the grid.
Wevj 16 00302 g014
Table 1. Conversion of load data on an hourly basis based on bills.
MonthsF1, F2 and F3
Details (kWh)
WeekdaySaturdaySundayF1
(Hrs)
F2
(Hrs)
F3
(Hrs)
F1F2F3
January24573722450.0990.3280.113
February35694020440.1590.4210.139
March41723323440.1620.4020.106
April26625020550.1180.3440.156
May33613523440.1300.3410.112
June24543222440.0990.3100.105
July19623821550.0820.3350.116
August21533223440.0830.2960.103
September21553021540.0910.2970.099
October22613622450.0910.3510.110
November23703422440.0950.4020.112
December22604521550.0950.3240.137
Table 2. Load data for the prosumers and consumers.
Participants with Different Load Profiles (kWh)
S No.123456EVLT
Load519.391492.54484.94020.81469.52697.82590.3
Prosumers and Consumers for REC
P and CPL-1PL-2PL-3CL-1CL-2CL-3EVLT
Load4484.94020.82697.8519.391492.51469.52590.3
Table 3. Self-consumption of prosumers for their load and one EV load.
Self-Consumption of Prosumer Load and One EV (kWh)
PGTESC_1ESC_2ESC_T E_EXLN,PLN,P, EVLTE_IMP, PSS (%)
41,5515215.81949.57165.334,3865987.7640.74662951.94
Where PGT is the energy generated from PV plant; ESC_1 is the self-consumed energy of prosumer load; ESC_2 is the self-consumed energy of prosumer one EV load; ESC_T is the total self-consumed energy of prosumer; E_EX is the energy exported or sold to grid; LN,P is the net load of prosumer; LN, P,EVLT is the net load of prosumer electric vehicle; and E_IMP,P is the energy imported from the grid.
Table 4. Energy sharing with consumers for their load and one EV load.
Energy Sharing with Consumers for Their Load and One EV load
E_EXESH_1ESH_2ESH_TE_EX_1LN, CLN, C,EVLTE_IMP,CSS (%)
34,3861248.511292377.732,0082232212244449.31
Where E_EX is the exported energy after self-consumption; ESH_1 is the -shared energy of consumer load; ESH_2 is the shared energy of consumer one EV load; ESH_T is the total shared energy with the consumer; E_EX_1 is the remaining energy exported or sold to grid after the self-consumption and sharing of energy; LN, C is the net load of consumer; LN,C, EVLT is the net load of consumer electric vehicle; and E_IMP, C is the energy imported from the grid for the consumer loads.
Table 5. Energy parameters after self-consumption and energy sharing, including EVs.
Energy Exchanges, Net Load, Net Energy, and Energy Balance
PGTESC_TESH_TE_EX_1LN,P, TLN,C, TE_IMP,TEnergy BalanceSS (%)
41,5517165.3 2377.732,0086628.424409068.441,55151.27
Where E_EX_1 is the remaining energy exported or sold to the grid after self-consumption and sharing of energy; LN,P, T is the total net load of prosumers; LN, C, T is the total net load of consumers; and E_IMP,T is the total energy imported from the grid for the consumer loads.
Table 6. Energy parameters after self-consumption and energy sharing, excluding EVs.
E_EX_2ESC_T,1ESH_T,1Energy BalanceSS (%)
35,0505215.81284.841,550.644.26
Where E_EX_2 is the remaining energy exported after self-consumption or energy sharing, in this case. ESC_T,1 and ESH_T,1 are the total self-consumption and energy sharing in this base case. From the EV charging load, it is seen that the maximum charging time for one EV is 4–5 h, and it is not the same; sometimes the owner charges it for 2 , 3, 4, or even 5 h. Moreover, the EV is also charged 2 or 3 times a week, following the EV data portal.
Table 7. Energy parameters for the base case (winter season), including maximum EVs.
No. of EVsAverage EV Load CapacityDays per Week for ChargingTime
Slots
Excess EnergySelf-Consumption
(kWh)
Energy Sharing
(kWh)
Energy Balance
(kWh)
SS
(%)
Winter Season
0---710.14----
210.5307:00–10:00552.56157.58--86.73
25.5307:00–10:00505.2947.27--52.03
210.5311:00–15:00318.05-187.24-76.40
25.5311:00–15:00245.28-72.76710.1359.38
Table 8. Energy parameters for other seasons, including maximum EVs.
No. of EVsExcess EnergySelf-Consumption
(kWh)
Energy Sharing
(kWh)
Energy Balance
(kWh)
SS
(%)
Spring Season
0909.88----
2758.37151.51--83.33
2707.2551.12--56.27
2499.36-207.89-84.82
2415.97-83.36909.8568.03
Summer Season
01074.5----
2892.82181.68--100
2816.2576.57--84.29
2571.17-245.07-100
2465.09-106.031074.486.53
Autumn Season
0749.33----
2567.65181.68--100
2495.3772.28--79.56
2296.79-198.58-81.02
2227.56-69.22749.3256.49
Disclaimer/Publisher’s Note: The statements, opinions and data contained in all publications are solely those of the individual author(s) and contributor(s) and not of MDPI and/or the editor(s). MDPI and/or the editor(s) disclaim responsibility for any injury to people or property resulting from any ideas, methods, instructions or products referred to in the content.

