
Application Research of a V2X Semi-Physical Simulation Platform in Vehicle–Road Collaboration Experiments


Abstract
1. Introduction
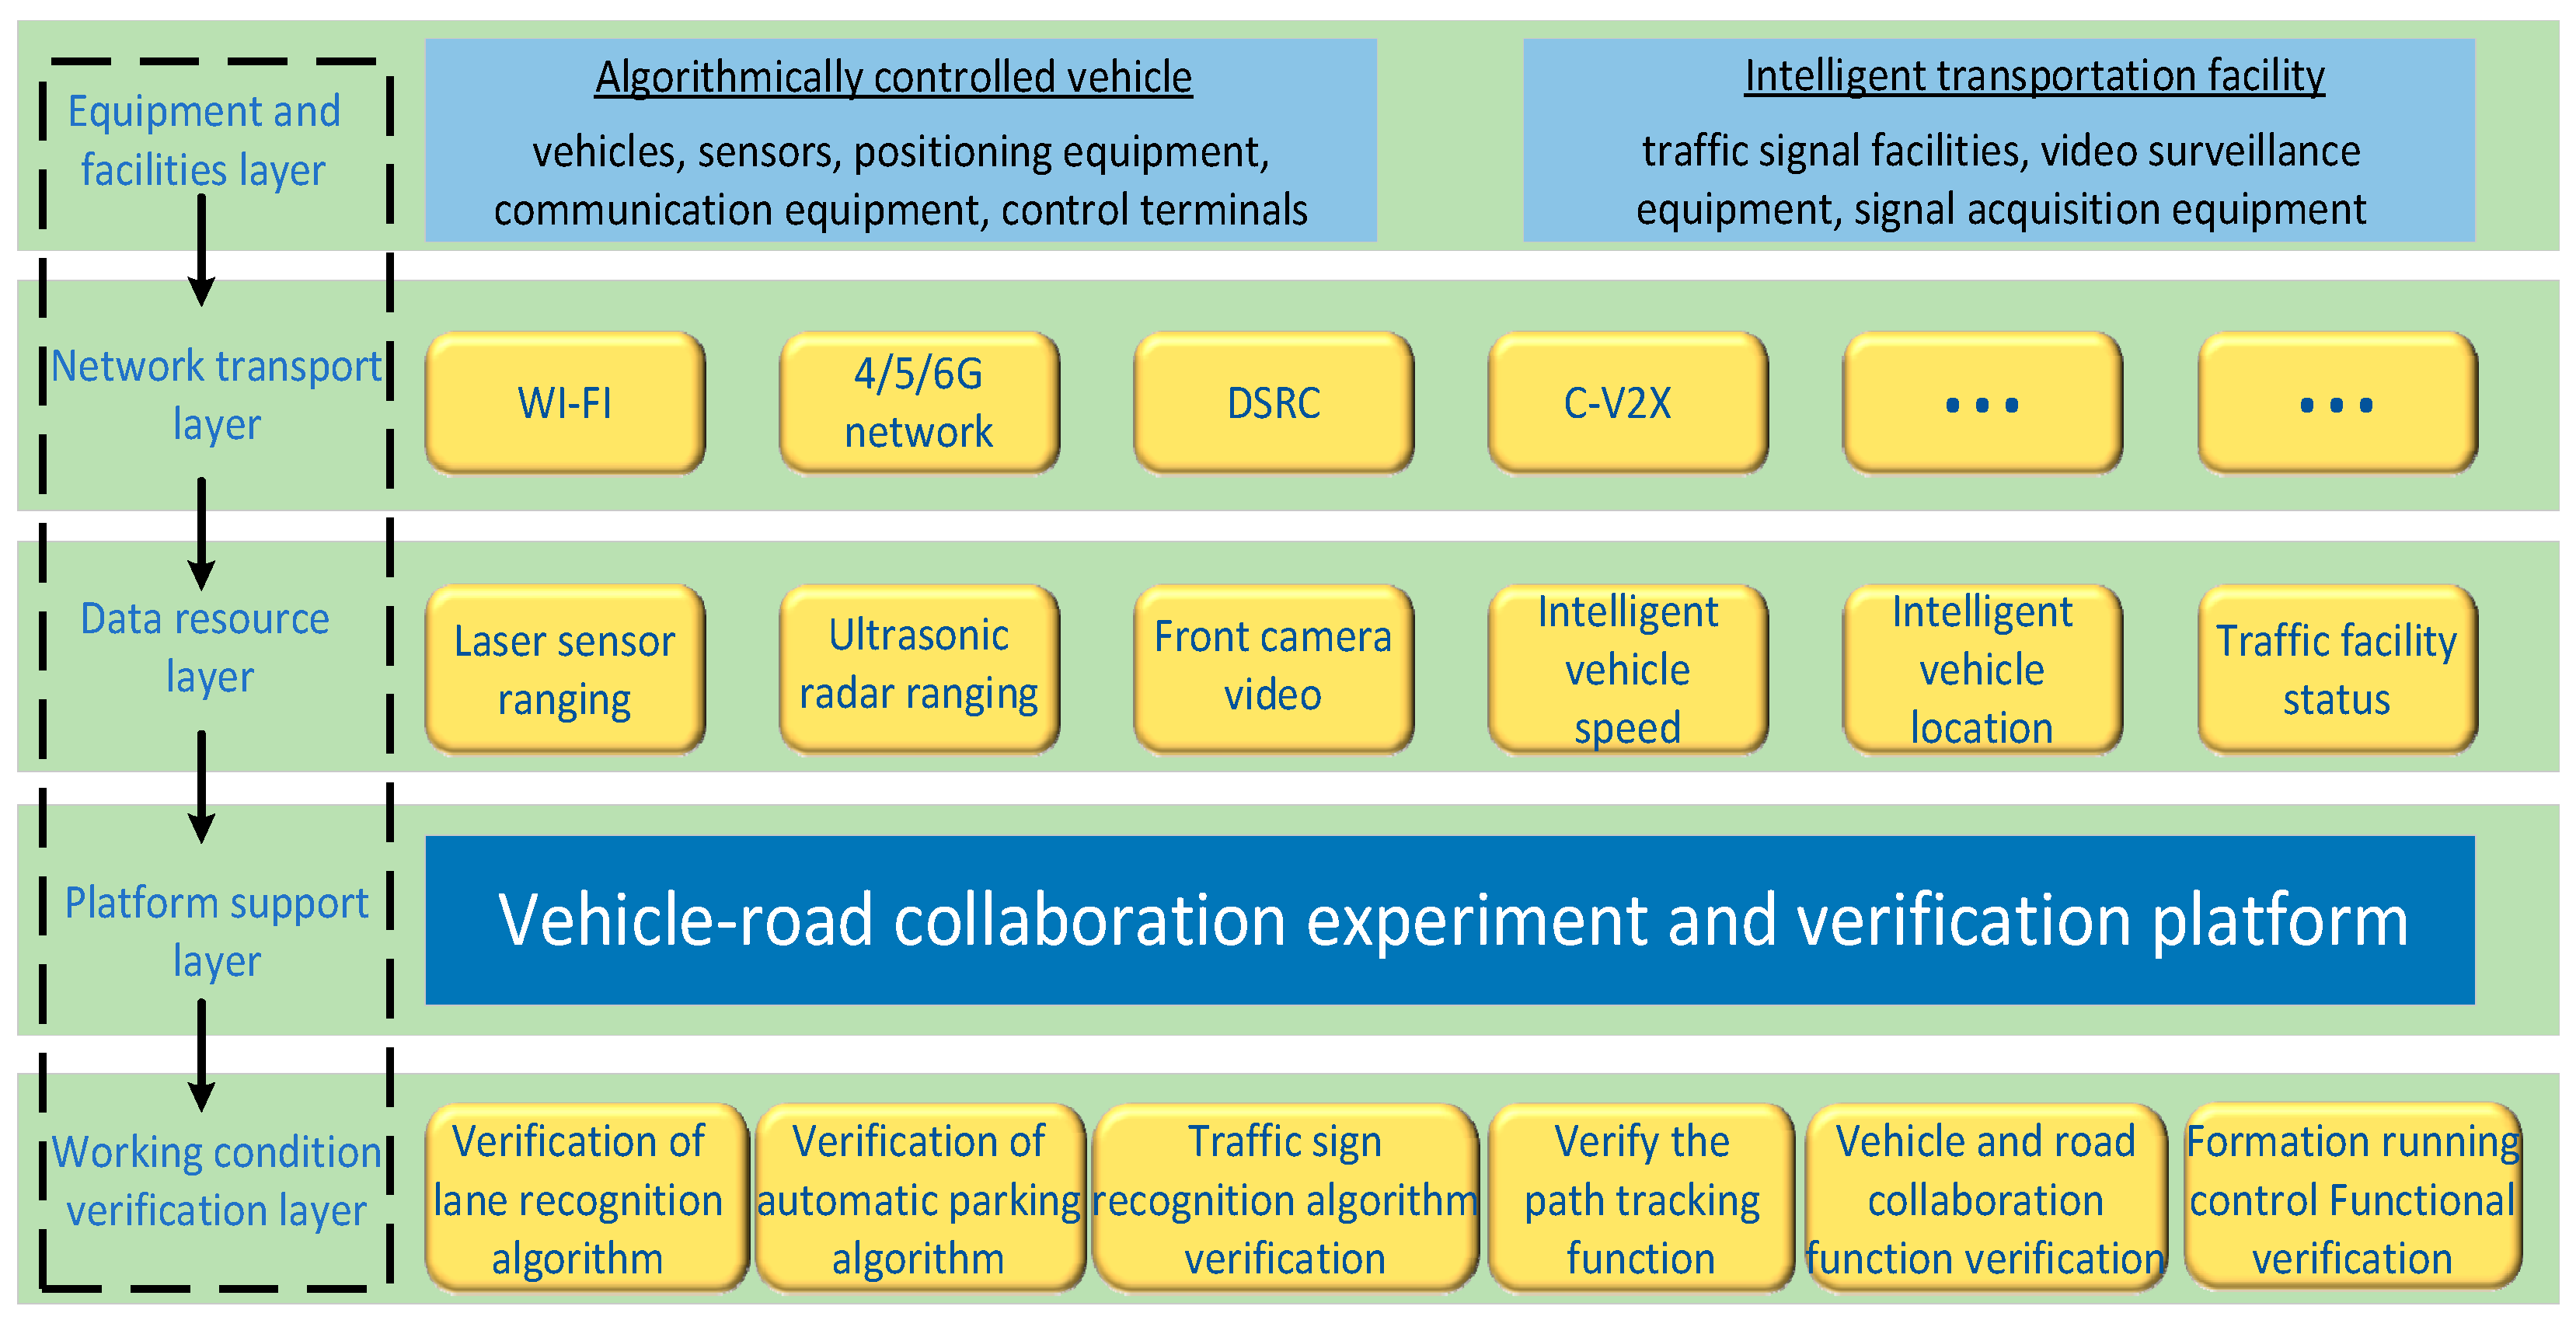
2. Physical and Logical Framework of the Platform
2.1. Platform Physical Structure
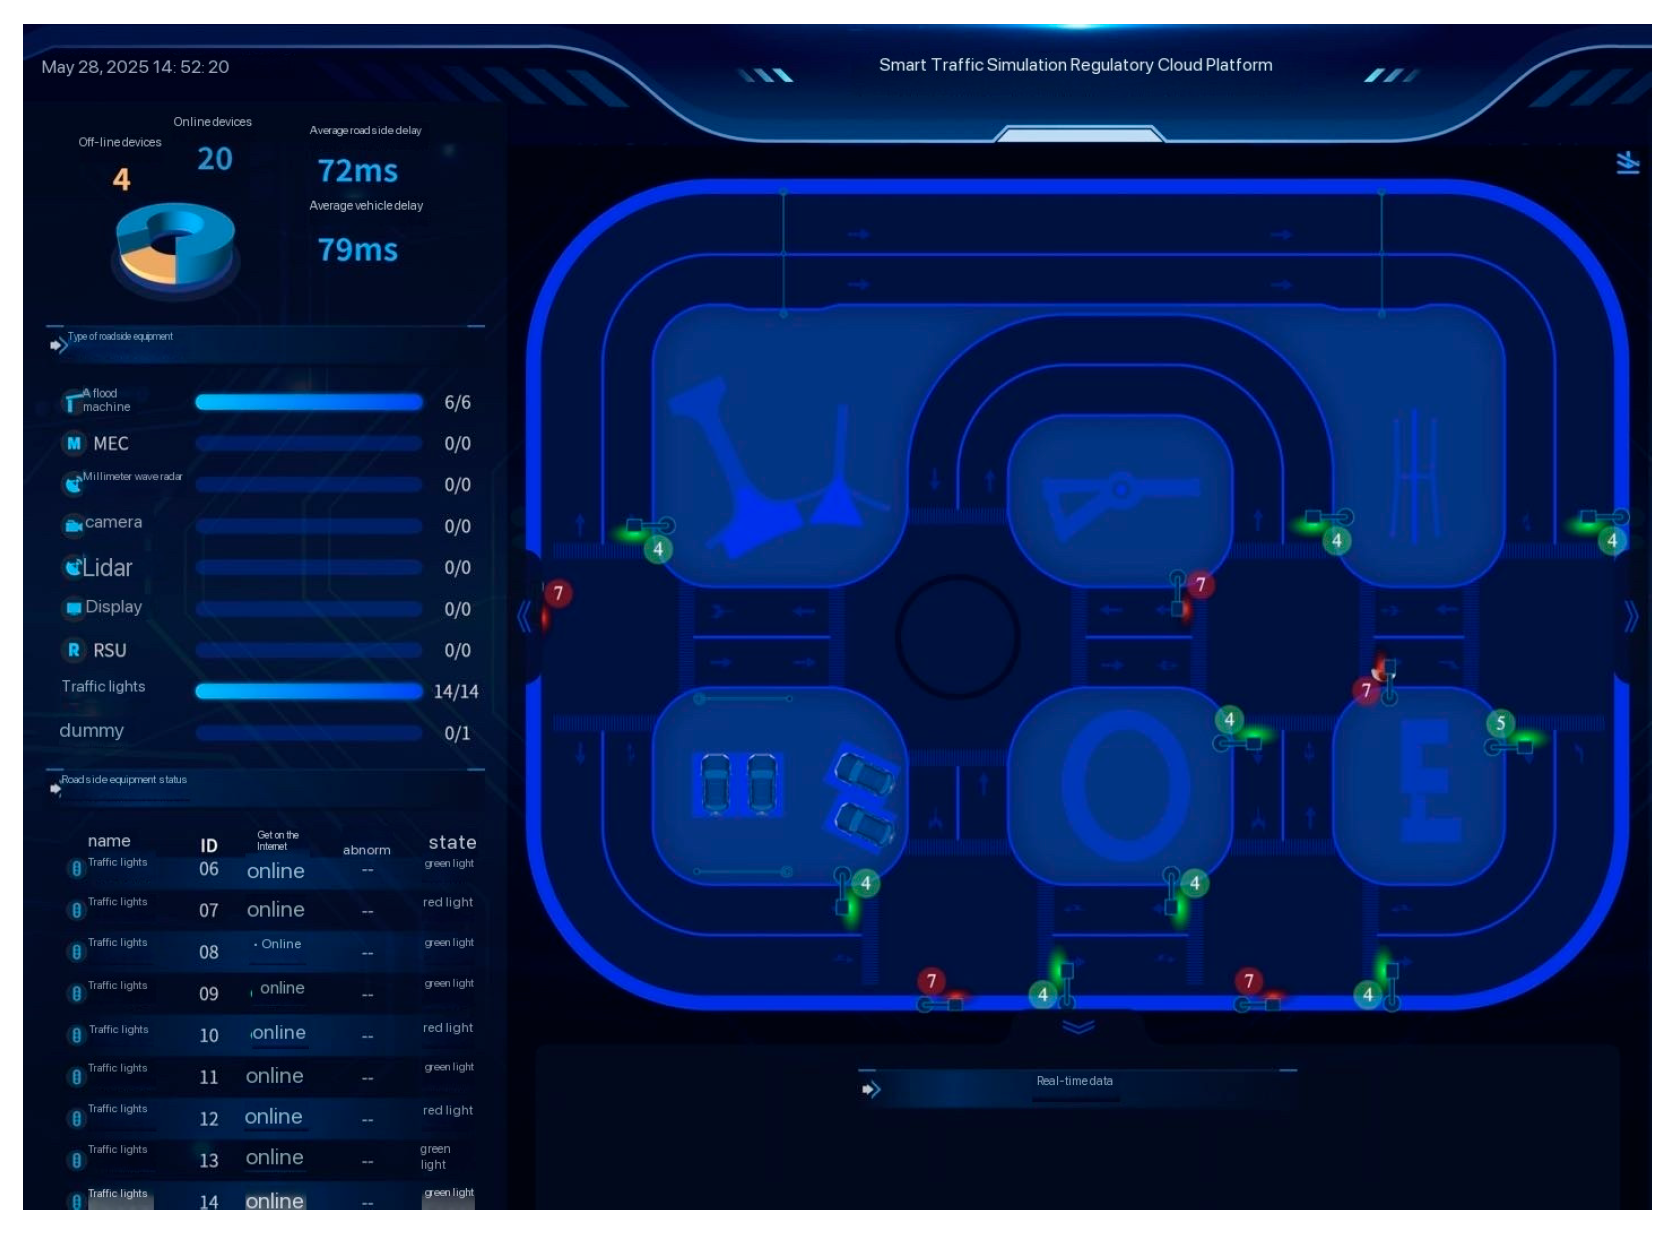
2.1.1. Intelligent Supervision Cloud Platform
2.1.2. Network Communication System
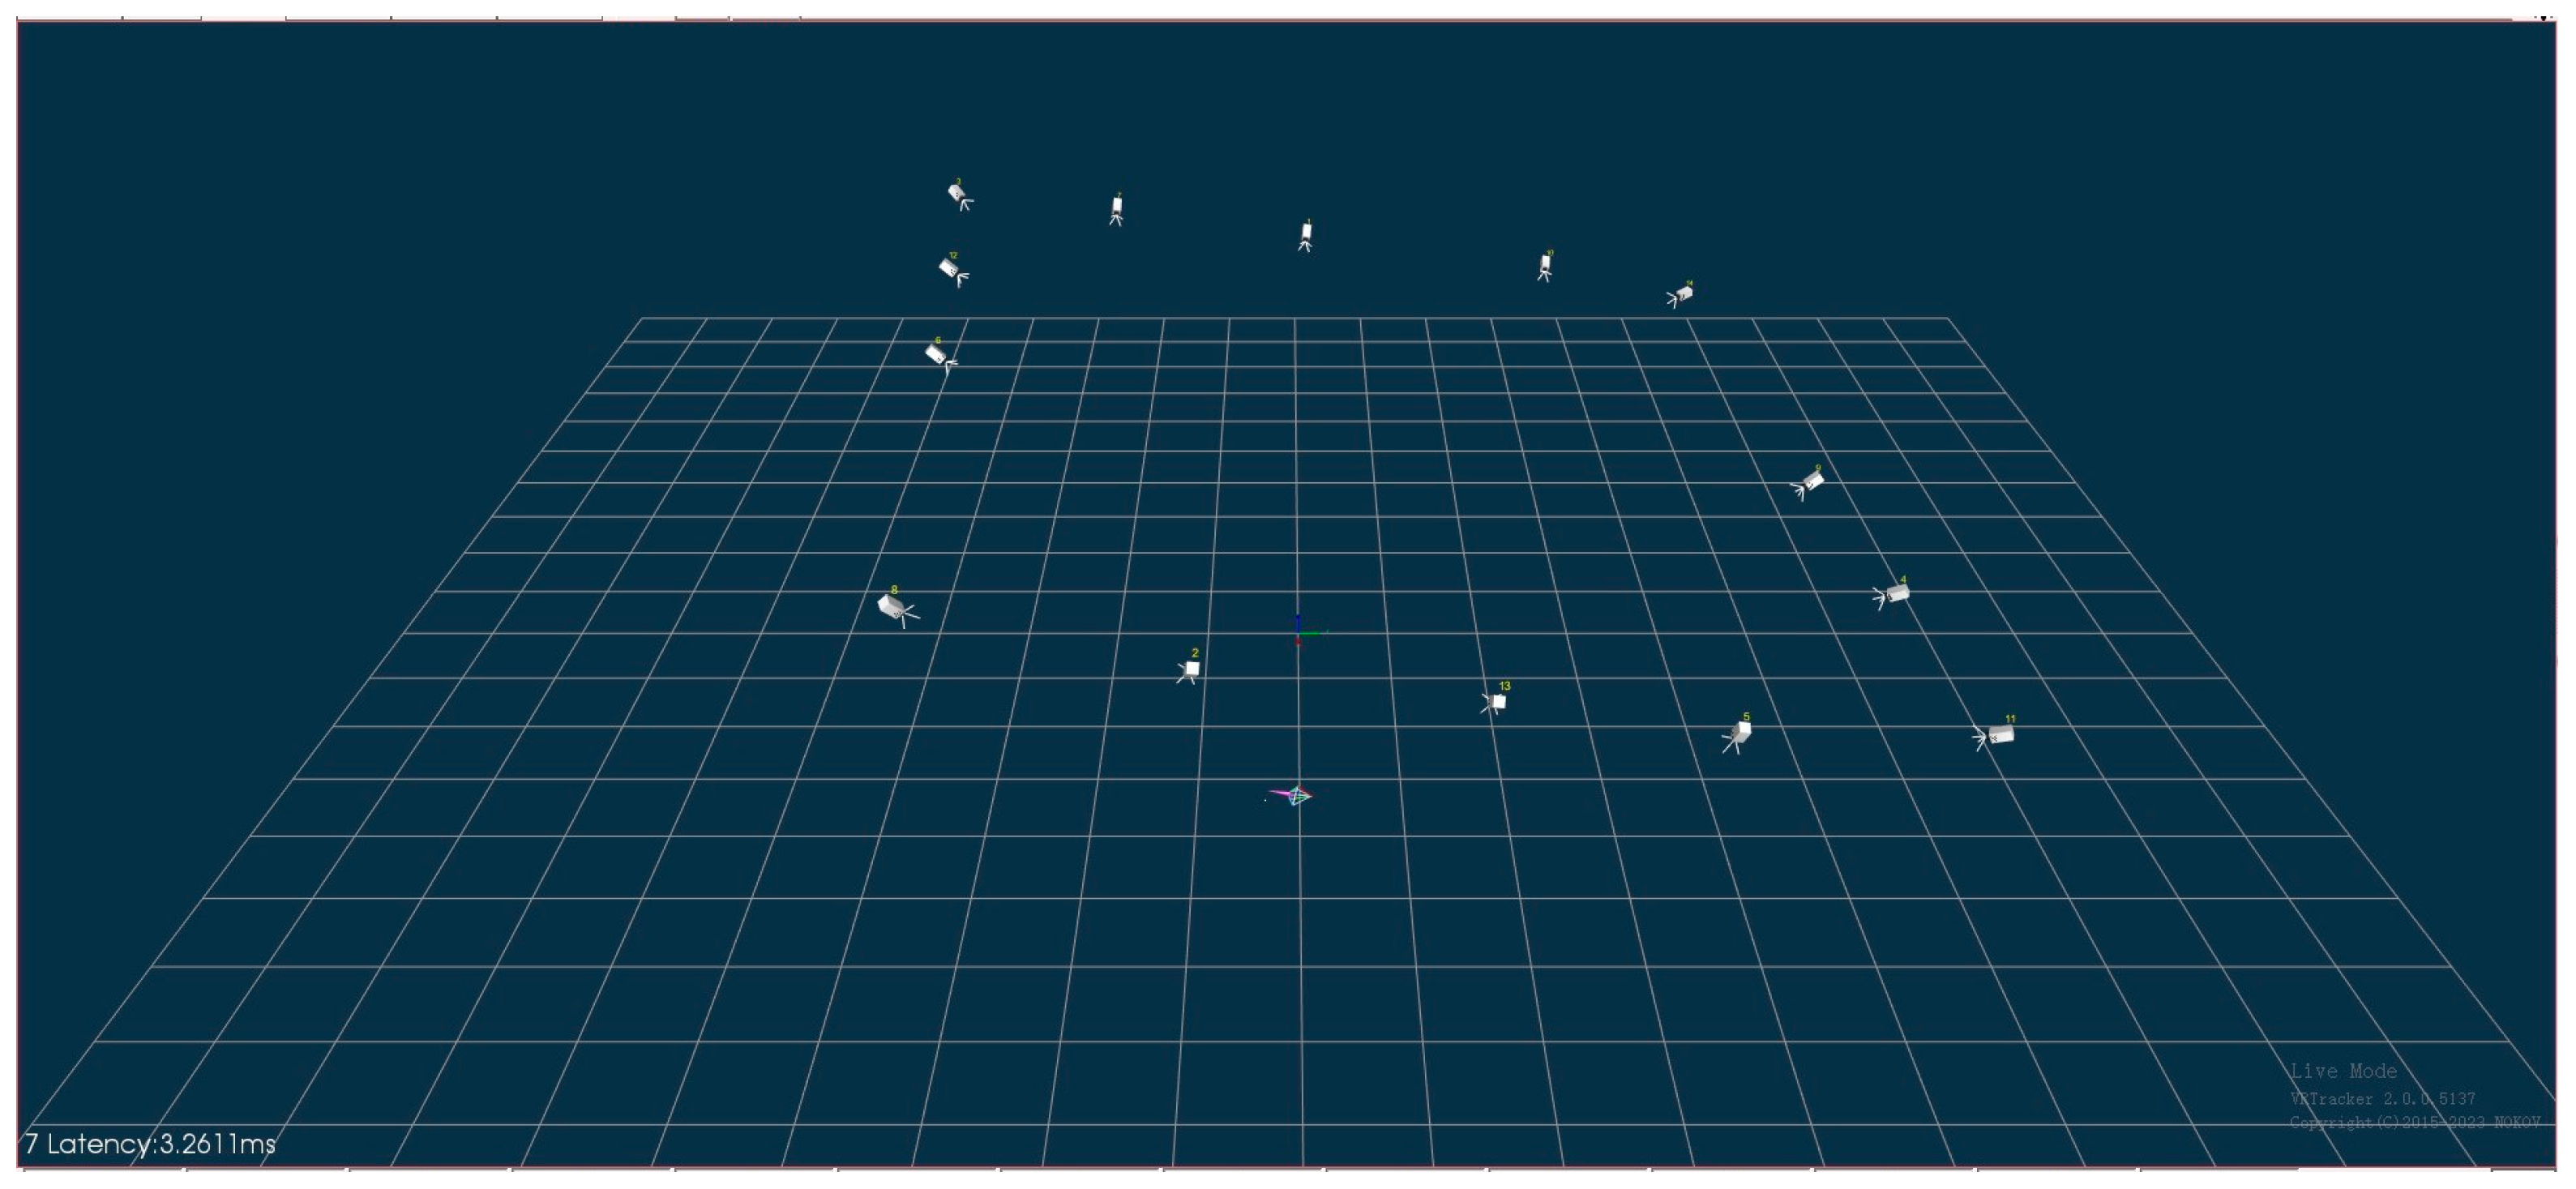
2.1.3. High-Precision Positioning System
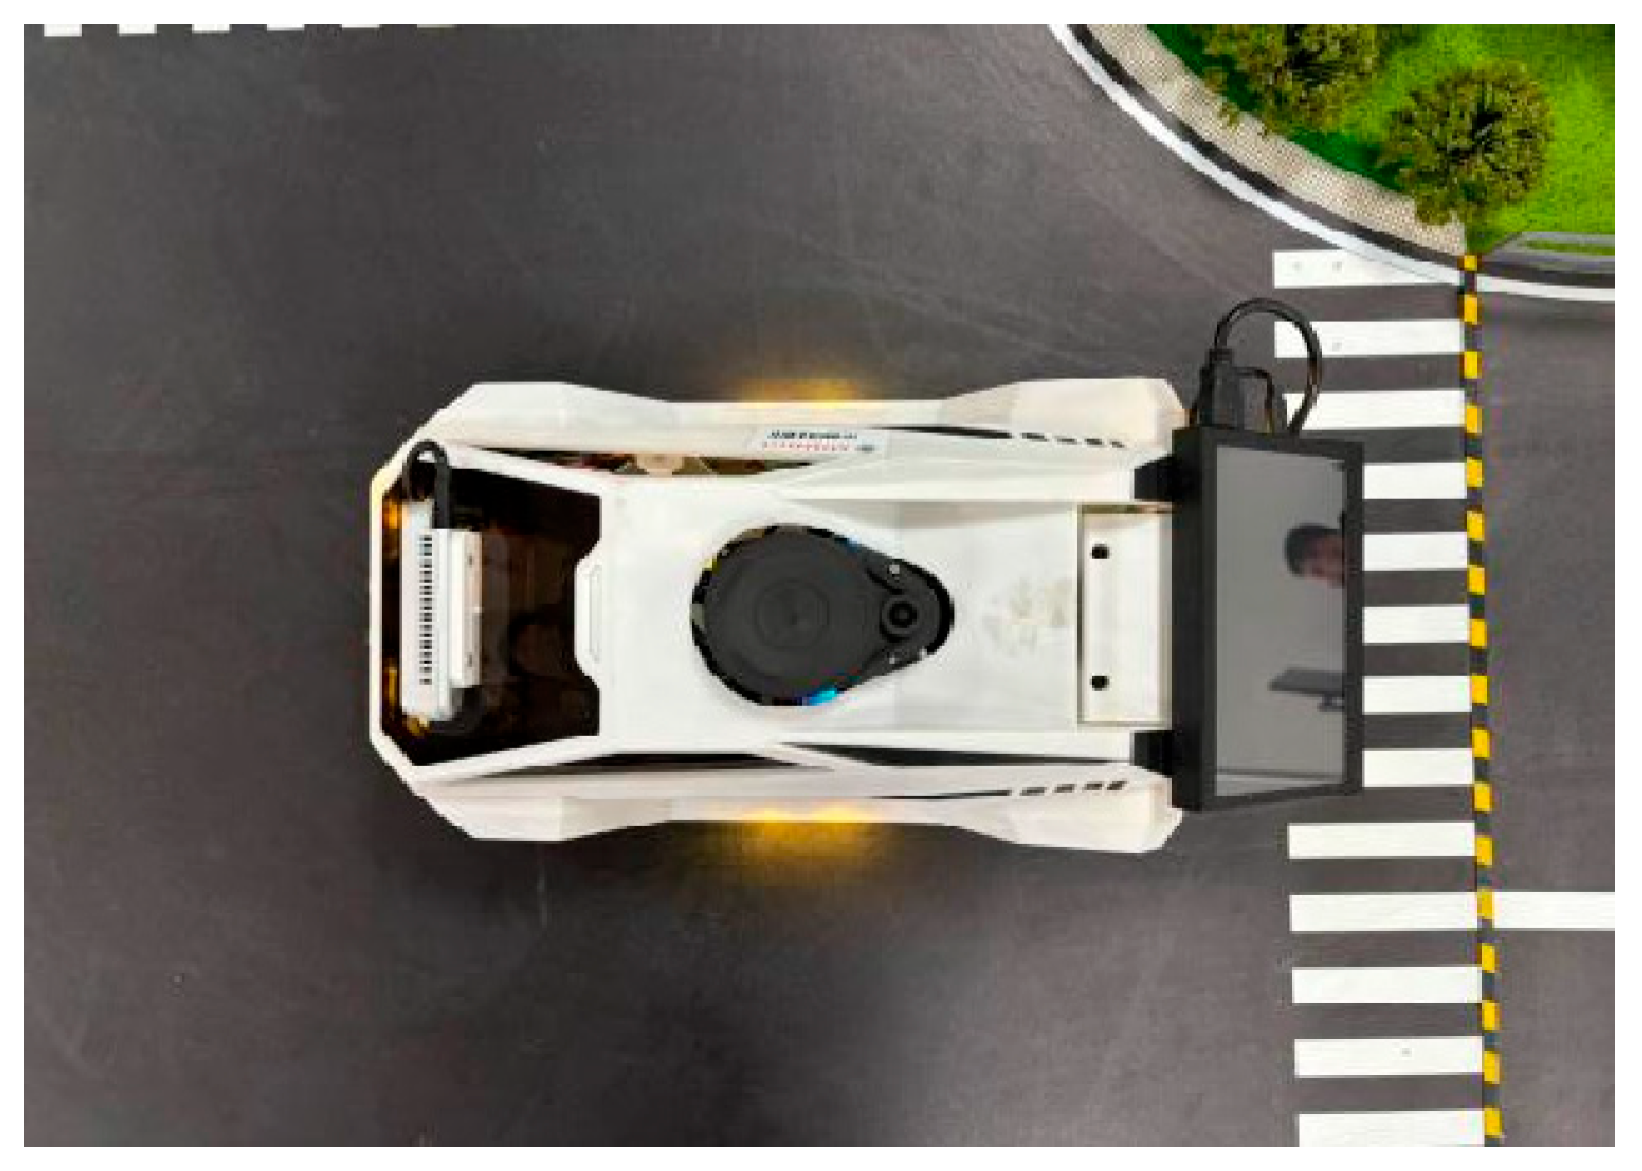
2.1.4. Intelligent Vehicle Terminal and Control Terminal
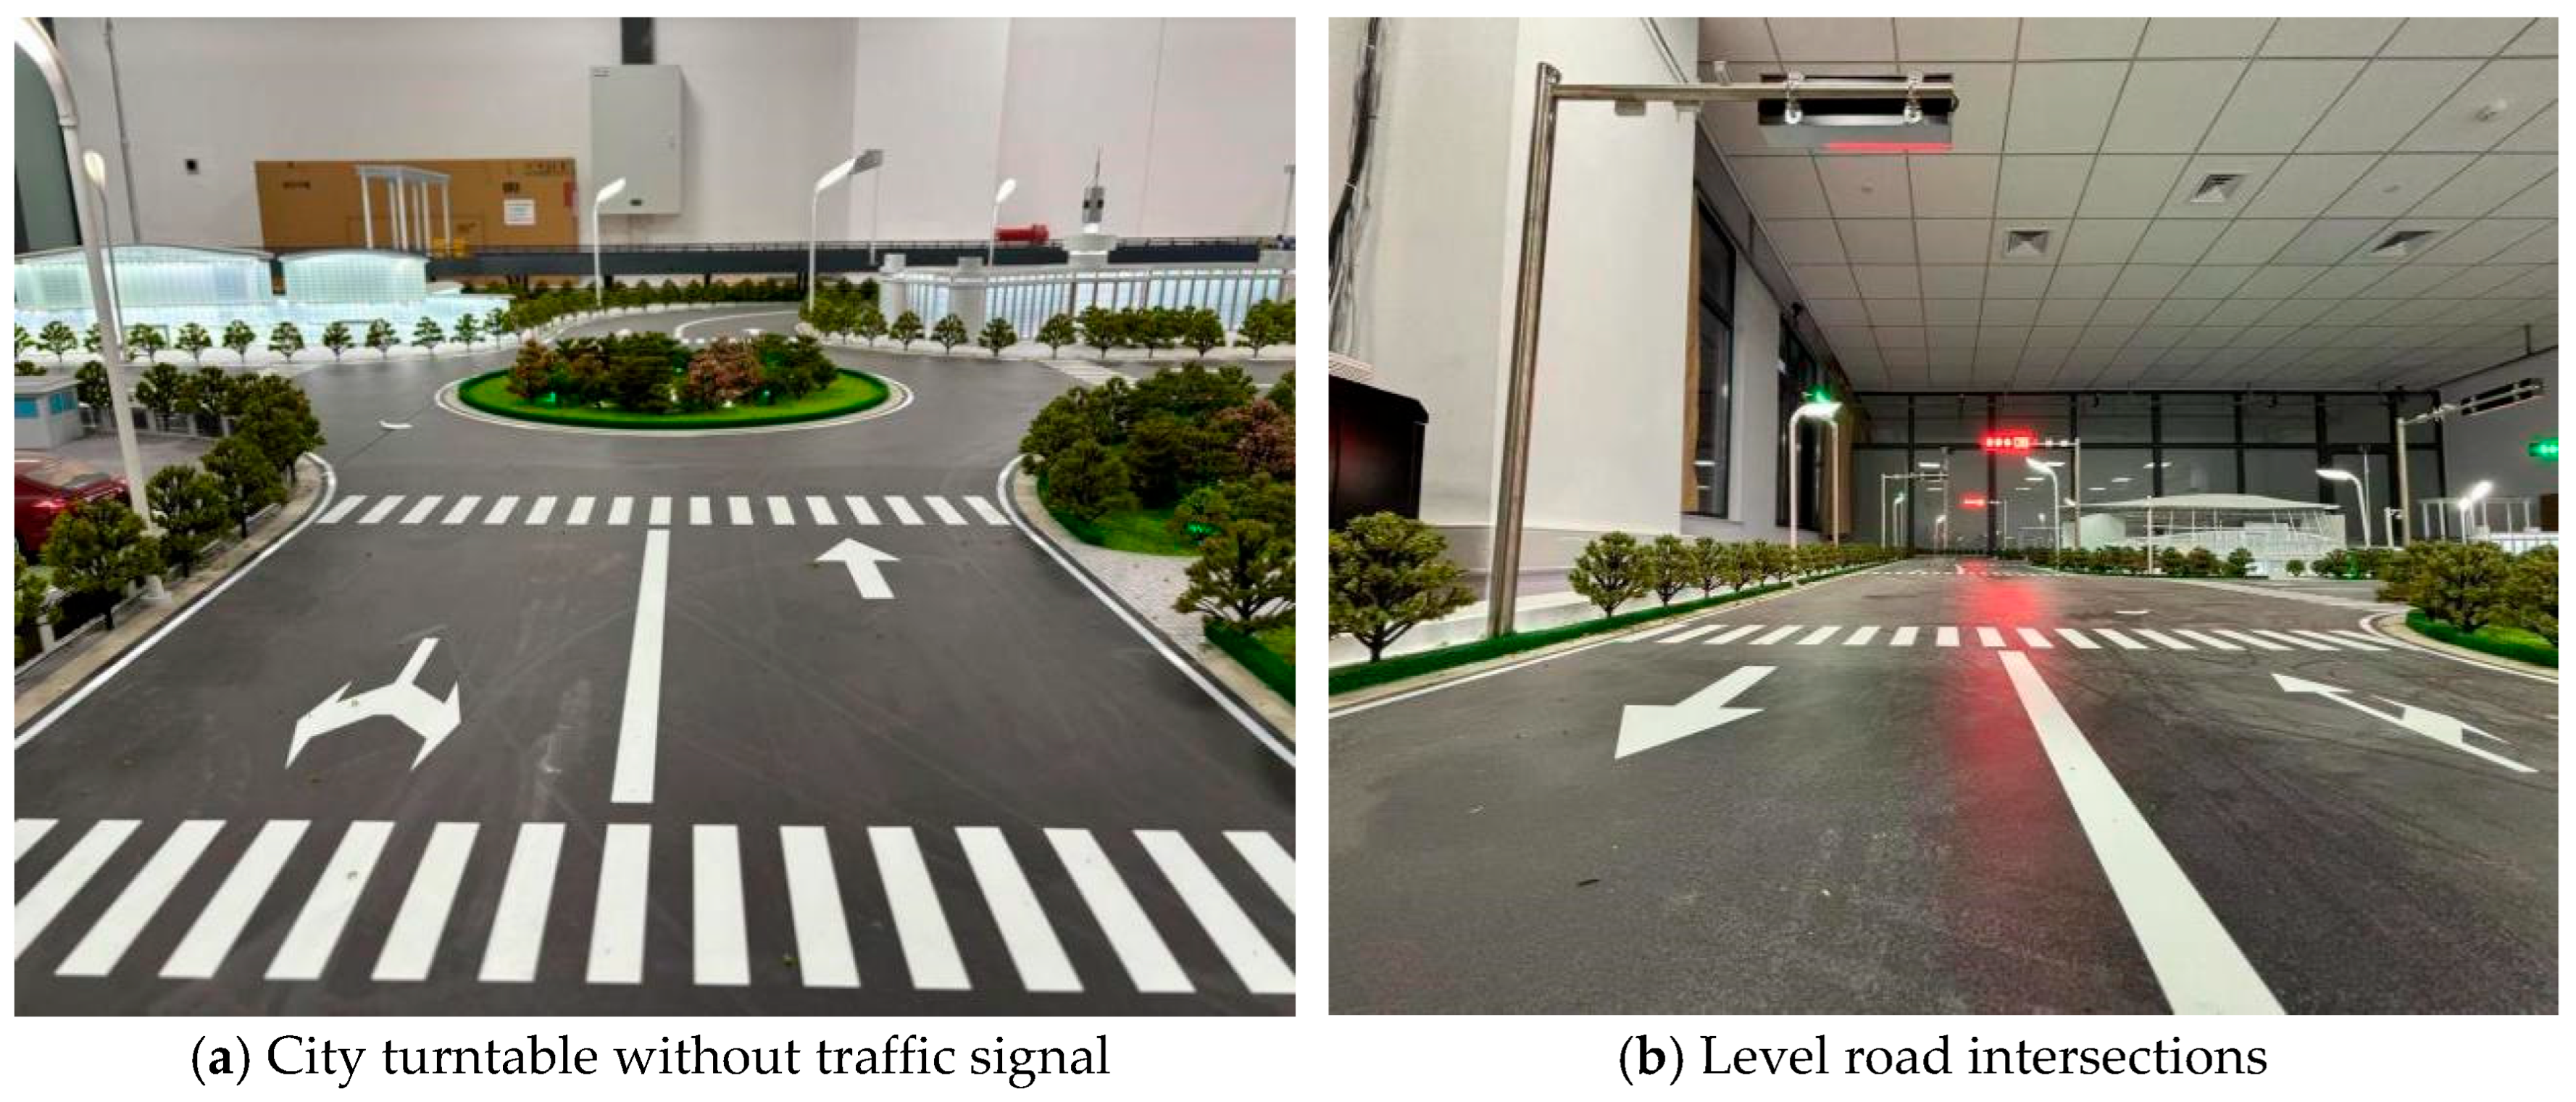
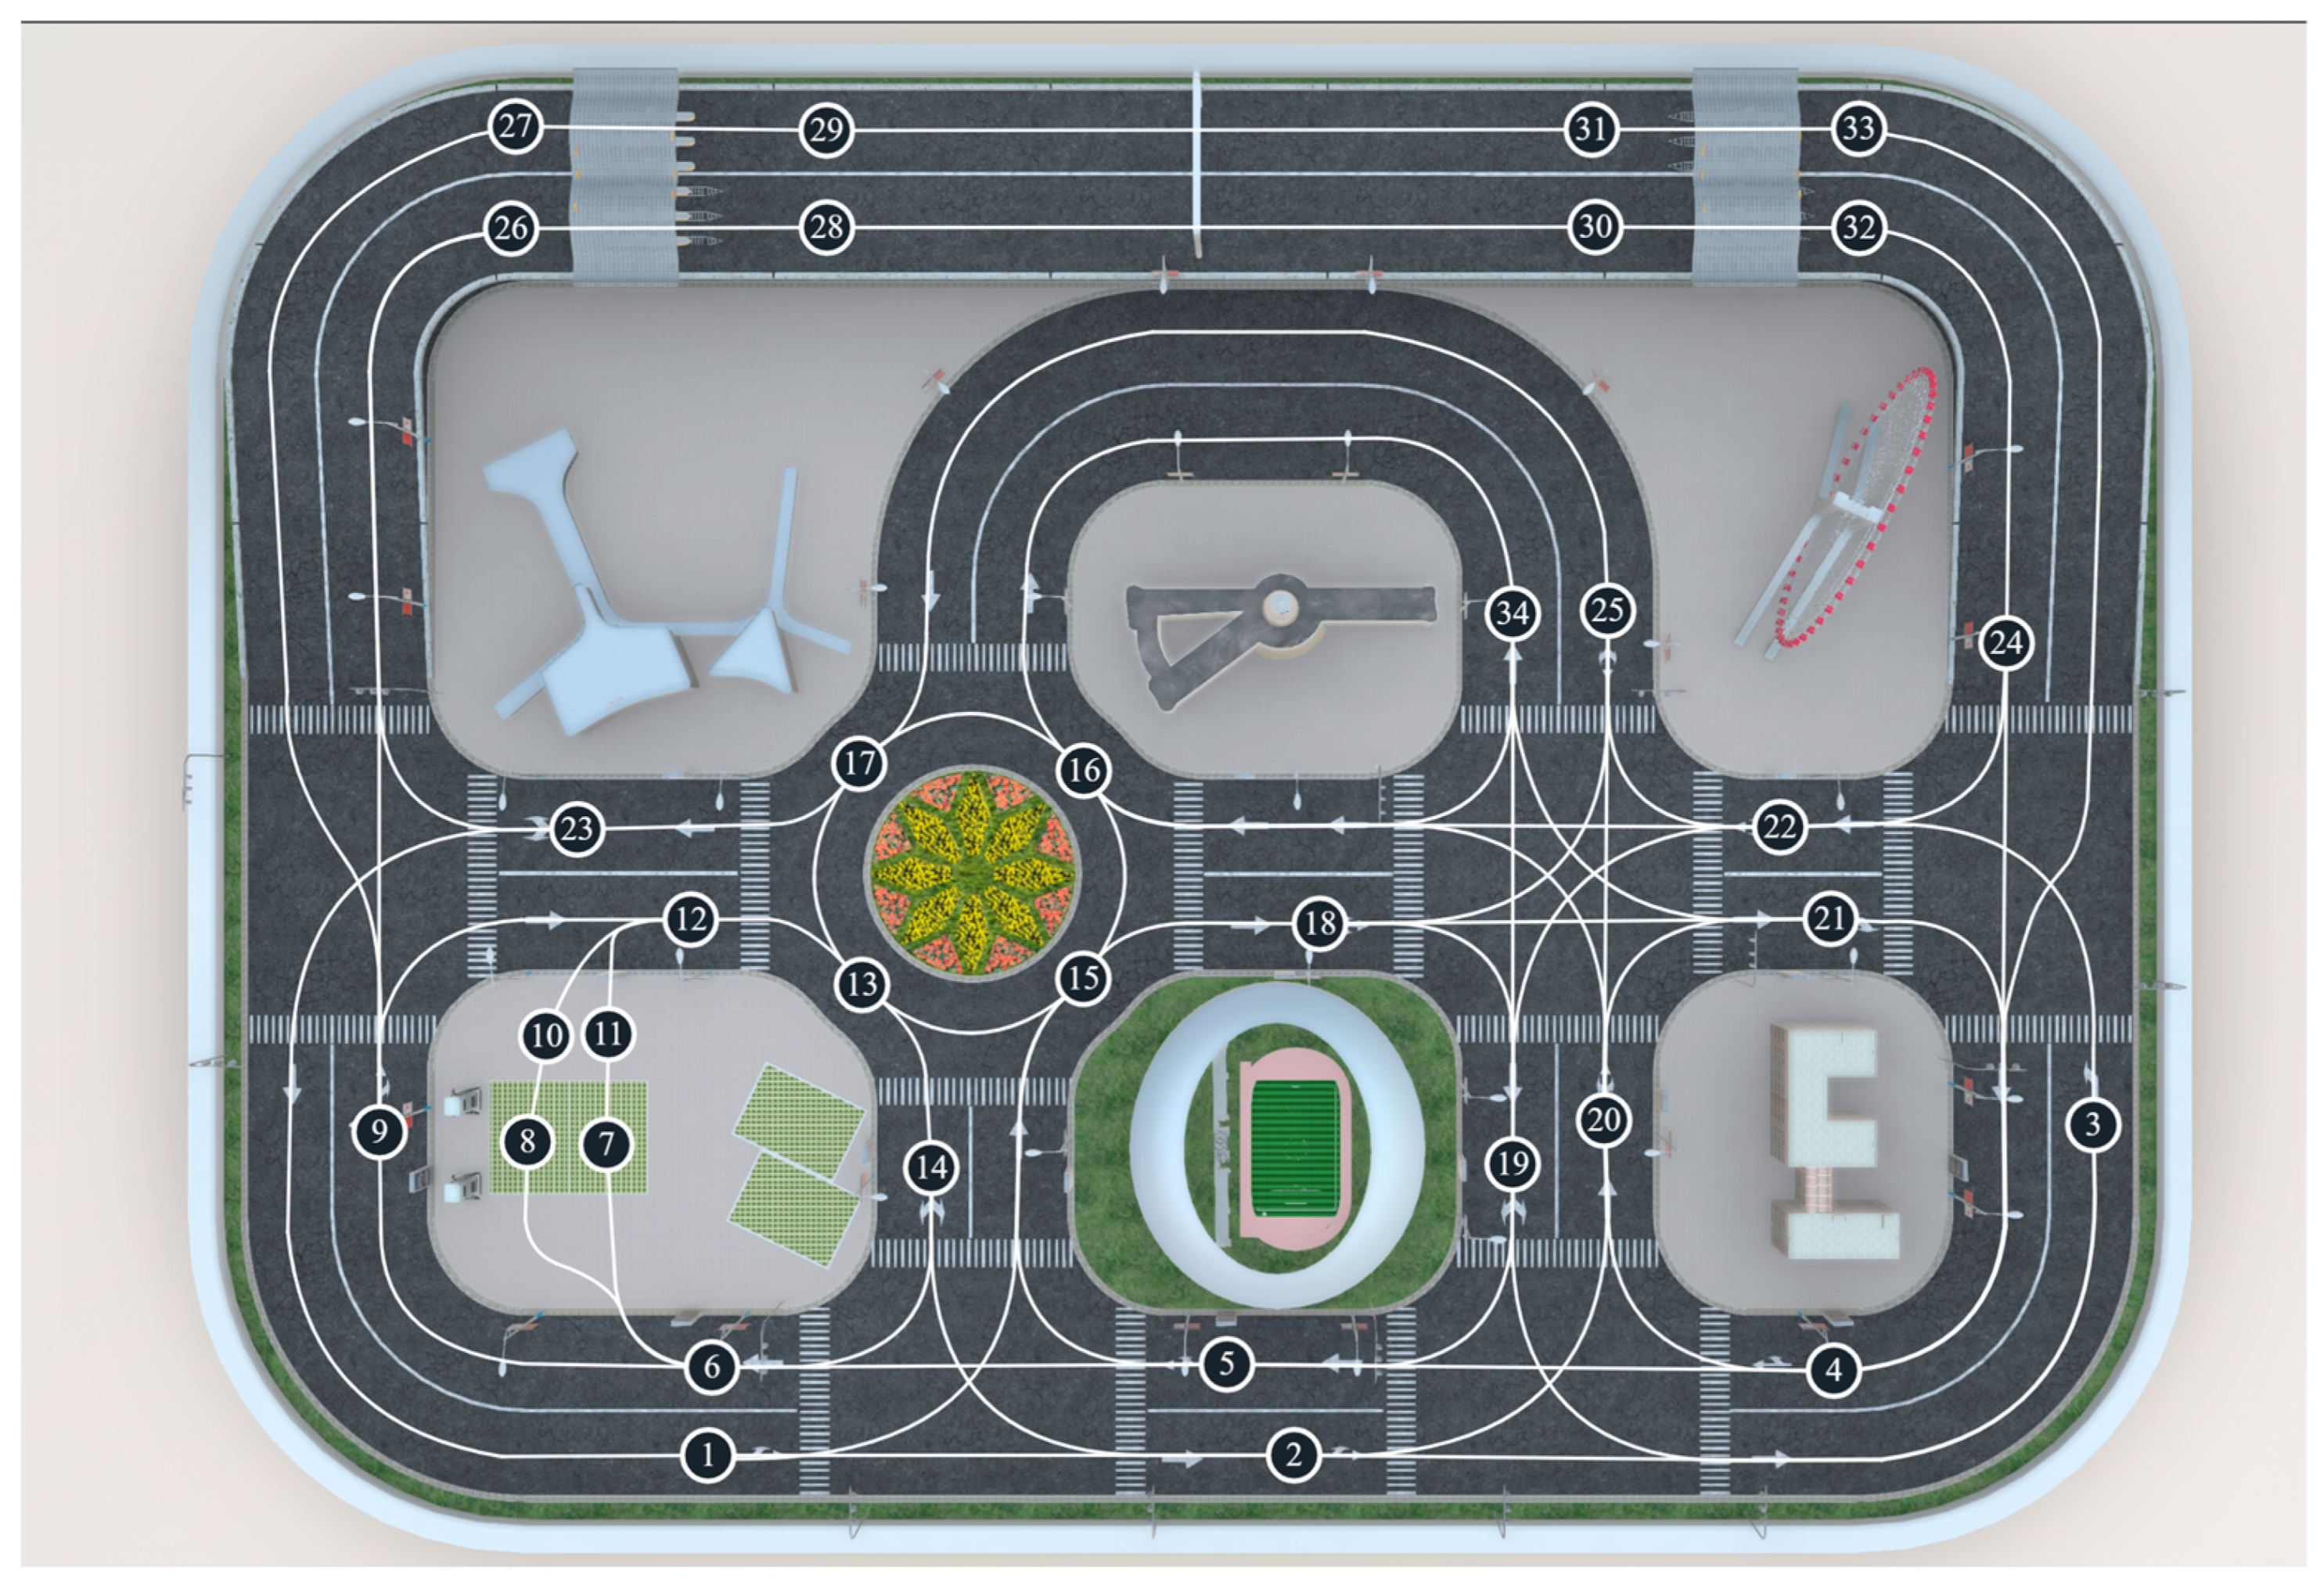
2.1.5. Smart Transportation Sand Table
2.1.6. Boundary Constraints and Real-World Challenge Simulation
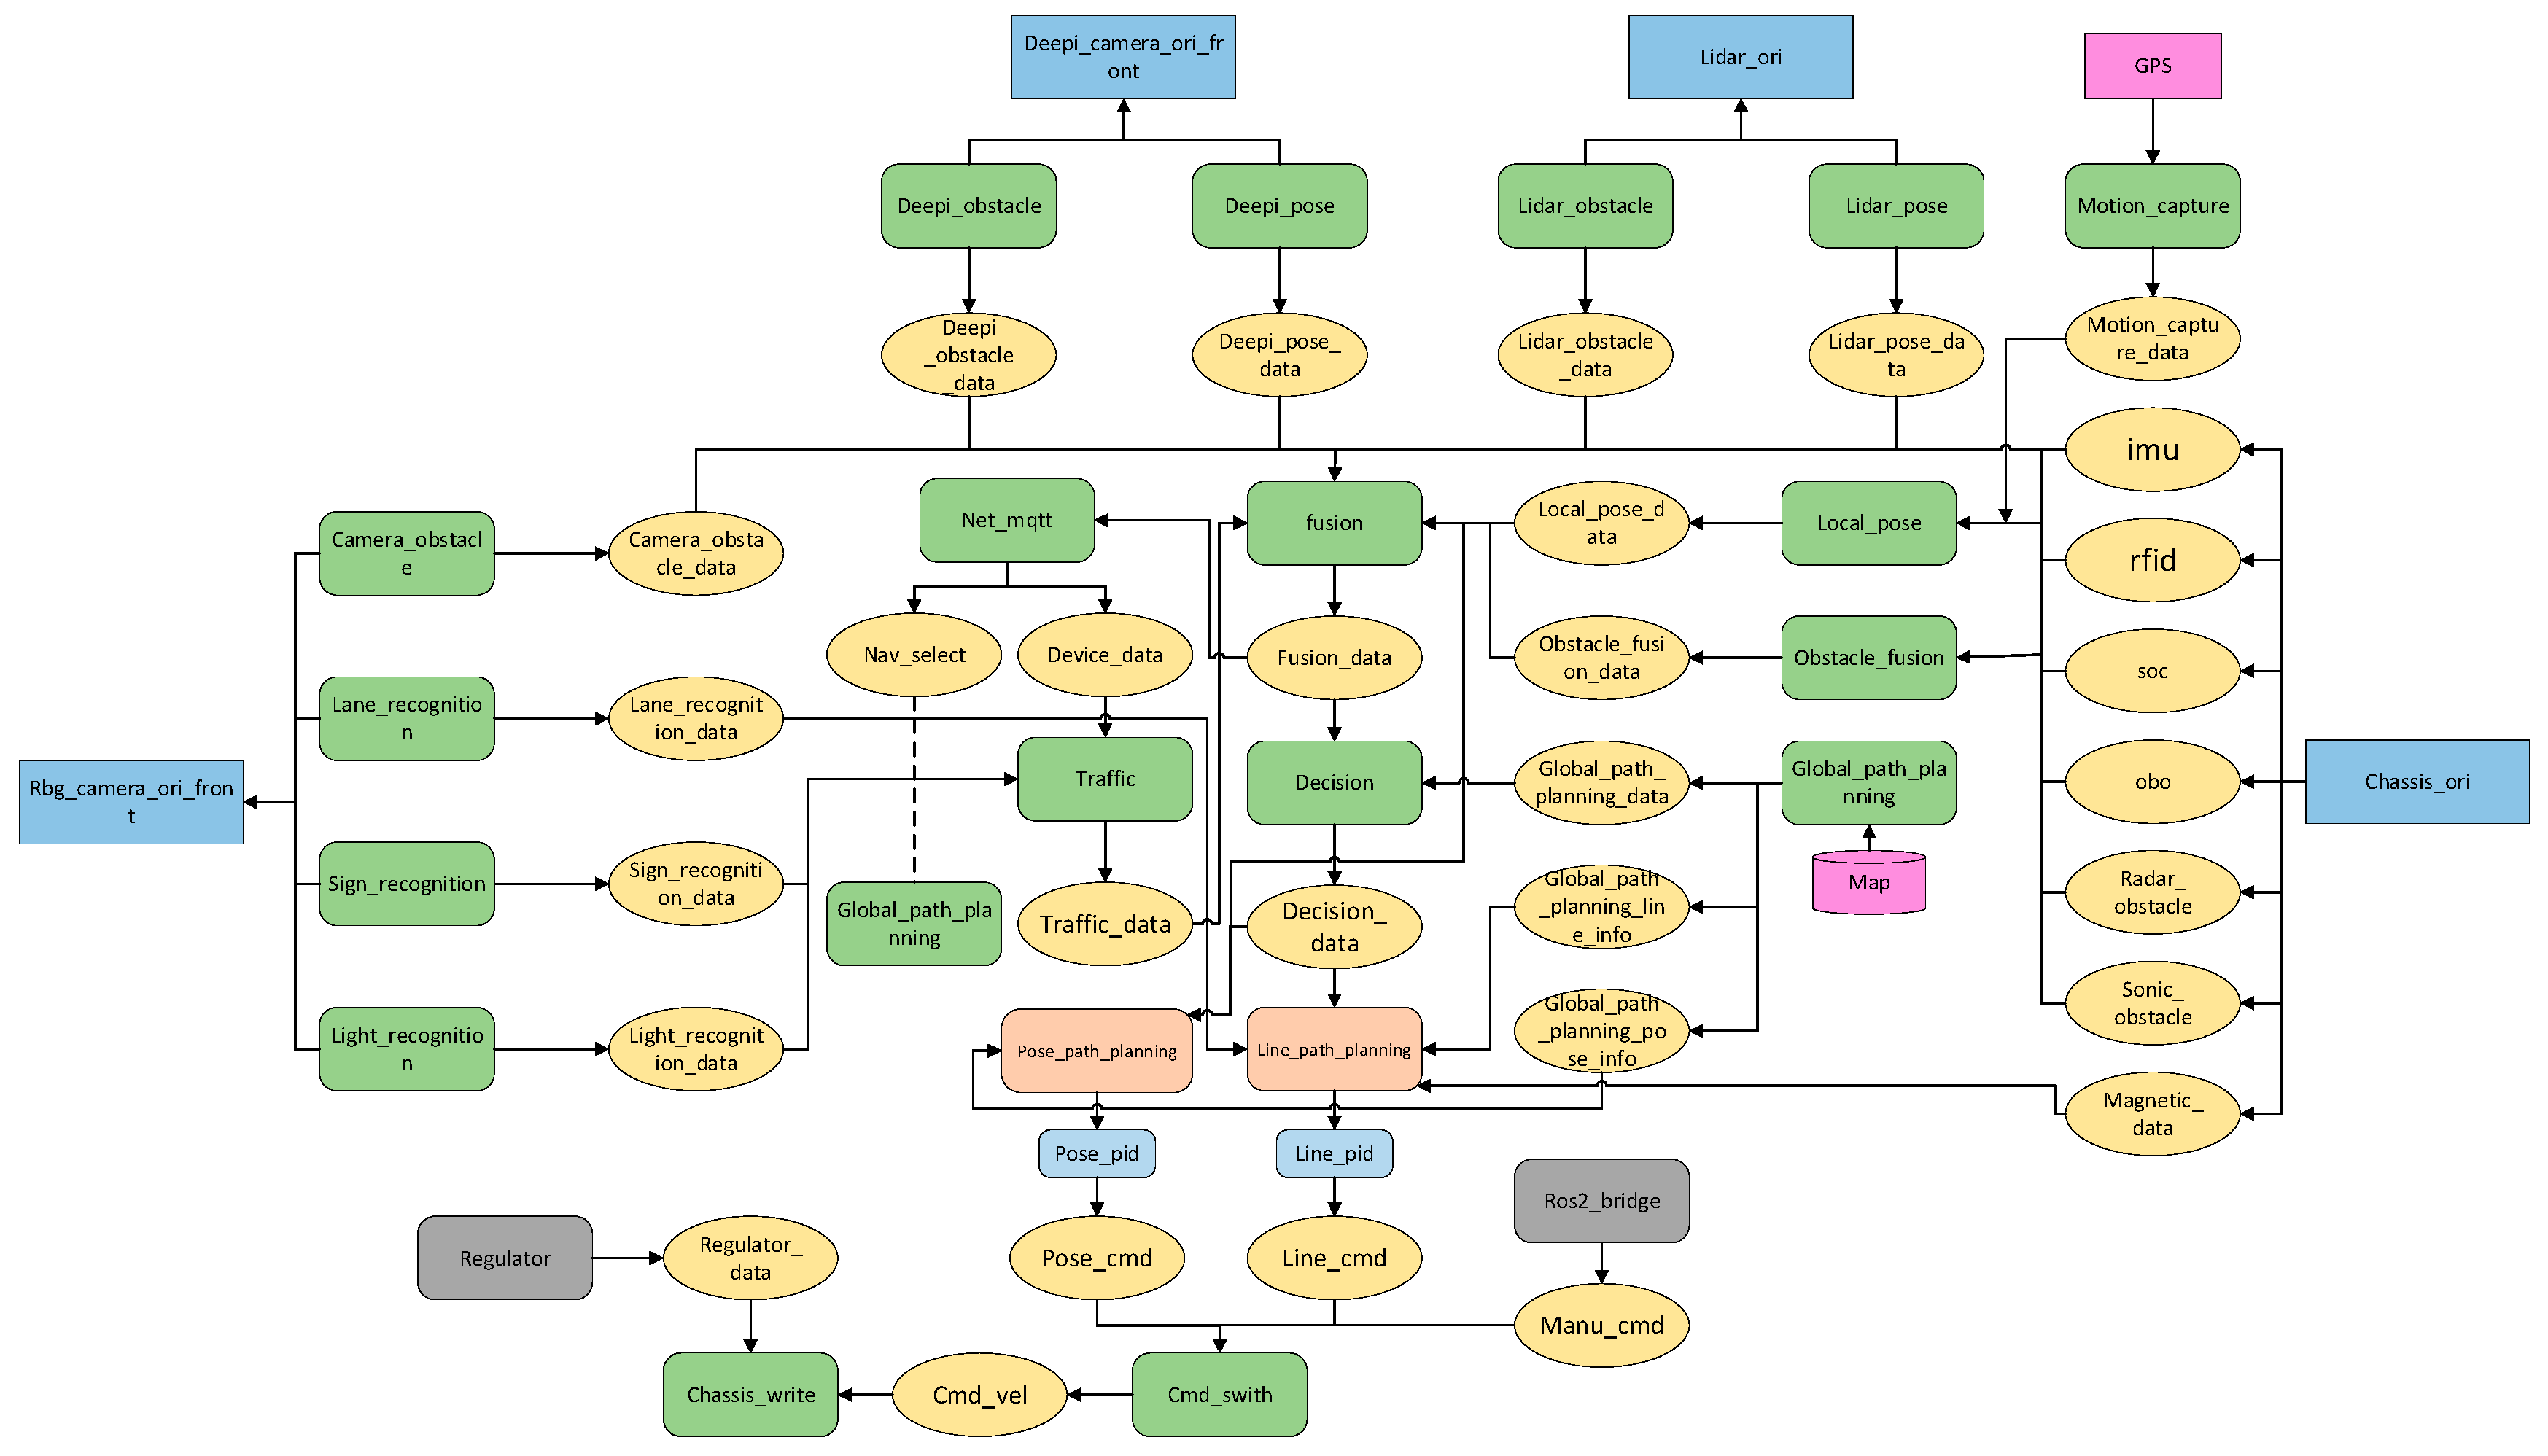
2.2. Platform Logical Structure
2.3. Comparative Analysis of V2X Simulation Tools
3. Teaching Method Design and Teaching Scenario
3.1. OBE Concept
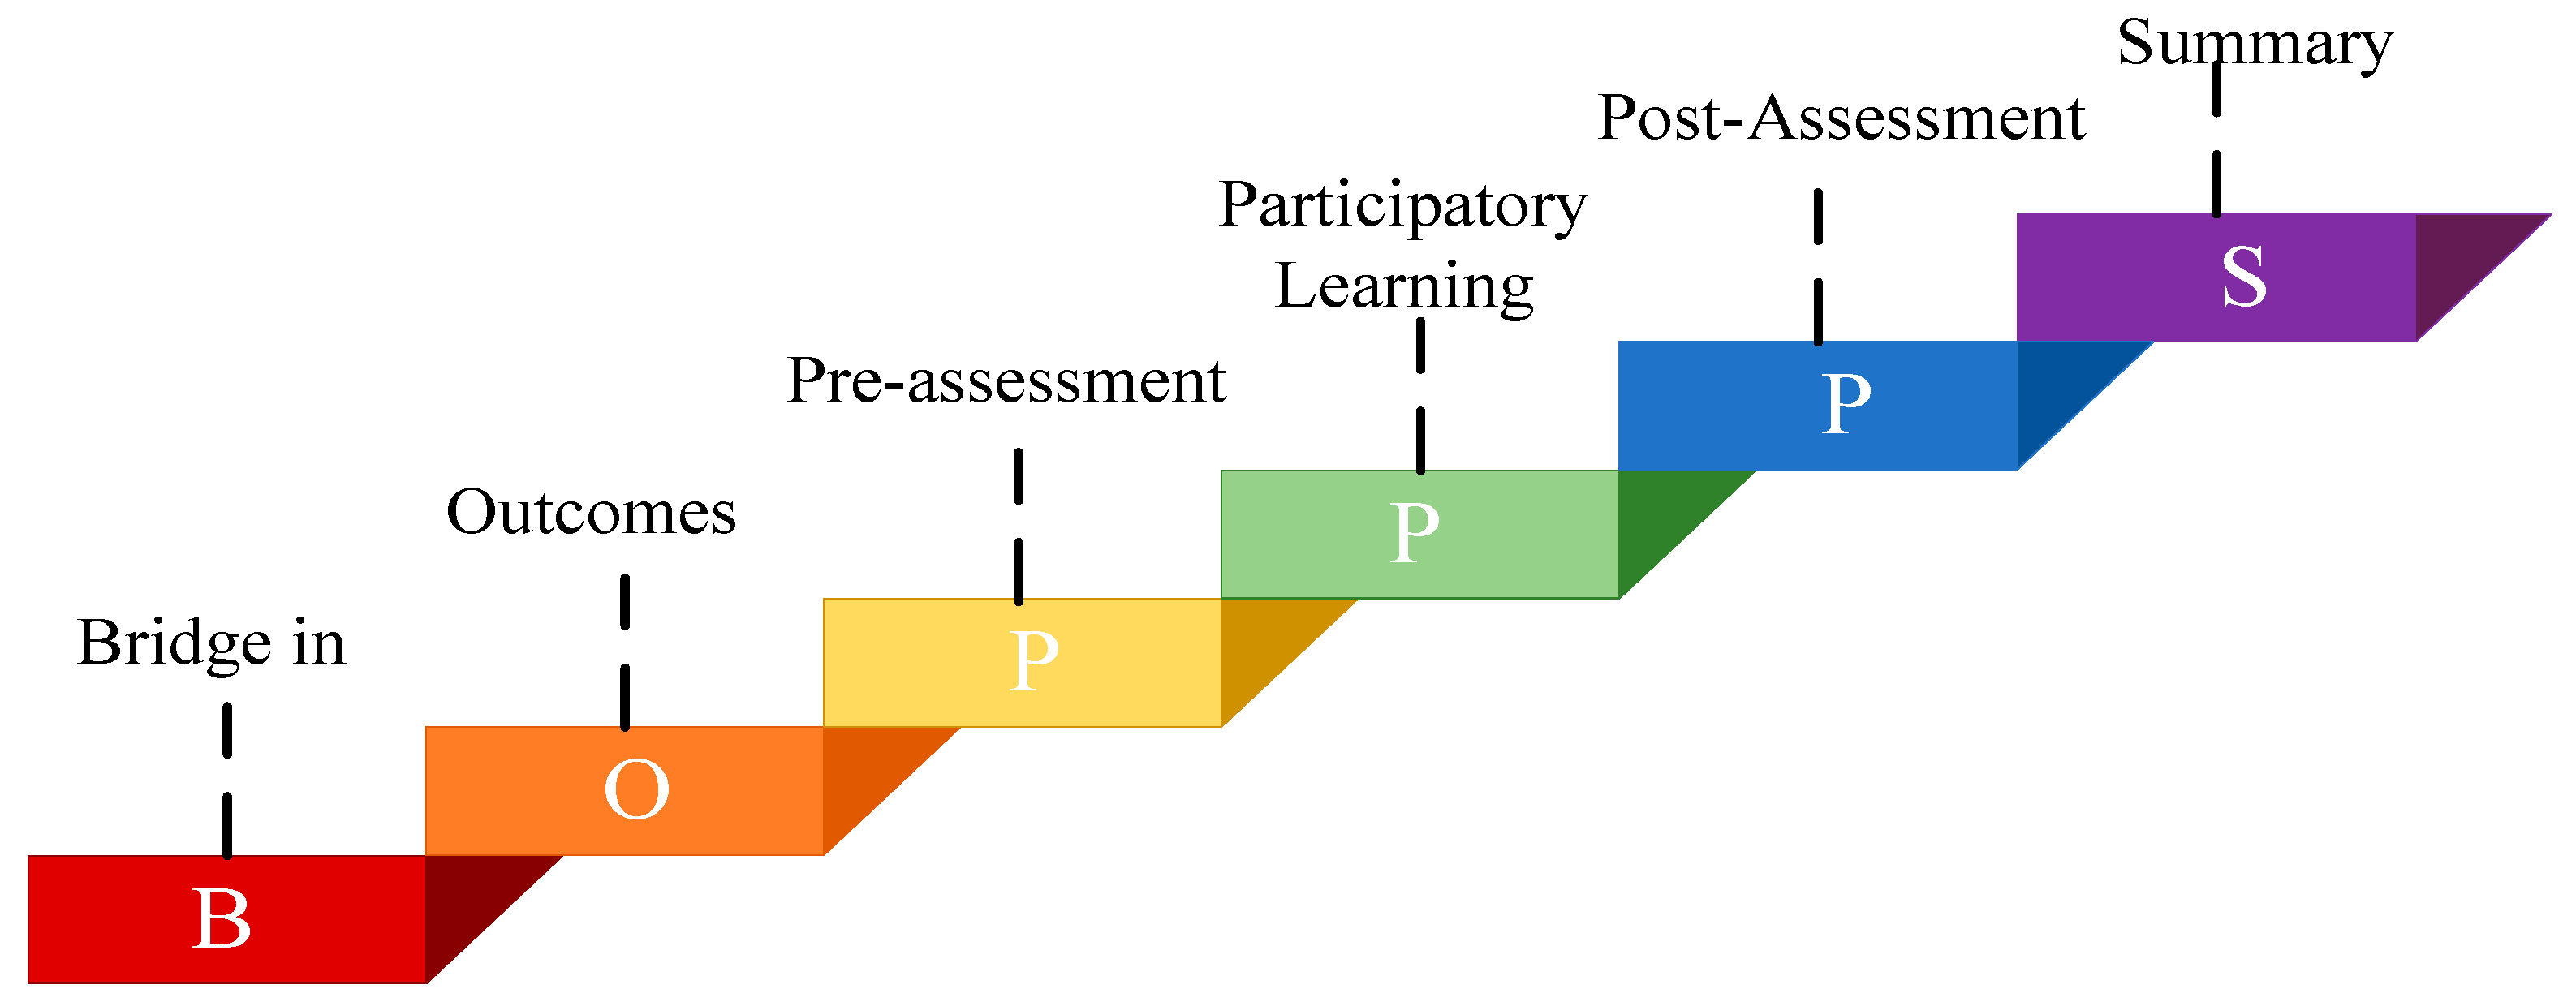
3.2. BOPPPS Teaching Model
3.2.1. Bridge-In
3.2.2. Objective
3.2.3. Pre-Assessment
3.2.4. Participatory Learning
3.2.5. Post-Assessment
3.2.6. Summary
4. Design of Experimental Teaching Links
4.1. Teaching Preparation
4.2. Experimental Purposes and Requirements
4.3. Teaching Process Design
4.3.1. Bridge-In (Stimulate Interest)
4.3.2. Objective (Specific Aim)
4.3.3. Pre-Assessment (Diagnostic Practice)
4.3.4. Participatory Learning (Engaged Learning)
4.3.5. Post-Assessment (Post-Evaluation)
4.3.6. Summary (Outcome Patterns)
5. Teaching Effect Demonstration and Data Analysis
5.1. Empirical Design of Teaching Effect
5.2. Research Object
5.3. Correlation Evaluation Method
5.3.1. Subjective Evaluation of the Correlation Between Simulation Platform and Teaching Effect
5.3.2. Evaluation of Knowledge Promotion Effect
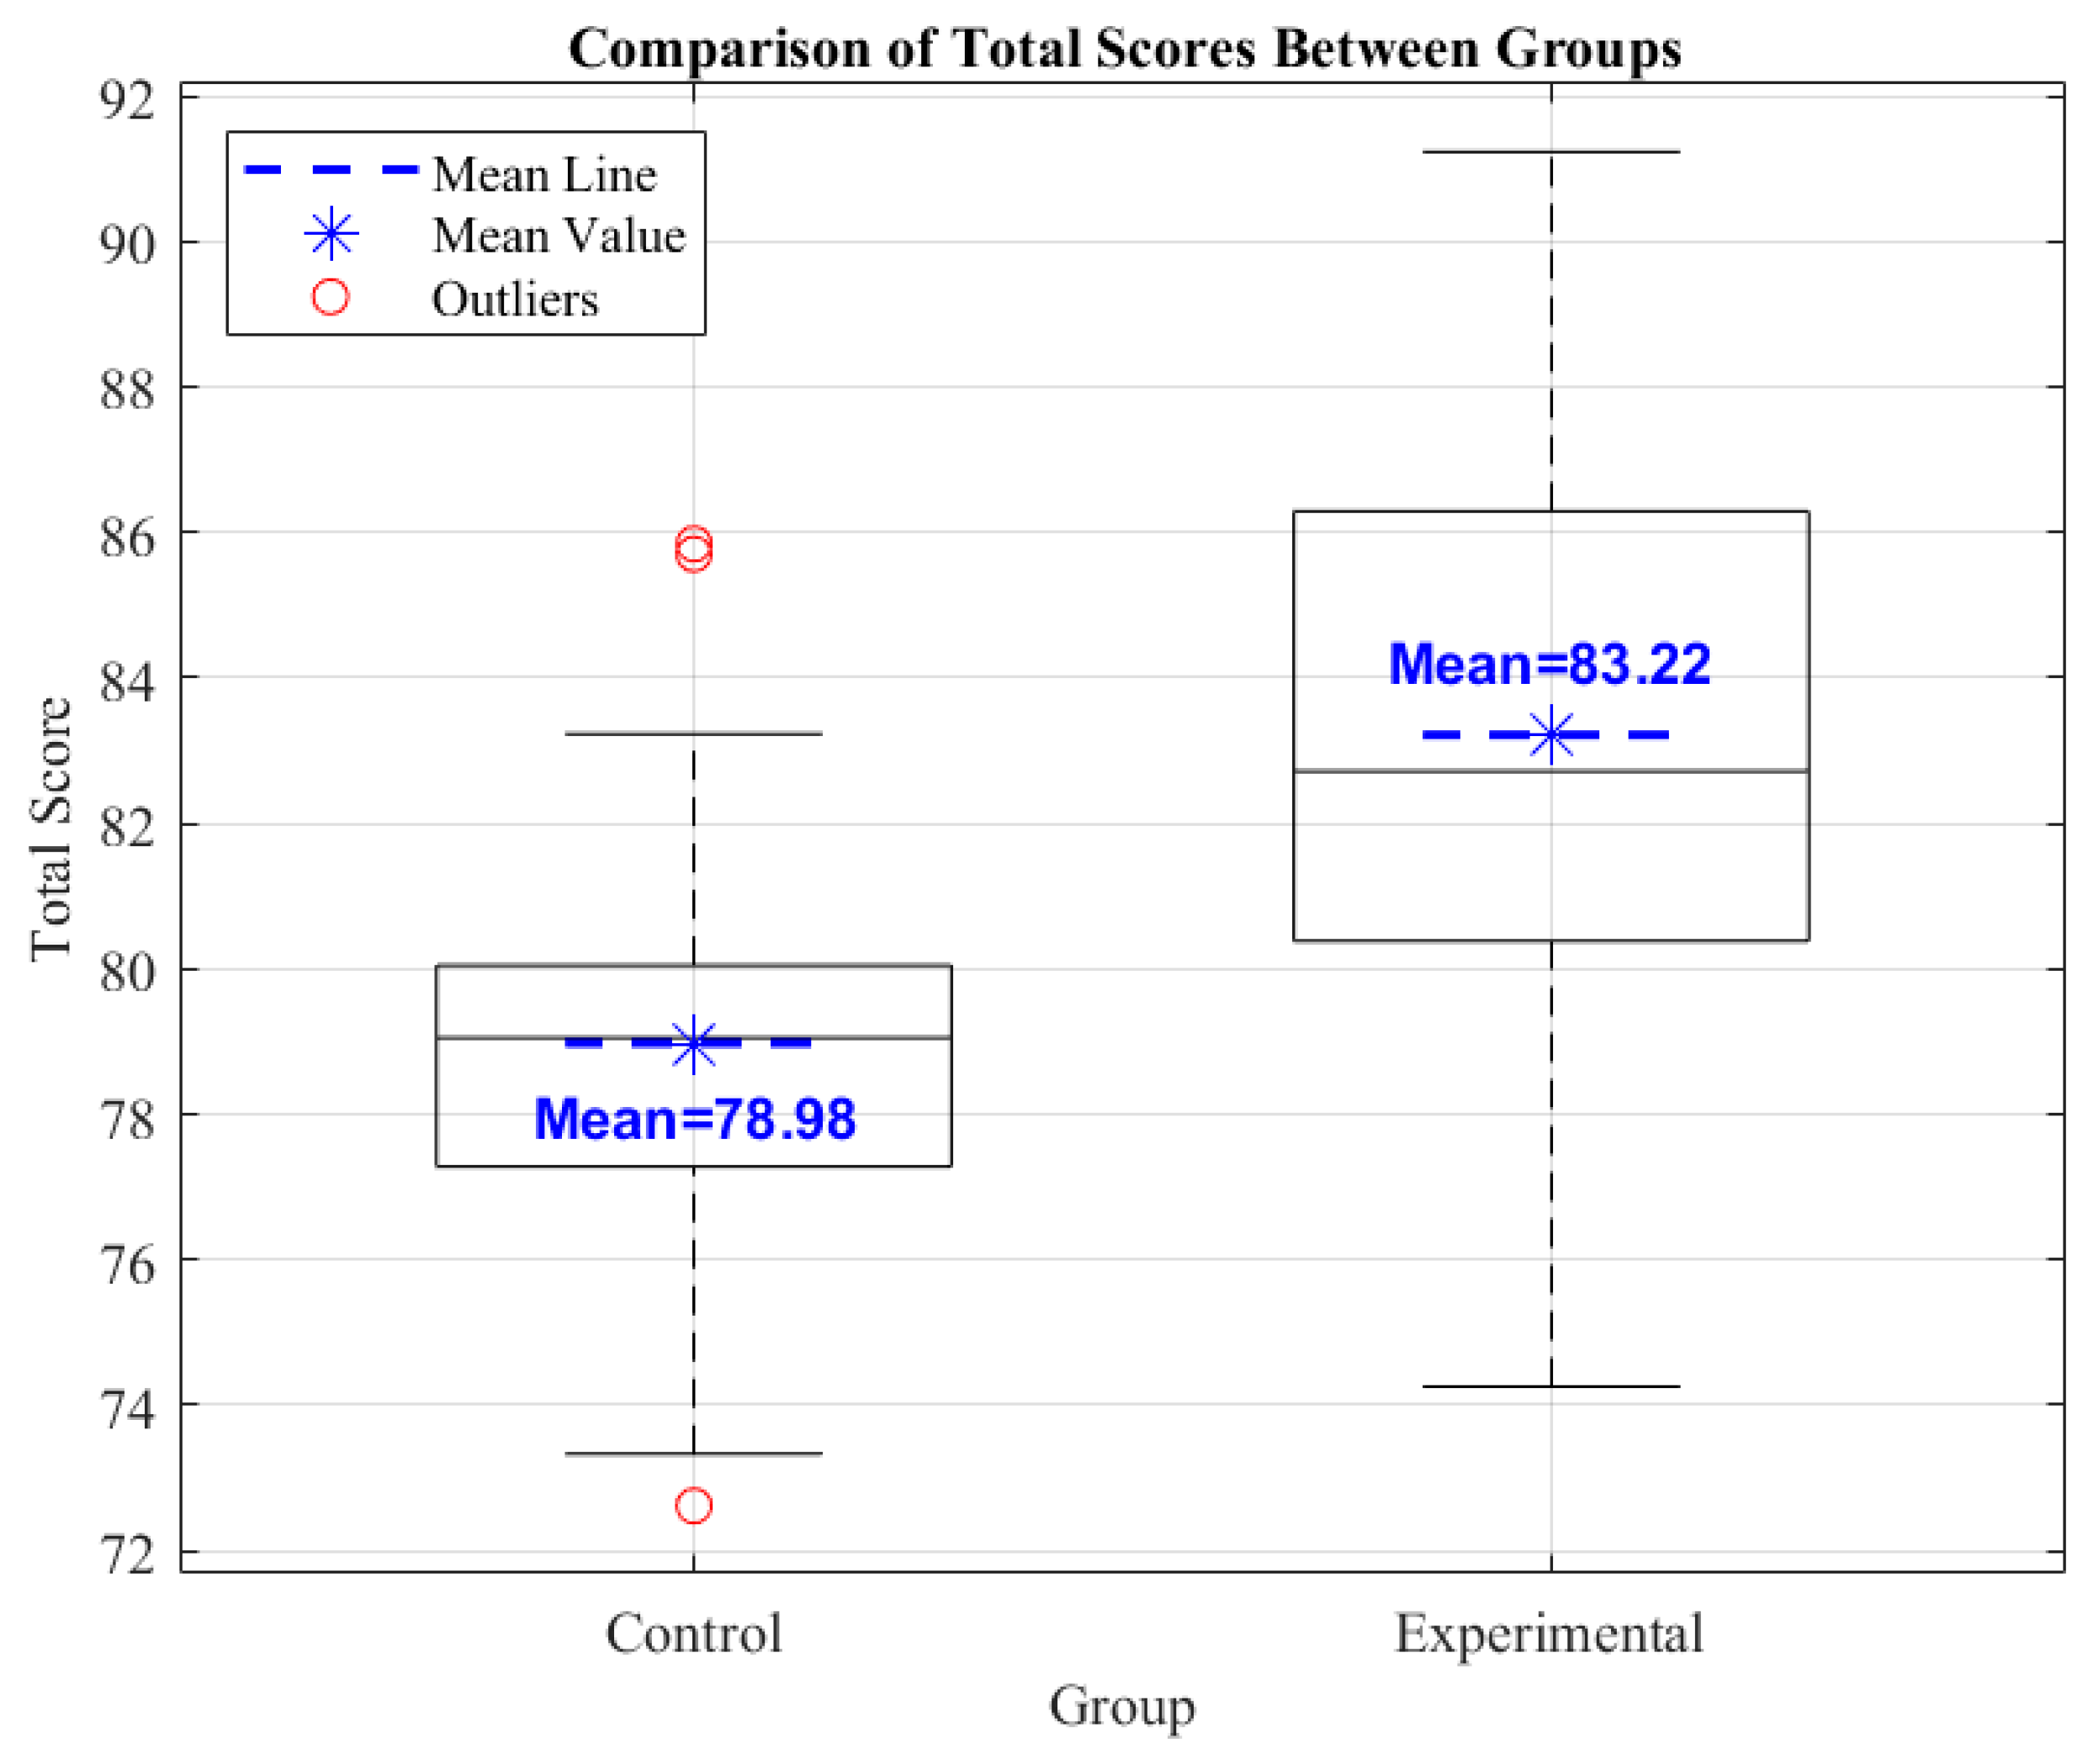
5.4. Data Analysis
5.4.1. Questionnaire Analysis
5.4.2. Correlation Analysis Between Simulation Platform and Objective Teaching Effect Improvement
5.5. Cross-Scenario Universality and Feasibility Analysis of Large-Scale Application
6. Conclusions and Prospects
Author Contributions
Funding
Institutional Review Board Statement
Informed Consent Statement
Data Availability Statement
Conflicts of Interest
References
- Li, W.; Duan, F.; Xu, C. Design and performance evaluation of a simple semi-physical human-vehicle collaborative driving simulation system. IEEE Access 2019, 7, 31971–31983. [Google Scholar] [CrossRef]
- Abboud, K.; Omar, H.A.; Zhuang, W. Interworking of DSRC and cellular network technologies for V2X communications: A survey. IEEE Trans. Veh. Technol. 2016, 65, 9457–9470. [Google Scholar] [CrossRef]
- Gyawali, S.; Xu, S.; Qian, Y.; Hu, R.Q. Challenges and solutions for cellular based V2X communications. IEEE Commun. Surv. Tutor. 2020, 23, 222–255. [Google Scholar] [CrossRef]
- Kaffash, S.; Nguyen, A.T.; Zhu, J. Big data algorithms and applications in intelligent transportation system: A review and bibliometric analysis. Int. J. Prod. Econ. 2021, 231, 107868. [Google Scholar] [CrossRef]
- Guevara, L.; Auat Cheein, F. The role of 5G technologies: Challenges in smart cities and intelligent transportation systems. Sustainability 2020, 12, 6469. [Google Scholar] [CrossRef]
- Cui, G.; Zhang, W.; Xiao, Y.; Yao, L.; Fang, Z. Cooperative perception technology of autonomous driving in the internet of vehicles environment: A review. Sensors 2022, 22, 5535. [Google Scholar] [CrossRef]
- Ma, Z.; Sun, S. Research on vehicle-to-road collaboration and end-to-end collaboration for multimedia services in the Internet of Vehicles. IEEE Access 2021, 10, 18146–18155. [Google Scholar] [CrossRef]
- Sun, E.; Chen, Z.; Cai, J. Cloud control platform of vehicle and road collaborative and its implementation on intelligent networked vehicles. In Proceedings of the 2021 IEEE International Conference on Emergency Science and Information Technology (ICESIT), Chongqing, China, 22–24 November 2021; pp. 274–276. [Google Scholar]
- Li, D.; Deng, L.; Cai, Z. Intelligent vehicle network system and smart city management based on genetic algorithms and image perception. Mech. Syst. Signal Process. 2020, 141, 106623. [Google Scholar] [CrossRef]
- Cao, D.; Wang, X.; Li, L.; Lv, C.; Na, X.; Xing, Y.; Li, X.; Li, Y.; Chen, Y.; Wang, F.-Y. Future directions of intelligent vehicles: Potentials, possibilities, and perspectives. IEEE Trans. Intell. Veh. 2022, 7, 7–10. [Google Scholar] [CrossRef]
- Shi, C.; Billinge, S.J. Teaching materials science and engineering students in the 21st century. Matter 2024, 7, 4130–4133. [Google Scholar] [CrossRef]
- Zhang, H.; Qi, Y.; Zhang, G.; Wang, D. Talent flow in China’s intelligent connected vehicle industry: Evidence from online resume mining. IEEE Trans. Eng. Manag. 2023, 71, 3510–3529. [Google Scholar] [CrossRef]
- Wang, Y.; Lu, G.; Yu, H. Traffic engineering considering cooperative vehicle infrastructure system. Strateg. Study Chin. Acad. Eng. 2018, 20, 106–110. [Google Scholar] [CrossRef]
- Chai, Z.; Nie, T.; Becker, J. Autonomous Driving Changes the Future; Springer: Berlin/Heidelberg, Germany, 2021. [Google Scholar]
- Wang, Z.; Han, K.; Han, P. Motion estimation of connected and automated vehicles under communication delay and packet loss of V2X communications. arXiv 2021, arXiv:2101.07756. [Google Scholar]
- Nguyen, H.T.; Rahim, N.A.; Guan, Y.L.; Pesch, D. Cellular V2X communications in the presence of big vehicle shadowing: Performance analysis and mitigation. IEEE Trans. Veh. Technol. 2022, 72, 3764–3776. [Google Scholar] [CrossRef]
- Wang, L.; Zhao, J.; Xiao, M.; Liu, J. Predicting Lane Change and Vehicle Trajectory With Driving Micro-Data and Deep Learning. IEEE Access 2024, 12, 106432–106446. [Google Scholar] [CrossRef]
- Gao, Y.; Hu, A.; Xiao, Y. Research-Oriented Online Laboratory Design on 5G-V2X Latency Measurements, Modeling and Optimization in the Campus Environment. In Proceedings of the 2024 IEEE Global Engineering Education Conference (EDUCON), Kos Island, Greece, 8–11 May 2024; pp. 1–10. [Google Scholar]
- Kaliannan, M.; Chandran, S.D. Empowering students through outcome-based education (OBE). Res. Educ. 2012, 87, 50–63. [Google Scholar] [CrossRef]
- Day, C.; Gu, Q.; Sammons, P. The impact of leadership on student outcomes: How successful school leaders use transformational and instructional strategies to make a difference. Educ. Adm. Q. 2016, 52, 221–258. [Google Scholar] [CrossRef]
- Wang, C.H.; Shannon, D.M.; Ross, M.E. Students’ characteristics, self-regulated learning, technology self-efficacy, and course outcomes in online learning. Distance Educ. 2013, 34, 302–323. [Google Scholar] [CrossRef]
- Holzberger, D.; Philipp, A.; Kunter, M. How Teachers’ Self-Efficacy Is Related to Instructional Quality: A Longitudinal Analysis. J. Educ. Psychol. 2013, 105, 774–786. [Google Scholar] [CrossRef]
- Hu, K.; Ma, R.-J.; Ma, C.; Zheng, Q.-K.; Sun, Z.-G. Comparison of the BOPPPS model and traditional instructional approaches in thoracic surgery education. BMC Med. Educ. 2022, 22, 447. [Google Scholar] [CrossRef]
- Ma, X.; Ma, X.; Li, L.; Luo, X.; Zhang, H.; Liu, Y. Effect of blended learning with BOPPPS model on Chinese student outcomes and perceptions in an introduction course of health services management. AJP Adv. Physiol. Educ. 2021, 45, 409–417. [Google Scholar] [CrossRef] [PubMed]
- Fu, Z.; Lin, Z.; Zhang, T. Assessing the Active Learning in Engineering Education Based on BOPPPS Model. In Proceedings of the 2018 ASEE Annual Conference & Exposition, Salt Lake City, UT, USA, 24–27 June 2018. [Google Scholar]
- Zumrawi, A.A.; Macfadyen, L.P. Proposed metrics for summarizing student evaluation of teaching data from balanced Likert scale surveys. Cogent Educ. 2023, 10, 2254665. [Google Scholar] [CrossRef]
- Li, S.; Wang, C.; Wang, Y. Fuzzy evaluation model for physical education teaching methods in colleges and universities using artificial intelligence. Sci. Rep. 2024, 14, 4788. [Google Scholar] [CrossRef]
- Krieglstein, F.; Beege, M.; Rey, G.D.; Ginns, P.; Krell, M.; Schneider, S. A Systematic Meta-analysis of the Reliability and Validity of Subjective Cognitive Load Questionnaires in Experimental Multimedia Learning Research. Educ. Psychol. Rev. 2022, 34, 2485–2541. [Google Scholar] [CrossRef]
- Nemoto, T.; Beglar, D. Likert-scale questionnaires. In JALT 2013 Conference Proceedings; JALT: Tokyo, Japan, 2014; Volume 108, pp. 1–6. [Google Scholar]
- Ivanov, O.A.; Ivanova, V.V.; Saltan, A.A. Likert-scale questionnaires as an educational tool in teaching discrete mathematics. Int. J. Math. Educ. Sci. Technol. 2018, 49, 1110–1118. [Google Scholar] [CrossRef]
- Nardi, P.M. Doing Survey Research: A Guide to Quantitative Methods; Routledge: Oxfordshire, UK, 2018. [Google Scholar]
- Cho, E.; Kim, S. Cronbach’s coefficient alpha: Well known but poorly understood. Organ. Res. Methods 2015, 18, 207–230. [Google Scholar] [CrossRef]


| Dimension | V2X HIL Simulation Platform | CARLA | SUMO | Modular Robotics |
|---|---|---|---|---|
| Cost | Moderate (hardware sandbox + commercial sensors, no high-performance GPU required) | High (GPU-dependent rendering, high hardware costs) | Low (pure software, open-source) | Low to moderate (hardware kits + basic sensors) |
| Scalability | High (supports dynamic scenario injection, multi-protocol extension, customizable road networks) | Moderate (relies on predefined 3D maps, requires programming for scenario expansion) | High (flexible traffic flow models but lacks vehicle control interfaces) | Low (limited by fixed kit modules) |
| Environmental Fidelity | High (1:15 physical sandbox + high-precision positioning, supports multi-sensor fusion) | Very high (high-fidelity 3D environment, precise physics engine) | Low (abstract traffic flow, no 3D visualization) | Low (simplified physics models, no traffic interaction) |
| Communication Realism | High (supports V2V/V2I/V2N protocols, simulates latency/interference) | Moderate (requires plugins for V2X simulation, no hardware link) | None (traffic flow simulation only) | Low (basic wireless communication, no V2X protocol support) |
| Pedagogical Suitability | High (layered experiment design, fault injection modules, teaching manuals) | Moderate (suited for algorithm research, lacks teaching resources and templates) | Moderate (suited for traffic engineering theory) | Moderate (suited for basic programming and control) |
| Learning Outcomes | Excellent (hardware–software synergy, intuitive understanding of full-chain vehicle–road collaboration) | Good (focuses on autonomous driving algorithms, requires advanced programming skills) | Moderate (macroscopic traffic analysis, lacks hands-on practice) | Moderate (basic robot control, no V2X scenarios) |
| Serial Number | Experiment Name | Experiment Content | Experiment Purpose |
|---|---|---|---|
| Experiment 1 | Data Communication Experiment | Based on different communication protocols, OBU of intelligent miniature vehicle, roadside equipment (RSU, MEC, Camera, radar), ETC and other equipment are connected to the cloud server for “human–vehicle–road” data exchange and communication, and the scheduled control functions and experiments are completed according to the communication content. | Enable students to master the communication protocols and data structure characteristics of the vehicle–road collaborative system. Cultivate students’ abilities in innovation, leadership and teamwork. |
| Experiment 2 | Traffic flow simulation experiment | Set different traffic flows, obtain the information interaction between vehicles (real-time location sharing, speed coordination, obstacle avoidance decision-making, etc.) and traffic lights, V2X roadside units and other infrastructure through the cloud control platform, observe and analyze the changing rules of traffic flow, such as the formation and dissipation of congestion, vehicle speed distribution, etc. | To enable students to understand the changing rules of traffic flow in an intelligent traffic environment and the role of V2X technology in improving traffic safety and efficiency. Cultivate students’ innovative ability, hands-on ability and independent thinking ability. |
| Experiment 3 | V2X Safety experiment | Through reasonable settings for different traffic scenarios and traffic signal periods, the safety performance of the autonomous driving module and V2X system, such as collision avoidance, emergency braking, vehicle stability and network security, is tested. | Enabling students to master the methods of independently designing experimental schemes, setting up experimental environments, and collecting and analyzing data in different traffic scenarios will help cultivate students’ hands-on ability and independent thinking ability. |
| Experiment 4 | Environmental Awareness Experiment | Collect perception data from intelligent vehicle cameras, radar and other sensors and conduct data fusion to dynamically perceive the driving environment of the intelligent miniature vehicles and provide digital driving decision information for those vehicles. | Enable students to master the general method of sensor information fusion, and be familiar with the general AI deep learning model. Cultivate students’ innovative ability, hands-on ability and teamwork ability. |
| Experiment 5 | Intelligent vehicle path planning experiment | Based on the high-precision map data of the V2X semi-physical simulation platform, different path planning algorithms are used to calculate a collision-free path from the starting point to the destination point under different cost function constraints, and the path optimization is carried out according to real-time traffic information and vehicle technical conditions. | Enable students to master the modeling and practical application ability of common path search algorithms such as A* and Dijkstra. Cultivate students’ abilities in innovation, leadership and teamwork. |
| Experiment 6 | Vehicle decision control experiment | Based on multi-source sensor data fusion parameters, the expected driving path of the intelligent miniature car is generated, and the corresponding control signal is sent to the controller to ensure that the intelligent miniature vehicle can complete the automatic driving task under the premise of safety and efficiency. | Enable students to master the basic theories and methods of automatic driving decision planning and control, such as polynomial path planning theory, PID control technology, etc. Cultivate students’ abilities in innovation, leadership and teamwork. |
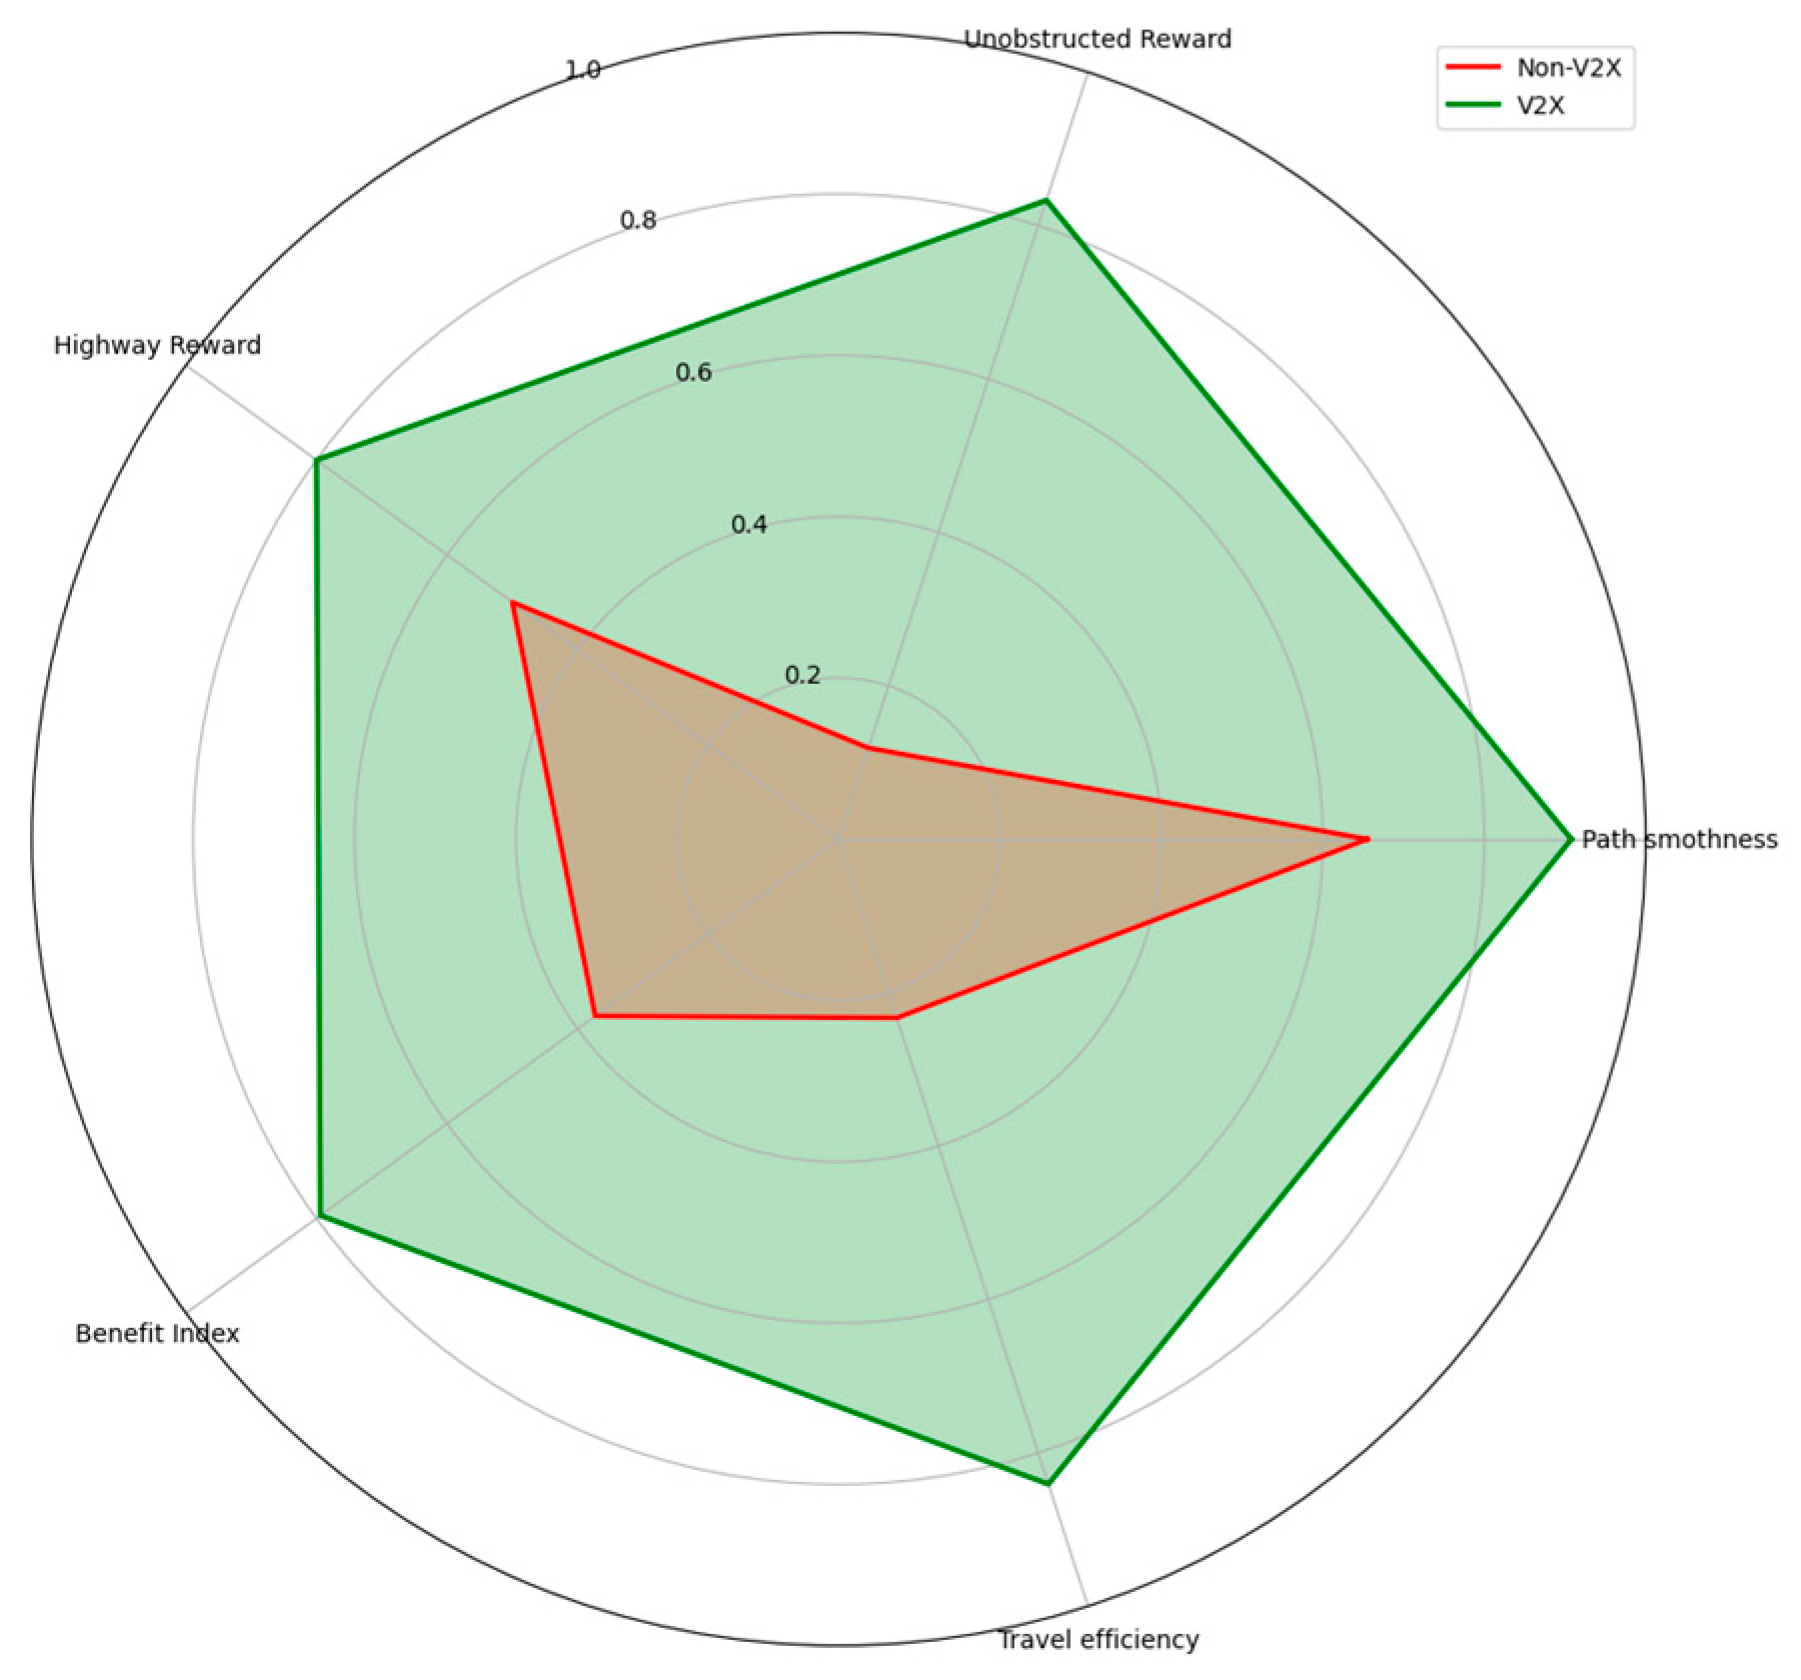
| Group | Path Length | Number of Red Lights Passed | Red Light Waiting Time | Road Type | Base Speed Limit | Dynamic Traffic Flow Impact | Total Travel Time |
|---|---|---|---|---|---|---|---|
| Non-V2X | 9.3 m | 3 | 7 + 4 + 5 = 16 s | Urban road | 0.8 m/s | Real-time congestion | 27.63 s |
| V2X | 12.9 m | 0 | 0 s | Highway | 2.5 m/s | Unobstructed | 5.16 s |
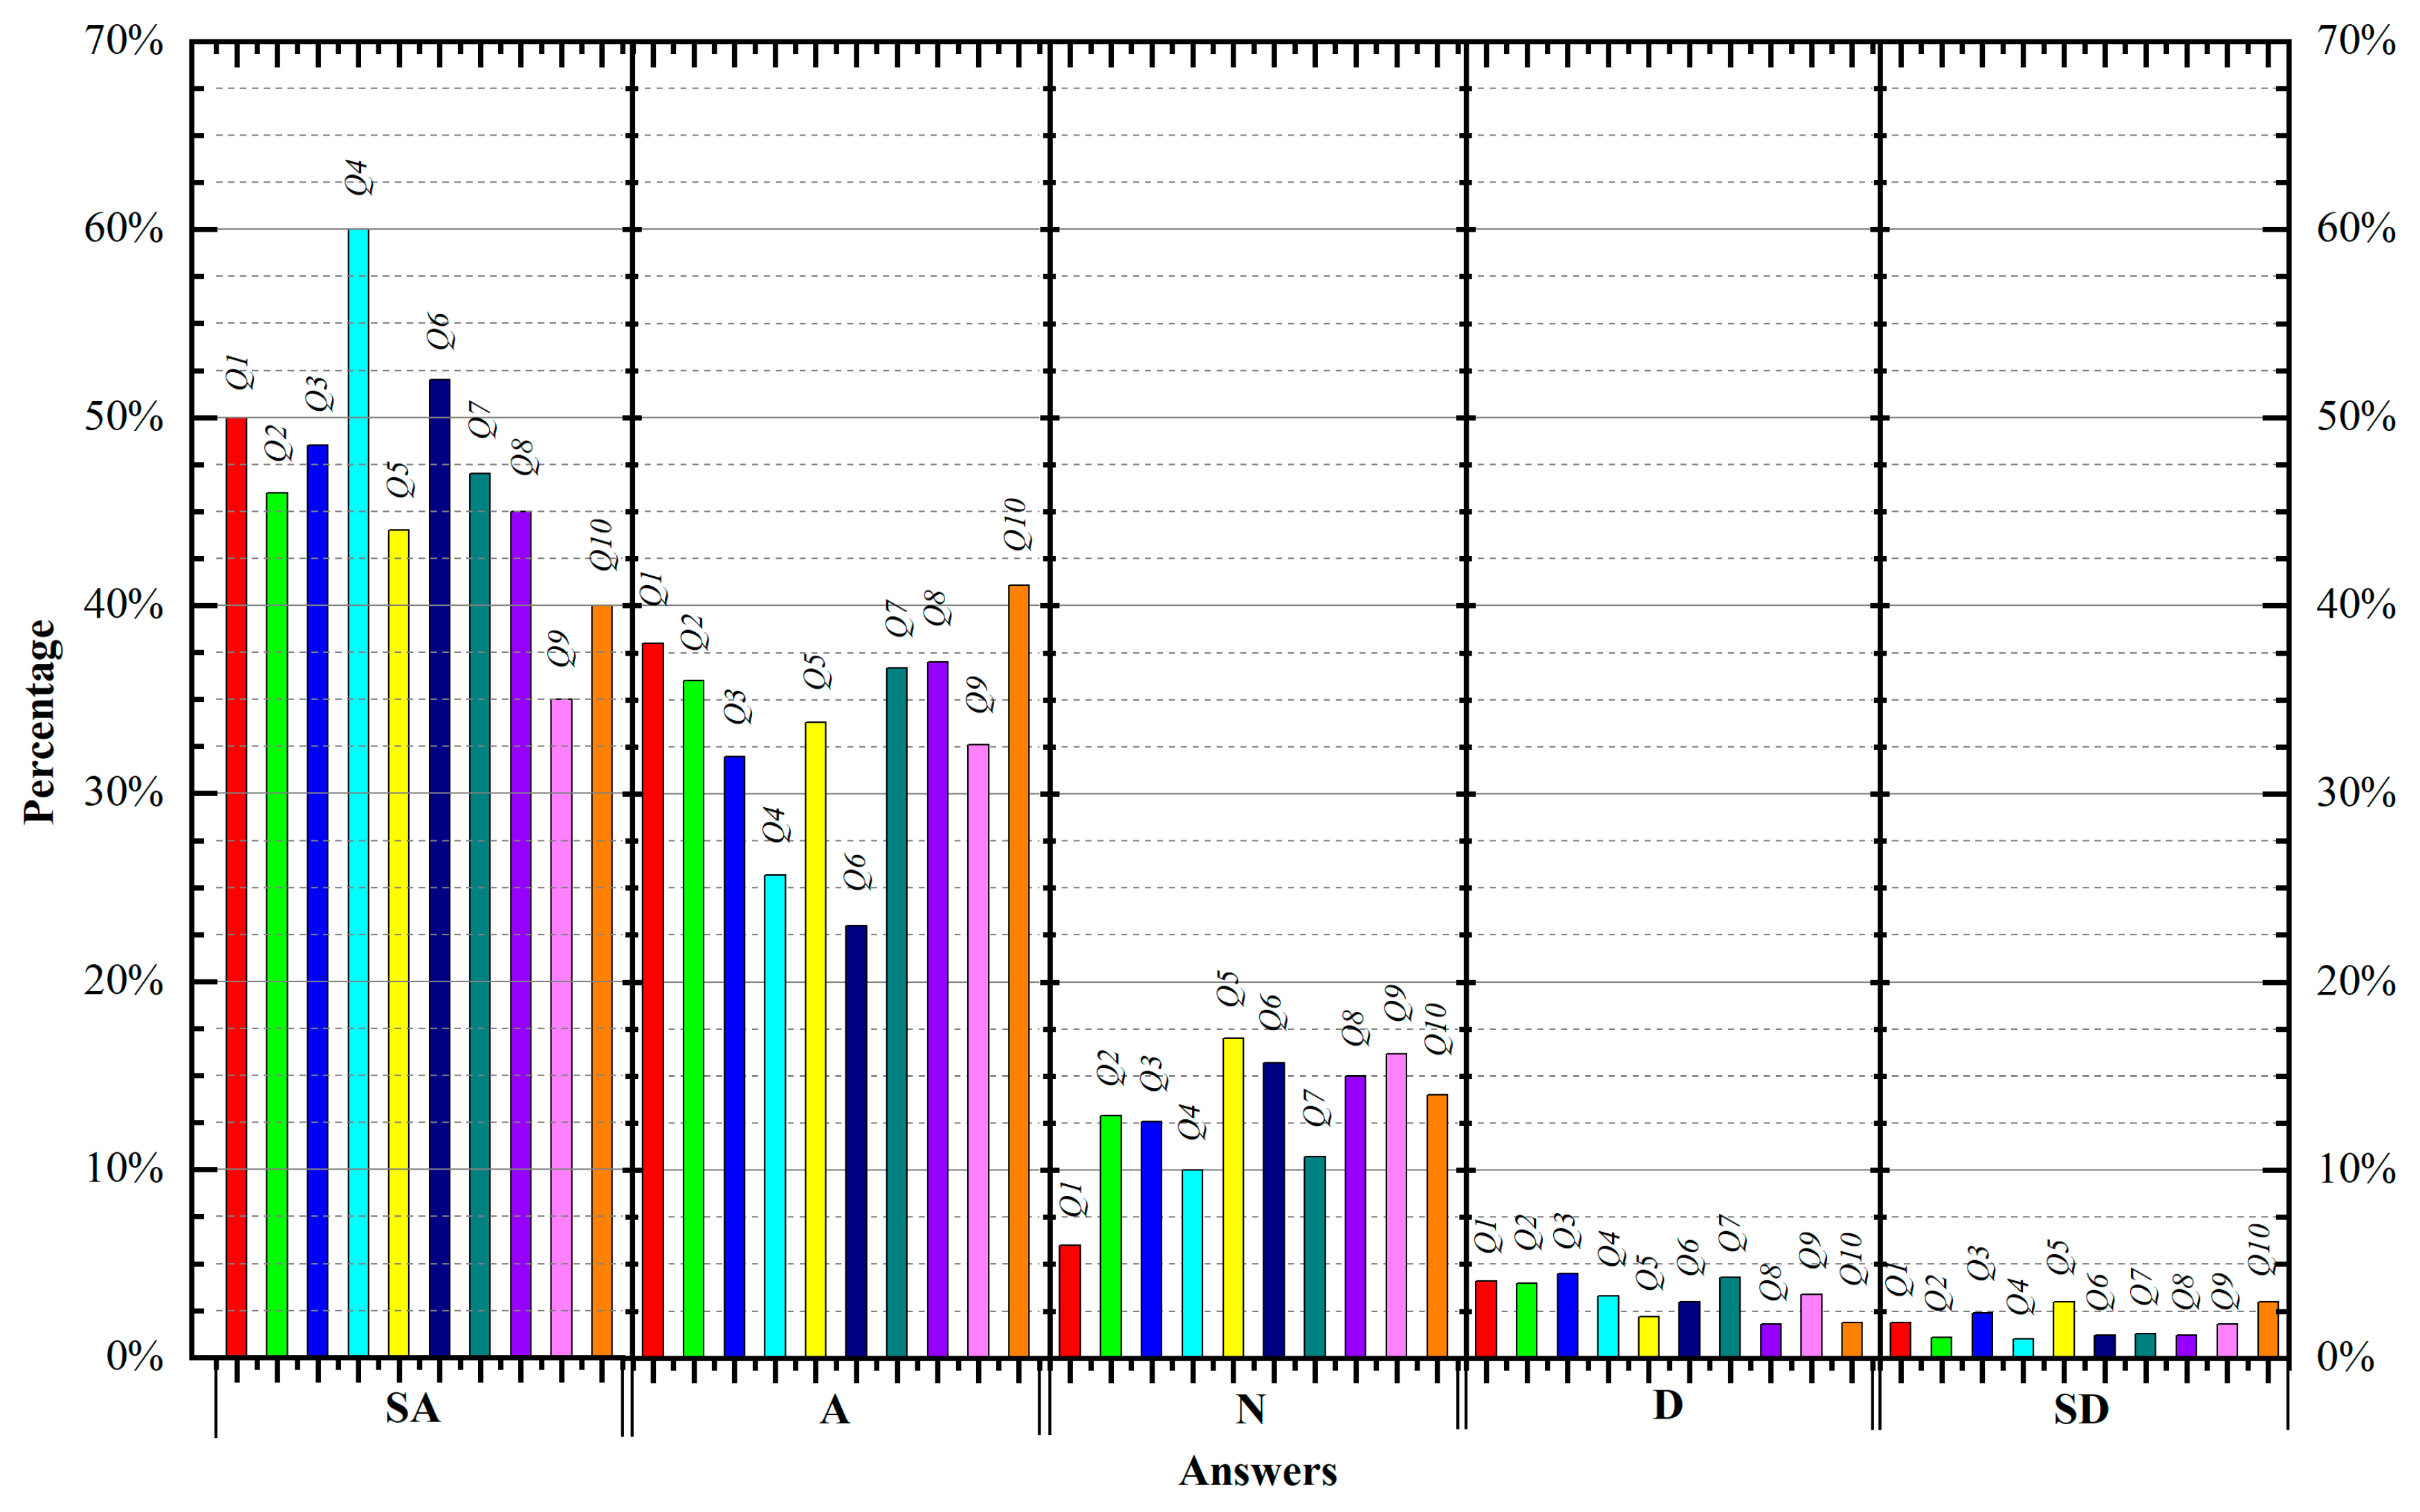
| Items | Questions About the Platform and Learning Effectiveness | Answers | ||||
|---|---|---|---|---|---|---|
| SA | A | N | D | SD | ||
| Q1 | Compared with traditional teaching methods, experimental courses based on the simulation platform enhance the understanding of new technologies in the field of vehicle–road collaboration | |||||
| Q2 | Compared with traditional teaching methods, the simulation platform stimulates students’ learning interest in vehicle–road collaboration technology | |||||
| Q3 | Compared with traditional teaching methods, the simulation platform improves students’ theoretical knowledge and application ability in the field of vehicle–road collaboration | |||||
| Q4 | Compared with traditional teaching methods, the simulation platform greatly increases the number of experimental projects that can be carried out | |||||
| Q5 | Compared with traditional teaching methods, the simulation platform significantly improves the safety of the teaching process | |||||
| Q6 | The hardware and software configuration of the simulation platform covers all the key knowledge points in the field of vehicle–road collaboration | |||||
| Q7 | Compared with traditional teaching methods, experimental courses based on simulation platforms make knowledge easier to understand and accept | |||||
| Q8 | Compared with traditional teaching methods, the teaching concept and course organization form based on the simulation platform are more reasonable and scientific | |||||
| Q9 | Compared with traditional teaching methods, students have a greater sense of participation, interaction and achievement in the teaching process | |||||
| Q10 | Compared with traditional teaching methods, the teaching results of experimental courses are more in line with pre-class teaching goal setting and effect orientation | |||||
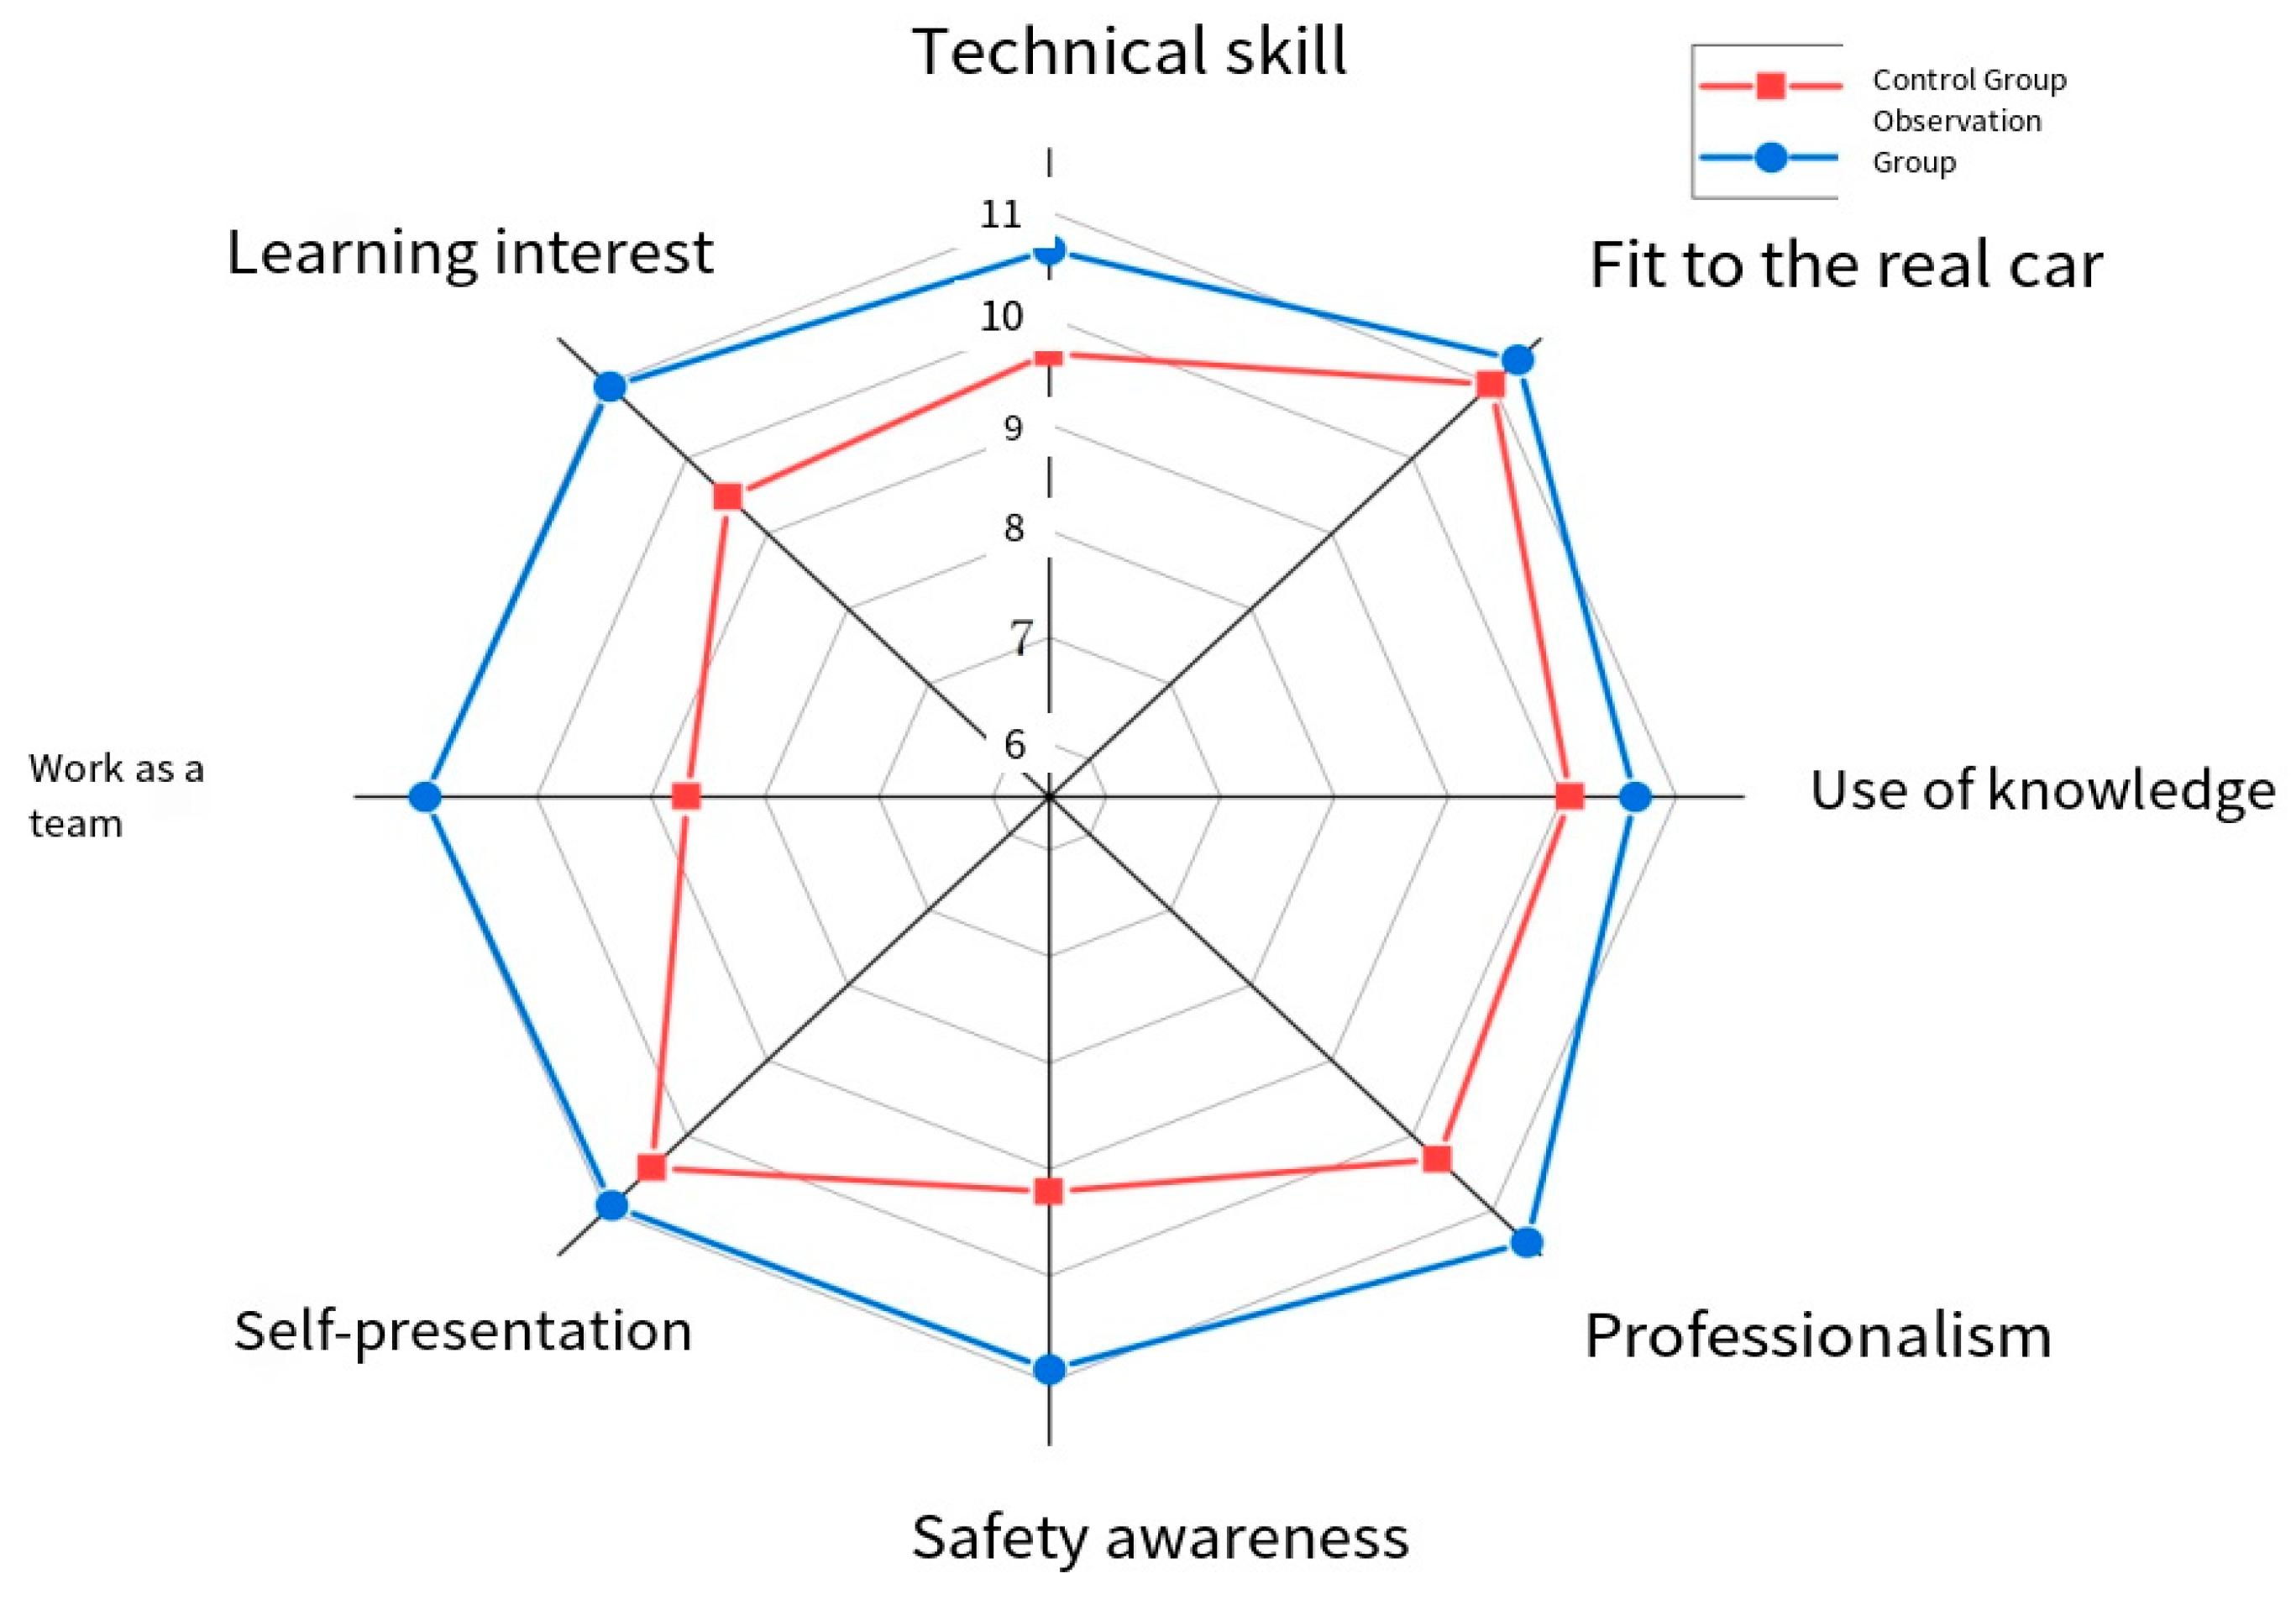
| Features | Experimental Skills | Innovation Awareness | Knowledge Application | Professionalism | Safety Awareness | Self-Presentation | Teamwork | Learning Interest | Total Points |
|---|---|---|---|---|---|---|---|---|---|
| Control group | |||||||||
| Pre-class grades | 9.67 | 8.98 | 9.07 | 8.32 | 9.21 | 10.43 | 8.68 | 9.48 | 73.84 |
| Process-class grades | 9.23 | 8.52 | 11.35 | 8.96 | 10.10 | 8.73 | 9.87 | 8.67 | 75.43 |
| Post-class grades | 9.45 | 9.54 | 9.89 | 8.28 | 9.90 | 10.16 | 8.34 | 8.84 | 74.40 |
| Total points | 9.38 | 9.08 | 10.39 | 8.56 | 9.91 | 9.62 | 8.99 | 8.84 | 74.76 |
| Observation group | |||||||||
| Pre-class grades | 11.43 | 11.98 | 10.12 | 12.42 | 10.28 | 10.99 | 12.13 | 12.36 | 91.71 |
| Process-class grades | 11.21 | 10.56 | 11.07 | 10.85 | 11.30 | 11.15 | 11.83 | 11.52 | 89.49 |
| Post-class grades | 10.03 | 11.77 | 10.40 | 11.68 | 10.67 | 10.74 | 10.07 | 10.22 | 85.58 |
| Total points | 10.64 | 11.31 | 10.64 | 11.42 | 10.88 | 10.93 | 10.98 | 10.95 | 87.76 |
| Features | Experimental Skills | Innovation Awareness | Knowledge Application | Professionalism | Safety Awareness | Self-Presentation | Teamwork | Learning Interest | Total Points |
|---|---|---|---|---|---|---|---|---|---|
| Scale mean after deleting items | 9.78 | 9.95 | 10.45 | 10.20 | 9.78 | 10.11 | 8.96 | 9.66 | Control group |
| 10.89 | 11.44 | 10.53 | 11.65 | 10.75 | 10.96 | 11.34 | 11.37 | Observation group | |
| Scale variance after deleting items | 0.16 | 1.72 | 0.63 | 1.36 | 0.22 | 1.56 | 0.65 | 0.86 | Control group |
| 0.57 | 0.59 | 0.24 | 0.62 | 0.27 | 0.04 | 1.24 | 1.16 | Observation group | |
| Revised item and total correlation | 0.65 | 0.70 | 0.71 | 0.62 | 0.74 | 0.69 | 0.66 | 0.70 | Control group |
| 0.72 | 0.82 | 0.76 | 0.83 | 0.79 | 0.70 | 0.74 | 0.81 | Observation group | |
| Square multiple correlation | 0.74 | 0.68 | 0.65 | 0.72 | 0.70 | 0.61 | 0.67 | 0.69 | Control group |
| 0.82 | 0.72 | 0.85 | 0.78 | 0.82 | 0.74 | 0.86 | 0.78 | Observation group | |
| Cronbach coefficient after deleting the item | 0.74 | 0.64 | 0.77 | 0.83 | 0.77 | 0.69 | 0.72 | 0.86 | Control group |
| 0.78 | 0.71 | 0.94 | 0.91 | 0.72 | 0.90 | 0.89 | 0.86 | Observation group | |
| Overall Cronbach coefficient of the scale | 0.78 | Control group | |||||||
| 0.85 | Observation group | ||||||||
Disclaimer/Publisher’s Note: The statements, opinions and data contained in all publications are solely those of the individual author(s) and contributor(s) and not of MDPI and/or the editor(s). MDPI and/or the editor(s) disclaim responsibility for any injury to people or property resulting from any ideas, methods, instructions or products referred to in the content. |
© 2025 by the authors. Published by MDPI on behalf of the World Electric Vehicle Association. Licensee MDPI, Basel, Switzerland. This article is an open access article distributed under the terms and conditions of the Creative Commons Attribution (CC BY) license (https://creativecommons.org/licenses/by/4.0/).
Share and Cite
Wang, L.; Zhang, H.; Huang, Y.; Liu, J.; Ji, K.; Shi, B. Application Research of a V2X Semi-Physical Simulation Platform in Vehicle–Road Collaboration Experiments. World Electr. Veh. J. 2025, 16, 304. https://doi.org/10.3390/wevj16060304
Wang L, Zhang H, Huang Y, Liu J, Ji K, Shi B. Application Research of a V2X Semi-Physical Simulation Platform in Vehicle–Road Collaboration Experiments. World Electric Vehicle Journal. 2025; 16(6):304. https://doi.org/10.3390/wevj16060304
Chicago/Turabian StyleWang, Lei, Heng Zhang, Yue Huang, Jian Liu, Kaixuan Ji, and Bohao Shi. 2025. "Application Research of a V2X Semi-Physical Simulation Platform in Vehicle–Road Collaboration Experiments" World Electric Vehicle Journal 16, no. 6: 304. https://doi.org/10.3390/wevj16060304
APA StyleWang, L., Zhang, H., Huang, Y., Liu, J., Ji, K., & Shi, B. (2025). Application Research of a V2X Semi-Physical Simulation Platform in Vehicle–Road Collaboration Experiments. World Electric Vehicle Journal, 16(6), 304. https://doi.org/10.3390/wevj16060304