
Evaluating Carbon Emissions: A Lifecycle Comparison Between Electric and Conventional Vehicles

 ,
,  ,
,  , , and
Abstract
1. Introduction
2. Literature Review on Carbon Emissions Related to Conventional Cars and Electric Cars
2.1. Carbon Footprint of Battery Material
2.2. Carbon Footprint (CF) of Battery Manufacturing
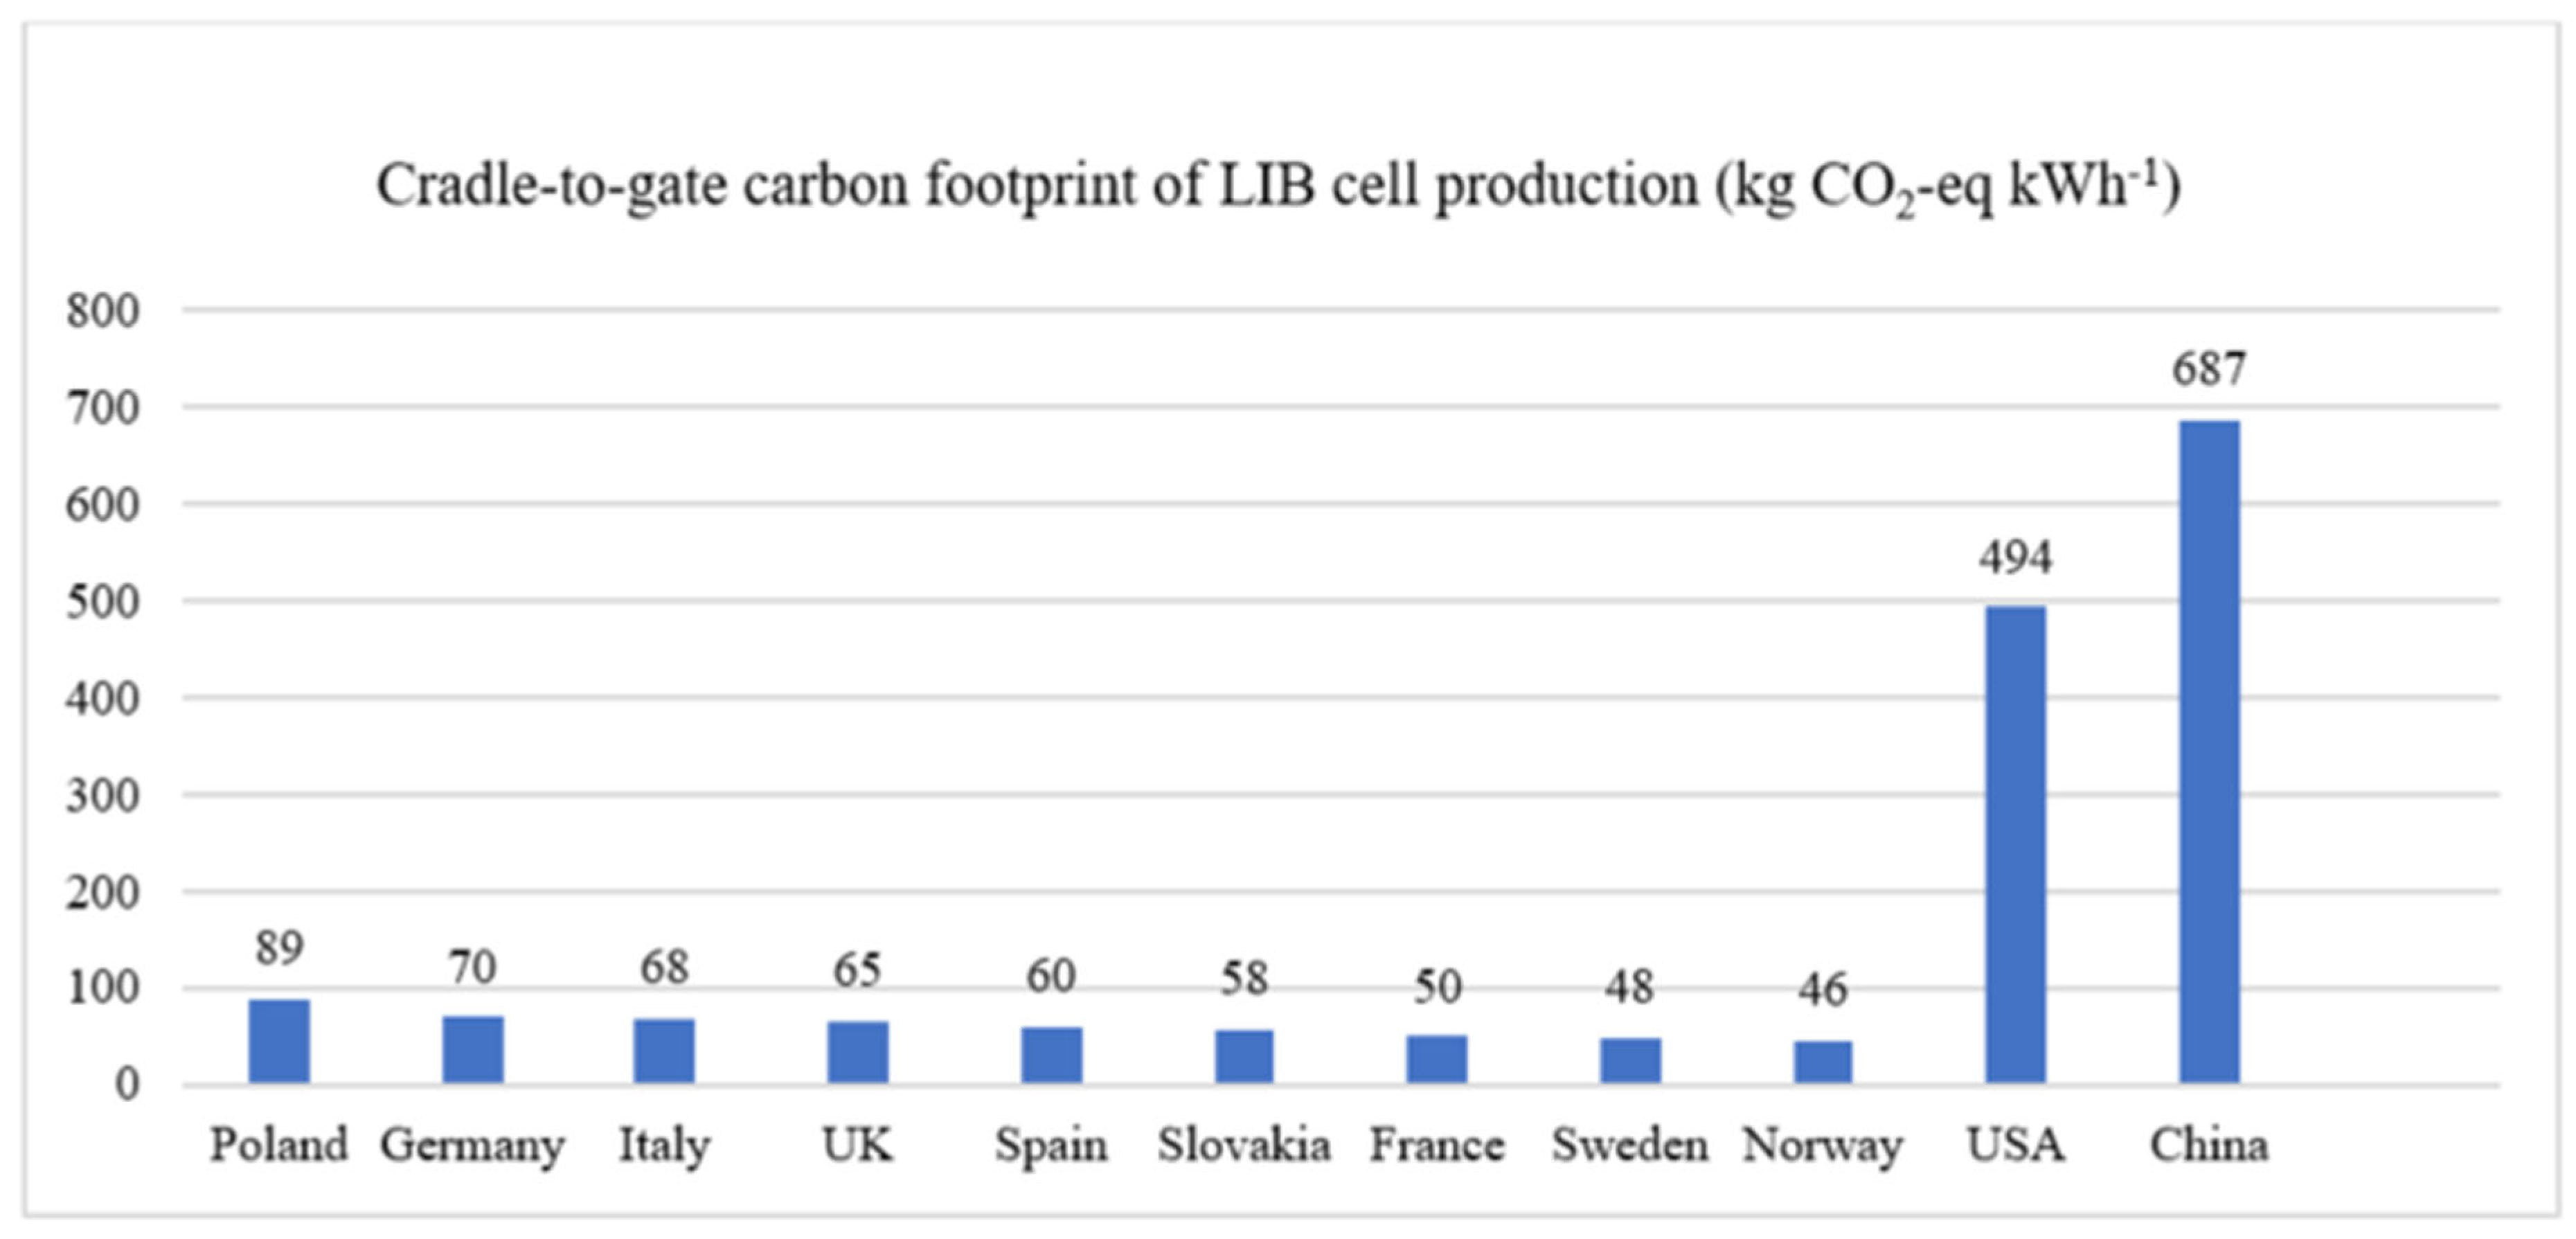
2.3. Cradle-to-Gate Carbon Footprint of LIBs
3. Methodology and Formulation of the Case Study
Sensitivity Analysis
4. Results and Recommendations
5. Conclusions
Author Contributions
Funding
Institutional Review Board Statement
Informed Consent Statement
Data Availability Statement
Conflicts of Interest
References
- Richter, F. Global Electric Car Sales Doubled in 2021, 15 February 2022. Available online: https://www.statista.com/chart/26845/global-electric-car-sales/ (accessed on 8 May 2025).
- IEA. Global EV Outlook 2020, Entering the Decade of Electric Drive? 2020. Available online: https://iea.blob.core.windows.net/assets/af46e012-18c2-44d6-becd-bad21fa844fd/Global_EV_Outlook_2020.pdf (accessed on 3 April 2024).
- EEA. Average CO2 Emissions from New Passenger Cars and Future Targets, European Environment Agency, 9 January 2024. Available online: https://www.eea.europa.eu/data-and-maps/daviz/average-co2-emissions-from-new-1#tab-chart_1 (accessed on 4 April 2024).
- EEA. New Registrations of Electric Cars in EU-27, European Environment Agency. 3 July 2023. Available online: https://www.eea.europa.eu/en/analysis/indicators/new-registrations-of-electric-vehicles/new-registration-of-electric-cars-eu-27 (accessed on 4 April 2024).
- Safarian, S. Environmental and energy impacts of battery electric and conventional vehicles: A study in Sweden under recycling scenarios. Fuel Commun. 2022, 14, 100083. [Google Scholar] [CrossRef]
- Verma, S.; Dwivedi, G.; Verma, P. Life cycle assessment of electric vehicles in comparison to combustion engine vehicles: A review. Mater. Today Proc. 2022, 49, 217–222. [Google Scholar] [CrossRef]
- Helmers, E.; Dietz, J.; Weiss, M. Sensitivity Analysis in the Life-Cycle Assessment of Electric vs. Combustion Engine Cars under Approximate Real-World Conditions. Sustainability 2020, 12, 1241. [Google Scholar] [CrossRef]
- Koroma, M.S.; Costa, D.; Philippot, M.; Cardellini, G.; Hosen, M.S.; Coosemans, T.; Messagie, M. Life cycle assessment of battery electric vehicles: Implications of future electricity mix and different battery end-of-life management. Sci. Total Environ. 2022, 831, 154859. [Google Scholar] [CrossRef]
- Winjobi, O.; Dai, Q.; Kelly, J. Update of Bill-of-Materials and Cathode Chemistry addition for Lithium-ion Batteries in GREET; Systems Assessment Group, Argonne National Laboratory: Chicago, IL, USA, 2020. [Google Scholar]
- European Parliament. Regulation (EU) 2023/1542 of the European Parliament and of the Council of 12 July 2023 Concerning Batteries and Waste Batteries, Amending Directive 2008/98/EC and Regulation (EU) 2019/1020 and Repealing Directive 2006/66/EC (Text with EEA relevance), 28 July 2023. Available online: https://eur-lex.europa.eu/eli/reg/2023/1542/oj (accessed on 19 April 2024).
- Tytgat, J. The Road to Climate-Neutral EV Batteries: Opportunities and Regulatory Framework. In Proceedings of the 29th CIRP Conference on Life Cycle Engineering, Leuven, Belgium, 4–6 April 2022. [Google Scholar]
- Chen, Q.; Lai, X.; Gu, H.; Tang, X.; Gao, F.; Han, X.; Zheng, Y. Investigating carbon footprint and carbon reduction potential using a cradle-to-cradle LCA approach on lithium-ion batteries for electric vehicles in China. J. Clean. Prod. 2022, 369, 133342. [Google Scholar] [CrossRef]
- Lovins, A. Six Solutions to Battery Mineral Challenges, The Rocky Mountain Institute RMI, 2022. Available online: https://rmi.org/insight/six-solutions-to-battery-mineral-challenges/ (accessed on 20 April 2024).
- Abdelbaky, M.; Schwich, L.; Henriques, J.; Friedrich, B.; Peeters, J.R.; Dewulf, W. Global warming potential of lithium-ion battery cell production: Determining influential primary and secondary raw material supply routes. Clean. Logist. Supply Chain. 2023, 9, 100130. [Google Scholar] [CrossRef]
- Da Silva Lima, L.; Quartier, M.; Buchmayr, A.; Sanjuan-Delmás, D.; Laget, H.; Corbisier, D.; Mertens, J.; Dewulf, J. Life cycle assessment of lithium-ion batteries and vanadium redox flow batteries-based renewable energy storage systems. Sustain. Energy Technol. Assess. 2021, 46, 101286. [Google Scholar] [CrossRef]
- Lai, X.; Chen, Q.; Tang, X.; Zhou, Y.; Gao, F.; Guo, Y.; Bhagat, R.; Zheng, Y. Critical review of life cycle assessment of lithium-ion batteries for electric vehicles: A lifespan perspective. eTransportation 2022, 12, 100169. [Google Scholar] [CrossRef]
- United States Environmental Protection Agency. Understanding Global Warming Potentials. EPA. 27 March 2024. Available online: https://www.epa.gov/ghgemissions/understanding-global-warming-potentials (accessed on 26 April 2024).
- Kallitsis, E.; Korre, A.; Kelsall, G.; Kupfersberger, M.; Nie, Z. Environmental life cycle assessment of the production in China of lithium-ion batteries with nickel-cobalt-manganese cathodes utilising novel electrode chemistries. J. Clean. Prod. 2020, 254, 120067. [Google Scholar] [CrossRef]
- Phogat, P.; Rawat, S.; Dey, S.; Wan, M. Advancements and challenges in sodium-ion batteries: A comprehensive review of materials, mechanisms, and future directions for sustainable energy storage. J. Alloys Compd. 2025, 1020, 179544. [Google Scholar] [CrossRef]
- Zhao, L.; Zhang, T. Engineering of Sodium-Ion Batteries: Opportunities and Challenges. Engineering 2023, 24, 172–183. [Google Scholar] [CrossRef]
- Haynes, W.M. CRC Handbook of Chemistry and Physics; CRC Press: Boca Raton, FL, USA, 2016. [Google Scholar]
- Berg, E.J.; Villevieille, C.; Streich, D.; Trabesinger, S.; Novák, P. Rechargeable Batteries: Grasping for the Limits of Chemistry. J. Electrochem. Soc. 2015, 162, A2468. [Google Scholar] [CrossRef]
- Rudola, A.; Rennie, A.J.R.; Heap, R.; Meysami, S.S.; Lowbridge, A.; Mazzali, F.; Sayers, R.; Wright, C.J.; Barker, J. Commercialisation of high energy density sodium-ion batteries: Faradion’s journey and outlook. J. Mater. Chem. A 2021, 13, 8279–8302. [Google Scholar] [CrossRef]
- Xu, H.; Zhang, G.; Zhang, J.; Liu, J.; Peng, K. Comparative analysis of electrochemical properties and thermal behaviors of sodium ion and lithium ion batteries. Int. J. Electrochem. Sci. 2025, 20, 101027. [Google Scholar] [CrossRef]
- Zhang, S.; Steubing, B.; Potter, H.K.; Hansson, P.-A.; Nordberg, A. Future climate impacts of sodium-ion batteries. Resour. Conserv. Recycl. 2024, 202, 107362. [Google Scholar] [CrossRef]
- Kallitsis, E. Life-Cycle Modelling of Lithium-ion Batteries for Electric Vehicles; Imperial College London: London, UK, 2023. [Google Scholar]
- Chordia, M.; Nordelöf, A.; Ellingsen, L.A.-W. Environmental life cycle implications of upscaling lithium-ion battery production. Int. J. Life Cycle Assess. 2021, 26, 2024–2039. [Google Scholar] [CrossRef]
- CATL. CATL Unveiled its Carbon Neutrality Plan. 18 April 2023. Available online: https://www.catl.com/en/news/6014.html (accessed on 2 May 2024).
- Northvolt, A.B. Introducing Northvolt’s Sustainability Report 2021; Northvolt AB: Stockholm, Sweden, 2021. [Google Scholar]
- Tesla. Tesla Sustainability Report 2022; Tesla: Austin, TX, USA, 2022. [Google Scholar]
- Linder, M.; Nauclér, T.; Nekovar, S.; Pfeiffer, A.; Vekić, N. The Race to Decarbonize Electric-Vehicle Batteries, McKinsey & Company, 23 January 2023. Available online: https://www.mckinsey.com/industries/automotive-and-assembly/our-insights/the-race-to-decarbonize-electric-vehicle-batteries (accessed on 2 May 2024).
- Degen, F.; Winter, M.; Bendig, D.; Tübke, J. Energy consumption of current and future production of lithium-ion and post lithium-ion battery cells. Nat. Energy 2023, 8, 1284–1295. [Google Scholar] [CrossRef]
- Schenker, V.; Oberschelp, C.; Pfister, S. Regionalized life cycle assessment of present and future lithium production for Li-ion batteries. Resour. Conserv. Recycl. 2022, 187, 106611. [Google Scholar] [CrossRef]
- Chordia, M.; Wickerts, S.; Nordelöf, A.; Arvidsson, R. Life cycle environmental impacts of current and future battery-grade lithium supply from brine and spodumene. Resour. Conserv. Recycl. 2022, 187, 106634. [Google Scholar] [CrossRef]
- Norilsk Nickel. Norilsk Nickel ESG Presentation; NorNickel: Moscow, Russia, 2022. [Google Scholar]
- International Energy Agency. The Role of Critical Minerals in Clean Energy Transitions; IEA: Paris, France, 2021. [Google Scholar]
- Baars, J.; Domenech, T.; Bleischwitz, R.; Melin, H.E.; Heidrich, O. Circular economy strategies for electric vehicle batteries reduce reliance on raw materials. Nat. Sustain. 2021, 4, 71–79. [Google Scholar] [CrossRef]
- Zhang, T.; Bai, Y.; Shen, X.; Zhai, Y.; Ji, C.; Ma, X.; Hong, J. Cradle-to-gate life cycle assessment of cobalt sulfate production derived from a nickel–copper–cobalt mine in China. Int. J. Life Cycle Assess. 2021, 26, 1198–1210. [Google Scholar] [CrossRef]
- Engels, P.; Cerdas, F.; Dettmer, T.; Frey, C.; Hentschel, J.; Herrmann, C.; Mirfabrikikar, T.; Schueler, M. Life cycle assessment of natural graphite production for lithium-ion battery anodes based on industrial primary data. J. Clean. Prod. 2022, 336, 130474. [Google Scholar] [CrossRef]
- Surovtseva, D.; Crossin, E.; Pell, R.; Stamford, L. Toward a life cycle inventory for graphite production. Off. J. Int. Soc. Ind. Ecol. 2022, 26, 964–979. [Google Scholar] [CrossRef]
- Kallitsis, E.; Lindsay, J.J.; Chordia, M.; Wu, B.; Offer, G.J.; Edge, J.S. Think global act local: The dependency of global lithium-ion battery emissions on production location and material sources. J. Clean. Prod. 2024, 449, 141725. [Google Scholar] [CrossRef]
- Kelly, J.C.; Dai, Q.; Wang, M. Globally regional life cycle analysis of automotive lithium-ion nickel manganese cobalt batteries. Mitig. Adapt. Strategy Glob. Change 2020, 25, 371–396. [Google Scholar] [CrossRef]
- Guo, Z.; Peng, S.; Zhang, H.; Li, T. Life cycle carbon emissions of China’s passenger vehicle sector: A fleet-based study. Procedia CIRP 2024, 122, 67–72. [Google Scholar] [CrossRef]
- Mårtensson, H.B.; Hojer, M. Low emission scenarios with shared and electric cars: Analyzing life cycle emissions, biofuel use, battery utilization, and fleet development. Int. J. Sustain. Transp. 2024, 18, 115–133. [Google Scholar] [CrossRef]
- Shang, H.; Sun, Y.; Huang, D.; Meng, F. Life cycle assessment of atmospheric environmental impact on the large-scale promotion of electric vehicles in China. Resour. Environ. Sustain. 2024, 15, 100148. [Google Scholar] [CrossRef]
- Chen, L.; Ma, R. Clean energy synergy with electric vehicles: Insights into carbon footprint. Energy Strategy Rev. 2024, 53, 101394. [Google Scholar] [CrossRef]
- Soares, L.O.; Sodre, J.R.; Boloy, R.A.M. Lifecycle assessment and environmental impacts of hybrid electric vehicles fuelled by bioethanol and biogas. Renew. Sustain. Energy Rev. 2025, 216, 115652. [Google Scholar] [CrossRef]
- Yuan, H.; Ma, M.; Zhou, N.; Xie, H.; Ma, Z.; Xiang, X. Battery electric vehicle charging in China: Energy demand and emissions trends in the 2020s. Appl. Energy 2024, 365, 123153. [Google Scholar] [CrossRef]
- Hossain, M.N.; Hasan, M.M.; Habib, M.A.; Ferdous, F.B.; Rahman, S. Assessing economic viability and environmental impact of solar-powered EV charging station in Gazipur, Bangladesh: A case study. Sol. Compass 2024, 12, 100091. [Google Scholar] [CrossRef]
- Tozluoğlu, Ç.; Liao, Y.; Sprei, F. Potential of e-bikes to replace passenger car trips and reduce greenhouse gas emissions. J. Cycl. Micromobility Res. 2024, 2, 100043. [Google Scholar] [CrossRef]
- Manjong, N.B.; Usai, L.; Orangi, S.; Clos, D.P.; Strømman, A.H. Exploring raw material contributions to the greenhouse gas emissions of lithium-ion battery production. J. Energy Storage 2024, 100, 113566. [Google Scholar] [CrossRef]
- Tournaviti, M.; Michailidou, A.V.; Savva, C.; Vlachokostas, C. Bridging the gap between life cycle assessment and lithium-ion batteries for electrification of vehicles: A critical review towards unified frameworks. Future Batter. 2025, 5, 100047. [Google Scholar] [CrossRef]
- Lagos, G.; Cifuentes, L.; Peters, D.; Castro, L.; Valdés, J.M. Carbon footprint and water inventory of the production of lithium in the Atacama Salt Flat, Chile. Environ. Chall. 2024, 16, 100962. [Google Scholar] [CrossRef]
- Xu, C.; Steubing, B.; Hu, M.; Harpprecht, C.; van der Meide, M.; Tukker, A. Future greenhouse gas emissions of automotive lithium-ion battery cell production. Resour. Conserv. Recycl. 2022, 187, 106606. [Google Scholar] [CrossRef]
- Balaram, V.; Santosh, M.; Satyanarayanan, M.; Srinivas, N.; Gupta, H. Lithium: A review of applications, occurrence, exploration, extraction, recycling, analysis, and environmental impact. Geosci. Front. 2024, 15, 101868. [Google Scholar] [CrossRef]
- Bruno, M.; Fiore, S. Review of lithium-ion batteries’ supply-chain in Europe: Material flow analysis and environmental assessment. J. Environ. Manag. 2024, 358, 120758. [Google Scholar] [CrossRef]
- Wang, Y.; Witlox, F. Global trends in electric vehicle adoption and the impact of environmental awareness, user attributes, and barriers. Energy Rep. 2025, 13, 1125–1137. [Google Scholar] [CrossRef]
- Buyacar. Used Mercedes-Benz for Sale|Buy Online with Finance, Buyacar. Available online: https://www.buyacar.co.uk/cars?fueltype=Petrol&make=Mercedes-Benz&vehicle_type=car&year=%5B2021%20TO%202024%5D&sortby=rating&order=desc (accessed on 8 June 2024).
- Nationwide-Cars. Cheap New Cars for Sale, Nationawide-Cars. Available online: https://www.nationwide-cars.co.uk/cars/ (accessed on 8 June 2024).
- Electric Vehicle Database. Cheapest Full Electric Vehicle, Electric Vehicle Database. 2024. Available online: https://ev-database.org/compare/cheapest-electric-vehicle#sort:path~type~order=.pricesort~number~asc|make-checkbox-dropdown:pathGroup=.ford|rs-price:prev~next=10000~100000|rs-range:prev~next=0~1000|rs-fastcharge:prev~next=0~1500|rs-acceleration:prev~next= (accessed on 9 June 2024).
- World Nuclear Association. Carbon Dioxide Emissions From Electricity, World Nuclear Association. 30 April 2024. Available online: https://world-nuclear.org/information-library/energy-and-the-environment/carbon-dioxide-emissions-from-electricity#life-cycle-emissions-of-electricity-options (accessed on 25 June 2024).
- Malik, F.H.; Mubbashir, A.; Lehtonen, M. Collaborative Demand Response Optimization of Electric Vehicles and Storage Space Heating for Residential Peak Shaving. Int. Rev. Electr. Eng. 2014, 9, 1154–1161. [Google Scholar] [CrossRef]
- Malik, F.H.; Lehtonen, M. Comparison of Electric Vehicles Charging Strategies and Their Impact on Network Capacity. Int. Rev. Electr. Eng. 2015, 10, 214–220. [Google Scholar] [CrossRef]
- Domínguez, C.; Doña, A.; Navarro-Espinosa, A. Is single-phase residential EV fast-charging a good idea? Evidence from optimal charging plans based on realistic data. Int. J. Electr. Power Energy Syst. 2023, 152, 109231. [Google Scholar] [CrossRef]
- Barman, P.; Dutta, L.; Bordoloi, S.; Kalita, A.; Azzopardi, B. Renewable energy integration with electric vehicle technology: A review of the existing smart charging approaches. Renew. Sustain. Energy Rev. 2023, 183, 113518. [Google Scholar] [CrossRef]
- Li, M.; Wang, Y.; Peng, P.; Chen, Z. Toward efficient smart management: A review of modeling and optimization approaches in electric vehicle-transportation network-grid integration. Green Energy Intell. Transp. 2024, 3, 100181. [Google Scholar] [CrossRef]
- Barzdukas, A. Wired vs Wireless Charging Efficiency for EVs: A Comparison, WiTricity, 23 February 2022. Available online: https://witricity.com/media/blog/what-is-efficiency-how-do-you-measure-it-and-why-should-you-care#:~:text=So%2C%20the%20%E2%80%9Cefficiency%E2%80%9D%20of,on%20which%20one%20you%20buy (accessed on 30 June 2024).
- Go-e. EV Charging Efficiency: Why Are There Energy Losses and How to Avoid Them? Go-e, 11 October 2022. Available online: https://go-e.com/en/magazine/ev-charging-losses (accessed on 30 June 2024).
- Nedelea, A. How Efficient Is Each Type Of EV Charger? InsideEVs. 8 March 2024. Available online: https://insideevs.com/features/711659/ev-charger-efficiency-losses/ (accessed on 30 June 2024).
- Saraswathi, V.N. A comprehensive review on charger technologies, types, and charging stations models for electric vehicles. Heliyon 2024, 10, e38945. [Google Scholar] [CrossRef] [PubMed]
- Hakam, Y.; Gaga, A.; Elhadadi, B. Exploring the state of electric vehicles: An evidence-based examination of current and future electric vehicle technologies and smart charging stations. Energy Rep. 2024, 11, 4102–4114. [Google Scholar] [CrossRef]
- European Council. How is EU Electricity Produced and Sold? European Council. 10 April 2025. Available online: https://www.consilium.europa.eu/en/infographics/how-is-eu-electricity-produced-and-sold/ (accessed on 8 May 2025).
- Eurostat. Net Electricity Generation by Type of Fuel—Monthly data, Eurostat, 15 April 2025. Available online: https://ec.europa.eu/eurostat/databrowser/view/NRG_CB_PEM__custom_16296438/default/table (accessed on 8 May 2025).
- Stanford Doerr. Global Carbon Emissions From Fossil Fuels Reached Record High in 2023, Stanford. 5 December 2023. Available online: https://sustainability.stanford.edu/news/global-carbon-emissions-fossil-fuels-reached-record-high-2023 (accessed on 8 May 2025).
- NOWTRICITY. Current Emission in Belgium, NOWTRICITY. 18 April 2025. Available online: https://www.nowtricity.com/country/belgium/ (accessed on 8 May 2025).
- Will, C.; Zimmermann, F.; Ensslen, A.; Fraunholz, C.; Jochem, P.; Keles, D. Can electric vehicle charging be carbon neutral? Uniting smart charging and renewables. Appl. Energy 2024, 371, 123549. [Google Scholar] [CrossRef]
- Global EV Outlook 2022. Available online: https://www.iea.org/reports/global-ev-outlook-2022 (accessed on 19 December 2024).
- Bieker, G. A Global Comparison of the Life-Cycle Greenhouse Gas Emissions of Combustion Engine and Electric Passenger Cars. Available online: https://theicct.org/publication/a-global-comparison-of-the-life-cycle-greenhouse-gas-emissions-of-combustion-engine-and-electric-passenger-cars/ (accessed on 7 December 2024).
- Xu, L.; Yilmaz, H.Ü.; Wang, Z.; Poganietz, W.-R.; Jochem, P. Greenhouse gas emissions of electric vehicles in Europe considering different charging strategies. Transp. Res. Part D Transp. Environ. 2020, 87, 102534. [Google Scholar] [CrossRef]
- Hirth, L. The market value of variable renewables: The effect of solar wind power variability on their relative price. Energy Econ. 2013, 38, 218–236. [Google Scholar] [CrossRef]
- Hawkins, T.R.; Singh, B.; Majeau-Bettez, G.; Strømman, A.H. Comparative environmental life cycle assessment of conventional and electric vehicles. J. Ind. Ecol. 2013, 17, 53–64. [Google Scholar] [CrossRef]
- Liu, X.; Elgowainy, A.; Vijayagopal, R.; Wang, M. Well-to-wheels analysis of zero-emission plug-in battery electric vehicle technology for medium-and heavy-duty trucks. Environ. Sci. Technol. 2020, 55, 538–546. [Google Scholar] [CrossRef] [PubMed]


| Parameters | Diesel Car | Petrol Car | Battery Electric Vehicle |
|---|---|---|---|
| Vehicle Weight | 1314 kg | 1234 kg | 1200 |
| Vehicle Energy Consumption | 0.78 kWh/km | 0.83 kWh/km | 0.199 kWh/km |
| Battery Weight | - | - | 296 kg |
| Battery Capacity | - | - | 40 kWh |
| Emission Standard | EURO 6 | EURO 6 | - |
| Characteristics | NMC 111 |
|---|---|
| Cell Nominal Voltage (V) | 3.7 |
| Nominal Capacity (Ah) | 43 |
| Battery Cell Efficiency (%) | 95 |
| Cell Energy Density (Wh/kg) | 264.2 |
| Battery Pack Energy (kWh) | 54.6 |
| Impact Type | Lithium-Ion Batteries | Vanadium Redox Batteries |
|---|---|---|
| Global Warming (kg CO2 eq.) | 56.3 | 57.0 |
| Fine Particulate Matter Formation (kg PM2.5 eq.) | 0.3 | 0.2 |
| Human Toxicity (kg 1,4-DCB) | 162.4 | 120.9 |
| Terrestrial Acidification (kg SO2 eq.) | 1.0 | 0.6 |
| Fossil Resource Scarcity (kg oil eq.) | 13.1 | 15.1 |
| Mineral Resource Scarcity (kg Cu eq.) | 5.0 | 4.8 |
| Parameters | SIB | LIB |
|---|---|---|
| Cathode and anode materials | Na(Ni0.4Fe0.2Mn0.4)O2/HC | LiFePO4/C |
| Nominal capacity, mAh | 1300 | 1500 |
| Nominal voltage, V | 3.1 | 3.2 |
| Maximum charging current, A | 1.3 | 1.5 |
| Maximum discharge current, A | 3.9 | 4.5 |
| Operating temperature range °C | Charging: −10–45 Discharging: −30–60 | Charging: 0–45 Discharging: −20–60 |
| Cell weight, g | 30 g | 40 g |
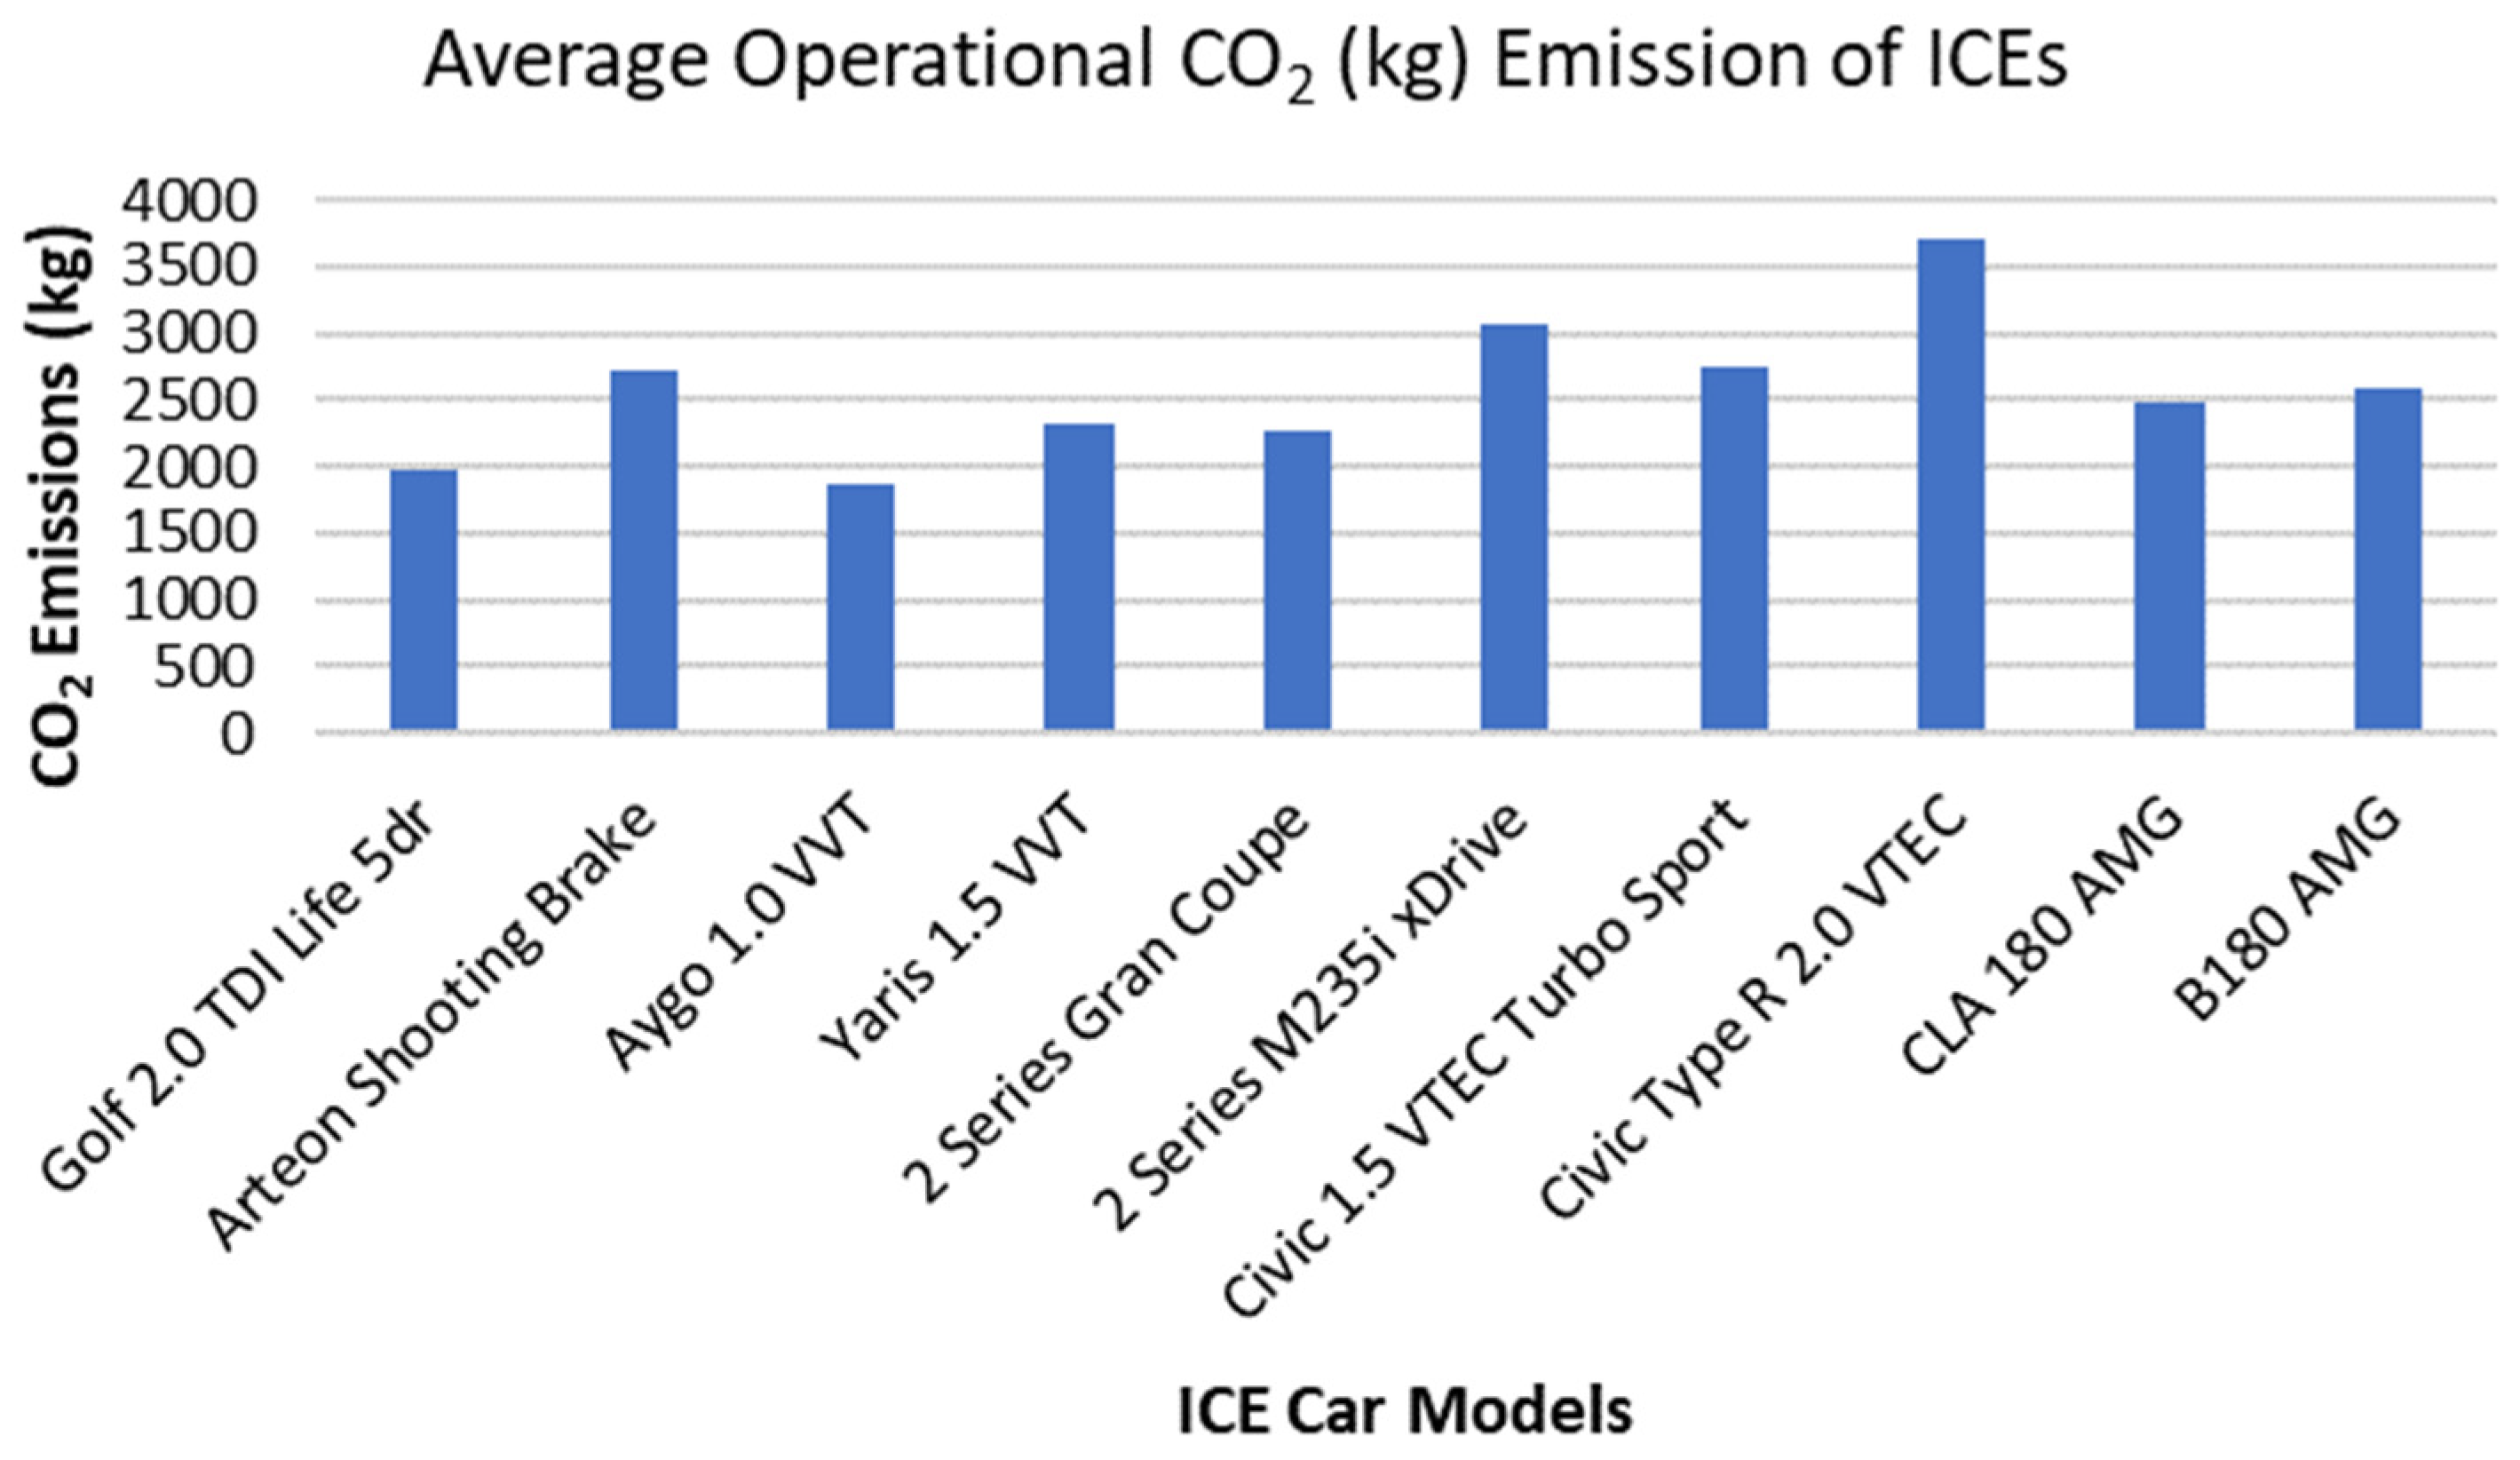
| Serial No. | Brand | Car Model | Carbon Emission (g/km) |
|---|---|---|---|
| 1 | Volkswagen | Golf 2.0 TDI Life 5dr | 99 |
| 2 | Volkswagen | Arteon Shooting Brake | 136 |
| 3 | Toyota | Aygo 1.0 VVT | 93 |
| 4 | Toyota | Yaris 1.5 VVT | 116 |
| 5 | BMW | 2 Series Gran Coupe | 114 |
| 6 | BMW | 2 Series M235i xDrive | 153 |
| 7 | Honda | Civic 1.5 VTEC Turbo Sport | 137 |
| 8 | Honda | Civic Type R 2.0 VTEC | 186 |
| 9 | Mercedes-Benz | CLA 180 AMG | 124 |
| 10 | Mercedes-Benz | B180 AMG | 129 |
| Serial No. | Make | Model | Battery Nominal Capacity (kWh) | Warranty Mileage (km) | Battery Replacement per 200,000 km |
|---|---|---|---|---|---|
| 1 | Volkswagen | Volkswagen ID.3 Pure | 55.0 | 160,000 | Yes |
| 2 | Volkswagen | Volkswagen ID.7 Tourer Pro | 82.0 | 160,000 | Yes |
| 3 | Tesla | Tesla Model Y | 60.0 | 160,000 | Yes |
| 4 | Tesla | Tesla Model S Dual Motor | 100.0 | 240,000 | No |
| 5 | Kia | Kia e-Soul | 42.0 | 150,000 | Yes |
| 6 | Kia | Kia EV9 99.8 kWh AWD | 99.8 | 150,000 | Yes |
| 7 | Mercedes-Benz | Mercedes-Benz EQT 200 Standard | 48.0 | 160,000 | Yes |
| 8 | Mercedes-Benz | Mercedes-Benz EQS 580 4MATIC | 125.0 | 250,000 | No |
| 9 | Ford | Ford Explorer Standard Range RWD | 55.0 | 160,000 | Yes |
| 10 | Ford | Ford Mustang Mach-E ER AWD | 98.7 | 160,000 | Yes |
| Model | Battery Nominal Capacity (kWh) | Total Batteries Required | Battery Production Emissions (Norway) kg CO2-eq | Battery Production Emissions (Tianjin) kg CO2-eq |
|---|---|---|---|---|
| Volkswagen ID.3 Pure | 55.0 | 2 | 5060 | 13,090 |
| Volkswagen ID.7 Tourer Pro | 82.0 | 2 | 7544 | 19,516 |
| Tesla Model Y | 60.0 | 2 | 5520 | 14,280 |
| Tesla Model S Dual Motor | 100.0 | 1 | 4600 | 11,900 |
| Kia e-Soul | 42.0 | 2 | 3864 | 9996 |
| Kia EV9 99.8 kWh AWD | 99.8 | 2 | 9182 | 23,752 |
| Mercedes-Benz EQT 200 Standard | 48.0 | 2 | 4416 | 11,424 |
| Mercedes-Benz EQS 580 4MATIC | 125.0 | 1 | 5750 | 14,875 |
| Ford Explorer Standard Range RWD | 55.0 | 2 | 5060 | 13,090 |
| Ford Mustang Mach-E ER AWD | 98.7 | 2 | 9080 | 23,491 |
| Model | Battery Nominal Capacity (kWh) | Energy per Charge (kWh) | Full Charge Mild Weather Range (km) | Total Number of Charging Cycles for 200,000 km | Total Energy Consumed for covering 200,000 km (kWh) |
|---|---|---|---|---|---|
| Volkswagen ID.3 Pure | 55.0 | 64.75 | 315 | 635 | 41,116.25 |
| Volkswagen ID.7 Tourer Pro | 82.0 | 96.47 | 530 | 377 | 36,369.19 |
| Tesla Model Y | 60.0 | 70.58 | 405 | 494 | 34,866.52 |
| Tesla Model S Dual Motor | 100.0 | 117.64 | 665 | 301 | 35,400.61 |
| Kia e-Soul | 42.0 | 49.41 | 265 | 755 | 37,304.55 |
| Kia EV9 99.8 kWh AWD | 99.8 | 117.41 | 490 | 409 | 48,020.69 |
| Mercedes-Benz EQT 200 Standard | 48.0 | 56.47 | 255 | 785 | 44,328.95 |
| Mercedes-Benz EQS 580 4MATIC | 125.0 | 147 | 595 | 337 | 49,539.00 |
| Ford Explorer Standard Range RWD | 55.0 | 64.7 | 320 | 625 | 40,437.50 |
| Ford Mustang Mach-E ER AWD | 98.7 | 116.1 | 500 | 400 | 46,440.00 |
| Country | Grid CO2 Intensity (g CO2/kWh) | EV Emissions (g CO2/km) | Key Energy Sources |
|---|---|---|---|
| Norway | 15.0 | 3–5 | Hydro (92%), Wind (7%), Other Sources (1%) |
| France | 52.0 | 10–12 | Nuclear (70%), Renewables (21%), Natural Gas (9%) |
| Germany | 350.0 | 70–85 | Coal (28%), Natural Gas (15%), Wind (27%), Nuclear (30%) |
| United States | 385.0 | 75–95 | Natural Gas (45%), Coal (25%), Renewables (30%) |
| China | 550.0 | 110–130 | Coal (61%), Renewables (29%), Nuclear (10%) |
| India | 700.0 | 140–160 | Coal (74%), Renewables (22%), Other Sources (4%) |
| Country | Grid CO2 Intensity (g CO2/kWh) | EV Emissions (g CO2/km) | Key Seasonal Energy Drivers | ||
|---|---|---|---|---|---|
| Summer | Winter | Summer | Winter | ||
| Norway | 10 | 20 | 1.8–3.6 | 3.6–7.2 | Hydro stable; minor winter fossil backup |
| France | 40 | 60 | 7.2–12.6 | 10.8–18.0 | Nuclear base; winter heating raises gas |
| Germany | 300 | 450 | 54–90 | 81–135 | Winter coal/gas use spikes |
| United States | 350 (avg.) | 450 (avg.) | 63–81 | 81–108 | Regional splits, e.g., California (summer: 200, winter: 300) vs. Midwest (coal-heavy) |
| China | 500 | 650 | 90–117 | 117–153 | Winter coal heating spikes |
| India | 650 | 800 | 117–144 | 144–180 | Coal use peaks in winter for heating |
| Vehicle Type | Manufacturing Emissions (tCO2) | Operational Emissions (tCO2/200,000 km) | Total Lifecycle Emissions (tCO2) |
|---|---|---|---|
| Tesla Model 3 (USA) | 10.5 | 12.6 (US grid) | 23.1 |
| Nissan Leaf (EU) | 9.8 | 6.3 (EU avg.) | 16.1 |
| BMW i3 (Germany) | 11.2 | 21.0 (German grid) | 32.2 |
| Toyota Corolla (ICE) | 6.7 | 34.5 (gasoline) | 41.2 |
| Model | Carbon Emissions Due to Charging and Battery Manufacturing Combined (Production Source + Battery Manufacturing Location) kg CO2 eq. | ||||
|---|---|---|---|---|---|
| Coal + Norway | Natural Gas + Norway | Solar + Norway | Hydropower + Norway | Nuclear + Norway | |
| Volkswagen ID.3 Pure | 38,775.33 | 25,206.96 | 7033.58 | 6046.79 | 5553.40 |
| Volkswagen ID.7 Tourer Pro | 37,366.74 | 25,364.90 | 9289.72 | 8416.86 | 7980.43 |
| Tesla Model Y | 34,110.55 | 22,604.59 | 7193.59 | 6356.80 | 5938.40 |
| Tesla Model S Dual Motor | 33,628.50 | 21,946.30 | 6299.23 | 5449.61 | 5024.81 |
| Kia e-Soul | 34,453.73 | 22,143.23 | 5654.62 | 4759.31 | 4311.65 |
| Kia EV9 99.8 kWh AWD | 48,558.97 | 32,712.14 | 11,486.99 | 10,334.50 | 9758.25 |
| Mercedes-Benz EQT 200 Standard | 40,765.74 | 26,137.19 | 6543.79 | 5479.89 | 4947.95 |
| Mercedes-Benz EQS 580 4MATIC | 46,371.98 | 30,024.11 | 8127.87 | 6938.94 | 6344.47 |
| Ford Explorer Standard Range RWD | 38,218.75 | 24,874.38 | 7001.00 | 6030.50 | 5545.25 |
| Ford Mustang Mach-E ER AWD | 47,160.80 | 31,835.60 | 11,309.12 | 10,194.56 | 9637.28 |
| Model | Carbon Emissions Due to Charging and Battery Manufacturing Combined (Production Source + Battery Manufacturing Location) kg CO2 eq. | ||||
|---|---|---|---|---|---|
| Coal + Tianjin | Natural Gas + Tianjin | Solar + Tianjin | Hydropower + Tianjin | Nuclear + Tianjin | |
| Volkswagen ID.3 Pure | 46,805.33 | 33,236.96 | 15,063.58 | 14,076.79 | 13,583.40 |
| Volkswagen ID.7 Tourer Pro | 49,338.74 | 37,336.90 | 21,261.72 | 20,388.86 | 19,952.43 |
| Tesla Model Y | 42,870.55 | 31,364.59 | 15,953.59 | 15,116.80 | 14,698.40 |
| Tesla Model S Dual Motor | 40,928.50 | 29,246.30 | 13,599.23 | 12,749.61 | 12,324.81 |
| Kia e-Soul | 40,585.73 | 28,275.23 | 11,786.62 | 10,891.31 | 10,443.65 |
| Kia EV9 99.8 kWh AWD | 63,128.97 | 47,282.14 | 26,056.99 | 24,904.50 | 24,328.25 |
| Mercedes-Benz EQT 200 Standard | 47,773.74 | 33,145.19 | 13,551.79 | 12,487.89 | 11,955.95 |
| Mercedes-Benz EQS 580 4MATIC | 55,496.98 | 39,149.11 | 17,252.87 | 16,063.94 | 15,469.47 |
| Ford Explorer Standard Range RWD | 46,248.75 | 32,904.38 | 15,031.00 | 14,060.50 | 13,575.25 |
| Ford Mustang Mach-E ER AWD | 61,571.80 | 46,256.60 | 25,720.12 | 24,605.56 | 24,048.28 |
Disclaimer/Publisher’s Note: The statements, opinions and data contained in all publications are solely those of the individual author(s) and contributor(s) and not of MDPI and/or the editor(s). MDPI and/or the editor(s) disclaim responsibility for any injury to people or property resulting from any ideas, methods, instructions or products referred to in the content. |
© 2025 by the authors. Published by MDPI on behalf of the World Electric Vehicle Association. Licensee MDPI, Basel, Switzerland. This article is an open access article distributed under the terms and conditions of the Creative Commons Attribution (CC BY) license (https://creativecommons.org/licenses/by/4.0/).
Share and Cite
Malik, F.H.; Ayadi, W.; Hussain, G.A.; Haider, Z.M.; Alkhatib, F.; Lehtonen, M. Evaluating Carbon Emissions: A Lifecycle Comparison Between Electric and Conventional Vehicles. World Electr. Veh. J. 2025, 16, 287. https://doi.org/10.3390/wevj16050287
Malik FH, Ayadi W, Hussain GA, Haider ZM, Alkhatib F, Lehtonen M. Evaluating Carbon Emissions: A Lifecycle Comparison Between Electric and Conventional Vehicles. World Electric Vehicle Journal. 2025; 16(5):287. https://doi.org/10.3390/wevj16050287
Chicago/Turabian StyleMalik, Farhan Hameed, Walid Ayadi, Ghulam Amjad Hussain, Zunaib Maqsood Haider, Fawwaz Alkhatib, and Matti Lehtonen. 2025. "Evaluating Carbon Emissions: A Lifecycle Comparison Between Electric and Conventional Vehicles" World Electric Vehicle Journal 16, no. 5: 287. https://doi.org/10.3390/wevj16050287
APA StyleMalik, F. H., Ayadi, W., Hussain, G. A., Haider, Z. M., Alkhatib, F., & Lehtonen, M. (2025). Evaluating Carbon Emissions: A Lifecycle Comparison Between Electric and Conventional Vehicles. World Electric Vehicle Journal, 16(5), 287. https://doi.org/10.3390/wevj16050287