Article

Longitudinal Exploration of Regularity and Variability in Electric Car Charging Patterns

Korea Transport Institute, Sejong-si 30147, Republic of Korea
*
Author to whom correspondence should be addressed.
World Electr. Veh. J. 2025, 16(5), 256; https://doi.org/10.3390/wevj16050256
Submission received: 8 March 2025 / Revised: 17 April 2025 / Accepted: 28 April 2025 / Published: 30 April 2025

Abstract

:
As the number of electric vehicles increases, effective charging infrastructure planning and grid load management strategies become more important. This requires a better understanding of charging behaviors and accurate forecasting of charging demand. This study aimed to analyze the charging patterns of electric cars using the panel data of one year from 2023. Using this longitudinal data, we explored the spatiotemporal characteristics of charging patterns in Korea, examined the regularities of charging patterns, and quantified the variability in charging and travel behaviors. According to the results, the proportion of drivers with regular charging patterns was 75%, and the proportion of drivers with irregular charging patterns was 25%. We applied a method to quantify the variability in EV travel and charging patterns and explored factors affecting the variability. The variability in charging frequencies and trips showed similar patterns, which implies that EV trips and charging behaviors are highly correlated, and travel characteristics are an important factor in explaining charging behaviors.

1. Introduction

The expansion of electric vehicles (EVs) is being driven by policies to reduce exhaust emissions, such as greenhouse gases and pollutant materials, from internal combustion engine vehicles. Global electric car sales are expected to grow to 17 million by 2024, with the market share of electric cars reaching 45% in China, 25% in Europe, and 11% in the United States [1]. To accelerate the adoption of EVs, sufficient charging infrastructure is critical to alleviate driving range anxiety and provide stable charging opportunities. However, the increase in EVs and the expansion of charging infrastructure can lead to an increase in electricity demand and have a negative impact on the power system. Therefore, as the number of EVs increases, power grid load management strategies have been introduced to mitigate the significant impact of the charging demand on the power grid.
For EV infrastructure planning and regulations and power grid load management, understanding the charging behaviors of EV drivers is most important. In the early days, when observations of electric vehicles were insufficient, research modeling EV charging behaviors was limited to theoretical hypotheses [2,3,4]. However, as the number of EVs increases, various charging pattern analysis studies are being conducted using observed data. Studies on EV charging patterns include charging behavior analyses for public charging infrastructure planning [5,6,7,8,9], studies analyzing the impact and potential of EV charging demand on the power grid [10,11,12], and charging load analyses to predict future EV charging demand [13,14]. Among recent studies, refs. [12,13,15] analyzed the spatiotemporal distribution of charging patterns based on longitudinal charging session data collected over a long period of time. Ref. [12] estimated synthetic charging load profiles by analyzing charging patterns in residential areas and workplaces based on charging session data collected for one year in Sweden. In [15], the authors analyzed travel and charging patterns by collecting data on 76,000 electric vehicles operating in Beijing, China for one month, and presented policy implications for introducing Time-of-Use tariffs and infrastructure planning. Ref. [13] analyzed 3.99 million sessions collected for 11 months in California, USA, and derived various charging segments, and the results were used to predict future charging demand profiles.
Charging pattern analyses using longitudinal data can contribute to improving charging infrastructure planning by understanding the variability in charging patterns and predicting realistic charging demand. Traditionally, transportation demand analysis methods have involved the hypothesis that there are regularities in human activity and movement, and the efforts to prove this hypothesis [16,17]. Understanding the regularities and diversity of activity and movement behaviors enables advanced predictions to improve infrastructure planning and operational efficiency. Previous studies that analyzed the regularity and variability in traffic patterns include [16,17,18,19]. Ref. [17] discussed a method of quantifying the variability found in travel behaviors by dividing it into interpersonal variability and intrapersonal variability. It has been also suggested that the effect of day-to-day variability in individuals’ travel behavior is an important factor in predicting travel demand. Among studies related to charging behaviors, Refs. [6,20,21] discussed the regularity and variability in charging behaviors. In [6], the authors defined charging regularity as heterogeneity in terms of charging intervals and analyzed public charging session data collected in the Netherlands and found that only 10% of users showed regular patterns. On the other hand, Ref. [20] analyzed charging transaction data in the Netherlands and found that only 15% showed irregular and non-repetitive charging patterns. In [21], the authors analyzed large-scale charging data divided into weekdays, weekends, and holidays and found that there was regularity in charging behaviors, similar to the results of [20]. Therefore, previous studies have not yet fully elucidated the regularities and variability in charging patterns, and continued exploration is needed as available data increases.
Factors affecting charging behaviors include internal factors, such as individual characteristics and preferences, as well as external factors, such as advances in battery technology and expansion of charging infrastructure. As argued by [22], charging behavior on the supply side is mostly analyzed based on simple assumptions, while EV drivers’ charging behavior varies with evolving battery technology and driving range. Changes in charging infrastructure, such as the expansion of public charging opportunities, will also bring about behavioral changes. In terms of the charging infrastructure environment, Korea is evaluated as having an excellent public charger scale with a ratio of less than two cars to chargers, and the law mandates the installation of a minimum number of chargers in all facility parking lots [1]. Therefore, analyzing the charging patterns of Korean electric vehicle drivers can be a good opportunity to examine what decisions drivers make in an environment where various charging opportunities are provided. Ref. [23] classified the charging patterns of Korean EV drivers into four types based on the choice of charging location and charger type through a latent class analysis using EV driver survey data. The first type is drivers who charge mainly with slow chargers at various locations, such as at home, public charging stations, and workplaces, with a probability of 69.3%. The second type is drivers who charge mainly with slow chargers at home, with a probability of 16.5%. The third type is drivers who charge mainly at public charging stations regardless of charger type, with a probability of 8.2%. The fourth type is drivers who charge mainly with slow chargers at work, with a probability of 6.1%. However, this study had limitations in analyzing the variability in charging patterns due to limited data, and there are few studies on charging patterns targeting Korean drivers other than this study.
In summary, previous studies have not sufficiently explored the regularities and variability in charging behaviors, and further research is needed to capture expected changes in charging behavior due to advanced battery technologies, driving ranges, and expanding charging infrastructure. This study aims to analyze EV charging patterns in Korea by utilizing EV travel and charging data collected through onboard devices (OBDs) in individual EVs over a period of one year. The data used in this study are the latest data collected from March 2023 to February 2024 and are suitable for analyzing charging patterns that reflect battery technology advancements and the expansion of public charging opportunities. In the charging pattern analysis, the variability in EV travel and charging is also discussed based on longitudinal data.
This paper is structured as follows: Section 2 presents the data and methods used in this study. Section 3 describes the results of the charging pattern analysis. Section 4 discusses the implications derived from the results. Section 5 summarizes the application of the analysis results and gives suggestions for future studies.

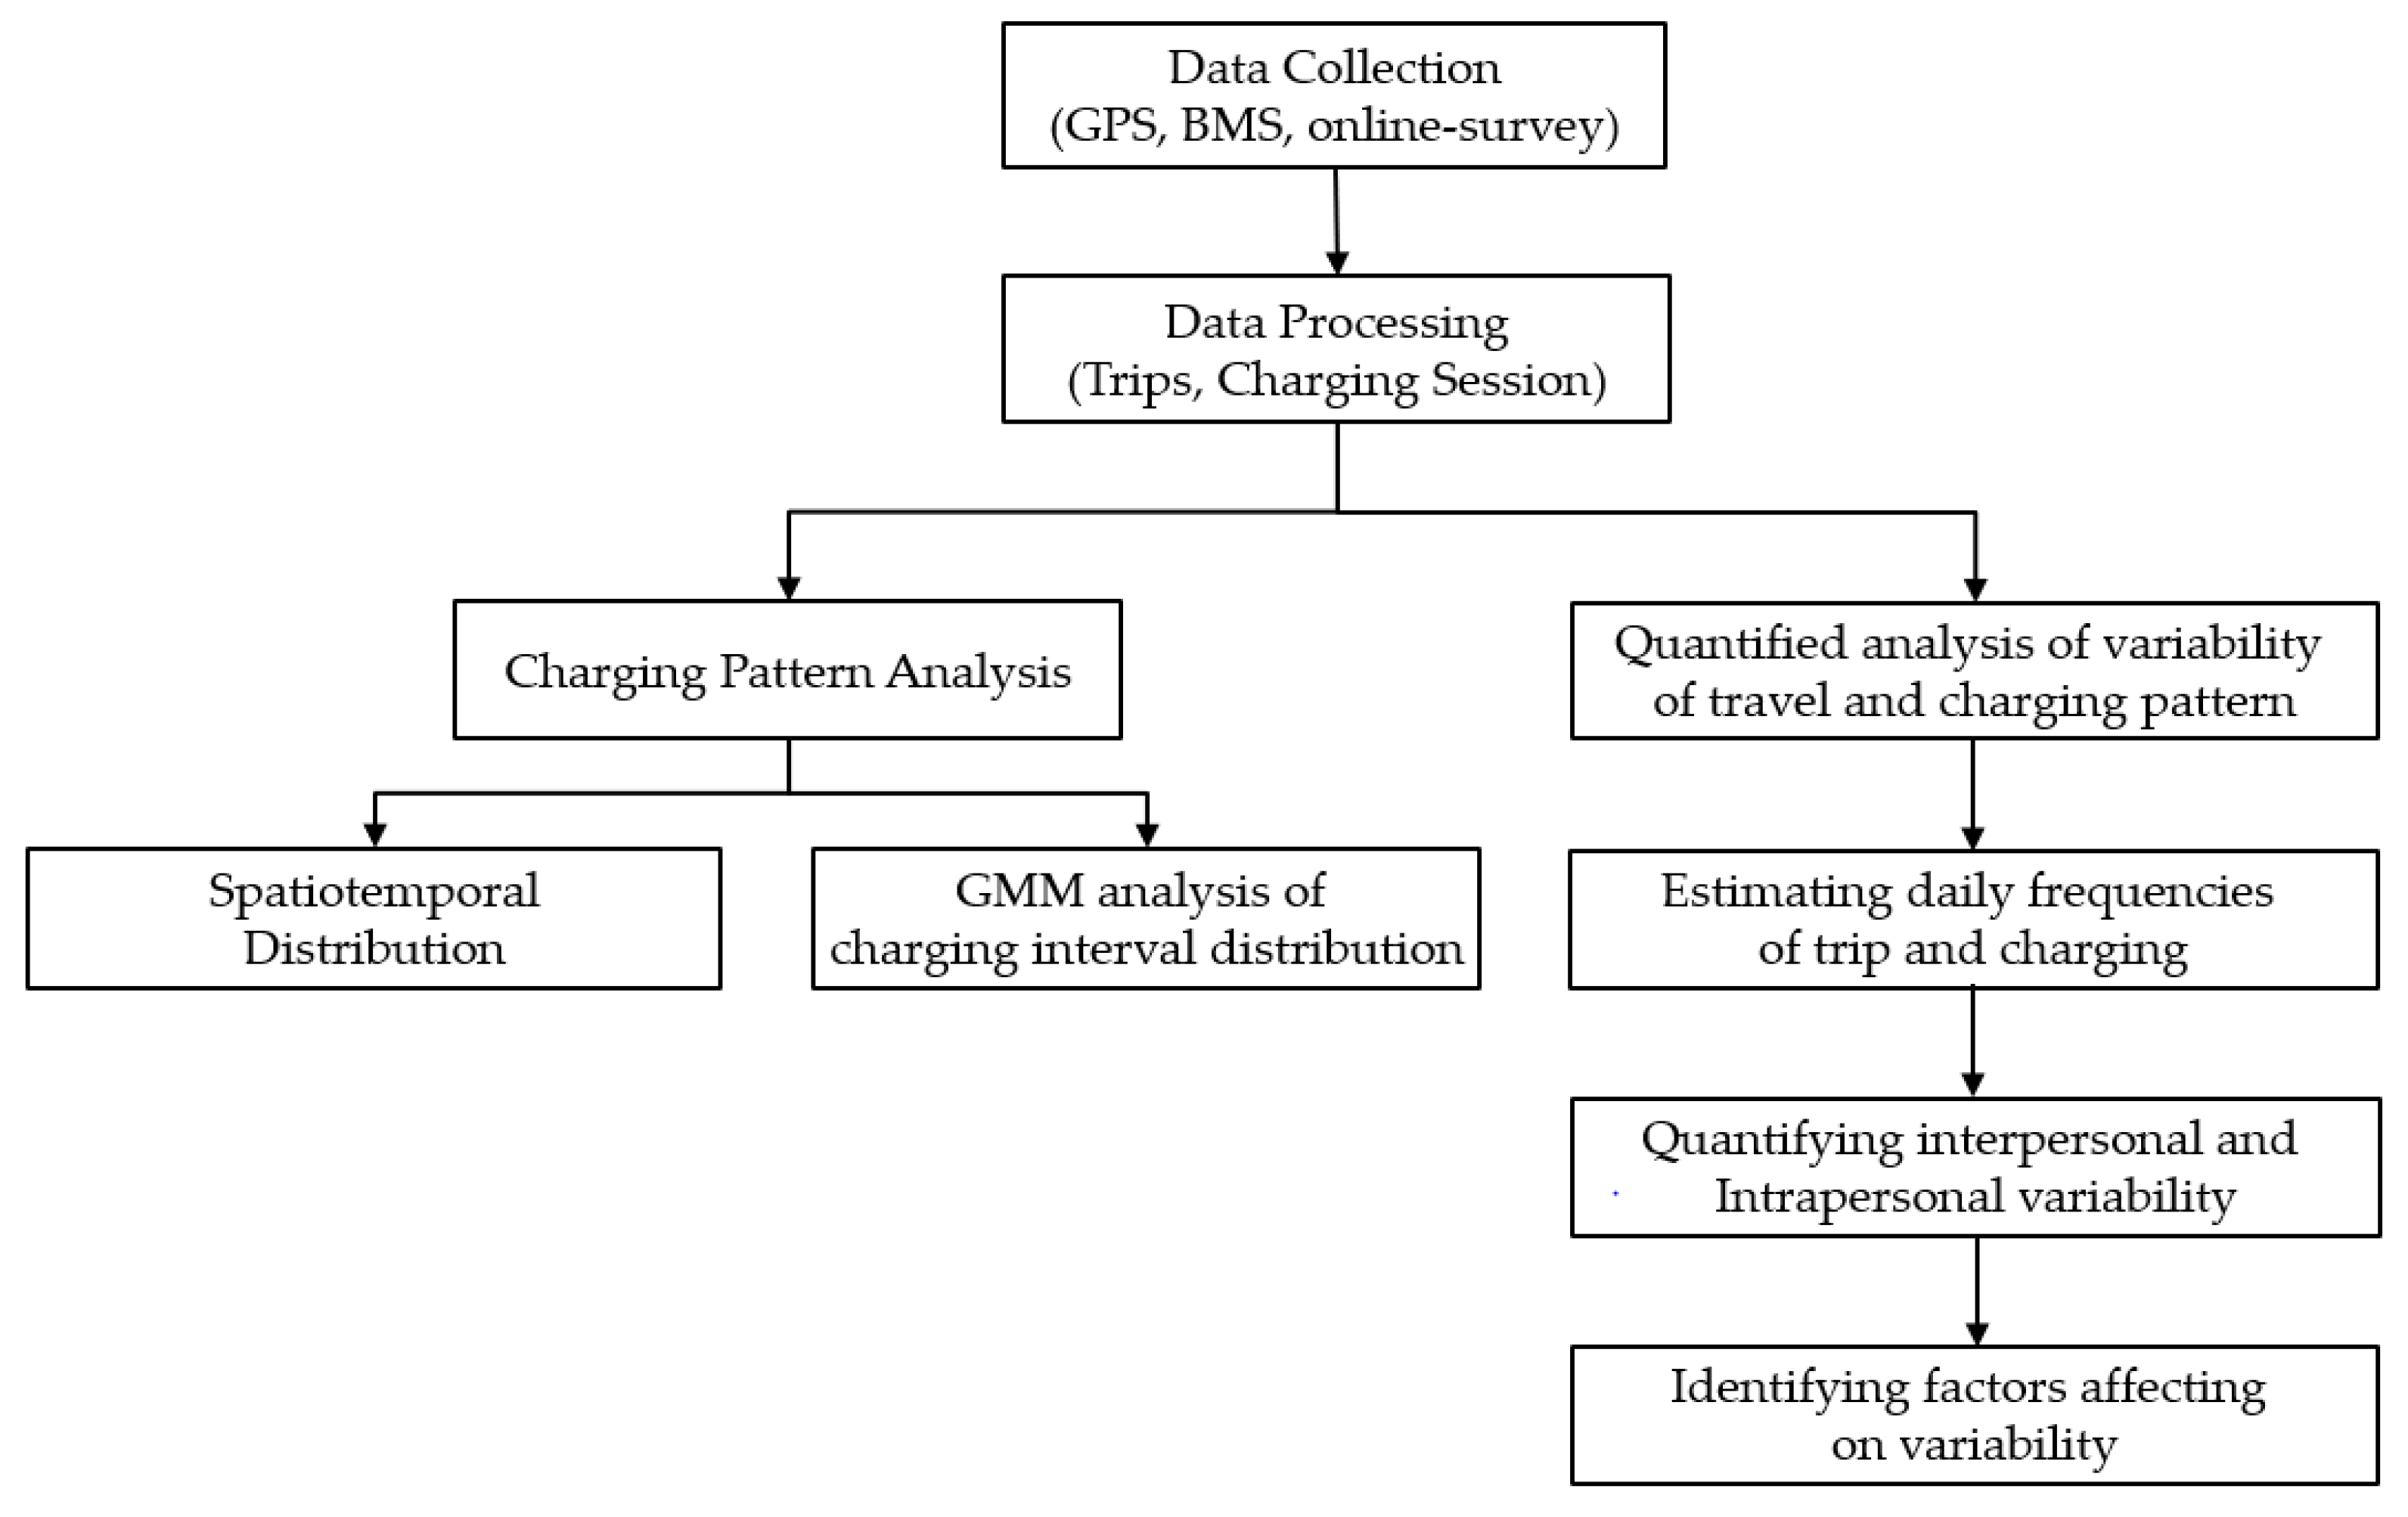
2. Materials and Methods
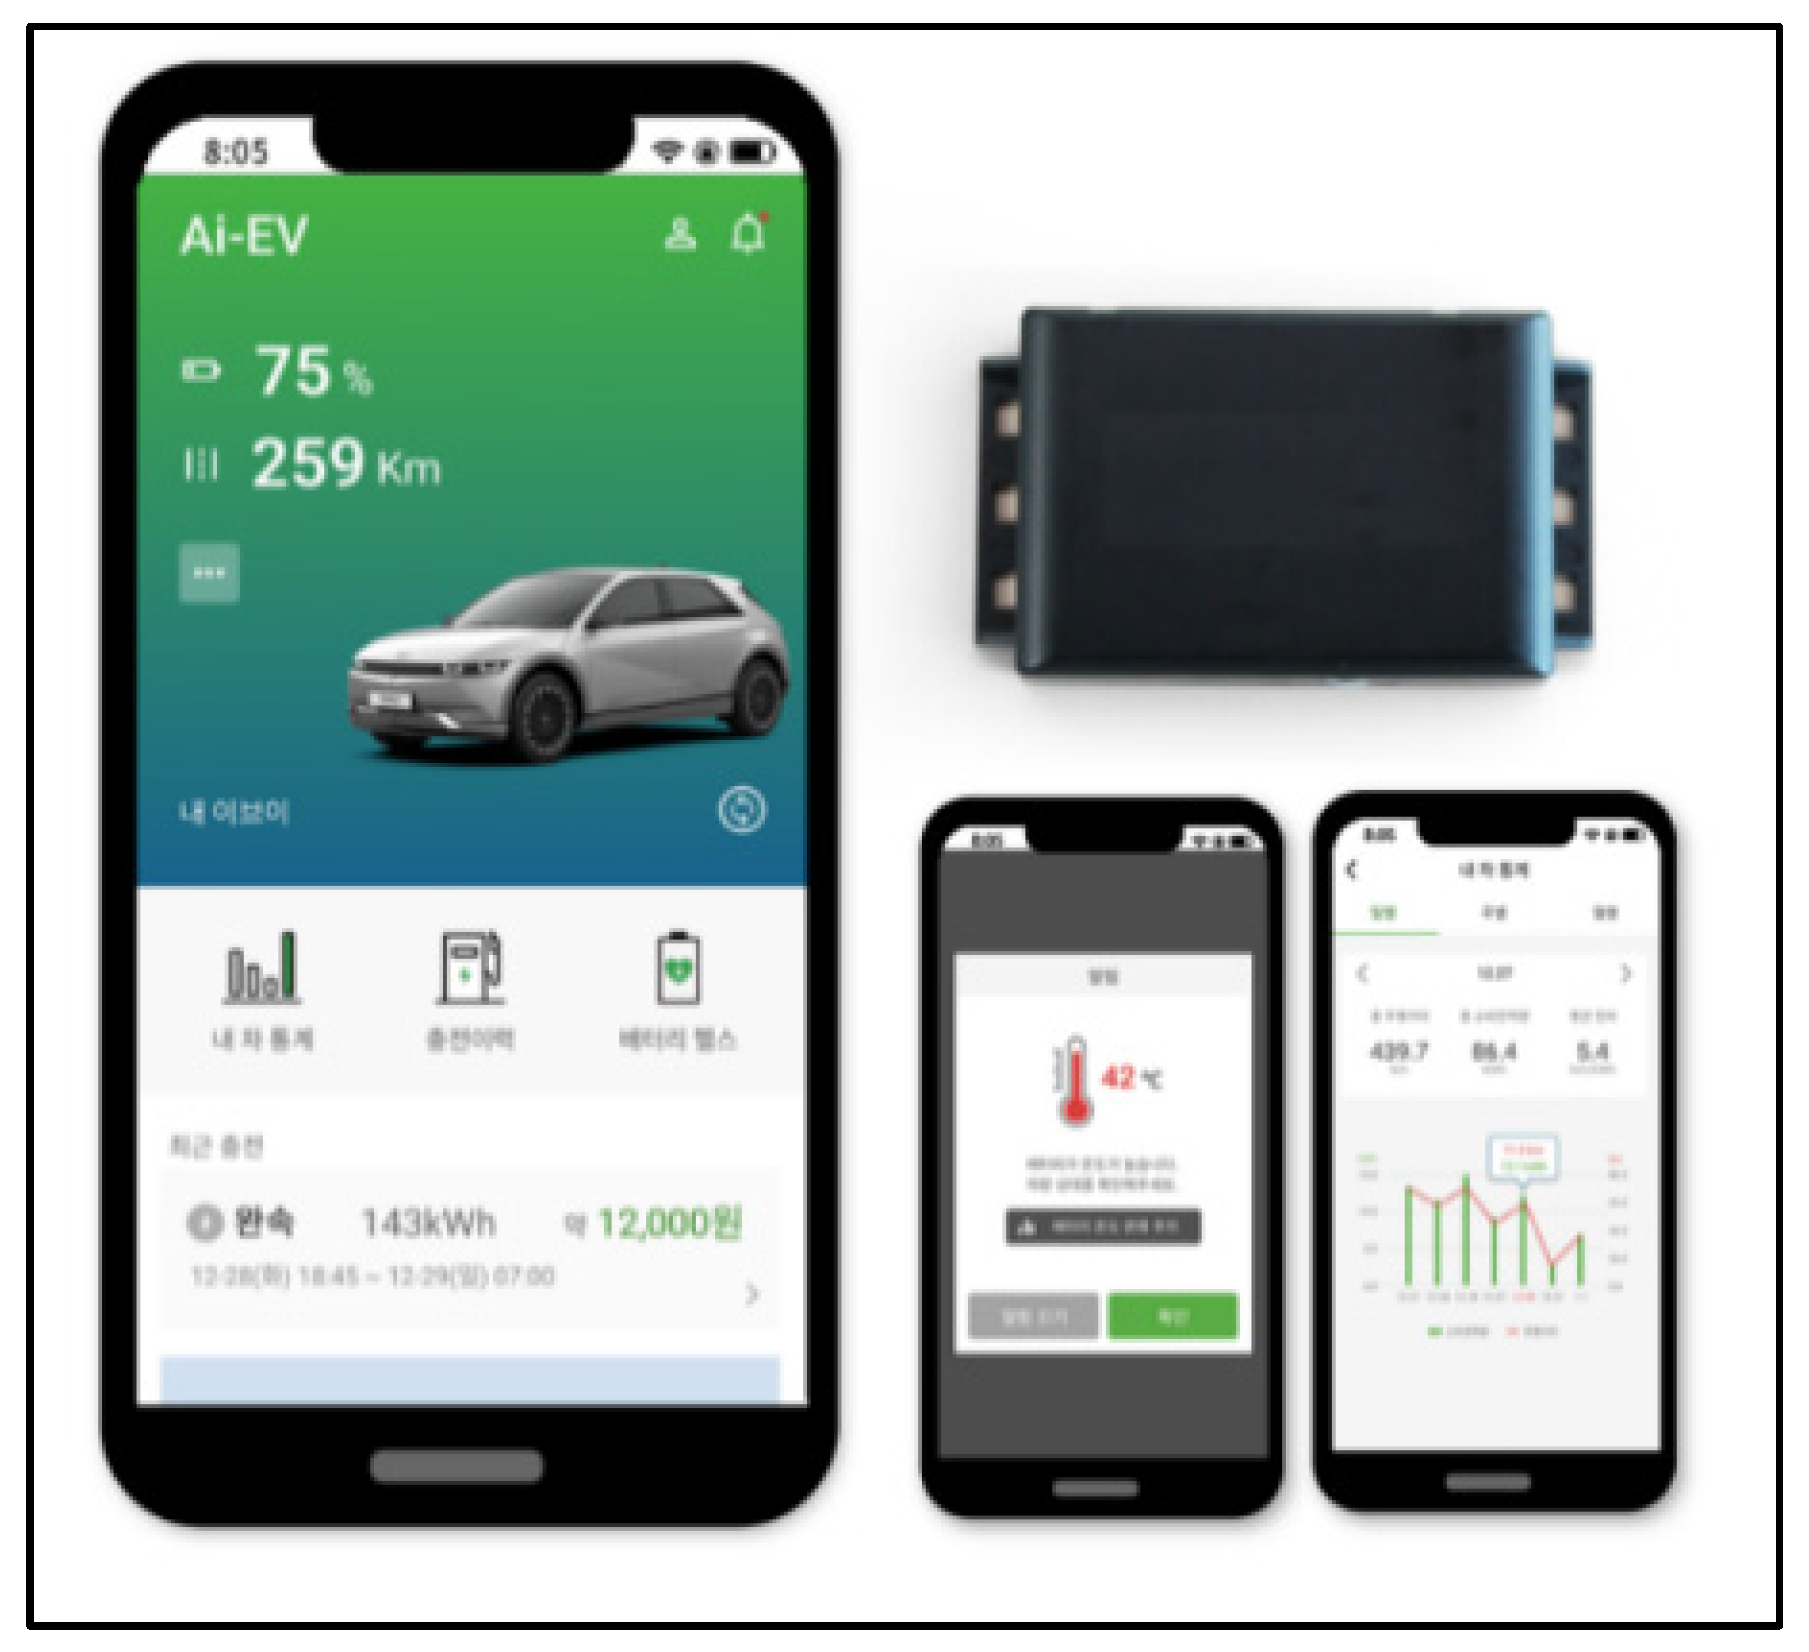
2.1. Data

This study utilized EV travel and charging data collected by Korea Electric Power Corporation. Korea Electric Power Corporation (KEPCO), the exclusive utility operator in Korea, has started a project to collect travel and charging data from EV drivers as of 2022 for the purpose of analyzing the long-term impact of the increase in EVs on the power grid. Data collection was carried out by attaching an OBD to individual vehicles, collecting information through intra-vehicle communication, and transmitting it to a server via a telecommunication network. Information related to travel and charging activity is mainly collected from the global position system (GPS) and battery management system (BMS) and is transmitted to the server every 5 s. Figure 1 shows the information provided to vehicle drivers by processing the OBD data and the OBD attached to the vehicle.
Participant recruitment was based on the area of residence, age, and the electric vehicle model. The regional allocation was composed of 35% in the metropolitan area, 35% in other metropolitan areas, 20% in other areas, and 10% in Jeju Island, considering the number of registered electric vehicles. The allocation by electric vehicle model included various models and reflected the number of registered vehicles for each model. Due to limited statistical data on the EV driver population, the age distribution was allocated based on the overall population proportion.
As a result, this study utilized data collected from 351 electric cars from 1 March 2023 to 29 February 2024. The data collection period differed because the participation period for each vehicle was different, but the analysis was limited to vehicles for which data was collected for at least one month. For vehicles where long-term data transmission failures were found during the collection period, data continuity was ensured by checking for errors through driver contact and vehicle diagnosis.
The electric car models are 100 Hyundai IONIQs, 77 Chevrolet Bolts, 64 Kia EV6s, 53 Kia Niros, and 57 others. All vehicles are the latest models from the 2020 model year or later, and the battery capacity ranges from a minimum of 58 kWh to a maximum of 77 kWh. Information on the main driver of the electric car was collected through an entry survey before data collection began, including information on family members, occupation, income, residential area, and workplace. In order to secure statistical significance, the main driver of the survey vehicle was selected by sampling allocation considering region and age, but the gender distribution was more than 90% male. Table 1 summarizes the key characteristics of electric cars and drivers.

2.2. Method

This study processed the collected vehicle information into individual vehicle travel and charging data as follows. First, travel was processed into a trip by integrating a set of observations in movement using GPS trajectories and ignition on and off information. The engine off-time criterion was set to 5 min, and the trip was considered to have ended when the vehicle was stopped for more than 5 min. Next, charging was processed into charging session units using data collected from the BMS and GPS, and each session data includes information, such as charging point, charger type, plug-in time, plug-out time, and charging capacity. Among the charging data collected from BMS data, cases where there was no change in State of Charge (SOC) or the duration was very short were excluded. Charging points were analyzed by matching them with the home and workplace addresses of respondents and classified into home, workplaces, and other public charging stations.
The analysis conducted in this study can be divided into two parts: spatiotemporal charging patterns and charging interval analyses and quantified analyses of variability in travel and charging patterns. The analysis methods for each part are as follows.

2.2.1. Spatiotemporal Charging Patterns and Charging Interval Distributions

Variables that characterize the charging pattern include charging points, charging time (start and end time, charging duration), charging frequencies, and charging interval (inter-charging time). We defined the charging interval as the difference between the start time of the previous charging session and the start time of the latter charging session in two consecutive charging sessions, and the formula is as follows:
λ i j = t i j + 1 t i j ,
where λ i j is j th charging interval of individual i, and t i j is the start time of charging session j.
The charging interval was analyzed according to charging points, and the time-of-day distribution of plug-in start time for each charging point was also analyzed.
During the analysis period, the total number of charging sessions and the charging interval between each charging session varied for each vehicle. Therefore, this study analyzed the regularity of the charging pattern based on the distribution of charging intervals for individual vehicles, as in [6]. The Gaussian Mixture Model (GMM) was utilized to statistically classify the distribution of charging intervals. GMM is a modeling method that finds complex distributions of data by mixing several Gaussian distributions and is very effective for clustering. Clustering is the task of classifying data with similar characteristics, and GMM performs clustering by calculating the probability that each data point belongs to a cluster. In this study, the distribution of charging intervals of individual vehicles was estimated using Stata analysis software [24].

2.2.2. Quantified Analysis of Variability in Travel and Charging Patterns

Based on the regularity analysis of the charging pattern, this part quantified the variability in the charging patterns and analyzed the factors affecting the variability. The method of quantifying the variability utilized the variability formula of travel presented by [17,25]. Ref. [17] quantified the total variability in individuals’ travel behavior by distinguishing it into two factors: interpersonal variability and intrapersonal variability, as shown in the figure. In his study, WPSS (Within Person Sum of Squares) is the result of estimating intrapersonal variability. A large value means large variability between individuals, and a small value means small variability within individuals. WPSS is decomposed into BDSS (Between-Day Sum of Squares) and WDSS (With-in Day Sum of Squares) and it was assumed that BDSS is decomposed into day-of-the-week variability and unexplained probability part. Next, BPSS (Between Person Sum of Squares) is the result of estimating interpersonal variability. A large value means large variability between individuals, and a small value means small variability between individuals. These variables can be calculated using the following formulas.
W P S S i = k = 1 K i ( t i k t ¯ i ) 2 ,
W P S S = i = 1 I k = 1 K i ( t i k t ¯ i ) 2 ,
B D S S = k = 1 K i I ( t ¯ k t ¯ ) 2 ,
B P S S = i = 1 I K i ( t ¯ i t ¯ ) 2 ,
where W P S S i is the within-person sum of squares of individual i, K i is the number of observation days for individual i, t i k is the number of stops made by person i on day k, t ¯ i is the mean number of stops made by person i, B D S S is the Between-Day Sum of Squares, t ¯ k is the mean number of stops made on day k, t ¯ is the mean number of stops made by all persons in the sample, and B P S S is the Between-Person Sum of Squares.
In Formulas (2)–(5), if the variables related to travel behavior are replaced with variables associated with charging behavior, the variability in charging patterns can also be quantified. This study analyzed both the variability in travel behaviors and the variability in charging behaviors. Finally, a linear regression model with intrapersonal variability as a dependent variable was analyzed to derive factors affecting intrapersonal variability in charging patterns. The logarithmic value of variability was used to secure the normality of the dependent variable, and the model analysis was performed using Stata analysis software (Version 17).
Figure 2 illustrates the data collection and processing, and analysis methods used in this study.

3. Results

3.1. Charging Pattern Analysis

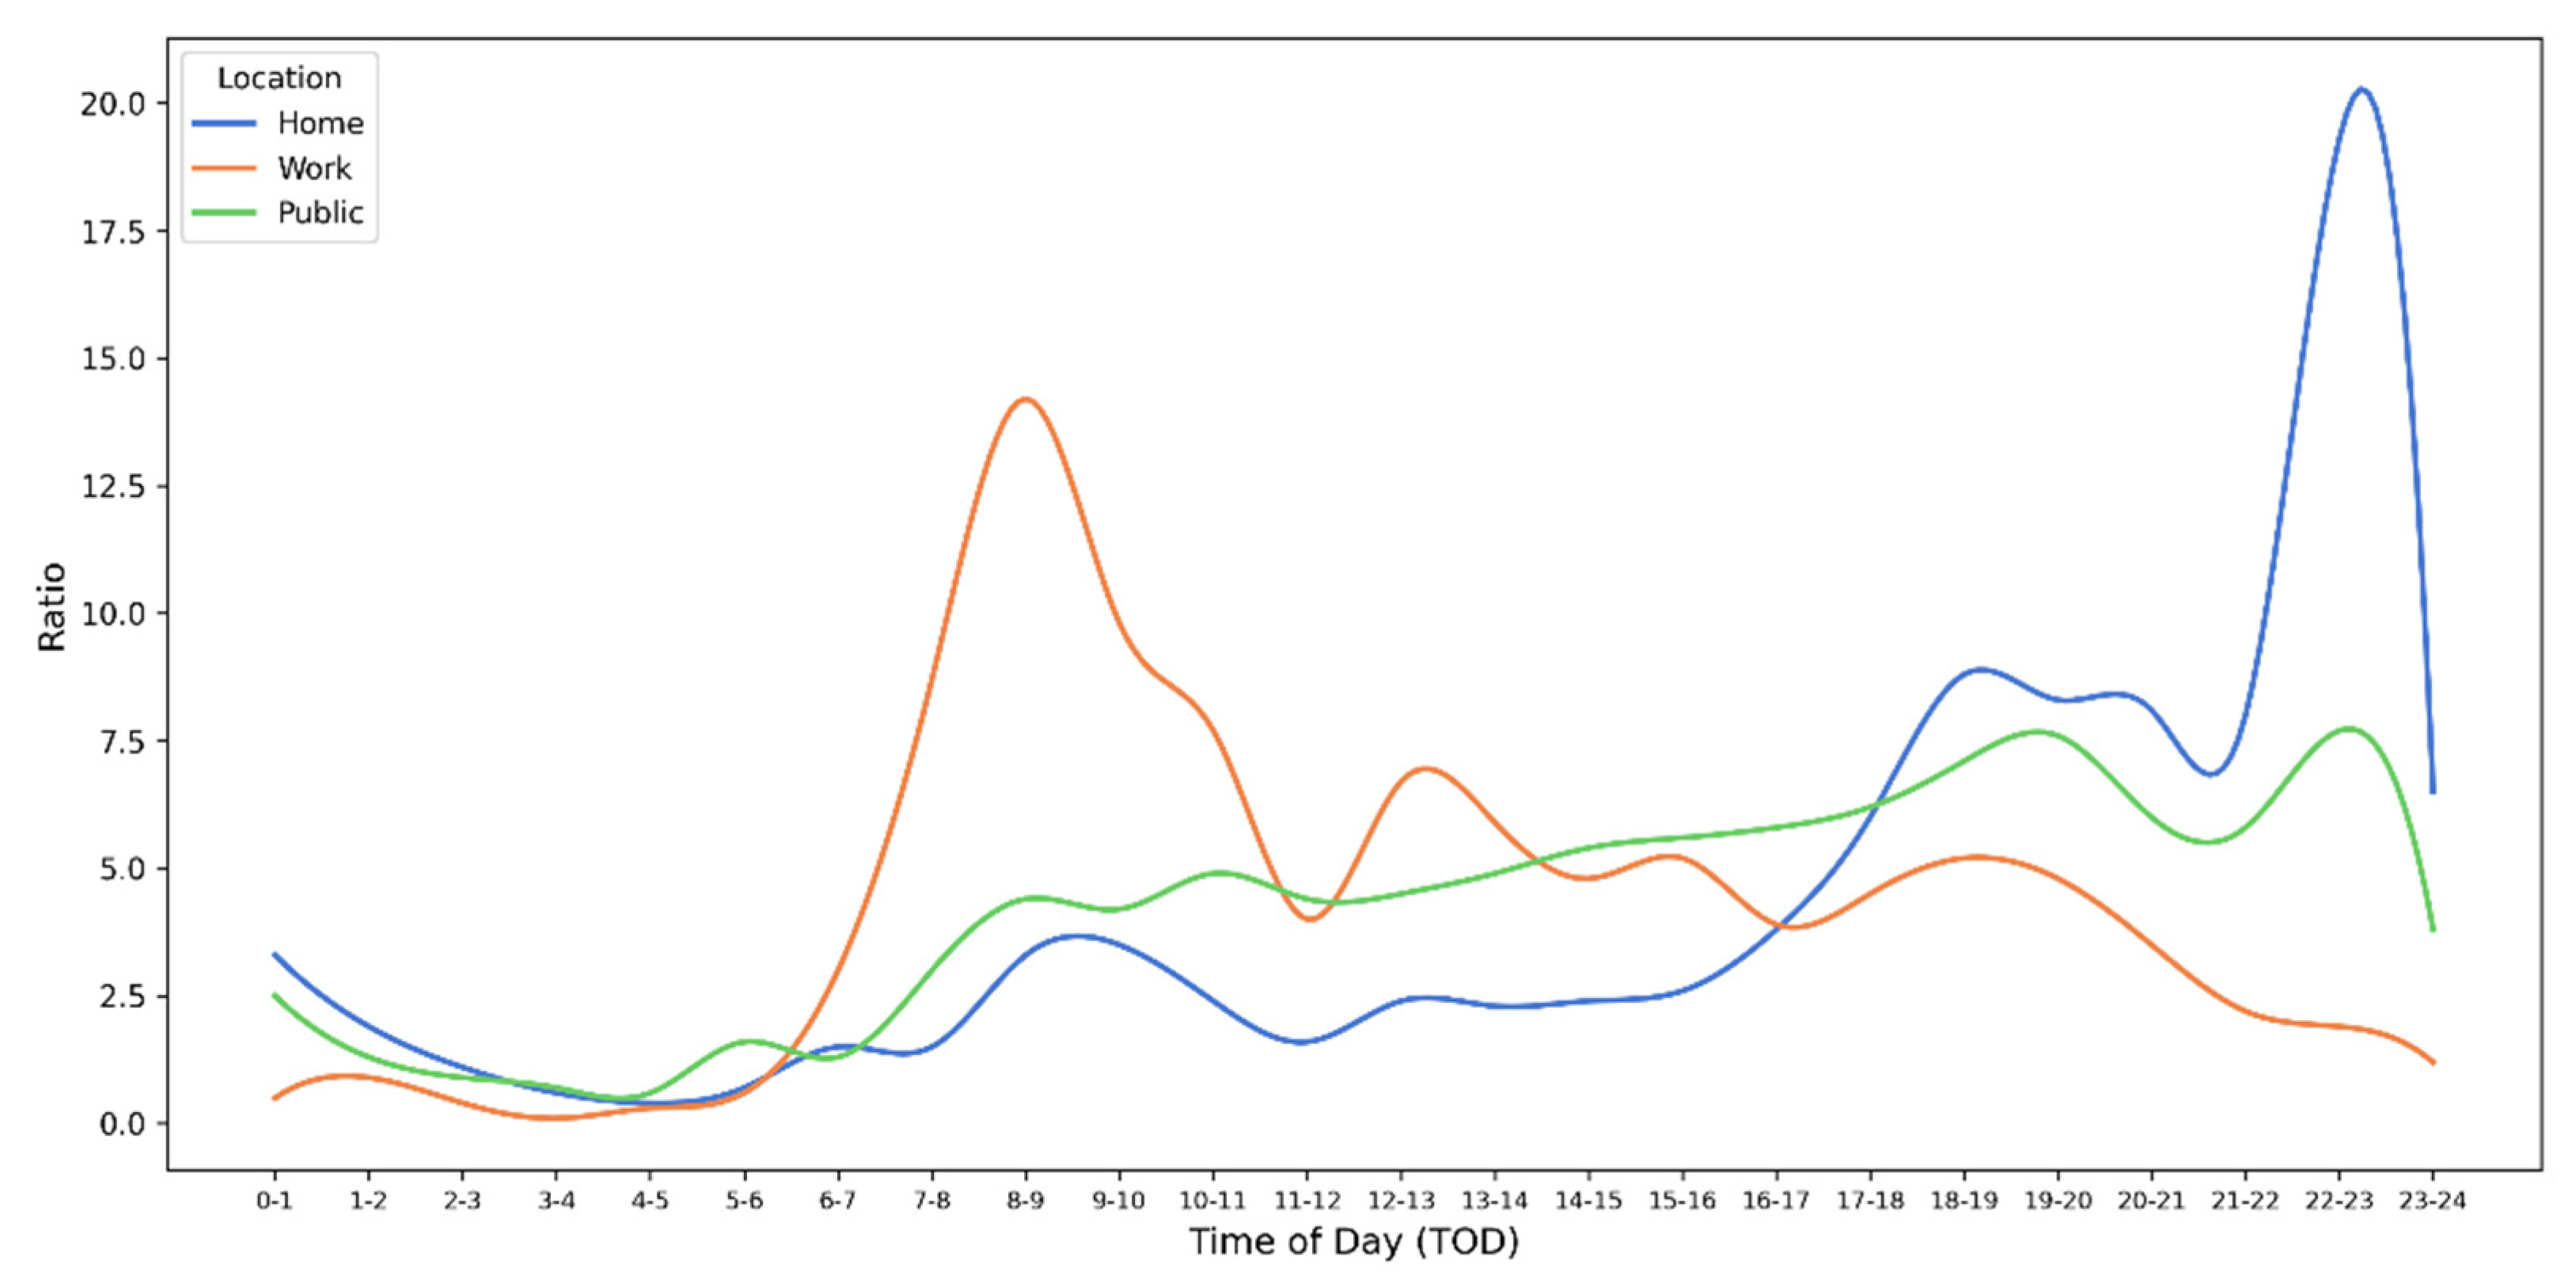
3.1.1. Spatiotemporal Patterns of Charging Behaviors

The spatiotemporal distribution of charging intervals was analyzed using 17,206 charging session data from 351 electric vehicles collected over 115 days from 9 June 2023 to 1 October 2023 [26]. The number of observations by charging point was 6138 (35.7%) at home, 2324 (13.5%) at workplaces, and 8743 (50.8%) at public charging stations.
The aggregated average value of the charging interval was estimated by aggregating all charging intervals derived from the entire charging session data. The average was 2.25 days calculated using Equation (6). Next, to calculate the disaggregated average, the average charging interval of individual vehicles was estimated, and the average of the values was calculated. The disaggregated average was 3.64 days calculated using Equation (7). The difference between the aggregated value and the disaggregated value was relatively large, which means that there is considerable heterogeneity among individuals.
A g g r e g a t e d   a v e r a g e   o f   c h a r g i n g   i n t e r v a l = i = 1 I j = 1 η i λ i j / i = 1 I η i j ,
D i s a g g r e g a t e d   a v e r a g e   o f   c h a r g i n g   i n t e r v a l = i = 1 I ( j = 1 η j λ i j / η i j ) / I ,
where λ i j is jth charging interval of individual i, η i j is the number of observations of the charging interval of individual i.
We extracted users who only charge at a single location to analyze the charging interval by charging point. As a result, 103 out of 351 vehicles (29.4%) used only one charging point, consisting of 6% charging at home, 1% charging at workplaces, and 22.8% charging at public charging stations. The average charging interval was 2.86 days at home, 1.58 days at workplaces, and 2.53 days at public charging stations. Home charging had the longest charging interval and the largest standard deviation. Table 2 summarizes the charging interval estimation results presented above.
Figure 3 shows the time-of-day (TOD) distribution of charging start times by charging point. Home charging has a high charging frequency after work hours, and the peak time is 22:00–23:00. Work charging has a peak time from 8:00–9:00 before work hours start, and charging mainly occurs during the day. Public charging has a peak time from 22:00–23:00, the same as home charging. As shown in Figure 3, the temporal distribution of charging demand varies depending on the charging point.

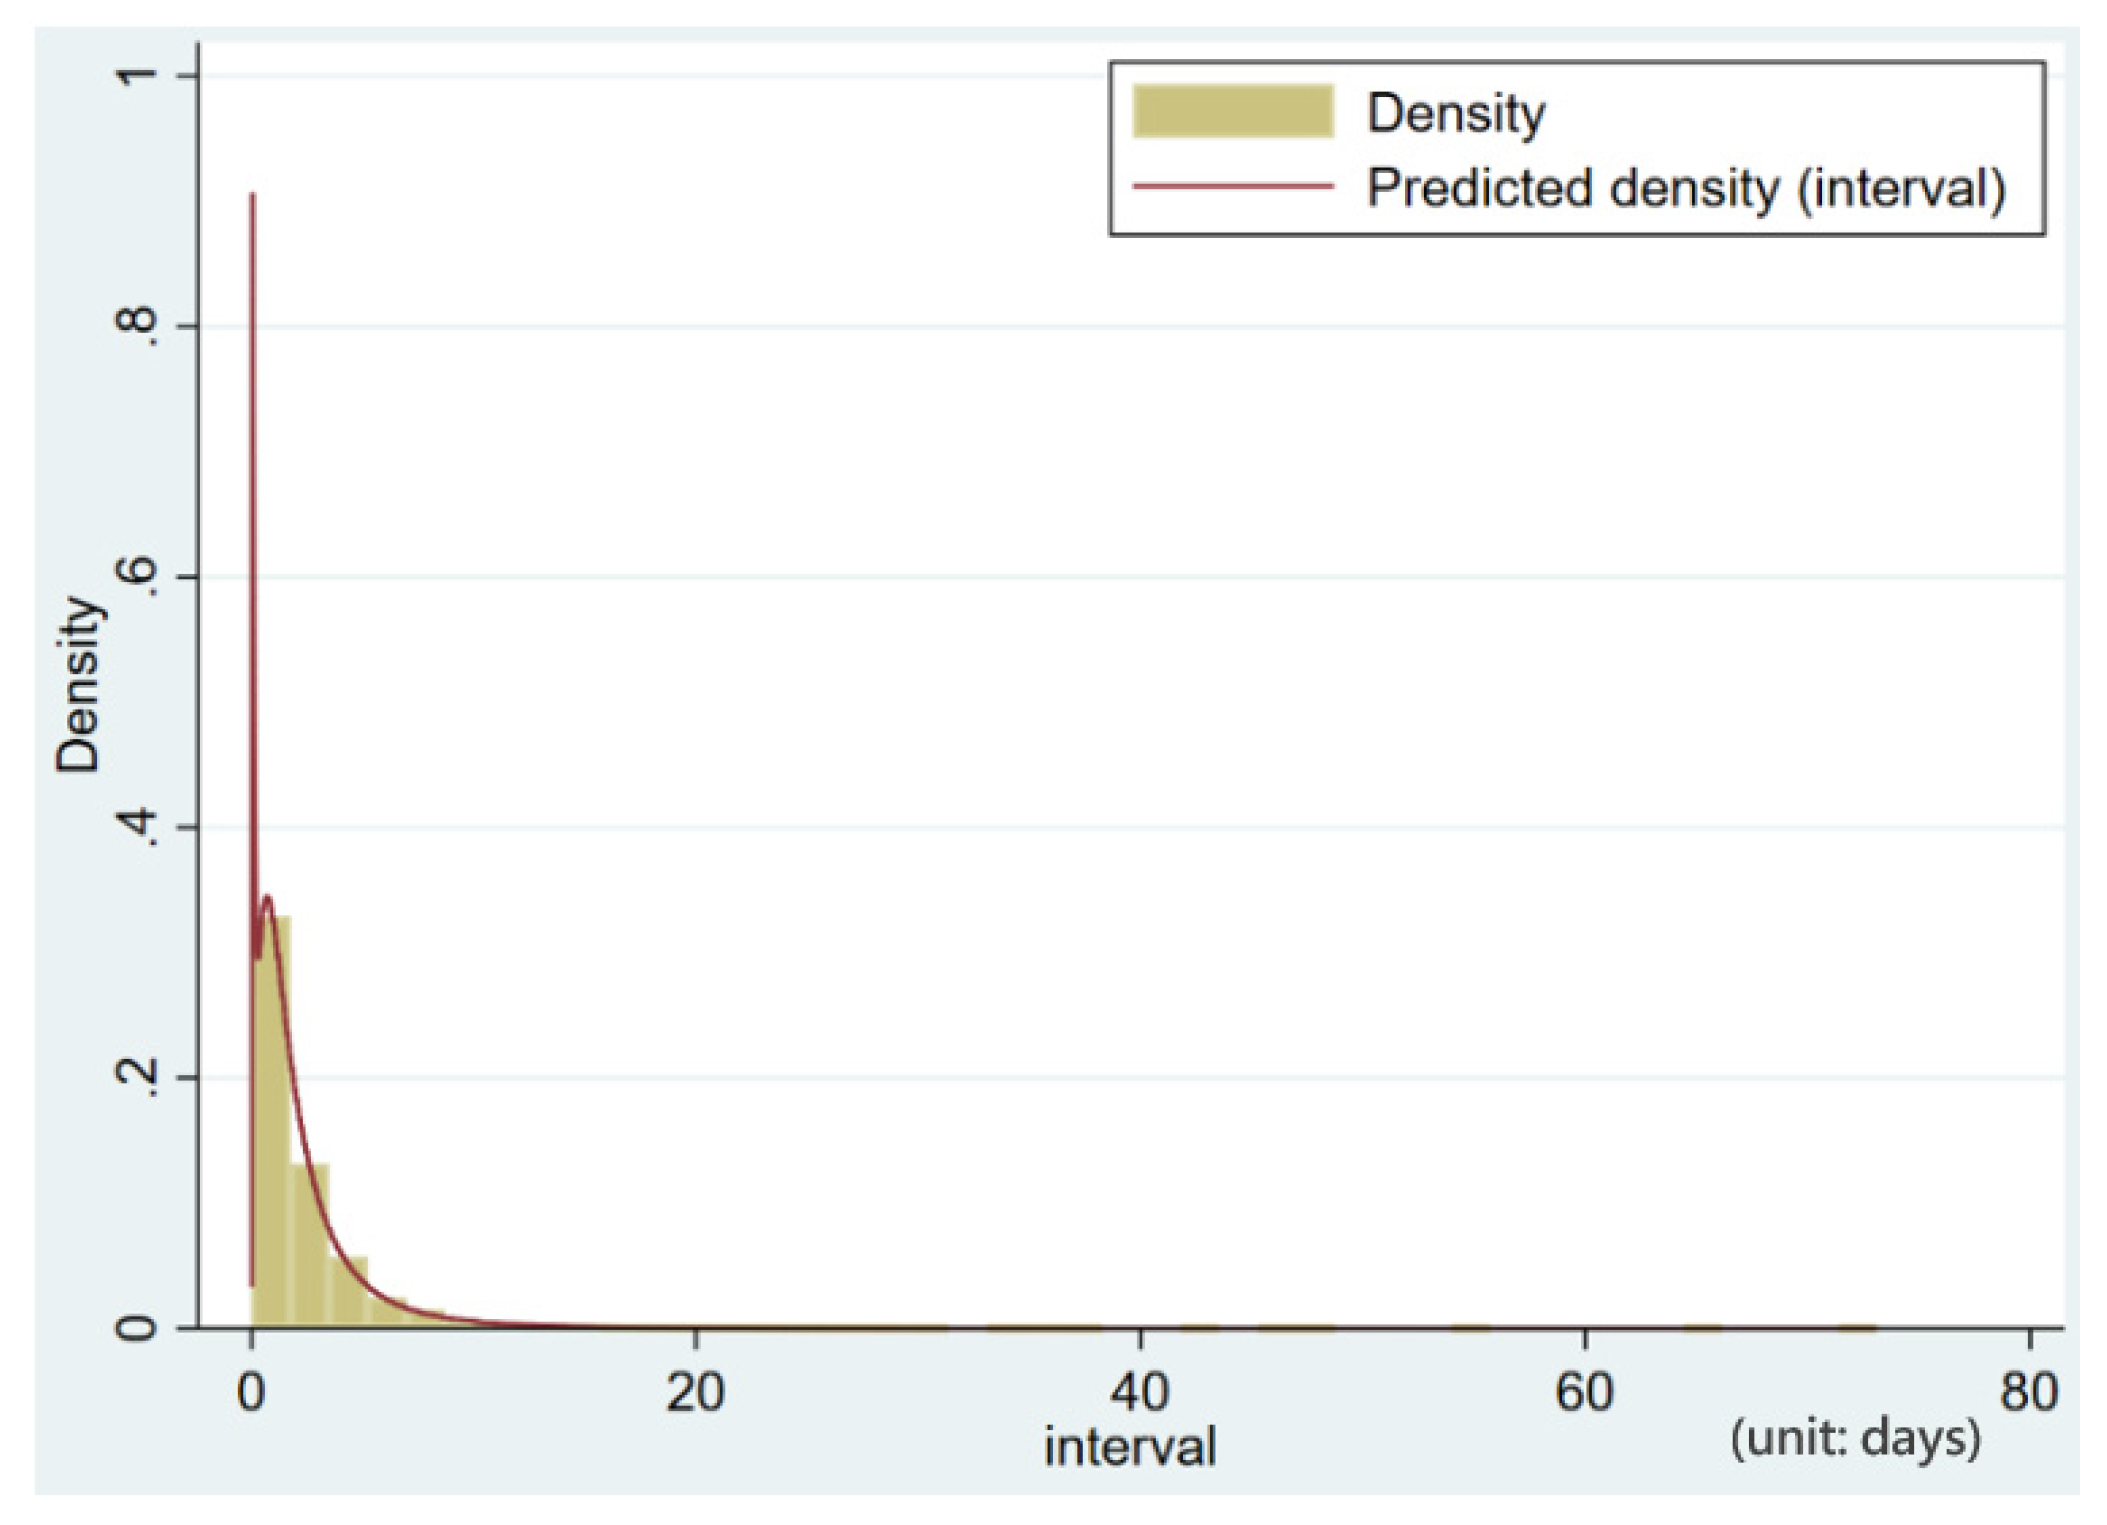
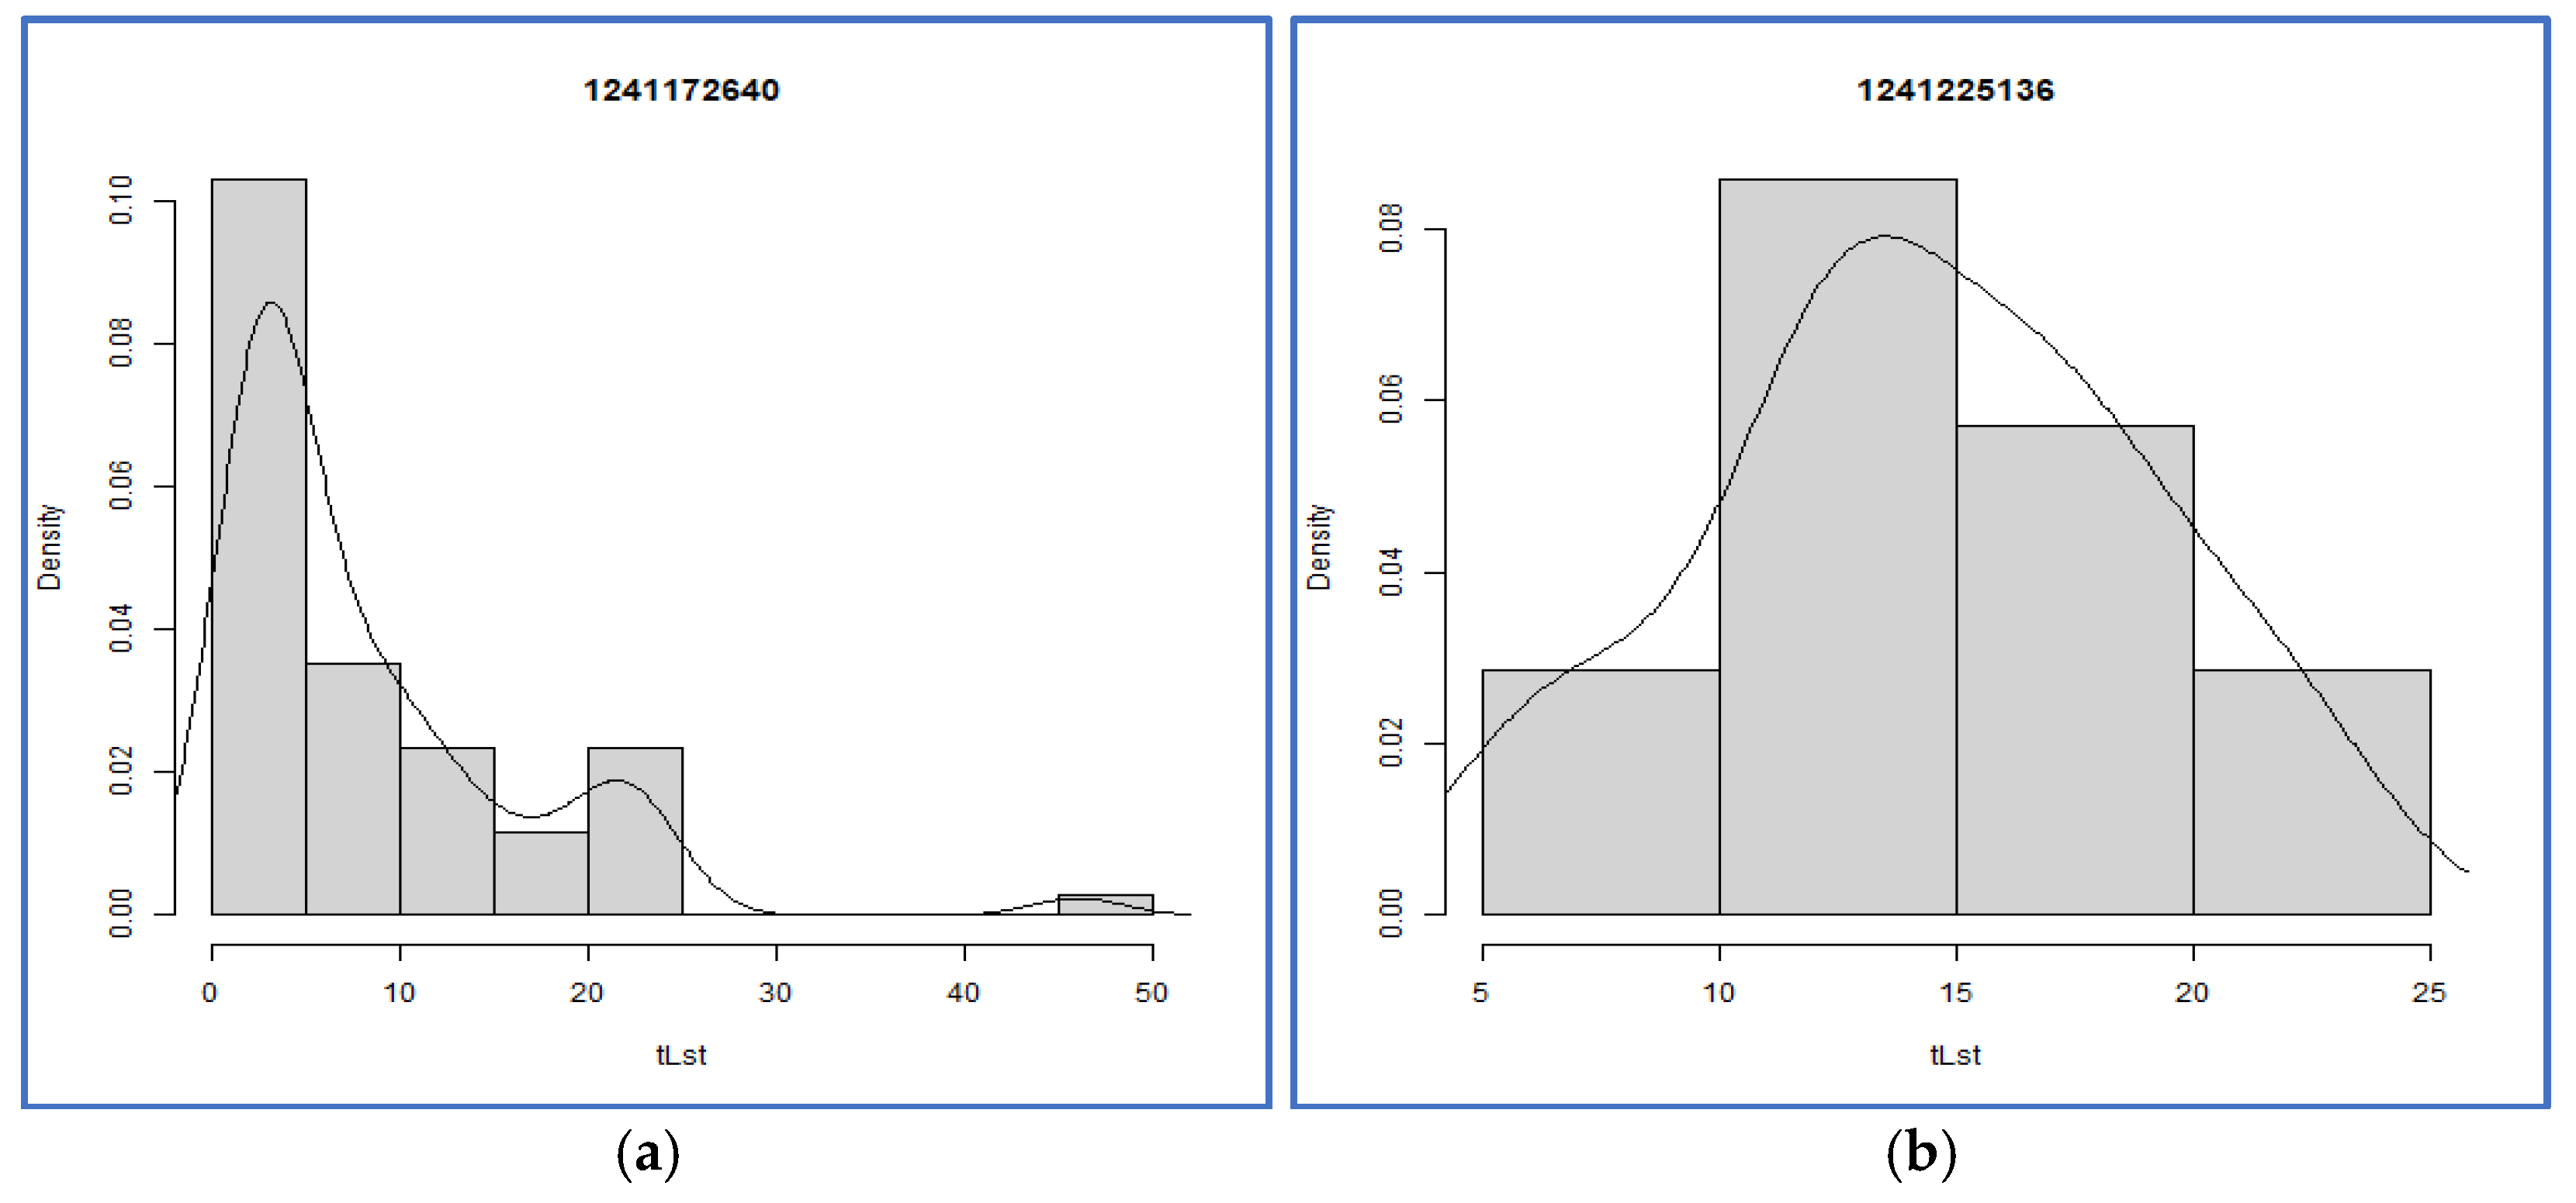
3.1.2. Distributions of Charging Interval: Aggregated Versus Individual

As analyzed in the previous session, a large difference between the aggregated average and the disaggregated average of the charging interval means that there is heterogeneity between individuals. We examined the heterogeneity of the charging interval through GMM analysis. The GMM was used to analyze the distribution and number of components in the charging interval, and the distribution form was examined for both normal and log-normal distributions, and the log-normal distribution was found to be more suitable.
First, we derived the charging interval value and frequency distribution using aggregated charging interval observations. Then, we analyzed the number of distribution components in the GMM from two to seven to derive the optimal model. Depending on the number of components, the log-likelihood value, AIC (Akaike Information Criterion) value, BIC (Bayesian Information Criterion) value, and component weight were estimated. We selected the two-component log-normal distribution with the smallest AIC and BIC values as the optimal model. Table 3 shows the results of the model analysis, and Figure 4 compares the density distribution of the model with that of charging interval observation.
Second, we analyzed the distribution of charging intervals for each vehicle using a GMM analysis. The Shapiro–Wilk test was used to verify the normality of distribution for all vehicles, and four vehicles were excluded from the analysis as they were not suitable due to insufficient observations.
The analysis of the charging interval distribution of 347 EVs revealed that 75% of the vehicles followed a log-normal distribution similar to the aggregate distribution. Figure 5a shows the density distribution of vehicle ID 1241172640 as one of the results. It shows that the vehicle has a regular charging pattern, typically charging every four or five days. On the other hand, the remaining 25% of vehicles show different patterns, such as a normal distribution or uniform distribution. Figure 5b shows one example for vehicle ID 1241225136, which follows a normal distribution. The vehicle has scattered charging intervals and has relatively low regularity in its charging pattern.
The results show that our observation sample also contains a mix of drivers with regularity and drivers with irregularity in their EV charging patterns. Therefore, infrastructure planning based on a single static charging pattern, such as the aggregated results, will have difficulty capturing the actual EV charging demand.

3.2. Analysis of Variability in Charging Patterns

As shown in the results of the previous section, individual charging patterns show variability in charging points, charging times, and charging intervals. We analyzed the variability in travel and charging patterns of electric cars through the equations that quantify the variability in the travel patterns presented in [17,25]. To sufficiently include variability due to weather and season, the analysis was based on data collected from 351 electric cars for one year from March 2023 to February 2024.

3.2.1. Trips and Charging Frequencies per Day

We selected trips and charging frequencies as variables with daily values to estimate the day-to-day variations in travel and charging patterns. The individual averages are calculated by dividing the total number of trips and charging frequencies performed by an individual during the analysis period by the number of observation days, as shown in Figure 6. On the other hand, the daily averages are calculated by dividing the total number of trips and charging frequencies on that day by the number of observed vehicles, as shown in Figure 7.
The mean and standard deviation for both the individual average and the daily average are shown in Table 4. When comparing the mean of the individual average and the mean of the daily average for trips, the two values are similar, but the values of standard deviations have a relatively large difference. Similarly, the mean values of the individual average and the daily average for charging frequencies are similar, but the standard deviations have a relatively large difference.

3.2.2. Quantified Variability in Trips and Charging Frequencies

In the previous Section 2.2.2, the Equations (2)–(5) were applied to calculate the variability indices of travel frequency and charging frequency. The results of calculating the WPSS, BDSS, BPSS, WDSS, and TSS, respectively, are summarized in Table 5.
The results of decomposing the intrapersonal and interpersonal variability in trips and charging frequencies are summarized as follows. The proportions of interpersonal variability in the total variability in trips and charging frequencies are 25.6% and 23.2%, respectively, showing similar proportions. Both trips and charging patterns show that intrapersonal variability accounts for a larger proportion of the total variability than interpersonal variability. The proportion of daily variability in intrapersonal variability is 2.56% for trips and 1.07% for charging frequency. The results show that, similar to the [17,25] study, daily variability has a low impact on within-person variability. The variability decomposition of trips and charging frequencies confirms that charging frequency shows an overall trend that is similar to the variability patterns of trips.

3.2.3. Factors Affecting Intrapersonal Variability in Charging Patterns

The intrapersonal variability decomposition results show that the proportion of daily variability is very low. Therefore, this study applied a regression model to explore factors affecting the intrapersonal variability in charging patterns other than daily variations. The dependent variable was the WPSSi of the individual, and the log value was used to secure normality. The explanatory variables are composed of the vehicle and driver characteristic variables and the driving and charging frequencies of individual vehicles, as shown in Table 6. To avoid the multicollinearity problem, we analyzed the model by controlling for only variables with a VIF (variation inflation factor) of less than 10. The estimated model has a sufficiently large F value to secure the significance of the model itself, and R2 was 0.53. The results of the model analysis are shown in Table 7.
The statistically significant explanatory variables include five variables (BOLT, Others, high income, average number of trips, and average number of charges) at the 95% significance level and one variable (battery capacity) at the 90% significance level. First, vehicle-related variables were significant in factors impacting intrapersonal variability, and the BOLT and other model vehicles tended to have relatively lower variability. Battery capacity also showed a negative coefficient value, which means that the larger the capacity, the lower the variability. In addition, it was found that the higher the income level, the lower the variability. Both trips and charging frequencies have positive coefficient values, which means that the variability increases as trips and charging increase.
Although this study applied only limited variables due to data limitations, trip pattern is considered an important factor in interpreting the variability in charging patterns, and various trip characteristics, such as the trip purpose, trip time and duration, location, and dwell time, should be reviewed to explain the variability. In this study, we included the average number of trips and region as variables related to the trip pattern. The number of trips was statistically significant with the variability in the charging pattern, and the more trips there were, the higher the variability in the charging pattern. However, the region, which can reflect the driving environment, was not statistically significant.
Although not addressed in the above model, seasonal characteristics also have a significant impact on charging patterns. We estimated the intrapersonal variability in charging frequency by season. As a result, as shown in Figure 8, the variability in the charging frequency was the greatest in winter, and the average variability was similar in other seasons. This trend is believed to be due to the lower temperature in the winter, which lowers the charging speed and fuel efficiency.

4. Discussion

We analyzed electric cars’ charging patterns in Korea using panel data collected over a year via OBDs installed in cars. As a result, we summarize the following key implications regarding the regularity and variability in charging patterns.
The average charging interval was 2.25 days for the aggregated average and 3.65 days for the disaggregated average. We found that charging decisions were made more frequently than the required charging needs, considering that the average daily driving distance of Korean passenger cars is 39 km per day and the average range of electric cars is over 400 km per charge. It also means that charging opportunities are increasing due to the expansion of public charging infrastructure in Korea. When we analyzed the entire charging session data by dividing the charging points into home, workplaces, and public charging stations, the public charging frequency was the highest. The reason why public charging is so frequent in Korea is believed to be due to the residential nature of many multi-unit dwellings and the high accessibility of public charging. This characteristic is even more pronounced when compared to other countries. In the California study, 53% of drivers only charge at home, and home charging is the primary charging method for all drivers [27]. The German study also assumes that home charging has the highest frequency [28]. The distribution of charging start times by charging points showed similar distributions for home charging and public charging, and the peak hours were also the same, at 22:00–23:00. However, the charging ratio at night was higher for home charging, and the charging ratio during the day was higher for public charging.
The distribution of charging intervals was estimated by applying the GMM to explore the regularity of charging behaviors. As a result, 75% of the individuals have a regular log-normal pattern of charging intervals, while 25% show an irregular pattern. This result means that the charging demand derived from a simple assumption about charging behaviors at the aggregated level in infrastructure planning or power demand forecasting may differ from the actual charging demand. Therefore, as the number of electric vehicles increases, research on charging behaviors and the variability in charging patterns and factors affecting them becomes more important.
Finally, we applied a method to quantify the variability in charging patterns and decomposed it into intrapersonal variability and interpersonal variability. As a result, the intrapersonal variability was more than three times higher than the interpersonal variability, and the proportion explained by daily variation within the intrapersonal variability was low, at about 1%. The variability in charging frequencies and trips showed similar patterns, and the variability in electric car trips was also similar to the results of the variability in conventional car trips analyzed by [17]. It implies that EV trips and charging behaviors are highly correlated, and travel characteristics are an important factor in explaining charging behaviors. Therefore, future research is needed to analyze charging patterns combined with travel characteristics (time and place, duration, and travel purpose).

5. Conclusions

As the number of EVs increases, effective charging infrastructure planning and grid load management strategies become more important. This study aimed to analyze the charging patterns of electric cars using panel data from 351 vehicles for one year from 2023. Using this longitudinal data, we explored the spatiotemporal characteristics of charging patterns in Korea, examined the regularities of charging patterns, and quantified the variability in charging and travel behaviors.
This study is one of the few studies on EV charging in Korea using longitudinal panel data. Nevertheless, future research is suggested for the regularity and variability in charging patterns. First, considering the characteristics of EV charging, seasonal and monthly variability analyses can be discussed. Second, regularity and variability can be explored, centered on charging and activity locations. In addition to the variability indices applied in this study, alternative indices, such as the Herfindahl–Hirschman Index, are suggested to be reviewed [29,30,31]. The previous studies have shown that travel characteristics, such as the location and transport mode, have repetitiveness, and this approach is also valid for charging pattern analyses. Future research will be needed to clarify the regularity through the combined analysis of travel and charging activities. It can also provide an in-depth look at the impact of travel patterns, such as the travel distance, travel time, location, and activity period, on charging patterns.

Author Contributions

Conceptualization, J.P. and C.K.; methodology, J.P. and C.K.; software, J.P. and C.K.; validation, J.P. and C.K.; formal analysis, J.P.; investigation, J.P.; resources, J.P.; data curation, J.P.; writing—original draft preparation, J.P.; writing—review and editing, J.P. and C.K.; visualization, J.P.; supervision, J.P.; project administration, J.P.; funding acquisition, J.P. All authors have read and agreed to the published version of the manuscript.

Funding

This research received no external funding.

Institutional Review Board Statement

Studies that use existing data or documents produced by the public sector are exempt from ethical review according to research guidelines of the Korea National Institute for Bioethics policy.

Informed Consent Statement

Informed consent was obtained from all subjects involved in this study.

Data Availability Statement

Data are contained within the article.

Conflicts of Interest

The authors declare no conflicts of interest.

References

  1. International Energy Agency (IEA). Global EV Outlook 2024. Moving Towards Increased Affordability. Available online: https://iea.blob.core.windows.net/assets/a9e3544b-0b12-4e15-b407-65f5c8ce1b5f/GlobalEVOutlook2024.pdf (accessed on 1 February 2025).
  2. Cao, Y.; Tang, S.; Li, C.; Zhang, P.; Tan, Y.; Zhang, Z.; Li, J. An optimized EV charging model considering TOU price and SOC curve. IEEE Trans. Smart Grid 2011, 3, 388–393. [Google Scholar] [CrossRef]
  3. Franke, T.; Krems, J.F. Understanding charging behaviour of electric vehicle users. Transp. Res. Part F Traffic Psychol. Behav. 2013, 21, 75–89. [Google Scholar] [CrossRef]
  4. Daina, N.; Sivakumar, A.; Polak, J.W. Electric vehicle charging choices: Modelling and implications for smart charging services. Transp. Res. Part C Emerg. Technol. 2017, 81, 36–56. [Google Scholar] [CrossRef]
  5. Potoglou, D.; Song, R.; Santos, G. Public charging choices of electric vehicle users: A review and conceptual framework. Transp. Res. Part D 2023, 121, 103824. [Google Scholar] [CrossRef]
  6. Kim, S.; Yang, D.; Rasoulli, S.; Timmermans, H. Heterogeneous hazard model of PEV users charging intervals: Analysis of four year charging transactions data. Transp. Res. Part C 2017, 82, 248–260. [Google Scholar] [CrossRef]
  7. Chen, C.; Song, Y.; Hu, X.; Guardiola, I.G. Analysis of electric vehicle charging behavior patterns with function principal component analysis approach. J. Adv. Transp. 2020, 2020, 8850654. [Google Scholar] [CrossRef]
  8. Shahriar, S.; Al-Ali, A.R.; Osman, A.H.; Dhou, S.; Nijim, M. Machine learning approaches for EV charging behavior: A review. IEEE Access 2020, 8, 168980–168993. [Google Scholar] [CrossRef]
  9. Mortimer, B.J.; Hecht, C.; Goldbeck, R.; Sauer, D.U.; De Doncker, R.W. Electric Vehicle Public Charging Infrastructure Planning Using Real-World Charging Data. World Electr. Veh. J. 2022, 13, 94. [Google Scholar] [CrossRef]
  10. Munshi, A.; Mohamed, Y.A.-R.I. Extracting and Defining Flexibility of Residential Electrical Vehicle Charging Loads. IEEE Trans. Ind. Inform. 2018, 14, 448–461. [Google Scholar] [CrossRef]
  11. Crozier, C.; Morstyn, T.; McCulloch, M. Capturing diversity in electric vehicle charging behaviour for network capacity estimation. Transp. Res. Part D Transp. Environ. 2021, 93, 102762. [Google Scholar] [CrossRef]
  12. Huang, P.; Ma, Z. Unveiling electric vehicle (EV) charging patterns and their transformative role in electricity balancing and delivery: Insights from real-world data in Sweden. Renew. Energy 2024, 236, 121511. [Google Scholar] [CrossRef]
  13. Powell, S.; Cezar, G.V.; Rajagopal, V. Scalable probabilistic estimates of electric vehicle charging given observed driver behavior. Appl. Energy 2022, 309, 118382. [Google Scholar] [CrossRef]
  14. Martz, A.; Langenmayr, U.; Ried, S.; Seddig, K.; Jochem, P. Charging behavior of electric vehicles: Temporal clustering based on real-world data. Energies 2022, 15, 6575. [Google Scholar] [CrossRef]
  15. Sun, M.; Shao, C.; Zhuge, C.; Wang, P.; Yang, X.; Wang, S. Uncovering travel and charging patterns of private electric vehicles with trajectory data: Evidence and policy implications. Transportation 2021, 49, 1409–1439. [Google Scholar] [CrossRef]
  16. Axhausen, K.W.; Zimmermann, A.; Schönfelder, S.; Rindsfüser, G.; Haupt, T. Observing the rhythms of daily life: A six-week travel diary. Transportation 2002, 29, 95–124. [Google Scholar] [CrossRef]
  17. Pas, E.I. Intrapersonal variability and model goodness-of-fit. Transp. Res. 1987, 21, 431–438. [Google Scholar] [CrossRef]
  18. Schlich, R.; Axhausen, K.W. Habitual travel behaviour: Evidence from a six-week travel diary. Transportation 2003, 30, 13–36. [Google Scholar] [CrossRef]
  19. Kitamura, R.; Yamamoto, T.; Susilo, Y.O.; Axhausen, K.W. How routine is a routine? An analysis of the day-to-day variability in prism vertex location. Transp. Res. Part A 2006, 40, 259–279. [Google Scholar] [CrossRef]
  20. Helmus, J.R.; Lees, M.H.; van den Hoed, R. A data driven typology of electric vehicle user types and charging sessions. Transp. Res. Part C Emerg. Technol. 2020, 115, 102637. [Google Scholar] [CrossRef]
  21. Liu, Y.; Hong, Y.; Hu, C. Research on Big Data Mining Technology of Electric Vehicle Charging Behaviour. Elektron. Elektrotechnika 2019, 25, 55–61. [Google Scholar] [CrossRef]
  22. Patil, P.; Kazemzadeh, K.; Bansal, P. Integration of charging behavior into infrastructure planning and management of electric vehicles: A systematic review and framework. Sustain. Cities Soc. 2023, 88, 104265. [Google Scholar] [CrossRef]
  23. Park, J.; Kim, C. Charging pattern of Electric Vehicle User and Affecting Facotrs: Latent Class Analysis Approach. Trans. Korean Inst. Electr. Eng. 2022, 71, 1639–1645. [Google Scholar] [CrossRef]
  24. StataCorp. Finite Mixture Model (FMMs). Available online: https://www.stata.com/features/overview/finite-mixture-models/ (accessed on 1 October 2024).
  25. Raux, C.; Ma, T.Y.; Cornelis, E. Variability in daily activity-travel patterns: The case of a one-week travel diary. Eur. Transp. Res. Rev. 2016, 8, 26. [Google Scholar] [CrossRef]
  26. Kim, C.; Park, J.; Yoo, J.; Park, J. An empirical study on spatiotemporal distribution of charge load by electric vehicle driver in Kora. In Proceedings of the EVS 37, International Electric Vehicles Symposium and Exhibition, Seoul, Republic of Korea, 23–26 April 2024. [Google Scholar]
  27. Lee, J.H.; Chakraborty, D.; Hardman, S.J.; Tal, G. Exploring electric vehicle charging patterns: Mixed usage of charging infrastructure. Transp. Res. Part D Transp. Environ. 2020, 79, 102249. [Google Scholar] [CrossRef]
  28. Adenaw, L.; Lienkamp, M. Multi-Criteria, Co-Evolutionary Charging Behavior: An Agent-Based Simulation of Urban Electromobility. World Electr. Veh. J. 2021, 12, 18. [Google Scholar] [CrossRef]
  29. Herfindahl, O.C. Concentration in the Steel Industry. Ph.D. Thesis, Columbia University, New York, NY, USA, 1950. [Google Scholar]
  30. Susilo, Y.O.; Axhausen, K.W. Repetitions in individual daily activity–travel–location patterns: A study using the Herfindahl–Hirschman Index. Transportation 2014, 41, 995–1011. [Google Scholar] [CrossRef]
  31. Crawford, F.; Watling, D.P.; Connors, R.D. Analysing Spatial Intrapersonal Variability of Road Users Using Point-to-Point Sensor Data. Netw. Spat. Econ. 2023, 23, 373–406. [Google Scholar] [CrossRef]
Figure 1. OBD device and information application.
Wevj 16 00256 g001
Figure 2. Analysis procedure and methods.
Wevj 16 00256 g002
Figure 3. TOD distribution of charging start time by location.
Wevj 16 00256 g003
Figure 4. Density distribution of aggregated charging intervals.
Wevj 16 00256 g004
Figure 5. Examples of EV charging interval distributions; (a) log-normal distribution for vehicle ID 1241172840; (b) normal distribution for vehicle ID 1241225136.
Wevj 16 00256 g005
Figure 6. Individual averages of trips and charging frequencies of 351 electric cars.
Wevj 16 00256 g006
Figure 7. Daily averages of trips and charging frequencies from 1 March 2023 to 29 February 2024.
Wevj 16 00256 g007
Figure 8. Intrapersonal variability in charging frequencies by season.
Wevj 16 00256 g008
Table 1. Characteristics of corresponding electric cars and drivers.
CharacteristicsRatio (%)
GenderMale driver90.9
Female driver9.1
AgeUnder 4030.5
40 to 6063.5
Above 606.0
EV modelIONIQ28.2
BOLT22.2
EV619.4
KONA14.2
Others 16.0
Battery capacityUnder 70 kwh52.1
Above 70 kwh47.9
Description of familySingle family14.5
Dual family36.7
Multi family48.7
OccupationOffice worker40.7
Others59.3
Average monthly incomeLow income19.1
Middle income63.0
High income17.9
RegionMetropolitan area32.2
Others 67.8
Home charging availabilityAvailable70.1
Unavailable 29.9
Table 2. Charging interval statistics.
ClassificationAverage of Charging Interval (Day)Standard Deviation
of Charging Interval (Day)
Aggregated average2.252.88
Disaggregated average3.653.30
Home charging only2.863.56
Workplace charging only1.581.08
Public charging only2.532.88
Mixed charging *2.142.83
Note: * is mixed with (home and public) or (work and public) or (home and work) charging.
Table 3. Effect of components of log-normal distribution on charging interval.
Component TypeRatio (%)Average
(Day)
Variance
(Day Square)
Information Index
Component 113.3−2.30−0.18Log-likelihood = −29,341.8, AIC *= 58,693.6, BIC **= 58,732.1
Component 286.70.52−0.09
Note: * Akaike’s information criterion and ** Bayesian information criterion.
Table 4. Comparison of means and standard deviations between individual averages and daily averages.
ClassificationMeanStandard Deviation
Individual
averages
Trips3.551.39
Charging frequency0.620.54
Daily
averages
Trips3.560.38
Charging frequency0.540.10
Note: average unit is frequency/day.
Table 5. Interpersonal and interpersonal variability analysis for trips and charging patterns.
VariabilityTripsCharging Frequency
Total variabilityTSS794,552115,203
Interpersonal variabilityBPSS203,41026,665
Intrapersonal variabilityWPSS (C = A + B)591,14288,538
BDSS (A)15,154946
WDSS (B)575,98887,592
Ratio of (A) to (B)2.56%1.07%
Ratio of BPSS to TSS25.6%23.15%
Table 6. Explanatory variables of regression model.
Key Variables Specific VariablesDefinition
GenderMaleIf (gender = male), 1, otherwise 0
AgeAge30If (age < 30), age30 = 1, otherwise age30 = 0
Age4050If (age >= 30 and age < 50), age4050 =1, otherwise age4050 = 0
Age60If (age >= 60), age60 = 1, otherwise age60=0
EV modelIONIQIf (EV model = IONIQ), 1, otherwise 0
BOLTIf (EV model = BOLT), 1, otherwise 0
EV6If (EV model = EV6), 1, otherwise 0
KONAIf (EV model = KONA), 1, otherwise 0
Others If (EV model is not above type), 1, otherwise 0
Battery capacityBattery capacityBattery capacity of EV
Number of family Single familyIf (number of family = 1), 1, otherwise 0
Dual familyIf (number of family = 2), 1, otherwise 0
Multi familyIf (number of family = 3), 1, otherwise 0
OccupationOffice workerIf (occupation = office worker), 1, otherwise 0
Average monthly incomeLow incomeIf (average monthly income of the respondent’s household (KRW 10,000) < 300), 1, otherwise 0
Middle incomeIf (average monthly income of the respondent’s household (KRW 10,000) > 300 & income < 1000), 1, otherwise 0
High incomeIf (average monthly income of the respondent’s household (KRW 10,000) >= 1000), 1, otherwise 0
Region Region If (Region of residence is metropolitan area), 1, otherwise 0
Home charging Home charging availability If (Home charging is available) 1, otherwise 0
TripAverage number of tripsAverage number of trips per day
Charging Average number of chargingAverage number of charging frequencies per day
Table 7. Regression model of intrapersonal variability.
VariablesCoefficientStandard ErrorzP > │z│
Male−0.0220.138−0.160.871
Age60−0.2270.167−1.360.174
IONIQ base
BOLT−0.615 (***)0.211−2.920.004
EV6−0.0610.112−0.550.586
KONA−0.0930.245−0.380.704
Others−0.487 (**)0.237−2.060.040
Battery capacity−0.027 (*)0.016−1.740.083
Multi family0.0830.0761.100.274
Office worker0.0040.1100.040.967
High income−0.375 (**)0.162−2.310.022
Region0.0800.0801.010.312
Home charging availability0.0310.1320.240.814
Average number of trips0.061 (**)0.0292.080.038
Average number of charges1.047 (***)0.07713.660.000
Constant6.3290.21540.790.431
Number of observations = 314, F (14,299) = 23.85, Prob > F = 0.0000, R-squared = 0.5276, Adj R-squared 0.5055. Note: *** 99% significant level, ** 95% significant level, * 90% significant level.
Disclaimer/Publisher’s Note: The statements, opinions and data contained in all publications are solely those of the individual author(s) and contributor(s) and not of MDPI and/or the editor(s). MDPI and/or the editor(s) disclaim responsibility for any injury to people or property resulting from any ideas, methods, instructions or products referred to in the content.

