Article

Energy Management of a 1 MW Photovoltaic Power-to-Electricity and Power-to-Gas for Green Hydrogen Storage Station

1
ATSSEE Laboratory, Science Faculty of Tunis, University of Tunis Manar, Tunis 2092, Tunisia
2
Department of Mathematics and Statistics, College of Science, Imam Mohammad Ibn Saud Islamic University (IMSIU), Riyadh 11623, Saudi Arabia
3
Laboratoire LETSER, Science Faculty of Oujda, University Mohamed 1st, Oujda 60000, Morocco
*
Author to whom correspondence should be addressed.
World Electr. Veh. J. 2025, 16(4), 227; https://doi.org/10.3390/wevj16040227
Submission received: 22 February 2025 / Revised: 18 March 2025 / Accepted: 24 March 2025 / Published: 11 April 2025

Abstract

:
Green hydrogen is increasingly recognized as a sustainable energy vector, offering significant potential for the industrial sector, buildings, and sustainable transport. As countries work to establish infrastructure for hydrogen production, transport, and energy storage, they face several challenges, including high costs, infrastructure complexity, security concerns, maintenance requirements, and the need for public acceptance. To explore these challenges and their environmental impact, this study proposes a hybrid sustainable infrastructure that integrates photovoltaic solar energy for the production and storage of green hydrogen, with PEMFC fuel cells and a hybrid Power-to-Electricity (PtE) and Power-to-Gas (PtG) configurations. The proposed system architecture is governed by an innovative energy optimization and management (EMS) algorithm, allowing forecasting, control, and supervision of various PV–hydrogen–Grid transfer scenarios. Additionally, comprehensive daily and seasonal simulations were performed to evaluate power sharing, energy transfer, hydrogen production, and storage capabilities. Dynamic performance assessments were conducted under different conditions of solar radiation, temperature, and load, demonstrating the system’s adaptability. The results indicate an overall efficiency of 62%, with greenhouse gas emissions reduced to 1% and a daily production of hydrogen of around 250 kg equivalent to 8350 KWh/day.

1. Introduction

The transition to a more environmentally friendly world has become a priority, with particular emphasis on the modernization of various sectors of life (health, transport, industry, buildings, etc.). For example, transport represents more than 30% of final energy consumption in the European Union and was responsible for 24% of greenhouse gas emissions in 2015. International standards directives and standards for compliance with the environment are committed to increasing energy efficiency and accelerating the decarbonization of the industrial and transport sector [1,2]. Green hydrogen plays an essential role in this transition by reducing carbon emissions in industry, transport, and electricity production [3,4,5,6,7]. To support this transition, photovoltaic (PV) systems with green hydrogen storage are proving promising, crucial, and sustainable. These systems consist of electrolyzers, storage systems, and fuel cells that convert renewable energy into stored green hydrogen in various forms, providing vital energy flexibility. However, integrating these systems with renewable energy sources can increase the complexity of energy management, requiring innovative approaches. Some research has focused on using hydrogen to reduce carbon emissions, including recommending optimal control strategies to minimize hydrogen production costs [8]. Others have explored the implementation of “fuel cell hybrid systems” to reduce pollution [9], while the integration of fuel cells into electric ships is under investigation. This research used genetic algorithms to optimize energy management, with promising results in terms of operational efficiency and environmental impact [10].
Furthermore, some studies have designed a hybrid system, combining photovoltaic panels, fuel cells, electrolyzers, and hydrogen storage. This approach has led to significant savings in energy costs and significantly reduced CO2 emissions [11,12]. In terms of energy management in smart buildings, other work has shown that the integration of renewable energy and storage devices in smart building districts, coupled with the use of improved optimization algorithms, could significantly improve energy efficiency and reduce greenhouse gas emissions in India [13,14].
In Asia, especially China, studies focused on the impact of carbon trading mechanisms on green innovation [15], while others have analyzed the increase in CO2 emissions and proposed ways to reduce these emissions through energy efficiency [16]. In maritime navigation, energy management strategies have been developed to extend the battery life and optimize the energy use of electric propulsion systems [17]. Several authors have studied different aspects such as size and cost optimization, energy management, power quality, and reliability of the proposed system [18,19]. However, research on energy management for hydrogen production and storage systems presents several shortcomings such as the diversity of models, the absence of standardized performance criteria, and a low rate of integration of renewable energies. Additionally, sustainability aspects, costs, variability of energy demand, modeling of electrochemical processes, and the lack of integrated approaches constitute critical points. Thoroughly addressing these gaps would help improve the reliability, efficiency, and widespread adoption of hydrogen production and storage systems in the context of renewable energy and the energy transition. Some have focused on short-term energy systems, while others have favored long-term storage systems. Some have addressed power control of photovoltaic (PV) systems, while others have explored energy management without sharing power between different energy sources and the storage system.
Finally, taking into account the imminent context of the energy transition in the near future despite the infrastructure and financing difficulties, we can say that the implementation and management of green hydrogen production and storage systems from renewable energies is a crucial solution for a more sustainable future.

2. Related Works

The use of fossil fuels in both industry and transport is increasingly limited following the strict recommendations of Kyoto, Copenhagen, Paris 2021, and Dubai 2022 as well as the Euro 3, 4, 5, and 6 standards [20]. This is due to their greenhouse gas emissions and their fluctuating prices. As an alternative, a new technology has recently taken hold since 2017 but is not yet widely manufactured, namely green hydrogen energy which consists of producing, transporting, and storing hydrogen from renewable energies by using electrolysis or reforming procedures estimated at 95% of the world’s H2 power production. Historically, hydrogen has been produced mainly by fossil methods, such as reforming natural gas, resulting in significant CO2 emissions. However, with the advent of electrolysis technologies powered by renewable energy sources, such as solar and wind power, the production of green hydrogen, which is emissions free, has gained interest since the 1990s. In terms of production, electrolyzers have seen significant improvements, particularly with proton exchange membrane (PEM) and solid oxide (SOEC) electrolyzers. Recent research has led to the development of more conductive membranes and catalysts based on less expensive materials. Furthermore, the integration of these electrolyzers with solar and wind installations has led to more economical and sustainable hydrogen production. In addition, innovative methods exploit the energy of organic waste through thermo chemical or biological processes, thus promoting a circular approach that valorizes resources while generating hydrogen. Regarding storage, significant advances have been made in the use of metal hydrides, which offer a safer and more compact storage solution, allowing high energy density and controlled release of hydrogen. In parallel, efficient liquefaction techniques have been used since 2021 to facilitate long-distance transport, such as the “HyNet” projects in the UK and the “Hydrogen Energy Supply Chain” in Australia [21]. Overall, these developments highlight the essential role of green hydrogen in combating climate change and promoting a sustainable energy economy, underlining the growing global commitment to this promising resource.
Currently, the production of green hydrogen by electrolysis of water via renewable energy sources and its storage via proton exchange membrane hydrogen fuel cells (PEMFCs) represents a significant step towards sustainable energy systems. PEMFCs convert hydrogen into electricity with an efficiency of 60%, with no CO2 emissions. On average, electrolysis requires about 50 kWh of energy to produce 1 kg of hydrogen with efficiencies ranging from 60% to 80%. Once produced, hydrogen can be stored at up to 700 bars, allowing around 5 kg of hydrogen to be stored in 8-liter tanks, which gives a range of 500 km for a hydrogen-powered car.
As an indication, in 2020, hydrogen produced by electrolysis represents 5% of the hydrogen used. Europe consumes 8.8 megatons per year, leading to emissions of 830 million-tones of CO2 per year, or around 2% of global emissions. In 2023, the World Bank has estimated the need for low-carbon green hydrogen consisting of 40 Mtones/year, half of which will be in emerging and developing countries. The investments needed to achieve this are estimated at USD 200 billion per year [22]. During the last two years 2023–2024, only six major green hydrogen development projects, with a capacity greater than 100 MW, have received a final investment decision according to a 10 GW action plan [23].Meanwhile, several experimental infrastructures of hydrogen have been studied and evaluated. In 2022, Y. Wang presented a study on the integration of renewable hydrogen for mobile and stationary Fuel Cells [24].The paper integrates PV-generated hydrogen production, compression, and storage, enhancing grid stability and maximizing PV utilization, showing casing advancements in green hydrogen storage stations. He also presented a dynamic model of a green hydrogen fueling station for heavy-duty vehicles, integrating solar PV for hydrogen production and storage, emphasizing renewable energy utilization. Another comprehensive study conducted by Rizk in 2023, outlined the economic impacts of large-scale hydrogen production, indicating that costs could fall below USD 3 per kg due to ongoing technological innovations and scale. He developed an optimal wind–photovoltaic power plant system for green hydrogen generation, emphasizing sustainability, energy production for hydrogen refueling stations, and wastewater treatment. The annual generation production is 6997.90 kWh electrical energy and 85,595 kg of green hydrogen [25].
In addition, AG Anastasiadis developed a management method for a hybrid wind–solar–hydrogen system for green hydrogen production and storage, including economic assessments, with a case study on Sifnos Island in Greece [26]. Later in 2024, Sayed et al. proposed a 10 MW PV/wind-powered hydrogen production plant in Egypt, utilizing energy storage, solar, and wind power to create green hydrogen, effectively reducing greenhouse gas emissions [27].
Finally, other studies and experiments recommend the use of integrated systems that combine hydrogen production and storage in a single device. This strategy enhanced efficiency and reduced reliance on costly materials [28,29].
Based on these results, we present in this study a new hybrid infrastructure for green hydrogen production and storage. This system is intended for energy production, sustainable transport, refueling stations, and several chemical industry applications. Our contributions in this research work are based on the implementation of the following parts:
-
Better management of the H2 value chain by implementing an energy management and optimization algorithm (EMS) which has a direct impact on cost reduction, the reliability of the installation, and its efficiency.
-
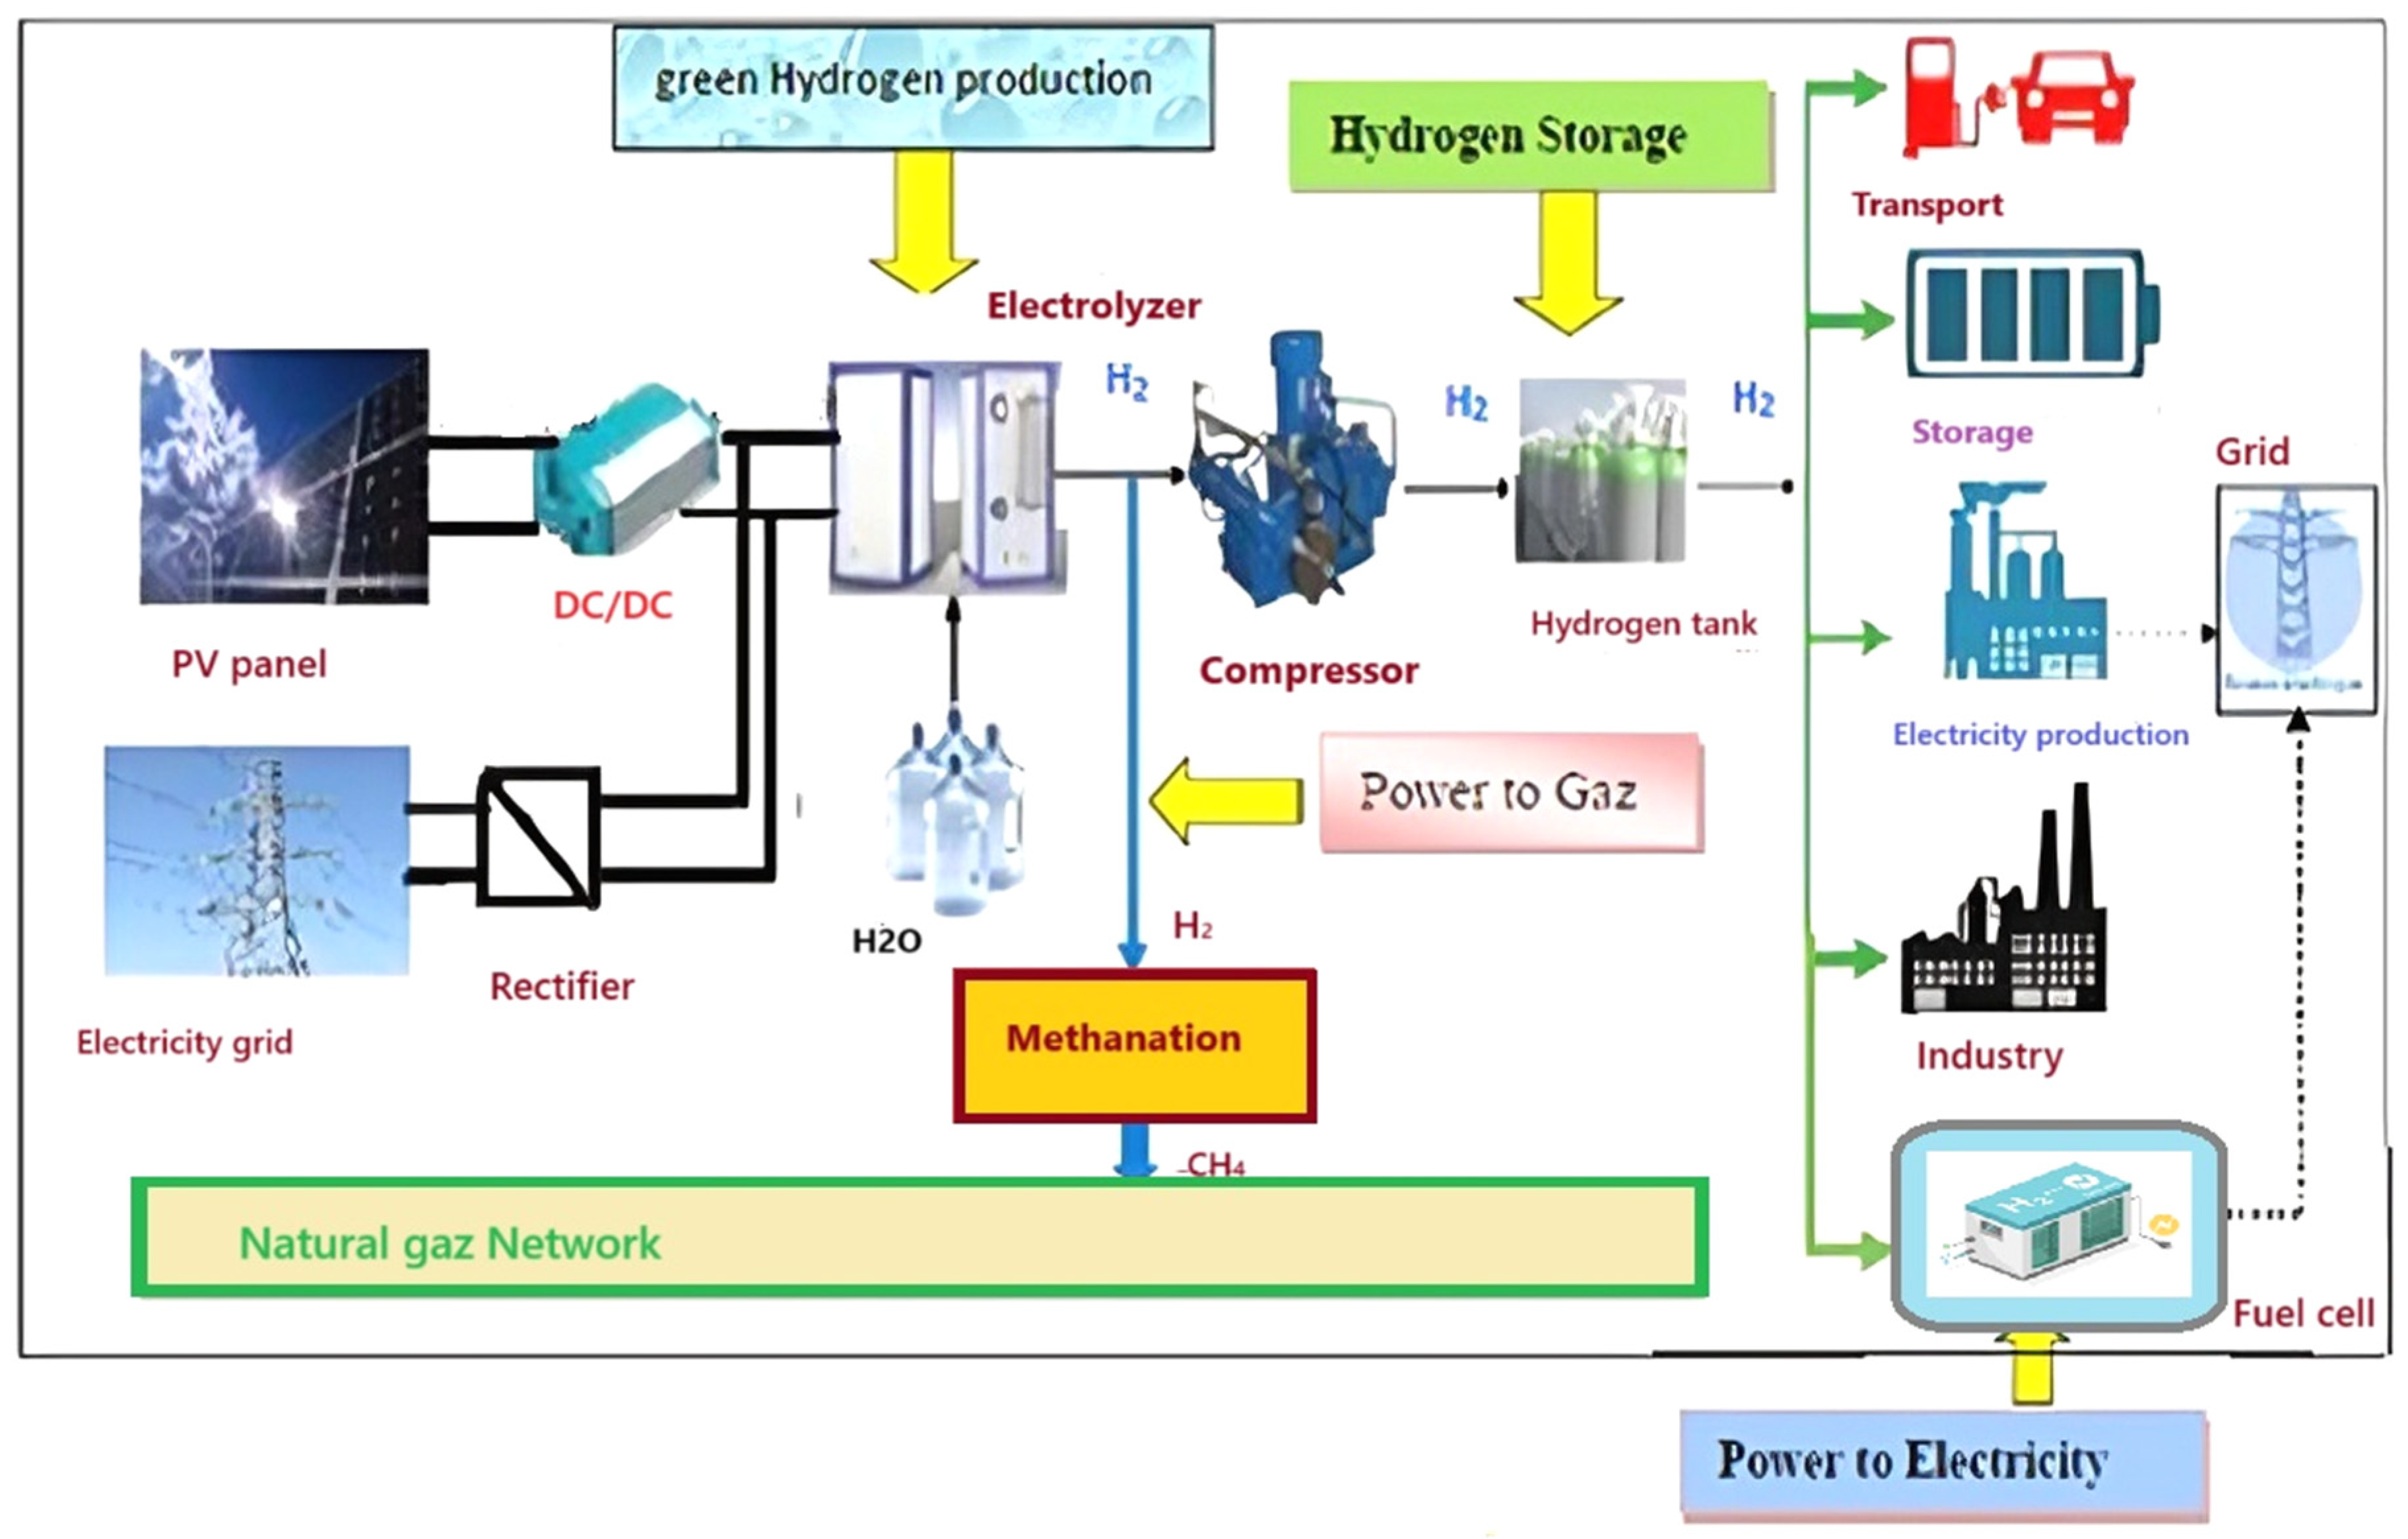
Flexible, resilient, and sustainable infrastructure by integrating different energy sources and two structures: P2E and P2G strategies in the same coherent energy system. The first one is the PtE (Power-to-Electricity) which allows electricity production via the PV–electrolyzer–PEMFC chain, while the second P2G (Power-to-Gas) allows the hydrogen production to be injected into the natural gas network, either directly or indirectly by methanation.

3. Hydrogen Production and Storage Processes

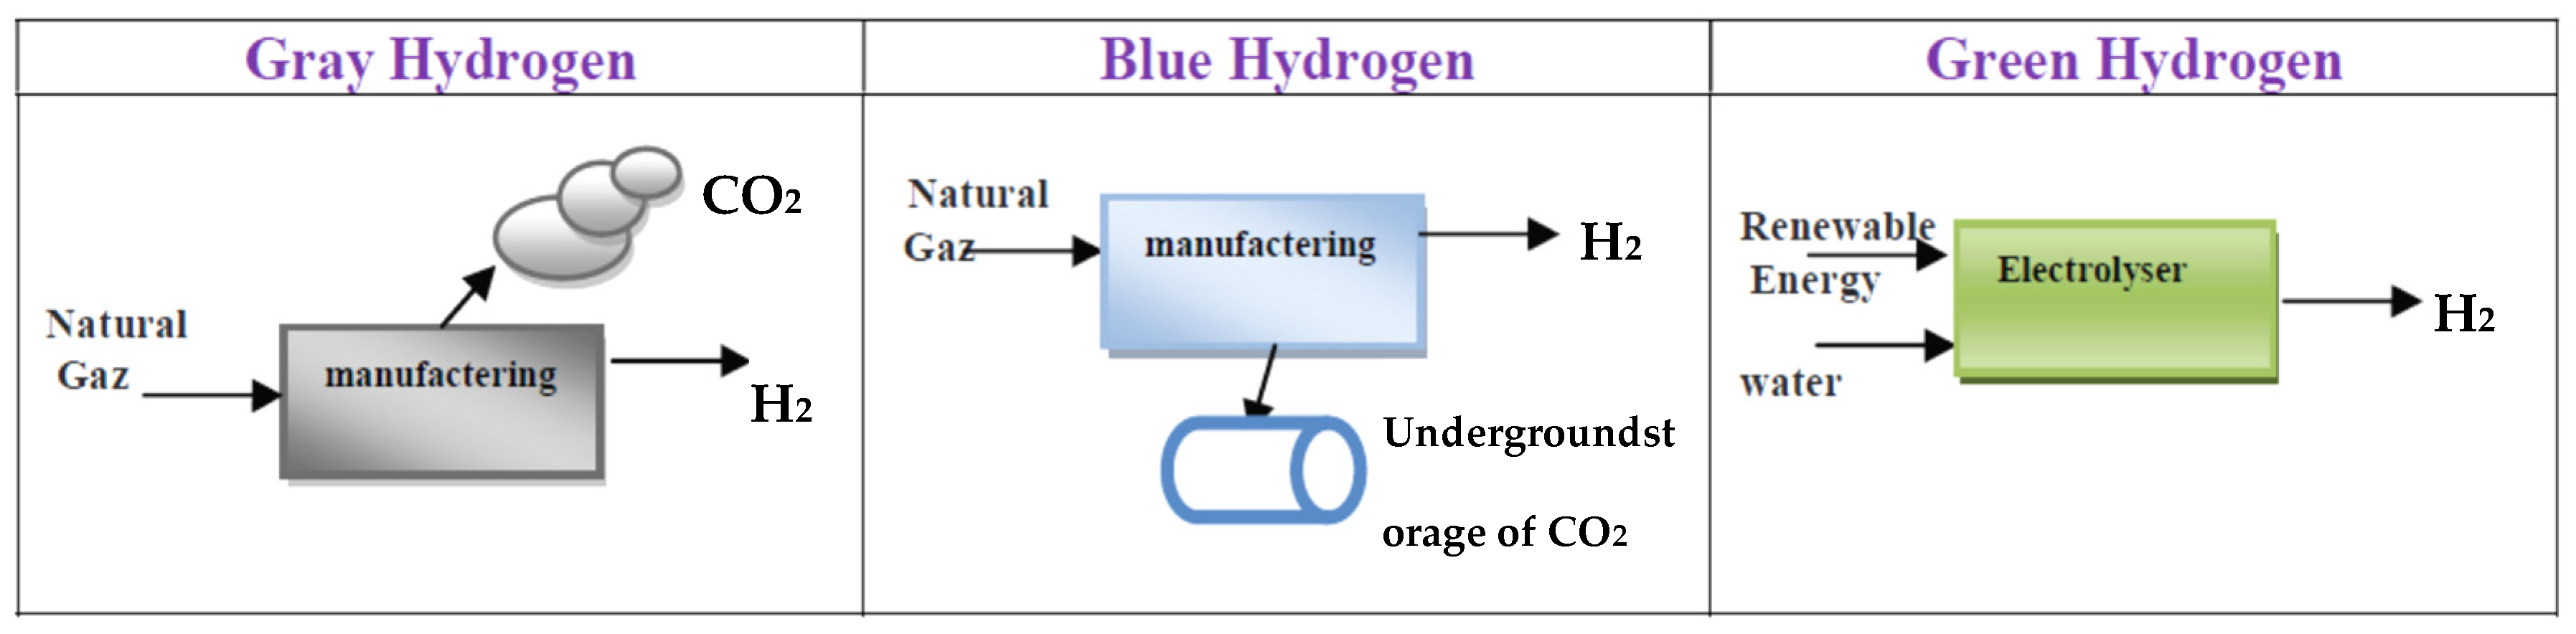
3.1. Hydrogen Production Methods

Energy storage in the form of hydrogen presents itself as an attractive and promising solution for the large-scale energy mix on the one hand and for the mobility of electric and hybrid vehicles on the other hand. Indeed, compared to current electrical storage technologies such as batteries, hydrogen has a very high specific energy density: around 130 megajoules per kilogram (35 kWh per kg). Gasoline or diesel are other methods of “chemical” energy storage which have a high energy density, but their combustion releases greenhouse gases while the combustion of hydrogen only releases water.
However, hydrogen is a light gas, characterized by a low volume density (about 10.8 mega joules per cubic meter), which makes it less favorable for its storage and transport. To overcome this problem, hydrogen can be compressed in pressurized gaseous form (about 700 bars), or in liquid form (at a temperature of −253 °C) or in solid form at low pressure (using materials that can absorb hydrogen) such as metal hydrides. Currently, H2 is produced in one of the three forms in Figure 1: gray, blue, or green. Only the last process is the most ecological since it uses renewable energies (solar and wind) and is performed at 0% carbon released.

3.2. Hydrogen Production by Steam Reforming

This way of production is used for medical laboratories and other fields requiring maximally purified hydrogen. Hydrogen is obtained from methane which reacts to the presence of (heated) water vapor with a yield of 75% with more modest costs than electrolysis.

3.3. H2 Storage Methods

In fact, to store one kg of hydrogen, you need a volume of approximately 11 m3. Knowing that this quantity can allow a vehicle powered by hydrogen to travel 100 km, we understand that it is complicated to store it as is. Therefore, it is necessary to implement technical means to increase its density and reduce the size of storage. Today, hydrogen can be compressed to 700 bars of pressure, or to 350 bars for mobility.
Several methods of storing hydrogen in gaseous form at high pressure are possible:
  • In tanks or bottles which allow hydrogen to be transported by trucks;
  • In service stations and storage tanks of hydrogen vehicles, where it will then be used to power a hydrogen fuel cell which generates electricity;
  • In massive underground storage facilities.
Today, hydrogen is produced near its place of use, but it can be transported between the production center and a place of use. There are currently three types of hydrogen transport:
  • Transport by dedicated long-distance pipelines;
  • Road or rail transport in pressure cylinders, made of steel;
  • Maritime transport.

3.4. Storage of Renewable Energies in the Form of Hydrogen

Hydrogen can be used to store electricity, making it possible to compensate for the overproduction of renewable electricity (solar, wind, etc.) at certain times and its insufficiency at others. Indeed, the production of solar energy depends on natural elements and cannot therefore be controlled according to consumption. Therefore, it is necessary to be able to store excess electricity when production exceeds consumption. Since electricity cannot be stored in large quantities over a long period, the solution is to convert it into hydrogen. Thus, the Power-to-Gas process consists of producing hydrogen by electrolysis of water, from renewable PV. It is then possible to conduct the following:
-
Store hydrogen in pressurized gaseous chemical form;
-
Store hydrogen in electrical form via PEMFC cells;
-
Inject H2 into the natural gas transport network;
-
Inject H2 into the electricity network via PEMFC.
Therefore, this new strategy makes it possible to respond to the issues of modularity, high fluctuation, and storage of renewable electricity and to overcome the low penetration rates of renewable energy into the electricity network (smart grid).

4. Conception and Modeling of the PV Green Hydrogen Production and Storage

4.1. Description of the Proposed Hydrogen PtE and PtG Structure

The infrastructure of the Green H2 station is described by the structure in Figure 2. Hydrogen is produced in gaseous form by electrolysis, from photovoltaic. The option of connection to the electricity grid makes it possible to inject the surplus electricity production into the national electricity grid or, failing that, to extract it if the PV power is insufficient during unfavorable weather conditions. The stored hydrogen can be used as follows:
-
Injected into the natural gas network (CH4) either directly or after methanization;
-
Compressed between 350 and 700 bars in bottles, tanks to be transported, and then sent to users or service stations.
The architecture displays also the conversion and energy storage in the form of three value chains:
  • Power-to-Electricity (PtE): The hydrogen is converted into electricity via a PEMFC fuel cell;
  • Power-to-Mobility (PtM): the hydrogen aliment the electric vehicles, the hydro and hybrid ones as well as the refueling and recharging stations;
  • Power-to-Gas (PtG): The hydrogen is combined with CO2 to produce the gas of methane (CH4) which is injected into the natural gas outlet (heating, …).

4.2. Modeling

The proposed model is shown in Figure 3. The MPT algorithm with P&O control is used to regulate the photovoltaic (PV) system in this model, and it is also connected to the buck–boost converter to adjust the direct voltage (DC). Then, the electrolyzer is subjected to DC voltage to generate green hydrogen. In the case of weak or absent solar radiation, it becomes more sustainable for the electricity grid to integrate into it. Indeed, solar energy depends on weather conditions. Additionally, in situations where the sun generates more energy over longer periods of time, the electrolyzer responds by absorbing the excess electricity and producing hydrogen. Compressed hydrogen stored in a tank is then used as fuel for the PEM fuel cell. The goal of optimizing energy management in this system is to minimize the impact of climatic and geographic factors on daily and seasonal patterns. Renewable energy provides a stable energy supply and the ability to meet electricity demand. However, several key assumptions and limitations can significantly influence the model’s accuracy such as the variability of environmental conditions, homogeneity of the plant components, dynamic and statistical of demand Profiles, and user behavior.
  • Model of PV generators
The specific layout of photovoltaic modules, with 78 strings where each string is composed of 39 modules connected in series, is carefully designed to maximize the efficiency of solar power generation. This design is meticulously crafted, taking into account seasonal fluctuations in solar irradiation and temperature changes. By integrating weather data into the design, the photovoltaic system can optimize its performance in real time, ensuring maximum solar energy production in a sustainable and efficient manner. The PV model equations are given by the voltage and current relationships (VPV, IPV) at the PV cell output [30]:
I P V = I p h I s exp q V P V + I P V · R s K · T c · A 1 V P V + I P V · R s R p
V P V = N 0 · K · T q L o g I s c I P V + I 0 · N p N P · I 0 N s N P · R S · I P V
I p h = I s c + K i T c T r e f · G G r e f
I S = I r s ( T c T r e f ) 3 · exp q E g 1 T r e f 1 T c K · A
where:
  • Is: the reverse saturation current of the diode at a temperature of 25 °C;
  • Eg: the gap energy of the semiconductor used in the cell (eV);
  • A: the ideal factor which depends on the PV technology;
  • Isc: the short-circuit current of the PV cell at a temperature of 25 °C;
  • Ki: coefficient of a temperature of the PV cell;
  • Tc: temperature of the PV cell in °K;
  • q: load of an electron= 1.6 · 10−19;
  • K: Boltzmann constant = 1.38 · 10−23
  • Tref: reference temperature = 298 °K (25 °C);
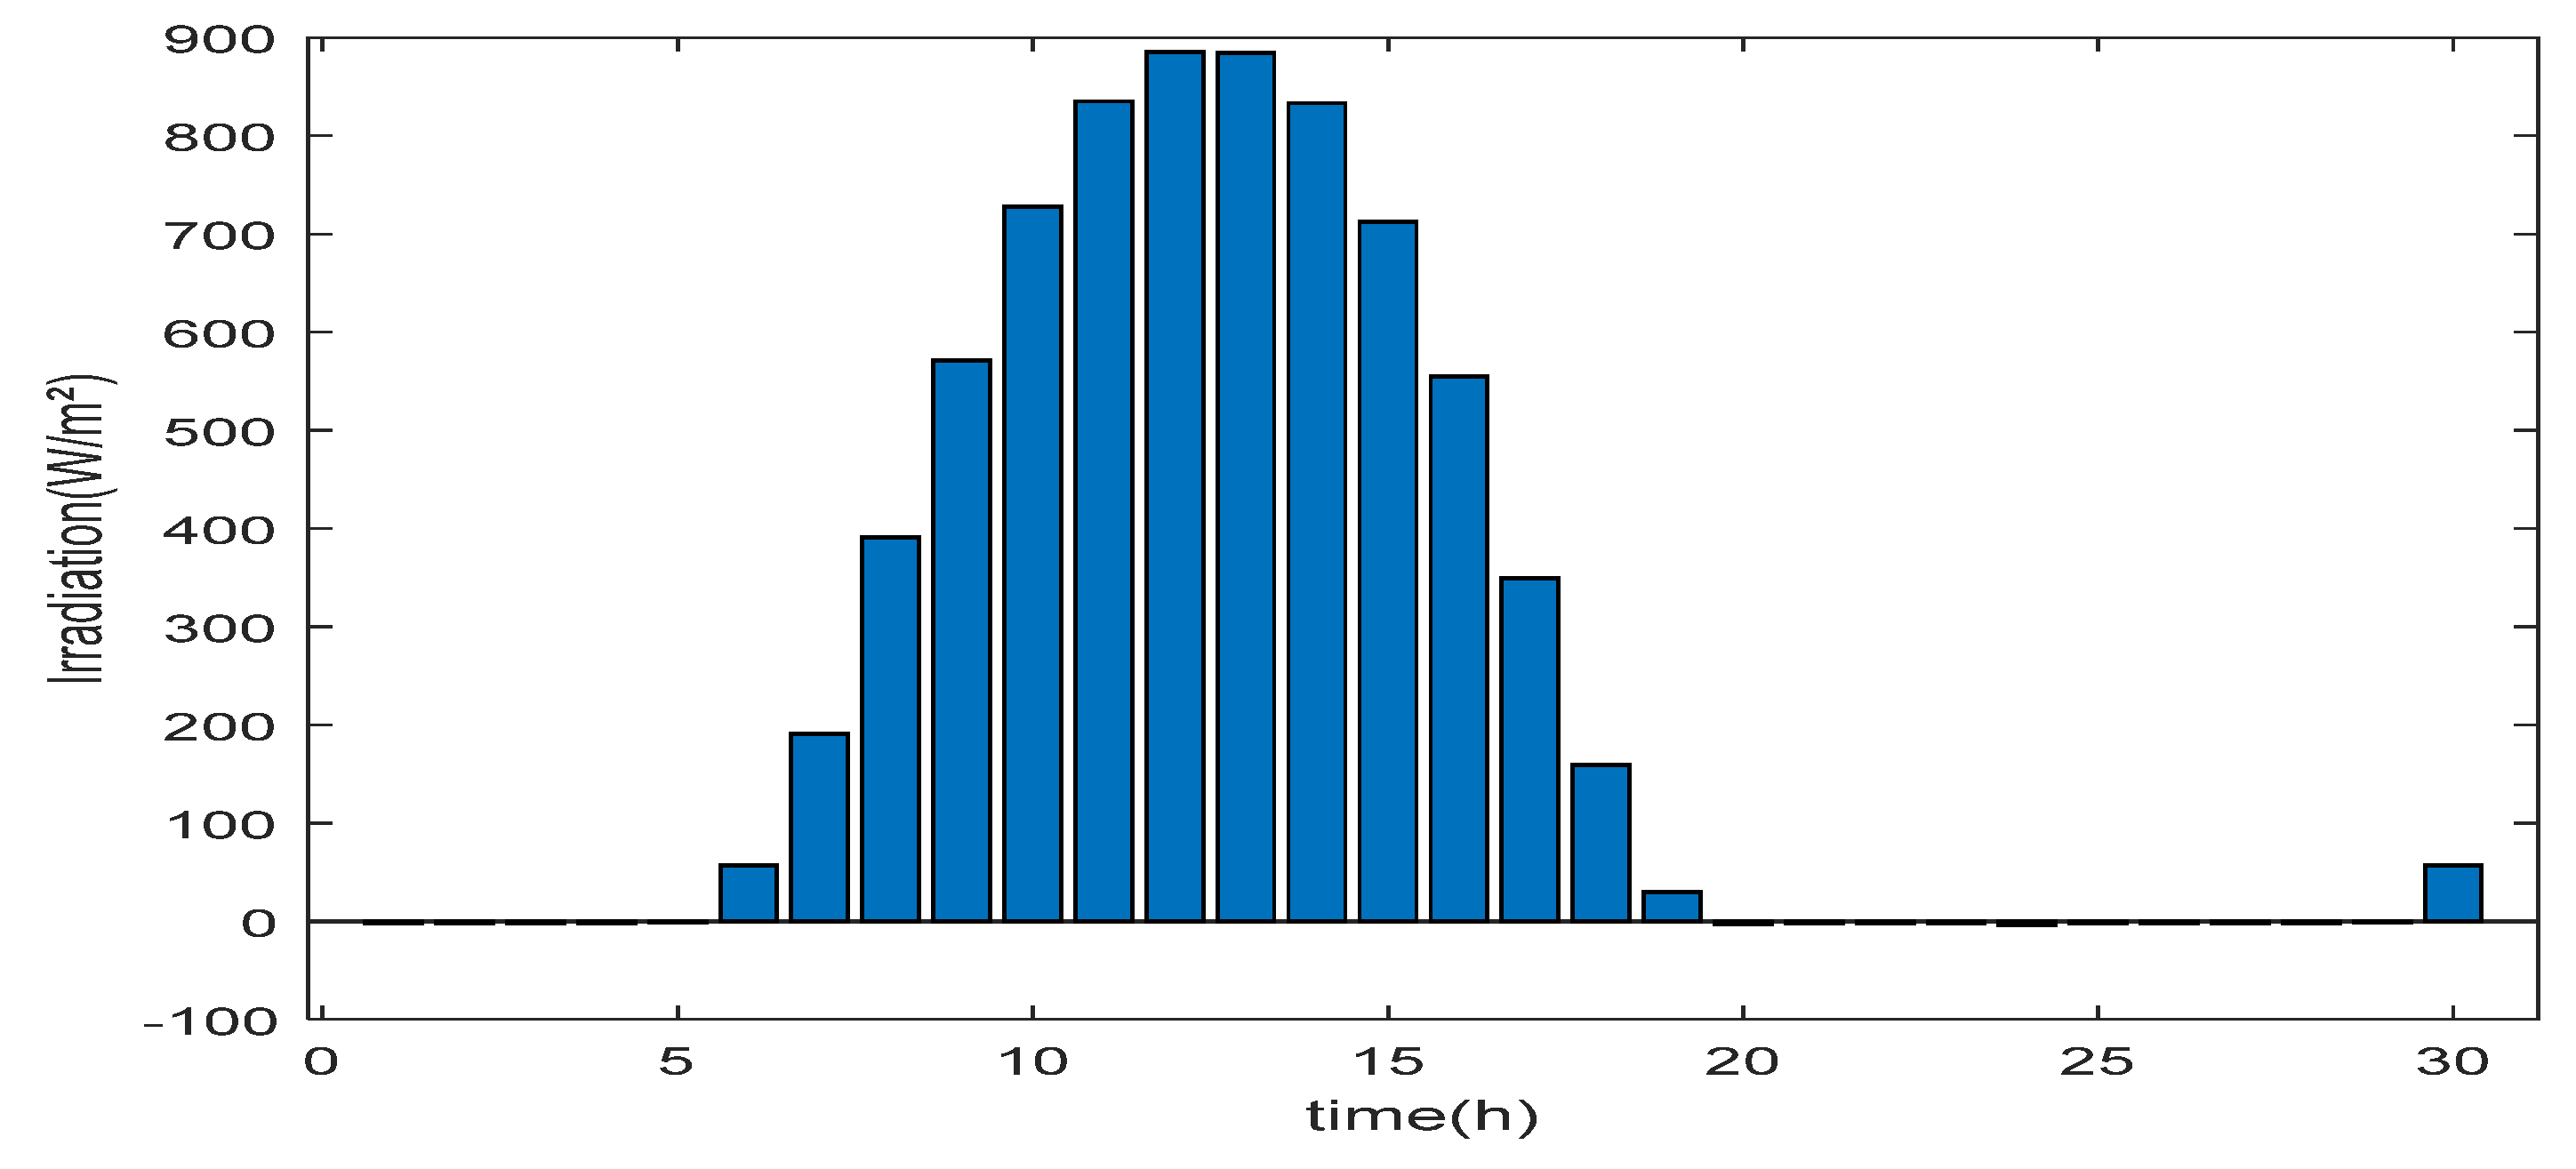
  • G: current sunshine in W/m2;
  • Gref: reference sunshine = 1000 W/m2;
  • Iph: photodiode current;
  • VPV, IPV: output voltage and output current of the PV cell
  • Rs, Rp: serial and parallel resistances
The numerical values of these parameters are given in Table 1.
  • PEM electrolyzer model
Proton exchange membrane electrolyzers works by using electric current to split water. In the case of water electrolysis, the gas obtained under the action of electrical energy is molecular oxygen at the anode and molecular hydrogen at the cathode. Proton exchange membrane electrolysis is an electrolysis technology that has the advantage of being able to produce high purity hydrogen directly under pressure, and with compact systems requiring low maintenance. The performance of a PEM is often linked to the operating voltage of the converter and the current density passing through the converter, and these parameters can be linked to the conversion efficiency and therefore to the power consumption of the electrolyzer during the production of hydrogen. The electrolyzer equations can be expressed as follows:
V E l t = V i n + V a n o d e t + V c a t h o d e t + R e l ( t ) I E l ( t )
I E L t = I a n o d e 1 t + I a n o d e 2 t = I c a t h o d e 1 t + I c a t h o d e 2 t
-
Electrolysis yield
η e l = N H 2 · V H 2 P e l
-
Electric power
P e l = N H 2 · V H 2 η e l
-
Quantity of H2 produced
V H 2 t = η F n c I e l t 2 F
-
Efficiency
η F = 96.5 e ( 0.09 I e l 75.5 I e l 2 )
  • Vin: open circuit voltage;
  • Vanode(t): voltage losses at the anodes;
  • Vcathode(t): voltage losses at the cathodes;
  • Rel(t): ohmic resistance of the electrolytes;
  • Iel(t): electrolyzer current;
  • Ianode1(t), Ianode2(t): currents in the resistive and capacitive anode branches;
  • Icathode1(t), Icathode2(t): currents in the resistive and capacitive cathode branches;
  • nc: the number of cells in the electrolyzer;
  • F: the Faraday constant (96,485.33 C/mol);
  • T: the temperature of the electrolyzer (in Kelvin);
  • ηF: the Faraday efficiency.
From Equations (5)–(10) and the data in Table 2, the electrolyzer model was designed using Simulink.
  • Compressor model
The compressor is an essential component in a high-pressure hydrogen gas production and storage station that can achieve values of 70 to 700 bars. The nominal power of the compressor is expressed by the following formula:
P c o m p t = C p T i n η c o m p [ ( P i n P o u t ) r 1 r 1 ] m ˙ c o m p ( t )
where
  • Cp: the specific heat of hydrogen at constant pressure, (14.3 kJ/kg/K);
  • Tin: the temperature of hydrogen at the compressor inlet, (293 K);
  • ηcomp: the mechanical efficiency of the compressor;
  • Pin, Pout: are, respectively, the inlet pressure (30 MPa) and outlet pressure (70 to 700 bars) of the compressor;
  • r: the ratio of the specific heats of hydrogen, (r = 1.4);
  • mcomp(t): the mass flow rate of gas through the compressor [kg/s].
  • Hydrogenstorage model
A hydrogen tank is a device used to store hydrogen, particularly in the form of gaseous dihydrogen. This type of storage is used in particular to power fuel cells. The storage tank is used to store the amount of hydrogen produced by the electrolyzer and supply the amount required by the fuel cell to maintain the load demand. In order to ensure the safety and normal operation of the system, effective and critical control of high-pressure storage must be carried out. The dynamic changes in its pressure are expressed by Equation (12).
P = z m H 2   R   T T a n k M   V t a n k + P i n i t i a l
The variables used in the equation are as follows [31]:
  • P: gas pressure in pascals (Pa);
  • Pinitial: the initial pressure (Pa);
  • m H 2 : the mass of the hydrogen quantity;
  • R: the gas constant equal to 8.314 J/Kmol;
  • Ttank: the absolute temperature of the gas in Kelvin (K);
  • Vtank: the gas volume (m3);
  • z: compressibility factor;
  • M: the molar mass of the hydrogen gas (2.016 × 10⁻³ kg/mol).
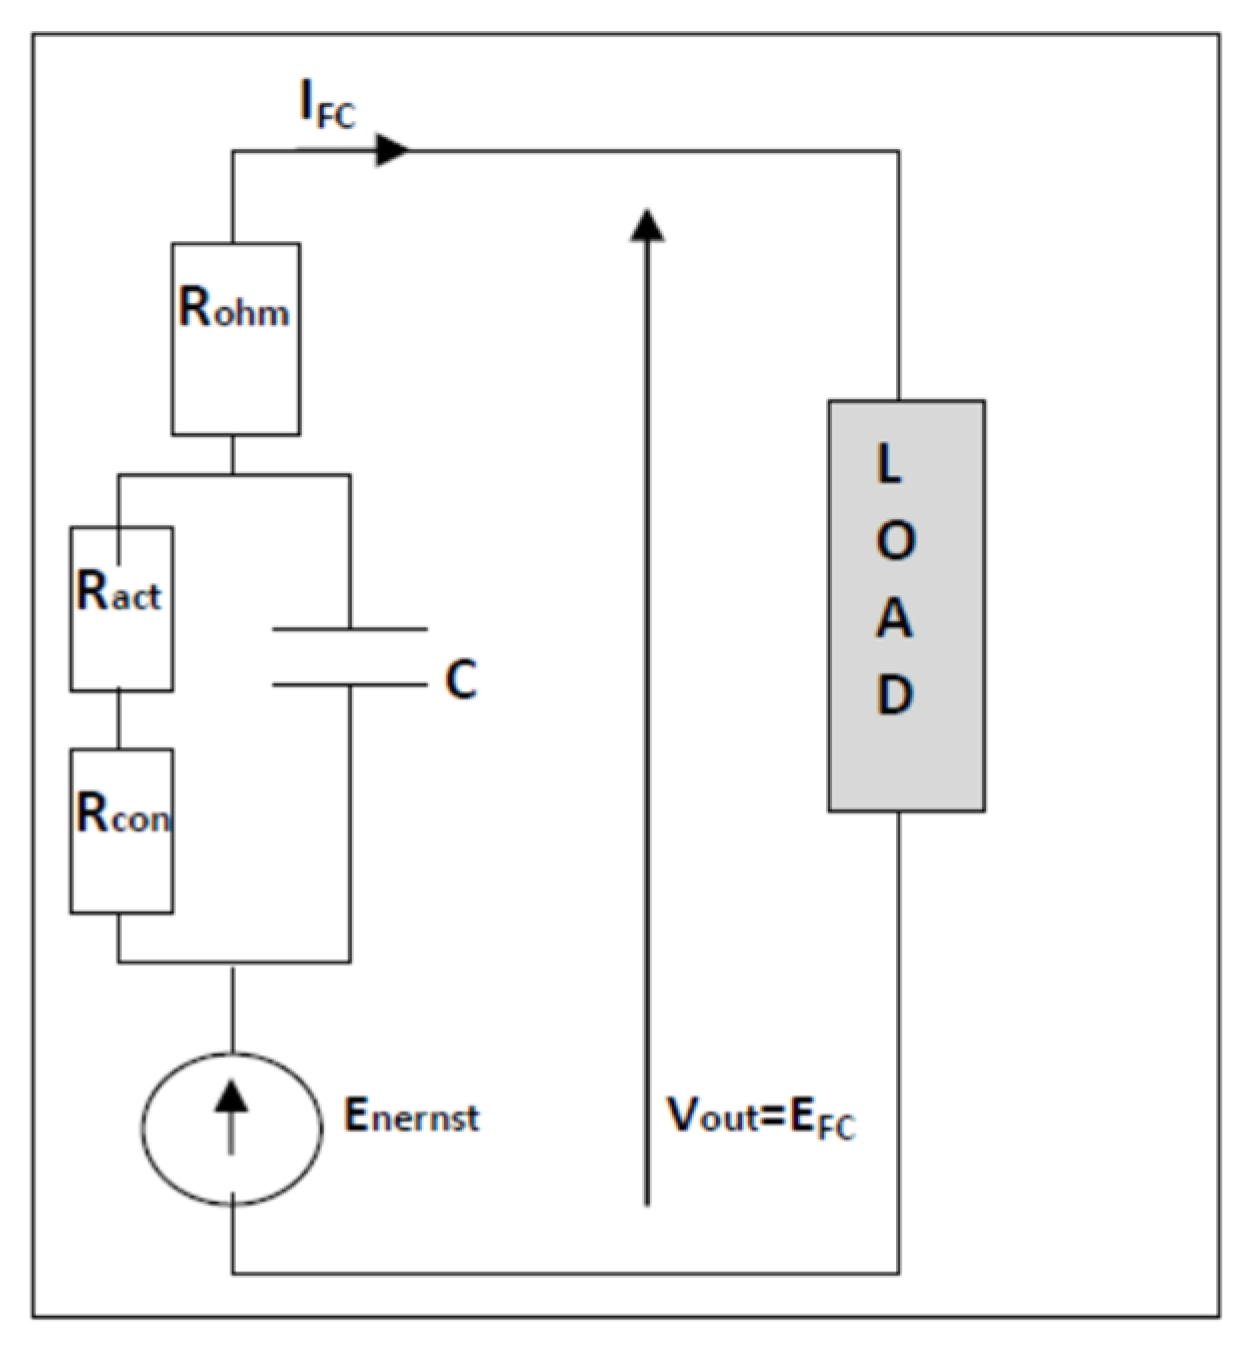
The system uses hydrogen-based fuel, charging on sunny days and discharging at night to meet daily needs. The mass of hydrogen available in the tank at the time of the step in question is determined by the following equation:
m t a n k t = m i n i t + H 2 i n d m o u t t
  • Fuel cell model
PEM fuel cells are innovative technologies that electrochemically convert hydrogen into electricity. Using a proton exchange polymer membrane, these cells are able to selectively move protons while blocking electrons, thereby generating an electric current. They stand out for their fast start-up, high efficiency, and ability to respond quickly to load fluctuations, making them ideal for a variety of applications including fuel cell vehicles and emergency power systems.
The electronic model of the fuel cell can be illustrated by the diagram inFigure 4. The model is equivalent to a Thevenin generator characterized by its couple (Enernst, Rth) which delivers on an electrical load, as illustrated in Figure 4.
The Rth is the internal resistance of Thevenin generator, and can be expressed as follows:
R t h = R o h m + R a c t + R c o n 1 + j C w ( R a c t + R c o n )
w = 2 πF (F: frequency)
As the current in the fuel cell is continuous, we can adopt F= 0. In this case, Rth becomes
R t h = R o h m + R t h + R a c t
The output voltage VFC of the fuel cell can be expressed as follows [32,33]:
V FC = E FC = E Nernst V act V ohm V con
The expression of the Nernst equation is as follows [33]:
E Nernst = 1.23 0.85 T 3 ( T 298 ) + 4.31 · 10 5 T · [ log ( P H 2 ) + 0.5 log ( P O 2 ) ]
P H 2 and P O 2 are the pressures of hydrogen and oxygen, respectively, at the inlet of the cell expressed in atmosphere (atm). According to Amphlett’s model:
V act = ξ 1 + ξ 2 T + ξ 3 T · log ( CO 2 ) + ξ 4 T · log ( I FC )
where
  • IFC is the fuel cell current;
  • ξ1, ξ2, ξ3 and ξ4 are the empirical parameters of the fuel cell;
  • CO2 is the concentration of oxygen (mol/cm3).
C O 2 can be computed by Henry expression as follows [34]:
C O 2 = P O 2 5.08 10 6 e 498 / T
The ohmic drop voltage across the cell is the result of the electronic resistances of the bipolar plates and can be given by the following expression [33]:
V ohm = I FC · ( R M + R C )
R M = ξ 5 + ξ 6 T + ξ 7 I FC
  • RM: is the resistance of the membrane;
  • RC: is the contact resistance to the conduction of electrons.
The concentration voltage is as follows [33]:
V con = B   J J m a x 1
Finally, the output voltage of the PEMFC is as follows:
V stack = N c e l l · V FC
  • Vstack: the output voltage of the PEMFC (all cells);
  • Ncell: number of cells in series;
  • Enernst: the thermodynamic potential of a single cell;
  • Vact: the activation voltage;
  • Vohm: the ohmic voltage;
  • Vcon: the concentration voltage;
  • T: cell temperature (in °K);
  • P H 2 : hydrogen pressure (in atm);
  • P O 2 : oxygen pressure (atm);
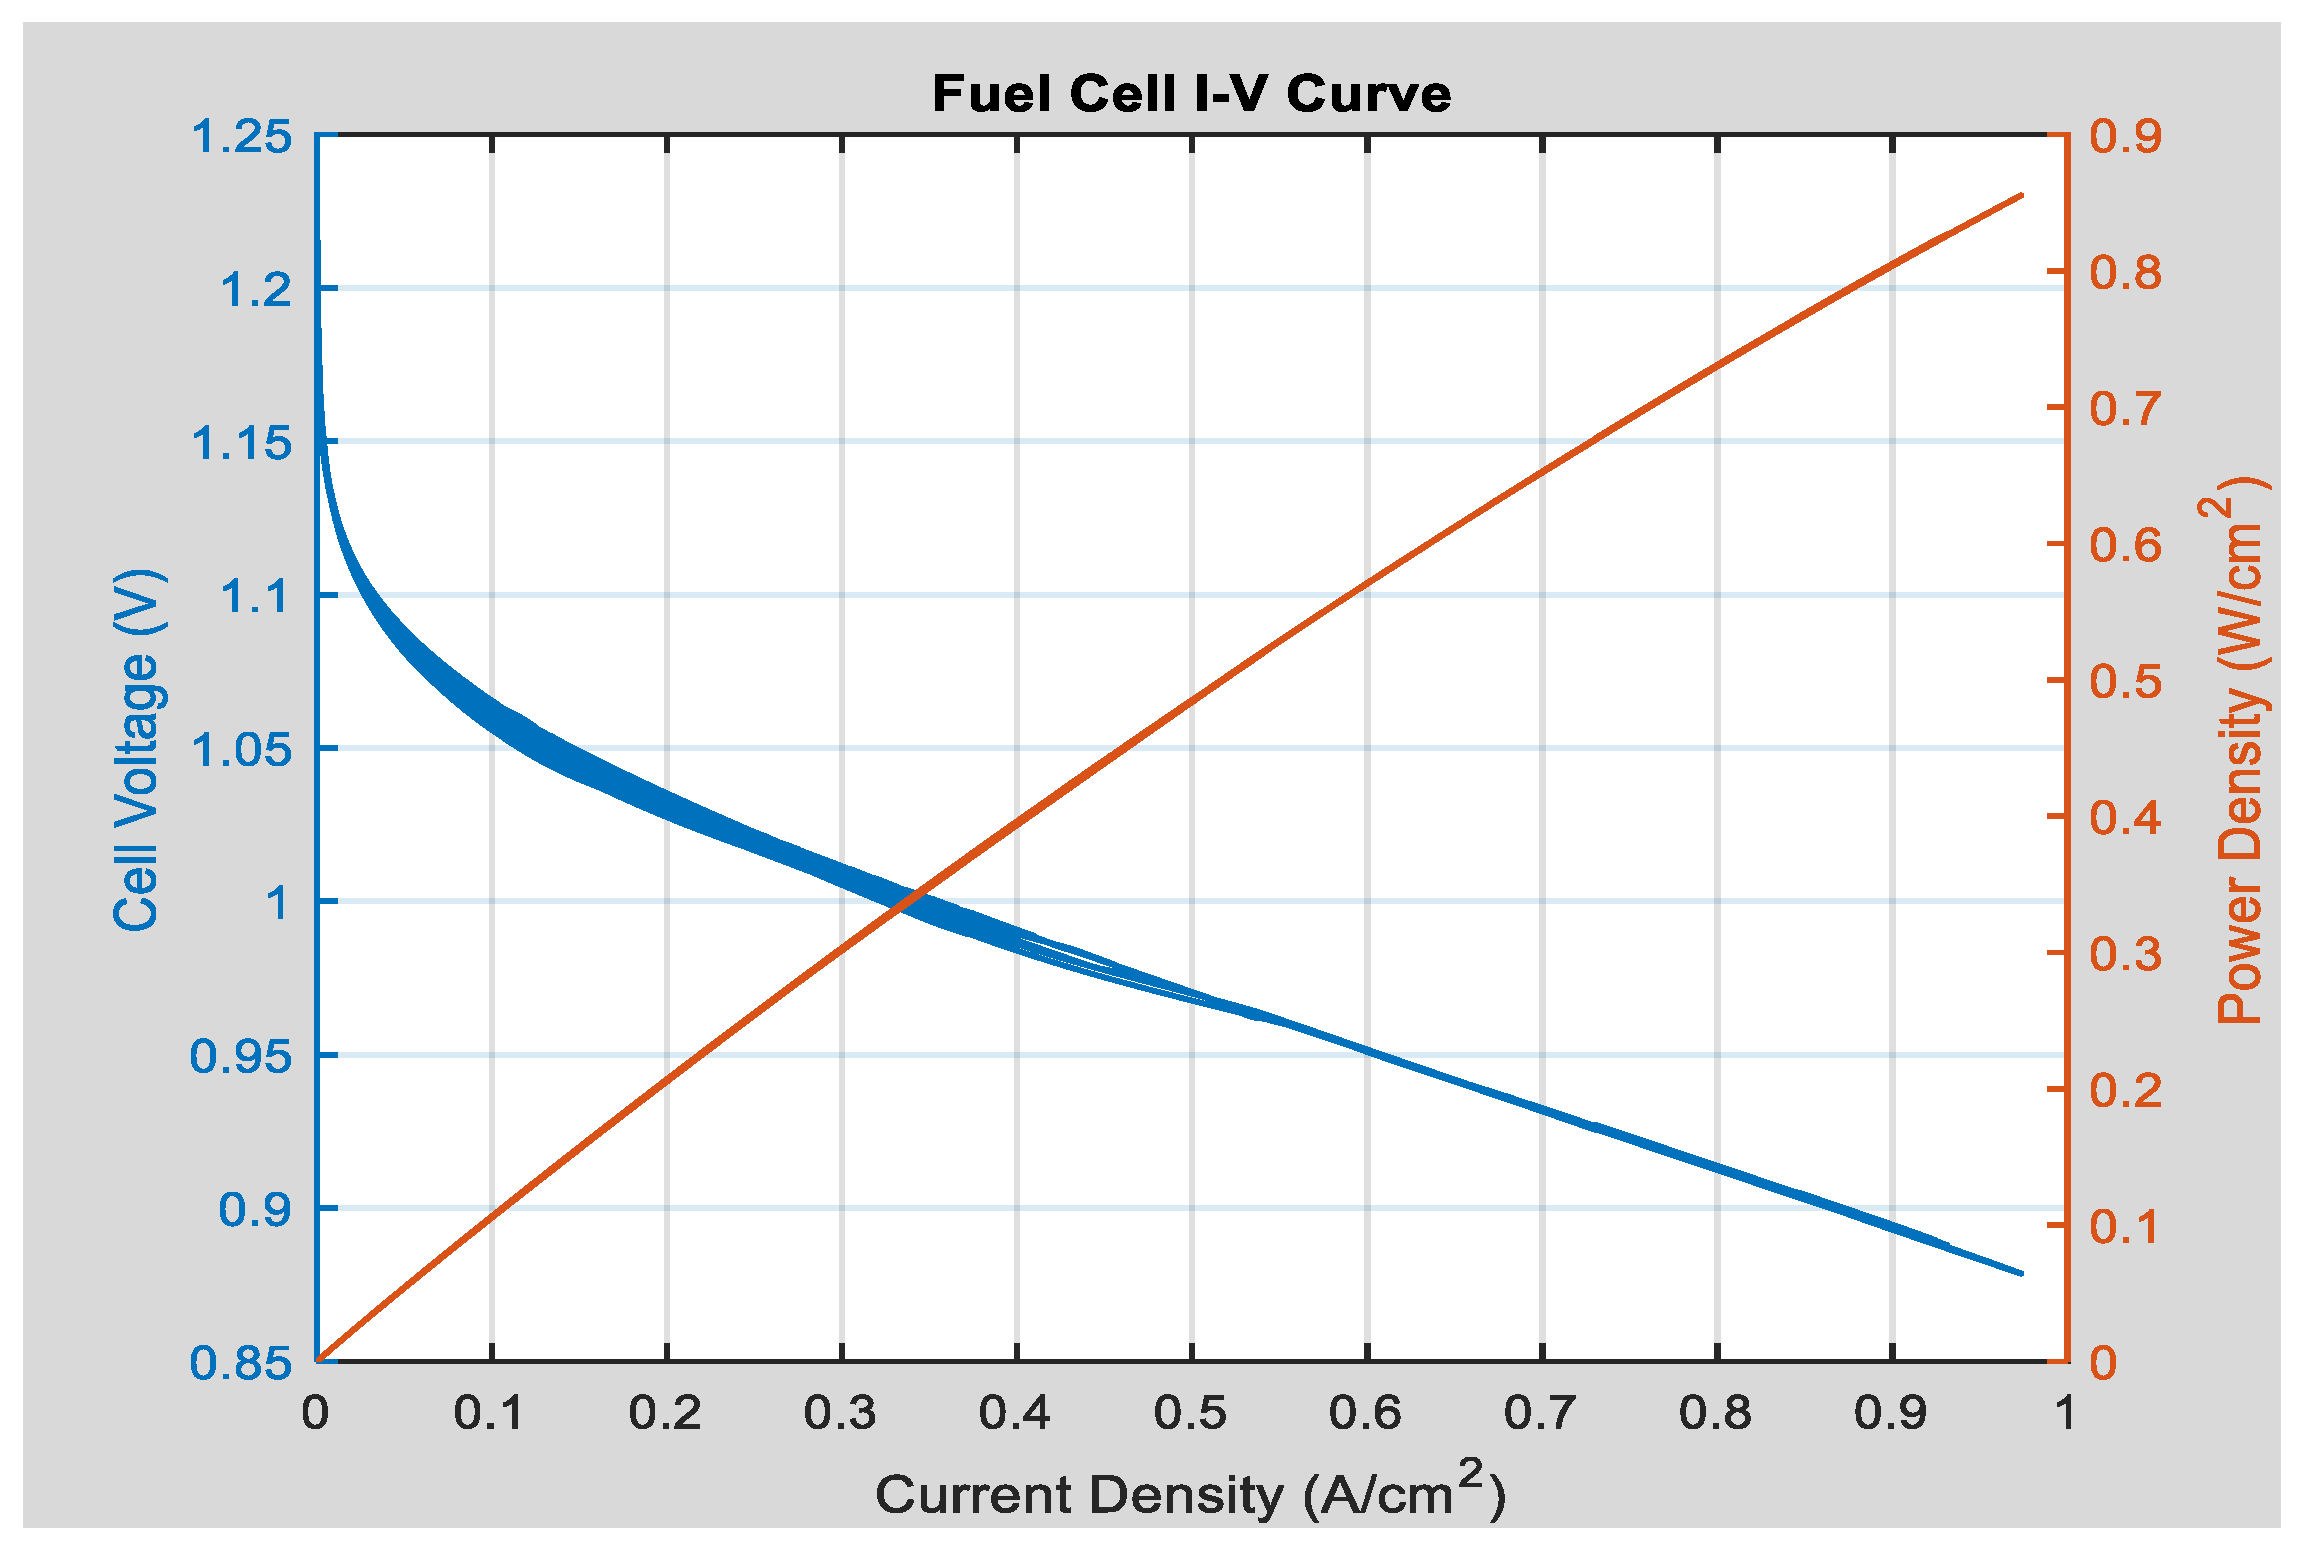
  • J: the current density of the cell (A/cm2);
  • Jmax: the maximum current density of the battery (A/cm2);
  • B: a weighting constant.
Finally, the output voltage of the fuel cell is as follows:
V stack = 1.23 0.85 T 3 ( T 298 ) + 4.31 · 10 5 T · [ log ( P H 2 ) + 0.5 log ( P O 2 ) ] [ ξ 1 + ξ 2 T + ξ 3 T · log ( C O 2 ) + ξ 4 T · log ( IFC ) ] I FC ( RM + RC ) B J J m a x 1
The amount of hydrogen absorbed by the PEMFC is given by Equation (25).
d m o u t t = P F C ( t ) P C I · η F C
where:
  • dmout(t): the hydrogen mass consumption by the fuel cell PEMFC (kg/h);
  • PFC: the power of the PEM fuel cell systems
  • PCI: the Lower Hydrogen Calorific Value;
  • ηFC: the efficiency of fuel cell.
The Simulink model is based on the data listed in Table 3 which summarizes the parameters of the fuel cell adopted.
Figure 5 illustrates a typical polarization curve for a fuel cell. The steep drop in voltage at low currents is attributed to activation overvoltage. The linear decline at intermediate currents is caused by ohmic overvoltage, while the rapid reduction in voltage at higher currents is associated with concentration overvoltage.

5. Energy Control and Management Strategy of the Proposed System

To offer energy management solutions, data exploitation is crucial. We began our design by implementing a centralized SCADA acquisition and monitoring chain for data collection and installing IoT sensors to gather real-time information on energy production and consumption, as well as environmental conditions. As a second step, we opted for secure storage of these data in remote databases via cloud computing, which offers flexibility, scalability, and enhanced security. Finally, analysis and visualization are provided by statistical and machine learning tools and algorithms (for forecasting) that will help predict energy demand and optimize operations. We created interactive dashboards to facilitate data visualization and decision making.

5.1. Description

At the heart of our proposition are innovative energy management algorithms (EMS). It optimizes operations and energy exchanges by integrating real-time data acquisition, monitoring, and control. It forecasts energy demand using historical consumption patterns and adjusts electrolyzer operation based on solar generation. The EMS implements optimization and predictive algorithms (ARIMA or LPC) for efficient hydrogen production and manages grid interactions for energy trading and compliance. A user-friendly interface provides performance metrics and alerts for maintenance needs. By enhancing efficiency and reducing costs, the EMS ensures reliable hydrogen production and supports sustainability goals, making it essential for effective renewable energy system integration.
In this approach, adaptability depending on the state of the photovoltaic system (power surplus/power deficit) guarantees excellent reliability to meet energy demands. The comprehensive energy management assessment takes into account various constraints such as load demand, hydrogen storage levels, operation of various elements, and energy surplus and shortage conditions.

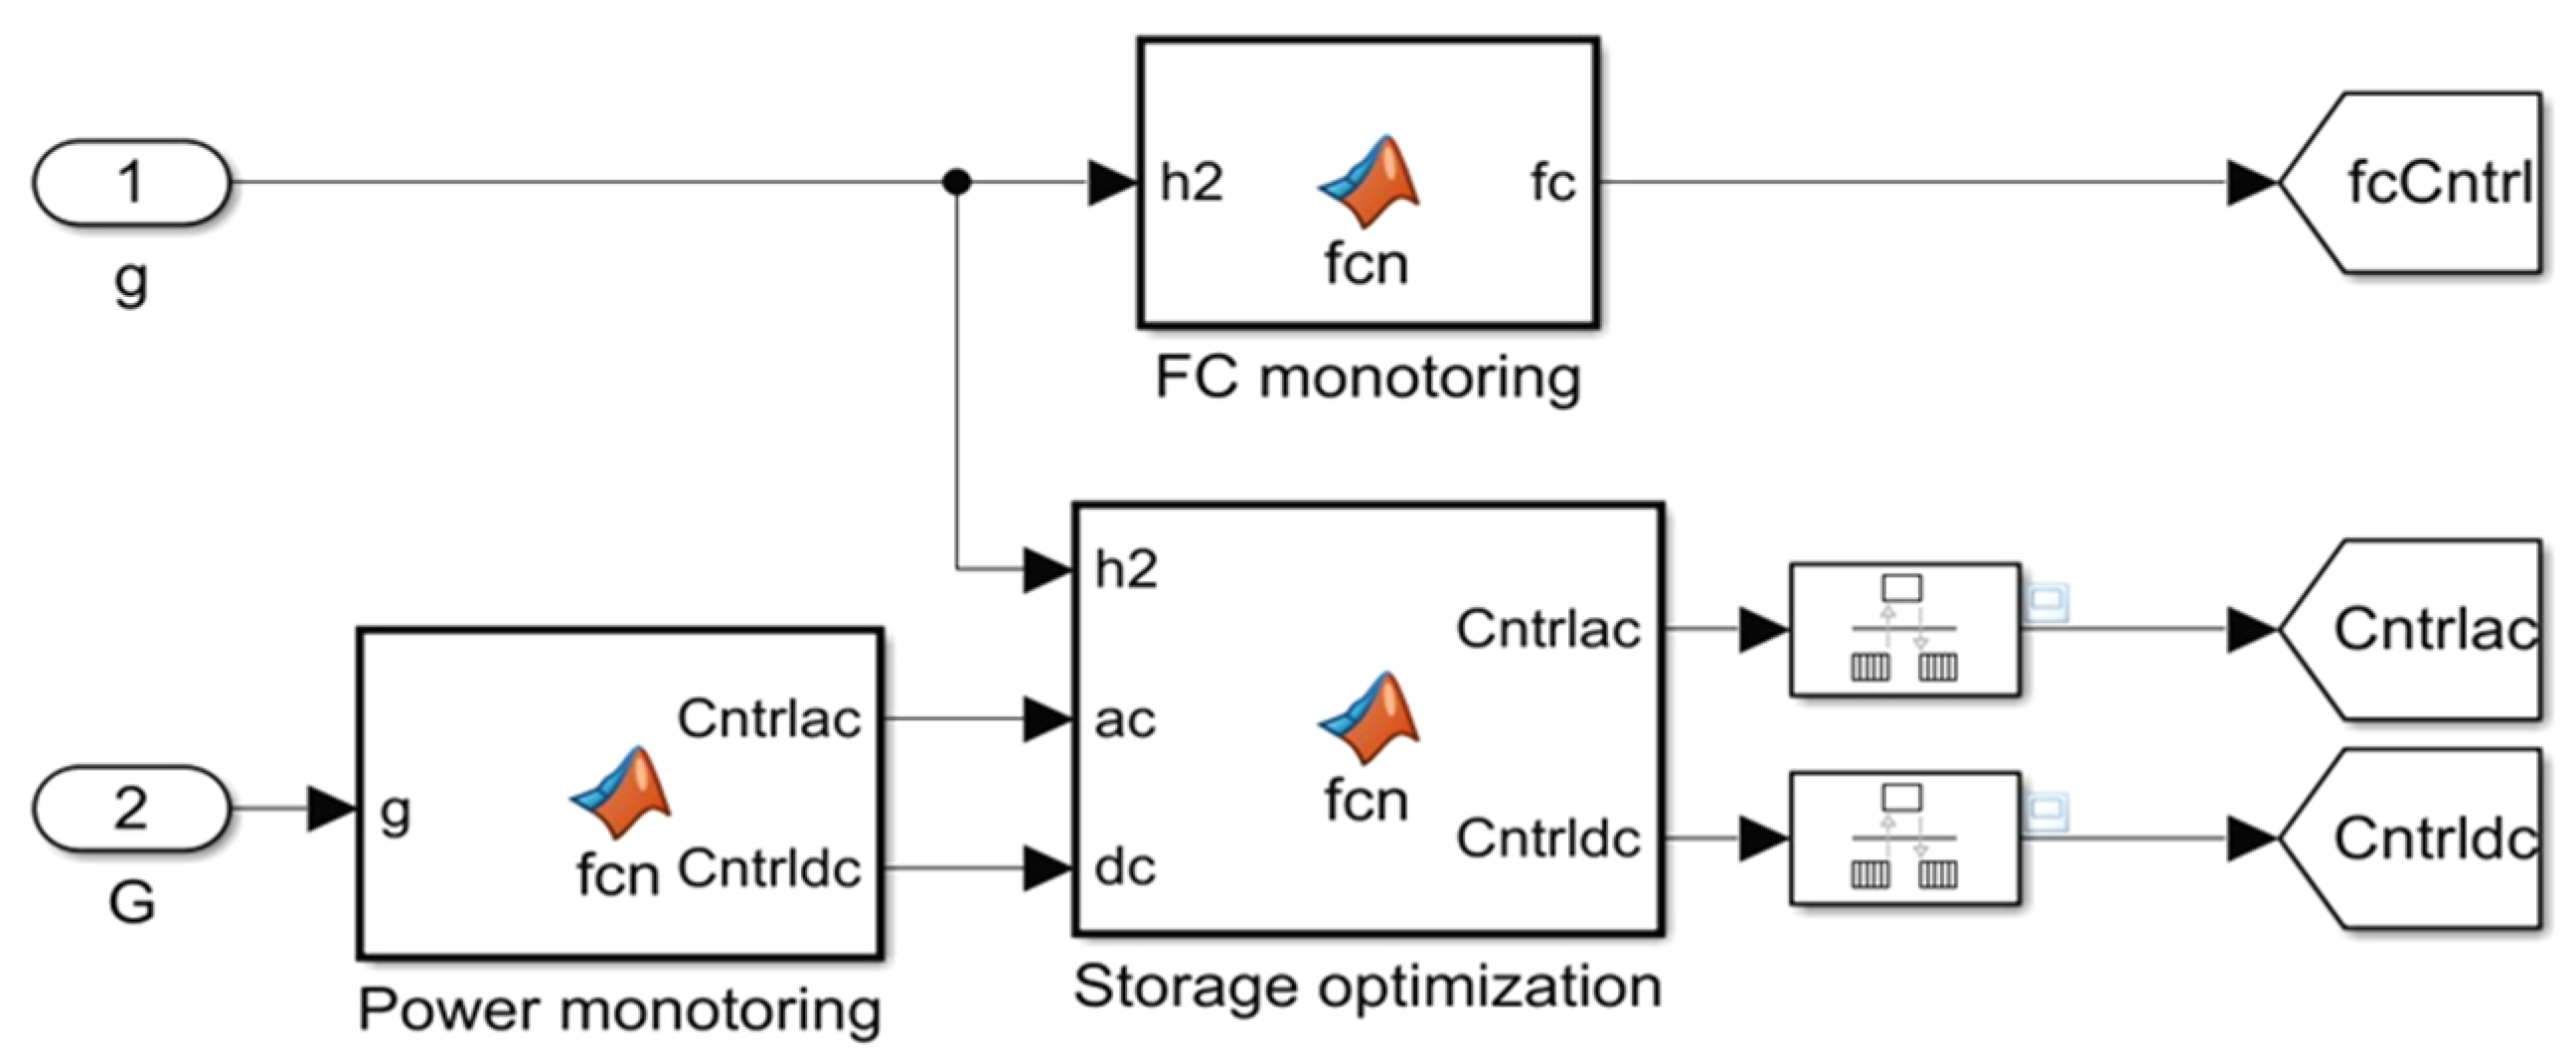
5.2. System Control Strategy

In our system, the MPPT controller adjusts the operating point of the solar panel using the modified P&O algorithm, thereby ensuring optimal power production by maintaining the output voltage at the maximum power point [35]. DC bus control encompasses the management of electrical parameters on this bus with the aim of ensuring stability and operational efficiency. Electronic devices such as DC–DC converters and regulators are used to maintain the required electrical conditions. Regulation of the output power of the PEM electrolyzer is achieved by adjusting the input current via a buck–boost converter, driven in continuous mode by a PWM generator. The PD3 Rectifier block simulates a three-phase rectifier with sinusoidal pulsewidth modulation (PWM), converting three-phase AC into a regulated DC voltage. It integrates an MPPT algorithm to optimize the power of a photovoltaic system, with a three-phase circuit breaker under logic control.

5.3. Energy Management of the Hydrogen Production and Storage System

  • Energy management algorithm
To ensure the balance of energy flow between the components of the proposed hydrogen production and storage system and the grid, an efficient energy management model was developed in a MATLAB2023 environment to plan their operation on an hourly basis. Figure 6 and Figure 7 illustrate, respectively, the Simulink implementation and the algorithm of energy management (EMS). In this developed model, the hourly imbalance between the solar output power of the PV system and the demand is evaluated based on the hourly simulation results of PV power. When there is a surplus in solar electricity production, the electrolyzer is powered to produce green hydrogen, and the storage tank is allowed to fill with green hydrogen as long as the operating pressure is below the target pressure. If the operating pressure reaches the target pressure threshold, then the storage tank stops filling with hydrogen gas. If the excess PV power exceeds the rated capacity of the electrolyzer, then the electrolyzer is set to operate at its rated capacity, and the excess PV power is injected into the grid.
  • Analysis of the energy management scenarios.
    Initializing Data Inputs: Configure the initial parameters required for the algorithm, including Ppv, grid availability, H2 storage tank capacity, minimum PV power thresholds, and minimum variation for H2 storage.
    PV Power Evaluation.
  • If the generated PV power exceeds a minimum threshold (Pmin) and if the PV power is sufficient, then the power generated is directed by PV to the PEM electrolyzer for H2 production.
  • If the PV power is insufficient then the energy is imported from the electricity grid.
    H2 Storage Tank Monitoring: Continuously monitor the status of the H2 storage tank and ensure that the tank is neither overfilled or underfilled for safe operating conditions.
    Check if the current H2 storage level is within a predefined operational range and is not close to the maximum capacity of the tank.
    Optimization of H2 Charge.
  • If the current variation in dmh2(t) is less than a predefined minimum variation (Delt mH2 max) then interrupt the filling process to maintain system stability.
  • If the H2 variation allows additional charging then continue to charge the H2 storage tank until it reaches an optimal level.
    Management of Excess PV Power: When the H2 storage tank is full, the solar power generation is checked if it is PV and not zero.
  • If excess PV power is available then activate the system to export excess PV power to the grid, ensuring efficient use of the generated energy.
    Iteration of the Algorithm: The algorithm evaluates and repeats these steps on an hourly basis to adapt to changing conditions and optimize energy management throughout the system.

6. Results and Discussions

6.1. Simulation Parameters

Simulations were carried out using MATLAB/Simulink software2023, with real data, including solar irradiation and ambient temperature. The parameters used for the simulation of the different components of the hydrogen production and storage system are illustrated in Table 4. Figure 8, Figure 9 and Figure 10, respectively, show the daily variations in solar irradiation, ambient temperature, and of the PV power supplied. The instantaneous power of the electrolyzer is illustrated in Figure 11, in which we observe that during periods of absence of sunshine (between 0 and 6 a.m., then 19–24 p.m. for each day of the summer season), the electrical network (grid) powers the system while for other periods it is solar energy which will be the main source of power for the system.
Figure 12 shows the daily exchange of electricity between the system components (PV, electrolyzer, grid, storage). It refers to the transfers of energy that occur daily between different parts of an energy system. These trades are influenced by factors such as PV renewable energy production, consumer demand, and storage capacities. Understanding and optimizing these exchanges is essential to ensure the efficiency of the energy system, and the use of Simulink makes it possible to visualize and analyze these dynamics for informed energy management. The hydrogen production and storage system provides around 126,040 kWh of green energy every day, which represents around 60% of the clean energy contribution.
Figure 13 shows the simulated daily hydrogen production and consumption assuming that the tank is initially not empty (low mass). An increase in the electrolyzer’s hydrogen production rate can be observed during periods of high sunlight, where excess solar energy is more likely to be generated during long periods of sunlight, as well as an increase in the hydrogen consumption rate of the fuel cell. Figure 14 represents the results of the simulation of H2 production as a function of the electrolyzer electric current. As current is supplied to the electrolyzer, the dissociation reaction of water molecules increases rapidly. Therefore, the overall efficiency of the proposed PV–H2 system is 60%. Future work should focus on improving the efficiency of PV–H2 systems while minimizing the energy cost for optimally sized renewable–hydrogen hybrid systems. In order to quantify and verify the reliability and effectiveness of the suggested control approach, as well as the ability of the independent hydrogen production and storage system to meet energy demands independent of any external factors, Matlab–Simulink software 2023 was used with practical meteorological input data (radiation/temperature of Figure 8 and Figure 9).
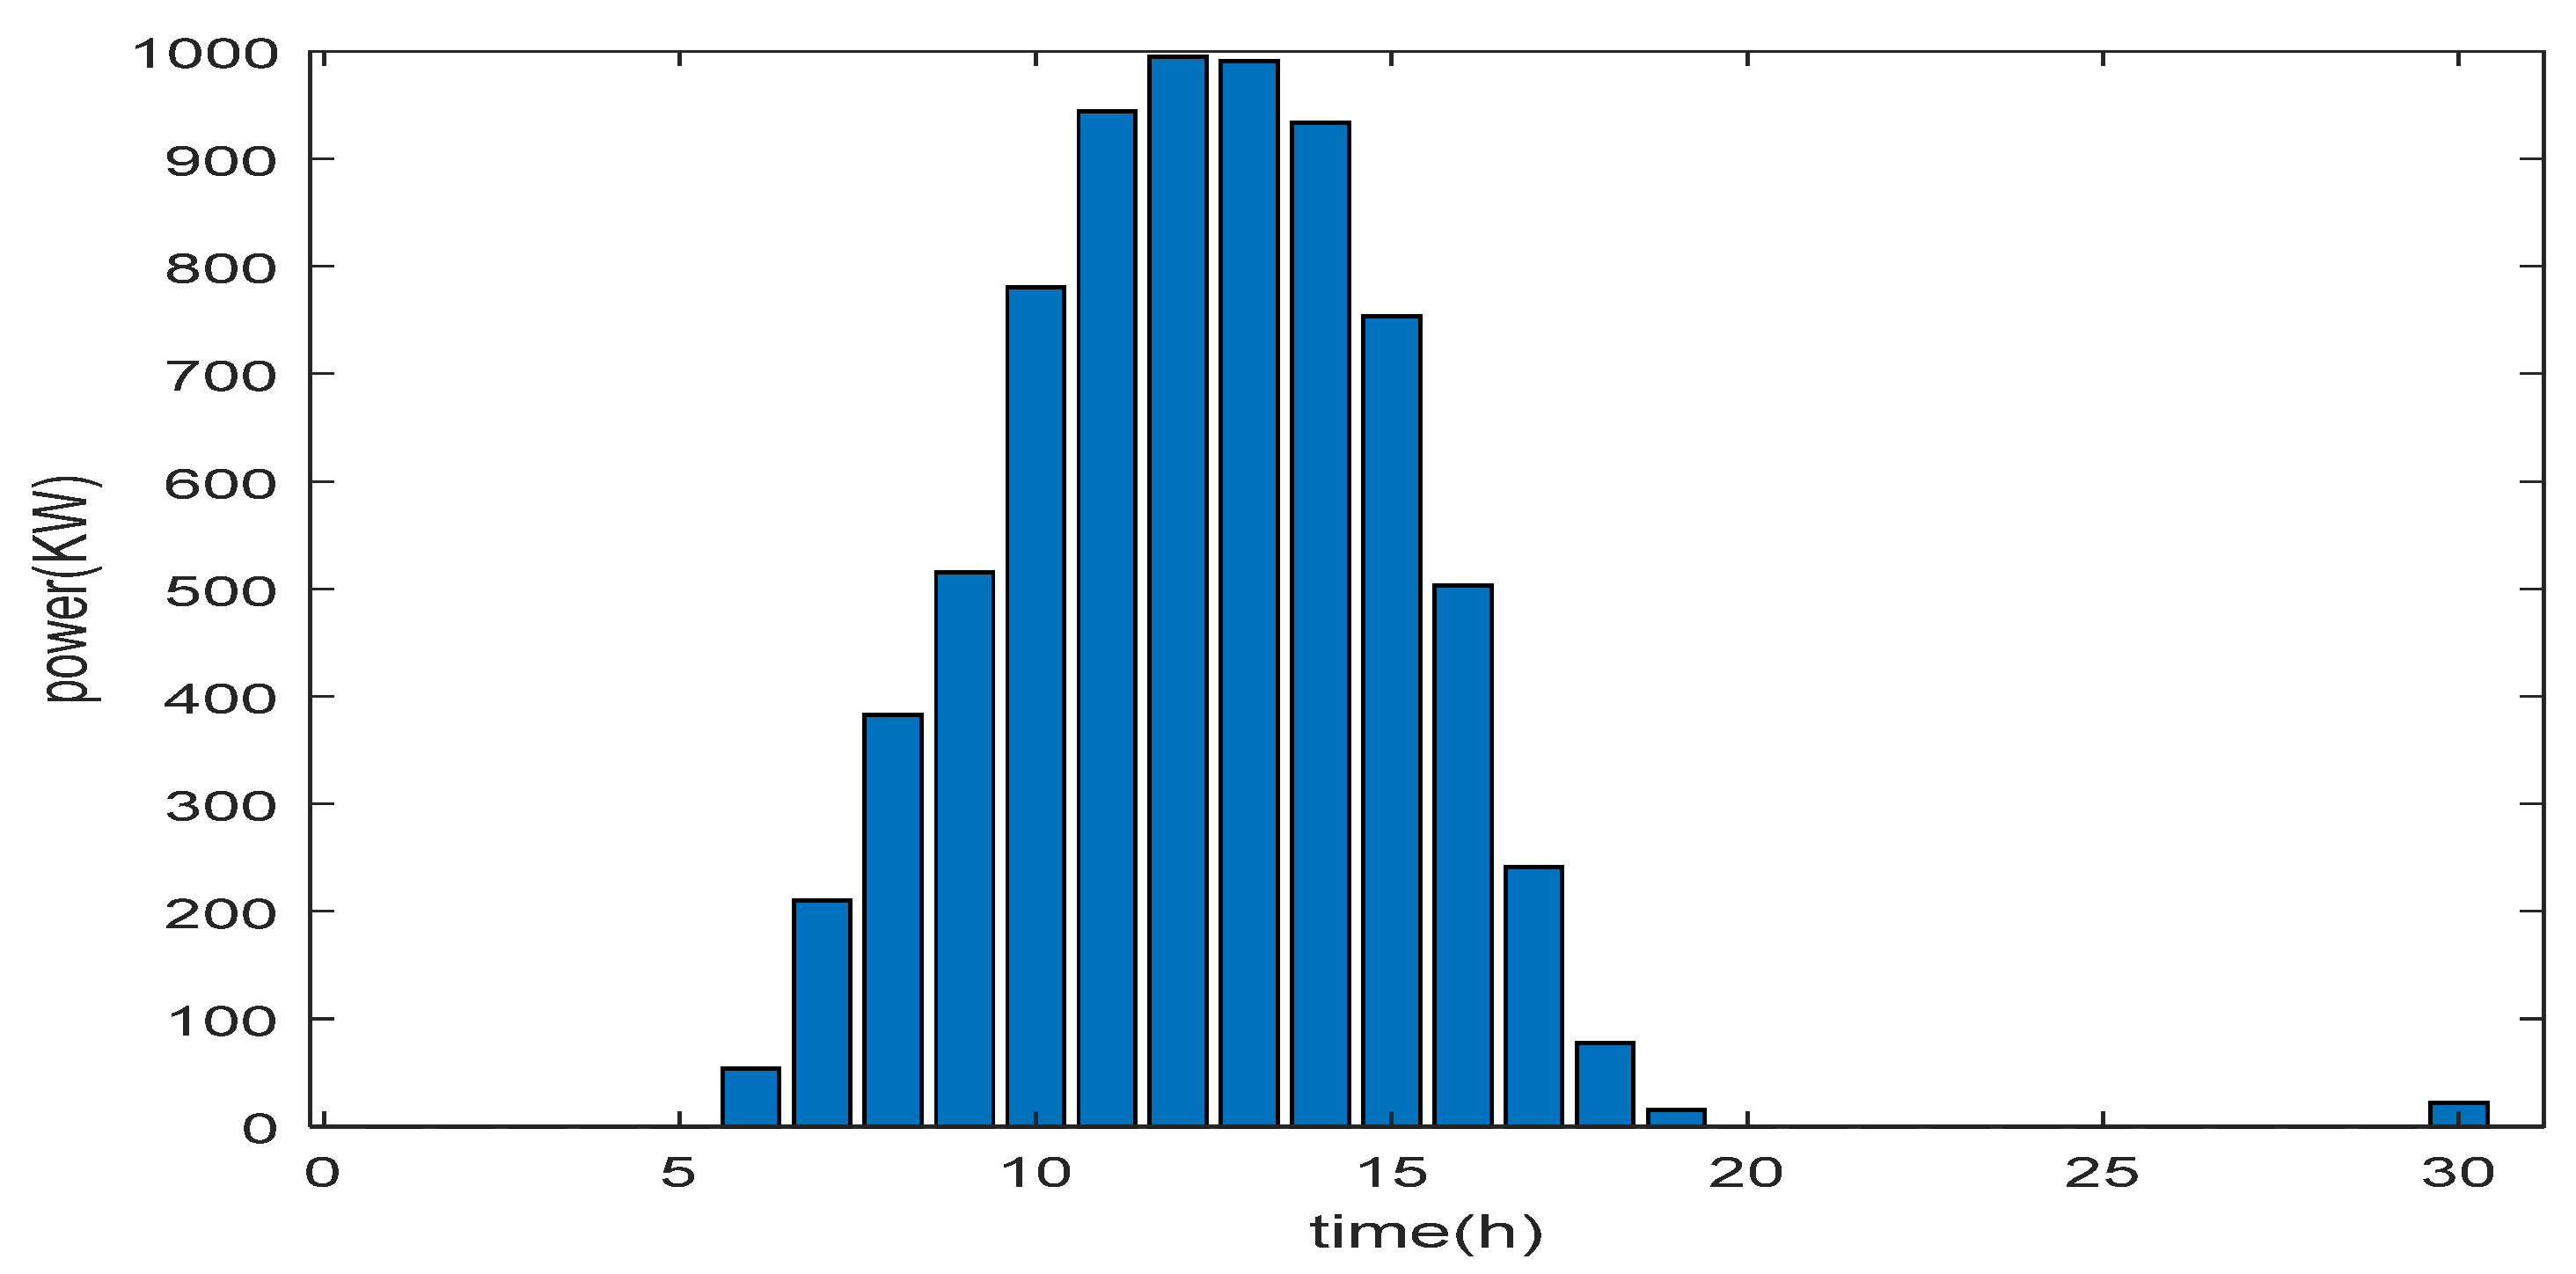
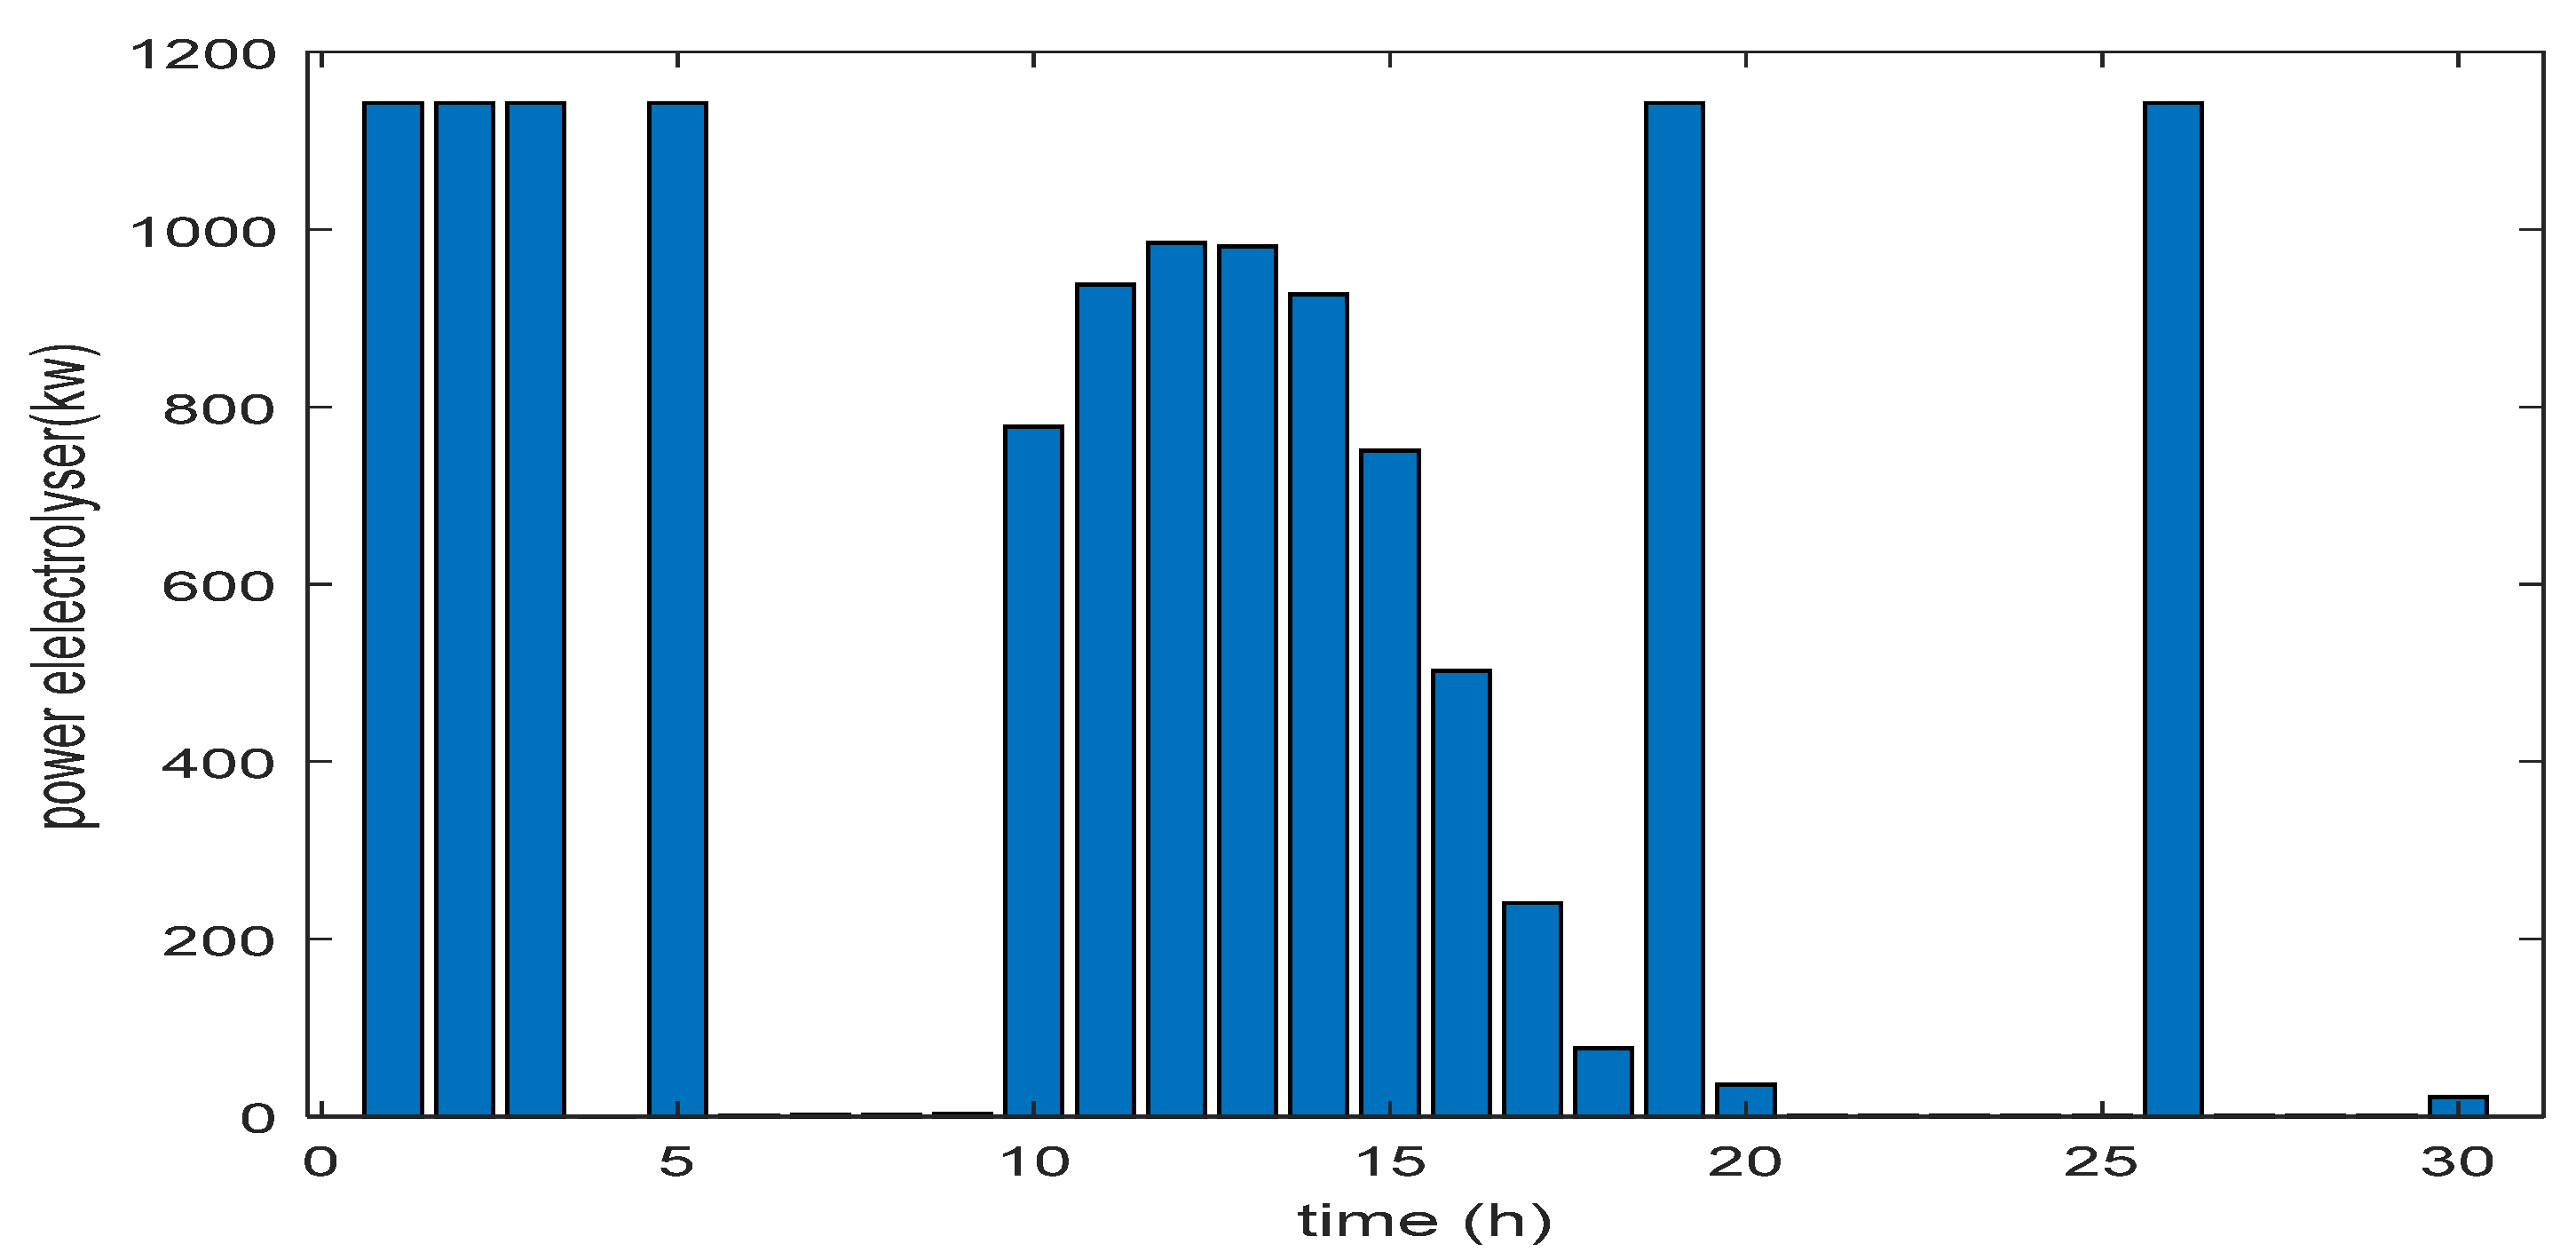
  • Evaluation of excess energy mode
The excess power mode evaluation looks at several performance metrics, including hydrogen production efficiency, storage efficiency, system response time, hydrogen production purity, overall system efficiency, and control reliability. The EMS must automatically check if the actual H2 storage level is within a predefined operational value and is not close to the maximum tank capacity: in this case, the value of dmH2 must be less than a threshold value (Delta mH2max), otherwise, its state remains ready for operation and it operates in charging mode.
  • Evaluation of energy deficit mode
When the system enters this mode, it becomes corrupted and requires rapid correction. In the meantime, the electricity network is preparing to become operational to correct this lack. The latter intervenes to cover the remaining power according to the constraints presented. If the condition delta mH2(t) is less than a predefined minimum variation (Delta mH2max) is met, the electrolyzer is powered and charges the hydrogen storage tank.

6.2. Evaluation of CO2 Emissions

* CO2 Gas emission by Hydrogen
G E C O 2 = M H 2 · E F H 2
M H 2 = P · T η · C H 2
G E C O 2 = P · T · M H 2 η · C H 2
  • G E C O 2 : produced quantity of carbon dioxide CO2 (kg CO2);
  • E F H 2 : emission Factor of green H2 (kg CO2/kg H2);
  • M H 2 :produced quantity of Hydrogen (kg H2);
  • P: power of the plant (kW);
  • T: average functioning time of the plant (Hours);
  • η : efficiency of H2;
  • C H 2 :calorific coefficient of H2 (Kwh/kg).

6.3. Comparison Study of CO2 Emission Between Hydrogen and Fuel

In our case study the power station is P = 1 MW with an efficiency of 80% with continuous an average functioning T = 3650 h/year
  • Case of Hydrogen station
E F H 2 = 0.1   k g   C O 2   b y   k g   o f   H 2 ; C H 2 = 33   k W h / k g
M H 2 = 1000   k W / ( 0.8 · 33   k W h / k g ) = 30   k g   H 2 / h
G E C O 2 = 30   k g · ( 0.1 )   k g   C O 2 / k g   H 2 = 3   k g   C O 2 / h
This is equivalent to a quantity of 10,950 kg of CO2 per year (in the case of 1 MW power production station by green H2)
  • Case of fuel (Diesel) station
E F N G = 0.25   k g   C O 2 / k g
E l e c t r i c   E n e r g y   p r o d u c t i o n :   1 M W · 3650   h / y e a r = 3650   M W h / y e a r
E m i s s i o n   o f   C O 2 :   3650   M W h / y e a r .   ( 0.25   k g   C O 2 / k W h ) = 912,500   k g   C O 2 / y e a r
  • Gain in reduction of CO2 emissions
G C O 2 % = 100 · G E C O 2 F u e l G E C O 2 H 2 G E C O 2 F u e l
which gives the next gain percentage G C O 2 = 98.8%. This value indicates that greenhouse CO2 emissions are reduced to 1.2%.

6.4. Results Discussion

The described power profiles shows that the electrolyzer voltage, current, and daily hydrogen production flow rate are influenced by sunlight. During the day, the electrolyzer operates at its optimal power and produces a purely green hydrogen flow rate of 6.5 kg of green hydrogen/h, or 216 kWh of stored energy per hour. At night, the electrolyzer is powered by the electricity grid to continue hydrogen production. It achieves a flow rate of 9.2 kg/h of non-green hydrogen, which translates to a stored energy of 305 kWh per hour. Thus, the stored green hydrogen is equal to 6.430 kWh per day, which translates to a percentage of green hydrogen produced of 65%.
This quantity of stored energy is sufficient (more than 6 GWh per day) to feed the refueling recharge stations, electric vehicles, or other end uses (industrial applications).
These results (conducted in Tunisia) can be extended to other regions having the same climatic conditions such as the north of Africa and Maghreb (Tunisia, Algeria, Morroco, and Libya) because they have similar geographic and climatic conditions and also the same traditions in fossil fuel and renewable energy usage. Also, they sometimes are connected with the same infrastructure like the smart Electricity grid between Tunisia and Algeria.
The proposed study has several limitations:
-
Economic viability: High initial costs could hinder adoption, particularly in economically constrained regions.
-
System dependence on weather fluctuations in solar energy production can affect hydrogen production during poor sunlight conditions, especially in regions not connected to the power grid.
-
The country’s lack of hydrogen transportation and distribution infrastructure, which smooths hydrogen away from refueling stations or users.
-
Regulatory framework and public acceptance.
Also, we succeeded in enhancing certain aspects of our study such as sustainability, reliability, reduced cost, and resilient H2 production and storage.
-
For sustainability, it was ensured by the hybridization between solar and green hydrogen, which are two sources without greenhouse gas emissions and complementary.
-
For reliability, it is the proposed energy management algorithm that allows scenarios to be managed and energy and thermal transfers to be optimized and therefore, the efficiency of daily hydrogen production.
-
For operating costs, it is the amortization of the actualized cost of selling hydrogen that reduces the cost price. This cost is reduced by the integration of solar on the one hand and by the algorithmic optimization of management and supervision of the installation on the other.
-
For resilience, it is improved by an integrated approach that combines energy diversification (PtE and PtG strategies), optimized, and proactive management as well as flexible and multiple storage.
To compare our results with other studies, we reported in Table 5 the main results and performances obtained from several references.
Finally, we can say that despite some economic and technological problems such as cost, infrastructure, and security, the proposed work could advance green hydrogen production technology to reduce greenhouse gas emissions and limit dependence on fossil fuels. It also allows for the development of new alternative and sustainable solutions, whether for electricity generation, energy storage, or even the future substitution of natural gas (methane). The proposed infrastructure could also boost the sustainable transportation, industrial, medical, chemical, and even agricultural sectors. On a social level, its impact is the creation of new jobs and opportunities for new investments.

7. Conclusions

The integration of green hydrogen production and storage systems, powered by photovoltaic panels, represents a significant step forward towards energy solutions. The results of this study investigated a 1 MW hydrogen production station that generates from 250 to 400 kg of hydrogen per day (in function of the geographic and climatic conditions), equivalent to approximately 8 to 12 MWh of stored energy. The PEMFC hydrogen cells used have a power of 500 kW with an efficiency of 60% and can reach 90% in the case of a heat recovery device. We have shown that the gain brought by the substitution of fossil fuels with green hydrogen reduces CO2 emissions by 98.8%, i.e., a gain of 900 tones of CO2 per year for the 1 MW installations. Also, the implementation of an optimization and energy management algorithm (EMS) in our station made it possible to supervise and control the operation and the different transfer scenarios of power energy flows between the PV, the electrolyzer, and the PEMFC and, in particular, during hours of insufficient PV production. The model takes into account the hydrogen consumption required to satisfy the charging demand and updates it based on operating hours. These results clearly reveal the potential of green hydrogen production and storage systems to contribute to the energy transition, while indicating the need for support for the technological development of the infrastructures necessary to maximize their large-scale deployment and ensure the safety of equipment and personnel.

Author Contributions

Conceptualization, D.H. and A.C.; methodology, K.K.; software, I.B.O.; validation, A.C. and K.K.; formal analysis, D.H.; investigation, D.H.; resources, A.C.; data curation, A.C.; writing—original draft preparation, D.H.; writing—review and editing, A.C.; visualization, D.H.; supervision, A.C.; project administration, A.C.; funding acquisition, I.B.O. All authors have read and agreed to the published version of the manuscript.

Funding

This research was funded by project ARICA 23-703.

Data Availability Statement

The original contributions presented in this study are included in the article. Further inquiries can be directed to the corresponding author.

Conflicts of Interest

The authors declare no conflicts of interest.

References

  1. García-Triviño, P.; Torreglosa, J.P.; Jurado, F.; Fernández Ramírez, L.M. Optimized operation of power sources of a PV/battery/hydrogen-powered hybrid charging station for electric and fuel cell vehicles. IET Renew. Power Gener. 2019, 13, 3022–3032. [Google Scholar] [CrossRef]
  2. European Commission: The Strategic Energy Technology (SET). Available online: https://www.bluemed-initiative.eu/wp-content/uploads/2018/11/Strategic-Energy-Technology-Plan.pdf (accessed on 10 June 2019).
  3. Feliciano, D. Net Zero Technical Report Committee on Climate Change; Committee on Climate Change: London, UK, 2019. [Google Scholar] [CrossRef]
  4. Narayanan, A.; Mets, K.; Strobbe, M.; Develder, C. Feasibility of 100% renewable energy-based electricity production for cities with storage and flexibility. Renew. Energy 2019, 134, 698–709. [Google Scholar]
  5. Widera, B. Renewable hydrogen implementations for combined energy storage, transportation and stationary applications. Therm. Sci. Eng. Prog. 2020, 16, 100460. [Google Scholar]
  6. Dahmane, N.; Djerioui, A.; Zeghlache, S.; Dahmane, Z.E.; Houari, A.; Hadjkaddour, A. Energy Management of PV/FC/BAT/SC and PEM Electrolyzer. In Proceedings of the 2022 IEEE International Conference on Electrical Sciences and Technologies in Maghreb (CISTEM), Tunis, Tunisia, 26–28 October 2022; pp. 1–6. [Google Scholar] [CrossRef]
  7. Javadpoor, S.; Nazarpour, D. Modeling a PV-FC-Hydrogen Hybrid Power Generation System. Eng. Technol. Appl. Sci. Res. 2017, 7, 1455–1459. [Google Scholar] [CrossRef]
  8. Parra, D.; Valverde, L.; Pino, F.J.; Martin, K. A review on the role, cost and value of hydrogen energy systems for deep decarbonization. Renew. Sustain. Energy Rev. 2019, 101, 279–294. [Google Scholar] [CrossRef]
  9. Tang, D.; Zio, E.; Yuan, Y.; Zhao, J.; Yan, X. The energy management and optimization strategy for fuel cell hybrid ships. In Proceedings of the 2nd International Conference on System Reliability and Safety (ICSRS), Milan, Italy, 20–22 December 2017; Available online: https://api.semanticscholar.org/CorpusID:46292092 (accessed on 31 December 2017).
  10. Han, J.; Charpentier, J.F.; Tang, T. An Energy Management System of a Fuel Cell/Battery Hybrid Boat. Energies 2014, 7, 2799–2820. [Google Scholar] [CrossRef]
  11. Okundamiya, M.S. Size optimization of a hybrid photovoltaic/fuel cell grid connected power system including hydrogen storage. Int. J. Hydrogen Energy 2021, 46, 30539–30546. [Google Scholar] [CrossRef]
  12. Bukar, A.L.; Tan, C.W. A review on stand-alone photovoltaic-wind energy system with fuel cell: System optimization and energy management strategy. J. Clean. Prod. 2019, 221, 73–88. [Google Scholar]
  13. Alhasnawi, B.; Jasim, B.H.; Bures, V.; Sedhom, B.E.; Alhasnawi, A.N.; Abbasi, R.; Razaq, M.M.; Siano, P.; Guerrero, J.M. A novel economic dispatch in the stand-alone system using improved butterfly optimization algorithm. Energy Strategy Rev. 2023, 49, 101135. [Google Scholar] [CrossRef]
  14. Yawale, S.K.; Hanaoka, T.; Kapshe, M.; Deshpande, A. Direct and indirect air pollutant reductions as co-benefits of the energy transition toward carbon-neutrality in India’s residential sector. Energy Strategy Rev. 2023, 49, 101143. [Google Scholar] [CrossRef]
  15. Bai, Y.X.; Wang, C.; Zeng, M.; Chen, Y.H.; Wen, H.X.; Nie, P.Y. Does carbon trading mechanism improve the efficiency of green innovation: Evidence from China. Energy Strategy Rev. 2023, 49, 101170. [Google Scholar] [CrossRef]
  16. Jia, J.; Xin, L.; Lu, C.; Wu, B.; Zhong, Y. China’s CO2 emissions: A systematic decomposition concurrently from multi-sectors and multi-stages since 1980 by an extended logarithmic mean divisia index. Energy Strategy Rev. 2023, 49, 101141. [Google Scholar] [CrossRef]
  17. Balsamo, F.; Capasso, C.; Miccione, G.; Veneri, O. Hybrid Storage System Control Strategy for All-Electric Powered Ships. Energy Procedia 2017, 126, 1083–1090. [Google Scholar] [CrossRef]
  18. Brekken, T.K.; Yokochi, A.; Von Jouanne, A.; Yen, Z.Z.; Hapke, H.M.; Halamay, D.A. Optimal energy storage sizing and control for wind power applications. Sustain. Energy, IEEE Trans. 2011, 2, 69–77. [Google Scholar]
  19. Zhang, Y.; Chowdhury, A.A.; Koval, D.O. Probabilistic wind energy modeling in electric generation system reliability assessment. Ind. Appl. IEEE Trans. 2011, 47, 1507–1514. [Google Scholar] [CrossRef]
  20. Skrúcaný, T.; Kendra, M.; Stopka, O.; Milojević, S.; Figlus, T.; Csiszár, C. Impact of the electric mobility implementation on the greenhouse gases production in central European countries. Sustainability 2019, 11, 4948. [Google Scholar] [CrossRef]
  21. Hasan, T.; Hassan, N.M.; Shah, R.; Emami, K.; Anderson, J. A hydrogen supply-chain model powering Australian isolated communities. Energy Rep. 2023, 9, 209–214. [Google Scholar]
  22. Marin, J. Lhyfewillproduce Green Hydrogen with Wind Turbines. Volume 17. 2020. Available online: https://fr.wikipedia.org/wiki/La_Tribune_(France,_1985) (accessed on 22 April 2023).
  23. Rauline, N. Hydrogen: The World Bank Calls for Investments in the Countries of the South. Volume 20. 2023. Available online: https://fr.wikipedia.org/wiki/Les_%C3%89chos (accessed on 1 May 2023).
  24. Wang, Y.; Fenton, J.M.; Brooker, P. Dynamic Modeling and Operation of a Green Hydrogen Fueling Station for Heavy-Duty Fuel Cell Vehicles. Proc. Meet. 2024, MA2023-01, 1976. Available online: https://iopscience.iop.org/article/10.1149/MA2023-01361976mtgabs (accessed on 21 February 2025).
  25. Rizk-Allah, R.M.; Hassan, I.A.; Snasel, V.; Hassanien, A.E. An optimal standalone wind-photovoltaic power plant system for green hydrogen generation: Case study for hydrogen refueling station. Results Eng. 2024, 22, 102234. [Google Scholar] [CrossRef]
  26. Anastasiadis, A.G.; Papadimitriou, P.; Vlachou, P.; Vokas, G.A. Management of Hybrid Wind and Photovoltaic System Electrolyzer for Green Hydrogen Production and Storage in the Presence of a Small Fleet of Hydrogen Vehicles. Energies 2023, 16, 7990. [Google Scholar] [CrossRef]
  27. Sayed, K. Feasibility Study and Economic Analysis of PV/Wind-Powered Hydrogen Production Plant. IEEE Access 2024, 12, 76304–76318. [Google Scholar] [CrossRef]
  28. Lin, Y.C.; Wyżga, P.; Macyk, J.; Macyk, W.; Guzik, M.N. Solar-driven (photo) electrochemical devices for green hydrogen production and storage: Working principles and design. J. Energy Storage 2024, 82, 110484. [Google Scholar]
  29. Atteya, A.I.; Ali, D.; Sellami, N. Precise Dynamic Modeling of Real-World Hybrid Solar—Hydrogen Energy Systems for Grid-Connected Buildings. Energies 2023, 16, 5449. [Google Scholar] [CrossRef]
  30. Essakhi, H.; Seddik, F. Modeling and photovoltaic simulation. In Proceedings of the Conference JIME 2019, Agadir, Morroco, 14–15 March 2019. [Google Scholar]
  31. Boulmrharj, S.; Khaidar, M.; Bakhouya, M.; Ouladsine, R.; Siniti, M.; Zine-dine, K. Performance Assessment of a Hybrid System with Hydrogen Storage and Fuel Cell for Cogeneration in Buildings. Sustainability 2020, 12, 4832. [Google Scholar] [CrossRef]
  32. Benchouia, N.; Hadjadj, A.E.; Derghal, A.; Khochemane, L.; Mahmah, B. Modeling and validation of fuel cell PEMFC. Rev. Des Energ. Renouvelables 2013, 16, 365–377. [Google Scholar] [CrossRef]
  33. Amrouch, F.; Mahmah, B.; Belhamel, M.; Benmoussa, H. Modeling of a PEMFC fuel cell supplied directly with hydrogen-oxygen and experimental validation. Review. Energy Ren. 2005, 8, 109–121. [Google Scholar]
  34. Saleh, Z.H. Simplified mathematical model of proton exchange membrane fuel cell based on horizon fuel cell stack. J. Mod. Power Syst. Clean Energy 2016, 4, 668–679. [Google Scholar]
  35. Bhuyan, S.K.; Hota, P.K.; Panda, B. Modeling, Control and Power Management Strategy of a Grid connected Hybrid Energy System. Int. J. Electr. Comput. Eng. (IJECE) 2018, 8, 1345–1356. [Google Scholar] [CrossRef]
  36. Mohammad, S.S.; Iqbal, S.J. Optimization and Power Management of Solar PV-based Integrated Energy System for Distributed Green Hydrogen Production. Distrib. Gener. Altern. Energy J. 2022, 37, 865–898. [Google Scholar] [CrossRef]
  37. Naseri, N.; El Hani, S.; Machmoum, M.; Elbouchikhi, E.; Daghouri, A. Energy Management Strategy for a Net Zero Emission Islanded Photovoltaic Microgrid-Based Green Hydrogen System. Energies 2024, 17, 2111. [Google Scholar] [CrossRef]
  38. Shaker, F.N.; Obed, A.A.; Abid, A.J.; Saleh, A.L.; Hassoon, R.J. Energy Management Strategy for PV PSO MPPT/Fuel Cell/Battery Hybrid System with Hydrogen Production and Storage. J. Tech. 2023, 5, 52–60. [Google Scholar] [CrossRef]
  39. Hollmuller, P.; Joubert, J.-M. Evaluation of a 5 kWp photovoltaic hydrogen production and storage installation for a residential home in Switzerland. Int. J. Hydrogen Energy 2000, 25, 97–109. [Google Scholar] [CrossRef]
Figure 1. Hydrogen production processes.
Wevj 16 00227 g001
Figure 2. Infrastructure of the H2 production/storage chain.
Wevj 16 00227 g002
Figure 3. Simulink model of the proposed system.
Wevj 16 00227 g003
Figure 4. Electric model of a fuel cell.
Wevj 16 00227 g004
Figure 5. Polarization curve of a fuel cell.
Wevj 16 00227 g005
Figure 6. Simulink of the energy management model flow.
Wevj 16 00227 g006
Figure 7. Flowchart of the developed energy management model.
Wevj 16 00227 g007
Figure 8. Hourly solar irradiation (W/m2).
Wevj 16 00227 g008
Figure 9. Hourly ambient temperature.
Wevj 16 00227 g009
Figure 10. Daily PV power.
Wevj 16 00227 g010
Figure 11. Hourly electrolyzer power.
Wevj 16 00227 g011
Figure 12. Daily exchange of electricity between system components.
Wevj 16 00227 g012
Figure 13. Daily mass of H2 storage (case of continuous operation 24 h/7 days)for a 1 MW station).
Wevj 16 00227 g013
Figure 14. Hydrogen produced per hour as a function of electrolyzer current.
Wevj 16 00227 g014
Table 1. PV-JINKO solar module parameter.
SettingsValue/Type
PV power1200 kWpic
Total number of PV modules3042
PV Connection Modules78 strings × 39 in series
PV Connection Modules400 W× (78 strings × 39 in series)
Short-circuit current (Isc)7.66 A (each one)
Open-circuit voltage (Voc)48.5 V (each one)
Table 2. Characteristic table of the PEM electrolyzer.
SettingsValues
Rated electrical power355 W
Rated steak voltage8 V
Stack current range0–50 A
Operating temperature range298 °K
Hydrogen outlet pressure10.5 bar
Cells numbers90 cells in Series and 25 in Parallel
Table 3. Characteristic of the fuel cell.
SettingsValues
Rated output power500 kW
Electrical efficiency49%
H2 purity 99%
Fuel consumption335 nm3/h
Table 4. Design parameters of the proposed system.
SettingsValue/Type
Total PV installed capacity1200 kW
Total number of PV modules3042
PV Connection Modules78 strings × 39 in series
Nominal power of each PV Module400 W
Short-circuit current (Isc)7.66 A
Open-circuit voltage (Voc)48.5 V
PEM Electrolyze power700 kW
Hydrogen tank800 Kg
PEM Fuel Cell500 kW
Efficiency of Fuel Cell46%
Table 5. Performances comparison with other references and studies.
StudyResults
Sheikh Suhail M [36]PV power = 150 kW
Electrolyzer power = 100 kW
Battery power: 47 kW
Produced energy = 650 kWh/day
H2 production = 12 kg/day
cost of H2 production = USD 4.8 per kg
Total Costs = USD 749,904
N. Naseri and Al [37]Equivalent hydrogen efficiency (EHC): 30%
Battery State of Charge (SOC): 20% to 80%
Power Sharing Efficiency: 50%
Maximum Power Point Tracking (MPPT) with fuzzy logic controller = Efficiency 95%
F. N. Shaker [38]PV power = 18 kW
Battery = 3.7 kW
Fuell cell = 4.9 kW
PEM electrolyzer = 7 KW
H2 production = 400 kg/day
Global Efficiency = 0.35
P. Hollmuller, J-M. Joubert [39]PV power = 5 kW
Energy production = 30 kWh/day
Electrolyzer power 5 kW (37 V, 250 A), 2 bar
Battery capacity: 22 kWh
H2 production = 1100 Nm3 per year = 100 kg/year
1 Nm3 of hydrogen produces 3 kWh.
1 kg of hydrogen contains 33.3 kWh of energy.
Our study
Hidouri D and Al.
PV power = 1200 kW
PEM electrolyzer = 750 kW
Fuell cell = 500 kW
Battery = 75 kW
H2 production = 250 to 400 kg/day
Global Efficiency = 0.49
EMS with SCADA and supervision interface
Disclaimer/Publisher’s Note: The statements, opinions and data contained in all publications are solely those of the individual author(s) and contributor(s) and not of MDPI and/or the editor(s). MDPI and/or the editor(s) disclaim responsibility for any injury to people or property resulting from any ideas, methods, instructions or products referred to in the content.

