Article

A Four-Party Evolutionary Game Analysis of Retired Power Battery Recycling Strategies Under the Low Carbon Goals

School of Automotive Business, Hubei University of Automotive Technology, Shiyan 442002, China
*
Author to whom correspondence should be addressed.
World Electr. Veh. J. 2025, 16(3), 187; https://doi.org/10.3390/wevj16030187
Submission received: 4 March 2025 / Revised: 16 March 2025 / Accepted: 18 March 2025 / Published: 20 March 2025

Abstract

Under the low carbon goal, recycling power batteries (PBs) from new energy vehicles (NEVs) is a crucial measure to address resource shortages and reduce carbon emissions. This study examined the insufficient collaboration among the responsible entities and the imperfections in market mechanisms within the PB recycling system. We overcome the limitations of traditional tripartite evolutionary game models by developing a four-party evolutionary game model that incorporates the government, manufacturers, recyclers, and consumers to investigate the strategic interactions within the extended producer responsibility (EPR) framework. Using MATLAB 2023a numerical simulations and Lyapunov stability analysis, we found that the system’s stability and efficiency depend on stakeholder collaboration and effective government policy guidance. The system evolves toward a Pareto optimal state when all parties adopt proactive recycling strategies. Meanwhile, ensuring substantial profits for manufacturers and recyclers is critical for the feasibility and stable operation of compliant recycling channels. While manufacturers and recyclers are more sensitive to subsidies than consumers, consumer decision-making is key to market stability. Long-term excessive subsidies may lead to diminishing marginal benefits. Strategic recommendations are provided for policymakers and stakeholders to enhance the efficiency and sustainability of the PB recycling system.

1. Introduction

Amid the escalating depletion of fossil fuels and the exacerbation of climate change, the imperatives of environmental and energy sustainability have ascended to the pinnacle of global priorities. Notably, within the transportation sector, the utilization of fossil fuels accounts for approximately 97% of the sector’s total energy consumption, contributing over 25% to the world’s carbon emissions [1,2]. China and the United States have emerged as the predominant annual emitters of carbon emissions from road transportation [3]. Confronting this challenge, NEVs, characterized by their reduced operational expenditures and enhanced energy efficiency in transit, are positioning themselves as a pivotal avenue for the transformation of the global automotive sector [4,5].
Compared with fossil fuel-based vehicles, the primary difference of NEVs lies in the innovation of their power sources. NEVs no longer rely on fossil fuels but are powered by renewable energy sources such as electricity and hydrogen [6]. Moreover, the three most significant components are the PB, electric motor, and electronic control system, collectively accounting for approximately 50% of the total vehicle cost. Among these, the EVB alone represents about 40% of the vehicle’s cost, making it the highest-value core component [7]. The burgeoning market of NEVs has spurred a significant increase in demand for their core component, PBs. Data from the global consulting firm SNE Research indicate that the global PB installation volume reached 705.5 GWh in 2023, representing a year-on-year growth rate of 38.6%. In parallel, the global market share of Chinese NEV battery manufacturers has risen sharply from 48.8% in 2021 to 63.5% in 2023, as depicted in Figure 1.
According to national industry standards, a PB is deemed to have reached the end of its service life in NEVs when its capacity degrades to below 80% of the initial capacity [8]. At this threshold, the battery’s range capability is insufficient to meet the vehicle’s normal driving requirements, necessitating its retirement. Consequently, given the current state of technology, the service life of PBs generally ranges from 5 to 8 years [9]. According to the China Alliance of Circular Economy for NEV PB Recycling and Utilization Industry, the volume of retired batteries and the number of NEVs are projected to reach 148.7 GWh and 2.9891 million units, respectively, by 2030. Retired PBs contain substantial amounts of recyclable heavy metals, including nickel, cobalt, and lithium, which hold extremely high value for recycling and repurposing [10]. Nonetheless, the global recycling rate of PBs remains below 5% at present [11]. The accelerated global transition toward electrification has further intensified the scarcity of critical heavy metals such as lithium, cobalt, and nickel, which are indispensable for PB production [12]. The accelerated global electrification strategy transition has further exacerbated the scarcity of critical metals such as lithium, cobalt, and nickel, which are essential for PB production [13].
To mitigate the environmental impact of retired PBs, the European Union introduced the Battery and Waste Battery Regulation in August 2023. This regulation mandates that manufacturers must recycle all end-of-life EVBs and repurpose or dismantle them based on their health status [14]. In January 2018, the Ministry of Industry and Information Technology of China promulgated the Interim Measures for the Management of the Recycling and Utilization of PBs for NEVs. This regulation formalizes the EPR system, mandating that battery manufacturers and NEV producers assume the primary responsibility for recycling retired batteries.
Despite concerted efforts from various sectors to enhance the PB recycling system, the industry continues to confront significant challenges. These include low market entry barriers, inadequate innovation in business models, ambiguous allocation of responsibilities and benefits, and incomplete market mechanisms [15,16]. Collectively, these challenges may result in the low efficiency of standardized recycling processes, elevated costs, and heightened risks of safety hazards and environmental pollution [17]. Therefore, the establishment of an efficient EVB recycling system is essential for facilitating a green transition and ensuring the sustainable development of the NEV industry.
Based on the aforementioned background, this study incorporated the practical challenges of PB recycling and systematically examined factors such as recycling mode selection, stakeholder interactions, and government policies. We constructed a four-player evolutionary game model under the EPR framework, encompassing the government, manufacturers, recyclers, and consumers. Through numerical simulations, we performed a sensitivity analysis of key factors influencing the participants’ decision-making behaviors. This approach enabled us to elucidate the mechanisms driving the evolutionary dynamics and identify the intrinsic motivations of each participant, ultimately offering actionable insights for improving the recycling and management of PBs.
The three contributions of this study are as follows. (1) Most existing studies have focused on dyadic or triadic game analyses. This study innovatively constructed a quadripartite evolutionary game model for spent PB recycling, incorporating the government, manufacturers, recyclers, and consumers. This approach addresses the gap in the literature regarding the collaborative analysis of multiple stakeholders. (2) This study explored the cooperation models between manufacturers and recyclers and assessed their impact on recycling efficiency. This addresses the limitation of existing research that inadequately considers the simultaneous involvement of manufacturers and recyclers in recycling and their bounded rationality in decision-making. (3) This study integrated punitive policies with subsidies to reveal the synergistic mechanisms between incentives and regulatory measures. Unlike existing studies that focused primarily on subsidies, this approach provides scientific recommendations for policymakers and stakeholders, highlighting the combined effects of incentives and penalties on decision-making.
The rest of this study is organized as follows. Section 2 provides a review of the literature concerning the recycling of retired PBs. Section 3 presents the model assumptions, constructs a four-player evolutionary game model, and examines the stability of strategies for relevant stakeholders. Section 4 simulates the impacts of varying parameters on system evolution. Section 5 concludes the study by summarizing the findings and providing strategic recommendations for relevant stakeholders.

2. Literature Review

2.1. Research on Recycling Models of Power Batteries

Early research on PB recycling primarily focused on the efficient separation and extraction of valuable materials from spent batteries to address issues such as high energy consumption, low efficiency, and environmental risks [18]. Harper et al. highlighted that the main recycling methods for retired PBs include pyrometallurgy, hydrometallurgy, and physical separation [19]. Pyrometallurgy, which recovers metals such as cobalt, copper, iron, and nickel through high-temperature smelting, has been applied in commercial recycling operations. However, its high energy consumption and gas emissions limit its economic feasibility for large-scale applications [20,21]. Hydrometallurgy, which uses acidic solutions to leach valuable metals such as lithium and cobalt, offers a higher recovery efficiency than pyrometallurgy and is particularly suitable for processing cathode materials with high concentrations of valuable metals [22,23]. Physical separation methods, which involve mechanical processes like crushing and sorting, are suitable for the preliminary treatment of spent batteries but typically need to be combined with other methods to enhance recovery efficiency [24]. With technological advancements, a series of emerging technologies have emerged in the field of PB recycling including direct recycling, bioleaching, solvent extraction, plasma gasification, mechanochemical recycling, hydrothermal recycling, and artificial intelligence and big data. These technologies demonstrate significant advantages in terms of recovery efficiency, cost control, environmental friendliness, product added value, and intelligent management [25]. For example, direct recycling technology repairs and regenerates cathode materials, avoiding the destruction of materials in traditional methods and significantly reducing the energy consumption and costs [26]. Bioleaching technology uses microorganisms to extract metals, achieving a green and low-energy recycling process [27]. Artificial intelligence and big data technologies optimize recycling processes through intelligent algorithms, enhancing the overall efficiency and precision [28,29]. Moreover, material selection in battery system design has a decisive impact on the full life cycle performance and recycling utilization. Bulut et al. [30] pointed out that materials such as polyetheretherketone and polysulfone are recommended for hybrid vehicle battery packs due to their thermal stability and mechanical strength. Wazeer et al. [31] further noted that phase change materials, known for their lightweight, high energy efficiency, and thermal uniformity, have gained attention as thermal management systems. The choice of these materials not only enhances the performance and safety of battery packs, but also achieves efficient resource utilization and environmental friendliness in the recycling process. As the first wave of PB retirements arrives, cascaded utilization and recycling process improvements have become research priorities. Mirzaei Omrani and Jannesari [32] evaluated the cascaded utilization of electric vehicle lithium-ion batteries from economic and environmental perspectives, highlighting their potential applications in the residential, industrial, and photovoltaic power plant sectors. Skeete et al. [33] pointed out that the diverse chemical compositions and physical properties of spent lithium-ion batteries complicate and increase the cost of the recycling process. Moreover, unrecycled metals, such as cobalt and lithium, are considered hazardous waste materials [34]. The chemical composition differences of lithium-ion batteries mainly manifest in three aspects: energy density, cycle life, and safety. For instance, nickel-cobalt-manganese batteries have a high energy density but shorter cycle life and poorer thermal stability [35], whereas lithium-iron-phosphate batteries have a lower energy density but longer cycle life and higher thermal stability [36]. These characteristics make LFP batteries more economically and environmentally viable in the recycling process [37]. In summary, research on PB recycling technology has evolved from traditional recycling processes to a more efficient, environmentally friendly, and intelligent direction.
Research on PB recycling models not only focuses on innovations and breakthroughs in recycling technologies, but also emphasizes the impact analysis of economic, regional, and political factors, which are key research areas in this field. For instance, Rajaeifar et al. [38] highlighted that the absence of efficient and cost-effective recycling models, which fail to cover diverse battery chemistries and regions, severely hinders the commercialization of battery reuse and recycling. Hosseini-Motlagh et al. [39] analyzed the decision-making of closed-loop supply chain (CLSC) members regarding pricing, economic incentives, and customer service levels under traditional and centralized decision-making structures, demonstrating that coordinated recycling under competitive conditions could significantly enhance the economic performance of the entire supply chain. Additionally, Lander et al. [40] found that China was the most economically viable location for recycling spent PBs due to its lower labor and fixed costs, achieving a net recycling profit of 21.91 USD per kWh. In terms of resource recycling and reuse, Chinen et al. [41] proposed that recycling valuable metals such as nickel from retired batteries could reduce costs by up to 20%, thereby lowering the price of remanufactured batteries and stimulating consumer willingness and acceptance. Kushwaha et al. [42] optimized the manufacturers’ channel choices in product recycling and remanufacturing processes through a mixed-integer linear programming model, suggesting that cooperation with third-party recyclers is the preferred strategy for manufacturers.

2.2. Research on Policies for Power Battery Recycling

In the CLSC of spent PBs, the participation of multiple stakeholders often fails to spontaneously form an efficient and compliant recycling system [43]. To address this issue, governments worldwide have implemented policies such as EPR, subsidies, and carbon credits to promote the recycling and reuse of PBs. EPR policies require battery manufacturers to be accountable for the entire life cycle of their products including recycling and reuse [44]. By clarifying the responsible entities, these policies encourage corporate participation in recycling but also face significant challenges in terms of enforcement difficulty and high regulatory costs [45]. Tembo et al. [46] pointed out that EPR has been adopted as a leading regulatory measure in many countries across Europe, Asia, and North America. However, the implementation outcomes of EPR policies vary significantly among different countries and regions. In some countries, EPR schemes have effectively increased the battery recycling rates, even surpassing the recycling targets set by the European Union, while others have shown poor performance [47]. For example, several states in the United States have passed EPR legislation, mandating retailers and producers to be responsible for battery recycling and reuse [48]. Compagnoni et al. [49] found that EPR policies indirectly led to an increase in the export of used batteries by improving the waste collection rates, more accurately tracking cross-border waste flows, and promoting the specialization of national waste management systems. Carbon credits, on the other hand, encourage companies to reduce carbon emissions through the carbon trading mechanism [50]. Recycling batteries can be considered as a means of reducing carbon emissions, thereby earning carbon credits. While this policy plays a positive role in reducing corporate carbon emissions, it also faces issues such as complex market mechanisms and high transaction costs [51]. Júnior et al. [52] pointed out that blockchain technology can enhance the transparency and traceability of PB recycling, thereby increasing the credibility of carbon credits and assisting companies in more efficiently recording and reporting carbon emission data, ensuring the fairness and rationality of carbon credit allocation. Narang et al. [53] found that the profits of PB manufacturers increased with the increase in carbon quotas but decreased with the rise in carbon trading prices. This indicates that carbon quota policies can motivate manufacturers to reduce carbon emissions while obtaining economic compensation through the carbon trading market. Moreover, governments lower the costs of battery recycling companies and increase their participation through tax incentives or direct subsidies [54]. The research by Li et al. [55] indicates that a PB recycling market lacking a government reward and punishment mechanism will find it difficult to form a green CLSC. Appropriate reward and punishment intensity can encourage companies to invest in recycling infrastructure and technology research and development [56]. However, an excessive reward and punishment intensity may reduce the total welfare due to increased policy expenditure and implementation costs [57]. Therefore, how to balance incentive effects with cost-effectiveness is the key issue in current policy design. In terms of optimizing subsidy policies, Wang et al. [58] suggested that the government should reasonably arrange reward and punishment amounts and implement the EPR system to promote low-carbon production, green consumption, and standardized recycling. Xiao et al. [59] pointed out that battery information sharing and government reward and punishment mechanisms can effectively promote the entry of retired PBs into formal recycling channels and suppress the development of informal recyclers. He and Sun [60] further found that a dynamic reward and punishment mechanism could significantly increase the enthusiasm of consumers and nearly 97% of new energy vehicle manufacturers to participate in recycling. Although existing studies have provided important references for policymaking, further research is still needed on the impact of the current reward and punishment policies on the behavior of manufacturers, recyclers, and consumers, especially in the aspects of evolutionary game analysis and multi-party collaborative mechanisms.

2.3. Current Status of Recycling Research Using Evolutionary Game Theory

Evolutionary game theory has emerged as a crucial theoretical framework in the study of recycling issues. It enables the simulation of strategy propagation and evolution within populations, elucidates the adaptive changes in individual behavior, and forecasts long-term dynamic equilibria [61]. Accordingly, scholars from various fields have increasingly employed this method to tackle the complex interaction issues in the recycling process. For example, Márquez and Rutkowski [62] used Colombia as a case study to explore the application of game theory in the management of spent battery waste. They analyzed the impact of government policies and interactions among stakeholders on the transition toward a circular economy. They highlighted that game-theoretic models could identify key factors that promote sustainable waste management, thus providing a basis for policy formulation. In Germany, Campitelli et al. [63] used evolutionary game theory to analyze stakeholder interactions in waste management. They found that optimizing policies and incentives could enhance system performance and support the circular economy transition Similarly, D’Adamo et al. [64] used game theory to analyze how waste management policies in Italy aligned with the circular economy goals. They highlighted the influence of policy instruments on stakeholder behavior and suggested strategies to optimize policy mixes. Furthermore, in urban waste management, Smol et al. [65] highlighted the importance of game theory in analyzing interactions among local governments, waste management firms, and residents in Poland. They found that optimizing stakeholder cooperation strategies could markedly improve resource recovery efficiency. At the transnational level, Wysokińska [66] used game theory to assess how regulatory frameworks influenced waste management practices, and the findings revealed that coordinated policies and optimized incentives could significantly enhance international cooperation and development in the circular economy.
Furthermore, there is a growing recognition among scholars of the significance of evolutionary game theory in the recycling of NEV batteries. Zhang et al. [67] constructed a tripartite evolutionary game model involving the government, manufacturers, and consumers, simulating the reuse of retired batteries under reduced subsidy scenarios to address challenges in the subsidy process. Building on this, Guo et al. [68] addressed key issues in battery recycling including the government reward–punishment imbalance and insufficient cooperation between manufacturers and recycling firms. They developed a tripartite evolutionary game model involving battery producers, third-party recyclers, and the government. Furthermore, Li and Zhang [69] formulated a tripartite game model for low-carbon innovation in lithium-ion battery recycling, engaging government agencies, battery manufacturers, and recycling firms. By assigning parameters and simulating the evolutionary dynamics, they examined the sensitivity of key parameters and their comparative impacts. Additionally, Wang et al. [70] addressed the issue of insufficient participation by consumers and recyclers in the retired lithium-ion battery recycling system. They developed a tripartite evolutionary game model to examine how government incentive policies shaped the strategic decisions of other stakeholders. Similarly, Xia et al. [71] addressed key challenges, including limited government oversight, information asymmetry, and the risk of economic incentives, encouraging battery manufacturers and third-party verification agencies to manipulate their carbon footprint data. To tackle these issues, they developed a tripartite evolutionary game model involving battery manufacturers, third-party verification agencies, and national market regulatory authorities.

3. Methods

3.1. Model Description

The instability in the collaborative recycling of end-of-life PBs, coupled with the uncertainty surrounding the industry’s future trajectory, has engendered a level of mistrust among the diverse stakeholders involved in the CLSC [72]. In this context, the present study identified the government, manufacturers, recyclers, and consumers as the key stakeholders, positing them as boundedly rational economic agents. Each agent is endowed with the capacity to select from a set of two distinct strategic options, with the implementation of these choices being inherently probabilistic [73]. In pursuit of optimal decision-making regarding the recycling of PBs, participants continually adapt and refine their strategies based on the anticipated strategic behaviors of their counterparts. This dynamic process aims to converge toward an evolutionary stable state, thereby enabling the maximization of individual benefits.
This research focused on the roles of four principal stakeholders in the recycling ecosystem of end-of-life PBs: the government, manufacturers, recyclers, and consumers. As the regulator of the recycling market, the government promotes the fulfillment of environmental responsibilities by all parties through the formulation of reward and punishment policies and the implementation of supervisory mechanisms, without directly engaging in the actual recycling activities. Manufacturers, as battery producers, bear the primary recycling responsibility under the EPR system. Leveraging their advantages in PB production technology and information, they can either establish their own recycling channels or collaborate with recyclers to participate in recycling activities. Recyclers, as professional recycling enterprises, can independently conduct recycling operations based on their technological and network advantages and also provide specialized recycling channel services to manufacturers. Consumers, as the source of the recycling chain, are responsible for delivering spent PBs to recycling outlets, with the extent of their environmental behavior depending on whether recyclers or manufacturers can establish compliant recycling outlets. While the government aims for the public interest, manufacturers and recyclers are profit-oriented. Given that the recycling process requires the consumption of human, material, and financial resources, manufacturers and recyclers weigh the value of actively participating in recycling activities after calculating their net income [74]. Therefore, an intricately designed and efficiently managed recycling system is essential to secure the active participation of all stakeholders in the recycling endeavor. Figure 2 shows the four-party evolutionary game model.

3.2. Model Assumptions

Assumption 1.
The government has two strategic choices. The first is “strict regulation”, which involves implementing both supervision and reward-penalty measures, with the probability of this strategy being denoted as x. The second strategy is “lax regulation”, which entails implementing supervision without reward-penalty measures, with the probability of this strategy being denoted as 1 − x, where x 0 , 1 .
Assumption 2.
Manufacturers have two strategic choices. The first is “participation in recycling”, which means that manufacturers possess recycling channels enabling them to fulfill their recycling responsibilities, with the probability of this strategy being denoted as y. The second strategy is “non-participation in recycling”, which means that manufacturers lack the necessary recycling channels and thus cannot fulfill their recycling responsibilities, with the probability of this strategy being denoted as 1 − y, where y 0 , 1 .
Assumption 3.
Recyclers have two strategic choices. The first is “compliant recycling”, which refers to adhering to national laws, regulations, and industry standards to ensure that the recycling process is environmentally friendly, safe, and achieves resource utilization. However, compliant recycling requires higher costs. The probability of this strategy is denoted as z. The second strategy is “non-compliant recycling”, which involves adopting low-cost, low-standard methods that neglect environmental protection and safety, and may even violate laws to avoid costs and obtain higher profits. The probability of this strategy is denoted as 1 − z, where z 0 , 1 .
Assumption 4.
Consumers have two strategic choices. The first is “adopting environmentally friendly behavior”, which means delivering end-of-life PBs to compliant recycling outlets. The probability of this strategy is denoted as w. The second strategy is “not adopting environmentally friendly behavior”, which means delivering end-of-life PBs to non-compliant recyclers. The probability of this strategy is denoted as 1 − w, where  w 0 , 1 .
Assumption 5.
This study involves two recycling models: (1) Cooperative recycling model: In this model, recyclers collaborate with manufacturers to establish recycling outlets [75]. Under this model, recyclers utilize the sales channels of manufacturers for reverse recycling, obtaining relevant information about PBs, completing the recycling at a lower cost Cr1, and gaining a profit Pr1. Manufacturers, on the other hand, pay a lower fee Cm1 to the recyclers, complete the recycling, and earn a profit Pm1 [76]. (2) Non-cooperative recycling model: In this model, recyclers and manufacturers independently establish their own recycling outlets. Under this model, recyclers bear a higher cost Cr2 for standardized recycling and dismantling, obtaining a profit Pr2; manufacturers need to pay a higher fee Cm2 to establish their own recycling outlets, earning a profit Pm2. Additionally, recyclers may adopt non-compliant recycling strategies to reduce costs, using non-standardized equipment and technology to complete recycling at a low cost Cr3 and gain a profit Pr3. Regardless of the model adopted, if manufacturers participate in recycling or recyclers conduct compliant recycling, they can obtain certain reputational benefits Em and Er, respectively, thereby enhancing long-term competitiveness [77].
Assumption 6.
Consumers face two choices in the disposal of end-of-life PBs. (1) Adopting environmentally friendly behavior: Consumers incur costs Cu1 but obtain benefits Pu1. If consumers choose this behavior but no compliant recycling outlets are available for delivery, their net benefit is 0.2. (2) Not adopting environmentally friendly behavior: Consumers bear no additional costs and receive higher benefits Pu2 such as cash returns [78].
Assumption 7.
Under strict regulation, the government provides subsidies: Sm for manufacturers’ recycling activities, Sr for recyclers’ compliant recycling, and Su for consumers’ environmentally friendly behaviors. The costs for strict and lenient regulation are Cg1 and Cg2, respectively. Effective recycling of retired batteries yields environmental benefits Pg. Fines Fm and Fr are imposed on non-compliant manufacturers and recyclers. If improper recycling causes environmental pollution, the government incurs remediation costs Cg3 [79].

3.3. Payoff Matrix

Based on the model assumptions detailed earlier, the payoff matrices for the four stakeholders—government, manufacturers, recyclers, and consumers—were formulated as presented in Table 1.

4. Results

4.1. Evolutionary Game Stability Analysis

4.1.1. Stability Analysis of the Government’s Strategy

The government’s expected payoffs under strict regulation and lax regulation are Ex1 and Ex2, respectively, and the average expected payoff is E x ¯ . The replicator dynamics equation for the government’s strategy selection is obtained through computation as follows:
F x = d x d t = x E x 1 E x ¯ = x 1 x E x 1 E x 2 = x 1 x U z , w , y = x 1 x C g 2 C g 1 C g 3 + F m + F r + w C g 3 y F m z F r y S m z S r + y w P g + z w P g w y S u w z S u y z w P g + y z w S u
The first derivative of F x is given by:
F x = 1 2 x U z , w , y
Based on the stability principle of differential equations, the necessary condition for the government strategy to achieve a stable state is F x = 0 and F x < 0 .
Theorem 1.
When  w < w 0 , the government tends to adopt a lenient regulatory strategy; when w > w 0 , it tends to implement a strict regulatory strategy; and when w = w 0 , the government’s stable strategy cannot be determined. The threshold value is w 0 G 1 w = 0 , w 0 = C g 2 C g 1 C g 3   + F m   + F r y F m z F r y S m z S r C g 3   + y P g + z P g + y S u z S u y z P g + y z S u .
Proof of Theorem 1.
Define G 1 w = U z , w , y = C g 2 C g 1 C g 3 + F m + F r + w C g 3 y F m z F r y S m z S r + y w P g + z w P g w y S u w z S u y z w P g + y z w . Given that G 1 w w = C g 3 + S u P g y 1 z 1 1 > 0 , it follows that G 3 w is an increasing function with respect to w. When w < w 0 ,   G 1 z < 0 , F x   | x = 0 = 0 and F x   | x = 0 < 0 , x = 0 is in a stable state. When w > w 0 , G 1 w > 0 , F x   | x = 1 = 0 and F x   | x = 1 < 0 , x = 1 is in a stable state. When w = w 0 , G 1 w = 0 , implying F x = 0 and F x = 0 . Under the condition, the government’s stable strategy cannot be determined, and all x 0 , 1 are in a stable state. □
As shown in Figure 3, the volume of each region corresponds to the likelihood of the government adopting either a stringent regulatory policy or a lenient one. These probabilities are calculated as follows:
V x 1 = 0 1 0 1 w 0 d y d x = 0 1 0 1 C g 2   C g 1   C g 3 + F m + F r y F m z F r y S m z S r C g 3   y S u z S u + y z S u d y d x = B 1 + z C 1 A 1 ln C g 3 S u z C g 3 S u 1 z S u 1 z
V x 2 = 1 V x 1
where A 1 = C g 2 C g 1 C g 3 + F m + F r , B 1 = F m + S m , C 1 = F r + S r .
Corollary 1.
When the probability of consumers engaging in environmentally friendly behaviors is high, the government tends to opt for lenient regulation regardless of the strategies adopted by the manufacturers. Conversely, when the probability of consumers engaging in such behaviors is low, the government’s decision-making varies depending on the different strategies of the manufacturers.

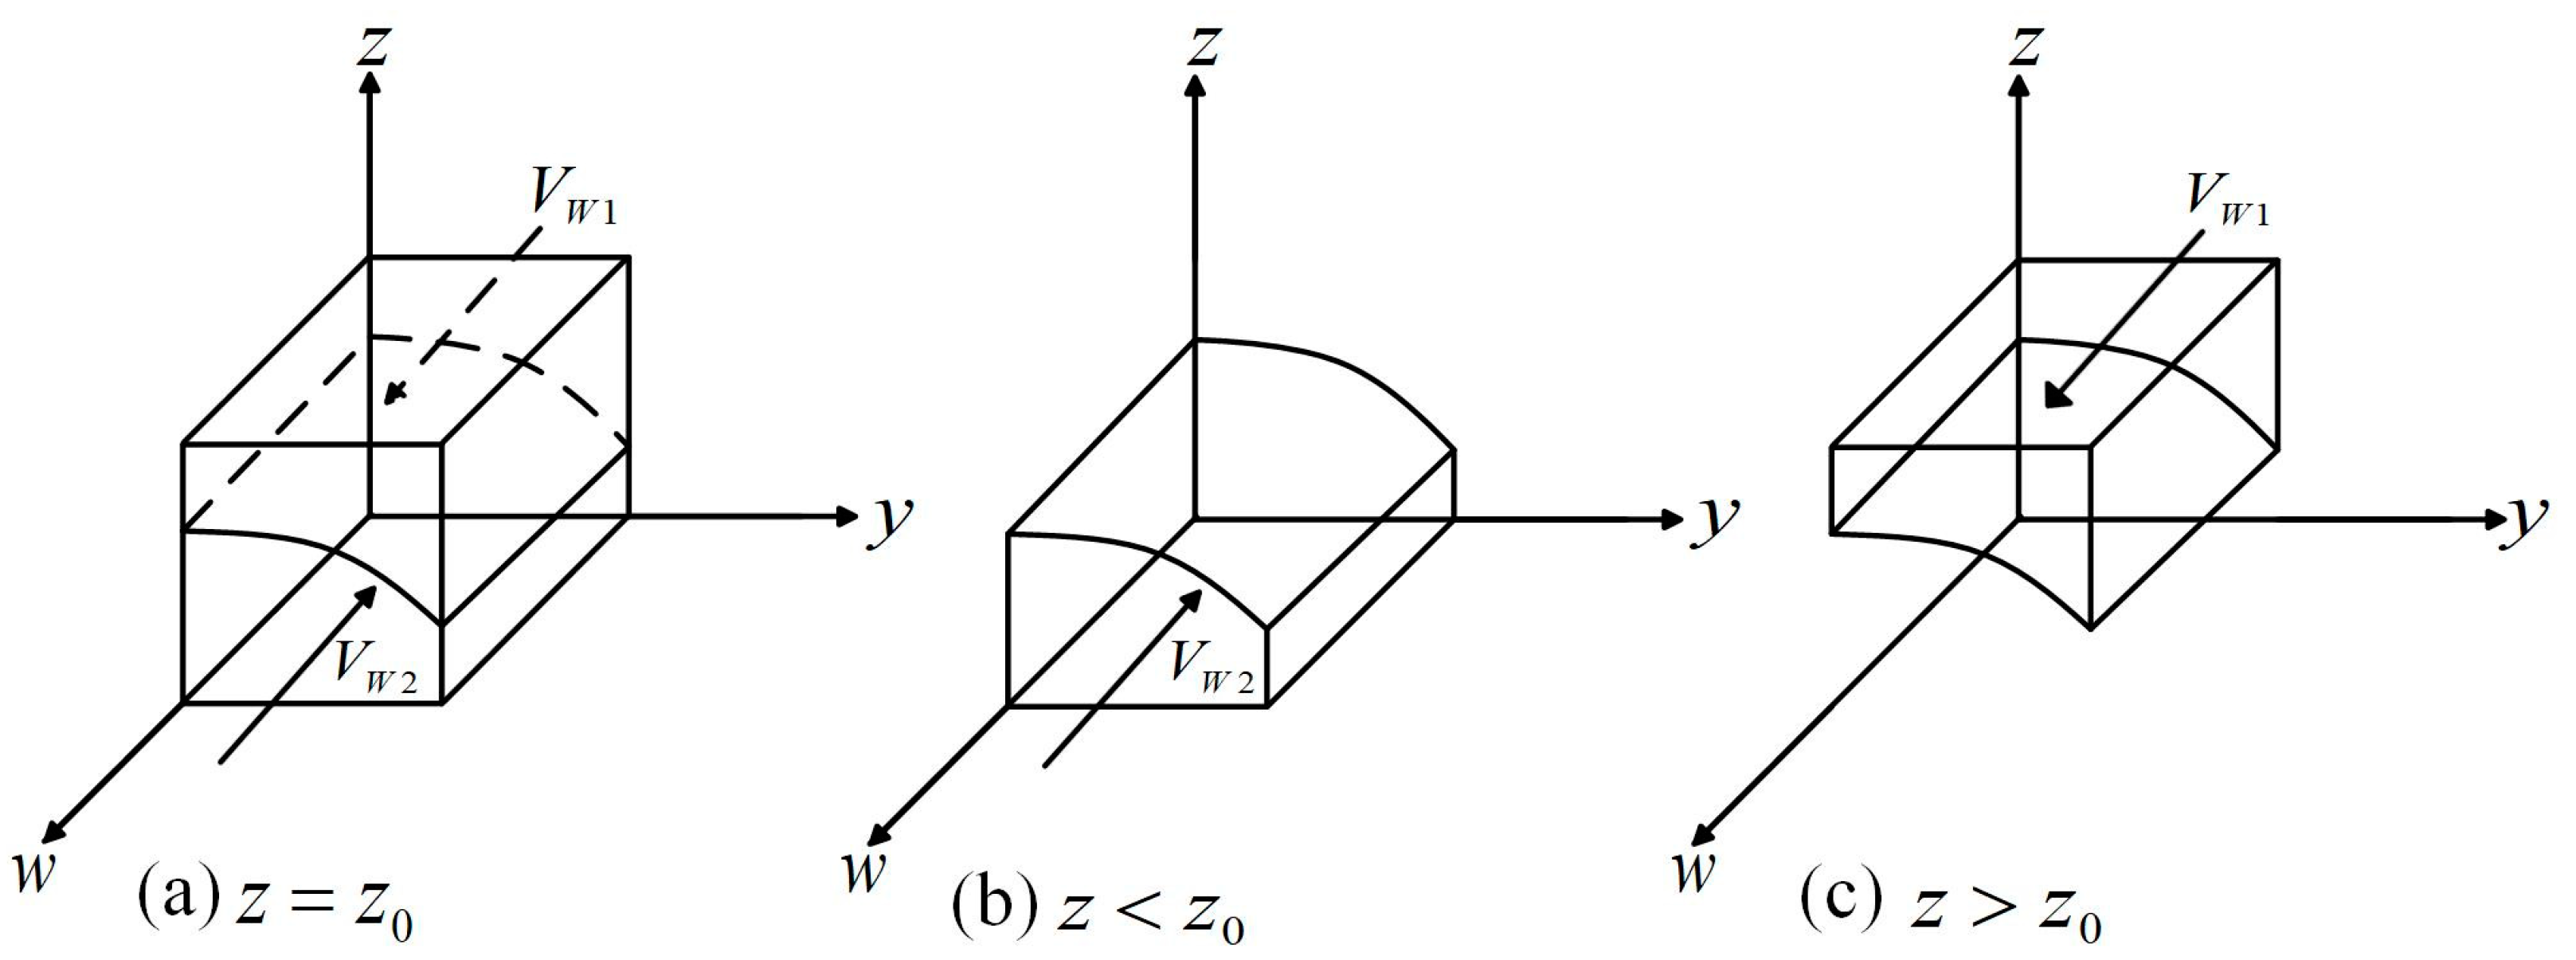
4.1.2. Stability Analysis of the Manufacturer’s Strategy

The expected payoffs for the manufacturer when choosing to participate in recycling or not participate are denoted as E y 1 and E y 2 , respectively, and the average expected payoff is E y ¯ . The replicator dynamics equation for the manufacturer’s strategy selection is obtained via computational analysis as follows:
F y = d y d t = y E y 1 E y ¯ = y 1 y E y 1 E y 2 = y 1 y U z , w , x = y 1 y U z , w , x = E m C m 2 z C m 1 + z C m 2 + x F m + w P m 2 + x S m + w z P m 1 w z P m 2
The first derivative of F y is given by:
F y = 1 2 y U w , x , y P m 2
Based on the principle of differential equation stability, the necessary condition for the manufacturer’s strategy to reach an equilibrium state is F y = 0 and F y < 0 .
Theorem 2.
When z < z 0 , the manufacturer tends to adopt a non-participation recycling strategy; when z > z 0 , the manufacturer prefers to implement a non-recycling strategy; when z = z 0 , the stable strategy of the manufacturer cannot be determined. The threshold value is z 0 G 2 z = 0 ,   z 0 = E m C m 2 + x F m + w P m 2 + x S m C m 1 + C m 2 + w P m 1 w P m 2 .
Proof of Theorem 2.
Define   G 2 z = E m C m 2 z C m 1 + z C m 2 + x F m + w P m 2 + x S m + w z P m 1 w z P m 2 . Given that G 2 z z = C m 2 C m 1 + w P m 1 P m 2 > 0 , it follows that G 2 z is an increasing function with respect to   z , When z < z 0 ,   G 2 z < 0 , F y   | y = 0 = 0 and F y   | y = 0 < 0 , y = 0 is in a stable state. When z > z 0 , G 2 z > 0 , F x   | x = 1 = 0 and F x   | x = 1 < 0 , y = 1 is in a stable state. When z = z 0 , G 2 z = 0 , implying F y = 0 and F y = 0 . Under the condition, the manufacturer’s stable strategy cannot be determined, and all y 0 , 1 are in a stable state. □
As depicted in Figure 4, the volume of region represents the probability of manufacturers opting to participate in recycling, while the volume of region represents the probability of manufacturers choosing not to participate in recycling. These probabilities are calculated as follows:
V y 1 = 0 1 0 1 z 0 d w d y = 0 1 0 1 E m C m 2 + x F m + w P m 2 + x S m C m 1 + C m 2 + w P m 1 w P m 2 d w d y = E m C m 2 + xF m + xS m P m 1 P m 2 ln C m 1 + C m 2 + P m 1 P m 2 C m 1 + C m 2 P m 2 P m 1 P m 2 ln C m 1 + C m 2 + P m 1 P m 2 C m 1 + C m 2
V y 2 = 1 V y 1
Corollary 2.
When the probability of recyclers complying with the regulations for the recycling of used PBs is high, manufacturers are inclined to participate in recycling regardless of the strategies adopted by consumers. Conversely, when the probability of such compliance is low, manufacturers make decisions based on the consumers’ actions regarding the delivery of used PBs.

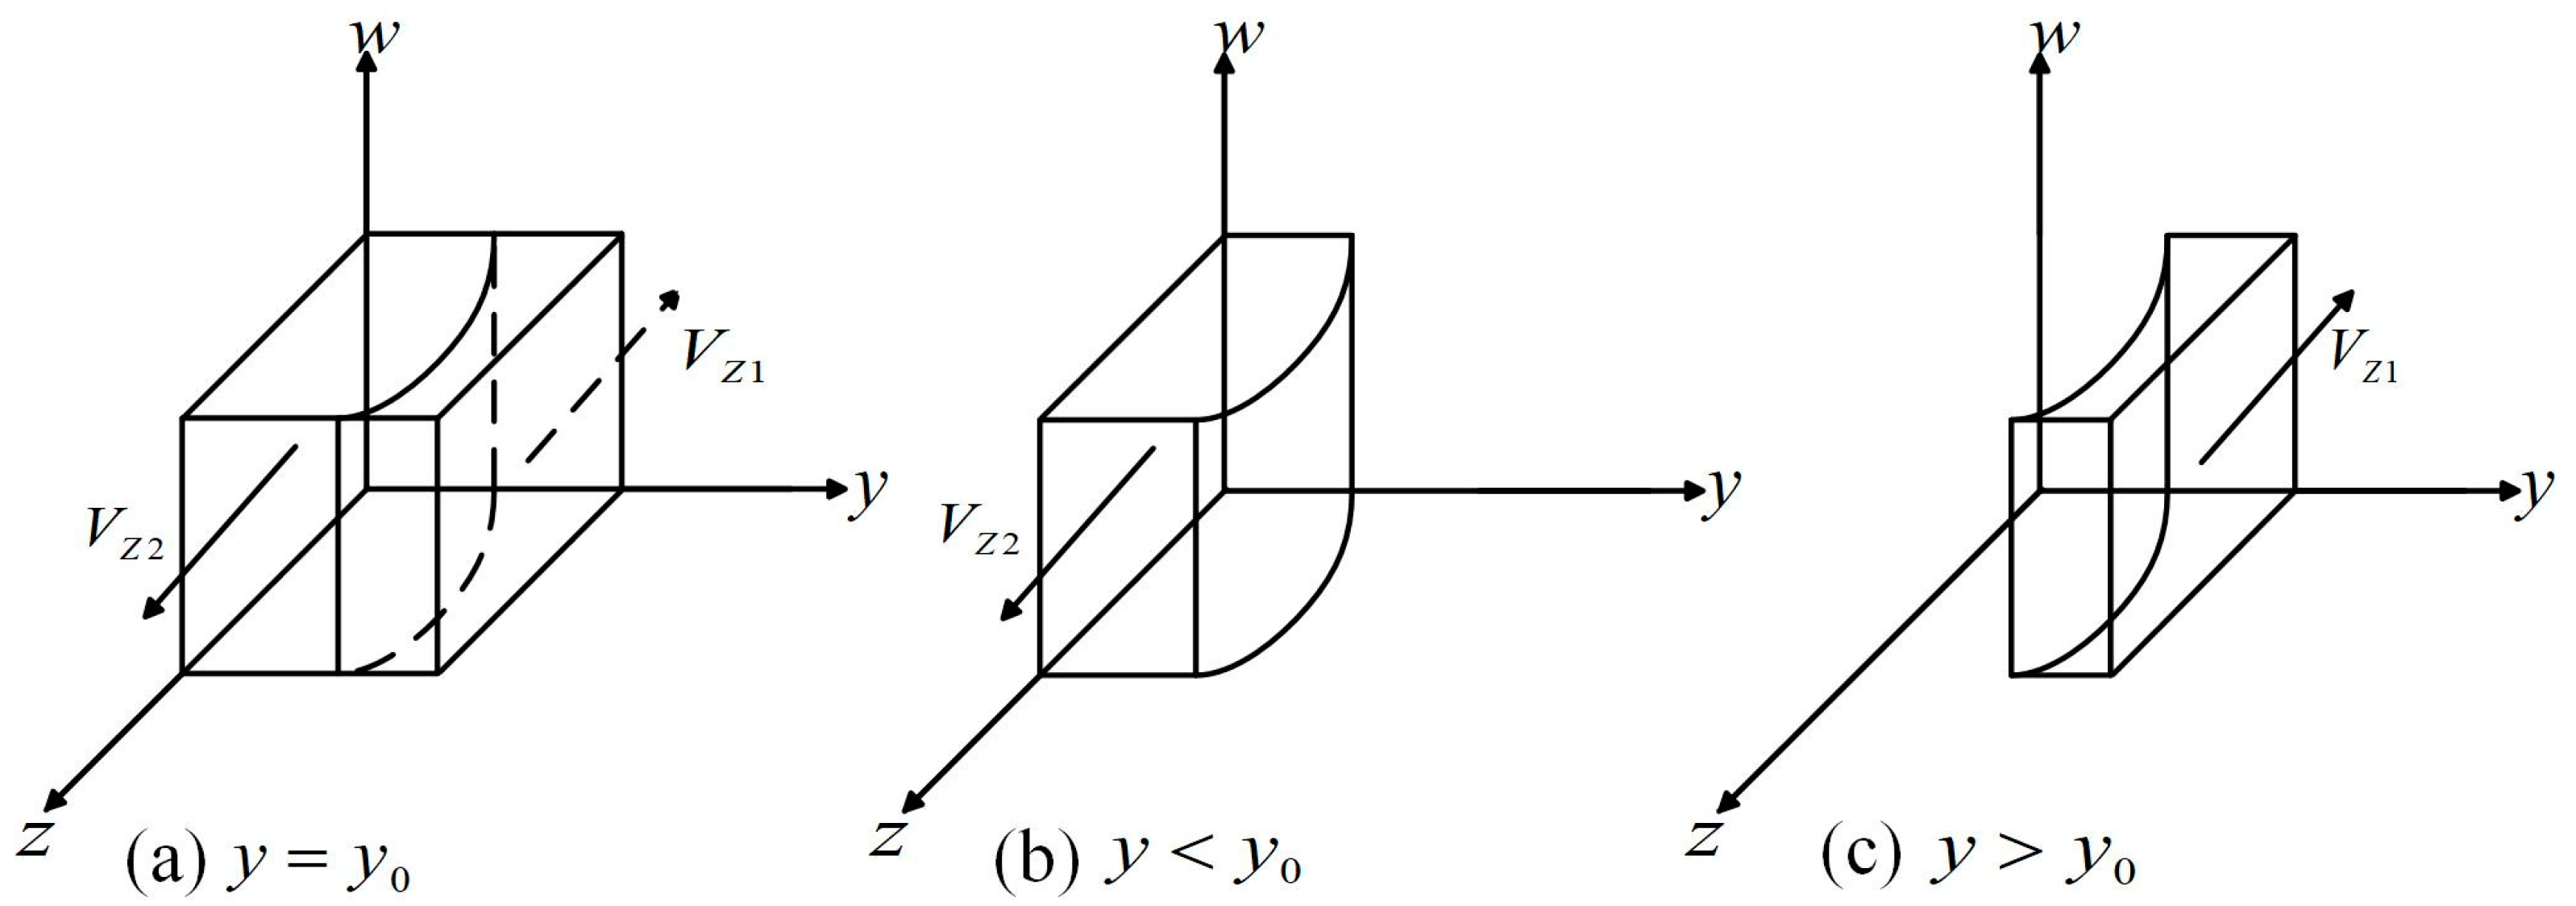
4.1.3. Stability Analysis of the Recycler’s Strategy

The expected payoffs for the recyclers when choosing compliant recycling and non-compliant recycling are E z 1 and E z 2 , respectively, with the average expected payoff being E z ¯ . The replicator dynamics equation for the recycler’s strategy selection is derived through computation as follows:
F z = d z d t = z E z 1 E z ¯ = z 1 z E z 1 E z 2 = z 1 z U w , x , y = z 1 z ( C r 3 C r 2 + E r P r 3 y C r 1 + y C r 2 + x F r + w P r 2 + w P r 3 + x S r + w y P r 1 w y P r 2 )
The first derivative of F z is given by:
F z = 1 2 z U w , x , y
Based on the principle of differential equation stability, the necessary condition for the recycler’s strategy to reach an equilibrium state is F z = 0   and   F z < 0 .
Theorem 3.
When  y < y 0 , recyclers tend to adopt a non-compliant recycling strategy; when  y > y 0 , recyclers tend to implement a compliant recycling strategy; when  y > y 0 , the stable strategy of recyclers cannot be determined; where the threshold is    y 0 G 3 y = 0 ,     y 0 = ( C r 3 C r 2 + E r   P r 3 + x F r + w P r 2 + w P r 3 + x S r ) C r 2 C r 1 + w P r 1 P r 2 .
Proof of Theorem 3.
Let G 3 y = C r 3 C r 2 + E r P r 3 y C r 1 + y C r 2 + x F r + w P r 2 + w P r 3 + x S r + w y P r 1 w y P r 2 . From   G 3 y y = C r 2 C r 1 + w P r 1 P r 2 > 0 , we can conclude that G 3 y is an increasing function with respect to z. When y < y 0 , G 3 y < 0 ,   F z   | z = 0 = 0 , and F z   | z = 0 < 0 , then z = 0 is in a stable state; when y > y 0 , and G 3 y > 0 , F z   | z = 1 = and F z   | z = 1 < 0 , then z = 1 is in a stable state; when y = y 0 , G 3 y = 0 , resulting in F z = 0 and F z = 0 , in which case the stable strategy of the recyclers cannot be determined and all y 0 , 1 are in a stable state. □
As shown in Figure 5, the volume of region represents the probability of the recyclers to choose compliant recycling, while the volume of region represents the probability of the recyclers to choose non-compliant recycling. The calculation yields:
V z 1 = 0 1 0 1 y 0 d w d z = 0 1 0 1 ( C r 3 C r 2 + E r P r 3 + x F r + w P r 2   + w P r 3   + x S r ) C r 2 C r 1 + w P r 1 P r 2 d w d z = C r 3 C r 2 + E r P r 3 + x F r + x S r B 1 l n A 1 + B 1 A 1 P r 2   + P r 3 B 1 2 A 1 + B 1 A 1 B 1 l n A 1 + B 1
V z 2 = 1 V z 1
Corollary 3.
When the probability of manufacturers participating in recycling is high, regardless of the strategy adopted by consumers, recyclers tend to choose compliant recycling. Conversely, when the probability of manufacturers participating in recycling is low, recyclers will make decisions based on whether consumers adopt environmentally friendly behaviors.

4.1.4. Stability Analysis of the Consumer’s Strategy

The expected payoffs for the consumers when choosing to implement environmental behavior and not to implement are denoted as E z 1 and E z 2 , respectively, with the average expected payoff being E w ¯ . The replicator dynamics equation for the consumer strategy selection is derived via computational analysis as follows:
F w = d w d t = w E w 1 E w ¯ = w 1 w E w 1 E w 2 = w 1 w U z , x , y = w 1 w ( y P u 1 y C u z C u P u 2 + z P u 1 + z P u 2 + z y C u y z P u 1 + x y S u + x z S u x y z S u )
The first derivative of F w is given by:
F w = 1 2 w U z , x , y
Based on the principle of differential equation stability, the necessary condition for the consumer’s strategy to reach an equilibrium state is F w = 0   and     F w < 0 .
Theorem 4.
When  z < z 0 , consumers tend to adopt a non-environmentally strategy; when   z > z 0 , consumers tend to implement an environmentally strategy; when   z = z 0 , the stable strategy of consumers cannot be determined; where the threshold is z 0 G 4 z = 0 ,     z 0 = y P u 1   y C u   P u 2 + x y S u y 1 C u + 1 y P u 1   + x 1 y S u + P u 2 .
Proof of Theorem 4.
Let G 4 z = y P u 1 y C u z C u P u 2 + z P u 1 + z P u 2 + z y C u y z P u 1 + x y S u + x z S u x y z S u . From G 4 z z = y 1 C u + 1 y P u 1 + x 1 y S u + P u 2 > 0 , we can conclude that G 4 z is an increasing function with respect to z. When z < z 0 , and G 4 z < 0 , F w   | w = 0 = 0 and F w   | w = 0 < 0, then w = 0 is in a stable state; when z > z 0 , and G 4 z > 0 , F w   | w = 1 = 0 and F w   | w = 1 < 0 , then w = 1 is in a stable state; when z = z 0 , G 4 z = 0 , resulting in F w = 0 and F w = 0 , in which case the stable strategy of consumers cannot be determined, and all y 0 , 1 are in a stable state. □
As shown in Figure 6, the volume of region represents the probability of consumers adopting environmentally friendly behaviors, while the volume of region represents the probability of consumers not adopting environmentally friendly behaviors. The calculation yields:
V z 1 = 0 1 0 1 y 0 d w d z = 0 1 0 1 ( C r 3 C r 2 + E r P r 3 + x F r + w P r 2 + w P r 3 + x S r ) C r 2 C r 1 + w P r 1 P r 2 d w d = C r 3 C r 2 + E r P r 3 + x F r + x S r B 1 l n A 1 + B 1 A 1 P r 2 + P r 3 B 1 2 A 1 + B 1 A 1 B 1 l n A 1 + B 1
V z 2 = 1 V z 1
Corollary 4.
When the probability of consumers adopting environmentally friendly behaviors is high, regardless of the strategy adopted by recyclers, manufacturers tend to participate in recycling. Conversely, when the probability of consumers adopting environmentally friendly behaviors is low, manufacturers will make decisions based on the regulatory behavior of recyclers.

4.1.5. Local Stability Analysis of the System

Based on the Lyapunov indirect method, the stability of the system’s equilibrium solutions can be determined by the eigenvalues of its Jacobian matrix [80]. The Jacobian matrix is shown in Equation (17).
J = F x x F x y F y x F y y F x z F x w F y z F y w F z x F z y F w x F w y F z z F z w F w z F w w
If the real parts of all eigenvalues satisfy λ < 0, the equilibrium solution is asymptotically stable and represents an evolutionarily stable strategy (ESS). If the real parts of all eigenvalues satisfy λ > 0, the equilibrium solution is unstable. If the eigenvalues have mixed signs (both positive and negative), the equilibrium solution is a saddle point, and its stability depends on the initial perturbation direction in the state space [80]. To validate the dynamic evolutionary behavior of the four-party game model, the 16 pure-strategy equilibrium solutions were substituted into the Jacobian matrix to calculate the eigenvalues and analyze their stability. The results are shown in Table 2.
According to Table 2, the potential ESS points for the system are: (1,1,1,1), (0,1,1,1), and (0,0,0,0).
Scenario 1.
When the parameters simultaneously meet the conditions  C g 2 + P g < C g 1 + S m + S r + S u ,   C m 1 < E m + F m + P m 1 + S m ,  C r 1 < C r 3 + E r + F r + P r 1 + S r ,  C u < P u 1 + S u , the equilibrium point (1,1,1,1) is an ESS according to the Lyapunov stability criterion. This indicates that under strict government regulation, manufacturers, recyclers, and consumers all adopt proactive strategies, driving the system toward a Pareto optimal state, achieving greater environmental benefits at a lower cost, which represents the most desirable scenario under strict government oversight.
Scenario 2.
When the parameters simultaneously satisfy the four conditions where  P g + C g 2 < C g 1 + S m + S r + S u ,  C m 1 < E m + P m 1 ,  C r 1 < C r 3 + E r + P r 1 ,  C u < P u 1 , the equilibrium point (0,1,1,1) is identified as an ESS, according to the Lyapunov criterion. In this case, the government adopts a lax regulatory strategy, while manufacturers, recyclers, and consumers continue to pursue active strategies. Although the government opts for lax regulation due to its higher costs than benefits, the market remains relatively well-functioning, allowing all parties to achieve certain economic gains. This state represents an ideal scenario under lax government regulation. However, in the absence of strict supervision, market stakeholders struggle to voluntarily fulfill their responsibilities, making this idealized state difficult to realize in practice.
Scenario 3.
When the parameters meet the condition  C g 2 + F m + F r < C g 1 + C g 3 ,   E m < C m 2 ,   C r 2 + P r 3 < C r 3 + E r P u 2 < 0  across all four criteria, the equilibrium point (0,0,0,0) becomes an ESS, indicating that the government, manufacturers, recyclers, and consumers are all adopting passive strategies. This leads the system to evolve toward a Pareto worst state, which is highly detrimental to the healthy.

4.2. Numerical Simulation Analysis

To more intuitively illustrate the impact of parameter variations on system evolution, numerical simulations were conducted using MATLAB 2023a. The parameter settings in the simulations were informed by real-world operational data on PB recycling, which were obtained from field surveys, industry reports, and the relevant literature [81,82]. The baseline parameters were set as follows: Pr1 = 6.5, Pm1 = 5, Cm2 = 2.5, Pm2 = 5.5, Cr2 = 3, Pr2 = 5, Cr3 = 1.5, Pr3 = 5, Em = 0.5, Er = 0.2, Pu1 = 3.5, Pu2 = 3, Sm = 2, Sr = 2, Su = 1, Cg2 = 3, Pg = 10, Fm = 3.5, Fr = 4, Cg3 = 1. Key parameters were then set according to different ESS points. For ESS (1,1,1,1), key parameters were set as Cr1 = 2, Cm = 1.5, Cu = 1.5, Cg1 = 3.5, as shown in Figure 7a. For ESS (0,1,1,1), key parameters were set as Cr1 = 2, Cm = 1.5, Cu = 1.5, Cg1 = 12, as shown in Figure 7b. For ESS (0,0,0,0), key parameters were set as Cr1 = 12, Cm = 12, Cu = 4.5, Cg1 = 12, as shown Figure 7c. In addition, the initial probabilities of all strategies were set to 0.5.
From Figure 7a, it can be observed that when the recycling costs of all entities are lower than their benefits, the government, manufacturers, recyclers, and consumers will only adopt active recycling strategies if the marginal benefits exceed the marginal costs. In the initial phase, all entities quickly adjust their strategies and increase their participation, with recyclers showing the highest level of engagement. Over time, the participation probabilities of all entities gradually approach 1, and the system eventually reaches a stable state, achieving Pareto optimality (1,1,1,1). This indicates that under effective government regulation, recycling operations are successfully advanced, and the participation levels of all entities remain high.
From Figure 7b, it can be observed that when government regulatory costs are excessively high, there is a tendency to adopt a lenient regulatory strategy, leading the system to converge to a suboptimal equilibrium state (0,1,1,1). In this state, manufacturers, recyclers, and consumers maintain a high level of participation due to the initial policy incentives, but this situation is difficult to sustain. As the regulatory intensity weakens, the enthusiasm of all entities for participation declines, which may lead to a stagnation of recycling operations. If the costs further exceed the benefits, the system will gradually evolve toward the state depicted in Figure 7c, eventually converging to a Pareto worst state (0,0,0,0). At this point, all entities adjust to a passive participation state in the short-term, indicating that the recycling market cannot function properly when the benefits fail to cover costs. Additionally, without government incentives and penalties, the market cannot guarantee higher returns for all stakeholders, making it difficult for parties to cooperate in recycling end-of-life PBs. This reduces the likelihood of adopting active recycling approaches. Therefore, the government needs to balance market regulation with policy support while reducing regulatory costs to ensure the effective operation of the recycling system.

4.3. Sensitivity Analysis

We utilized a local sensitivity analysis in this part of our study, particularly employing the one-at-a-time method. By altering each input parameter in isolation while holding others constant, this technique allowed us to accurately assess the specific effects of parameter variations on the model’s outcomes [83]. The sensitivity analysis not only clearly illustrated how changes in parameters affect the evolutionary path, but also assisted in identifying the primary drivers within the model [84]. Thus, this study performed sensitivity analyses on the key parameters to examine how various factors influence the decision-making behaviors of governments, manufacturers, recyclers, and consumers. Given that Scenario 3 represents the most ideal state, the following analysis used the ESS (1,1,1,1) condition as the initial value.

4.3.1. Analysis of Factors Influencing Government Decision-Making

Under the parameter settings of Scenario 3, the government provides subsidies to manufacturers (Sm), recyclers (Sr), and consumers (Su) at the levels of 1, 3, 5, 7, and 9, with the corresponding simulation results depicted in Figure 8a–c). The study showed that increasing subsidy levels prolongs the time required for the government to adopt strict regulatory strategies. When subsidies exceed a certain threshold (Sm = Sr = Su = 5), the government tends to adopt a lax regulatory approach, suggesting that exceeding budgetary limits makes lax regulation more feasible. Furthermore, when subsidies reach 5, the government imposes strict regulations on manufacturers and recyclers earlier than on consumers, indicating the higher sensitivity of manufacturers and recyclers to subsidies. Therefore, it is recommended that, given limited fiscal resources, that the government prioritize subsidies to manufacturers and recyclers to effectively incentivize their participation in recycling activities through targeted reward mechanisms. Additionally, the government should design and optimize long-term incentive mechanisms for consumers to enhance their willingness and enthusiasm for environmentally friendly behaviors.
Under the parameter settings of Scenario 3, the comprehensive government benefit (Pg) was assigned values of 1, 3, 5, 7, and 9. As depicted in Figure 8d, the threshold for the government’s transition from lenient to strict regulation was approximately Pg = 5. When the comprehensive benefit surpasses this threshold, the government exhibits a stronger preference for adopting a strict regulatory strategy. Moreover, as the comprehensive government benefit increases, the time required for the system to attain a strict regulatory equilibrium is markedly reduced. This underscores the government’s role as a market regulator, consistently placing social welfare at the forefront. The rise in comprehensive benefits not only highlights the environmental advantages stemming from stringent regulation, but also underscores the government’s capacity to uphold market order and social welfare through effective regulatory measures. Consequently, with the increase in comprehensive benefits, the government is more inclined to intensify market regulation to ensure the maximization of social welfare.
Under the parameter settings of Scenario 3, the fines imposed on manufacturers (Fm) and recyclers (Fr) were set to 1, 3, 5, 7, and 9, respectively. As illustrated in Figure 8e,f, an increase in the fine amounts leads to a significant rise in the probability of the government adopting a strict regulatory strategy, accompanied by a marked acceleration in the system’s convergence to a stable equilibrium state. These results highlight the positive incentivizing effect of the penalty mechanism on the government’s regulatory decision-making. Specifically, higher fines not only directly enhance the government’s comprehensive benefits, but also indirectly reinforce the incentive compatibility of compliant behaviors by increasing the non-compliance costs for manufacturers and recyclers. As a result, these dynamics drive the government to prioritize the implementation of strict regulatory strategies.

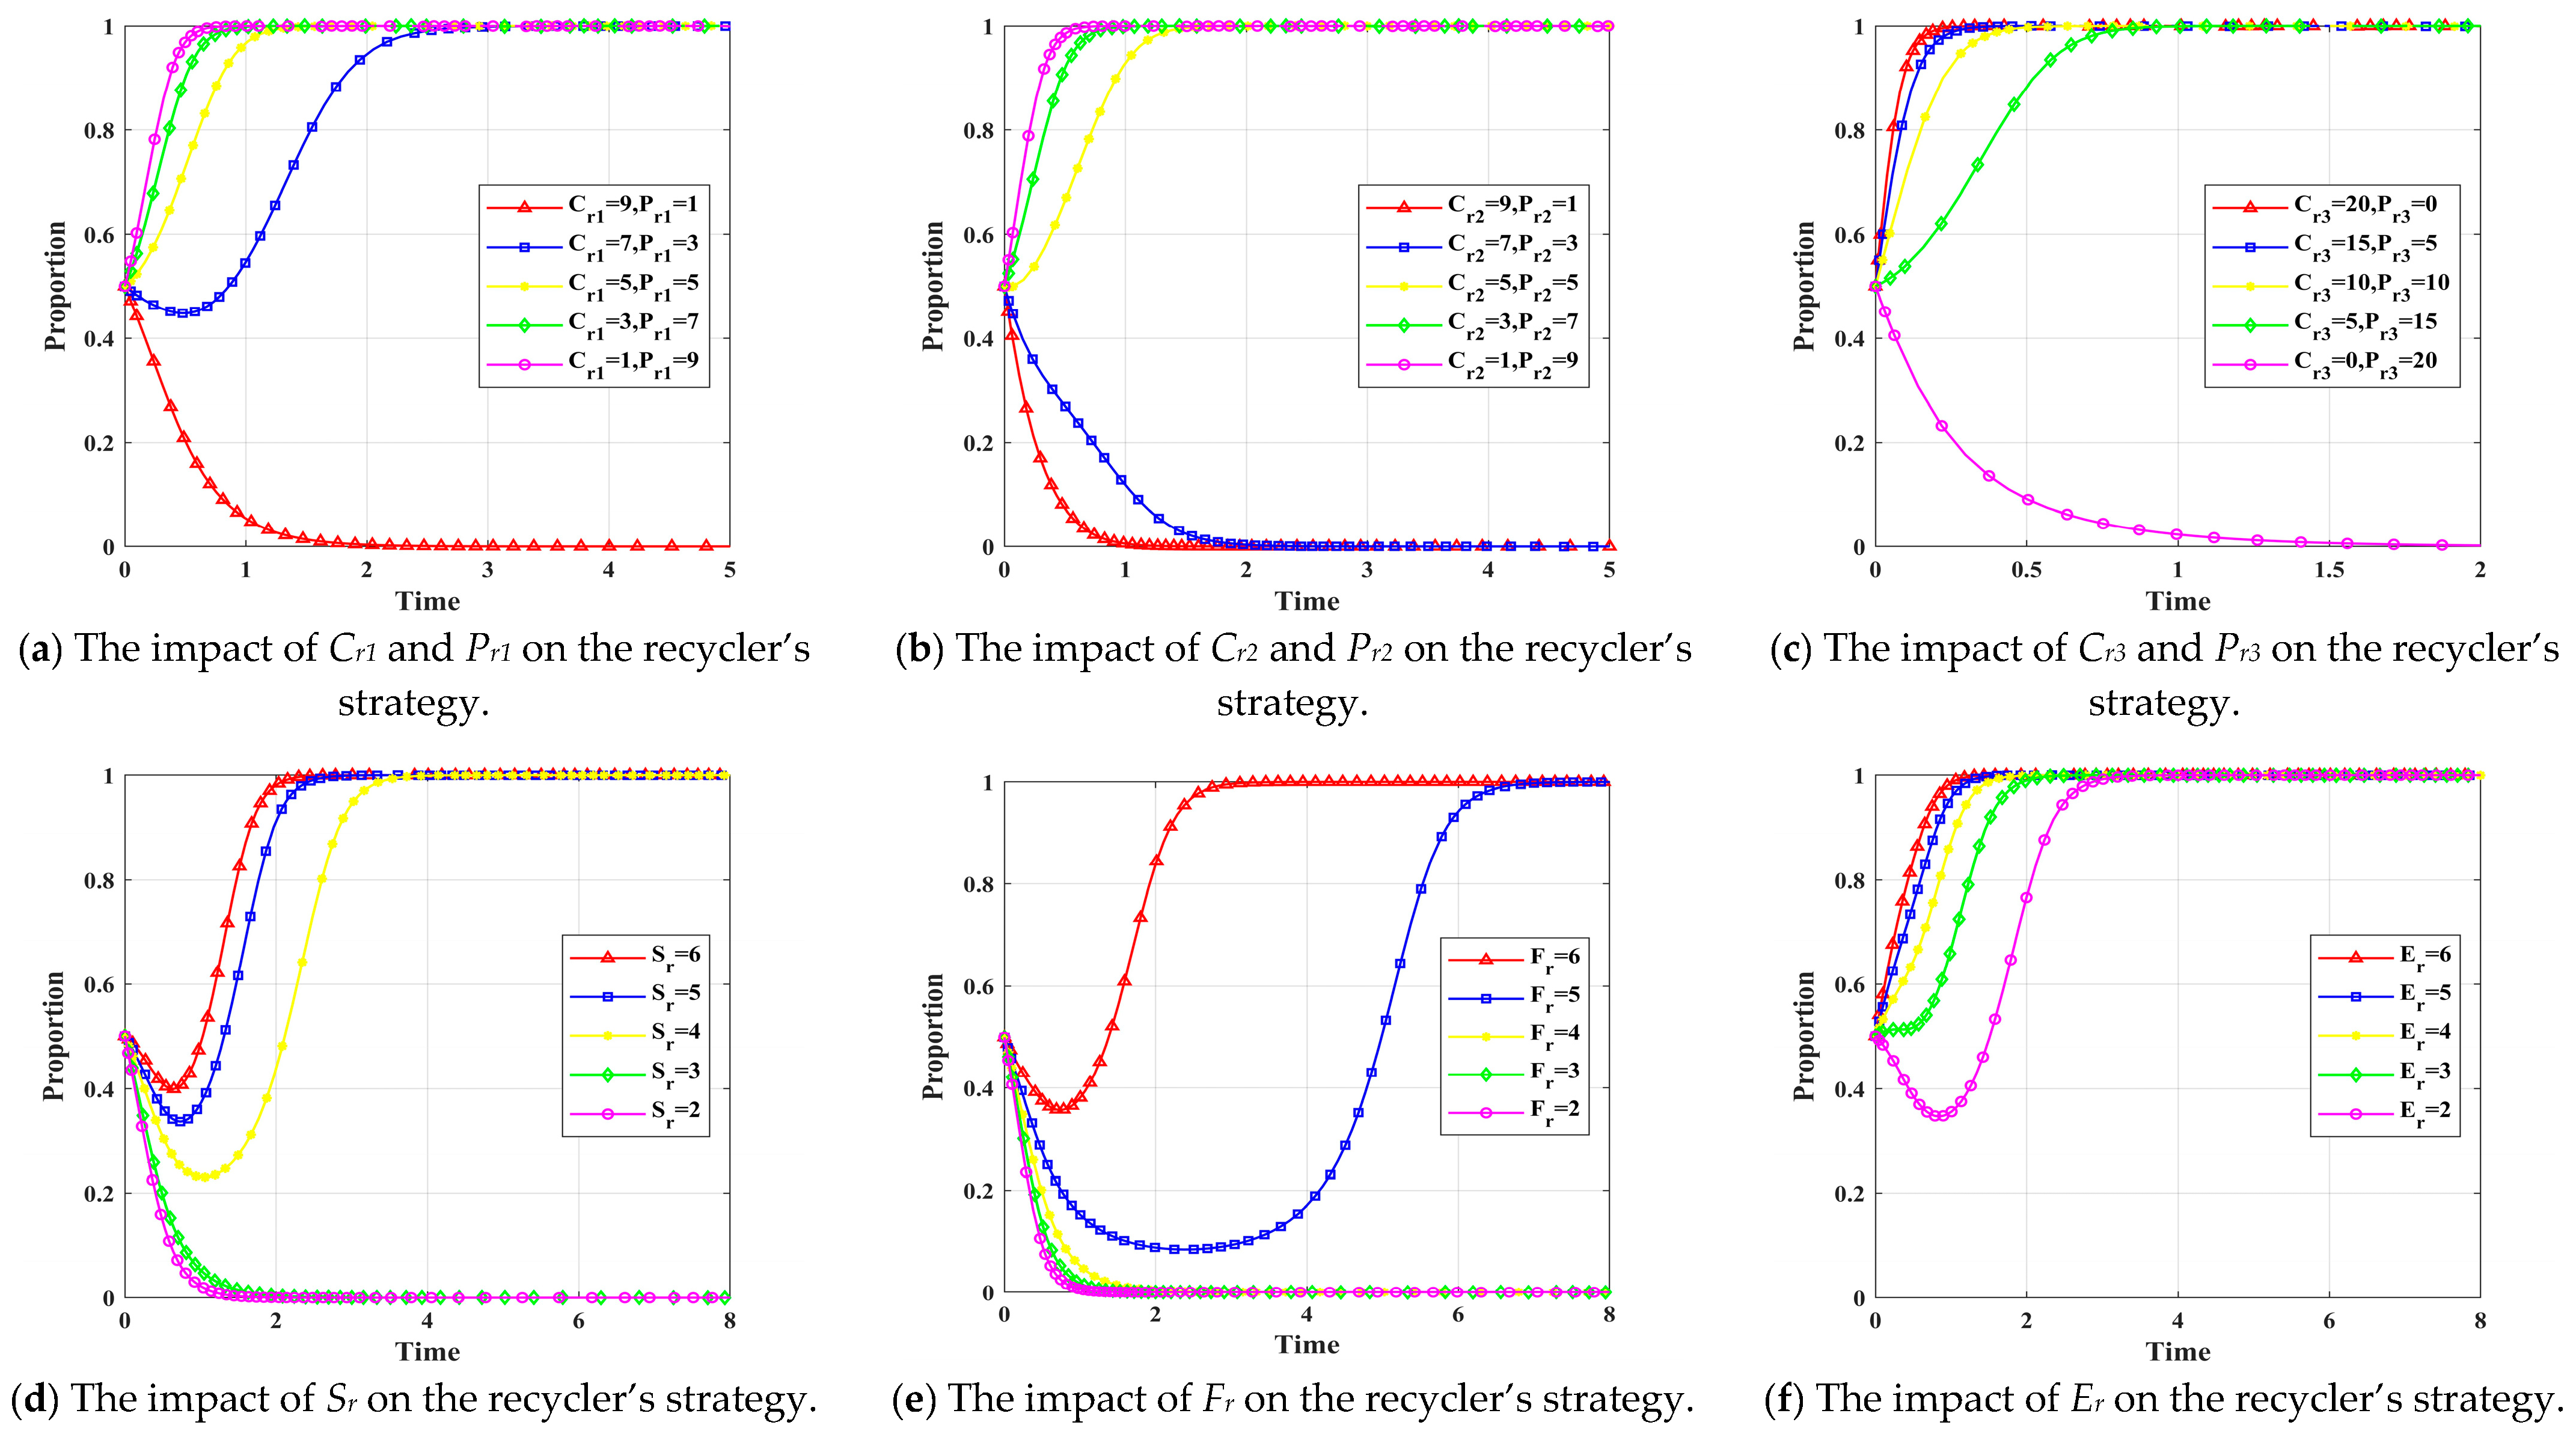
4.3.2. Analysis of Factors Influencing the Recyclers’ Decision-Making

As shown in Figure 9a, in the cooperative recycling model between recyclers and manufacturers, both parties jointly share the costs and benefits. Initially, the recyclers may incur losses due to significant investments in recycling infrastructure, equipment, and labor. However, government subsidies and incentive mechanisms from manufacturers effectively encourage recyclers to adopt compliant recycling strategies. The evolutionary curve gradually converges to 1, indicating that the cooperative model enhances recycling system efficiency through risk-sharing and economies of scale, achieving higher profitability under Pareto improvement. Conversely, if the recyclers’ losses persist and expand, they may shift toward non-compliant strategies to pursue short-term gains, causing the evolutionary curve to approach 0. This underscores that profit is a critical driver of the recyclers’ strategy choices. Under the non-cooperative recycling model, recyclers incur inevitable costs (Cr2) for standardized recycling and dismantling, which are mandated by environmental and safety regulations. Figure 9b illustrates that compared with the cooperative model, recyclers face greater financial pressure when independently establishing recycling channels due to substantial capital expenditures. Once the costs and revenues reach break-even or become negative, the evolutionary curve approaches 0, indicating a preference for non-compliant strategies to reduce costs. Although this may provide short-term relief, it entails legal risks, brand damage, and deteriorated stakeholder relationships. As depicted in Figure 9c, the evolutionary curve only shifts toward non-compliant recycling when it yields higher profits for recyclers. While this may offer short-term profit increases, it results in irreversible environmental damage and weakened sustainable development capabilities in the long run. Therefore, recyclers should prioritize the long-term value of compliant recycling, balancing the economic benefits with environmental and social responsibilities.
In conclusion, the balance between costs and benefits is the core driving force behind the recyclers’ strategy choices. Collaboration with manufacturers, through risk-sharing and profit-sharing mechanisms, effectively promotes the adoption of compliant recycling strategies. However, under economic pressure, recyclers may opt for non-compliant recycling to reduce their operational costs, especially in the absence of external support such as government subsidies. Therefore, the government should guide recyclers toward compliant behavior through a combination of incentive policies and strict regulation while optimizing the market competition environment to ensure that compliant recyclers receive corresponding economic benefits.
Under Scenario 3, setting Cr1 at 12 drove the recyclers toward non-compliant recycling strategies, facilitating a clearer assessment of how subsidies, fines, and reputation value influence their decision-making. Simulations were conducted with Sr set at 2, 3, 4, 5, and 6. As shown in Figure 9d, recycler subsidies (Sr) positively correlated with compliant recycling behavior. Higher Sr values accelerated the shift from non-compliant to compliant strategies and stabilized the system more rapidly, highlighting the immediate incentive effect of subsidies. As depicted in Figure 9e, the impact of government fines (Fr) on recycler behavior evolved gradually. Although increasing Fr enhanced compliance pressure, the strategy evolution was slower than with subsidies, exhibiting a lag in the incentive effect and suggesting diminishing marginal benefits of the single fine mechanism.
The simulation results in Figure 9f show that reputation benefits (Er) positively influenced the recyclers’ decision-making. An increase in Er steepened the slope of the recycler strategy evolution curve, thereby accelerating convergence toward compliant recycling behavior. Although recyclers are less sensitive to policy measures compared with manufacturers, the impact of reputation benefits on the recyclers’ behavior is typically stronger. Therefore, enhancing subsidies and reputation incentives while moderately increasing fines is recommended to form an effective policy package that promotes compliant behavior among recyclers.

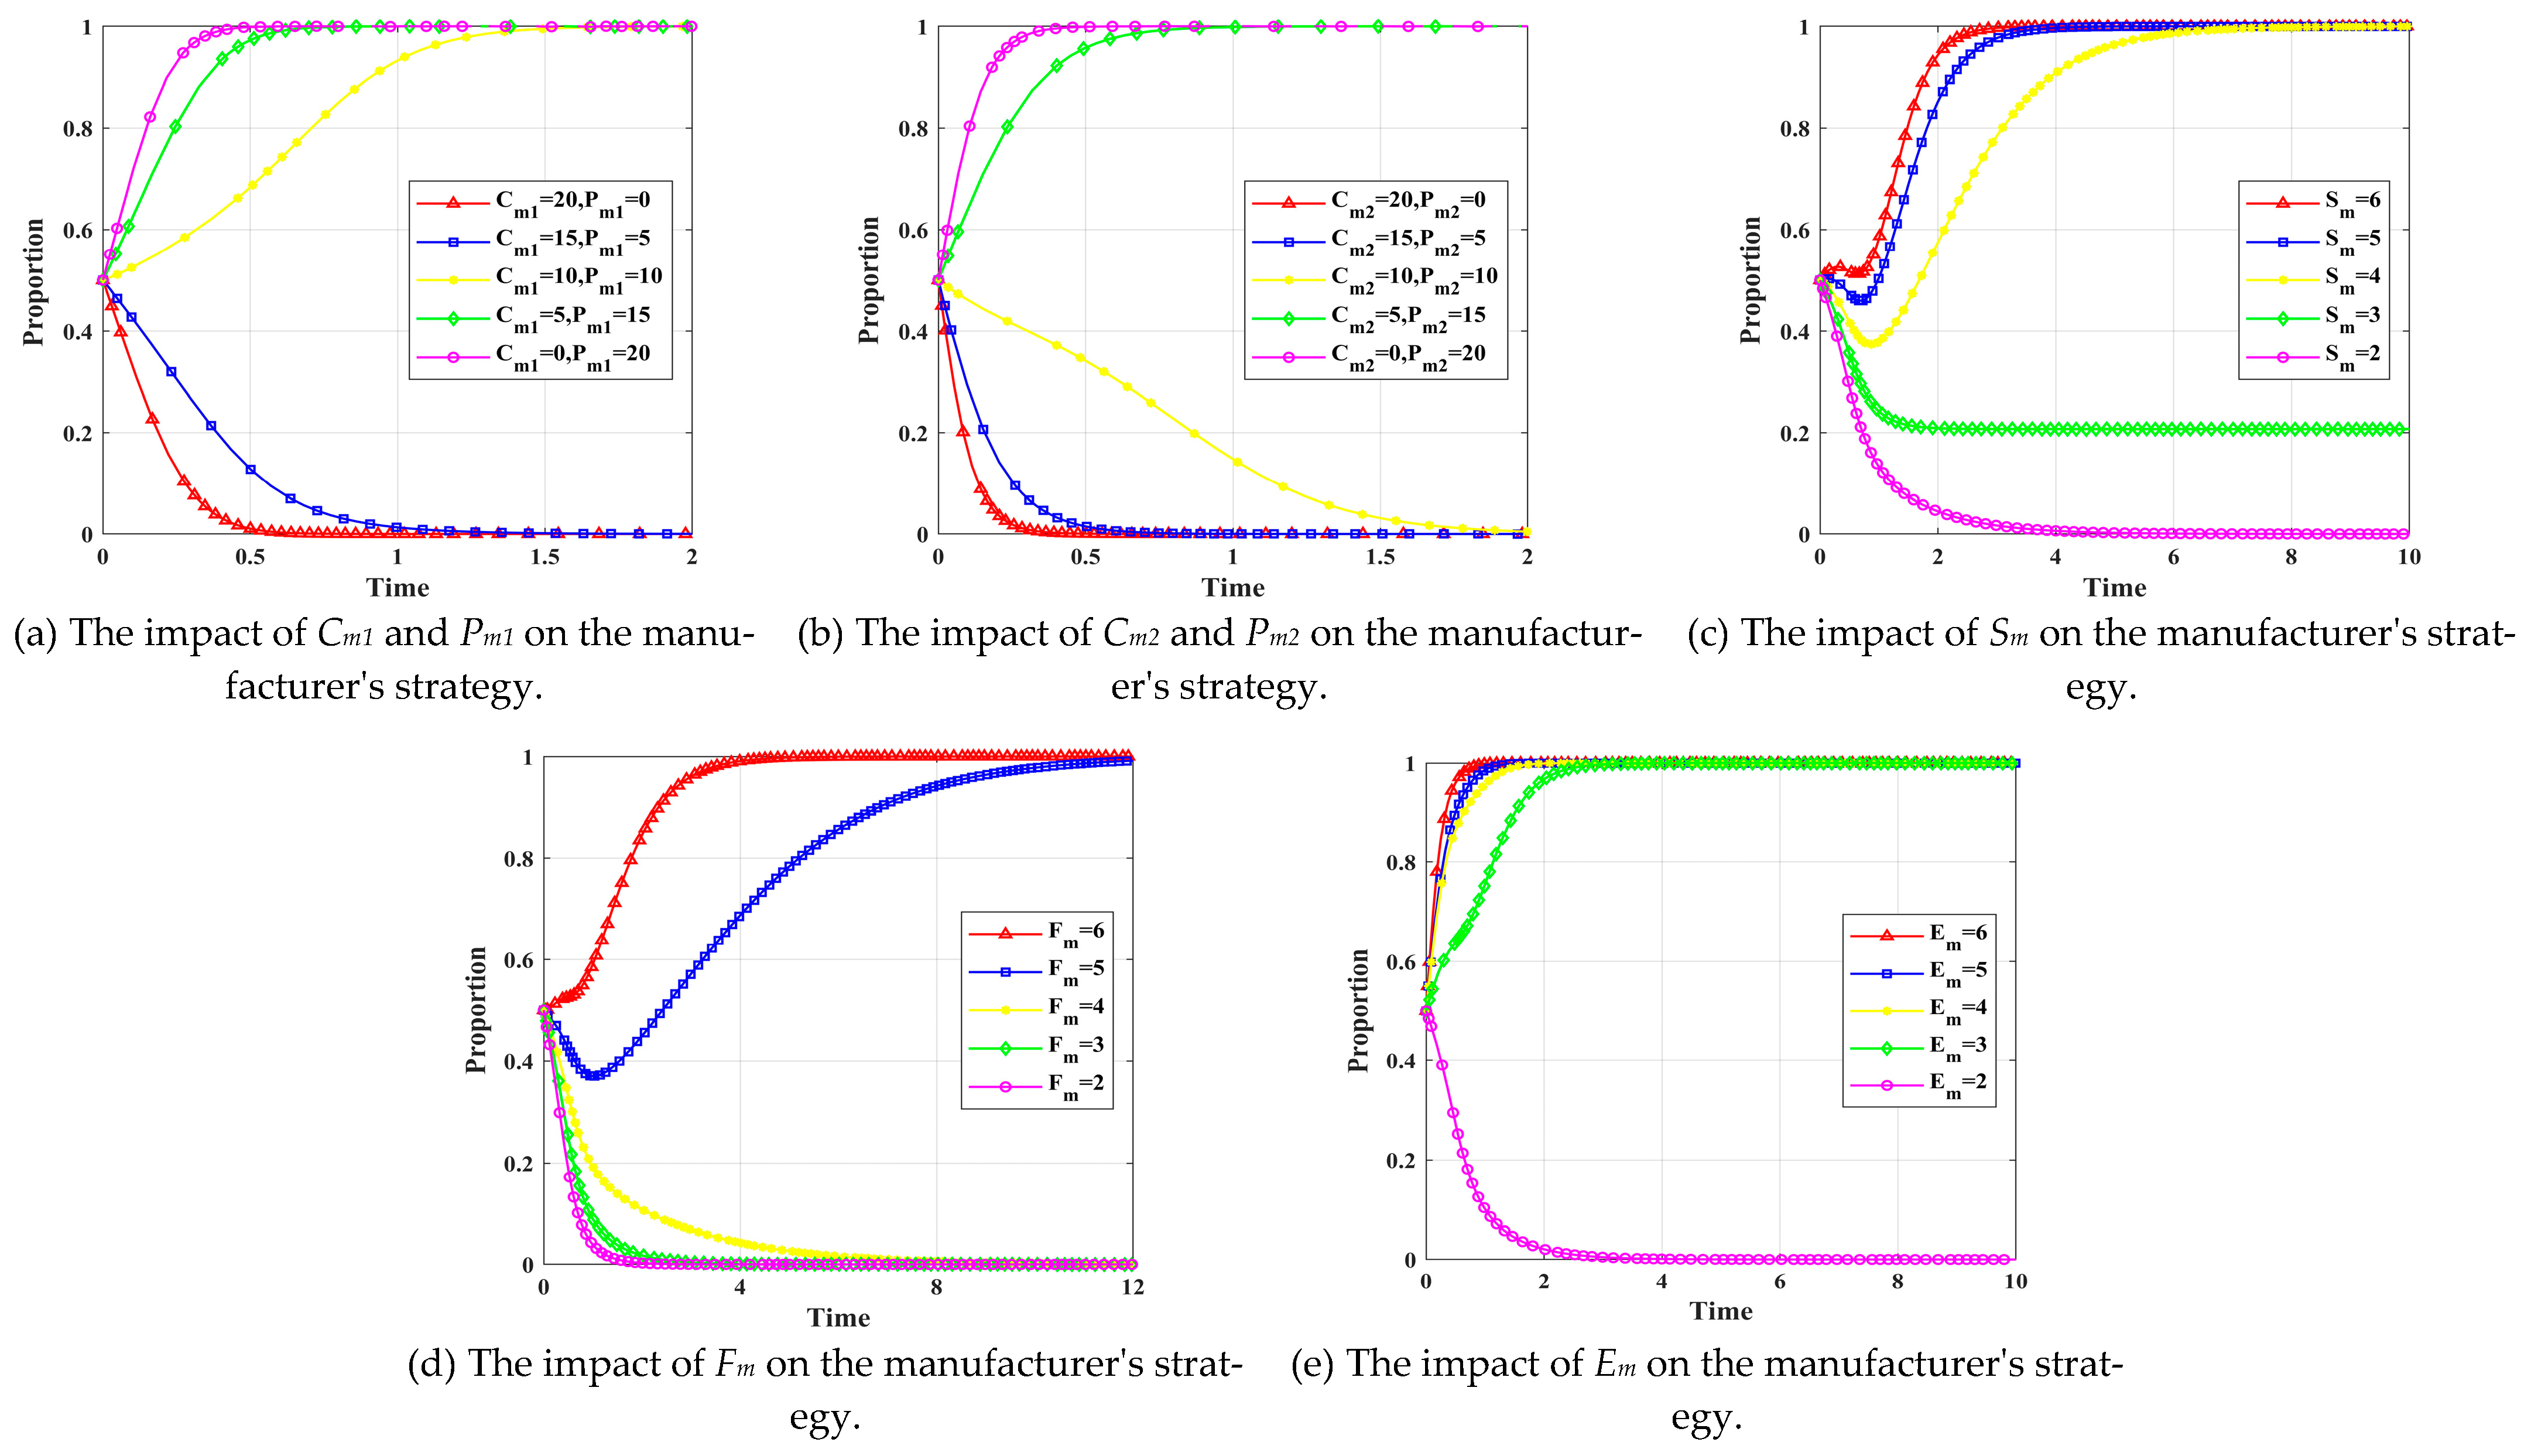
4.3.3. Analysis of Factors Influencing Manufacturer Decision-Making

As depicted in Figure 10a, when the manufacturer’s input cost (Cm1) exceeded the cooperative recycling revenue (Pm1), the evolutionary curve rapidly converged to 0, indicating a short-term inclination for manufacturers to exit recycling activities. Conversely, as recycling revenues incrementally surpassed the input costs, the probability of manufacturers participating in recycling steadily increased, with the evolutionary curve monotonically rising toward one. This underscores that rising recycling revenue not only bolsters the manufacturers’ participation willingness, but also expedites the convergence of their decision-making. Furthermore, at the break-even point, manufacturers remain inclined to participate in recycling, supported by synergies with recyclers and external incentives from government subsidies. This highlights the long-term stability and sustainability of the manufacturers’ engagement in recycling activities, driven by the collective action of multiple stakeholders. Under the non-cooperative recycling model, manufacturers incur unavoidable costs (Cm2) when establishing their own recycling outlets. These costs are necessary to meet the regulatory requirements and market responsibilities, as manufacturers must invest resources to build recycling channels. As illustrated in Figure 10b, when the manufacturer’s non-cooperative recycling cost (Cm2) exceeded its revenue (Pm2), the evolutionary curve rapidly converged to zero, indicating that excessive recycling costs prompt manufacturers to swiftly abandon recycling strategies. This decision-making rate was significantly faster than in the cooperative recycling model with recyclers, highlighting the high cost risks inherent in independent recycling. When the system reached break-even, the evolutionary curve gradually declined to zero, suggesting that government subsidies alone are insufficient to sustain the manufacturers’ participation in recycling. Conversely, as the revenue from independent recycling exceeded its costs, leading to increasing profits, the manufacturers’ willingness to establish independent recycling systems strengthened, with the evolutionary curve rapidly converging to one. This underscores the importance of optimizing the recycling revenue structure, reducing costs, and enhancing policy support to drive the manufacturers’ participation in recycling.
Under Scenario 3, setting the manufacturer’s input cost (Cm1) at 12 induced a preference for non-participation in recycling strategies. This configuration facilitated a more direct assessment of how subsidies (Sm), fines (Fm), and reputation value (Em) impact the manufacturer’s decision-making. As depicted in Figure 10d, increasing government subsidies significantly reduced the convergence time from the initial state to a stable equilibrium, ultimately shifting the manufacturer’s strategy from non-participation to participation in recycling. This shift indicates that higher subsidies effectively mitigate the adjustment costs associated with the manufacturer’s strategy. Comparing Figure 10c,d shows that when both the fines and subsidies were set at 4, subsidies prompted the manufacturers to participate in recycling earlier than the administrative penalties, highlighting the superior timeliness of subsidies as an incentive. In contrast, administrative penalties exhibited a degree of negativity and lag. From the manufacturer’s perspective, government compensation effectively alleviates the cost pressures associated with recycling participation, thereby more efficiently driving their choice to engage in recycling strategies.
Reputation value, as an intangible economic asset, significantly enhances a company’s market competitiveness and customer loyalty. As depicted in Figure 10e, setting the reputation value (Em) at levels of 2, 3, 4, 5, and 6 revealed that higher reputation values accelerated the manufacturer’s convergence to a stable state (state 1) and increased the likelihood of adopting recycling strategies. This underscores the positive incentive effect of reputation value on the manufacturers’ participation in recycling activities. Accordingly, manufacturers should intensify the promotion of their recycling initiatives to bolster their reputation value. Moreover, manufacturers are encouraged to collaborate with recyclers in developing compliant recycling infrastructure and optimize the recycling network using advanced technologies such as the Internet of Things and blockchain. These efforts can effectively reduce the costs while enhancing the operational efficiency and transparency. Additionally, manufacturers should actively promote their recycling initiatives through various channels, including social media, online platforms, and community partnerships, to build corporate reputation and market trust.

4.3.4. Analysis of Factors Influencing the Consumers’ Decision-Making

Simulations were conducted by setting Pu2 at 15, 18, and 24, with the results shown in Figure 11a–c. As the profit (Pu2) consumers gained from delivering retired batteries to non-compliant recyclers increased from 15 to 24, the probability of recyclers adopting compliant strategies rose, while the volatility of their strategies became more pronounced. The manufacturers’ participation remained relatively stable but was still somewhat affected. Meanwhile, the government regulatory intensity exhibited persistent cyclical fluctuations, with the amplitude of these fluctuations gradually increasing as the Pu2 values rose. This indicates that the impact of consumer behavior on non-compliant recyclers strengthens with increasing Pu2 values, thereby enhancing the recyclers’ influence on the retired battery recycling market. Therefore, optimizing the recycling network layout by establishing compliant collection points at consumer terminals, such as residential communities and automotive sales and service outlets, is recommended to reduce the costs for consumers to engage in environmentally friendly behaviors. Additionally, strengthening the supervision of non-compliant recyclers, enhancing the competitiveness of compliant recyclers, guiding consumers to choose compliant channels, and increasing the penalties for non-compliant behaviors to reduce their market share and influence are also suggested.
As depicted in Figure 11d, when the consumer’s disposal cost (Cu) exceeded their benefit (Pu1), the probability of engaging in environmentally friendly behavior rapidly converged to zero, underscoring the strong inhibitory effect of economic loss on environmental participation. At the break-even point, government subsidies maintain the consumers’ inclination toward environmentally friendly behavior, highlighting the regulatory role of policy on the market. Conversely, when the disposal costs were lower than the benefits, the probability of engaging in environmentally friendly behavior approached one, indicating that economic incentives promote such behavior. Therefore, it is recommended that marginal disposal costs are reduced through technological innovation, fixed costs are compressed by leveraging economies of scale, and a dynamic subsidy model is constructed based on a recycling revenue index to achieve a linkage between subsidy intensity and market returns.
The simulation results shown in Figure 11e indicate that setting the consumer environmental behavior cost (Cu) at 4.5 led consumers to prefer non-environmental behaviors. As the consumer subsidy (Su) increased, the strategy of the consumers evolved from non-environmental to environmental behavior, with the rate of strategy adjustment peaking at Su = 2 and then stabilizing. This underscores the dual nature of subsidy policies: while short-term subsidies can effectively enhance consumer environmental awareness, excessive long-term subsidies may result in insufficient government support for other recycling entities, thereby destabilizing compliant recycling channels and ultimately hindering the sustainable development of environmental behaviors. Therefore, it is recommended that the government establish a subsidy effectiveness evaluation system to monitor policy implementation in real-time. A differentiated subsidy strategy should be implemented, with the subsidy levels dynamically adjusted according to regional and market conditions. Additionally, a balance between subsidy intensity and market recycling channels should be maintained to ensure sustainable environmental behavior.

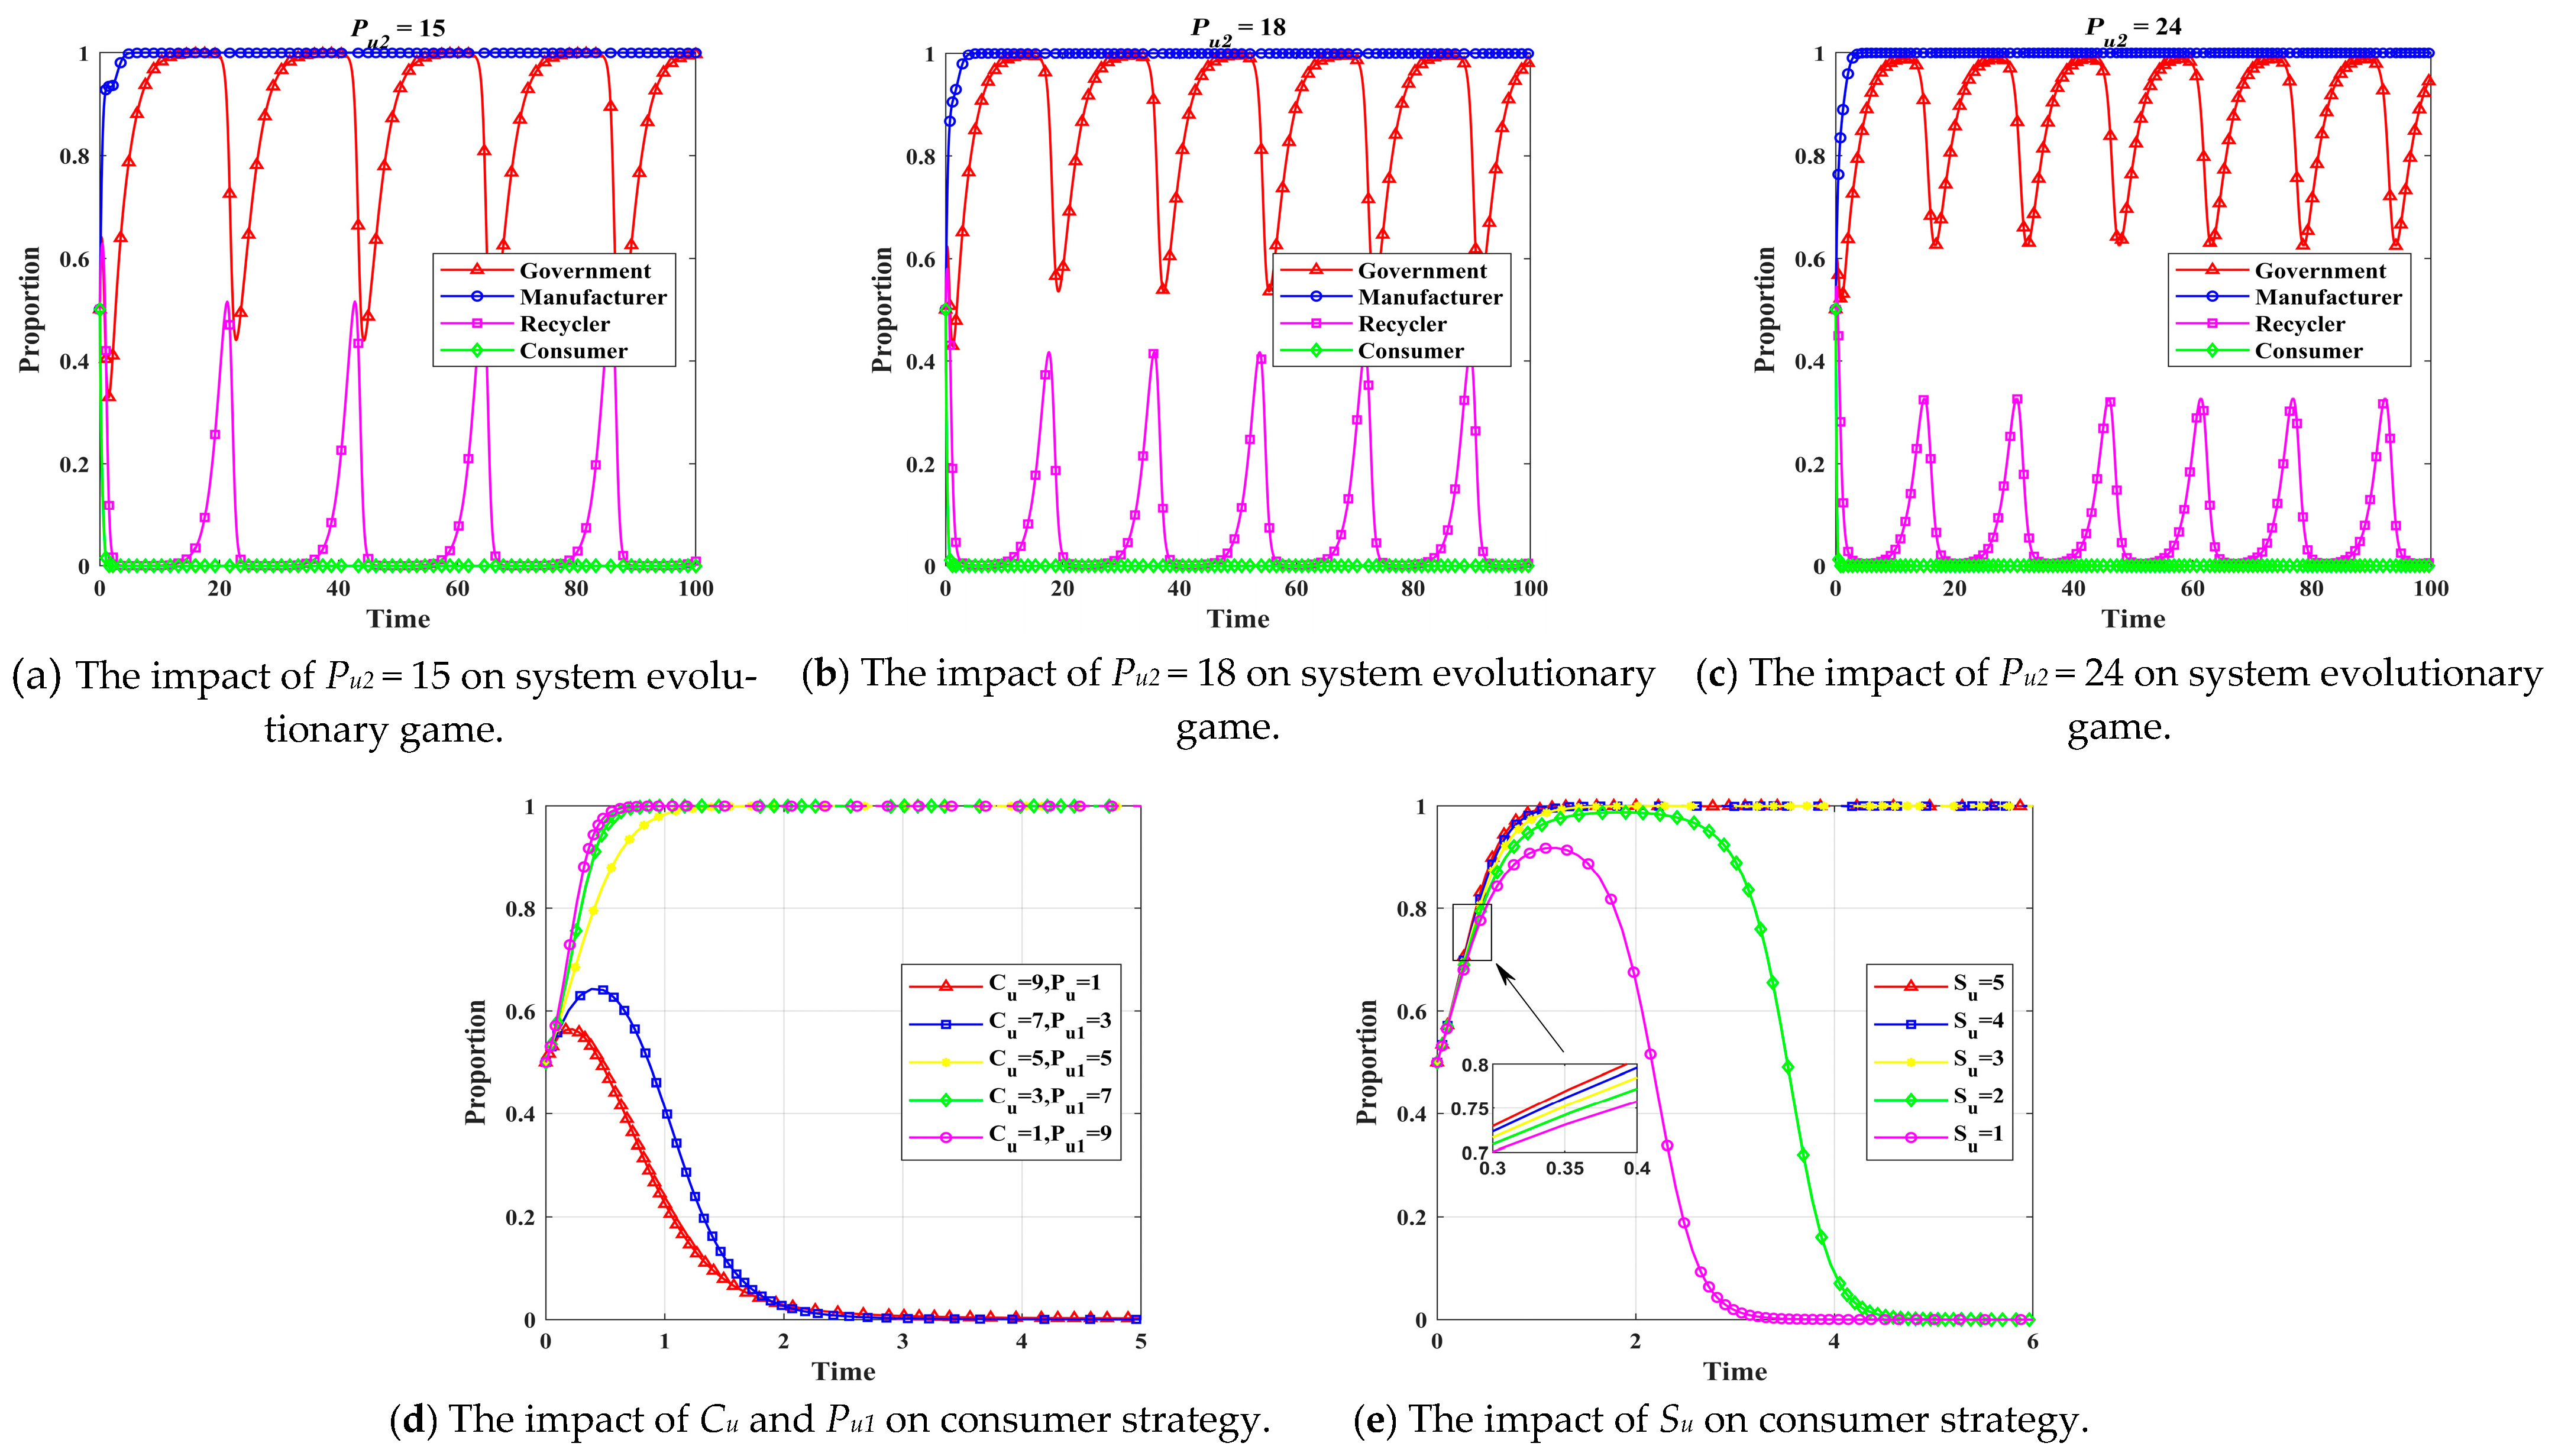
4.3.5. Influence of Government Regulatory Probability

This study undertook a three-dimensional simulation analysis to assess the efficacy of governmental regulatory mechanisms in the recycling of waste PBs. The analysis involved the strategic evolution of manufacturers, recyclers, and consumers under two contrasting regulatory frameworks: x = 0 (lenient regulation) and x = 0.8 (stringent regulation). The outcomes, as depicted in Figure 12, revealed substantial disparities in system dynamics and equilibrium states across these regulatory paradigms. These findings offer empirical support for the refinement of policies aimed at optimizing battery recycling management.
Figure 12 demonstrates that within a lenient regulatory framework (x = 0), the system manifests a bifurcated state: one characterized by active participation in recycling by manufacturers, recyclers, and consumers, and another by their disengagement. This dichotomy exposes the intrinsic contradictions within the recycling framework, where the proactive faction is propelled by a sense of social duty to partake in recycling, whereas the reactive faction, motivated by self-interest, is prone to opportunistic conduct. Specifically, the manufacturers’ strategic decisions are shaped by a dual consideration of potential reputational damage and economic incentives, leading to a multiplicity of strategic pathways; recyclers, in their pursuit of profit maximization, are inclined toward non-compliant practices including the use of high-priced door-to-door collection services; and certain consumers, deterred by the elevated costs of engagement, resort to environmentally detrimental behaviors. These observations validate that market mechanisms alone are inadequate for fostering standardized progression within the recycling system, thereby highlighting the essential role of governmental oversight. Under the stringent regulatory regime characterized by x = 0.8, the system evolved toward a state of equilibrium. At this critical threshold, the government’s sustained high probability of regulatory enforcement substantially elevated the propensity for recyclers to adhere to compliant recycling practices. Consequently, manufacturers exhibit a heightened inclination to partner with compliant recyclers, thereby enhancing their engagement in recycling initiatives. In this context, consumers demonstrate a greater propensity to deposit their used PBs at compliant recycling collection sites. These observations are consistent with the outcomes of the system evolution path analysis detailed in preceding sections.
In conclusion, the implementation of stringent regulatory measures in conjunction with substantial subsidy policies has been demonstrated to significantly bolster the compliance levels of manufacturers and recyclers alike. Furthermore, these initiatives serve to motivate consumers toward environmentally responsible practices, facilitating the achievement of a stable and sustainable PB recycling system. Conversely, an environment of lax governmental regulation results in a multiplicity of strategies that lack stability, potentially culminating in diminished efficiency within the recycling system. Hence, it is evident that active leadership and stringent regulatory oversight from the government are pivotal to the robust and healthy progression of the PB recycling sector.

5. Conclusions and Recommendations

5.1. Conclusions

This study constructed a four-party evolutionary game model involving the government, manufacturers, recyclers, and consumers, based on the EPR system. The model systematically analyzed the decision-making behaviors and interaction mechanisms of each stakeholder in the retired PB recycling system. Numerical simulations using MATLAB 2023a revealed the impacts of reward and punishment policies, costs and benefits, and environmental benefits on the stability of the recycling system. The specific conclusions are as follows:
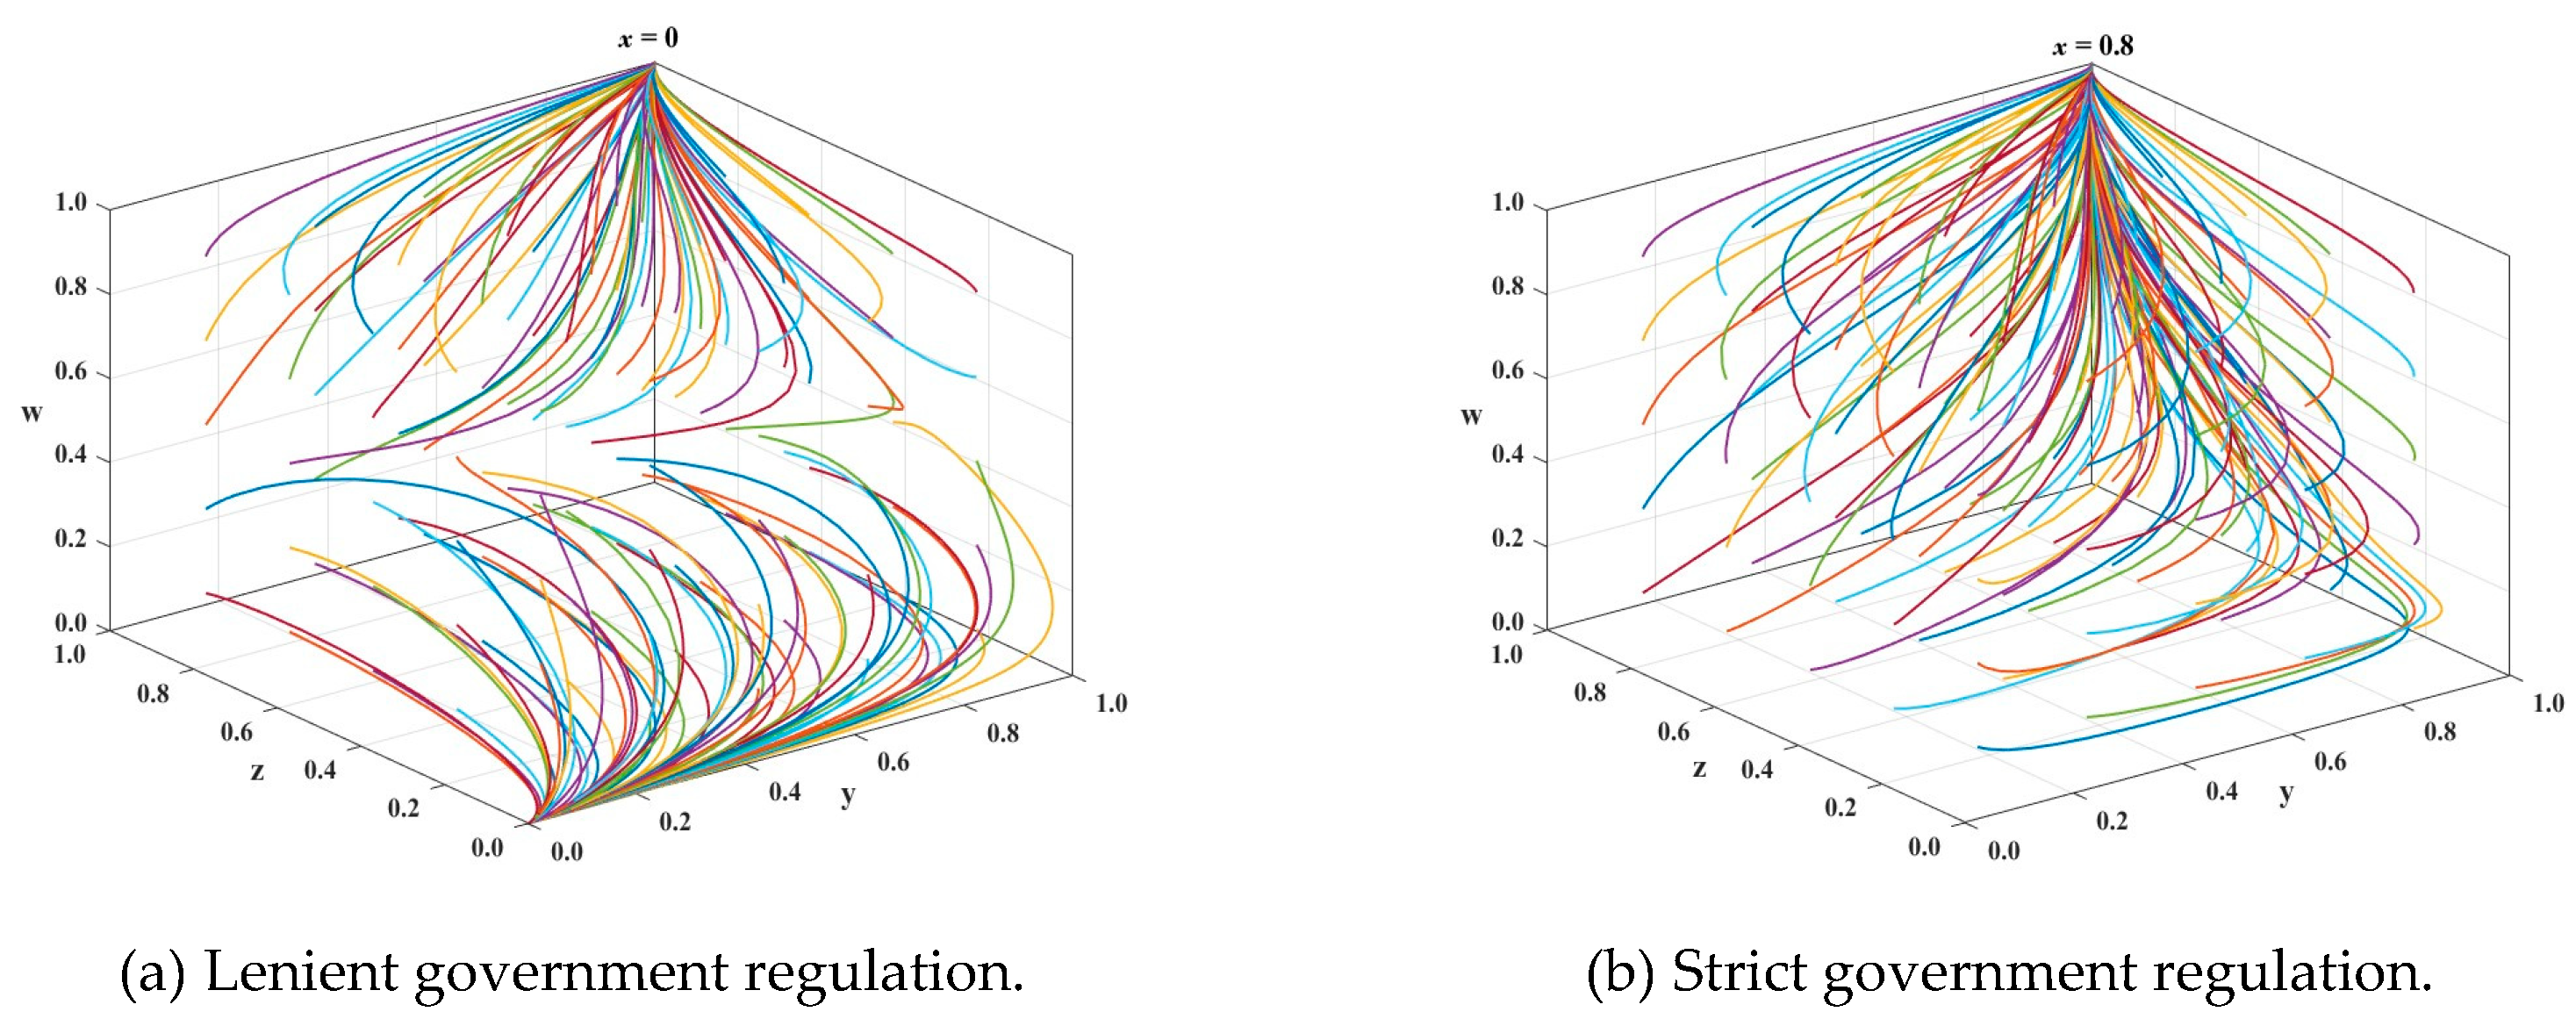
  • Long-term evolution may yield three stable strategy combinations. Firstly, when the government, manufacturers, recyclers, and consumers all adopt proactive recycling strategies, the system evolves toward a Pareto optimal state. Secondly, if the government pursues a lenient regulatory strategy, the system may transition to a transitional state (0,1,1,1), but this state is challenging to maintain. Thirdly, in the absence of stringent long-term regulation, the system is likely to evolve toward a Pareto worst state (0,0,0,0), which would be highly detrimental to the development of the used PB recycling market.
  • Increasing the level of government subsidies can temporarily extend the period of strict regulation. However, long-term subsidies beyond a certain threshold may lead to diminishing marginal returns and the inefficient allocation of fiscal resources. Manufacturers and recyclers are particularly sensitive to subsidy policies, so policy formulation should prioritize these groups. Enhancing the government’s overall benefits and increasing the penalties for non-compliance could help strengthen the government’s resolve and capability to enforce strict regulations.
  • The manufacturers’ engagement in spent PB recycling is primarily driven by profit considerations. Within a collaborative environment supported by multi-stakeholder cooperation and favorable policies, their recycling practices exhibit long-term stability and sustainability. Policy incentives and enhanced reputational value could further motivate manufacturers to participate. Additionally, manufacturers are highly sensitive to fluctuations in subsidy policies, which directly influence their decision to engage in recycling activities.
  • Collaboration with manufacturers enables recyclers to share the costs and risks, thereby promoting the adoption of compliant recycling strategies. However, under economic pressures or insufficient external support, recyclers may resort to non-compliant practices that offer higher profits but pose environmental, legal, and reputational risks. While subsidy policies provide an immediate incentive for compliant behavior, penalty mechanisms have a relatively delayed impact, and reputational benefits offer a positive incentive for decision-making.
  • The consumers’ environmentally friendly behaviors directly influence the strategic choices of recyclers and manufacturers as well as market stability. Economic incentives positively promote consumer engagement in environmental protection, whereas financial losses significantly dampen their participation. Subsidy policies could enhance consumer awareness of environmental protection in the short-term, but excessive long-term subsidies may undermine the stability of compliant recycling channels by providing insufficient support for other recycling entities, potentially causing market imbalances.

5.2. Recommendations

In light of the findings, this study puts forth some strategic recommendations as follows:
  • The government should strengthen its regulatory role, delineate clear accountability boundaries, and refine subsidy policies to give priority to supporting manufacturers and recyclers, mitigating the inevitable economic costs they encounter, and enhancing consumer participation. Additionally, it should advance the standardization of emerging technologies and establish a digital traceability system for the supply chain. Moreover, it is crucial to refine market entry and exit mechanisms and enhance collaborative governance among multiple stakeholders. The government should also streamline regulatory procedures to reduce administrative and enforcement costs, and bolster environmental oversight to diminish the risks of environmental pollution and decrease the costs associated with environmental remediation.
  • Manufacturers are encouraged to reduce recycling costs through technological innovation and process optimization as well as alleviate cost pressures by leveraging government subsidies and preferential tax policies. Additionally, manufacturers should strengthen partnerships with recyclers to share costs and enhance efficiency. Prioritizing reputation management, promoting recycling initiatives, and establishing digital recycling platforms through government-backed programs are crucial for boosting environmental standing and reinforcing the positive impact of reputational incentives.
  • Recyclers should enhance cooperation with manufacturers to share the costs and profits, thereby reducing the risks. They should also optimize the cost structures and improve recycling efficiency and quality through technological innovation. On this basis, actively pursuing government subsidies and other policy incentives could strengthen the economic motivation for compliant recycling practices. Additionally, focusing on reputation management and enhancing brand value and social recognition through compliant operations will bolster market competitiveness.
  • Consumers are encouraged to proactively select compliant and convenient recycling channels to reduce the recycling and waste management costs. They should also rationally weigh the costs and benefits of eco-friendly behaviors and actively utilize government subsidies to transition from non-environmentally friendly to environmentally friendly practices. Enhancing environmental awareness and resisting the allure of short-term economic gains are crucial for sustaining individual eco-friendly behaviors.

5.3. Limitations

Although the game-theoretic model developed in this study included four key stakeholders—government, manufacturers, recyclers, and consumers—the actual CLSC for PBs is more complex, involving competitive and cooperative relationships among multiple enterprises of similar or different types. Future research could extend to multi-tier supply chain networks. Additionally, this study primarily focused on incentive and punitive policies, costs and benefits, and reputational value. Future research could further explore the composition of costs and benefits including societal costs and potential gains from technological innovation. Additionally, future research should incorporate more real-world case studies to enhance the empirical basis of the study. This study mainly considered the EPR system and incentive and punitive policies. Future research could investigate the implementation effects of various policies, such as carbon credit quotas and deposit systems, in the recycling process of PBs, and integrate empirical studies to validate the practical applicability of the model.

Author Contributions

Conceptualization, L.Y. and S.Z.; Methodology, L.Y.; Software, S.Z.; Validation, Z.D., L.Y. and S.Z.; Formal analysis, L.Y.; Investigation, S.Z.; Resources, Z.D.; Data curation, L.Y.; Writing—original draft preparation, Z.D.; Writing—review and editing, S.Z.; Visualization, L.Y.; Supervision, Z.D.; Project administration, S.Z.; Funding acquisition, L.Y. All authors have read and agreed to the published version of the manuscript.

Funding

This research was funded by the General Program of the National Social Science Foundation of China (grant number 17BGL238), and the Humanities and Social Sciences Research Project of the Ministry of Education of China (grant number 22YJC630030).

Data Availability Statement

The original contributions presented in this study are included in the article. Further inquiries can be directed to the corresponding author.

Conflicts of Interest

The authors declare no conflicts of interest.

Abbreviations

The following abbreviations are used in this manuscript:
NEVNew energy vehicle
EPRExtended producer responsibility
PBPower battery
ESSEvolutionarily stable strategy
CLSCClosed-loop supply chain

References

  1. Achakulwisut, P.; Erickson, P.; Guivarch, C.; Schaeffer, R.; Brutschin, E.; Pye, S. Global fossil fuel reduction pathways under different climate mitigation strategies and ambitions. Nat. Commun. 2023, 14, 5425. [Google Scholar] [CrossRef]
  2. Liu, Z.; Deng, Z.; Davis, S.; Ciais, P. Monitoring global carbon emissions in 2022. Nat. Rev. Earth Environ. 2023, 4, 205–206. [Google Scholar] [CrossRef] [PubMed]
  3. Evro, S.; Oni, B.A.; Tomomewo, O.S. Global Strategies for a Low-Carbon Future: Lessons from the US, China, and EU’s Pursuit of Carbon Neutrality. J. Clean. Prod. 2024, 461, 142635. [Google Scholar] [CrossRef]
  4. Way, R.; Ives, M.C.; Mealy, P.; Farmer, J.D. Empirically grounded technology forecasts and the energy transition. Joule 2022, 6, 2057–2082. [Google Scholar] [CrossRef]
  5. Speizer, S.; Fuhrman, J.; Lopez, L.A.; George, M.; Kyle, P.; Monteith, S.; McJeon, H. Integrated assessment modeling of a zero-emissions global transportation sector. Nat. Commun. 2024, 15, 4439. [Google Scholar] [CrossRef] [PubMed]
  6. Tuffour, J.P.; Ewing, R. Can battery electric vehicles meet sustainable energy demands? Systematically reviewing emissions, grid impacts, and coupling to renewable energy. Energy Res. Soc. Sci. 2024, 114, 103625. [Google Scholar] [CrossRef]
  7. Mauler, L.; Duffner, F.; Zeier, W.G.; Leker, J. Battery cost forecasting: A review of methods and results with an outlook to 2050. Energy Res. Soc. Sci. 2021, 14, 4712–4739. [Google Scholar] [CrossRef]
  8. Neumann, J.; Petranikova, M.; Meeus, M.; Gamarra, J.D.; Younesi, R.; Winter, M.; Nowak, S. Recycling of lithium-ion batteries—Current state of the art, circular economy, and next generation recycling. Adv. Energy Mater. 2022, 12, 2102917. [Google Scholar] [CrossRef]
  9. Nuroldayeva, G.; Serik, Y.; Adair, D.; Uzakbaiuly, B.; Bakenov, Z. State of Health Estimation Methods for Lithium-Ion Batteries. Int. J. Energy Res. 2023, 2023, 4297545. [Google Scholar] [CrossRef]
  10. Wang, S.; Lai, Y.; Yang, J.; Zhao, J.; Zhang, Y.; Chen, M.; Tang, J.; Xu, J.; Su, M. Advances in Recycling Technologies of Critical Metals and Resources from Cathodes and Anodes in Spent Lithium-Ion Batteries. Separations 2024, 12, 4. [Google Scholar] [CrossRef]
  11. Ma, X.; Meng, Z.; Bellonia, M.V.; Spangenberger, J.; Harper, G.; Gratz, E.; Olivetti, E.; Arsenault, R.; Wang, Y. The evolution of lithium-ion battery recycling. Nat. Rev. Clean Technol. 2025, 1, 75–94. [Google Scholar]
  12. Lee, J.; Choe, H.; Yoon, H.Y. Past trends and future directions for circular economy in electric vehicle waste battery reuse and recycling: A bibliometric analysis. Sustain. Energy Technol. Assess. 2025, 75, 104198. [Google Scholar]
  13. Istrate, R.; Mas-Fons, A.; Beylot, A.; Northey, S.; Vaidya, K.; Sonnemann, G.; Kleijn, R.; Steubing, B. Decarbonizing lithium-ion battery primary raw materials supply chain. Joule 2024, 8, 2992–3016. [Google Scholar]
  14. Dobó, Z.; Dinh, T.; Kulcsár, T. A review on recycling of spent lithium-ion batteries. Energy Rep. 2023, 9, 6362–6395. [Google Scholar]
  15. Preet, S.; Smith, S.T. A comprehensive review on the recycling technology of silicon-based photovoltaic solar panels: Challenges and future outlook. J. Cleaner Prod. 2024, 448, 141661. [Google Scholar]
  16. Rezaei, M.; Nekahi, A.; MR, A.K.; Nizami, A.; Li, X.; Deng, S.; Nanda, J.; Zaghib, K. A review of lithium-ion battery recycling for enabling a circular economy. J. Power Sources 2025, 630, 236157. [Google Scholar]
  17. Zhou, Y.; Cui, X.D.; Lin, A.J.; Dong, Y.; Duan, L.G. Environmental life cycle assessment on the recycling processes of power batteries for new energy vehicles. J. Clean. Prod. 2025, 488, 144641. [Google Scholar]
  18. Man, G.T.; Iordache, A.M.; Zgavarogea, R.; Nechita, C. Recycling Lithium-Ion Batteries—Technologies, Environmental, Human Health, and Economic Issues—Mini-Systematic Literature Review. Membranes 2024, 14, 277. [Google Scholar] [CrossRef]
  19. Bae, H.; Kim, Y. Technologies of lithium recycling from waste lithium ion batteries: A review. Mater. Adv. 2021, 2, 3234–3250. [Google Scholar]
  20. Harper, G.; Sommerville, R.; Kendrick, E.; Driscoll, L.; Slater, P.; Stolkin, R.; Walton, A.; Christensen, P.; Heidrich, O.; Lambert, S.; et al. Recycling lithium-ion batteries from electric vehicles. Nature 2019, 575, 75–86. [Google Scholar]
  21. Blömeke, S.; Scheller, C.; Cerdas, F.; Thies, C.; Hachenberger, R.; Gonter, M.; Herrmann, C.; Spengler, T.S. Material and energy flow analysis for environmental and economic impact assessment of industrial recycling routes for lithium-ion traction batteries. J. Clean. Prod. 2022, 377, 134344. [Google Scholar]
  22. Zhao, T.; Mahandra, H.; Marthi, R.; Ji, X.; Zhao, W.; Chae, S.; Traversy, M.; Li, W.; Yu, F.; Li, L.; et al. An overview on the life cycle of lithium iron phosphate: Synthesis, modification, application, and recycling. Chem. Eng. J. 2024, 485, 149923. [Google Scholar]
  23. Wang, M.; Liu, K.; Dutta, S.; Alessi, D.S.; Rinklebe, J.; Ok, Y.S.; Tsang, D.C. Recycling of lithium iron phosphate batteries: Status, technologies, challenges, and prospects. Renew. Sustain. Energy Rev. 2022, 163, 112515. [Google Scholar]
  24. Tripathy, A.; Bhuyan, A.; Padhy, R.; Mangla, S.K.; Roopak, R. Drivers of lithium-ion batteries recycling industry toward circular economy in industry 4.0. Comput. Ind. Eng. 2023, 179, 109157. [Google Scholar]
  25. Dos Santos, M.P.; Garde, I.A.A.; Ronchini, C.M.B.; Cardozo Filho, L.; De Souza, G.B.M.; Abbade, M.L.F.; Regone, N.N.; Jegatheesan, V.J.; De Oliveira, J.A. A technology for recycling lithium-ion batteries promoting the circular economy: The RecycLib. Resour. Conserv. Recycl. 2021, 175, 105863. [Google Scholar]
  26. Roy, J.J.; Phuong, D.M.; Verma, V.; Chaudhary, R.; Carboni, M.; Meyer, D.; Cao, B.; Srinivasan, M. Direct recycling of Li-ion batteries from cell to pack level, Challenges and prospects on technology, scalability, sustainability, and economics. Carbon Energy 2024, 6, e492. [Google Scholar]
  27. Chen, G.; Shi, H.; Ding, H.; Zhang, X.; Gu, T.; Zhu, M.; Tan, W. Multi-scale analysis of nickel ion tolerance mechanism for thermophilic Sulfobacillus thermosulfidooxidans in bioleaching. J. Hazard. Mater. 2023, 443, 130245. [Google Scholar]
  28. Roy, J.J.; Rarotra, S.; Krikstolaityte, V.; Zhuoran, K.W.; Cindy, Y.D.I.; Tan, X.Y.; Carboni, M.; Meyer, D.; Yan, Q.; Srinivasan, M. Green recycling methods to treat lithium-ion batteries E-waste, a circular approach to sustainability. Adv. Mater. 2022, 34, 2103346. [Google Scholar]
  29. Cheng, A.L.; Fuchs, E.R.H.; Karplus, V.J.; Michalek, J.J. Electric vehicle battery chemistry affects supply chain disruption vulnerabilities. Nat. Commun. 2024, 15, 2143. [Google Scholar]
  30. Bulut, M.S.; Ordu, M.; Der, O.; Basar, G. Sustainable thermoplastic material selection for hybrid vehicle battery packs in the automotive industry: A comparative multi-criteria decision-making approach. Polymers 2024, 16, 2768. [Google Scholar] [CrossRef]
  31. Wazeer, A.; Das, A.; Abeykoon, C.; Sinha, A.; Karmakar, A. Phase change materials for battery thermal management of electric and hybrid vehicles: A review. Energy Nexus 2022, 7, 100131. [Google Scholar]
  32. Mirzaei Omrani, M.; Jannesari, H. Economic and environmental assessment of reusing electric vehicle lithium-ion batteries for load leveling in the residential, industrial and photovoltaic power plants sectors. Renew. Sustain. Energy Rev. 2019, 116, 109413. [Google Scholar] [CrossRef]
  33. Skeete, J.-P.; Wells, P.; Dong, X.; Heidrich, O.; Harper, G. Beyond the EVent horizon: Battery waste, recycling, and sustainability in the United Kingdom electric vehicle transition. Energy Res. Soc. Sci. 2020, 69, 101581. [Google Scholar]
  34. Biswal, B.K.; Zhang, B.; Tran, P.T.M.; Zhang, J.; Balasubramanian, R. Recycling of spent lithium-ion batteries for a sustainable future: Recent advancements. Chem. Soc. Rev. 2024, 53, 5552–5592. [Google Scholar] [PubMed]
  35. Karimzadeh, S.; Safaei, B.; Yuan, C.; Jen, T.-C. Emerging atomic layer deposition for the development of high-performance lithium-ion batteries. Electrochem. Energy Rev. 2023, 6, 24. [Google Scholar]
  36. Nasajpour-Esfahani, N.; Garmestani, H.; Bagheritabar, M.; Jasim, D.J.; Toghraie, D.; Dadkhah, S.; Firoozeh, H. Comprehensive review of lithium-ion battery materials and development challenges. Renew. Sustain. Energy Rev. 2024, 203, 114783. [Google Scholar]
  37. Miranda, D.; Gonçalves, R.; Wuttke, S.; Costa, C.M.; Lanceros-Méndez, S. Overview on theoretical simulations of lithium-ion batteries and their application to battery separators. Adv. Energy Mater. 2023, 13, 2203874. [Google Scholar]
  38. Rajaeifar, M.A.; Ghadimi, P.; Raugei, M.; Wu, Y.; Heidrich, O. Challenges and recent developments in supply and value chains of electric vehicle batteries: A sustainability perspective. Resour. Conserv. Recycl. 2022, 180, 106144. [Google Scholar]
  39. Hosseini-Motlagh, S.-M.; Nouri-Harzvili, M.; Johari, M.; Sarker, B.R. Coordinating economic incentives, customer service and pricing decisions in a competitive closed-loop supply chain. J. Clean. Prod. 2020, 255, 120241. [Google Scholar]
  40. Lander, L.; Cleaver, T.; Rajaeifar, M.A.; Nguyen-Tien, V.; Elliott, R.J.; Heidrich, O.; Kendrick, E.; Edge, J.S.; Offer, G. Financial viability of electric vehicle lithium-ion battery recycling. Iscience 2021, 24, 102787. [Google Scholar]
  41. Chinen, K.; Matsumoto, M.; Tong, P.; Han, Y.S.; Niu, K.-H.J. Electric vehicle owners’ perception of remanufactured batteries: An empirical study in China. Sustainability 2022, 14, 10846. [Google Scholar] [CrossRef]
  42. Kushwaha, S.; Chan, F.T.; Chakraborty, K.; Pratap, S. Collection and remanufacturing channels selection under a product take-back regulation with remanufacturing target. Int. J. Prod. Res. 2022, 60, 7384–7410. [Google Scholar] [CrossRef]
  43. Bhuyan, A.; Tripathy, A.; Padhy, R.; Gautam, A. Evaluating the lithium-ion battery recycling industry in an emerging economy: A multi-stakeholder and multi-criteria decision-making approach. J. Clean. Prod. 2022, 331, 130007. [Google Scholar] [CrossRef]
  44. Melin, H.E.; Rajaeifar, M.A.; Ku, A.Y.; Kendall, A.; Harper, G.; Heidrich, O. Global implications of the EU battery regulation. Science 2021, 373, 384–387. [Google Scholar] [CrossRef]
  45. Giosuè, C.; Marchese, D.; Cavalletti, M.; Isidori, R.; Conti, M.; Orcioni, S.; Ruello, M.L.; Stipa, P. An exploratory study of the policies and legislative perspectives on the end-of-life of lithium-ion batteries from the perspective of producer obligation. Sustainability 2021, 13, 11154. [Google Scholar] [CrossRef]
  46. Tembo, P.M.; Dyer, C.; Subramanian, V. Lithium-ion battery recycling—A review of the material supply and policy infrastructure. NPG Asia Mater. 2024, 16, 43. [Google Scholar] [CrossRef]
  47. Ahlers, J.; Hemkhaus, M.; Hibler, S.; Hannak, J. Analysis of Extended Producer Responsibility Schemes; Adelphi Consult GmbH: Berlin, Germany, 2021. [Google Scholar]
  48. Zan, X.; Zhang, D. Analysis on the optimal recycling path of Chinese lead-acid battery under the extended producer responsibility system. Sustainability 2022, 14, 4950. [Google Scholar] [CrossRef]
  49. Compagnoni, M.; Grazzi, M.; Pieri, F.; Tomasi, C. Extended producer responsibility and trade flows in waste: The case of batteries. Environ. Resour. Econ. 2025, 88, 43–76. [Google Scholar] [CrossRef]
  50. Van Hoof, G.; Robertz, B.; Verrecht, B. Towards sustainable battery recycling: A carbon footprint comparison between pyrometallurgical and hydrometallurgical battery recycling flowsheets. Metals 2023, 13, 1915. [Google Scholar] [CrossRef]
  51. Feng, Z.; Luo, N.; Shalpegin, T.; Cui, H. The influence of carbon emission reduction instruments on blockchain technology adoption in recycling batteries of the new energy vehicles. Int. J. Prod. Res. 2024, 62, 891–908. [Google Scholar] [CrossRef]
  52. Júnior, C.A.R.; Sanseverino, E.R.; Gallo, P.; Koch, D.; Schweiger, H.-G.; Zanin, H. Blockchain review for battery supply chain monitoring and battery trading. Renew. Sustain. Energy Rev. 2022, 157, 112078. [Google Scholar]
  53. Narang, P.; De, P.K.; Lim, C.P.; Kumari, M. Optimal recycling model selection in a closed-loop supply chain for electric vehicle batteries under carbon cap-trade and reward-penalty policies using the Stackelberg game. Comput. Ind. Eng. 2024, 196, 110512. [Google Scholar]
  54. Kim, T.; Yoon, C.; Jung, S. A Study on the Battery Recycling Process and Risk Estimation. Int. J. Environ. Res. Public Health 2024, 21, 1649. [Google Scholar] [CrossRef]
  55. Li, G.; Lu, M.; Lai, S.; Li, Y. Research on power battery recycling in the green closed-loop supply chain: An evolutionary game-theoretic analysis. Sustainability 2023, 15, 10425. [Google Scholar] [CrossRef]
  56. Ren, G.; Eveleigh, T. A quantitative assessment of policy-driven impacts on circular economy of electric vehicle batteries in the United States. Environ. Syst. Decis. 2025, 45, 4. [Google Scholar] [CrossRef]
  57. Thompson, D.L.; Hartley, J.M.; Lambert, S.M.; Shiref, M.; Harper, G.D.J.; Kendrick, E.; Anderson, P.; Ryder, K.S.; Gaines, L.; Abbottet, A.P. The importance of design in lithium ion battery recycling–a critical review. Green Chem 2020, 22, 7585–7603. [Google Scholar]
  58. Wang, J.; He, Y.-Q.; Wang, H.-G.; Wu, R.-F. Low-carbon promotion of new energy vehicles: A quadrilateral evolutionary game. Renew. Sustain. Energy Rev. 2023, 188, 113795. [Google Scholar]
  59. Xiao, M.; Xu, C.; Xie, F. Research on the impact of information sharing and government subsidy on competitive power battery recycling. J. Clean. Prod. 2024, 467, 1429. [Google Scholar]
  60. He, L.; Sun, B. Exploring the EPR system for power battery recycling from a supply-side perspective: An evolutionary game analysis. Waste Manag. 2022, 140, 204–212. [Google Scholar]
  61. Traulsen, A.; Glynatsi, N.E. The future of theoretical evolutionary game theory. Philos. Trans. R. Soc. B 2023, 378, 20210508. [Google Scholar]
  62. Márquez, A.J.C.; Rutkowski, E.W. Waste management drivers towards a circular economy in the global south—The Colombian case. Waste Manag. 2020, 110, 53–65. [Google Scholar]
  63. Campitelli, A.; Kannengießer, J.; Schebek, L. Approach to assess the performance of waste management systems towards a circular economy: Waste management system development stage concept (WMS-DSC). MethodsX 2022, 9, 101634. [Google Scholar]
  64. D’Adamo, I.; Mazzanti, M.; Morone, P.; Rosa, P. Assessing the relation between waste management policies and circular economy goals. Waste Manag. 2022, 154, 27–35. [Google Scholar] [CrossRef] [PubMed]
  65. Smol, M.; Duda, J.; Czaplicka-Kotas, A.; Szołdrowska, D. Transformation towards circular economy (CE) in municipal waste management system: Model solutions for Poland. Sustainability 2020, 12, 4561. [Google Scholar] [CrossRef]
  66. Wysokińska, Z. A review of transnational regulations in environmental protection and the circular economy. Compar. Econ. Res. Cent. East Eur. 2020, 23, 149–168. [Google Scholar]
  67. Zhang, H.; Zhu, K.; Hang, Z.; Zhou, D.; Zhou, Y.; Xu, Z. Waste battery-to-reutilization decisions under government subsidies: An evolutionary game approach. Energy 2022, 259, 124835. [Google Scholar]
  68. Guo, S.; Liu, G.; Guo, X.; Wang, Y. Game evolution and simulation analysis of power battery recycling in China under conflicting supply and demand of critical metals. Front. Energy Res. 2022, 10, 984437. [Google Scholar]
  69. Li, Y.; Zhang, J. Evolutionary Game Analysis of Low-Carbon Incentive Behaviour of Power Battery Recycling Based on Prospect Theory. Sustainability 2024, 16, 2793. [Google Scholar] [CrossRef]
  70. Wang, Z.; Wu, F.; Zhang, W.; Ke, S.; Wang, X. Multi-agent behavioral strategy game and synergy evolution path of the retired power battery recycling system. Manag. Decis. Econ. 2024, 45, 3993–4011. [Google Scholar]
  71. Xia, X.; Li, P.; Cheng, Y. Tripartite evolutionary game analysis of power battery carbon footprint disclosure under the EU battery regulation. Energy 2023, 284, 129315. [Google Scholar]
  72. Shekarian, E.; Flapper, S.D. Analyzing the structure of closed-loop supply chains: A game theory perspective. Sustainability 2021, 13, 1397. [Google Scholar] [CrossRef]
  73. Basteck, C.; Ehlers, L. Strategy-proof and envy-free random assignment. J. Econ. Theory 2023, 209, 105618. [Google Scholar]
  74. Sayem, F.R.; Bin Islam, S.; Naznine, M.; Nashbat, M.; Hasan-Zia, M.; Kunju, A.K.A.; Khandakar, A.; Ashraf, A.; Majid, M.E.; Kashem, S.B.A.; et al. Enhancing waste sorting and recycling efficiency: Robust deep learning-based approach for classification and detection. Neural Comput. Appl. 2024, 37, 4567–4583. [Google Scholar]
  75. Nie, S.; Cai, G.; Huang, Y.; He, J. Deciphering stakeholder strategies in electric vehicle battery recycling: Insights from a tripartite evolutionary game and system dynamics. J. Clean. Prod. 2024, 452, 142174. [Google Scholar] [CrossRef]
  76. Zheng, Y.; Xu, Y. Optimizing Green Strategy for Retired Electric Vehicle Battery Recycling: An Evolutionary Game Theory Approach. Sustainability 2023, 15, 15464. [Google Scholar] [CrossRef]
  77. Huang, X.; Lin, Y.; Lim, M.K.; Zhou, F.; Liu, F. Electric vehicle charging station diffusion: An agent-based evolutionary game model in complex networks. Energ 2022, 257, 124700. [Google Scholar]
  78. Wei, L.; Wang, C.; Li, Y. Governance strategies for end-of-life electric vehicle battery recycling in China: A tripartite evolutionary game analysis. Front. Environ. Sci. 2022, 10, 1071688. [Google Scholar]
  79. Du, B.; Hou, H.; Xu, H.; Zhang, M. How to solve the problem of irregular recycling of spent lead-acid batteries in China?—An analysis based on evolutionary game theory. J. Clean. Prod. 2023, 421, 138514. [Google Scholar]
  80. Bastos, J.; Buzzi, C.; Santana, P. On structural stability of evolutionary stable strategies. J. Differ. Equ. 2024, 389, 190–227. [Google Scholar]
  81. Liao, D.; Tan, B. An evolutionary game analysis of new energy vehicles promotion considering carbon tax in post-subsidy era. Energy. 2023, 264, 126156. [Google Scholar]
  82. Wang, E.; Nie, J.; Wang, Y. Government subsidy strategies for the new energy vehicle power battery recycling industry. Sustainability 2023, 15, 2090. [Google Scholar] [CrossRef]
  83. Li, D.; Jiang, P.; Hu, C.; Yan, T. Comparison of local and global sensitivity analysis methods and application to thermal hydraulic phenomena. Prog. Nucl. Energy 2023, 158, 104612. [Google Scholar]
  84. Demir, G.; Chatterjee, P.; Pamucar, D. Sensitivity analysis in multi-criteria decision making: A state-of-the-art research perspective using bibliometric analysis. Expert Syst. Appl. 2024, 237, 121660. [Google Scholar]
Figure 1. Global power battery installation volume, 2017–2023.
Wevj 16 00187 g001
Figure 2. Interactive relationships of stakeholders.
Wevj 16 00187 g002
Figure 3. Phase diagram of government strategy evolution.
Wevj 16 00187 g003
Figure 4. Phase diagram of manufacturer strategy evolution.
Wevj 16 00187 g004
Figure 5. Phase diagram of recycler strategy evolution.
Wevj 16 00187 g005
Figure 6. Phase diagram of consumer strategy evolution.
Wevj 16 00187 g006
Figure 7. System evolution path.
Wevj 16 00187 g007
Figure 8. Sensitivity analysis of government parameters.
Wevj 16 00187 g008
Figure 9. Sensitivity analysis of recycler parameters.
Wevj 16 00187 g009
Figure 10. Sensitivity analysis of manufacturer parameters.
Wevj 16 00187 g010
Figure 11. Sensitivity analysis of consumer parameters.
Wevj 16 00187 g011
Figure 12. The effect of government regulatory intensity on system evolution.
Wevj 16 00187 g012
Table 1. Payoff matrix of the four stakeholders.
ConsumersGovernments
Strict SupervisionLax Regulation
ManufacturersManufacturers
Participation in RecyclingNo Participation in RecyclingParticipation in RecyclingNo Participation in Recycling
RecyclersCompliance recyclingEnvironmental behavior a 1 = P g C g 1 S m S r S u a 2 = P g + F m C g 1 S r S u a 3 = C g 2 a 4 = C g 2
b 1 = P m 1 + E m + S m C m 1 b 2 = F m b 3 = P m 1 + E m C m 1 b 4 = 0
c 1 = P r 1 + E r + S r C r 1 c 2 = P r 2 + E r + S r C r 2 c 3 = P r 1 + E r C r 1 c 4 = P r 2 + E r C r 2
d 1 = P u 1 + S u C u d 2 = P u 1 + S u C u d 3 = P u 1 C u d 4 = P u 1 C u
Not environmental behavior a 5 = S m S r C g 3 a 6 = F m C g 1 S r C g 3 a 7 = C g 2 a 8 = C g 2
b 5 = E m + S m C m 1 b 6 = F m b 7 = E m C m 1 b 8 = 0
c 5 = E r + S r C r 1 c 6 = E r + S r C r 2 c 7 = E r C r 1 c 8 = E r C r 2
d 5 = 0 d 6 = 0 d 7 = 0 d 8 = 0
Non-compliant recyclingEnvironmental behavior a 9 = P g + F r C g 1 S u S m a 10 = F m + F r C g 1 a 11 = C g 2 a 12 = C g 2
b 9 = P m 2 + E m + S m C m 2 b 10 = F m b 11 = P m 2 + E m C m 2 b 12 = 0
c 9 = F r C r 3 c 10 = F r C r 3 c 11 = C r 3 c 12 = C r 3
d 9 = P u 1 + S u C u d 10 = 0 d 11 = P u 1 C u d 12 = 0
Not environmental behavior a 13 = F r S m C g 1 C g 3 a 14 = F m + F r C g 1 C g 3 a 15 = C g 2 a 16 = C g 2
b 13 = E m + S m C m 2 b 14 = F m b 15 = E m C m 2 b 16 = 0
c 13 = P r 3 F r C r 3 c 14 = P r 3 F r C r 3 c 15 = P r 3 C r 3 c 16 = P r 3 C r 3
d 13 = P u 2 d 14 = P u 2 d 15 = P u 2 d 16 = P u 2
Table 2. Stability analysis of equilibrium solutions.
Equilibrium PointEigenvalue
( λ )
SignStabilityEquilibrium PointEigenvalue
( λ )
SignStability
1 , 1 , 1 , 1 λ 1 = C g 1 C g 2 P g + S m + S r + S u xESS 0 , 1 , 1 , 1 λ 1 = C g 2 C g 1 + P g S m S r S u xESS
λ 2 = C m 1 E m F m P m 1 S m - λ 2 = C m 1 E m P m 1 -
λ 3 = C r 1 C r 3 E r F r P r 1 S r - λ 3 = C r 1 C r 3 E r P r 1 -
λ 4 = C u P u 1 S u - λ 4 = C u P u 1 -
( 1 , 0 , 1 , 1 ) λ 1 = C g 1 C g 2 F m P g + S r + S u xUnstable 0 , 0 , 1 , 1 λ 1 = C g 2 C g 1 + F m + P g S r S u xUnstable
λ 2 = E m C m 1 + F m + P m 1 + S m + λ 2 = E m C m 1 + P m 1 +
λ 3 = C r 2 C r 3 E r F r P r 2 S r - λ 3 = C r 2 C r 3 E r P r 2 -
λ 4 = C u P u 1 S u - λ 4 = C u P u 1 +
1 , 1 , 0 , 1 λ 1 = C g 1 C g 2 F r P g + S m + S u xUnstable 0 , 1 , 0 , 1 λ 1 = C g 2 C g 1 S m + F r + P g S u xUnstable
λ 2 = C m 2 E m F m P m 2 S m - λ 2 = C m 2 E m P m 2 -
λ 3 = C r 3 C r 1 + E r + F r + P r 1 + S r + λ 3 = C r 3 C r 1 + E r + P r 1 +
λ 4 = C u P u 1 + P u 2 S u x λ 4 = C u P u 1 + P u 2 +
1 , 1 , 1 , 0 λ 1 = C g 1 C g 2 + C g 3 + S m + S r +Unstable 0 , 1 , 1 , 0 λ 1 = C g 2 C g 1 C g 3 S m S r -Unstable
λ 2 = C m 1 E m F m S m x λ 2 = C m 1 E m +
λ 3 = C r 1 C r 3 E r F r + P r 3 S r x λ 3 = C r 1 C r 3 E r + P r 3 x
λ 4 = P u 1 C u + S u + λ 4 = P u 1 C u +
1 , 1 , 0 , 0 λ 1 = C g 1 C g 2 + C g 3 F r + S m xUnstable 0 , 1 , 0 , 0 λ 1 = C g 2 C g 1 C g 3 + F r S m xUnstable
λ 2 = C m 2 E m F m S m x λ 2 = C m 2 E m +
λ 3 = C r 3 C r 1 + E r + F r P r 3 + S r + λ 3 = C r 3 C r 1 + E r P r 3 x
λ 4 = P u 1 C u P u 2 + S u x λ 4 = P u 1 C u P u 2 x
1 , 0 , 1 , 0 λ 1 = C g 1 C g 2 + C g 3 F m + S r xUnstable 0 , 0 , 1 , 0 λ 1 = C g 2 C g 1 C g 3 + F m S r xUnstable
λ 2 = E m C m 1 + F m + S m x λ 2 = E m C m 1 -
λ 3 = C r 2 C r 3 E r F r + P r 3 S r x λ 3 = C r 2 C r 3 E r + P r 3 x
λ 4 = P u 1 C u + S u + λ 4 = P u 1 C u +
1 , 0 , 0 , 1 λ 1 = C g 1 C g 2 F m F r xUnstable 0 , 0 , 0 , 1 λ 1 = C g 2 C g 1 + F m + F r xUnstable
λ 2 = E m C m 2 + F m + P m 2 + S m + λ 2 = E m C m 2 + P m 2 +
λ 3 = C r 3 C r 2 + E r + F r + P r 2 + S r + λ 3 = C r 3 C r 2 + E r + P r 2 +
λ 4 = P u 2 + λ 4 = P u 2 +
1 , 0 , 0 , 0 λ 1 = C g 1 C g 2 + C g 3 F m F r xUnstable 0 , 0 , 0 , 0 λ 1 = C g 2 C g 1 C g 3 + F m + F r xESS
λ 2 = E m C m 2 + F m + S m x λ 2 = E m C m 2 -
λ 3 = C r 3 C r 2 + E r + F r P r 3 + S r + λ 3 = C r 3 C r 2 + E r P r 3 x
λ 4 = P u 2 - λ 4 = P u 2 -
Note: “×” indicates that the sign (positive or negative) is uncertain.
Disclaimer/Publisher’s Note: The statements, opinions and data contained in all publications are solely those of the individual author(s) and contributor(s) and not of MDPI and/or the editor(s). MDPI and/or the editor(s) disclaim responsibility for any injury to people or property resulting from any ideas, methods, instructions or products referred to in the content.

