Article

Investigation into the Prediction of the Service Life of the Electrical Contacting of a Wheel Hub Drive

by
Markus Hempel
*,
Niklas Umland
and
Matthias Busse
Fraunhofer Institute for Manufacturing Technology and Advanced Materials IFAM, 28359 Bremen, Germany
*
Author to whom correspondence should be addressed.
World Electr. Veh. J. 2025, 16(2), 68; https://doi.org/10.3390/wevj16020068
Submission received: 17 December 2024 / Revised: 12 January 2025 / Accepted: 20 January 2025 / Published: 25 January 2025

Abstract

:
This article examines contacting by means of ultrasonic welding between a cast aluminum winding and a copper conductor of a wheel hub drive for a passenger car. The effect of thermal stress on the formation and growth of intermetallic phases (IMC) in the contact is analyzed. By using microscopy, the growth constant under the specific load conditions can be identified with the help of the parabolic time law and offer a possibility for predicting the service life of the corresponding contacts. As a result, it can be stated that the increase in electrical resistance of the present contact at load temperatures of 120 °C, 150 °C, and 180 °C does not reach a critical value. The growth rates of the IMC also show no critical tendencies at the usual operating temperatures (120 °C and 150 °C, e.g., at 150 °C = 4.59 × 10⁻⁷ μm2/s). The activation energy calculated using the Arrhenius plot of 155 kJ/mol (1.61 eV) can be classified as high in comparison to similar studies. In addition, it was found that future investigations of the IMC growth of corresponding electrical contacts should rather be carried out with electric current. The 180 °C sample series were carried out in the oven and with electric current; the samples in the oven did not show clear IMC, while the samples exposed to electric current already showed IMC under the microscope.

1. Introduction

Electric Drives are finding new applications due to the electrification of passenger transportation. To make these drives lighter and more cost-effective, a cast aluminum winding can be used. The weight reduction compared to copper is advantageous for the tire-sprung masses of a wheel hub drive. The development focus here is on service life, reliability, and increasing the power density of the corresponding drives. One way of making the drive smaller, and thus increasing the volumetric power density, is to use copper in the interconnection. Due to the possible current density and the necessary air gap distances compared to aluminum, the surrounding system, e.g., housing, can be built smaller. Contacting with copper is generally necessary in a vehicle, as copper cables are usually used [1]. The aging mechanism discussed in this publication, which is mainly determined by the joining technique and the application conditions, is interdiffusion. The formation of intermetallic phases between an electrical contact of copper and aluminum is solely related to the contact and can already be generated during joining. When using an electric drive with a cast aluminum coil, contact with a copper conductor is one of the most important factors for the reliability of the drive due to known aging mechanisms through the formation and growth of intermetallic phases (IMC) in connection with the increase in electrical resistivity.
In preliminary investigations, ultrasonic welding was identified as the favored joining process for the contacting task at hand due to its very good joining results and its tool geometry. The diffusion mechanisms between aluminum and copper can vary due to the manufacturing process [2], making it appear to be necessary to investigate the ultrasonically welded joint in the application of a traction drive. The connection should be designed as an overlap connection to ensure a large joining area. In the planned application of electrical contacting of a wheel hub drive, peak temperatures of a maximum 180 °C are permissible at the end winding, which is limited due to the insulation system. The insulation is specified to insulation class H in accordance with DIN EN 60085. The maximum operating temperature of the winding is 150 °C, and the normal operating temperature is 120 °C. For these temperatures, a service life prediction must be determined based on the growth kinetics of the intermetallic phases and the resulting electrical resistance in order to ensure the long-term functionality of the wheel hub drive.
There are several scientific publications that describe corresponding investigations on copper–aluminum compounds. M. Oberst et al. describe bolted connections that they heated up to 200 °C in 30 K steps in an oven and compared the electrical resistivity with the values before aging [3]. A. Elkjaer et al. produced butt welds using special friction stir welding and aged them at 200 °C, 250 °C, and 350 °C for 1000 h. The growth rate of the IMC was then determined and compared with the existing literature [4]. Ultrasonically welded copper–aluminum compounds were investigated in [5,6,7], and their activation energy and growth rate were determined. However, these investigations were carried out on small copper wires with wire diameters of, e.g., 20.32 µm [5], 50.8 µm [6], and 2 µm [7], which were bonded to aluminum layers. In these investigations, the samples were aged at 250 °C, and, subsequently, the growth rate was determined. H.J. Kim et al. showed a growth rate of 6.833 × 10 14 cm2/s [7], and H. Xu et al. calculated the growth rate on the basis of his studies with 2.46 × 10 17 m2/s [6]. In comparison to the planned contacting, the identified publications were carried out with different materials or their states, different sample production methods, different aging holding times, and different load temperatures. Funamizu and Watanabe already wrote in 1970 that “Intermediate phases can be formed in a diffusion zone in many different ways” [8]. S. Pfeifer also presented the different results in relation to the IMC in her work. She shows that the electrical resistivity and phase widths resulting from different joining processes after joining are not the same [2]. The overview compiled by Elkjaer et al. from 2022, which describes the various investigations of the diffusion properties of copper–aluminum compounds of different joining processes and the resulting growth kinetics, shows a similar situation [4]. With regard to growth rate and the electrical resistivity, the results show a need for individual investigation for planned contacting in order to make it work reliably. Following this train of thought, the main objective of this work is to record the increase in electrical resistance at typical operating temperatures of an electric traction drive. Based on practical investigations, which are carried out very close to the application with regard to the samples and thermal aging, a basic statement on the usability of the electrical contacting of cast aluminum windings is to be made. A comparison between thermal aging using electric current and the oven should improve the validity of future investigations. IMC formation and growth are to be determined in order to evaluate the influences of this aging mechanism in relation to the increase in electrical resistance. The investigations are intended to provide an opportunity to expand innovative technology concepts for electric traction drives for passenger transportation. In the present case, the contacting of the cast aluminum winding represents a novelty worthy of investigation. The identification of the activation energy of intermetallic phases of the contacting can be used to predict aging in use. If the electrical resistance and mechanical stability requirements are known, aging can be predicted by recording the contacting temperature during the use of such a drive using the activation energy values described in this publication.

2. Materials and Methods

In the planned investigation, the entire IMC is to be analyzed, i.e., the individual phases, their thickness, and the specific electrical resistivity are not considered, but the overall width of the IMC and the change in the electrical resistance of the contacting. For the investigation, the ultrasonically welded samples are to be heated to 180 °C both in the oven and with an electric current, and are to be held for 48 h, 120 h, and 240 h. This should enable a comparison of the accelerated thermal aging of the electrical contacting of a traction drive. In further investigations, the described operating temperature of 120 °C and maximum operating temperature of 150 °C are to be set by means of an electric current for the specified holding times. Finally, samples are to be subjected to an electrical current in endurance tests at an operating temperature of 120 °C for 30 days. The change in electrical resistance and the formation and width of the intermetallic phases are to be recorded as a quality criterion using microscope images and a scanning electron microscope (SEM). The data obtained are then evaluated for their criticality.

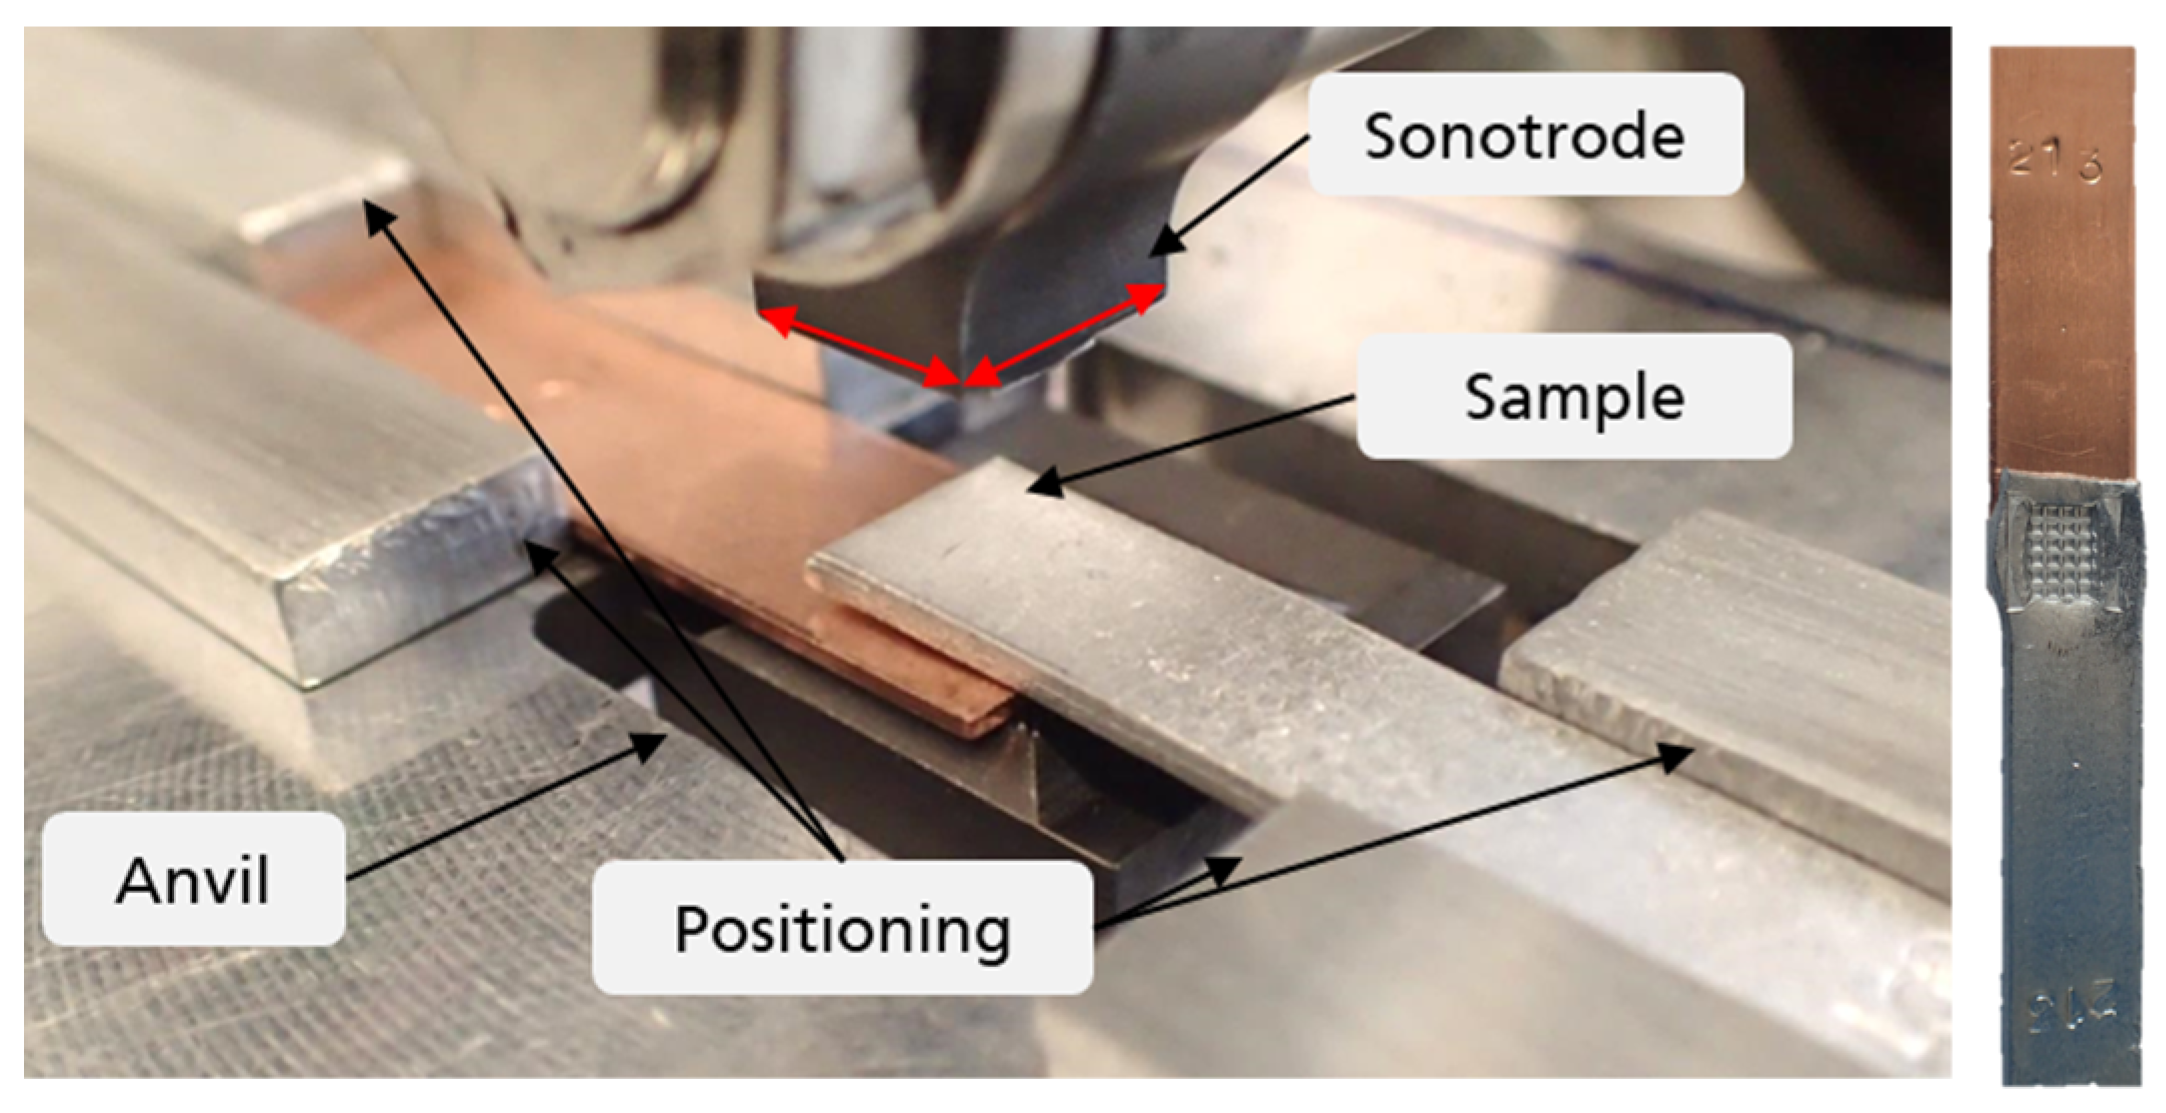
2.1. Sample Preparation

For sample preparation, the cast aluminum coil is to be contacted with a formed copper conductor. An ultrasonic welding system from BRANSON L20 with 20 kHz and 4.0 kW power is used [9], which has a probe size of (4 × 6) mm you can see in Figure 1 the red arrows. The joint was made in an overlap joint, and the samples were positioned using stops to ensure reproducibility and to ensure that the respective material proportions of the base materials were the same in the subsequent measurement. The more ductile material was turned towards the sonotrode for better coupling of the vibration during ultrasonic welding. The sonotrode acted on the more ductile material (aluminum). The parameter set used for welding had an energy of 500 J, an amplitude of 52 µm, and a welding pressure of 0.124 N/mm2. The following Figure 1 shows the sample production.

2.2. Materials

As already mentioned, aluminum coils are manufactured by casting. The coils are tapered towards the inner diameter to increase the groove filling. For this purpose, the conductors at the slot base are rather flat and wide, whereas the conductors at the tooth head are rather high and narrow. In this application, the conductor ends for contacting vary in a range from 0.8 mm to 1.3 mm in height and from 7.15 mm to 9.6 mm in width due to the casting process. Due to the variable geometry of the sample, the dimensions of each sample were measured to calculate the specific electrical resistivity. To produce the samples, approximately 40 mm long conductor ends are cut from the individual coil to produce simple flat conductors. The physical properties of the aluminum material are shown in the following Table 1.
To obtain more accurate results, the tensile strength, yield strength, and electrical resistivity of the aluminum after casting are measured. Differences between the measured values and the material’s specifications show the influence of the casting process.
The copper material is a rolled strip material made of deoxidized oxygen-free copper, Cu-PHC. The copper samples are cut from a 15 m long strip into 40 mm long pieces, and thus have geometric dimensions of 0.8 mm × 10 mm × 40 mm. The following Table 2 shows the properties of the material.

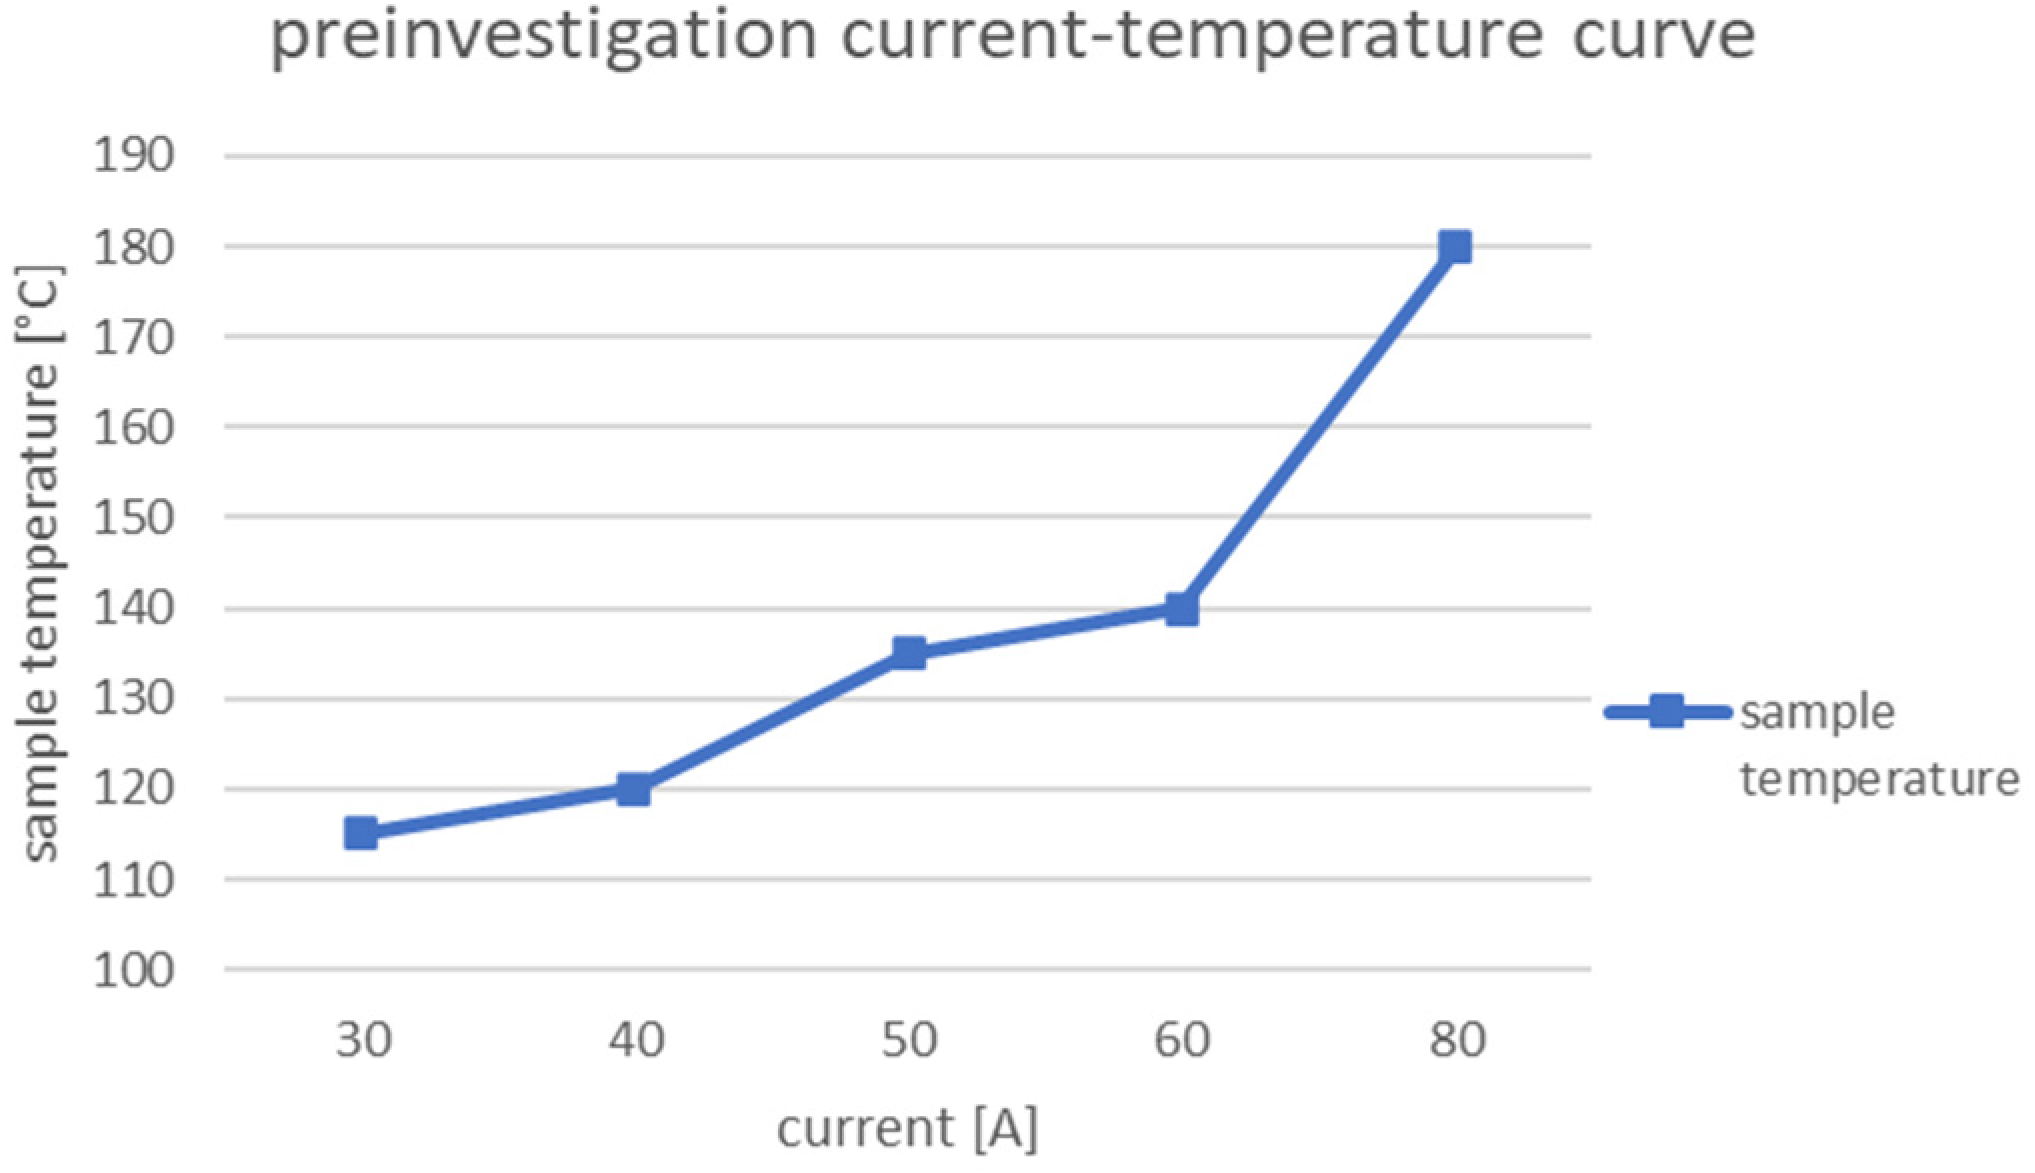
2.3. Experimental and Measurement Setup

To determine the influence of different thermal aging emulation methods, a preliminary comparison between oven treatment at 180 °C and treatment using an electric current is conducted. Tests at the maximum operating temperature (150 °C) and operating temperature (120 °C) were carried out with an electric current. The holding time is set to up to 10 days (240 h), according to DIN EN 61189-1. To identify the corresponding changes below this time, further reference points are determined after 48 and 120 h. In addition, the samples are aged at the usual operating temperature (120 °C) for 720 h. The tests were carried out in ambient air. As described in the Introduction, the tests were carried out twice with a sample batch of at least four samples, so that at lowest eight samples were produced per support point.
The electrical current test setup was established in a temperature-controlled measuring room with a constant ambient temperature of 20 °C. Temperature data were recorded using a Keysight 34970A data acquisition device (Keysight, Santa Rosa, CA, USA). During the experiments, the electrical current was kept constant, and the temperature was set at the contact point of the samples at the beginning of the experiment. The following Figure 2 shows the test setup.
In this case, four samples are connected in a series, each with a temperature sensor in the contact zone. In addition, the ambient temperature and the temperature of the supply lines are recorded. Each test series (temperature and holding time) with 4 samples is repeated at least twice in order to obtain a sufficient sample quantity of at least 8 samples. If there was a fault with a sample, e.g., destruction after aging when measuring the electrical resistance, an entire series of 4 samples was aged again, and all usable samples were measured. Thus, at least 8 samples per support point (e.g., 48 h 180 °C oven samples) were produced. The total sample quantity was 143 samples.
Preliminary tests were carried out in advance to obtain an initial estimate of the current to be set. It was found that a sample temperature of 120 °C is reached at a current of approximately 30–40 A. In preliminary tests, the sample temperature was kept constant, and the electrical current was minimally adjusted. The results are shown in the following Figure 3.
Considering the planned application of the contact, the alignment with the resulting phase current in the electric traction drive must be determined. When driving through the Worldwide Harmonized Light Vehicles Test Procedure (WLTP) with the planned wheel hub drive, an average current of 31.15 A can be determined using simulation, which corresponds to a temperature at the contact of approximately 115 °C according to the diagram shown. Abrupt increases in the electrical phase current during an acceleration phase of the vehicle or the wheel hub drive are expected, which results in a briefly increased sample temperature.
The oven tests are carried out in an electrically heated drying oven with electronic control. The temperature uniformity of the oven is ±5 °C [12]. To reduce heat conduction, the samples are placed on ceramic crucibles and a ceramic plate in the preheated oven. The test is carried out at room humidity and is not specially adjusted, so oxidation is expected. The following Figure 4 shows the samples of a series of tests in the oven.
The aged samples are subjected to various tests before and after aging for qualification purposes. The following analysis methods were used to determine the results:
  • Measurement of electrical resistance using the four-wire method based on DIN IEC 60468.
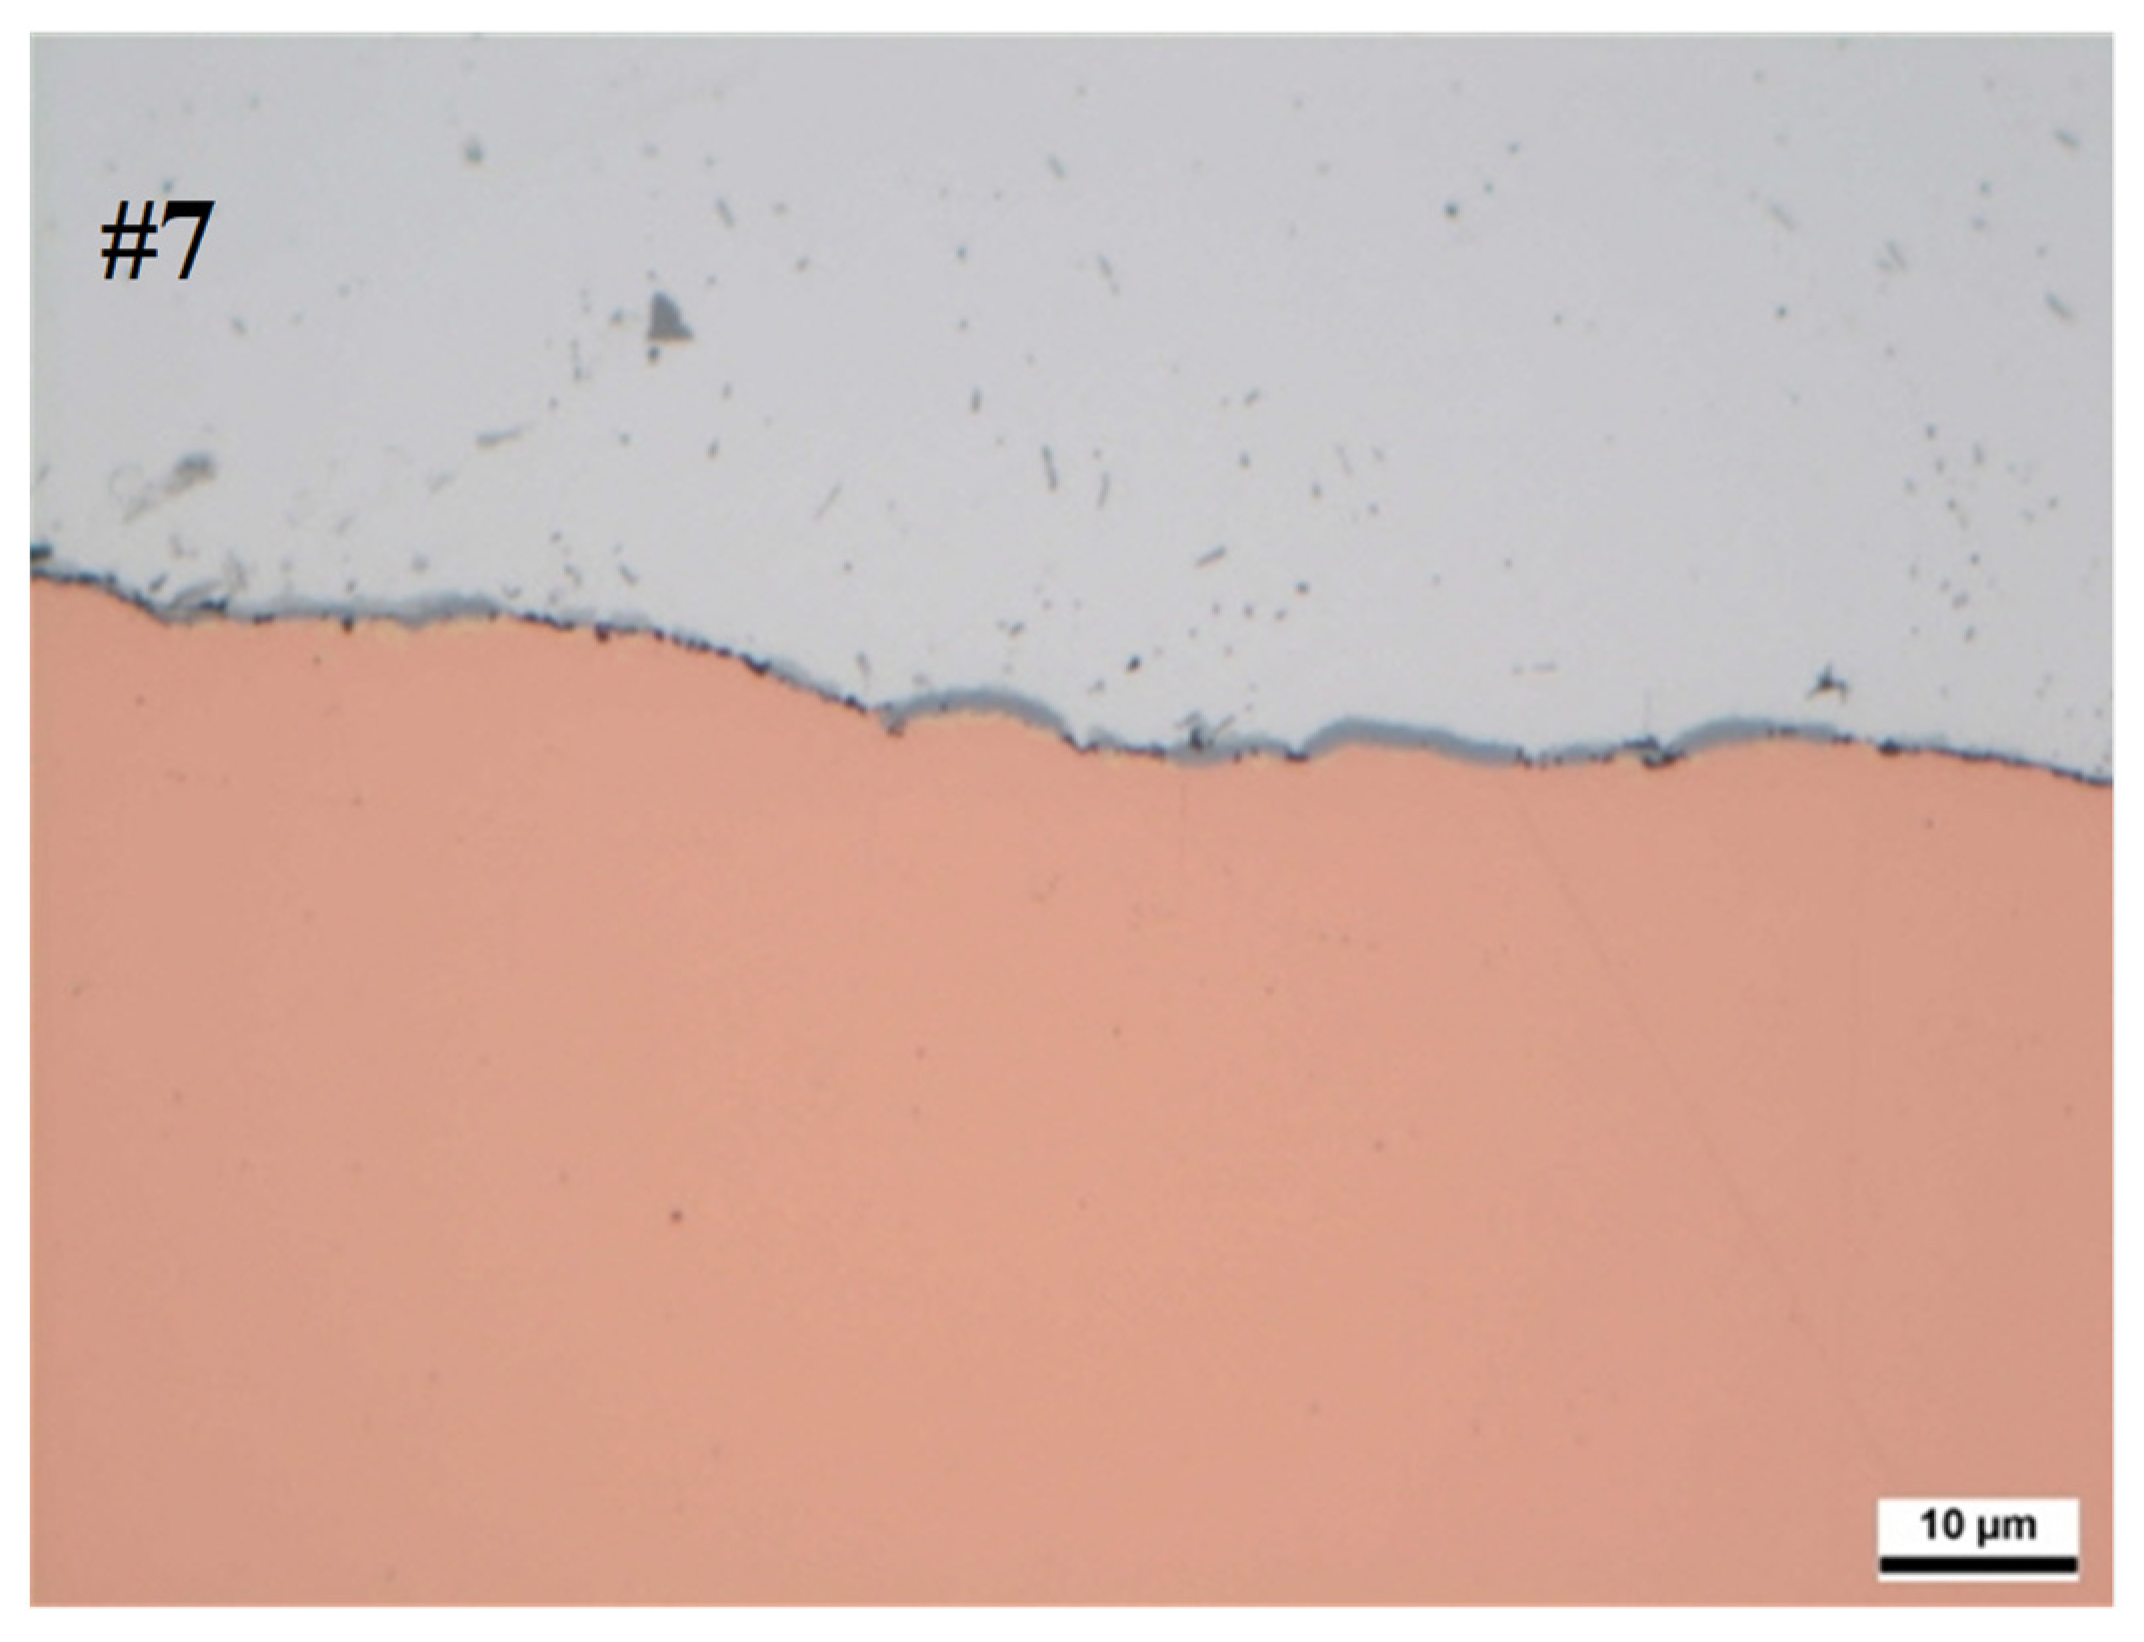
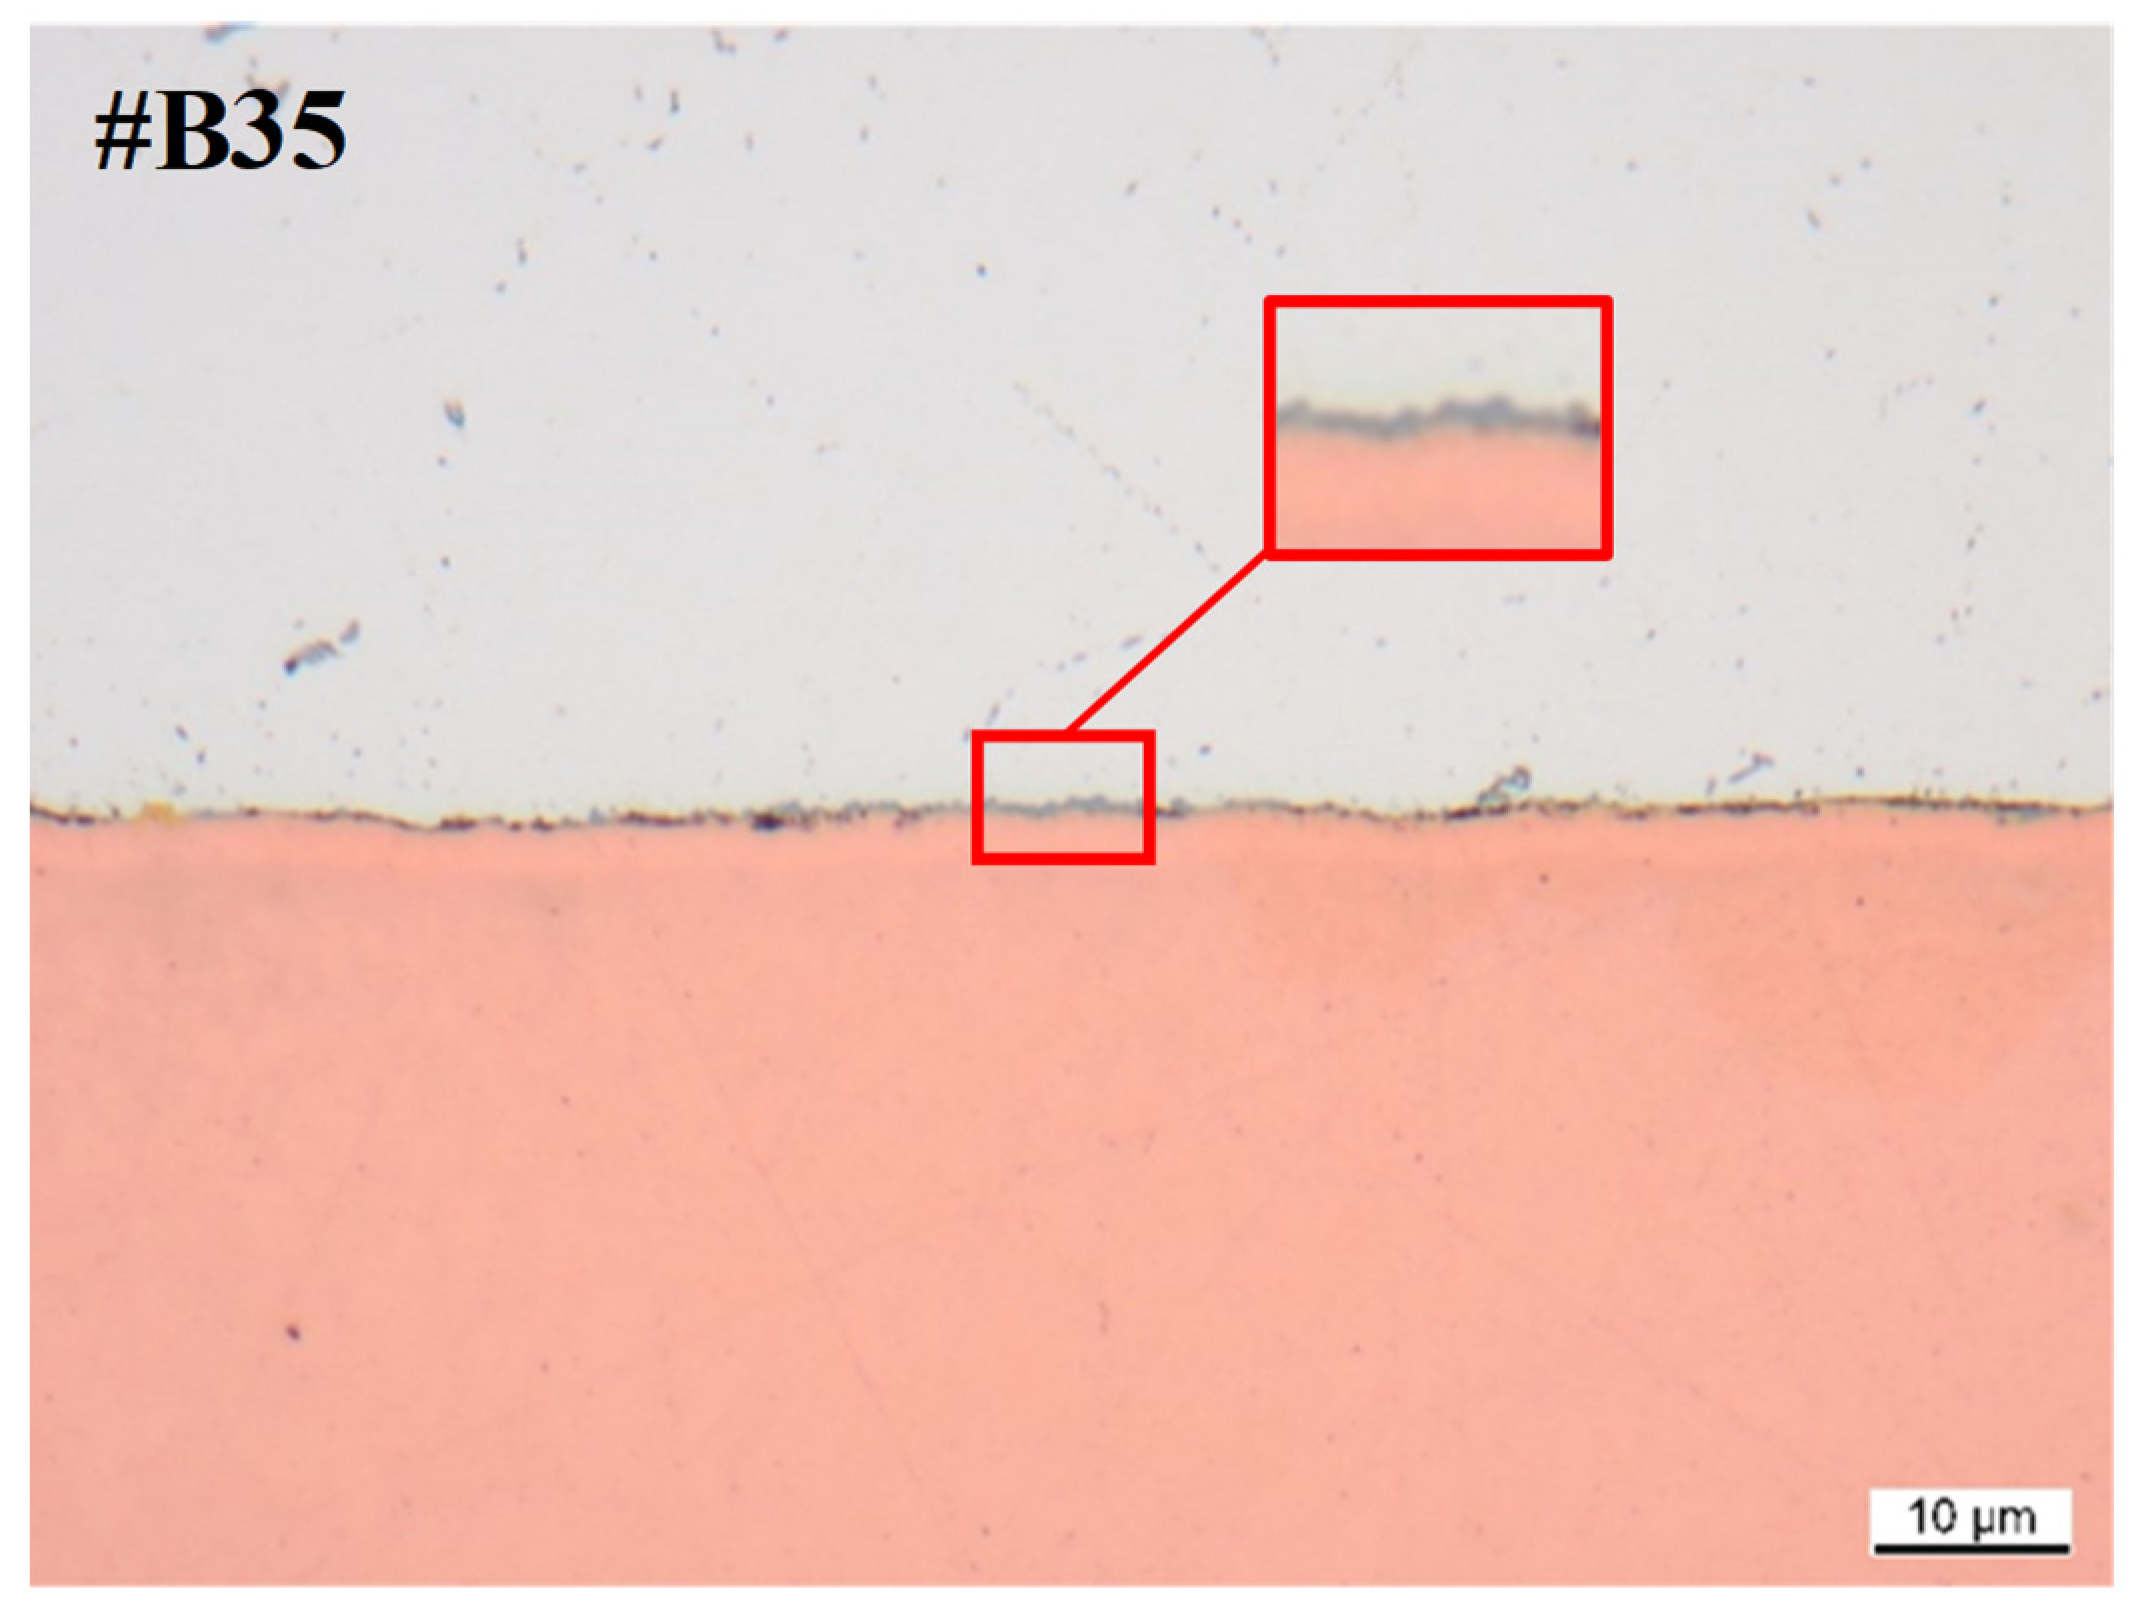
  • Micrographs and microscope images are used to identify the intermetallic phases and their width.
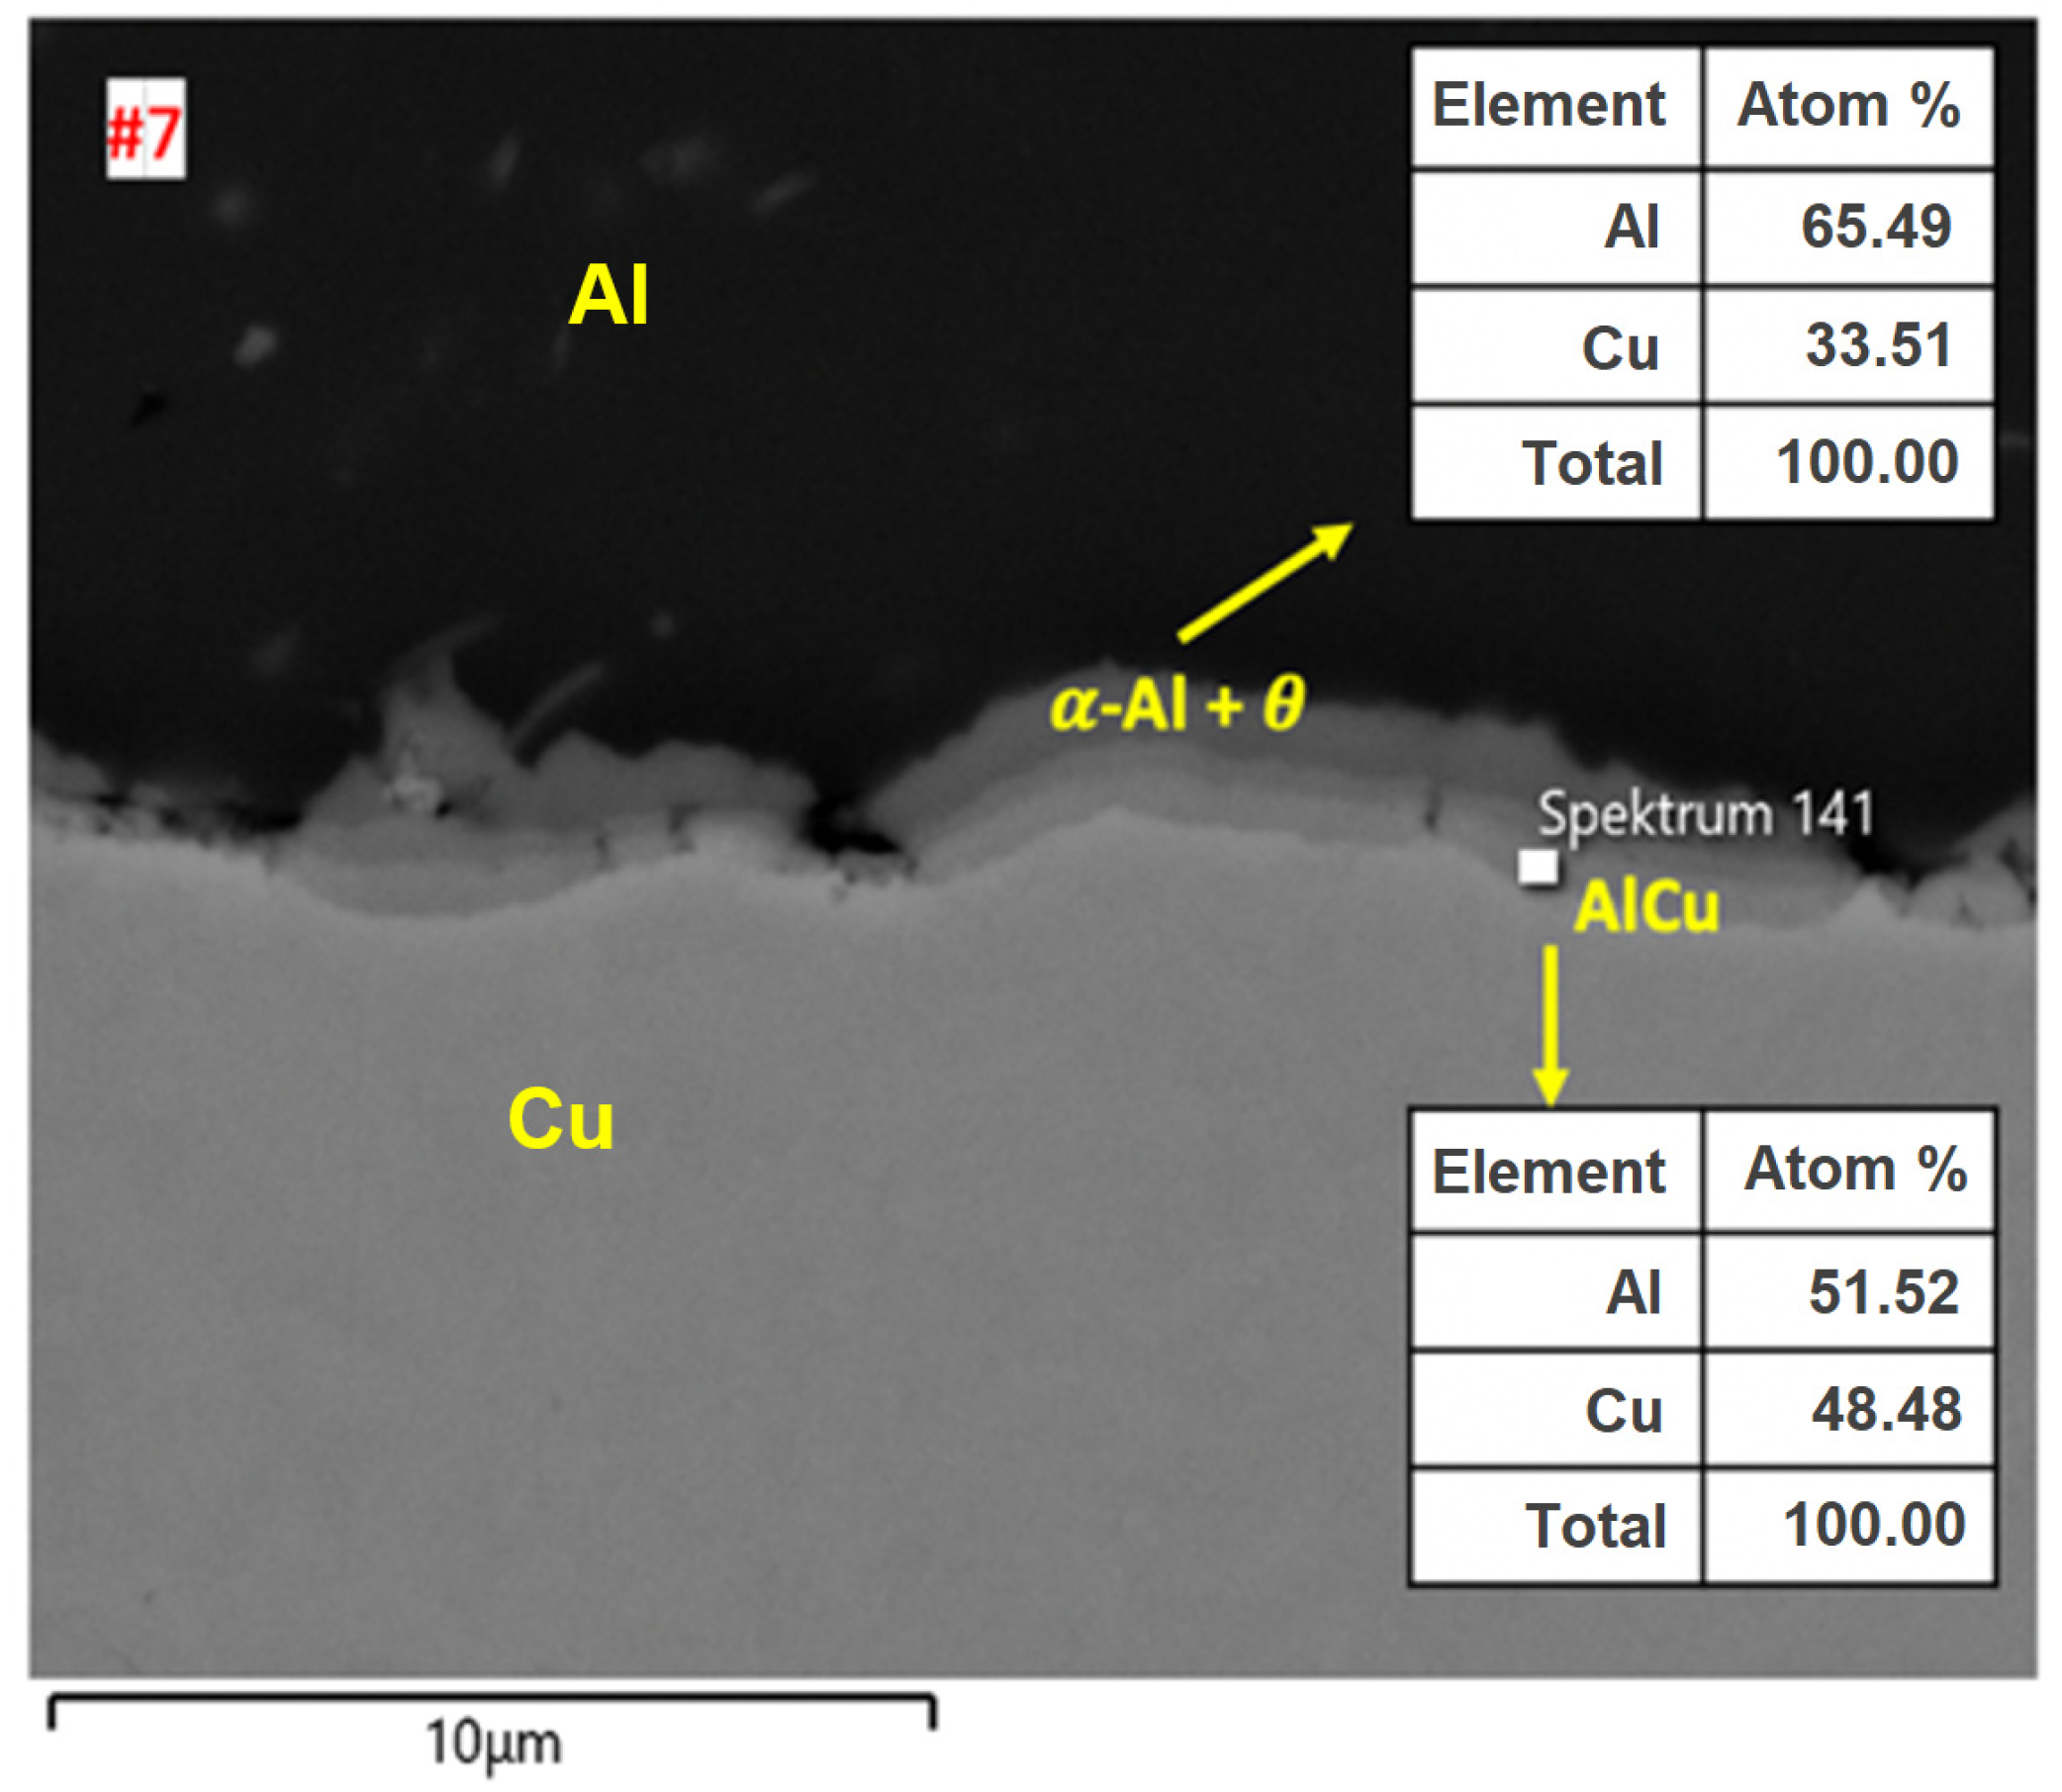
  • Images of selected samples are used with scanning electron microscope (SEM) with energy dispersive X-ray spectroscopy (EDS) to identify the phase composition.
To determine electrical resistance, the four-wire measurement setup is operated at a constant temperature of 20 °C in a measuring room. During the measurement, the sample heating is continuously recorded, and the current injection is turned off when the sample temperature reaches 23 °C. The measurements are repeated 5 times per sample, followed by a change in current direction and a further five measurements. The test current is set at 10 A, and the measuring distance for the voltage tap is set to 29 mm. There is 11 mm of base material within the measuring section, i.e., 11 mm copper and 11 mm aluminum. The measuring accuracy of the setup is ±0.05 µΩ. The following Figure 5 shows the four-wire measuring setup.
Detailed metallographic analysis is needed for microstructural characterization to investigate the formation of intermetallic phases at the weld interface and to determine the thicknesses of the interdiffusion layer. Samples were cut near the welding zone and ground to avoid unnecessary forces to the welding zone. The diameter of each embedding form is 30 mm. The cross-sections of the welding zone were prepared using SiC grinding papers with a grit size from 500 to 2000 and performed manually under water cooling. The optical microscope images were taken with Incident Light Brightfield LEICA DMRX at 500× and 1000× magnification. Lastly, scanning electron microscopy (SEM) was applied together with energy-dispersive X-ray spectroscopy (EDS) to identify the interdiffusion layers developed at the Al-Cu interface. Point analysis was performed to detect the composition of intermetallic compounds.

3. Results

The first section compares the results of the samples that were thermally aged at 180 °C in the oven and with an electric current. This should clarify the significance of the results in relation to the application.

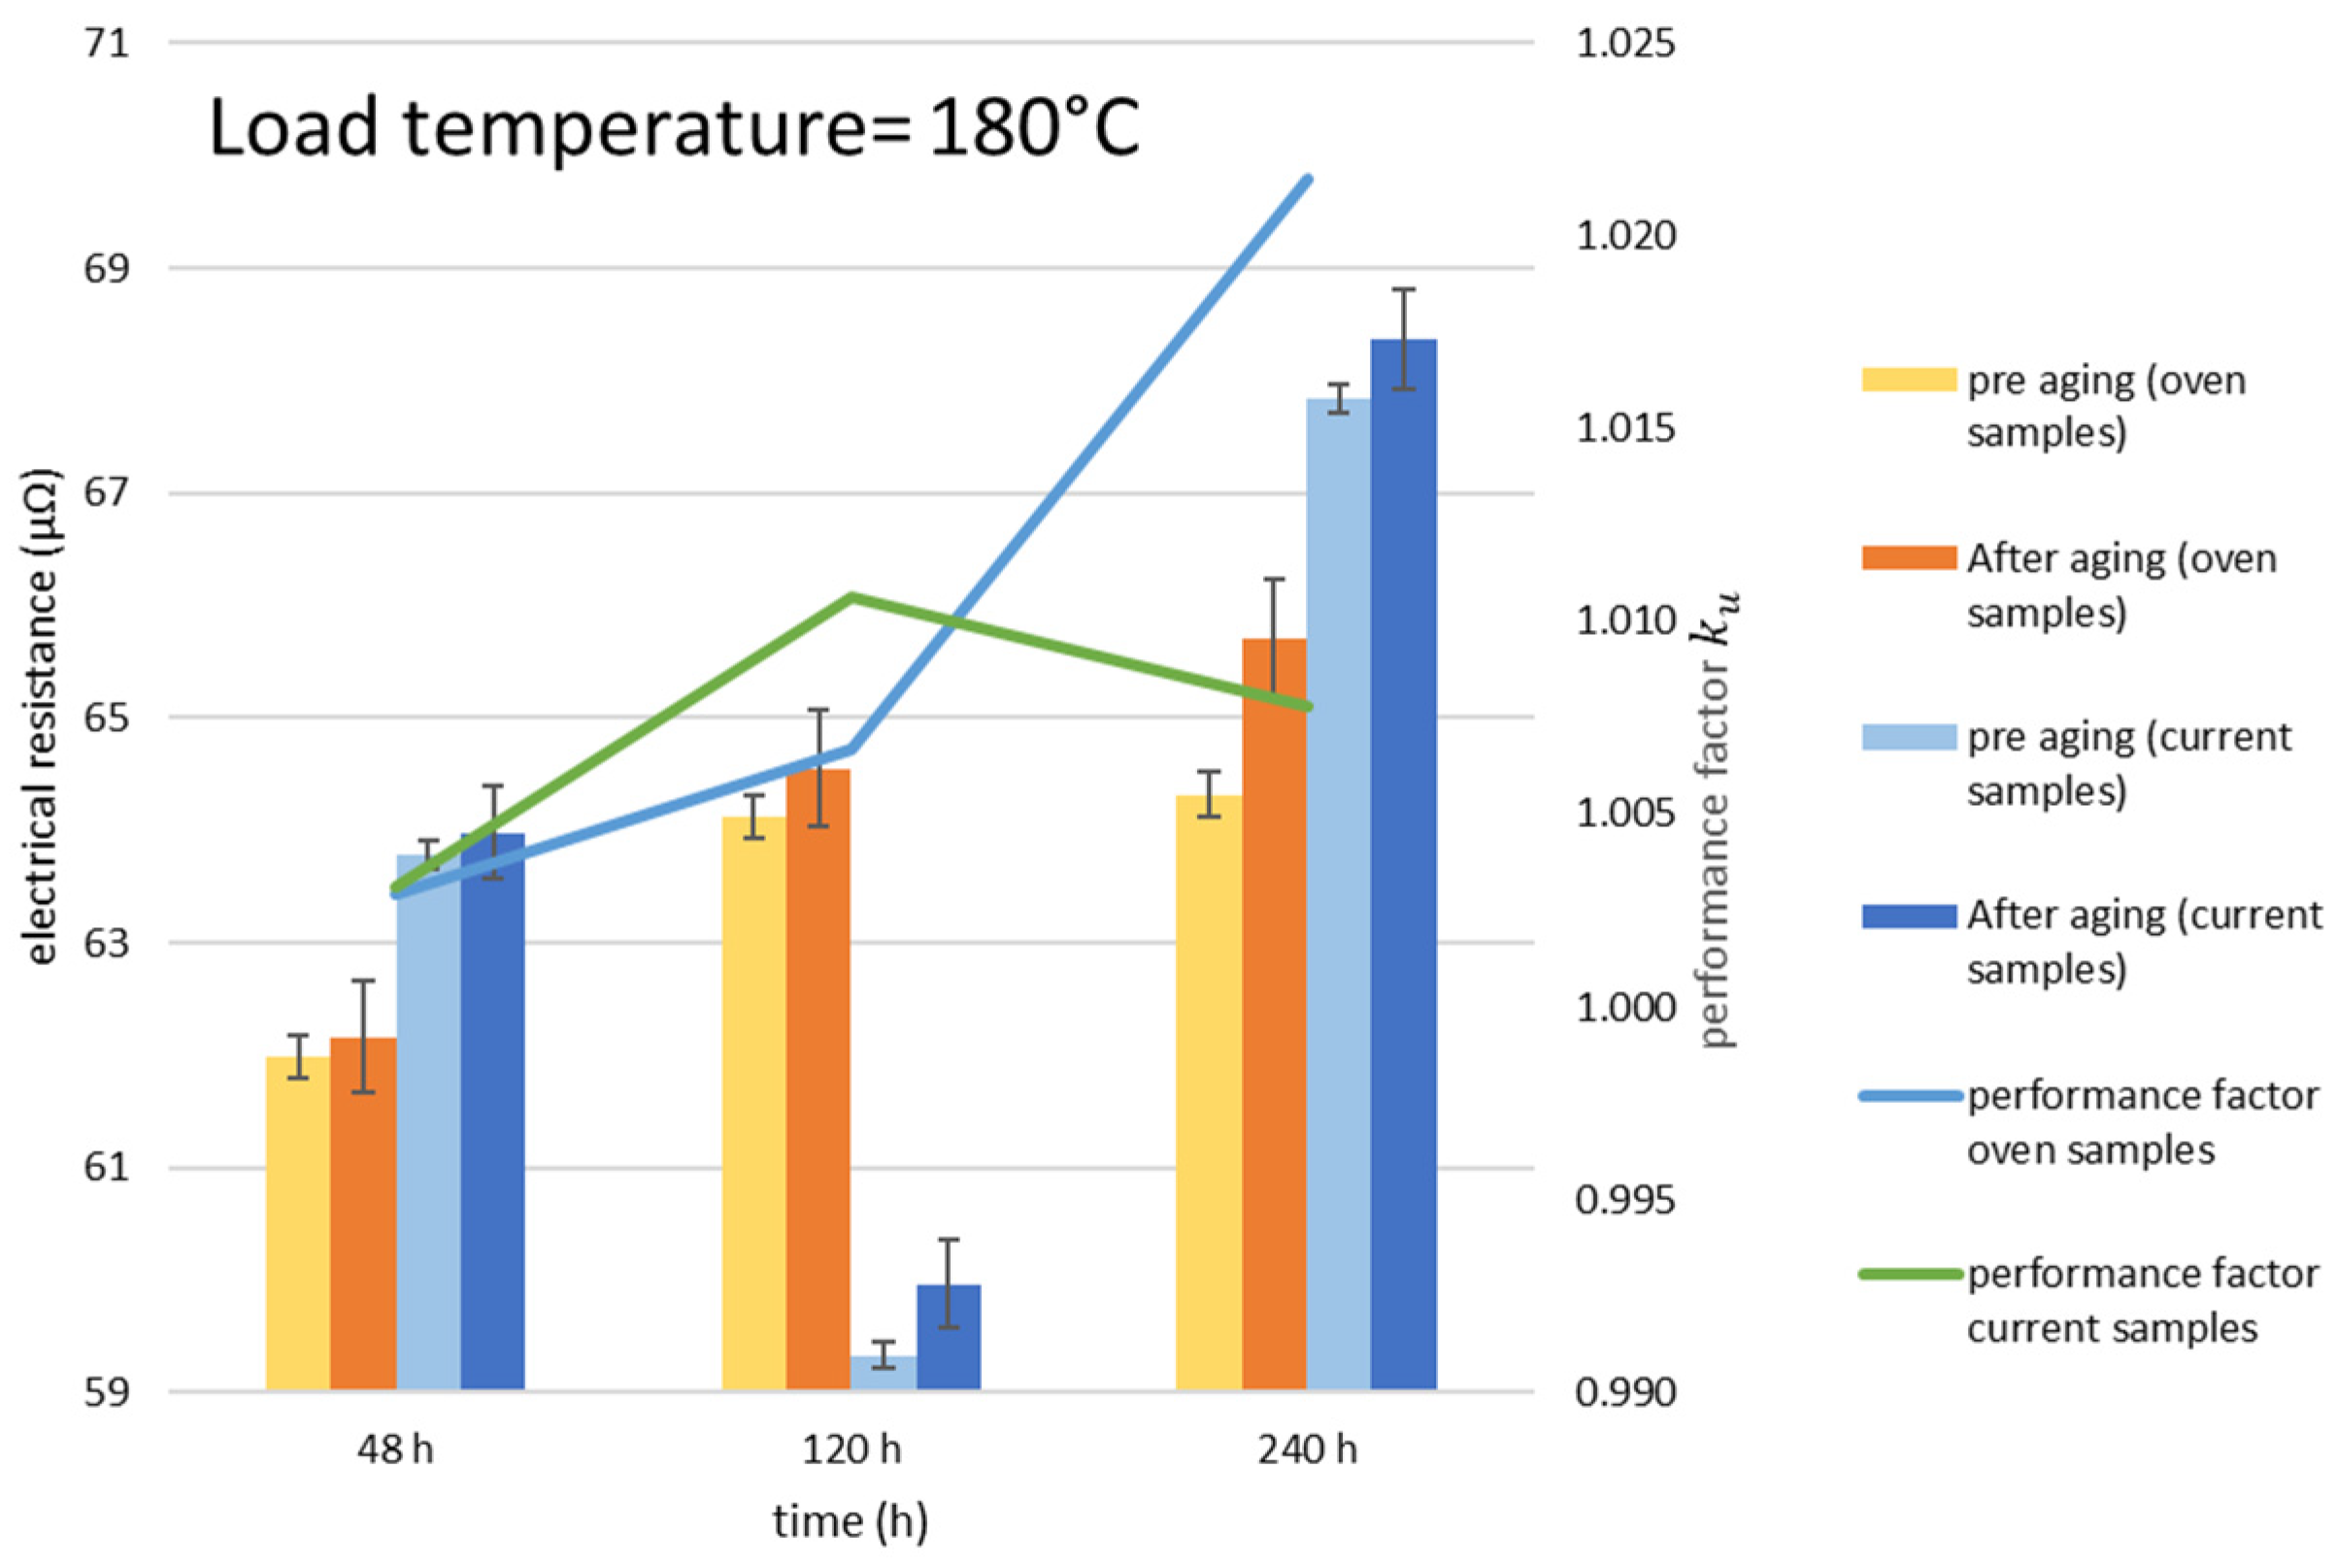
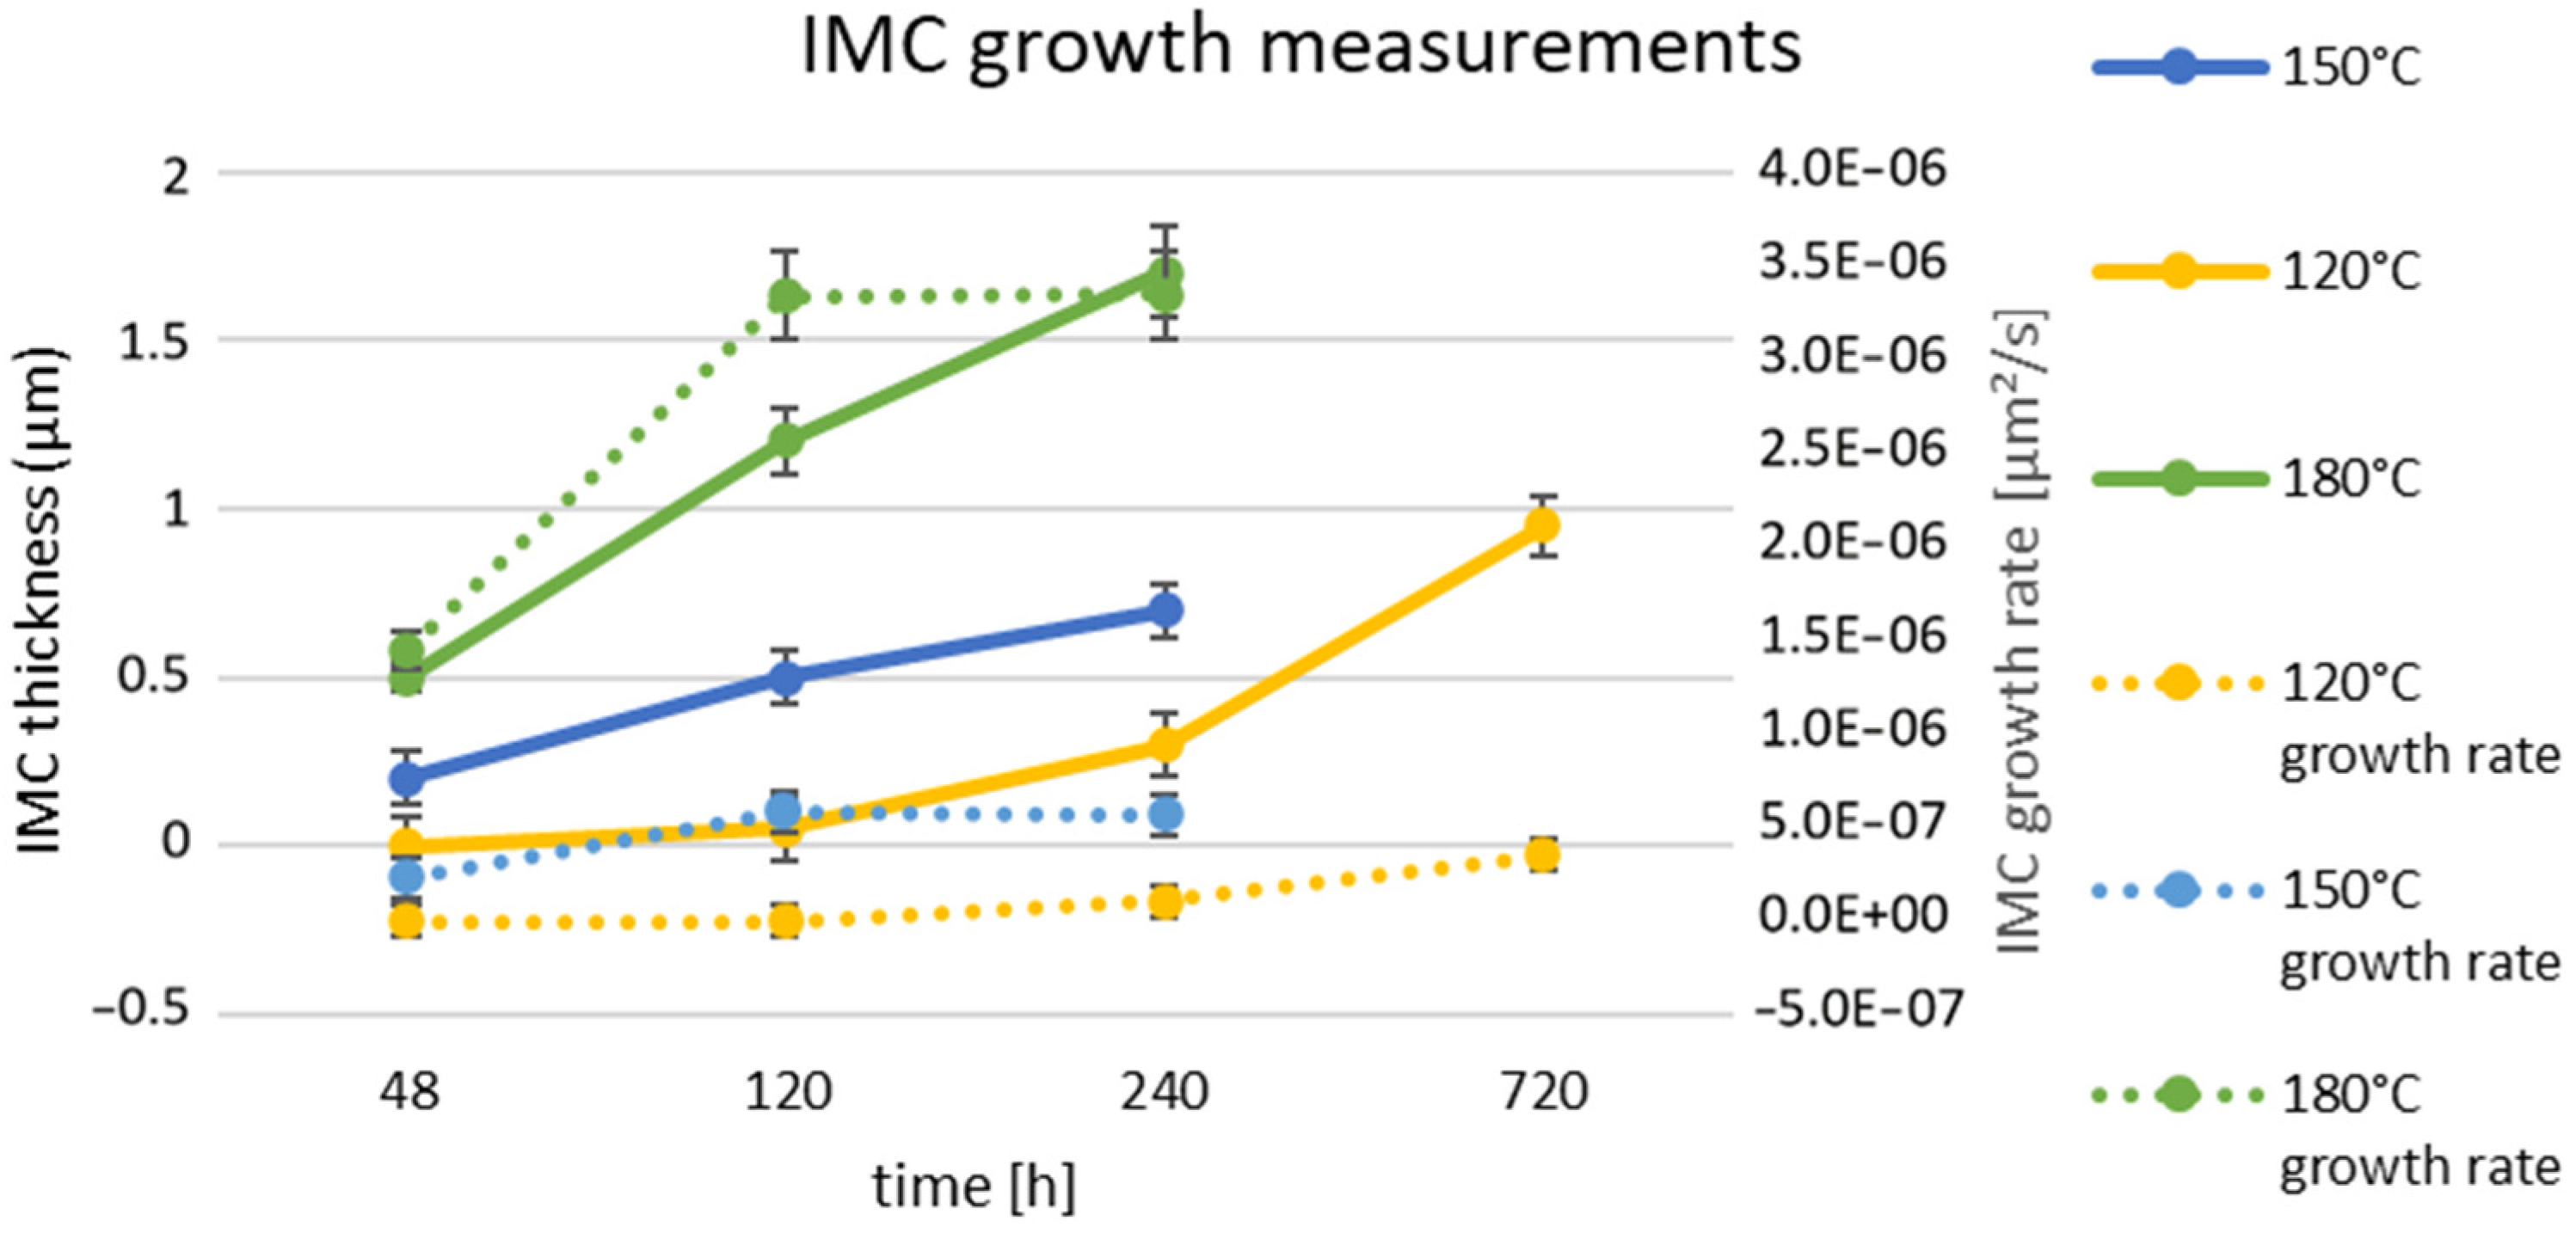
3.1. Comparison of Thermal Aging at Maximum Temperature 180 °C

All samples showed an average increase in electrical resistance during thermal aging in the oven. The longer the exposure time, the higher the resistance values. The correlation between holding time and resistance increase is linear. An increase in electrical resistance can also be observed in samples aged with an electric current, which also showed to be dependent on the holding time. In both experiments, the increase in electrical resistance is moderate. M. Oberst et al. [3] described the ratio between the aged resistance value R j o i n t and the resistance value of the sample before aging R m a t e r i a l . The so called “performance factor” k u results from the following:
k u = R j o i n t R m a t e r i a l
This has the advantage that the heterogeneous resistance values are easier to interpret in relation to themselves when comparing the sample series, which can vary due to sample production and the short measurement distance. In the following Figure 6, the changes in the electrical resistance of the samples before and after thermal aging in the oven and with electric current are shown, as well as the respective performance factors. When looking at these, only a slight increase in the resistance ratio of up to 1.02 can be recognized. This is significantly lower, compared to the investigations of M. Oberst et al. [13], where assembled copper–aluminum samples were aged at 140 °C and exhibited a factor of 5 in the comparable degradation period, e.g., at 240 h.
A. Elkjaer et al. [4] also did not show a significant increase in resistivity after aging at 200 °C, 250 °C, and 350 °C. In these investigations, Cu/Al connections were produced using a modified friction stir welding variant, which was considered to have a specific electrical resistivity of <10 µΩmm. Contacts produced in the present study have an average electrical resistivity of approximately 0.7 µΩmm after joining, which has increased to 0.75 µΩ mm due to thermal aging and is therefore negligible.
Another way to describe the quality of a lap joint is to consider the volume fractions of the base materials and their electrical conductivity [2,4]. Calculation of the so-called quality factor k makes this possible [14]. The reference conductivity κ r e f must be calculated taking into account the respective volume fractions and the reference conductivity of the base materials. κ A l is the electrical conductivity of the aluminum material used, V A l is the volume fraction of the aluminum that is included in the measurement, κ C u is the electrical conductivity from copper, and V C u is the copper volume fraction.
κ r e f = κ A l V A l V A l + V C u + κ C u V C u V A l + V C u      
The reference resistance R r e f is then calculated with l as the measuring section or conductor length, and A is the cross-sectional area of the contacting zone and the reference conductivity is κ r e f :
R r e f = 1 κ r e f · l A
If this is now related to the measured resistance value R c o n t a c t , the quality factor is calculated as follows.
k = R c o n t a c t R r e f
According to R. Bergmann [14], the quality factor can be 0.5 in the best case and up to a quality factor of 1 the joints can be rated as technically good. In the present study, quality factors from 0.52 to 0.65 were generated before aging. Due to thermal aging, the quality factors only increased by a value from 0.01 to 0.02. The maximum lies in the 180–240 h samples, which were aged in the oven and have a quality factor of 0.66. This series of samples already showed poorer values after joining with an average value of the quality factor of 0.64. In summary, the quality factors also show that the joint and the resulting thermal aging do not represent any significant degradation.
When examining the samples under the microscope, the samples that were aged with an electric current already show clear intermetallic phases, whereas the samples that were aged at 180 °C in the oven show no obvious IMC. Sample#7 (aged with electric current at 180 °C for 120 h) and sample#21 (aged in the oven at 180 °C for 120 h) are examples of this.
Figure 7 clearly shows a transition phase between the base materials of sample #7. This phase is not continuous at the transition of the base materials, and the width also varies. Compared to sample #21 in Figure 8, which was thermally aged for 120 h at 180 °C in the oven, this sample does not show a clear intermetallic phase. According to H.-J. Bargel and G. Schulze [15], diffusion is activated not only purely thermally, but also by the electric/magnetic fields. In the present case, the comparison of thermal aging at 180 °C showed that a difference between the two aging tests (oven vs. electric current) was already evident after 48 h. This confirms results from a study by M. Braunović [16].
When looking at the SEM images in (dark area = pure aluminum from Table 1 and light area = pure copper from Table 2) with the EDS spectrum analysis of sample #7 in Figure 9, various intermetallic phases have already formed. It shows the intermetallic compounds of AlCu η2 and α-Al + θ. Guo et al. [17] investigated intermetallic phase formation in diffusion bonded Cu/Al laminates within the temperature range of 400–500 °C for 10–30 min. They identified three intermetallic phases: Al4Cu9 γ2, AlCu η2, and Al2Cu θ. They concluded that this was due to the higher growth rate of these phases than that of Al2Cu3 δ and Al3Cu4 ζ2. In fact, the presence of IMCs is affected by several variables such as the manufacturing condition, the annealing temperature, and time.
In the spectral analysis, several areas were examined in advance, and representative areas were recorded. Analyzing several points produces a more accurate result, as it was shown in [18]. Here, the phase equilibria and composition are analyzed for a minimum of three different spots to then average the results. The authors employed the techniques of EDS and XRD (X-ray powder diffraction analyses) for phase identification. Looking at sample#21 in Figure 8, the statements about the microscope image are confirmed by the SEM images. The SEM microstructure in Figure 10 shows only a small amount of copper, which is due to the large measuring range. No clear intermetallic phase could be detected during the SEM analysis. Instead, the example shows a kind of mixing, which can also be attributed to the ultrasonic welding process. Furthermore, surface irregularities, such as brittle oxides and impurities, may exert an influence on this phenomenon. These irregularities may potentially create a secondary interface because of local detachment. Similar findings have also been observed by several authors [19,20,21]. Generally, swirl-type interlocking is accompanied by welding defects such as voids or cracks, and the number and size of voids can be increased by increasing the welding energy [19]. The measuring range of the spectrum analysis is so large that the copper components are not fully recorded, and the aluminum components are also measured, which looks like a mixture based on the values.

3.2. Test Results at Typical Operating Temperatures

In principle, an ambient temperature of 180 °C is not expected in the planned application of the contact in a traction drive, as simulated in the oven tests. Only the winding or the coil heads of the drive can generate an increased temperature at the nearby contacts, but this should be lower due to the heat transfer mechanisms than the heating caused by the electric current flowing in the contact area or the resulting power loss at the contact. In further investigations of the maximum (150 °C) and the usual operating temperature (120 °C), the samples are heated with an electric current. The reference points are again set to 48 h, 120 h, and 240 h to compare the results with previous tests. Figure 11 shows the performance factors k u of both test series. In comparison, only a slight increase of 0.01 can be observed. Comparison between the two temperature levels (120 °C and 150 °C) shows a uniform increase at the load duration of 120 and 240 h. However, the increased temperature load of 180 °C (Figure 6) does not show a clear continuation of this trend. Oberst et al. [3,13] showed, in their investigations of assembled joints, that the performance factor no longer increases as much with longer load duration, i.e., the increase in resistivity due to thermal aging is no longer as strong. The same can be observed in the present study for aging with electric current. Likewise, the electrical resistances of the test series increase negligibly low with approximations ranging from 0.1 µΩ to 0.7 µΩ. The resistance values increased slightly more at higher temperatures and longer holding times. It should be noted at this point that some samples within the sample series showed a reduction in resistance value at lower temperatures (120 °C and 150 °C) and holding times of up to 120 h. This was particularly evident in the 150 °C/48 h sample series, where the performance factor was very low as a result. This may be due to the softening of the a spots, which takes place during heating [22], and the temperature-dependent constriction resistance [23], which can be reduced after cooling.
In further investigations, a series of samples was subjected to the usual operating temperature of 120 °C for 720 h to be able to estimate the durability of the contact. For the long-term samples, an increase in electrical resistance and performance factors can be observed from Figure 11. The series of samples aged for 720 h shows higher performance factors than the samples aged for up to 240 h. A comparison of the performance factors shows a continuous increase up to 240 h of holding time. However, the performance factor for the sample series up to 720 h holding time is still very low, with a value of 1.008. The average increase in resistance was only approx. 0.7 µΩ. The comparison between 120 °C/720 h and the 150 °C/240 h sample series shows a similar performance factor, whereby reduced temperature leads to a lower increase in resistance.
Figure 7 shows the aging of sample#7 at 180 °C for 120 h with an electric current, and, as described, the first intermetallic phases can already be seen here. Compared to sample #37 in Figure 12, which was exposed to 150 °C for the same holding time of 120 h, no clear intermetallic phases can be detected. Only a slight nucleation is present.
Based on the relationship that the electrical resistance increases with the increase in IMC, the microscope image of sample #37 in Figure 12 confirms the expected result of the electrical measurements. The increase in resistance of the sample series 150 °C/120 h only shows an average increase of approx. 0.5 µΩ, which means a performance factor of 1.008. In Figure 13, sample #B35 is given as an example for 120 °C/720 h sample series. Here, the formation of a light intermetallic phase can be recognized. This can already be detected as a full surface intermediate phase. This may explain the greater increase in the performance factor compared to the 120 °C/240 h sample series.

3.3. Formation and Growth of the Intermetallic Phases Under Typical Operating Conditions

Overall, this study confirms that thermal aging increases electrical resistance and that stronger intermetallic phases form for higher temperatures and longer holding. To be able to make a statement on the functionality of the contact in the electric drive, a description of the growth of the phases is to be carried out. The thickness of the intermetallic phases should be used for this purpose. As described, IMC can be detected in the 180 °C samples after a short holding time. However, at a lower load temperature, e.g., 120 °C, they did not occur after the shorter load time. A lower temperature and longer holding time (e.g., 120 °C/720 h) led to the formation of IMC. A. Elkjaer et al. [4] also found, in his investigations, that the growth rate is higher at higher load temperatures. The parabolic growth law should be used to calculate the growth rates based on the thickness of the IMC. The thickness of the interdiffusion layer was measured using SEM.
d I M P = k I M P T · t
d I M P (µm) is the thickness of the intermetallic phase, t(h) is the holding time, and k I M P (µm/h) is the growth rate. In Figure 14, the IMC thickness can be read from the holding time for the respective load temperatures. As already described, the lower load temperatures (120 °C and 150 °C) show low thicknesses of the intermetallic phases. On the contrary, the samples exposed to the maximum tolerable temperature (180 °C) already show a clear, continuous IMC layer with an average thickness of 0.5 µm after 48 h, which increases to 1.7 µm after 240 h as the exposure time continues. The 120 °C samples show an IMC thickness of 0.95 µm after a holding time of 720 h.
The growth rate calculated using the parabolic growth law decreases with increasing holding time at higher temperatures (180 °C and 150 °C). This can be explained by the decreasing concentration gradient over time, as the atoms strive for thermodynamic equilibrium and distribute themselves more evenly over time. The formed IMC hinders this process [5]. In [4], the mean growth rate for 150 °C was reported as 2.09 × 10 8   µ m 2 / s for 3000 h holding times. Compared to the mean growth rate of 4.59 × 10 7   µ m 2 / s , in this study, a higher growth rate was observed. This may be due to the shorter duration of the test because, as already described, the growth rate decreases with a longer load duration, which results in a lower mean growth rate. Figure 15 shows the Arrhenius plot of the investigations.
The slope can be used to calculate the activation energy of the IMC, which is 155 kJ/mol (1.61 eV) in the present study. With m as slop, Q as the activation energy, and R as the universal gas constant R = 8.314 J/(mol · K ) ,
m = Q R     Q = ( m · R )
In comparison with similar investigations (similar loading temperature or similar contacting variant) e.g., 151.6 kJ/mol [4], 76.1 kJ/mol [5], or 108.8 kJ/mol [7], the activation energy can be considered high, and therefore a lower IMC growth rate can be expected in comparison. The growth rates obtained for the respective temperature support point can also be used to calculate the service life.
d I M P = k I M P T · t t = d I M P 2 k I M P
If a maximum IMC thickness is specified, the time can be calculated by using (7). In the present study, the increase in electrical resistance cannot be described as borderline. As an example, the 180 °C samples, which were thermally aged for 240 h, showed an increase in resistance of 0.53 µΩ at a phase thickness of 1.7 µm, which means an increase of 3.53% of the electrical resistibility in relation to the contact area. The resulting electrical resistance is therefore negligibly small. To nevertheless estimate the service life of the electrical contacting, this can be calculated by setting different limiting thicknesses of the IMC. IMC thicknesses from >2 µm to 10 µm in 2 µm steps are suggested as an example for predicting service life. With these values and the values of the IMC growth rates from Figure 15, the lifetime predictions can be calculated as a function of the thermal load. The values are summarized in the following Table 3:
As described, the limit value for the IMC thickness in this application is >2 µm, and a usual application temperature of the wheel hub drive or the wiring of 120 °C shows a service life of 9.701 h until the critical value is reached. If the drive is brought to the maximum operating temperature several times during its service life, the service life is reduced by 75%. A combination of temperatures and aging is realistic, as an electric traction drive is not operated immediately and permanently at the respective temperature.

4. Discussion

Regarding the joining technology, the investigations described have shown that an ultrasonic welded joint is suitable as a joining technology for contact, as no IMC could be detected after joining, and the quality factors can be rated as good. However, the application showed that IMCs are formed under operating conditions and during prolonged loading at the usual application temperature of 120 °C. The resulting increase in resistance can be regarded as negligible in the investigation period. The same applies for the performance factor with an increase of 0.02. The further possibility of calculating the quality factor (see (4)) also shows that the maximum electrical resistance does not lead to a critical evaluation. Solchenbach et al. [24] come to the conclusion in their investigation that a significant deterioration in electrical resistance occurs due to an IMC thickness of 3–5 µm. This IMC thickness was not reached in the present investigation, but longer investigation times are useful for a lifetime analysis. The identified growth rates of the IMC and the thicknesses of the IMC, as well as the increase in electrical resistance, do not show any critical values, taking the application into account. From an electrical point of view, it can be concluded from the investigations to date that contact of the cast aluminum coil with a copper conductor formed by ultrasonic welding can withstand the loads in a wheel hub drive. The maximum IMC thickness depends on the surrounding system. The formation of the intermetallic phases makes the contact area more brittle, which can lead to breakage under mechanical stress, e.g., due to vibration. However, this can be prevented by an interconnection carrier because it supports the contacts. As shown in Section 3.2, the electrical resistance increases due to the formation of the intermetallic phases. This in turn leads to an increase in the temperature at the contact area, which results in damage to the insulation, among other things. M. Abbasi et al. [25] came to the conclusion in his investigations that an IMC thickness of >2.5 µm leads to a mechanically critical size for cold-rolled Al/Cu connections. With defined limit values of the electrical resistance and with known mechanical loads, the time until these limit values are reached can be calculated using the critical phase thickness with the values identified in this study. With defined limit values of the electrical resistance and with known mechanical loads, the time until these limit values are reached can be calculated using the critical phase thickness with the values identified in this study. If the limit values of Solchenbach et al. 3 µm [24] for the electrical resistance and M. Abbasi et al. 2.5 µm [25] for the mechanical load are used, using (7), the worst case can be calculated with the maximum operating temperature of 150 °C and with the growth rate k I M P = 4.59 × 10 7 µ m 2 / s :
t = d I M P 2 k I M P
Limit of Electrical resistance, with d I M P = 3 µm → t R   m a x .   = 5446.6 h.
Limit of mechanical load, with d I M P = 2.5 µm → t F S   m a x . = 3782.4 h.
In this worst-case scenario, the use of the electric drive as a tire-sprung wheel may be critical. But in the present investigation, the relationship between the increase in electrical resistance and the resulting IMC thickness is not so serious. Using the growth rate k I M P = 1.15 × 10 7 µ m 2 / s from the normal operating temperature of 120 °C, we obtain the following:
Limit of Electrical resistance, with d I M P = 3 µm → t R   m a x .   = 21,827.4 h.
Limit of mechanical load, with d I M P = 2.5 µm → t F S   m a x . = 15,157.9 h.
According to the current investigation, the correlation between the IMC thickness and the electrical resistance means that no critical value can be identified for use in a wheel hub drive. However, the thicknesses of the intermetallic phases of these described limits are so close to each other that they depend strongly on the analysis method and have a very large effect on the prediction results. It could be shown that the electrical performance of the contacting in an electric traction drive is suitable as a wheel hub drive. Thus, the deterioration in the mechanical properties due to the thermal degradation of such a connection needs to be investigated. Further studies should investigate the relationships between the thermal load, IMC thickness, and their effects on the mechanical resistance of the connections. These are very strongly dependent on the surrounding system of the mechanical connection of the interconnection, e.g., the use of an interconnection ring carrier, so this should already be known.

5. Conclusions

Investigations of the accelerated thermal aging of electrical contacts in traction drives should be carried out using an electric current, as IMC growth occurs more quickly compared to exposure in an oven. Ultrasonically welded connections between Cu/Al did not show IMC after joining, but this occurs from 120 h onward under continuous load at typical operating temperatures of 120 °C. A critical increase in electrical resistance due to thermal degradation with the application temperatures of 120 °C, 150 °C, and 180 °C is not recognizable after 240 h.
The growth rates decreased after 120 h in the tests with increased temperature (150 °C and 180 °C). At 155 kJ/mol, the activation energy of the IMC can be considered high compared to similar studies.

Author Contributions

Conceptualization, M.H.; Methodology, M.H.; Validation, M.H. and M.B.; Formal analysis, M.H. and N.U.; Investigation, M.H.; Data maintenance, M.H.; Writing—creation of original draft, M.H.; Writing—review and editing, N.U. and M.B.; Visualization, M.H.; Monitoring, M.B.; Project management, M.H. All authors have read and agreed to the published version of the manuscript.

Funding

This research received no external funding.

Data Availability Statement

We confirm that the manuscript complies with the editorial and ethical guidelines of the MDPI. The procedure and the generation of results comply with industry-recognized standards. All necessary data for the traceability of the results are included in the report. Detailed information can be provided on request, as the data is available within the Fraunhofer-Gesellschaft.

Conflicts of Interest

The authors declare no conflict of interest.

References

  1. Reske, K. Langzeitverhalten von Schweißverbindungen mit Aluminiumleitungen für Hybrid- und Elektrofahrzeuge. Ph.D. Thesis, Technische Universität München, München, Germany, 2015. [Google Scholar]
  2. Pfeifer, S. Einfluss Intermetallischer Phasen der Systeme Al-Cu und Al-Ag auf den Widerstand Stromtragender Verbindungen im Temperaturbereich von 90 °C bis 200 °C. Ph.D. Thesis, TU Dresden, Dresden, Germany, 2015. [Google Scholar]
  3. Oberst, M.; Schlegel, S.; Grossmann, S.; Willing, H.; Freudenberger, R. Impact of the Formation of Intermetallic Compounds in Current-Carrying Connections. IEEE Trans. Device Mater. Relib. 2020, 20, 157–166. [Google Scholar] [CrossRef]
  4. Elkjaer, A.; Sørhaug, J.A.; Ringen, G.; Bjørge, R.; Grong, Ø. Electrical and thermal stability of Al-Cu welds: Performance benchmarking of the hybrid metal extrusion and bonding process. J. Manuf. Process. 2022, 79, 626–638. [Google Scholar] [CrossRef]
  5. Liu, C.-P.; Chang, S.-J.; Liu, Y.-F.; Chen, W.-S. Cu-Al interfacial formation and kinetic growth behavior during HTS reliability test. J. Mater. Process. Technol. 2019, 267, 90–102. [Google Scholar] [CrossRef]
  6. Hiu, X. Growth of Intermetallic Compounds in Thermosonic Copper Wire Bonding on Aluminum Metallization. J. Electron. Mater. 2009, 2010, 124–131. [Google Scholar]
  7. Kim, H.-J.; Lee, J.Y.; Paik, K.-W.; Koh, K.-W.; Won, J.; Choe, S.; Lee, J.; Moon, J.-T.; Park, Y.-J. Effects of Cu/Al intermetallic compound (IMC) on copper wire and aluminum pad bondability. IEEE Trans. Comp. Packag. Technol. 2003, 26, 367–374. [Google Scholar] [CrossRef]
  8. Funamizu, Y.; Watanabe, K. Interdiffusion in the Al-Cu System. Sendai, September 22, 1968. In Proceedings of the Autumn Meeting of the Japan Institute of Metals, Sendai, Japan, 22 September 1968; Available online: https://www.jstage.jst.go.jp/article/matertrans1960/12/3/12_3_147/_pdf/-char/en (accessed on 19 January 2025). [CrossRef]
  9. Branson Ultrasonics Corporation. Branson-Ultraweld-L20-Technsiches Datenblatt; Branson Ultrasonics Corporation: Brookfield, CO, USA, 2012. [Google Scholar]
  10. RHEINFELDEN ALLOYS GmbH & Co. KG. RHEINFELDEN-ALLOYS_2016_Handbuch-Hüttenaluminium-Gusslegierungen_DE; RHEINFELDEN ALLOYS GmbH & Co.: Rheinfelden, Switzerland, 2016. [Google Scholar]
  11. Aurubis AG. Werkstoff Datenblatt Cu-PHC; Aurubis AG: Hamburg, Germany, 2009. [Google Scholar]
  12. Nabertherm. Advanced Materials: Öfen und Wärmebehandlungsanlagen; Bedienungsanleitung Ofen TR1050. 2021. Available online: https://nabertherm.com/de/produkte/labor/trockenschraenke/trockenschraenke-elektrisch-beheizt (accessed on 19 January 2025).
  13. Oberst, M.; Schlegel, S.; Großmann, S. On the Aging of Electrical Joints with a Copper and an Aluminum Contact Member. In Proceedings of the Sixty-Fifth IEEE Holm Conference on Electrical Contacts, Milwaukee, WI, USA, 15–18 September 2019; IEEE: Piscataway, NJ, USA, 2019. [Google Scholar]
  14. Bergmann, R. Zum Langzeitverhalten des Widerstandes Elektrischer Stromschienenverbindungen; TU Dresden: Dresden, Germany, 1995. [Google Scholar]
  15. Bargel, H.-J.; Schulze, G. Werkstoffkunde, 10th ed.; Springer: Berlin/Heidelberg, Germany, 2008; ISBN 978-3-540-79296-3. [Google Scholar]
  16. Braunović, M.; Aleksandrov, N. Intermetallic compounds at aluminum-to-copper and copper-to-tin electrical interfaces—Electrical Contact. IEEE Trans. Comp. Hybrids Manufact. Technol. 1992, 1992, 25–34. [Google Scholar]
  17. Guo, Y.; Liu, G.; Jin, H.; Shi, Z.; Qiao, G. Intermetallic phase formation in diffusion-bonded Cu-Al laminates. J. Mater. Sci. 2011, 46, 2467–2473. [Google Scholar] [CrossRef]
  18. Ponweiser, N.; Lengauer, C.L.; Richter, K.W. Re-investigation of phase equilibria in the system Al-Cu and structural analysis of the high-temperature phase η1-Al1-δCu. Intermetallics 2011, 19, 1737–1746. [Google Scholar] [CrossRef] [PubMed]
  19. Zhao, Y.Y.; Li, D.; Zhang, Y.S. Effect of welding energy on interface zone of Al–Cu ultrasonic welded joint. Sci. Technol. Weld. Join. 2013, 18, 354–360. [Google Scholar] [CrossRef]
  20. Zhang, G.; Takahashi, Y.; Heng, Z.; Takashima, K.; Misawa, K. Ultrasonic Weldability of Al Ribbon to Cu Sheet and the Dissimilar Joint Formation Mode. Mater. Trans. 2015, 56, 1842–1851. [Google Scholar] [CrossRef]
  21. Fujii, H.T.; Endo, H.; Sato, Y.S.; Kokawa, H. Interfacial microstructure evolution and weld formation during ultrasonic welding of Al alloy to Cu. Mater. Charact. 2018, 139, 233–240. [Google Scholar] [CrossRef]
  22. Erk, A.; Schmelzle, M. Grundlagen der Schaltgerätetechnik: Kontaktglieder und Löscheinrichtungen elektrischer Schaltgeräte der Energietechnik, 1., 974; Springer: Berlin/Heidelberg, Germany, 1974; ISBN 9783642503405. [Google Scholar]
  23. Vinaricky, E. Elektrische Kontakte, Werkstoffe und Anwendungen: Grundlagen, Technologien, Prüfverfahren, 3rd ed.; Springer: Berlin/Heidelberg, Germany, 2016; ISBN 978-3-642-45426-4. [Google Scholar]
  24. Solchenbach, T.; Plapper, P.; Cai, W. Electrical performance of laser braze-welded_kommentiert. J. Manuf. Process. 2014, 16, 183–189. [Google Scholar] [CrossRef]
  25. Abbasi, M.; Karimi Taheri, A.; Salehi, M.T. Growth rate of intermetallic compounds in Al/Cu bimetal produced by cold roll welding process. J. Alloys Compd. 2001, 319, 233–241. [Google Scholar] [CrossRef]
Figure 1. Sample preparation with the ultrasonic welding system (left) and a sample (right).
Wevj 16 00068 g001
Figure 2. Experimental setup used for the accelerated aging of Al-Cu joints using an electric current.
Wevj 16 00068 g002
Figure 3. Pretest of the current–temperature correlation.
Wevj 16 00068 g003
Figure 4. Samples in the furnace for accelerated aging.
Wevj 16 00068 g004
Figure 5. Four-wire measurement setup.
Wevj 16 00068 g005
Figure 6. Change in the electrical resistance of the Cu/Al contact at 180 °C.
Wevj 16 00068 g006
Figure 7. Microscope image of the sample#7 annealed with 180 °C with electric current for 120 h.
Wevj 16 00068 g007
Figure 8. Microscope image of sample #21 annealed in the furnace with 180 °C for 120 h.
Wevj 16 00068 g008
Figure 9. EDX/spectrum analysis from sample #7 of particular points selected within the interfacial zone and the compositional range of Al and Cu in at.%.
Wevj 16 00068 g009
Figure 10. EDX/spectrum analysis of sample #21 of a specific point in the interface zone.
Wevj 16 00068 g010
Figure 11. Change in the electrical resistance of the Cu/Al contacting at 120 °C and 150 °C.
Wevj 16 00068 g011
Figure 12. Microscope image of sample#37 annealed with 150 °C with electric current for 120 h.
Wevj 16 00068 g012
Figure 13. Microscope image of the sample#B35 annealed with 120 °C with electric current for 720 h.
Wevj 16 00068 g013
Figure 14. IMC growth rate and IMC thickness.
Wevj 16 00068 g014
Figure 15. Arrhenius plot of intermetallic growth rate.
Wevj 16 00068 g015
Table 1. Material properties of aluminum AL 99.7R [10].
PropertiesUnitManufacturer ValueOwn Measurements
Melting point°C655–660
Specific electrical resistivityµΩcm2.74–2.903.06
Densityg/cm32.67
Tensile strengthN/mm280–12062
Yield strengthN/mm220–4022
Table 2. Material properties of copper Cu-PHC [11].
PropertiesUnitManufacturer ValueOwn Measurements
Melting point°C1083
Specific electrical resistivityµΩcm≥1.721.72
Densityg/cm38.94
Tensile strengthN/mm2220–260240
Yield strengthN/mm2≤14087
Table 3. Service lifetime prediction as a function of the thermal load.
Temperature of the Thermal Load
IMC Growth Rate
Limit Value of the IMC Thickness
10 µm8 µm6 µm4 µm2 µm
120 °C
1.15 × 10 7 µ m 2 / s
242,526 h155,216 h87,309 h38,804 h9701 h
150 °C
4.59 × 10 7 µ m 2 / s
60,504 h38,722 h21,781 h9680 h2420 h
180 °C
2.71 × 10 6 µ m 2 / s
10,256 h6564 h3692 h1641 h410 h
Disclaimer/Publisher’s Note: The statements, opinions and data contained in all publications are solely those of the individual author(s) and contributor(s) and not of MDPI and/or the editor(s). MDPI and/or the editor(s) disclaim responsibility for any injury to people or property resulting from any ideas, methods, instructions or products referred to in the content.

