Article

A Comparative Life Cycle Analysis of an Active and a Passive Battery Thermal Management System for an Electric Vehicle: A Cold Plate and a Loop Heat Pipe

1
Department of Energy, Interdepartmental Center for Automotive Research and Sustainable Mobility—CARS@PoliTO, Politecnico di Torino, Corso Duca degli Abruzzi 24, 10129 Turin, Italy
2
School of Architecture, Technology and Engineering, University of Brighton, Brighton BN2 4GJ, UK
*
Author to whom correspondence should be addressed.
World Electr. Veh. J. 2025, 16(2), 100; https://doi.org/10.3390/wevj16020100
Submission received: 16 January 2025 / Revised: 4 February 2025 / Accepted: 9 February 2025 / Published: 12 February 2025
(This article belongs to the Special Issue Heat Pipes in Thermal Management Systems for Electric Vehicles)

Abstract

:
This study extends beyond conventional Battery Thermal Management System (BTMS) research by conducting a Life Cycle Analysis comparing the environmental impacts of two technologies: a traditional active cold plate system and an innovative passive Loop Heat Pipe (LHP) system. While active cold plate BTMS requires continuous energy input during operation and charging, leading to significant energy consumption and emissions, the passive LHP BTMS operates without external power or moving parts, substantially reducing the climate change impact. This analysis considered two materials for LHP construction: copper and stainless steel. The results demonstrated that the LHP design achieved a 9.9 kg reduction in overall BTMS mass compared to the cold plate system. The implementation of stainless steel effectively addressed the high resource consumption associated with copper while reducing environmental impact by over 50% across most impact categories, compared to the cold plate BTMS. The passive operation of the LHP system leads to substantially lower energy usage and emissions during the use phase compared to the active cold plate. These findings highlight the potential of passive LHP technology to enhance the environmental sustainability of Battery Thermal Management Systems while maintaining effective thermal performance.

1. Introduction

In November 2019, the European Parliament declared a climate emergency, presenting in response the ’Green Deal’, an agreement encapsulating all the proposals and objectives intended to achieve climate neutrality in Europe by 2050, with an ambitious target to achieve a 90% reduction in transport-related greenhouse gas (GHG) emissions [1]. The transport sector is the largest emitter of GHG in the UK, representing 26% of the UK’s total emissions in 2021, the majority of which was from road transport [2]. Hence, this is why governments worldwide are pushing for the adoption of electric vehicles (EVs), seen as the main bet in terms of containing this emergency, with drastic measures such as a sales ban on all new cars and vans relying solely on combustion. EVs are seen as the most effective solution in the short term since by exploiting the use of batteries, they decrease our dependence on oil and reduce the emissions of greenhouse gases and other pollutants. Lithium-ion batteries were recently chosen as the go-to energy storage technical solution due to their high energy density, great versatility, and long cycle life.
The effectiveness, durability, and safe operation of lithium-ion batteries are significantly affected by their operating temperature. Studies demonstrated that in cold environments (such as −40 °C), the energy and power capacities of 18650 cells dropped dramatically to just 5% and 1.25%, respectively, primarily because the electrolyte becomes less conductive, and lithium ions struggle to move through the carbon anode [3]. This issue manifests in real-world scenarios, as illustrated by the 2012 Nissan Leaf, reporting losses of more than half its driving range when operating at −10 °C [4]. Similarly, elevated temperatures prove detrimental to battery performance. For instance, 18650 cells operated at 45 °C lose 36% of their capacity after 800 charging cycles, while those at 55 °C experience severe degradation, losing over 70% of their capacity within just 490 cycles [5]. These performance losses occur because heat causes the Solid Electrolyte Interphase (SEI) to break down and reduces the ease with which lithium ions can move through the battery. Temperature fluctuations also speed up two key aging processes: calendar aging and cycle aging. The former, which depends on storage conditions including temperature and State of Charge (SOC), progresses more rapidly as temperatures increase. The latter is influenced by both temperature and Depth of Discharge (DOD), with studies revealing that each degree increase between 30 °C and 40 °C shortens battery life by approximately two months [6]. This is because the temperature sensitivity follows Arrhenius behaviour, with reaction rates increasing exponentially with temperature. This relationship is particularly evident during high C-rate discharge cycles, where more demanding rates correspond to higher operational temperatures.
In recent years, a great number of studies have aimed at improving the performance of the Battery Thermal Management System (BTMS). An effective BTMS must deliver optimal performance across three distinct levels. At the broadest level, the entire battery pack temperature should be maintained between 25 °C and 40 °C to maximise both performance and lifespan [7]. At the intermediate level, temperature uniformity across battery modules is crucial—neighbouring cells’ temperature must not differ by more than 5 °C, as such variations create electrochemical imbalances that compromise the pack’s overall efficiency. At the smallest level, individual cells require careful thermal control, with internal temperature differentials kept within 3–5 °C to ensure optimal functioning [8]. While batteries can operate adequately at up to 50 °C, this represents a less ideal operating range, albeit acceptable [9]. For safety purposes, temperatures should never exceed 60 °C during normal operation to prevent unsafe failure scenarios such as thermal runaway, in which a self-sustained reaction is created, leading to smoke, fire, and eventually, the explosion of the cells [10].
Research on this topic is florid, with several reviews highlighting the strengths and weaknesses of the different technical solutions. Currently, only two cooling solutions are employed in vehicles available in the market: air [11] and liquid convection [12]. In the high-performance sector, like the McLaren Speedtail, immersion cooling starts to emerge, even in a couple of instances [13]. Air convection BTMS stands out for its simplicity and low cost of implementation. However, due to the air's poor thermal performance, it cannot cope with fast charging, and it is also characterised by high parasitic power due to the presence of fans. Akbarzadeh et al. proved that with the same levels of parasitic power, liquid cooling is more efficient at reducing the cells' temperature [14]. However, Chen et al. showed that with numerical optimisation, it is possible to improve the minimum temperature of the cells by more than 2 °C whilst maintaining the same inlet flow rate (and hence, the same power) [15]. Liquid convection BTMS provides high efficiency in cooling and heating but adds complexity, weight, and costs due to the number of parts involved. Rabiei et al. investigated several types of liquid cold plate microchannels, looking at the channel architectures [16]. They found out that using wavy channels and thin layers of metal foams can decrease power consumption by more than 50%. Other experimental BTMS technologies proposed by researchers worldwide but not yet employed in commercial EVs are heat pipes [17], Phase Change Material (PCM) [18], and immersion cooling [19]. The reader is referred to the cited reviews for more information.
An important distinction to be made, however, is between active and passive systems. Active indicates the need for an external energy source, such as electricity, to remove excess heat (e.g., forced liquid and air convection); passive ones exploit thermodynamic principles to remove the excess heat without the need for any additional power or moving part.
The authors of this study identified that research has been focusing on the thermal performance only of these BTMSs, without taking into account the environmental costs associated with the proposed technologies. This paper, hence, proposed an innovative comparative approach to BTMS evaluation, by which a Life Cycle Assessment (LCA) analysis of two BTMSs is carried out to identify the least environmentally impactful solution. The chosen BTMS is a traditional one, featuring an active liquid cold plate, and an innovative one, using a Loop Heat Pipe (LHP) system. LCA is a method defined by international standards ISO 14040 [20] and 14044 [21] for analysing the environmental impacts of a product or system. LCA is a comprehensive study that examines the entire life cycle of a product; depending on the stages that are taken into consideration, different types of analysis can be defined, such as ‘cradle to gate’, considering from raw material extraction to product manufacture, and ‘cradle to grave’: from raw materials to product final disposal and recycling. The applications of this technique are many, including product development and innovation, policy decision support, green public or private procurement, the development of life cycle-based environmental declarations, communication and marketing, industrial process optimisation, and corporate sustainability strategies; these are just a few examples of the areas in which LCA plays an important role [22].
Not many works in literature are found assessing the environmental impact of the BTMS. Chen et al. developed a performance index to assess air and PCM cooling performances, showing that to better cyclical costs, extend operative life, and reduce operating costs, air cooling was a better option than PCM, due to PCM's low cycle life and thermal properties [23]. Lander et al. performed a life cycle cost analysis on a liquid cooling BTMS to make EVs both economically and environmentally viable. Their results showed that the life cycle cost and carbon footprint were reduced by 27% and 25%, respectively, when moving from air cooling to an optimised liquid BTMS [24].
Similarly, the literature is scarce regarding LCA for heat pipes. To the best of the authors’ knowledge, only a handful of works were found addressing this topic. Llera et al. performed an LCA on stainless-steel heat pipes aimed at steam production, finding that the use of heat pipes reduced the GHG emissions in steam production by 97% [25]. However, the manufacturing process of heat pipes was not considered in the LCA. Illner et al. produced an interesting study in which they used a switchable heat pipe (developed in-house with the use of an absorption material) and compared the benefits with liquid cooling by means of an LCA [26]. They showed the potential to reduce the overall impact by about four times by using the passive system with heat pipes, albeit with very conservative assumptions on the liquid BTMS cooling side and on the production phase of the heat pipes.
The brief list of works cited above highlights the need for more research in the direction of understanding both the environmental impact of BTMS and heat pipe technology. The present manuscript aims to fill this knowledge gap by using an LCA analysis to compare the environmental impact of a standard liquid BTMS and a novel passive Loop Heat Pipe-based BTMS, including the production phases. To the best of the authors’ knowledge, this is the first LCA of an LHP.
The paper is structured as follows: Section 2 outlines the methodology, including the LCA framework, product identification, and data collection process, detailing sources, tools, and assumptions for each life cycle stage. Section 3 introduces a sensitivity scenario based on the initial finding that copper was a critical issue, exploring its substitution with stainless steel. Section 4 presents the main analysis results, while Section 5 covers the sensitivity analysis results. Section 6 concludes this study.

2. Methodology

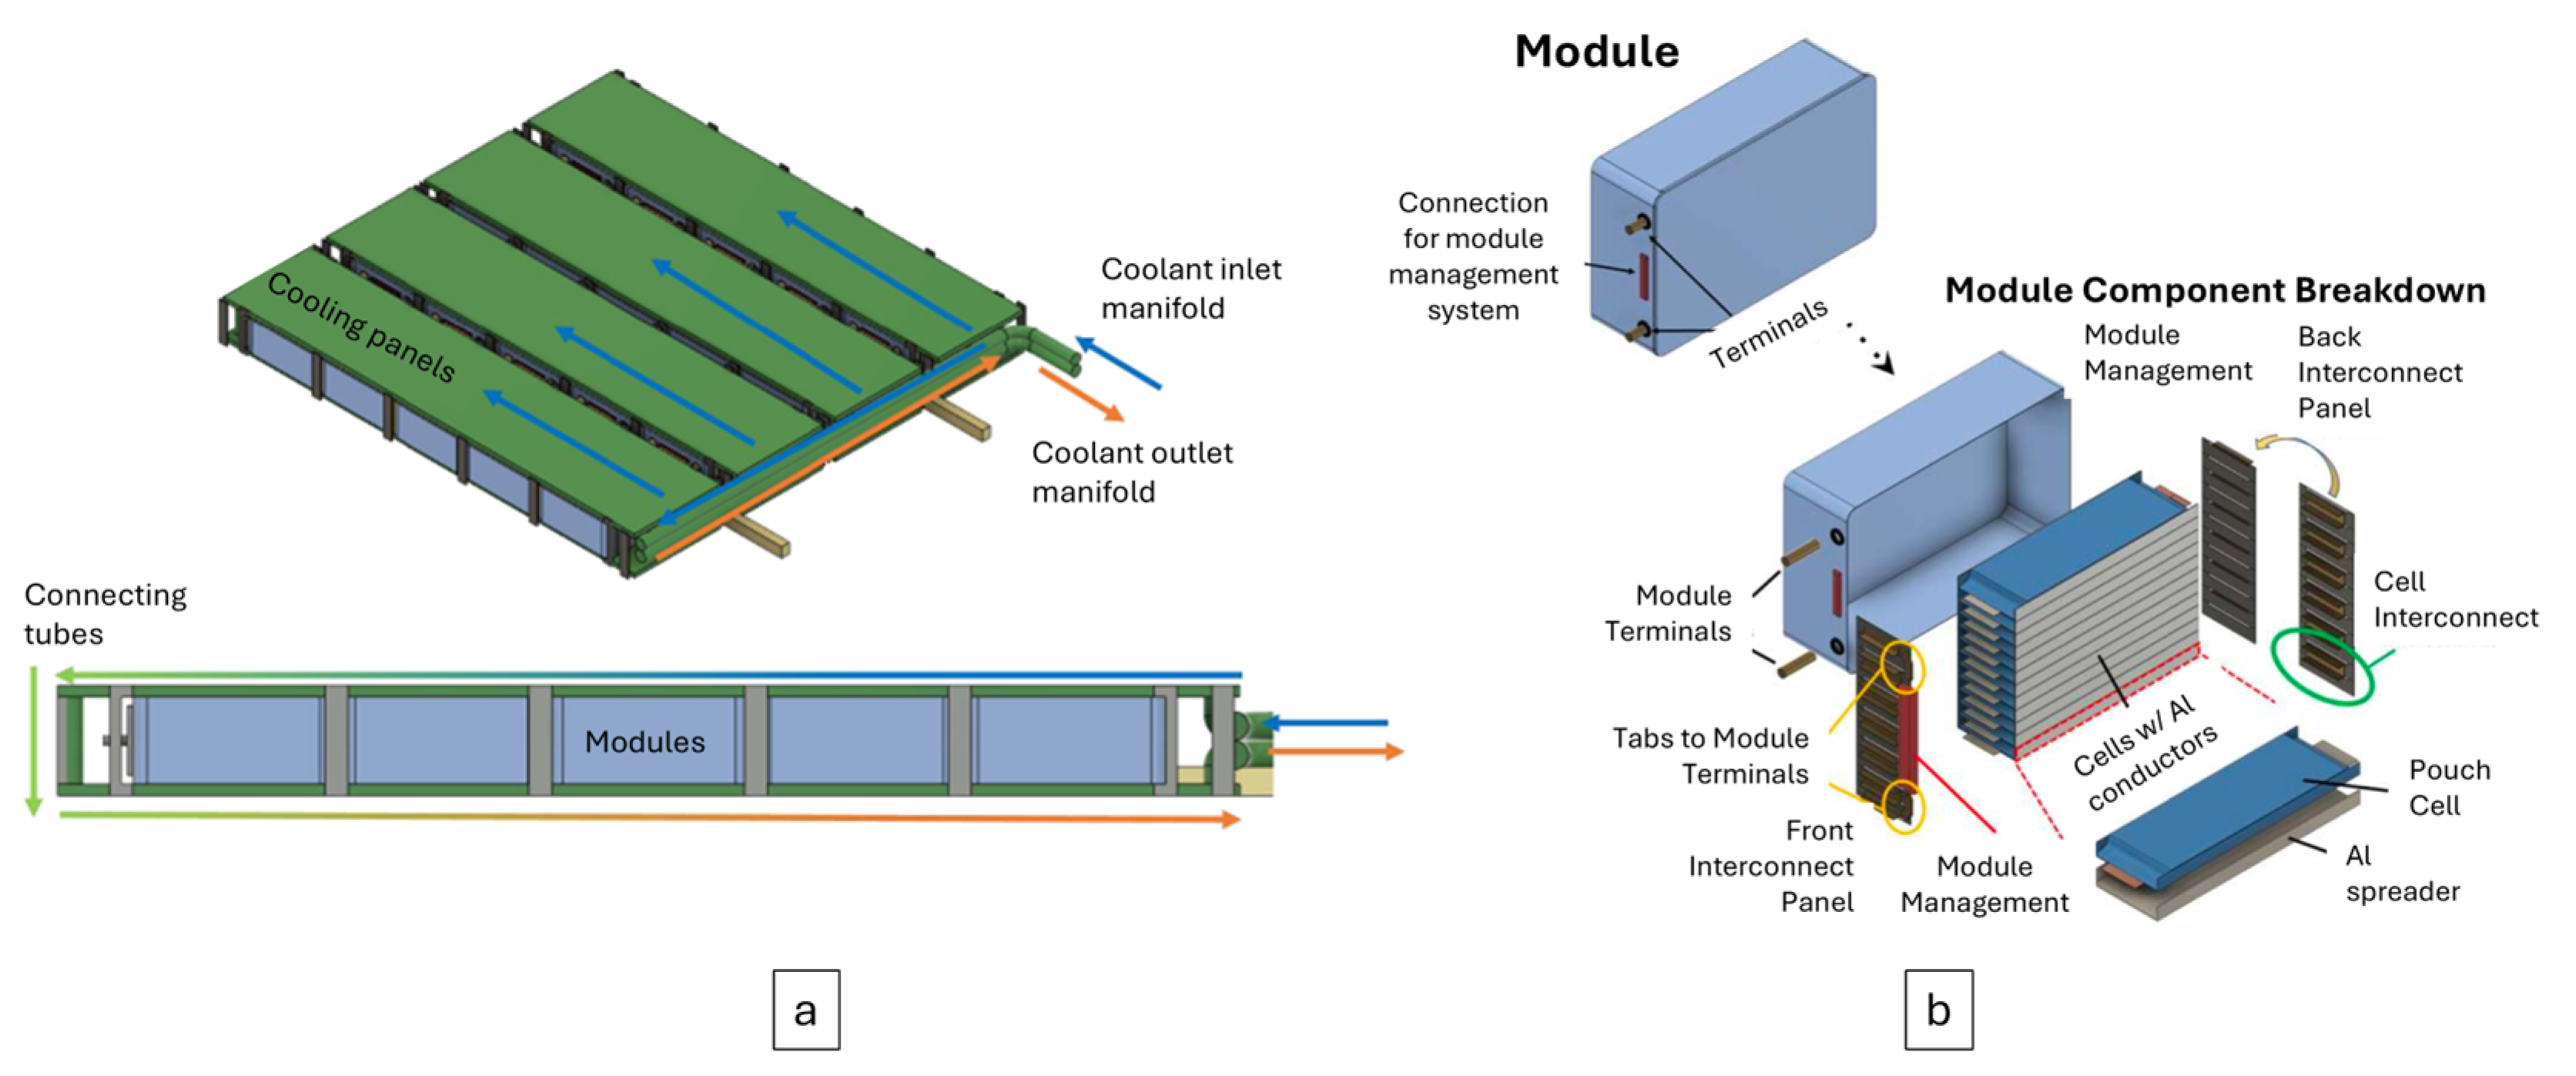
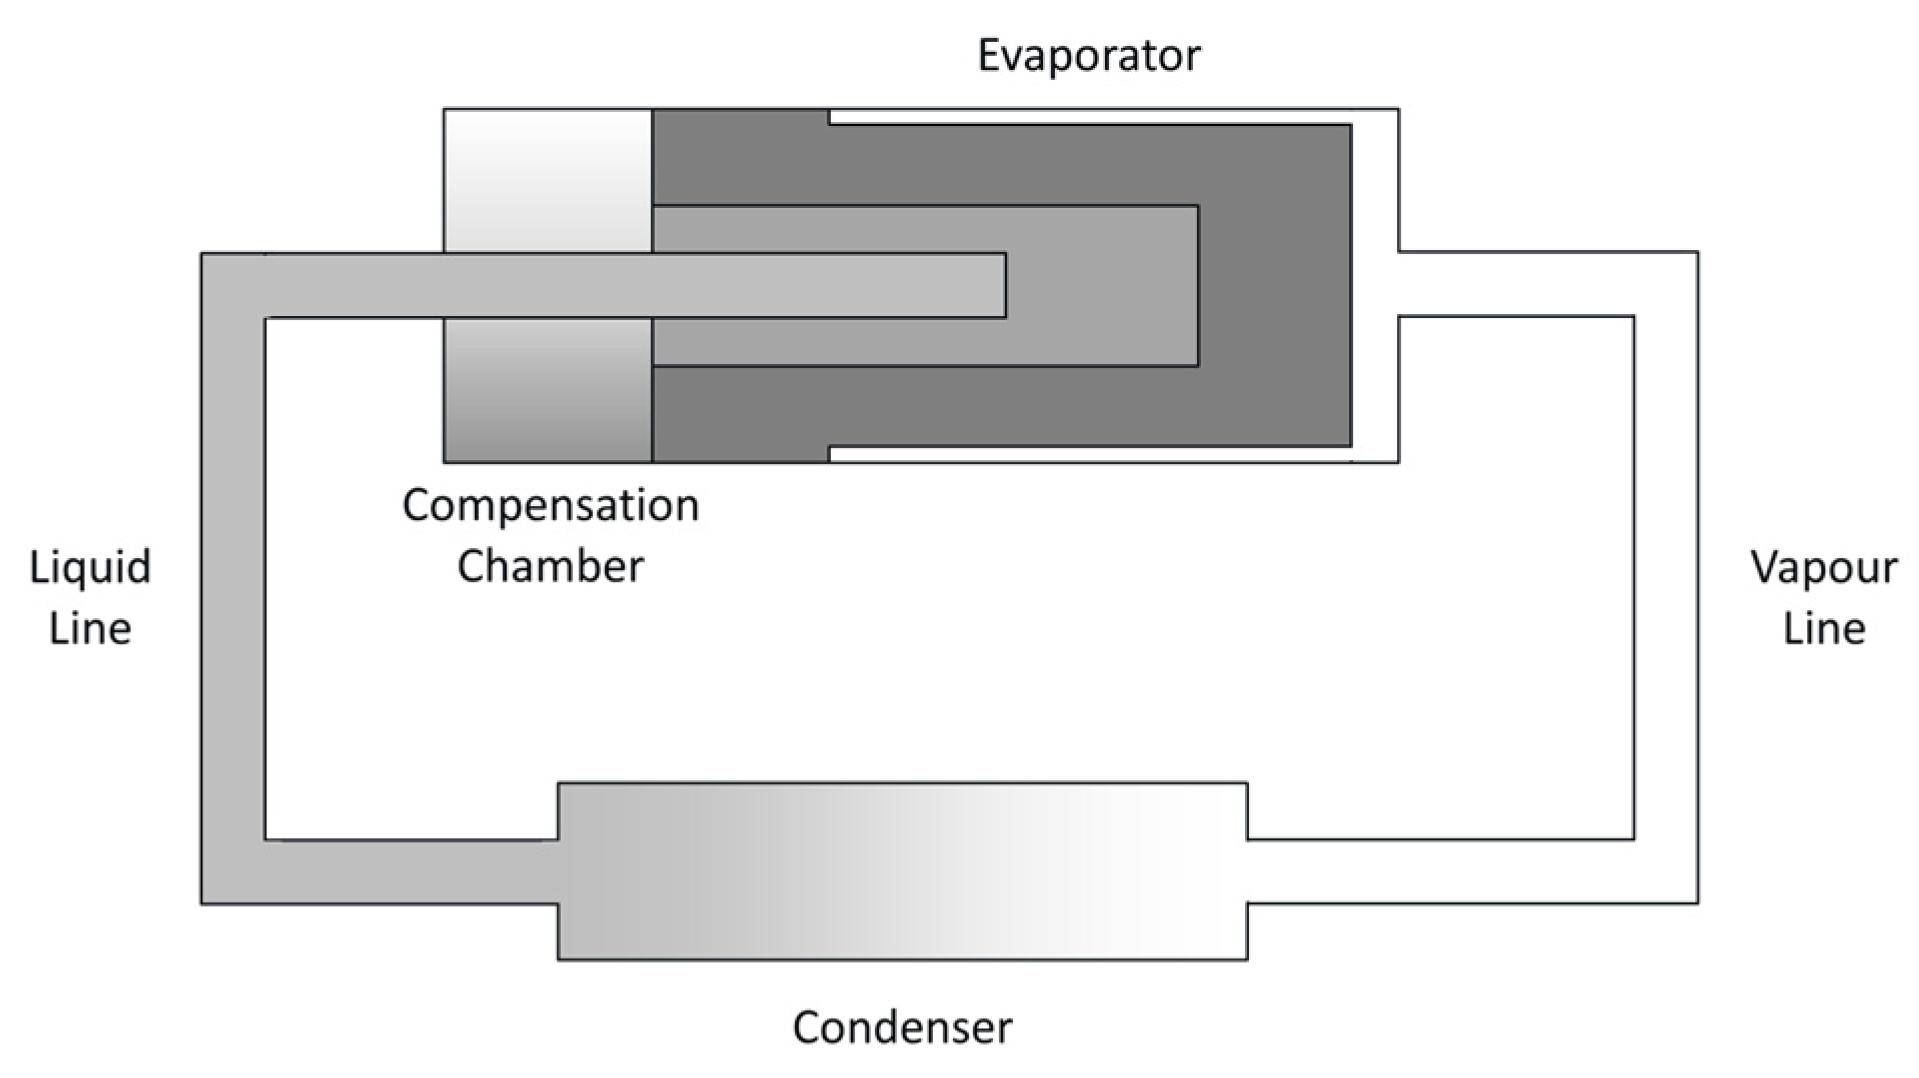
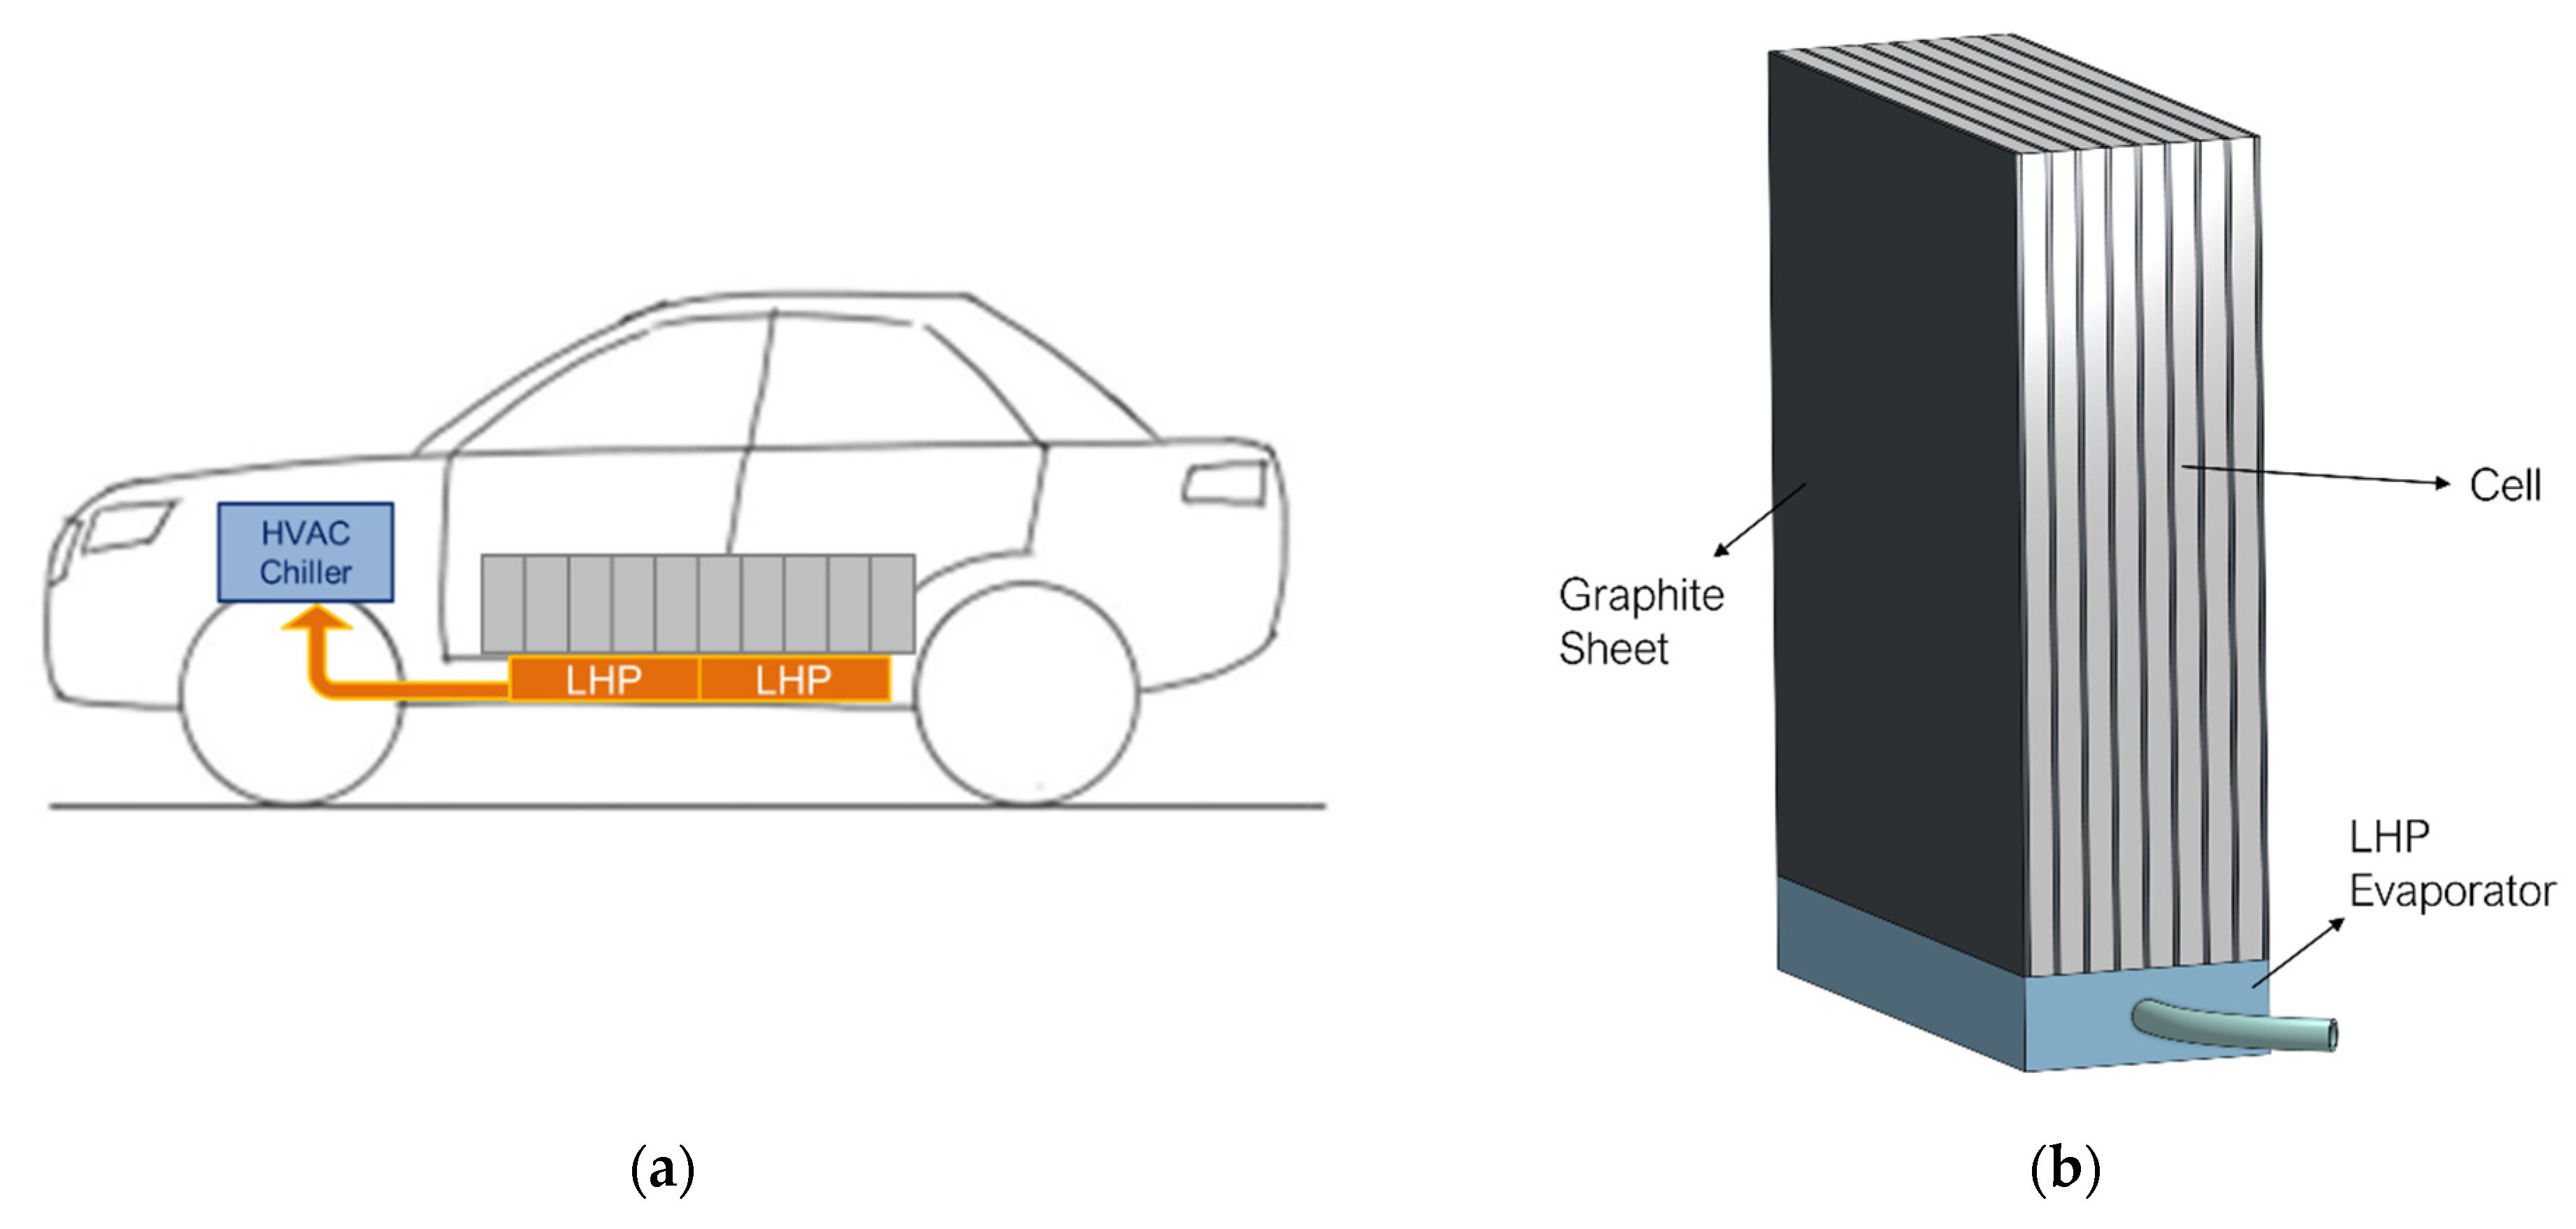
2.1. Battery Thermal Management Systems Under Analysis

For the modelling of the entire battery pack, the open-source BatPac model was used, created by the researchers at Argonne National Laboratory [27]. BatPac is a publicly available model that creates a bottom-up lithium-ion battery design and performs a cost calculation. The model designs the battery for a specified power, energy, and vehicle type (i.e., hybrid, plug-in hybrid, or full-electric). The tool then generates a complete cost analysis by examining each stage of the battery manufacturing process. The original model and manual were publicly peer-reviewed by battery experts assembled by the U.S. Environmental Protection Agency.
A stainless-steel (SS) liquid cold plate was chosen as the benchmark technology for the comparative study presented in this manuscript, as it is more utilised in the industry due to its advantages over copper cold plates. In fact, SS cold plates have a higher resistance to freezing-induced deformations and to corrosion and are lighter and cheaper than their copper counterpart [28], albeit with poorer thermal performance due to lower thermal conductivity. The working fluid is a 50/50 (by weight) solution of ethylene-glycol and water. This cold plate will take away the excess heat from the battery pack and reject it to the Heating Ventilation and Air Conditioning (HVAC) unit of the vehicle. The proposed cooling system utilising the proposed cooling panels, placed both above and below the battery modules, is presented in Figure 1. Both sides of the panels are hydraulically connected in parallel to the manifold, made of 18/8 stainless steel, and responsible for uniformly distributing the refrigerant.
Stiff pouch cells are used as they are considered advantageous due to their high energy density, light weight, and volumetric efficiency. The module contains aluminium heat conductors wrapped around each cell for thermal management, a module management control system, terminals, and a casing. The whole pack includes the entire battery management system and additional functions for the thermal management system. Busbars and terminals for drawing energy to and from the pack are also included.
The innovative, not-yet-employed BTMS chosen for the other side of the comparative study is an LHP BTMS. LHPs are passive two-phase heat transfer devices. Developed in the USSR in the 1970s, they have been used primarily for space applications [29]. As shown in the schematic in Figure 2, they are comprised of four main components: evaporator, vapour and liquid line, and condenser. In the evaporator, a porous structure called a wick traps the liquid in numerous capillary pores. Due to this capillarity, a positive pressure gradient arises. When heat is applied (e.g., from the battery), the liquid boils and turns to vapour, and it is forced towards the vapour line by the pressure gradient given by the capillarity. The vapour line flows into the condenser, where the heat is rejected, and the vapour turns to liquid and flows back into the evaporator through the liquid line. Here, it is received by the compensation chamber, which is a two-phase reservoir that feeds the liquid to the wick. Due to this operating principle, LHP allows for excellent heat transfer over long distances (i.e., several meters) [30] at a much lower cost compared to a standard heat pipe of a similar size, due to having the wick in the evaporator only. LHPs are studied for anti-icing applications [31], smartphone cooling [32], semiconductor cooling [33], and waste heat recovery [34] and have been widely used in space applications [29]. LHPs have also been mass-produced [35,36], indicating the technological maturity of this device.
The LHP-based BTMS was proposed by Bernagozzi et al. [37,38], with a series of LHP evaporators placed below the battery module, thermally connecting the battery modules to the HVAC chiller already present in the vehicle, as shown in Figure 3.
Previous research has shown that this design was able to improve the cooling performance of an active cold plate by more than 3 °C during fast-charge cycles [38]. Further research showed that 2 LHPs were able to maintain the battery cells below the required temperature thresholds during 1C and 2C charge cycles [39]. Possible potential LHP architectures applied to a module scale are shown in Figure 4. Further research needs to be established in creating an ad hoc LHP design able to maximise the thermal contact with the battery module, which, however, is out of the scope of the present work. In fact, this work aims to motivate further research by showing the environmental benefits of such technology.
Being a relatively new technology, LHPs need further investigation but offer clear advantages.

2.2. Life Cycle Assessment

Life cycle assessment analysis comprises four distinct phases: (1) goal and scope definition, (2) life cycle inventory (LCI), (3) life cycle impact assessment (LCIA), and (4) interpretation. The initial phase establishes this study’s assumptions, including system boundaries, research objectives, methodological framework, and the specification of functional units and requisite data. During the LCI phase, a comprehensive inventory is developed through systematic data collection aligned with this study’s objectives, encompassing all the relevant input and output flows within the defined system boundaries. The LCIA phase facilitates the translation of inventory data into environmental significance by correlating all the relevant input and output flows with specific environmental impact categories. This phase necessitates the selection of appropriate LCIA calculation and classification methods, followed by characterisation procedures to quantify the magnitude of impacts for each inventory element. Additionally, two discretionary steps may be implemented: normalisation, which contextualises the results against reference values, and weighting, which assigns relative importance to different impact categories based on predetermined criteria, such as sociopolitical considerations. Finally, Interpretation is where the results collected in the LCI and LCIA are discussed and compared.
SimaPro v9.3.0.3 was the software used to carry out this LCA analysis, supported by the Ecoinvent database (version 3.1 released in November 2023). The chosen calculation method was the Environmental Footprint (EF) Method, developed in 2013 and later updated in 2021 by the European Commission [40]. The Environmental Footprint Method is based on international standards, such as the ISO 14000 family, and it provides a comprehensive and reliable guide for measuring the environmental footprint of a product or service during its life cycle. During its development, it has been tested with over 300 companies and 2000 stakeholders, with applications in many sectors, including computer equipment and batteries.
The LCIA phase of an LCA evaluates the contributions a product gives to various ecological problems. To identify the major impact areas needing attention and action, SimaPro adopts the EF calculation method, which proposes 16 environmental impact categories to collect the interactions of processes or services with the ecosystem, described in Table 1. These categories collectively enable the systematic evaluation of environmental impacts across various dimensions, facilitating informed decision-making in product development and process optimisation.

2.3. Data Collection

The selected battery pack contains a total of 384 cells divided into 32 modules made of 12 cells, respectively. The BatPaC model provides information on the performance of the battery, including that the total heat generated by the battery pack was 716 W. Considering 384 cells, that means an average of 1.86 W of thermal power released by a single cell, which is less than a 1C charge cycle. For this reason, 2 LHPs were deemed sufficient to cool down a single module.
The parameters chosen in this set-up are summarised in Table 2. It is now possible to proceed with the collection of data describing the components of the two cooling systems.

2.3.1. Raw Material Acquisition

Of particular importance for an LCA are the materials, as displayed in Table 3. All data shown here have been extracted directly from the BatPac model. In the case of the coolant, its total weight was divided by two, as the liquid used is half ethylene-glycol and the other half water.
The data collection process for the LHP BTMS proved challenging, as no pre-existing system had been designed specifically for the adopted battery pack. As a result, readily available information was limited. Hence, the approach taken was to start with the geometry of the battery pack and adapt the LHP system based on a reference design. Figure 5 provides a sketch depicting the dimensions of the battery pack and the positioning of the LHPs. It is important to note that two LHPs (labelled a and b) are required for each module, with each LHP having a vapour line and a liquid line. However, in the sketch, only one of the two pipelines has been represented, as the figure shows a top view. The length of a single module was obtained from the BatPac model and is equivalent to 290.4 millimetres. These data were used to calculate the average pipeline length of an LHP, characterised by ID/OD values of 4.4 mm and 6 mm, respectively.
The remaining LHP data were collected directly from the experiments performed in [38]. The system is composed of copper pipelines, and the chosen working fluid is ethanol. Due to the LHP being a two-phase device, with a 50% filling ratio, it is assumed for volume and mass calculation that this split remains constant. The vapour phase contributes negligibly to the overall mass and can therefore be ignored. The masses of both the copper evaporator and its contained fluid are known. With these parameters established, we can now calculate the amount of piping needed for the LHP BTMS, presented in Table 4.
Considering the total pipe length, the 50% filling ratio and the ID/OD of the pipes, volumes, and masses of working fluid and copper pipes are estimated, giving a mass of 0.4458 kg of ethanol and 8.7037 kg of copper pipes. One copper LHP evaporator has a mass of 0.17 kg [37]. This value was then multiplied by the number of LHPs present in the system. The same was performed with the mass of the fluid inside a single evaporator (0.0096 kg). As a result, the total mass of the evaporators is 10.88 kg, and the total mass of the ethanol in the evaporator is 0.6144 kg, bringing the total mass of the working fluid to 1.06 kg. The LHP BTMS will therefore add a total of 20.644 kg to the whole battery pack, while the cold plate BTMS added a total of 30.54 kg, representing a one-third improvement. A summary table of the masses associated with the LHP BTMS is provided in Table 5.
As it can be observed, the data collected do not include information about the components responsible for heat dissipation in the surrounding environment. This is because the heat dissipation task is carried out by the vehicle’s HVAC unit, which is located outside the scope of this investigation. Indeed, the environmental impact of the HVAC unit and the battery control system will be neglected during the analysis presented in this study.

2.3.2. Manufacturing

The next step involves identifying the manufacturing processes for each component. Due to the absence of physical prototypes, we based our process selection on common industry practices, supported by existing examples and industrial applications. We used the SimaPro software package to identify appropriate datasets and included detailed descriptions of each database entry selected. The components inputted into the software are the circulation pump, cooling panels, and manifold.
The most commonly used process for a low-power pump made of aluminium is casting. In this case, lost-wax aluminium casting was chosen, a process used to create objects, from simple to complex, by pouring molten metals into molds made from wax models. The service covers the input of aluminium ingots and alloys, casting, dewaxing, cutting, grinding, straightening, machining, and non-destructive testing. It also includes water and energy consumption, emissions, and end-of-life of materials. For the cooling panels, a process called ‘Metal working, average for chromium steel product manufacturing’ is used. The dataset represents the average production processes to transform a chromium steel semi-finished product into a final product. The service provided accounts for machinery, infrastructure, metal operations, and additional steel inputs to consider processing losses but excludes the degreasing process. Finally, regarding the manifold, two processes were considered. The first is lost-wax steel casting, which describes its production, while the second considers the welding carried out to assemble the manifold parts. For casting, steel input, mold production, stainless-steel and alloy casting, heat treatment, straightening, cutting, grinding, and non-destructive testing are considered. It also includes water and energy consumption, emissions, and end-of-life of materials. On the other hand, the process ‘welding, arc, steel’ was selected to describe the welding of metals using electricity to create enough heat to melt the metal. This dataset uses a power supply to create an electric arc between the metal electrode and the base material. Material input, energy consumption, and emissions are included. In this case, to evaluate its contribution, the input required is the length (in meters) of the weld made,   l w e l d i n g . This parameter was obtained by calculating that 4 rows of 2 pipes (inlet and outlet) of OD 25 mm were needed; hence, the total welding layer deposited around the perimeter of each pipe amounted to 0.629 m. The summary of the cold plate components and their masses is presented in Table 6.
The same approach is used for the collection of data concerning LHPs. Pipelines are usually produced by extrusion, but the item referring to this process for copper machining is not available in the Ecoinvent 3 database. The alternative adopted is to describe the manufacturing of pipes with the service ‘metal working, average for copper product manufacturing’. This service represents the average production process to transform a semi-finished copper product into a final product. This dataset considers machinery, infrastructure, metal operations, and additional copper input to be considered for processing losses. For the same reasons, the process chosen for the pipelines was also associated with the construction of the copper evaporators.
In LHPs, the copper wick is only located inside the evaporator and is produced by the sintering process. Even this type of process is not provided by the database, and during the research, numerous alternatives were attempted in order to consider the contributions made by this service. The solution considered closest to the desired one is to at least consider the contributions related to energy consumption from the sintering furnace. To do this, the energy per unit volume was calculated from energy balance specific during the sintering process and was derived from the calculation of the heat required to heat a material to a specific temperature, considering the thermophysical properties of copper:
Q V = ρ m c p T s i n t T a m b t s i n t
where Q is the total energy [J] absorbed by the material during the sintering, V [m3] is the volume of the material being sintered, and ρ m is the average density [ k g / m 3   ] of the material calculated as
ρ m = ρ · 1 p o r o s i t y
where a 50% porosity was assumed; c p is the specific heat capacity [J/kgK]; T s i n t and T a m b are the maximum temperatures [°C] reached during sintering (875 °C) and ambient temperatures (25 °C), respectively; and finally, t s i n t is the duration of the sintering process [s], assumed to be 1 h. Additionally, a conservative assumption of a 30% loss due to sintering efficiency was made. Following this process, the energy consumption associated with sintering came to 20.4 MJ (=5.67 kWh). For a total of 64 LHP, it therefore amounts to 362.88 kWh.
Finally, the vacuuming procedure for the LHP was considered. Generating vacuum conditions is crucial to the proper long-term functioning of LHPs. A vacuum allows the continuous cycle of evaporation and condensation to work at lower temperatures, accelerating the transition of state and, thus, facilitating heat transfer. This condition also reduces the presence of residual gases and especially eliminates Non-Condensable Gases. These elements add extra components to the working fluid, inherently increasing the inner pressure and, hence, the working temperature of the device. In the experimental campaign reported in [38], a vacuum was achieved through a two-stage pump system: the first was a volumetric scroll pump (Boc Edwards XDS35i, rated at 520 W), while the second was a turbomolecular pump (Boc Edwards EXT255Hi, rated at 250 W). With this approach, vacuum conditions corresponding to 2.1 × 10⁻⁵ mbar were obtained. To assess the contributions of this procedure, the power values of the two pumps and their working time will determine their energy consumption. Considering a 3 h vacuum procedure at each stage, 2310 Wh of energy consumption is associated with the vacuuming of a 1 LHP evaporator. Thus, for the whole set of 64 LHP, the total energy consumption for vacuuming is 147.84 kWh. These values are summarised in Table 7.

2.3.3. Use

Evaluating the environmental impacts of the use phase makes it possible to highlight the differences, in terms of environmental impact, that arise during the operation of the electric vehicle and, thus, when the BTMS is activated. Significant differences in the results are expected considering the comparison of an active system with a passive system. As the LHP BTMS is a passive system, it does not require any external energy source; hence, during the use phase, it provides no impact. Therefore, only the contribution given by the Cold Plate system will be studied in this section. It is important to point out that the two BTMSs share the same cold side, the HVAC chiller of the vehicle, which is hence excluded from this comparison.
The cold plate BTMS, in the use phase, requires energy for the circulation pump. The pump keeps running while driving the vehicle as well as during charging at a constant power of 573.07 W. Hence, to obtain the pump’s energy consumption, the vehicle’s usage time, charging time, and other key battery characteristics must be estimated. First, the operating time of the pump is divided into two parts: the charge phase and the discharge phase. For both phases, the BatPaC model is used to determine the ratios that define the battery’s performance.
Assuming an average battery life of 8 years, which also corresponds to the warranty period of most electric car production companies such as Audi, BMW, and Tesla, and considering that statistics collected by the European Commission have reported that the average daily time Europeans spend driving a car is about one hour [56], the total discharge time is estimated. The charge rate and discharge rate (C-rates) are defined by the ratio of the time the battery takes respectively to charge and discharge. A charge rate of 1C and a discharge rate of C/3 are assumed. Hence, the total charging time is calculated as one-third of the total discharging time. The sum of the charging time and discharging time will give the total pump running time, which will be used for the total energy consumption estimation, amounting to a total of 2231 kWh, detailed in Table 8. The pump running duration was estimated considering a total driving time of 2910 h (1 h per day per 8 years). A discharge rate of C/3 means needing charging every 3 h; hence, over the 8 years, 973 cycles of charging are needed, each of 1 h (because charged at 1C). Hence, the total usage of the pump is 2910 + 973 = 3894 h.

2.3.4. Disposal and Recycling

The final step in a Life Cycle Assessment using a cradle-to-grave approach is to consider the disposal scenario of the product. In this stage, the software considers the waste management procedures and calculates the recycled material percentages. An Ecoinvent dataset representing the disposal of ‘municipal solid waste’ in an open landfill with water infiltration was considered. The duration of the operational phase is 15 years, and a methane correction factor is used for the air emissions of the landfill [57]. Disposal is uncontrolled, and leachate from the landfill is emitted directly without being treated. The activity begins when the waste is available at the dump site and ends when it is disposed of, and emissions are released into the air or water. This dataset is used in both BTMS systems, and it has a small effect on the overall comparison.

3. Set-Up of a Sensitivity Scenario

During the first round of calculations, it became evident that copper posed a significant environmental challenge in the system under study, especially in the resource use category, as will be presented in the next section.
In order to find an alternative to the excessive impact on the resource use caused by using copper, an LHP made in stainless steel (SS) is proposed. Research has proved that it is possible to achieve a perfectly operating LHP in SS [58,59,60,61,62]. Stainless steel offers environmental benefits, as its extraction is less invasive and less toxic than the mining of copper, and it also has a high recycling rate [63]. Its mechanical properties exceed that of copper, guaranteeing a longer lifespan, and also allow for thinner envelopes, which ultimately will lead to lower encumbrance. Although copper is generally preferred for thermal applications due to its excellent thermal conductivity, these properties of stainless steel, together with its lower cost, make it an attractive choice for future thermal management applications. The limitations to the use of stainless steel are its lower thermal conductivity and manufacturability. Previous research by Bernagozzi et al. [38] has shown that a SS LHP can provide an comparable thermal performance to the copper LHP when applied as BTMS. This ensures a satisfactory level of confidence in suggesting this technology as a suitable alternative.
Following a similar process as highlighted before, using the same geometries and dimensions of the copper system, it was possible to obtain the masses for piping and a single-LHP evaporator, i.e., 7.70 kg and 0.15 kg, respectively. The same mass of ethanol was considered; hence, the whole LHP SS system added up to 18.39 kg, as shown in Table 9. By recalling the values presented in Table 5 on the copper LHP, it can be seen that using SS has resulted in a total reduction in the system weight of 2.25 kg, which represents a 40% mass reduction compared to a cold plate system.
Due to a better selection available on the Ecoinvent database, the following processes were chosen for the SS LHP: For the pipes, an extrusion process was used; for the construction of the evaporator, the same process shown in Equation (1) was used, with the physical properties of stainless steel (specific heat capacity, density, and melting temperature). Due to SS’s melting temperature being higher than copper, normally between 1400 and 1450 °C depending on the composition of the alloy, more energy is required for the sintering process, with a total of 577.92 kWh for the whole set of 64 evaporators (compared to 362 kWh in the copper case). The processes, masses, and energy costs for the alternative SS LHP are presented in Table 10.

4. Results

At this point, the collection of all the life cycle data of the two battery cooling systems had been completed and the analysis could proceed with the assessment of the environmental impacts. Firstly, the characterised results from the active cold plate BTMS are presented in Table 11 for various life cycle stages: materials and production (which includes raw material acquisition and manufacturing), use phase, and disposal. The results of each stage are presented for key impact categories, measured in their respective units, alongside the total contribution from all stages combined.
Climate change (kg CO2eq) emerges as the most significant impact category, with the use phase contributing 1.64 × 10³ kg CO2eq, accounting for most of the total impact (2.05 × 10³ kg CO2eq). Ionising radiation (kBq U-235 eq) is dominated by the use phase at 5.78 × 10⁻⁵ kBq U-235 eq, with negligible contributions from disposal, and this is caused by the adopted electricity mix. Photochemical ozone formation (kg NMVOC eq) and acidification (mol H+ eq) also see their highest impacts during the use phase, contributing 2.39 × 10² kg NMVOC eq and 4.21 mol H+ eq, respectively. Freshwater and marine eutrophication are relatively low across all life cycle stages, with the use phase remaining the dominant contributor. Ecotoxicity in fresh water (CTUe) and land use (Pt) follow a similar pattern, whereby the use phase has the largest contribution, while production also plays a notable role. Water use (m3 deprivation) is driven predominantly by the use phase (1.57 m3), while disposal contributes minimally. Resource use for both fossils (MJ) and minerals/metals (kg Sb eq) is again most impacted by the use phase, with significant contributions from materials and production for minerals/metals (1.13 × 10⁴ kg Sb eq). The disposal phase generally has a minor contribution to most impact categories, except for minimal effects in ecotoxicity and land use. Overall, the characterised results highlight the dominant role of the use phase in driving the environmental impacts of the cold plate system.
Not all the 16 impact categories presented previously in Section 2.2 are listed in Table 11. As for some categories like human toxicity (cancer and non-cancer) and particulate matter, the calculated impact was zero.
Using a weighting approach, on the other hand, is a useful option to highlight which categories should be given more importance, according to the current political and social criteria. For example, contributions related to ’Climate Change’ and ’Resource use, fossils’ usually receive higher weighting factors in this type of assessment.
This is because in environmental and socio-economical terms, global warming and the depletion of non-renewable resources, such as fossil fuels, attract more attention, reflecting the urgency and severity of the conditions [64]. Figure 6 presents the weighted environmental impacts of the cold plate system across several impact categories, measured in millipoints (mPt), where one point (Pt) represents the average annual total environmental impact of a European citizen [65].
The results highlight that climate change is the dominant impact category, with a significantly higher score, nearing 55 mPt. This impact greatly surpasses all other categories, indicating its central role in the system’s environmental burden. Following climate change, resource use (fossils) emerges as the second most significant category, with a score slightly above 30 mPt. This suggests a high reliance on fossil resources throughout the system’s life cycle. Other notable contributors include particulate matter and eutrophication in fresh water, each showing moderate impacts of around 10–15 mPt. In contrast, categories such as ionising radiation, photochemical ozone formation, human toxicity (cancer and non-cancer), and eutrophication (marine and terrestrial) display much lower contributions, each falling well below 10 mPt. The water use and land use impacts are minimal in comparison, barely registering on the graph. Overall, the results show that climate change and resource use (fossils) dominate the environmental impacts of the cold plate BTMS system, while other categories play a relatively minor role.
In addition, the pie chart in Figure 7 shows the contributions, in percentages, of the product life cycle stages, assuming a single score result. This makes it possible to understand whether the production or material collection phase has a greater impact than the usage and disposal phase. For cold plate BTMS, as expected, the largest contribution is produced during the use phase due to the energy required by the coolant circulation pump.
Regarding the results of the LCA for the passive LHP BTMS, the results are presented in Table 12. It is evident that, like in the previous case, many categories have negligible values. Overall, the results indicate that the materials and production phases dominate the environmental impacts across all categories for the Loop Heat Pipe system. The disposal phase has a minimal contribution to the total impacts, reflecting the significant resource and energy demands of the initial production stage. This suggests that efforts to reduce environmental impacts should focus on improving the efficiency and sustainability of the materials and production processes.
The weighted version of the data measured in mPt is depicted in Figure 8, showing a notable peak in the impact category ‘Resource use, minerals and metals’. This is due to the extraction and processing of copper, due to its limited availability. In fact, due to its extensive use in industry and electronics, this material is a non-renewable metal, and the high use of it may lead to a depletion of this resource in the future [66]. Moreover, its extraction from mines and manufacturing requires large amounts of energy and a large territory, producing a great amount of waste, affecting also the categories of ecotoxicity in fresh water and land use. For these reasons, the weighted emissions analysis assigns it a heavy importance factor, clarifying the necessity of action in this field. However, compared to the cold plate system and due to its passive operation, the LHP BTMS has zero contribution in the utilisation phase, as shown in Figure 9. Interestingly, due to the significant impact of using copper, the percentage of resources used in disposal is also negligible.
In order to understand whether the proposed solution is advantageous with respect to the traditional BTMS, it is now useful to compare the output of the two presented so far. The comparative results are presented in Figure 10, as percentages of the total for each impact category. It can be observed that by excluding the categories affected using copper, particularly in the resource use category but also freshwater ecotoxicity and acidification, the performance in terms of the environmental impact of the LHP system is similar and, in most cases, better than those shown by the cold plate. Furthermore, it was explained that in the traditional system, the greatest contribution is made by the use phase, a scenario that therefore depends on the time and distances over which the vehicle is used. It must therefore be kept in mind that the longer the use phase, the greater the advantages of the passive system over the active one.
These results, together with other technical characteristics such as weight and volume reductions, show that LHPs appear to be a good solution to replace the traditional cooling system. However, changes must be made to solve the problems associated with the exploitation of non-renewable resources in order to eliminate the negative effects obtained. The first option is to replace the metal used to make the components with alternative materials. In doing so, it will be necessary to verify that performance improvements are achieved without negatively affecting the other impact categories. The next section of the present paper will show the results of an alternative LHP made from stainless steel (SS).

5. Sensitivity Analysis—Results for SS LHP and Comparison

The alternative LHP made with SS was studied to limit the impact on the use of resources such as minerals and metals. Previous results showed that using SS instead of copper and keeping the same dimensions reduces the thermal performance of the BTMS, due to SS's lower thermal conductivity [39,67]. However, they would also reduce the cost of the system and, due to the higher tensile strength, would allow for a thicker LHP envelope, which would in turn reduce the thermal resistance and improve the thermal performance. Nevertheless, the aim of this work is to discuss the environmental metrics of the analysed technologies.
From the updated LCA results presented in Table 13 and in the comparison with copper shown in Figure 10, it is evident that now resource use is much less impactful, and there is also an overall reduction in all other categories. This proves that the use of SS would mean a significant improvement in the overall environmental impact of the LHP technology selected for the proposed BTMS.
Finally, it is possible to compare the updated innovative BTMS, using SS LHPs, with the benchmarked active cold plate BTMS. The results presented in Figure 10 show clearly that the proposed BTMS offers significant benefits in all the environmental categories considered. In fact, it provides a 52% reduction in kg CO2eq, and a more than 50% improvement in all the other categories, with a peak of a 60% improvement in freshwater ecotoxicity. Due to its passive operation, LHP results in lower power consumption and a lower impact on climate change related to fossil fuels. High levels of GHG emissions were produced with the cold plate, amounting to a total of 2045 kg CO2eq. With the first version of LHP, the production of GHGs was reduced to 614 kg of CO2eq. In the case of the LHP system made of stainless steel, these levels experienced insignificant variations, bringing GHG emissions to 646 kg CO2eq, still highly advantageous compared to cold plate rates.

6. Conclusions

This paper presented a comprehensive Life Cycle Assessment to evaluate the environmental impacts of two Battery Thermal Management Systems (BTMSs) for electric vehicles: a traditional active cold plate system and an innovative passive system using Loop Heat Pipe (LHP) technology. The cold plate system is already well established and widely used in the automotive market due to its high efficiency. However, this analysis revealed that its active nature requires a continuous supply of energy, during both operation and charging. This has resulted in significant energy consumption and a higher environmental impact.
These findings led the investigation towards the alternative passive LHP solution, which offers numerous advantages. The elimination of dependency on an external energy source allows the LHP system to demonstrate a considerable reduction in the climate change category, producing a significant decrease in greenhouse gas emissions. Additionally, its passive nature enables a simplified design with fewer components, translating to a lighter structure. The data show the LHP system provides a 9.9 kg reduction in the overall BTMS mass compared to the cold plate system, offering benefits not only in environmental terms but also in vehicle performance.
In the second part of this study, a different LHP design was proposed, replacing copper with stainless steel as the building material. This change successfully addressed the high peaks in the resource use category observed in the initial copper-based LHP design, significantly reducing the negative impacts of material extraction and processing. Meanwhile, the positive effects of the passive LHP technology were preserved:
  • The LHP BTMS using stainless-steel components has over 50% lower impact across most environmental impact categories compared to the cold plate BTMS. This includes a 52% reduction in greenhouse gas emissions (kg CO2eq) and an over 60% improvement in freshwater ecotoxicity.
  • The use of stainless steel instead of copper in the LHP system greatly reduces the impact on resource use, particularly for minerals and metals. This addresses a major weakness of the initial copper-based LHP design.
  • The passive operation of the LHP system, without the need for a power-consuming coolant pump, leads to substantially lower energy usage and emissions during the use phase compared to the active cold plate.
  • The LHP BTMS using stainless-steel components achieves a 40% reduction in overall system weight compared to the cold plate, which can provide additional benefits in vehicle applications.
The results demonstrate the potential of LHP technology as a promising low-impact alternative for future electric vehicle thermal management systems in comparison to the traditional active cold plate system in terms of environmental sustainability and resource consumption. The development and adoption of this passive cooling approach can lead to significant improvements in the environmental impact of electric vehicle battery systems. Moreover, given that this is the first LCA of LHP, it suggests that heat pipe manufacturers worldwide should include this analysis when proposing this technology to the industry.

Author Contributions

Conceptualisation, M.B. and A.A.; methodology, M.B. and A.A.; software, M.M., M.B. and A.A.; formal analysis, M.M.; investigation, M.M.; resources, A.A. and E.S.; writing—original draft preparation, M.M. and M.B.; writing—review and editing, M.B. and A.A.; visualisation, M.M. and M.B.; supervision, M.B., A.A. and E.S.; project administration, E.S. All authors have read and agreed to the published version of the manuscript.

Funding

This research received no external funding.

Data Availability Statement

The original contributions presented in this study are included in the article. Further inquiries can be directed to the corresponding author.

Acknowledgments

The authors are grateful to the School of Architecture, Technology, and Engineering at the University of Brighton for hosting M.M. during his period of being a visiting researcher.

Conflicts of Interest

The authors declare no conflicts of interest.

Abbreviations

The following abbreviations are used in this manuscript:
BTMSBattery Thermal Management System
DODDepth of Discharge
EFEnvironmental Footprint
EVElectric Vehicle
LCA Life Cycle Assessment
LCIALife Cycle Impact Assessment
LCILife Cycle Inventory
LHPLoop Heat Pipe
GHGGreenhouse Gases
HVACHeating Ventilation and Air Conditioning
PCMPhase Change Material
SEISolid Electrolyte Interphase
SOCState of Charge
SSStainless Steel

References

  1. European Parliament. Green Deal: Key to a Climate-Neutral and Sustainable EU; European Parliament: Strasbourg, France, 2024. [Google Scholar]
  2. UK Department for Transport. Transport and Environment Statistics: 2023; UK Department for Transport: London, UK, 2023. [Google Scholar]
  3. Olabi, A.G.; Maghrabie, H.M.; Adhari, O.H.K.; Sayed, E.T.; Yousef, B.A.A.; Salameh, T.; Kamil, M.; Abdelkareem, M.A. Battery Thermal Management Systems: Recent Progress and Challenges. Int. J. Thermofluids 2022, 15, 100171. [Google Scholar] [CrossRef]
  4. Iora, P.; Tribioli, L. Effect of Ambient Temperature on Electric Vehicles’ Energy Consumption and Range: Model Definition and Sensitivity Analysis Based on Nissan Leaf Data. World Electr. Veh. J. 2019, 10, 2. [Google Scholar] [CrossRef]
  5. Ramadass, P.; Haran, B.; White, R.; Popov, B.N. Capacity Fade of Sony 18650 Cells Cycled at Elevated Temperatures. J. Power Sources 2002, 112, 614–620. [Google Scholar] [CrossRef]
  6. Niculuţǎ, M.C.; Veje, C. Analysis of the Thermal Behavior of a LiFePO4 Battery Cell. J. Phys. Conf. Ser. 2012, 395, 012013. [Google Scholar] [CrossRef]
  7. Lin, J.; Liu, X.; Li, S.; Zhang, C.; Yang, S. A Review on Recent Progress, Challenges and Perspective of Battery Thermal Management System. Int. J. Heat Mass Transf. 2021, 167, 120834. [Google Scholar] [CrossRef]
  8. Tete, P.R.; Gupta, M.M.; Joshi, S.S. Developments in Battery Thermal Management Systems for Electric Vehicles: A Technical Review. J. Energy Storage 2021, 35, 102255. [Google Scholar] [CrossRef]
  9. Qin, P.; Liao, M.; Zhang, D.; Liu, Y.; Sun, J.; Wang, Q. Experimental and Numerical Study on a Novel Hybrid Battery Thermal Management System Integrated Forced-Air Convection and Phase Change Material. Energy Convers. Manag. 2019, 195, 1371–1381. [Google Scholar] [CrossRef]
  10. Bandhauer, T.M.; Garimella, S.; Fuller, T.F. A Critical Review of Thermal Issues in Lithium-Ion Batteries. J. Electrochem. Soc. 2011, 158, R1. [Google Scholar] [CrossRef]
  11. Zhao, G.; Wang, X.; Negnevitsky, M.; Zhang, H. A Review of Air-Cooling Battery Thermal Management Systems for Electric and Hybrid Electric Vehicles. J. Power Sources 2021, 501, 230001. [Google Scholar] [CrossRef]
  12. Wu, W.; Wang, S.; Wu, W.; Chen, K.; Hong, S.; Lai, Y. A Critical Review of Battery Thermal Performance and Liquid Based Battery Thermal Management. Energy Convers. Manag. 2019, 182, 262–281. [Google Scholar] [CrossRef]
  13. Roe, C.; Feng, X.; White, G.; Li, R.; Wang, H.; Rui, X.; Li, C.; Zhang, F.; Null, V.; Parkes, M.; et al. Immersion Cooling for Lithium-Ion Batteries—A Review. J. Power Sources 2022, 525, 231094. [Google Scholar] [CrossRef]
  14. Akbarzadeh, M.; Kalogiannis, T.; Jaguemont, J.; Jin, L.; Behi, H.; Karimi, D.; Beheshti, H.; Van Mierlo, J.; Berecibar, M. A Comparative Study between Air Cooling and Liquid Cooling Thermal Management Systems for a High-Energy Lithium-Ion Battery Module. Appl. Therm. Eng. 2021, 198, 117503. [Google Scholar] [CrossRef]
  15. Chen, K.; Wang, S.; Song, M.; Chen, L. Structure Optimization of Parallel Air-Cooled Battery Thermal Management System. Int. J. Heat Mass Transf. 2017, 111, 943–952. [Google Scholar] [CrossRef]
  16. Rabiei, M.; Gharehghani, A.; Andwari, A.M. Enhancement of Battery Thermal Management System Using a Novel Structure of Hybrid Liquid Cold Plate. Appl. Therm. Eng. 2023, 232, 121051. [Google Scholar] [CrossRef]
  17. Bernagozzi, M.; Georgoulas, A.; Miché, N.; Marengo, M. Heat Pipes in Battery Thermal Management Systems for Electric Vehicles: A Critical Review. Appl. Therm. Eng. 2023, 219, 119495. [Google Scholar] [CrossRef]
  18. Jaguemont, J.; Omar, N.; Van den Bossche, P.; Mierlo, J. Phase-Change Materials (PCM) for Automotive Applications: A Review. Appl. Therm. Eng. 2018, 132, 308–320. [Google Scholar] [CrossRef]
  19. Pambudi, N.A.; Sarifudin, A.; Firdaus, R.A.; Ulfa, D.K.; Gandidi, I.M.; Romadhon, R. The immersion cooling technology: Current and future development in energy saving. Alex. Eng. J. 2022, 61, 12. [Google Scholar] [CrossRef]
  20. ISO 14040; Environmental Management—Life Cycle Assessment—Principles and Framework. International Organization for Standardization: Geneva, Switzerland, 2021.
  21. ISO 14044; Environmental Management—Life Cycle Assessment—Requirements and Guidelines. International Organization for Standardization: Geneva, Switzerland, 2021.
  22. LU: Publications Office. International Reference Life Cycle Data System (ILCD) Handbook: General Guide for Life Cycle Assessment: Detailed Guidance; Publications Office of the European Union: Luxembourg, 2010. [Google Scholar]
  23. Chen, F.; Huang, R.; Wang, C.; Yu, X.; Liu, H.; Wu, Q.; Qian, K.; Bhagat, R. Air and PCM Cooling for Battery Thermal Management Considering Battery Cycle Life. Appl. Therm. Eng. 2020, 173, 115154. [Google Scholar] [CrossRef]
  24. Lander, L.; Kallitsis, E.; Hales, A.; Edge, J.S.; Korre, A.; Offer, G. Cost and Carbon Footprint Reduction of Electric Vehicle Lithium-Ion Batteries through Efficient Thermal Management. Appl. Energy 2021, 289, 116737. [Google Scholar] [CrossRef]
  25. Llera, R.; Vigil, M.; Díaz-Díaz, S.; Martínez Huerta, G.M. Prospective Environmental and Techno-Economic Assessment of Steam Production by Means of Heat Pipes in the Steel Industry. Energy 2022, 239, 122334. [Google Scholar] [CrossRef]
  26. Illner, M.; Thüsing, K.; Salles, A.; Trettenhann, A.; Albrecht, S.; Winkler, M. Switchable Heat Pipes for Eco-Friendly Battery Cooling in Electric Vehicles: A Life Cycle Assessment. Energies 2024, 17, 938. [Google Scholar] [CrossRef]
  27. Knehr, K.W.; Kubal, J.J.; Nelson, P.A.; Ahmed, S. A Manual for BatPaC v5.0 Battery Performance and Cost Modeling for Electric-Drive Vehicles; Argonne National Lab. (ANL): Argonne, IL, USA, 2022. [Google Scholar]
  28. Mahmoudinezhad, S.; Sadi, M.; Ghiasirad, H.; Arabkoohsar, A. A Comprehensive Review on the Current Technologies and Recent Developments in High-Temperature Heat Exchangers. Renew. Sustain. Energy Rev. 2023, 183, 113467. [Google Scholar] [CrossRef]
  29. Maydanik, Y.F. Loop Heat Pipes. Appl. Therm. Eng. 2005, 25, 635–657. [Google Scholar] [CrossRef]
  30. Nakamura, K.; Odagiri, K.; Nagano, H. Operational Characteristics of 10m-Class Long-Distance Loop Heat Pipe under Anti- Gravity Condition. In Proceedings of the Joint 18th IHPC and 12th IHPS, Jeju, Republic of Korea, 12–16 June 2016; pp. 384–391. [Google Scholar]
  31. Su, Q.; Chang, S.; Zhao, Y.; Zheng, H.; Dang, C. A Review of Loop Heat Pipes for Aircraft Anti-Icing Applications. Appl. Therm. Eng. 2018, 130, 528–540. [Google Scholar] [CrossRef]
  32. Domiciano, K.G.; Krambeck, L.; Flórez, J.P.M.; Mantelli, M.B.H. Thin Diffusion Bonded Flat Loop Heat Pipes for Electronics: Fabrication, Modelling and Testing. Energy Convers. Manag. 2022, 255, 115329. [Google Scholar] [CrossRef]
  33. Watanabe, N.; Mizutani, T.; Nagano, H. High-Performance Energy-Saving Miniature Loop Heat Pipe for Cooling Compact Power Semiconductors. Energy Convers. Manag. 2021, 236, 114081. [Google Scholar] [CrossRef]
  34. Somers-Neal, S.; Tomita, T.; Watanabe, N.; Ueno, A.; Nagano, H. Experimental Investigation of a 10 KW-Class Flat-Type Loop Heat Pipe for Waste Heat Recovery. Int. J. Heat Mass Transf. 2024, 231, 125865. [Google Scholar] [CrossRef]
  35. Nashine, C.; Pandey, M.; Baraya, K.K. Experimental Studies on the Transient Characteristics and Start-up Behaviour of a Miniature Loop Heat Pipe. Appl. Therm. Eng. 2025, 259, 124814. [Google Scholar] [CrossRef]
  36. Huang, B.-J.; Chuang, Y.-H.; Yang, P.-E. Low-Cost Manufacturing of Loop Heat Pipe for Commercial Applications. Appl. Therm. Eng. 2017, 126, 1091–1097. [Google Scholar] [CrossRef]
  37. Bernagozzi, M.; Georgoulas, A.; Miché, N.; Rouaud, C.; Marengo, M. A Novel Loop Heat Pipe Based Cooling System for Battery Packs in Electric Vehicles. In Proceedings of the 2020 IEEE Transportation Electrification Conference & Expo (ITEC), Chicago, IL, USA, 23–26 June 2020; IEEE: Piscataway, NJ, USA, 2020; pp. 251–256. [Google Scholar]
  38. Bernagozzi, M.; Georgoulas, A.; Miché, N.; Rouaud, C.; Marengo, M. Novel Battery Thermal Management System for Electric Vehicles with a Loop Heat Pipe and Graphite Sheet Inserts. Appl. Therm. Eng. 2021, 194, 117061. [Google Scholar] [CrossRef]
  39. Bernagozzi, M. Development and Characterisation of an Innovative Battery Thermal Management System for Electric Vehicles with Loop Heat Pipes and Graphite Sheets. Doctoral Thesis, University of Brighton, Brighton, UK, 2022. [Google Scholar]
  40. Pelletier, N.; Allacker, K.; Pant, R.; Manfredi, S. The European Commission Organisation Environmental Footprint Method: Comparison with Other Methods, and Rationales for Key Requirements. Int. J. Life Cycle Assess. 2014, 19, 387–404. [Google Scholar] [CrossRef]
  41. Fazio, S.; Biganzioli, F.; De Laurentiis, V.; Zampori, L.; Sala, S.; Diaconu, E. Supporting Information to the Characterisation Factors of Recommended EF Life Cycle Impact Assessment Methods; Publications Office of the European Union: Luxembourg, 2018. [Google Scholar]
  42. Stocker, T.F.; Qin, D.; Plattner, G.-K.; Tignor, M.; Allen, S.K.; Boschung, J.; Nauels, A.; Xia, Y.; Bex, V.; Midgley, P.M. Climate Change 2013: The Physical Science Basis. Contribution of Working Group I to the Fifth Assessment Report of the Intergovernmental Panel on Climate Change; Cambridge University Press: Cambridge, UK, 2013. [Google Scholar]
  43. World Meteorological Organization. Scientific Assessment of Ozone Depletion: 2014, Global Ozone Research and Monitoring Project Report No. 55; World Meteorological Organization: Geneva, Switzerland, 2014. [Google Scholar]
  44. Rosenbaum, R.K.; Bachmann, T.M.; Gold, L.S.; Huijbregts, M.A.J.; Jolliet, O.; Juraske, R.; Koehler, A.; Larsen, H.F.; MacLeod, M.; Margni, M.; et al. USEtox—The UNEP-SETAC Toxicity Model: Recommended Characterisation Factors for Human Toxicity and Freshwater Ecotoxicity in Life Cycle Impact Assessment. Int. J. Life Cycle Assess. 2008, 13, 532–546. [Google Scholar] [CrossRef]
  45. Fantke, P.; Evans, J.; Hodas, N.; Apte, J.; Jantunen, M.; Jolliet, O.; McKone, T.E. Health Impacts of Fine Particulate Matter. In Global Guidance for Life Cycle Impact Assessment Indicators: Volume 1; UNEP/SETAC Life Cycle Initiative: Paris, France, 2016; pp. 76–99. [Google Scholar]
  46. Frischknecht, R.; Braunschweig, A.; Hofstetter, P.; Suter, P. Human health damages due to ionising radiation in life cycle impact assessment. Environ. Impact Assess. Rev. 2000, 20, 2. [Google Scholar]
  47. van Zelm, R.; Huijbregts, M.A.J.; den Hollander, H.A.; van Jaarsveld, H.A.; Sauter, F.J.; Struijs, J.; van Wijnen, H.J.; van de Meent, D. European Characterization Factors for Human Health Damage of PM10 and Ozone in Life Cycle Impact Assessment. Atmos. Environ. 2008, 42, 441–453. [Google Scholar] [CrossRef]
  48. Huijbregts, M.A.J.; Steinmann, Z.J.N.; Elshout, P.M.F.; Stam, G.; Verones, F.; Vieira, M.; Zijp, M.; Hollander, A.; van Zelm, R. ReCiPe2016: A Harmonised Life Cycle Impact Assessment Method at Midpoint and Endpoint Level. Int. J. Life Cycle Assess. 2017, 22, 138–147. [Google Scholar] [CrossRef]
  49. Seppälä, J.; Posch, M.; Johansson, M.; Hettelingh, J.-P. Country-Dependent Characterisation Factors for Acidification and Terrestrial Eutrophication Based on Accumulated Exceedance as an Impact Category Indicator (14 Pp). Int. J. Life Cycle Assess. 2006, 11, 403–416. [Google Scholar] [CrossRef]
  50. Posch, M.; Seppälä, J.; Hettelingh, J.-P.; Johansson, M.; Margni, M.; Jolliet, O. The Role of Atmospheric Dispersion Models and Ecosystem Sensitivity in the Determination of Characterisation Factors for Acidifying and Eutrophying Emissions in LCIA. Int. J. Life Cycle Assess. 2008, 13, 477–486. [Google Scholar] [CrossRef]
  51. Struijs, J.; Beusen, A.; van Jaarsveld, H.; Huijbregts, M.A.J. Aquatic Eutrophication. Chapter 6. In ReCiPe 2008 A Life Cycle Impact Assessment Method Which Comprises Harmonised Category Indicators at the Midpoint and the Endpoint Level. Report I: Characterisation Factors; Ministerie van VROM: The Hague, Netherlands, 2008. [Google Scholar]
  52. Bos, U.; Horn, R.; Beck, T.; Lindner, J.P.; Fischer, M. LANCA®—Characterization Factors for Life Cycle Impact Assessment. Version 2.0.; Fraunhofer Verlag: Stuggart, Germany, 2016. [Google Scholar]
  53. Boulay, A.-M.; Bare, J.; Benini, L.; Berger, M.; Lathuillière, M.J.; Manzardo, A.; Margni, M.; Motoshita, M.; Núñez, M.; Pastor, A.V.; et al. The WULCA Consensus Characterization Model for Water Scarcity Footprints: Assessing Impacts of Water Consumption Based on Available Water Remaining (AWARE). Int. J. Life Cycle Assess. 2018, 23, 368–378. [Google Scholar] [CrossRef]
  54. Van Oers, L.; Guinée, J. The Abiotic Depletion Potential: Background, Updates, and Future. Resources 2016, 5, 16. [Google Scholar] [CrossRef]
  55. CML—Department of Industrial Ecology CML-IA Characterisation Factors. Available online: https://www.universiteitleiden.nl/en/research/research-output/science/cml-ia-characterisation-factors (accessed on 18 December 2024).
  56. Pasaoglu, G.; Fiorello, D.; Martino, A.; Scarcella, G.; Alemanno, A.; Zubaryeva, A.; Thiel, C. Driving and Parking Patterns of European Car Drivers—A Mobility Survey; European Commission: Luxembourg, 2012. [Google Scholar]
  57. Kim, R.H.; Lee, N.H.; Yoon, S.P.; Song, S.H.; Park, J.K. Considerations on the Methane Correction Factor and Fraction of Methane Parameters in the IPCC First-Order Decay Model for Active Aeration Landfills. Waste Manag. 2023, 169, 232–242. [Google Scholar] [CrossRef] [PubMed]
  58. Celata, G.P.; Cumo, M.; Furrer, M. Experimental Tests of a Stainless Steel Loop Heat Pipe with Flat Evaporator. Exp. Therm. Fluid Sci. 2010, 34, 866–878. [Google Scholar] [CrossRef]
  59. Tian, T.; Li, H.; Zhang, W.; Lai, Q.; Xie, Y.; Tan, J. The Start-up Characteristics of a Novel Loop Heat Pipe with Stainless Steel Capillary Wick. Appl. Therm. Eng. 2025, 258, 124553. [Google Scholar] [CrossRef]
  60. Hu, Z.; Wang, D.; Xu, J.; Zhang, L. Development of a Loop Heat Pipe with the 3D Printed Stainless Steel Wick in the Application of Thermal Management. Int. J. Heat Mass Transf. 2020, 161, 120258. [Google Scholar] [CrossRef]
  61. Maydanik, Y.F.; Chernysheva, M.A.; Pastukhov, V.G. Review: Loop Heat Pipes with Flat Evaporators. Appl. Therm. Eng. 2014, 67, 294–307. [Google Scholar] [CrossRef]
  62. Wirsch, P.J.; Thomas, S.K. Performance Characteristics of a Stainless Steel/Ammonia Loop Heat Pipe. J. Thermophys. Heat Trans. 1996, 10, 326–333. [Google Scholar] [CrossRef]
  63. Johnson, J.; Reck, B.K.; Wang, T.; Graedel, T.E. The Energy Benefit of Stainless Steel Recycling. Energy Policy 2008, 36, 181–192. [Google Scholar] [CrossRef]
  64. Capellán-Pérez, I.; Mediavilla, M.; de Castro, C.; Carpintero, Ó.; Miguel, L.J. Fossil Fuel Depletion and Socio-Economic Scenarios: An Integrated Approach. Energy 2014, 77, 641–666. [Google Scholar] [CrossRef]
  65. Li, Y.; Linke, B.S.; Voet, H.; Falk, B.; Schmitt, R.; Lam, M. Cost, Sustainability and Surface Roughness Quality—A Comprehensive Analysis of Products Made with Personal 3D Printers. CIRP J. Manuf. Sci. Technol. 2017, 16, 1–11. [Google Scholar] [CrossRef]
  66. Alvarado, S.; Maldonado, P.; Jaques, I. Energy and Environmental Implications of Copper Production. Energy 1999, 24, 307–316. [Google Scholar] [CrossRef]
  67. Silva, D.d.O.; Riehl, R.R. Thermal Behavior of Water-Copper and Water-Stainless Steel Heat Pipes Operating in Cycles. In Proceedings of the 2016 15th IEEE Intersociety Conference on Thermal and Thermomechanical Phenomena in Electronic Systems (ITherm), Las Vegas, NV, USA, 31 May–3 June 2016; IEEE: Piscataway, NJ, USA, 2016; pp. 6–11. [Google Scholar]
Figure 1. BatPac (a) cooling system schematic and (b) overall module component breakdown (Reprinted from Ref. [27]).
Wevj 16 00100 g001
Figure 2. Loop Heat Pipe schematic.
Wevj 16 00100 g002
Figure 3. A BTMS with a Loop Heat Pipe schematic presentation: (a) placement inside the vehicle; (b) the details of a single module extract. Reprinted with permission from Ref. [38]. 2021, Elsevier.
Wevj 16 00100 g003
Figure 4. A potential LHP BTMS architecture design at the module level for (a) 2 LHPs, (b) 4 LHPs, (c) 6 LHPs, and (d) 10 LHPs. Pipes have been removed from the images for clarity.
Wevj 16 00100 g004
Figure 5. Schematic of battery pack and LHP fluidic lines.
Wevj 16 00100 g005
Figure 6. The weighted LCA results for the cold plate BTMS. The dimensionless unit millipoints (mPt) of the weighted results stands for one-thousandth of the yearly environmental load of an average citizen in Europe.
Wevj 16 00100 g006
Figure 7. The percentage contributions of the product life sectors for the cold plate BTMS, assuming a single score result.
Wevj 16 00100 g007
Figure 8. Weighted LCA results for LHP BTMS. The dimensionless unit millipoints (mPt) of the weighted results stands for one-thousandth of the yearly environmental load of an average citizen in Europe.
Wevj 16 00100 g008
Figure 9. The percentage contributions of the product life sectors for the LHP BTMS, assuming a single score result.
Wevj 16 00100 g009
Figure 10. Comparative LCA results between active cold plate BTMS (benchmark), passive BTMS with LHP in copper (Cu), and passive BTMS with LHP in stainless steel (SS).
Wevj 16 00100 g010
Table 1. A description of the Impact Categories for the Environmental Footprint (EF) Method [41].
Impact CategoryDescription
Climate changeQuantifies GHG emissions using the Intergovernmental Panel on Climate Change (IPCC) 2013 model as a baseline, for a 100 year-time horizon (GWP-100). The impact is measured in kilograms of carbon dioxide equivalents (CO2eq) [42].
Ozone depletionCalculates the destructive effects on the stratospheric ozone layer over a time horizon of 100 years. The impact is measured in trichlorofluoromethane equivalents (CFC-11eq). It uses the World Meteorological Organisation 2014 model as a baseline [43].
Human toxicityAssesses impacts on human health caused by the absorption of cancerous and non-cancerous (measured distinctly) substances. The impact is measured in Comparative Toxic Units for Humans (CTUh), using the USEtox (2008) model [44].
Particulate matter (PM)Assesses disease incidence due to kg of PM2.5 emitted, based on Fantke's (2016) model. The impact is measured in disease incidences [45].
Ionising radiationQuantifies the impact of ionising radiation on the population, based on Frischknecht's (2000) model. The impact is measured in Uranium 235 equivalents (U235eq) [46].
Photochemical ozone formationCalculates the impact of tropospheric ozone formation, based on Van Zelm's (2008) model [47], as applied in ReCiPe2008 [48]. The impact is measured in kilograms of Non-Methane Volatile Organic Compound equivalents (kg NMVOCeq).
AcidificationEvaluates the change in critical load exceedance of the sensitive area in terrestrial and main freshwater ecosystems, to which acidifying substances deposit, based on Seppälä’s (2006) [49] and Posch’s (2008) [50] models. The impact is measured in moles of hydrogen ion equivalents (mol H+ eq).
Eutrophication,
terrestrial
Evaluates the change in critical load exceedance of the sensitive area, to which eutrophying substances deposit, based on Seppälä’s (2006) [49] and Posch's (2008) [50] models. The impact is measured in moles of nitrogen equivalents (mol N eq).
Eutrophication, aquatic freshwater/marineMeasures the degree to which the emitted nutrients reach the end compartment, based on Struijs's (2009) [51] model. The impact is measured in kilograms of phosphorous equivalents for the aquatic freshwater compartment (kg P eq) and kilograms of nitrogen equivalents for the marine compartment (kg N eq).
Ecotoxicity, freshwaterMeasures the toxic effect on aquatic freshwater species, based on the USEtox (2008) model [44]. The impact is measured in Comparative Toxic Units for ecosystems (CTUe).
Land useMeasures four soil properties: biotic production, erosion resistance, groundwater regeneration, and mechanical filtration, based on LANCA® v 2.2 [52] as the baseline model. The impact is measured through a single soil quality score (Pts).
Water useEvaluates the impact on the quantity of water deprived, based on the AWARE model [53]. The impact is measured in terms of volume (m3).
Resource useThe impact of the depletion of natural resources, based on Van Oers and Guinée [54], as implemented in the CML method, v. 4.8 (2016), available at [55]. Energy carriers are considered separately and measured in MJ equivalents, while mineral and metal resources are measured in Sb-equivalents.
Table 2. Battery pack parameters.
ParameterValue
Designated duration of power pulse10
Target pack power, [kW]300
Estimated pack power at target % OCV, [kW]440
Target pack energy, [kWh]100
Number of cells per module12
Number of cells in parallel2
Number of modules in row8
Number of rows of modules per pack4
Number of modules per pack32
Number of modules in parallel2
Cells per pack384
Total cells per battery system384
Battery system capacity, [Ah]284.1
Table 3. The materials for the cold plate BTMS as obtained from the BatPac model. All amounts are in kg.
ComponentsMaterialsAmount
50% CoolantEthylene-Glycol5.52
50% CoolantWater5.52
ManifoldSteel, Chromium Steel 18/81
PanelsSteel, Chromium Steel 18/816.5
PumpAluminium, cast alloy2
Total (kg)30.54
Table 4. A calculation of the amount of piping linked to the LHP BTMS.
Number of modules32
Number of LHP required per module2
Number of LHP fluidic lines2
Total number of pipes128
Battery pack length [mm]1161.6
Average pipe length [mm]580.8
Total pipe length [m]74.35
Table 5. LHP BTMS component mass breakdown and total mass.
ComponentsMaterialsAmount
PipelineCopper8.704
EvaporatorsCopper10.88
Coolant (pipes)Ethanol0.446
Coolant (evaporator)Ethanol0.614
Total (kg)20.644
Table 6. Cold Plate BTMS components, processes, and masses.
Cooling Plate Thermal Management System
ComponentsProcessesAmountUnit
PumpCasting, aluminium, lost-wax2kg
Cooling
Panels
Metalworking, average for chromium steel product manufacturing16.5kg
ManifoldCasting, steel, lost-wax1kg
ManifoldWelding, arc, steel0.628m
Table 7. The materials, masses, and energy consumption of the manufacturing of the LHPs.
Loop Heat Pipe Thermal Management System
ComponentsProcessesAmountUnit
PipelineMetalworking, average for copper product manufacturing8.7kg
Pipeline
(vacuum)
(Vacuum pumps energy consumption)
Electricity, medium voltage
147.84kWh
EvaporatorsMetalworking, average for copper product manufacturing10.88kg
Evaporators
(wick)
(sintering energy consumption)
Electricity, medium voltage
362.88kWh
Table 8. The data used for the estimation of the energy consumption needed for powering the circulation pump of the Cold Plate system.
Pump Power [W]573.07
Average Daily Driving Time [h]1
Battery Lifetime [years]8
Total Driving Time [h]2920
Charge Rate1C
Discharge RateC/3
Total charging time [h] (discharging time/3)974
Pump Working Time [h]3894
Pump Energy Consumption [kWh]2231.15
Table 9. Stainless-steel LHP BTMS updated components and materials.
ComponentsMaterialsAmount (kg)
PipelineSteel, Chromium Steel 18/87.70
EvaporatorsSteel, Chromium Steel 18/89.63
Coolant (pipes)Ethanol0.446
Coolant (evaporator)Ethanol0.614
Total (kg)18.39
Table 10. The process, masses, and energy consumption associated with the production of the SS LHP.
Loop Heat Pipe Thermal Management System
ComponentsProcessesAmountUnit
PipelineImpact extrusion of steel, hot, initial warming7.70kg
PipelineImpact extrusion of steel, hot, deformation stroke7.70kg
PipelineImpact extrusion of steel, hot, tempering7.70kg
Pipeline
(vacuum)
(Vacuum pumps energy consumption)
Electricity, medium voltage
148kWh
EvaporatorsMetalworking, average for steel product manufacturing9.63kg
Evaporators
(wick)
(sintering energy consumption)
Electricity, medium voltage
578kWh
Table 11. The characterised LCA results of the active cold plate BTMS.
Cold Plate System
Impact CategoryUnitTotalMaterials and
Production
Use PhaseDisposal
Climate changekg CO2eq2.05 × 1033.79 × 1021.64 × 1033.01 × 101
Ionising radiationkBq U-235 eq8.12 × 10−52.34 × 10−55.78 × 10−5-
Photochemical ozone formationkg NMVOC eq2.77 × 1023.75 × 1012.39 × 102-
Acidificationmol H+ eq5.701.494.218.95 × 10−3
Eutrophication, freshwaterkg P eq8.37 × 10−52.10 × 10−56.27 × 10−58.34 × 10⁻¹⁰
Eutrophication, marinekg N eq2.38 × 10−56.48 × 10−61.73 × 10−55.11 × 10⁻⁸
Eutrophication, terrestrialmol N eq3.23 × 10−62.76 × 10−64.76 × 10−76.79 × 10⁻¹⁰
Ecotoxicity, freshwaterCTUe1.02 × 1011.878.321.12 × 10−3
Land usePt9.18 × 10−11.38 × 10−17.77 × 10−12.25 × 10⁻³
Water usem3 depriv.2.014.15 × 10−11.573.08 × 10−2
Resource use, fossilsMJ1.92 × 101 3.541.57 × 1011.12 × 10−4
Resource use, minerals and metalskg Sb eq4.35 × 1041.13 × 1043.15 × 1046.38 × 102
Table 12. The characterised LCA results of the passive LHP BTMS.
Loop Heat Pipe system
Impact CategoryUnitTotalMaterials and ProductionDisposal
Climate changekg CO2eq6.14 × 1025.94 × 1022.03 × 101
Ionising radiationkBq U-235 eq4.58 × 10−54.58 × 10⁻⁵-
Photochemical ozone formationkg NMVOC eq1.04 × 1021.04 × 102-
Acidificationmol H+ eq3.543.536.05 × 10−3
Eutrophication, freshwaterkg P eq4.78 × 10−54.78 × 10−55.64 × 10−10
Eutrophication, marinekg N eq1.71 × 10−41.71 × 10−43.45 × 10−8
Eutrophication, terrestrialmol N eq2.47 × 10−62.47 × 10−64.59 × 10−10
Ecotoxicity, freshwaterCTUe1.49 × 1011.49 × 1017.54 × 10−4
Land usePt1.201.201.52 × 10−3
Water usem3 depriv.1.111.092.08 × 10−2
Resource use, fossilsMJ1.31 × 1011.31 × 1017.60 × 10−5
Resource use, minerals and metalskg Sb eq1.12 × 1051.12 × 1054.31 × 102
Table 13. The characterised LCA results for the SS LHP BTMS.
Loop Heat Pipe System in Stainless Steel
Impact CategoryUnitTotalMaterials and ProductionDisposal
Climate changekg CO2eq6.46 × 1026.28 × 1021.81 × 101
Ionising radiationkBq U-235 eq8.51 × 1018.51 × 101-
Photochemical ozone formationkg NMVOC eq1.671.665.39 × 10−3
Acidificationmol H+ eq3.163.166.72 × 10−4
Eutrophication, freshwaterkg P eq2.83 × 10−12.82 × 10−11.35 × 10−3
Eutrophication, marinekg N eq6.20 × 10−16.02 × 10−11.86 × 10−2
Eutrophication, terrestrialmol N eq6.046.046.77 × 10−5
Ecotoxicity, freshwaterCTUe1.35 × 1041.32 × 1043.84 × 102
Land usePt1.60 × 1031.60 × 1036.91
Water usem3 depriv.1.23 × 1021.23 × 102-
Resource use, fossilsMJ7.99 × 1037.99 × 103-
Resource use, minerals and metalskg Sb eq3.28 × 10−33.28 × 10⁻³-
Disclaimer/Publisher’s Note: The statements, opinions and data contained in all publications are solely those of the individual author(s) and contributor(s) and not of MDPI and/or the editor(s). MDPI and/or the editor(s) disclaim responsibility for any injury to people or property resulting from any ideas, methods, instructions or products referred to in the content.

