Featured Application
The findings of this study can support the development of targeted communication strategies and educational campaigns to increase public trust in autonomous vehicles (AVs), tailored to the specific concerns of different generational cohorts. Policymakers and automotive companies can use the generational insights to design age-appropriate outreach programs, ensuring a smoother societal transition to AV integration. Furthermore, urban planners and smart mobility developers may apply the results to anticipate adoption rates among various age groups, enabling more inclusive infrastructure planning and service design for future autonomous transport systems.
Abstract
The rapid technological advancement of autonomous vehicles (AVs)—as exemplified by recent research such as Enhancing High-Speed Cruising Performance of Autonomous Vehicles Through Integrated Deep Reinforcement Learning Framework (IEEE Transactions on Intelligent Transportation Systems, 2025)—raises pressing societal questions about their acceptance. Although numerous studies have examined attitudes toward autonomous vehicles in recent years, most research is limited to a single country, age group, or small sample. As a result, there is still a lack of empirical analyses comparing multiple generations and conducted on large samples that would provide a comprehensive picture of the age-determining factors of social acceptance of AVs. The present study aims to fill this gap with a questionnaire survey of 8663 people, which examines the trust, technology acceptance, and willingness to use autonomous vehicles among the Baby Boomer, X, Y, Z, and Alpha generations using Likert scale items. We used the Kruskal–Wallis test to explore the differences between generations. Our results show significant differences: while Generations Z and Alpha show remarkable openness and trust in AV technology, the Baby Boomer generation shows marked skepticism. The novelty of the research is that it provides large-scale, multi-generational comparative data, thus shedding light from a new perspective on the cultural, experiential, and trust patterns that determine the social acceptance of autonomous vehicles, beyond technological factors. The limitations of the study include self-reported data collection, geographical limitations (Hungary), and the lack of actual driving experience among the Alpha generation, which may affect the validity of the responses. However, these factors point the way for future international and qualitative research. The results can provide practical guidance for decision-makers, developers, and urban planners in developing inclusive, generation-sensitive transportation policies and communication strategies.
1. Introduction
In recent decades, technological advances have fundamentally transformed our daily lives, with transportation becoming one of the most dynamically developing areas. Rapid advances in artificial intelligence, sensor systems, and machine learning have enabled the emergence of self-driving, or autonomous, vehicles. However, autonomous vehicles are not just an engineering innovation but also pose social and ethical challenges that affect public safety, urban planning, and transportation culture. The question today is no longer whether autonomous vehicles will appear in our everyday lives, but how quickly and to what extent society will be able to adapt to them. Acceptance of the technology is not uniform: different social and age groups—especially generations—have different attitudes toward autonomous technologies. Younger generations, who are more digitally competent and open to innovation, tend to view self-driving vehicles more positively, while older age groups are often more skeptical about the technology and its safety. Although there is a growing body of research on the acceptance of autonomous vehicles, most studies are limited to a single age group, country, or small sample. There is a lack of comprehensive, empirical studies that compare multiple generations simultaneously and use statistical methods to reveal differences in attitudes. The present study aims to fill this gap and uses generational theory as its theoretical framework. This theory assumes that each generation is shaped by its own historical, social, and technological context, which determines its values, worldview, and attitudes toward technology. Building on these theoretical foundations, the study aims to explore how different generations—Baby Boomers, Generation X, Generation Y, Generation Z, and Generation Alpha—relate to autonomous vehicles. The research uses quantitative methodology and a Likert scale questionnaire to examine trust in the safety of AVs, willingness to accept them, and intention to purchase and use them. We used the Kruskal–Wallis test to statistically analyze the differences between generations.
We have formulated the following hypothesis: the assessment of the safety and reliability of autonomous vehicles differs significantly between different generational groups, resulting in measurable differences in terms of acceptance and intention to use. This hypothesis is grounded in the notion that the acceptance of autonomous vehicles is not merely a technological or economic issue, but is strongly linked to generational identity, technological trust, and cultural experience.
Accordingly, the research seeks answers to the following questions:
- How safe do consumers feel self-driving vehicles are?
- To what extent do they trust autonomous systems?
- Would they be willing to use or purchase such technology?
- Do they consider the self-driving function in vehicles to be a value-adding factor?
The timeliness of the topic is also supported by the fact that autonomous vehicles are now present not only in experimental environments but also in real traffic worldwide. However, the extent to which they are accepted has a significant impact on the extent to which the social benefits of technology such as a reduction in accidents, increased transport efficiency, and a reduction in environmental impact—can be realized. The limitations of this study include the fact that data collection is based on a self-reported questionnaire method, which may be subject to subjective bias; the study is geographically limited to Hungary, so the results cannot be generalized to all socio-cultural contexts; and in the case of the Alpha generation, the lack of actual driving experience may affect the reliability of attitudes. At the same time, these factors also point the way for future international and qualitative research. The results of the study contribute to a deeper understanding of the acceptance of autonomous vehicles from both a scientific and practical perspective and help decision-makers, developers, and urban planners to develop generation-sensitive, inclusive, and socially accepted transportation solutions.
2. Literature Review
The development of self-driving technology has exploded in recent decades and is expected to fundamentally transform transport and social interactions. These technologies are based on automation and artificial intelligence, which enable vehicles to operate independently and autonomously [1,2]. In addition to changing the way we drive, these developments will also bring new industry trends and innovations, for example, through the digitalisation of the automotive industry and changing consumer expectations [3,4]. From the point of view of consumer acceptance, research shows that society’s readiness for the technology is variable and not homogeneous: many people’s opinions are polarized, which makes the acceptance of vehicles difficult [5,6]. The social perception of self-driving vehicles depends not only on technological developments, but also on cultural, social and psychological factors (Table 1) [7,8].
Furthermore, differences between women and men in the acceptance of self-driving cars are also observed, as driving habits and attitudes differ by gender [5,9]. Ethical and legal issues are also currently on the agenda for the introduction of self-driving vehicles, which legislators urgently need to work on to facilitate the social integration of new technologies [10,11]. The future of autonomous transport will also entail a transformation of urban infrastructure, including the optimization of transport systems, traffic reduction and sustainable mobility [12,13].
Finally, research has analyzed a limited number of test and empirical data that suggest that self-driving vehicles will play a key role in more efficient mobility solutions [2,14]. Extensive research is needed to promote the adoption of the technology and change transport habits so that society can smoothly adapt to the development of autonomous vehicles.
2.1. Self-Driving Cars
The proliferation of self-driving cars (AVs) is one of the most significant technological developments of our time, with the potential to transform not only transport but also society as a whole. One of the main drivers behind the professional and scientific focus on autonomous vehicles is the rapid development of artificial intelligence (AI), which enables AVs to drive safely and efficiently [15]. The acceptance of the technology and social attitudes are key to the widespread adoption of these vehicles [15]. The need for safety is the main factor that consumers consider when evaluating the benefits of self-driving cars, followed by functional and subjective factors [16]. Research on accident reduction shows that autonomous technology can dramatically reduce the number of road accidents, thereby increasing safety not only for drivers but also for road users [17]. However, the acceptance of AVs by users is not without concerns, for example, due to technological failures or the possibility of hacking [15]. The impact on urban infrastructure is also significant, as the use of self-driving cars is expected to transform urban transport patterns [18]. The use of AVs in fleets could reduce the number of vehicles on the road, which could have a positive impact on the environment and urban quality of life [19]. The transport habits of urban people and business models could also adapt to the widespread emergence of AVs, offering new opportunities for sustainable urban mobility [19]. In addition, tourism could also benefit significantly from the introduction of autonomous vehicles: self-driving cars could make it easier and more convenient for tourists to get to different destinations, leading to the emergence of new tourism services [20]. Experts believe that the uptake of AVs could fundamentally change the travel experience [20]. However, in addition to social acceptance, it is important to consider the technological and legal framework. International regulation and legal frameworks for self-driving cars have not yet kept pace with technological progress, and it is therefore essential to accelerate the development of legal frameworks and reliable, safe autonomous systems [21]. Accidents and legal liability should also be on the global agenda [15].

Table 1.
Social and Technological Factors Influencing the Acceptance of Autonomous Vehicles.
Table 1.
Social and Technological Factors Influencing the Acceptance of Autonomous Vehicles.
| Factor Type | Description | Source(s) |
|---|---|---|
| Technological Progress | Development of AI, sensors, automation | [1,2,15] |
| Safety | Reduction in traffic accidents, increased passenger protection | [16,17] |
| Cultural Attitudes | Generational differences in openness to innovation | [22,23,24,25,26,27,28,29,30,31] |
| Legal Framework | Gaps in international and national regulation | [10,11,21] |
| Ethical Concerns | Responsibility, decision-making algorithms, autonomy issues | [10,11,15] |
| Gender Differences | Varying mobility preferences and risk perception between men and women | [5,9] |
| Urban Infrastructure | Adaptation of transportation systems in smart cities | [12,13,18,19] |
| Environmental Aspects | Lower emissions, fewer vehicles through shared fleets | [19,20] |
In conclusion, the development of self-driving cars is not only a technological achievement, but could also bring about profound social, urban planning and economic changes. The long-term success of these vehicles will depend on society’s ability to adapt to this new form of mobility and on the timely resolution of legal and ethical issues.
2.2. Generations
The concept of generations is an important social science issue, looking at the lifestyles, values, cultural norms and technological affinities of different age groups. Generational theories help us to understand the impact of social and economic changes on particular age groups and also provide an opportunity to analyze social interactions [22].
Baby Boomers (1946–1964)
The Baby Boomers were born in the post-World War II era and typically represent traditional family values. Their lives have been characterized by economic booms and rising social standards of living. People of their generation have favored job stability and have witnessed a significant increase in high school and university education. Their political and social activism, such as civil rights movements, has played an important role in social change [23].
Generation X (1965–1980)
Generation X, also known as the “waning generation”, is characterized by their honest and independent values. Compared to the Baby Boomers, they were exposed to a much greater flood of information, due to technological advances, especially the computer revolution. They are pragmatic and more inclined to seek a work–life balance. Their attitude to work is therefore variable, and they have shown adaptability in many areas, given the economic depression in which they spent their young adulthood [24].
Generation Y (Millennials, 1981–1996)
Generation Y, also known as the Millennials, grew up in the golden age of technological progress and navigating the digital world has become an integral part of their ontological experience. They are the first generation to have grown up with the rise of the global internet and mobile technology. Generation Y members are generally more open to diversity and more environmentally aware than their predecessors. Their labor market preferences are dominated by flexible working hours and a sense of corporate social responsibility [25].
Generation Z (1997–2012)
Generation Z is known as the generation of digital natives, having never experienced the world without an internet connection. They are characterized by the central role of technology, social media and virtual connections. Generation Z members are already expected to seek their quasi-workplace and transport preferences within the digital medium and expect their workplaces, as well as their everyday lives, to be adventurous. Social justice and environmental awareness play a significant role in their values [26].
Alpha Generation (2013-present)
Generation Alpha, the youngest generation, is growing up with the latest technological advances such as artificial intelligence and automation. They will experience almost every aspect of the digital world in their daily lives, and are likely to face the greatest technological impacts. As technological innovations become the norm for Generation Alpha, it is expected that environmental awareness, healthy living and the science of global issues will also feature prominently in their public memory [27].
Showing different generations is an integral part of understanding the complex fabric of society. Each generation interprets the world from a different perspective, which provides an opportunity to analyze the economic and social consequences and intergenerational relations. Understanding intergenerational differences helps to predict social dynamics and future trends, an aspect that is also of paramount importance for policy decisions and economic planning [28].
2.3. Generation-Specific Elements of Self-Driving Cars
When presenting generation-specific elements, it is important to take into account the technological nativities, values and cultures of different age groups (Table 2). New technologies, especially self-driving cars, reach different generations in different ways and play different roles in the lives of each generation. Members of the Baby Boom generation have experienced the beginnings of technological advances alongside their adherence to traditional values, which reinforces their commitment to manual cars and classic modes of transport. Many members of the Baby Boom generation are more attached to the familiar driving experience and technological innovations such as self-driving cars may initially be alien to them [29]. At the same time, their need for safety may reinforce their acceptance of self-driving technologies if the vehicles are able to guarantee accident reduction [30].
Table 2.
Generational Attitudes Toward Autonomous Vehicles.
Generation X members have grown up in a time of technological change and have experience with the digital transition. This generation is sensitive to external influences and is also committed to sustainability and social responsibility in relation to autonomous driving [31]. However, they may also be skeptical about the changes brought about by self-driving technologies, which may be caused by their strong attachment to traditional driving [32].
Generation Y, which grew up in the middle of the digital revolution, is much more open to self-driving cars. For them, technological innovations are not just tools, but part of a way of life, and they are taking a creative approach to self-driving technologies in terms of transport solutions [33]. Their acceptance of this type of vehicle may be strengthened, especially if it meets the generation’s expectations, such as comfort and environmental protection [34].
Generation Z is the child of the digital age, where technology and self-driving cars are taken for granted. Their vision of mobility is more focused on sharing services, sustainability and environmentally conscious transport. They are particularly attracted by the potential of self-driving cars to save time and offer new transport experiences, including avoiding traffic jams [35]. At the same time, there can be a lack of trust in technology, especially in relation to digital security and regulation [36].
Generation Alpha is characterized by growing up with the latest technologies, relying even more on digital solutions than their predecessors. For members of the youngest generation, self-driving cars are a natural and expected solution, with additional features such as advanced entertainment systems [37]. As this generation is not yet old enough to have direct experience of self-driving cars, the evolution of their future driving habits is closely linked to the evolution of technology [38].
Overall, taking into account generation-specific elements will allow a better understanding of the societal impact and market acceptance of self-driving cars. Each generation has a different approach to technological innovation, which creates opportunities to optimize and increase the acceptance of future mobility solutions, especially in the areas of safety, sustainability and comfort [39].
The development of autonomous vehicles is not an isolated process, but part of a broader technological ecosystem shaped by the rapid advance of industrial automation, artificial intelligence (AI), and smart technologies. In recent years, self-driving cars have not only become more advanced on a technical level, but their symbolic significance has also grown: they have become an iconic technology of the “digital age,” embodying both technological progress and new forms of human–machine interaction. As a result, society’s perception of autonomous mobility is undergoing a profound transformation, particularly in terms of generational differences in attitude. The integration of artificial intelligence into the control of self-driving vehicles is one of the most important trends, opening up new dimensions in safety, predictive decision-making, and user experience. AI-based systems are now capable of sensing, interpreting, and responding to environmental stimuli in real time, while continuously learning from driving situations. This adaptive operation enhances vehicle efficiency and safety, but also raises new questions about human control, transparency, and decision-making responsibility. For younger generations—especially Gen Z and Gen Alpha—such AI systems are no longer foreign: smart devices, generative artificial intelligence, machine recommendation systems, and virtual assistants have become part of their everyday lives. This early exposure to technology fundamentally influences how they interpret the operation and reliability of autonomous vehicles. The technological socialization of younger generations is rooted in the “digital native” experience, which is characterized by constant online presence, data-driven decision-making, and the normalization of machine intelligence. Since members of this age group have been exposed to automated systems at an early age—such as smart homes, autonomous robot vacuum cleaners, drones, and voice-activated assistants—autonomous vehicles are not unfamiliar to them, but rather a natural evolutionary step. This experiential advantage contributes to their trust in AI-based decision-making and reduces their psychological resistance to new technology. According to research, younger generations have significantly higher levels of perceived usefulness and perceived trust in autonomous systems than older age groups [40].
In contrast, for older generations—especially Baby Boomers and Generation X—AI-driven automation is much more a symbol of loss of control. While young people see automation as a source of convenience and efficiency, older people are often wary of “black box” decision-making, in which machines appear to act without human supervision. This difference stems in part from differences in technological socialization environments: earlier generations grew up in the age of analog rather than digital technologies, so artificial intelligence is less transparent and less predictable for them. Another key trend is the integration of automation and intelligent networks into transportation infrastructure. Self-driving cars do not exist in isolation but are increasingly part of an intelligent transport ecosystem in which vehicles communicate with each other (Vehicle-to-Vehicle, V2V), with the infrastructure (V2I), and with the user’s digital environment (V2X). Such networks enable traffic optimization, accident prevention, and collective decision-making by vehicles. However, technological advances are eliciting different responses across generations: younger users are more open to data sharing and digital connectivity, while older generations are more distrustful of data security. This generational difference is particularly important when examining the acceptance of autonomous vehicles, because AI and automated systems are not just technical developments, but also trust constructs. Trust in technology is based on past experiences, perceived transparency, and cultural values—and significant differences can be observed between generations in all three dimensions [41]. For younger age groups, artificial intelligence is a “human-like” technology, while older people tend to perceive it as a mechanical, alienating phenomenon. New trends are therefore not only shaping the technological parameters of self-driving vehicles, but also profoundly shaping user perceptions and generational attitudes. The spread of artificial intelligence, automation, and smart technologies is increasingly blurring the line between “machine” and “human” decision-making, thereby redefining the social meaning of mobility. The younger generations’ exposure to AI-driven technologies not only reduces their trust but also their perception of risk associated with autonomous systems, which may explain why they are more willing to try and accept self-driving vehicles. A deeper analysis of this trend provides valuable context for research examining generational differences, as it highlights that attitudes toward technological innovation are not only a matter of demographics, but also of digital socialization experiences.
2.4. The Rapid Development and Research Significance of Autonomous Driving Technology
The technological development of autonomous vehicles has been progressing at a faster pace than ever before in the last decade and has now become one of the most dynamically developing areas of transportation systems. The industry’s development is driven by breakthroughs in artificial intelligence, sensor fusion, real-time decision-making, and data sharing. Vehicles are no longer controlled solely by pre-programmed algorithms, but by deep learning and reinforcement learning systems that are capable of learning, adapting, and optimizing driving strategies in real time. This development is not just a technical curiosity: it fundamentally influences the social perception and acceptance of autonomous mobility. The latest research shows that the development of autonomous vehicles is shifting from classic, rule-based control approaches towards deep reinforcement learning (DRL), one of the most advanced and dynamic branches of machine learning. DRL-based systems are capable of learning from environmental feedback and continuously recalculating optimal decisions based on the current state of the vehicle and changes in the environment. A prominent example of this technology is the study entitled “Enhancing High-Speed Cruising Performance of Autonomous Vehicles Through Integrated Deep Reinforcement Learning Framework,” published in 2025 in the IEEE Transactions on Intelligent Transportation Systems journal [42]. The aim of the research was to improve the high-speed cruising stability and safety of autonomous vehicles using an integrated deep reinforcement learning framework. The authors developed a model system that combines vehicle dynamics, sensory data, and predictive decision-making, enabling autonomous, adaptive control even in high-speed environments. The novelty of the article lies in the fact that it integrates traditional control architectures into a unified learning framework, in which the vehicle is able to incorporate experiences from different situations—such as lane changes, overtaking, braking, and avoiding congestion—into its future decisions. The DRL model continuously evaluates the environment and optimizes vehicle behavior through a “reward system,” enabling it to simultaneously increase safety and efficiency. Developments of this type are revolutionizing autonomous driving because vehicles respond not according to static rules, but based on real-time experiences—this kind of adaptivity creates dynamics similar to human learning. Another key element of technological development is multimodal sensor fusion, which allows the vehicle to integrate data from multiple sensors (LIDAR, RADAR, camera, GNSS, ultrasound, and V2X communication) for more reliable perception of the environment. While environmental perception used to be the weakest point of autonomous vehicles, today’s artificial intelligence-based sensor fusion algorithms are capable of dynamically correcting perception errors and adapting to visual conditions. The latest systems are capable of detecting and responding to traffic events with a reaction time of 10–20 ms, which is practically equivalent to human reflex time [43]. In addition to safety, this development also increases perceived reliability, which is directly linked to the social acceptance of autonomous vehicles.
Technological advances are spectacular not only in the areas of control and perception, but also in system-level adaptivity and self-correction. New-generation control models are capable of recognizing their own uncertainty and modifying their decision-making strategy, when necessary, thereby avoiding erroneous interventions. The emergence of self-aware control architectures, together with reinforcement learning frameworks, heralds a new technological era in which the vehicle is no longer merely an executive tool, but an independent decision-making system. However, this autonomy also raises new types of trust issues, as the transparency and predictability of “machine decisions” are key to user acceptance of the technology [44].
The rapid advancement of autonomous driving technology is therefore significant not only from an engineering standpoint, but from many other perspectives as well. The emergence of more advanced systems also induces social and psychological changes: it transforms people’s relationship to mobility, safety, and control. From the user’s point of view, this development has a dual effect: on the one hand, it increases safety and efficiency, but on the other hand, it raises new questions about the relationship between humans and machines, for example, in the areas of responsibility, data security, and ethical decision-making. Younger generations, who have been socialized in a digital environment, typically respond more positively to such systems and accept technological innovation as a natural development. Older generations, on the other hand, are more likely to feel threatened by the loss of human control and are slower to develop trust, especially in the case of fully autonomous Level 4–5 systems. The speed of technical development and technological transparency therefore have a direct impact on social trust and, through this, on technology acceptance models (TAM, UTAUT). More advanced autonomous systems, such as those presented in [45] (Figure 1), are capable of reducing the level of perceived risk by significantly mitigating the risk arising from human error. At the same time, users’ psychological sense of safety does not always keep pace with technological developments. The literature describes this as the “trust paradox”: the more advanced and autonomous the technology, the greater the objective safety it provides, but from the user’s perspective, the feeling of unpredictability may increase [46]. Based on all this, the technological background of autonomous vehicle development is not only important in an engineering context, but also of fundamental importance for social science research. The speed, complexity, and adaptability of technological innovation determine how trust, risk perception, and willingness to accept are formed across different generations and cultures. Thus, the presentation of the development of AV technology not only complements but also reinforces the research value of the thesis: it places the dynamics of technical innovation in close connection with the study of human factors and builds a bridge between engineering and social science research.
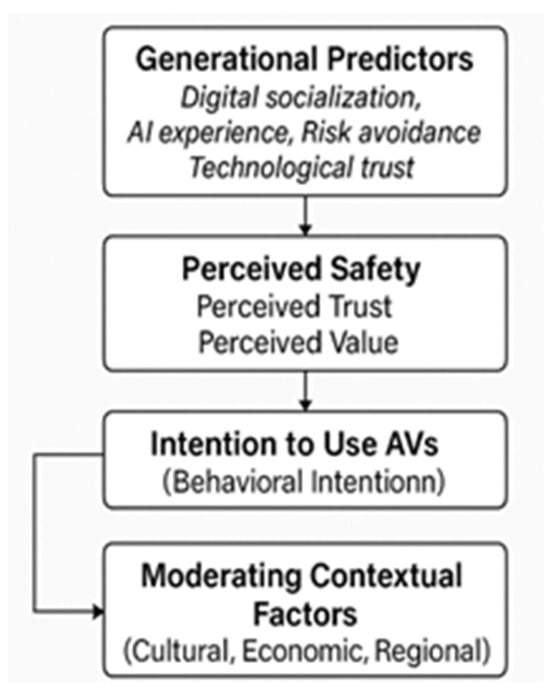
Figure 1.
Conceptual model of generational factors in the acceptance of self-driving vehicles; source: own editing [45] based on reference.
2.5. The Impact of Cultural, Economic, and Regional Contexts on Generational Attitudes Toward the Acceptance of Autonomous Vehicles
The literature examining the acceptance of autonomous vehicles (AVs) no longer treats the topic as a purely technological issue, but increasingly as a socio-technological complex system. The social integration of AV technology depends not only on the technical reliability of the innovation, but also on the cultural, economic, and regional contexts in which individuals and generations interpret and accept the new transportation paradigm. However, previous research has mostly treated these factors in isolation or superficially, so the reasons for generational differences are often unclear. Cultural background plays a decisive role in how people relate to automated systems, especially when they replace human decision-making. Cultural differences influence the concepts of trust, perceived risk, autonomy, and sense of control, which are key factors in AV acceptance [45]. Of Hofstede’s cultural dimensions, uncertainty avoidance and power distance are particularly relevant. Societies with high uncertainty avoidance, such as Germany, France, and Hungary, tend to be cautious about fully autonomous systems, as they symbolize a loss of human control [46]. In contrast, cultures with low uncertainty avoidance (e.g., Sweden, the Netherlands) perceive innovation as an opportunity rather than a threat. In collectivist cultures (e.g., China, South Korea), autonomous vehicles are often treated as a means of community welfare and safety, so willingness to accept them is evident not only at the individual level but also at the societal level [47]. In such cultural environments, younger generations tend to have greater trust in centrally regulated technological developments than their Western counterparts, for whom autonomous vehicles are more of an individual convenience tool.
Cultural background therefore not only influences technological trust, but also shapes generational attitudes. Younger generations (Y, Z, Alpha) around the world are more open to automation, but the extent of this openness depends on the values that dominate in a given culture. In a collective, technology-friendly culture (such as South Korea), Generation Z takes algorithmic decision-making for granted, while in an individualistic, security-oriented environment (such as Germany), the same age group tends to emphasize the preservation of human oversight [48].
2.6. Economic Factors: Development, Income Level, and Infrastructure
The level of economic development and technological infrastructure is key to how quickly trust in AV technology develops in different regions and generations. In developed economies, where digitalization and intelligent transport systems are already integrated into everyday life, the acceptance of autonomous vehicles is spreading more quickly and is less generation dependent [49]. In higher-income societies (e.g., Western Europe, North America), the availability and familiarity of AV technology strongly correlate with trust. In these countries, younger generations are often in a better financial position to try out new technologies (e.g., shared mobility services, self-driving taxis), thus building trust through experience.
In contrast, in developing regions—such as Southeast Asia or Eastern Europe—economic constraints (lower incomes, inadequate infrastructure) hinder the spread of autonomous systems, especially among older generations, who are more risk-averse and less open to technological innovations [50]. In such an environment, AVs are often perceived as a “luxury item” or “elite technology,” which increases the socio-economic gap between generations. However, the economic context is not only a limiting factor, but also a shaping factor. In affluent societies, safety and environmental arguments are more prominent (e.g., accident prevention, emission reduction), while in developing countries, AVs are seen more in terms of efficiency and improved mobility. These differences are also reflected in generational attitudes: younger, more mobile generations appreciate the convenience and time savings of AVs, while older generations primarily focus on financial returns or safety [51].
2.7. Regional Differences and the Role of Infrastructure
The regional context includes not only economic factors, but also infrastructural and regulatory factors. The basic prerequisites for AV technology to function are a developed communications network (e.g., 5G/6G), intelligent transport infrastructure (sensor network, V2X communication), and regulatory stability. In countries where these conditions are met—such as Japan, Singapore, Germany, or the United States—the population associates autonomous mobility with a higher sense of safety, regardless of generational affiliation [52]. In contrast, in less developed regions where AVs are still in the experimental stage, there is a stronger perception of uncertainty and technological risk. Regional experience is therefore crucial: user confidence depends largely on whether they have encountered similar technology before and what social narrative is associated with it. The differences observed between regions also result in divergent patterns at the generational level. For example, in the United States and Western Europe, younger generations see AV as an extension of personal freedom (“more time, less stress”), while in East Asia it is more of a symbol of collective safety and efficiency [53]. Different interpretative frameworks are shaped by cultural values and infrastructure development and determine the social embeddedness of technology.
2.8. Cultural–Economic–Regional Interactions and Generational Effects
Cultural, economic, and regional factors interact closely with each other to influence generational attitudes. In a developed, innovation-friendly country (e.g., South Korea), even older generations are more likely to accept autonomous vehicles because the national discourse treats technological development as a social value. In contrast, in a region with high uncertainty avoidance and low technological trust (e.g., Central Europe), older generations are much more conservative and more likely to reject systems without human control [54]. Past technological transitions (e.g., the introduction of electric vehicles or digital navigation systems) also leave their mark on social attitudes. Regions where the population has successfully adapted to previous innovations are more confident about autonomous vehicles. In this context, younger generations are “digital natives,” while older generations are more like “digital immigrants” for whom algorithmic decision-making is more unfamiliar and less transparent. Future research therefore needs to establish an integrated conceptual model in which cultural values, economic conditions, and regional infrastructure act as moderators or mediators in the chain linking generational attitudes and AV acceptance. Only in this way can we comprehensively understand why different generations show different patterns of trust, risk, and evaluation in relation to autonomous mobility.
Based on a review of the literature, it has become clear that the acceptance of autonomous vehicles (AVs) cannot be explained solely by individual psychological factors (e.g., trust, perceived usefulness, safety). The social embeddedness of technology and the perception of technology by different generations are shaped by cultural, economic, and regional contexts. The proposed conceptual model depicts these factors as a hierarchical and interactive system, where contextual variables indirectly influence AV acceptance through generational attitudes.
(A) External contextual factors (Exogenous Variables)
Cultural factors
Uncertainty avoidance: The higher the level, the lower the willingness to accept autonomous technologies [55].
Individualism–collectivism: In individualistic cultures, AV is interpreted as a means of personal freedom, while in collectivist cultures it is interpreted as a means of community security [56].
Technological norms and narratives: National discourse (“man over machine” vs. “man working with machine”) shapes trust patterns and generational interpretations.
Economic factors
Macroeconomic development: GDP per capita and innovation index correlate positively with AV acceptance [57].
Income inequality: Price sensitivity and perceived risk are higher in low-income groups, especially among older generations.
Technological accessibility: AV test environments, shared mobility services, and infrastructure investments promote generational experience expansion.
Regional factors
Infrastructure availability: Users in regions with more advanced V2X and 5 G/6 G networks perceive higher perceived safety [58].
Regulatory stability: A clear legal environment (e.g., AV certification systems) strengthens institutional trust.
Previous technological transitions: Experience with previous successful innovations (e.g., electric vehicles, intelligent transportation systems) increases social trust in AV technologies [59]. These three context groups influence AV acceptance not in isolation, but in interaction with each other. For example, cultural norms of trust and economic development together determine the extent to which a given generation views AV as a reliable and valuable technology.
The role of education, media communication, and public policy in shaping technological trust and generational attitudes
This study examines generational attitudes toward autonomous vehicles (AVs), but it is important to emphasize that these attitudes are not formed in isolation, but rather as a result of social and cultural learning processes. The degree of technological trust is not only determined by individual experiences or age characteristics, but is also significantly influenced by educational processes, media narratives, and government and public policy interventions. Together, these three factors can bridge the gap between generations, promoting the social acceptance of autonomous mobility.
The role of education in strengthening technological literacy and trust
Education is a fundamental tool for building technological trust, as it directly shapes people’s knowledge, skills, and attitudes toward modern technologies. For younger generations—especially Y, Z, and Alpha—the use of digital technologies is a natural part of everyday life, so autonomous systems seem like a logical step in their development. In contrast, older generations, primarily Baby Boomers and Generation X, did not encounter artificial intelligence or automated decision-making systems during their school years, so these technologies are unfamiliar and less transparent to them. One of the most effective ways to build trust is to expand educational programs for all ages. Higher education and adult education institutions can incorporate the topic of “mobility of the future” into their courses, covering not only the technical operation of self-driving systems, but also their ethical, legal, and social implications. It is equally important to promote lifelong learning: community education programs, retirement academies, or local innovation workshops can provide opportunities for older generations to learn firsthand about how the technology works and its safety guarantees. It is worth incorporating the functioning of automated systems, the ethical issues of artificial intelligence, and the digital aspects of transport safety into primary and secondary education at an early stage. This not only provides technical knowledge, but also contributes to the responsible use of technology and the development of a conscious civic attitude. Numerous studies show that increased knowledge and competence directly reduce technological anxiety and increase trust, making education crucial to both the cognitive and emotional dimensions of trust building.
2.9. The Impact of Media Campaigns and Community Communication
The media plays a decisive role in how people interpret new technologies. Younger generations mainly encounter content related to self-driving vehicles through online platforms, where the emphasis is often on innovation, convenience, and future orientation. Older generations, however, typically obtain their information from traditional media—television, radio, newspapers—where news stories often highlight accidents, technological failures, or ethical debates. This difference may contribute to a generational trust gap. A comprehensive, fact-based media communication strategy can help address this situation. Awareness campaigns that use real data and positive examples to showcase the benefits of autonomous systems—such as accident prevention features, environmental impacts, or services that aid the mobility of the elderly—can convey a more nuanced picture of the technology. Stories that reinforce emotional identification, such as the case of an elderly passenger being safely transported home, have a greater impact on the emotional side of trust than mere technical arguments. It is also important to take generational media preferences into account: while members of Generation Z and Alpha can be reached with video and interactive content, expert interviews, TV reports, and printed materials may be more effective for Generation X and Baby Boomers. Countering false information is also part of successful campaigns: sensationalist news reports can distort public trust, so there is a need for official, controlled communication channels—such as government or university information portals—that provide reliable information on current developments and safety results in AV technology.
The role of public policy and regulation
The public policy environment creates the institutional foundations for social trust. It is the responsibility of the state to provide a clear legal framework for the operation of autonomous vehicles, thereby signaling that the technology is under supervision and not an “uncontrolled experiment.” Transparent regulations—such as clear definitions of liability issues, data protection, and certification—increase citizens’ sense of security. Governments should also support practical experience. Experimental self-driving bus services, autonomous vehicles on university campuses, and public demonstrations give people the opportunity to experience the technology for themselves. Experiential learning is an effective way to reduce mistrust, as direct experience often has a stronger impact than theoretical knowledge. Public policy measures are most effective when representatives of different generations are involved in decision-making. Such participatory models—such as civil advisory bodies or public consultations—not only increase democratic legitimacy, but also provide an opportunity for the concerns of older generations and the suggestions of younger generations to be reflected in regulation.
An integrated approach: the three pillars of trust building
The development of technological trust is a multi-factor process in which education, the media, and public policy reinforce each other. Education ensures understanding, the media conveys knowledge and gives emotional meaning to technology, while public policy institutionalizes safety and ethical standards. When these areas work in concert, they can bridge the trust gap between generations. For example, when an older person attends a community presentation on self-driving vehicles (education) then sees a report showing how these systems have reduced the number of accidents (media), and knows that the government requires strict safety certification (policy), they receive a triple confirmation of trust. Technological trust is not only a psychological construct, but also a socio-political one. Shaping attitudes toward self-driving vehicles is a responsibility for society as a whole: education, the media, and public policy can together create a cultural and institutional environment in which innovation elicits curiosity and cooperation rather than fear. The generation gap can be bridged through the coordinated development of these three pillars, enabling autonomous mobility to succeed not only technologically, but also socially.
2.10. The Role of Fuel Cell Electric Vehicles in Strengthening the Reliability and Social Acceptance of Autonomous Mobility
Parallel to the development of autonomous vehicles (AVs), a fundamental transformation is taking place in the transport sector in terms of energy supply and powertrain technology. Clean energy powertrains, including fuel cell electric vehicles (FCEVs), are gaining increasing attention as they combine the environmental benefits of electric propulsion with the advantages of long range and fast refueling. This dual advantage is particularly important for autonomous vehicles, where operational capability, system stability, and reliability determine user confidence and societal acceptance of the technology.
2.11. Technical Advantages of FCEV Technology in Autonomous Systems
The basic principle of FCEVs is the electrochemical conversion of hydrogen into electrical energy in the vehicle’s on-board fuel cell. The only by-product of this energy conversion is water vapor, so the system ensures locally zero-emission operation. Due to the high energy density of the fuel cell, vehicles can achieve a range of 500–800 km on a single tank, which significantly exceeds the performance of most battery electric vehicles (BEVs) [60]. In addition, FCEVs have a refueling time of only 3–5 min, making their energy supply continuity and fleet availability orders of magnitude better than that of conventional electric vehicles, which typically take 30–90 min to charge. From an autonomous mobility perspective, this fast energy recharge and stable range are particularly advantageous, as the operation of AV fleets is greatly influenced by the operating time efficiency of the vehicles. Services such as self-driving taxi or logistics systems require a high degree of energy independence and fuel supply reliability, which FCEV systems provide optimally. According to the study Hydrogen-Based Fuel Cell Systems for Autonomous Mobility Applications [61], hydrogen-powered systems increase fleet-level vehicle availability by 15–20% compared to pure battery systems, especially in low-temperature environments where battery performance declines. The robustness of FCEVs under extreme temperature conditions is also a significant advantage for autonomous transportation. The efficiency of conventional lithium-ion batteries can deteriorate by as much as 30–40% below −10 °C, while fuel cell systems remain stable because the electrochemical reaction is less sensitive to temperature. This performance stability contributes to the predictability of vehicle range and operating time, which directly influences user confidence in autonomous systems.
2.12. Health-Conscious Energy Management and Integrated Thermal Management
The latest research trends are not only aimed at improving the efficiency of the powertrain, but also at maintaining the long-term “health” of the system components. The so-called health-conscious energy management approach combines the optimization of energy consumption with the maximization of component lifetime. An important element of this is the integrated thermal management strategy, which jointly controls the energy requirements of the fuel cell, battery, cooling system, and passenger compartment [62]. In the IEEE study entitled Integrated Thermal Management Strategy for Fuel Cell Electric Vehicles Considering Cabin and Powertrain Systems [63], researchers developed a real-time model predictive algorithm capable of dynamically distributing thermal energy between the cabin and the powertrain. The results show that the system increased energy efficiency by 8–12% while reducing the thermal load on the fuel cells by 20%, thereby increasing their service life. In autonomous vehicles, energy management is not only a technical issue, but also a functional safety issue: optimal thermal management ensures that the vehicle’s systems operate in a stable and predictable manner, which is key to the reliable performance of self-driving algorithms. Artificial intelligence-based control of thermal management systems enables predictive and adaptive control that takes into account environmental conditions (e.g., terrain, temperature, load) and user requirements (comfort level, cabin temperature) in advance. This integrated approach is one of the most important technological foundations for the operational stability and energy efficiency of autonomous systems.
2.13. Indirect Impact of FCEV Technology on the Social Perception of Autonomous Mobility
Improvements in technological performance directly influence users’ perceived reliability and perceived value (perceived value). The acceptance of autonomous vehicles is closely linked to the extent to which users trust in the stable, predictable operation of the vehicle. The high availability and long service life offered by FCEV powertrains contribute to this trust. For younger generations, especially cohorts Y and Z, environmental awareness and technological openness play an important role in their assessment of the technology. For them, hydrogen-based energy is not only innovative, but also a symbol of sustainability that is in line with their lifestyle and ethical values [64]. Environmentally friendly operation and energy efficiency thus add a positive emotional charge to the perception of autonomous vehicles, increasing their acceptance. In contrast, older generations tend to approach the issue from the perspective of technological safety and reliability. For them, the stability and maintainability of FCEVs are more important than environmental considerations. In the context of autonomous mobility, this difference means that FCEV technology increases acceptance through a dual mechanism: it strengthens technological confidence in terms of sustainability for younger generations and in terms of safety for older generations. In addition to generational differences, the development of FCEVs also has different effects in a regional dimension. In more developed countries (e.g., Japan, South Korea, Germany), the development of hydrogen-based mobility infrastructure has already begun, further strengthening user confidence. However, in countries where the hydrogen refueling network is still in its infancy, barriers to trust and acceptance remain significant [65].
As the development of clean and low-emission powertrain technologies progresses in parallel with autonomous vehicle systems, it is becoming increasingly clear that certain, currently often underestimated characteristics of fuel cell electric vehicles (FCEVs) could play a key role in the operability and social acceptance of future autonomous mobility services. The particularly long range of FCEVs, their robust performance in cold weather conditions, and their extremely fast hydrogen refueling capabilities are advantages that are not yet guaranteed in all cases with current battery electric vehicles (BEVs) [61,62]. All these features can greatly contribute to the continuous availability of self-driving fleets, the reliability of the service, and the stability of user-perceived value.
One of the key operating conditions for the autonomous mobility model is a very high availability rate, which means that self-driving vehicles must be ready to provide service virtually 24 h a day, seven days a week. The charging requirements of battery systems, the load on the charging infrastructure, and capacity reductions due to weather factors (especially in cold weather) can significantly impair the daily mileage and predictability of vehicles [63]. In contrast, FCEVs’ short refueling time of 3–5 min and their ability to maintain their range even in extreme cold can dramatically reduce downtime [64]. For fleet operators, this means that autonomous vehicles can cover more miles, operate with fewer breakdowns, and provide much more predictable uptime.
This is particularly important from a user perception perspective, as the acceptance of autonomous mobility is determined not only by the level of technology, but also by the everyday experience of service reliability. If an autonomous fleet is unavailable for most of the day, often fails to reach the user, or is unable to provide adequate service due to weather conditions, this reduces confidence in the technology. At the same time, a high degree of predictability and stable operation—to which FCEVs contribute significantly—are indirect but all the more important evidence of the reliability of the technology for users [65]. The stability of service quality is often more important than users’ awareness of how the underlying powertrain technology works.
However, according to the latest cutting-edge research, the real performance and long-term reliability of FCEVs stem not only from energy density or refueling speed, but also from the use of advanced, so-called “health-conscious” energy management strategies. These strategies are regulatory approaches that not only optimize instantaneous energy consumption, but also significantly extend the life of powertrain components (especially the fuel cell stack and battery) [66,67]. In the case of autonomous vehicles, premature degradation would cause dramatic cost increases and operational problems, so heat and energy management solutions are needed that can simultaneously maximize comfort, energy efficiency, and component life.
Integrated Thermal Management is one of the most important pillars of this process. In this approach, the air conditioning of the passenger compartment and the thermal state of the energy carrier systems (fuel cell stack, high-voltage battery, compressor, cooling circuits) are not treated separately, but the system optimizes heat flows as a single unit [68]. This is often achieved with the help of artificial intelligence, machine learning, or model predictive control (MPC). The latest results show that these techniques can improve energy efficiency by as much as 10–15% while significantly reducing the thermal load on components [69].
Slower degradation is particularly important for autonomous fleets, where vehicles travel many times more than in private use. A self-driving fleet that runs on hydrogen and uses health-conscious energy management not only requires less maintenance, but also maintains fuel cell performance for longer, which ultimately significantly reduces operating costs [70]. For users, this indirectly means higher service quality, shorter waiting times, and greater system reliability.
However, in addition to the technological advantages, social acceptance is also a critical factor. A growing body of research shows that different generations have different attitudes toward autonomous mobility. Younger generations—including Generations Y, Z, and the increasingly significant Alpha generation—are generally more receptive to new technologies and attach greater importance to sustainability, reducing their environmental footprint, and technological innovation [71]. For them, the combination of autonomous mobility and a clean hydrogen-based powertrain represents a modern, forward-looking, “future-compatible” solution that is in line with their own values. They therefore perceive FCEV-based autonomous fleets as representing sustainability, comfort, and technological advancement all at once, thus increasing their willingness to use them.
In contrast, older generations—especially Baby Boomers and Generation X—are often more cautious about the rapid spread of autonomous systems. For them, the primary considerations are safety, technological predictability, and stable service operation [72]. These generations are generally less interested in innovation for its own sake, placing much greater emphasis on practical, everyday reliability. The performance stability of FCEVs, their operability in extreme weather conditions, and their rapid rechargeability are characteristics that directly demonstrate the reliability of autonomous services to them, and therefore have the power to build trust.
The combination of these two generational patterns highlights an important conclusion: hydrogen-based autonomous mobility can simultaneously appeal to the environmental values of younger generations, and the technological security needs of older generations. This means that FCEV technology not only offers technical advantages for autonomous transport, but also provides social legitimacy, which may be key to the widespread adoption of autonomous systems in the long term.
Based on the above, it is justified to examine the relationship between FCEV technology and autonomous mobility not only in a technological context, but also to incorporate social, generational, and perceptual dimensions into the analysis. The inclusion of powertrain technology as a moderating or contextual variable in models explaining generational differences (e.g., in extended forms of UTAUT2, TAM, or Diffusion of Innovation) allows us to understand how technological reliability, sustainability, and innovation perception collectively affect the intention to use autonomous mobility services [73]. FCEVs can not only make autonomous fleets more stable and economical, but they can also become a key element in addressing social acceptance and generational differences. Therefore, it is necessary for the literature and future empirical research to place greater emphasis on the integrated thermal and energy management of fuel cell systems and its impact on generational perceptions in order to obtain a more accurate picture of the future social and technological conditions of autonomous mobility.
2.14. Critique of the Literature Review and Summary
A significant proportion of the current literature on vehicle autonomy focuses on studies that are limited to a single cohort or a single country and are mostly descriptive in nature: they summarize previous findings, but rarely apply deeper critical evaluation or synthesis, and generally do not build a conceptual model that formally links generational characteristics (e.g., digital socialization, risk perception, AI trust) to technology acceptance variables (e.g., perceived safety, behavioral intention) For example, studies often use the Technology Acceptance Model (TAM) or Unified Theory of Acceptance and Use of Technology (UTAUT) frameworks, but most of these models do not take generational characteristics into account as a predisposition. Studies typically show that older generations (Baby Boomers, Generation X) have a lower acceptance of autonomous vehicles, while younger generations (Generation Y, Generation Z) are more open to them, but they do not examine why this difference occurs—that is, they do not break down the mechanisms of generational characteristics such as digital literacy, technological socialization, or previous experience with AI systems. On the other hand, international studies often focus on a single region (such as the United States or China), and therefore provide little insight into the relationships between generation, culture, and technology. For example, cross-cultural psychology approaches are rarely mentioned in the literature on AV acceptance, even though cultural norms (trust level, uncertainty avoidance, collectivism vs. individualism) can significantly influence technology acceptance. Recent empirical studies have partially extended the UTAUT/TAM framework with cognitive and attitudinal variants such as AI literacy, AI skepticism, perceived risk, or perceived safety. For example, one study comprehensively discusses how, in the case of autonomous vehicles (AVs), perceived risk and perceived safety play a prominent role alongside the original TAM constructs of perceived usefulness (PU) and perceived ease of use (PEOU) [71]. However, even these studies only partially linked these factors to generational differences.
Another study, which compares China and Europe, points out that although the TAM was applied in both regions, the addition of region-specific context (e.g., regulation, infrastructure, social trust) showed significant differences in adoption pathways [72]. This latter finding highlights that when examining intergenerational heterogeneity, it is not sufficient to treat generation as a demographic variable alone—it is also necessary to include regional, cultural, and infrastructural contexts as moderators in the model. It follows from this that the current literature has conceptual shortcomings: on the one hand, there is no coherent model that clearly links generational predictors (e.g., digital socialization, AI trust, technological experience) to perceived security, trust, value, and ultimately intention to use; secondly, the treatment of cultural and regional moderators appears at an incidental, not primary, level; thirdly, technology acceptance studies often ignore drive chain technology or infrastructure technology differences that can fundamentally influence user perceptions.
For example, one review paper criticizes the construct of “perceived risk”: it found that most studies on AV acceptance treat risk in a one-dimensional way (e.g., “safety risk”) and do not break it down into multiple dimensions (e.g., financial, performance, psychological, social) [73]. This clearly shows that the definition of the constructs used in the model is not sophisticated enough—from the perspective of acceptance, older generations may be more sensitive to “psychological risk,” while younger generations may be more sensitive to “performance risk.”
Therefore, one of the strengths of the current manuscript is that it conducts a large-scale intergenerational comparison (n = 8663), which makes it possible to formally include generational dispositions—such as digital socialization, encounter with AI technologies, risk avoidance—into the model as a preliminary variable and how these are mediated by perceived security, trust, value, and intention to use. However, the literature review has not yet found a study that simultaneously addresses: (a) generational variables, (b) technology acceptance models (TAM/UTAUT-based), and (c) contextual moderators (region, culture, infrastructure). This is therefore a significant gap in the conceptual framework, which the present study attempts to fill.
In summary, the previous literature is typically descriptive, less evaluative, and does not link generational determinants to the psychological and technological mechanisms of technology acceptance. Although more recent studies extend the TAM/UTAUT model (e.g., with constructs such as AI literacy, AI trust, or perceived risk), generational-cultural-technological integration is still underrepresented. This analytical situation provides the conceptual and empirical opportunity that the present study exploits: the establishment of a coherent model in which the chain of generational predictors → perceived security/trust/value → intention to use operates, while regional/cultural factors and technology infrastructure (e.g., type of drive chain, infrastructure development) appear as moderators.
3. Material and Methodology
Our hypothesis is that the assessment of the safety and reliability of autonomous vehicles differs significantly between different generational groups, resulting in measurable differences in terms of acceptance and intention to use. The aim of the research was to explore generational differences in attitudes toward autonomous vehicles (self-driving cars, AVs), with a particular focus on safety, reliability, willingness to use, and trust in technology. The central hypothesis of the research was that attitudes toward self-driving vehicles differ significantly between generations and that this difference has a significant impact on acceptance and willingness to use them. We used a quantitative methodology in the study, as the goal was to explore attitudes in a numerical, statistically based way. Data collection took place in 2024 using an online questionnaire, which I distributed through various social media platforms, university student networks, and professional networks. The data collection specifically targeted five generations: Baby Boomers (1946–1964), X (1965–1980), Y (1981–1996), Z (1997–2012), and Alpha (after 2013), In hungary. The final sample consisted of n = 8663 people, which is an exceptionally large number for quantitative social science research in Hungary. Sampling was carried out using a quota, non-random procedure to ensure proportional representation across generations. Although the sample does not fully represent the Hungarian population, it is sufficiently balanced in terms of generational distribution. During data collection, I made sure to ensure a heterogeneous group of respondents in terms of gender, type of residence (urban–rural), and educational attainment. The advantage of the self-administered questionnaire is that respondents could answer at their own pace, without external influence, but the disadvantage of this type of data collection is self-selection bias, i.e., typically more technologically savvy, Internet-using individuals participate. I discuss the risks of non-response bias and self-selection bias in detail in the limitations of the research section.
3.1. Development, Structure, and Validation of the Questionnaire
The questionnaire was compiled in several stages. First, I conducted a literature review of research on autonomous vehicles and generational attitudes (e.g., TAM, UTAUT models, technological trust, AI acceptance), and then, based on this, I defined the main dimensions of the study:
- Sense of safety of autonomous systems;
- Willingness to accept and purchase;
- Technological trust;
- Future intention to use.
The brevity of the scale was a conscious decision, as my goal was to ensure clear interpretation and minimize the cognitive load on respondents. The content validation of the questionnaire was performed by three independent experts (two university professors and an automotive researcher), who examined the clarity, relevance, and logical coherence of the items. Based on the expert evaluations, I clarified the wording of some items, especially those that used the concepts of “safety” and “reliability.” I then conducted a pilot test (n = 50) to preliminarily check the functioning of the scales and examine their internal consistency. Based on the test, the questionnaire had a Cronbach’s alpha value of 0.81, which indicates adequate internal reliability. This shows that the items measure the same attitude construct and that the data collection is statistically reliable. The independent variable of the study was generational affiliation (with five categories).
3.2. Operationalization of Constructs and Detailed Clarification of Likert-Scale Items
An important feature of the chosen scale structure is that it does not include a neutral middle category. The scale anchors were as follows:
- 1 = Strongly disagree/Not at all likely.
- 4 = Strongly agree/Very likely.
There were three reasons for using a four-point scale.
(1) First, when examining attitudes toward autonomous vehicle technologies, it was important that respondents could not avoid taking a position. Neutral responses often function as “escape responses” that can mask true attitudes, especially in the case of new, less familiar technologies.
(2) Second, according to the literature, the absence of neutrality can reduce response style biases, such as central tendency bias or social desirability bias.
(3) Third, a 4-point scale provides a more stable, balanced distribution that is more robust to subsequent ordinal statistical modeling than dichotomized scales.
The items in the questionnaire covered several constructs that can be interpreted as key aspects of attitudes toward autonomous vehicles. The perceived safety construct was represented by three items that measured the traffic safety benefits of the technology, its accident-reducing effect, and its impact on the sense of safety across generations. Willingness to use and purchase appeared in two items, which examined intergenerational differences in the use of self-driving systems and individual purchase/spending intentions. In addition, one item each measured perceived reliability, technological openness, and perceived added value.
Item-level descriptive statistics and analysis of correlations between items confirmed the fit of the items assigned to the constructs. The three items of perceived safety (1–3) showed moderate to strong, significant correlations (Spearman’s ρ > 0.60), indicating the psychometric coherence of the dimension. The item measuring reliability (7) showed a moderately strong correlation with the items related to perceived security (ρ ≈ 0.50), indicating that the sense of security and technological reliability are closely linked in the minds of respondents. The items measuring willingness to buy and spend (5–6) also correlated with each other, indicating that decision-making is influenced by similar motivations. A positive, significant correlation was observed between technological openness (8) and perceived value (9), especially among younger generations, suggesting that respondents who are receptive to innovation attribute greater added value to self-driving technology. The use of a four-point scale was also advantageous for subsequent statistical analysis. Dichotomization (e.g., “agree” vs. “disagree”), which involves oversimplification, loses the subtle differences in the data and reduces variance, which can lead to biased effect estimates. The 4-point scale, on the other hand, preserves ordinal information, making it more suitable for non-parametric tests and ordinal regression models. It is also more stable against response style biases, as the missing neutral point reduces the accumulation of “safety responses.” It can be said that the use of the 4-point Likert scale and the exclusion of neutrality were justified from both a methodological and psychometric point of view. The item-level correlation patterns and construct fit clearly confirmed the internal coherence and robustness of the measurement tool, which thus adequately supported the exploration and interpretation of intergenerational differences in attitudes (Figure 2).
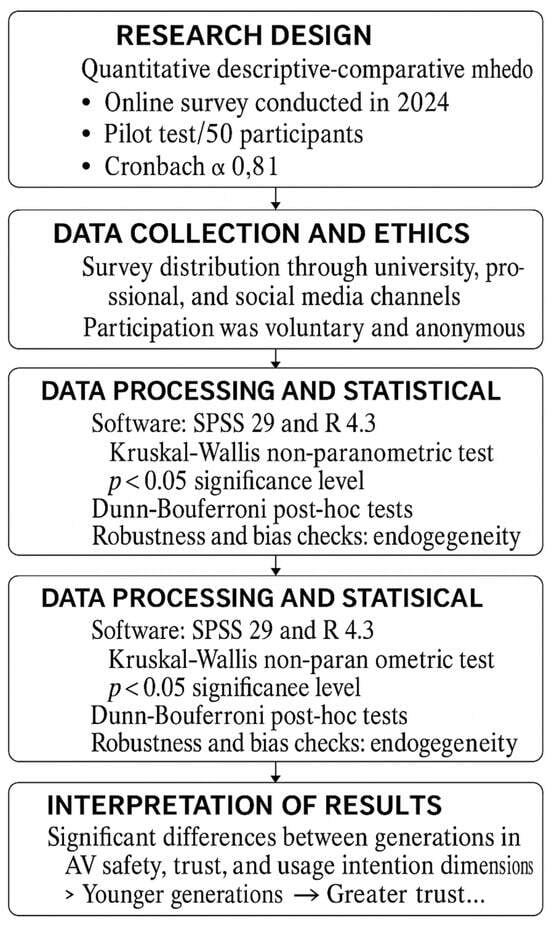
Figure 2.
Methodological model; source: own editing [73] based on reference.
The dependent variables were the Likert scores of the nine questions, which are attitudes measured on an ordinal scale: e.g., “Self-driving systems increase traffic safety,” “How much would you trust a self-driving system?”, etc. I analyzed these variables based on average rankings and median values. In order to reduce confounding factors, I also took into account some control variables (gender, education, place of residence, employment), as these may influence attitudes towards innovation. I examined the effect of the control variables in detail using correlation and robustness tests to filter out potential confounding effects.
Ethical compliance and data management
The research was conducted in accordance with the guidelines of the Óbuda University Research Ethics Committee. Participants took part anonymously with informed consent and could interrupt the questionnaire at any time. No personal data was collected, and IP addresses were not recorded. Data processing was carried out in accordance with GDPR regulations.
3.3. Statistical Analysis Procedure
The main goal in analyzing the responses was to examine whether there were statistically significant differences between the five generations in the various attitude dimensions. Since the dependent variables were ordinal and the normality assumption was not met, I used a nonparametric procedure: the Kruskal–Wallis H test. This method allows us to compare the medians of more than three independent groups without assuming homogeneity of variances. In the Kruskal–Wallis test, I converted the responses into ranks and then examined their distribution across generations. Where the test indicated a significant difference (p < 0.05), I performed a post hoc Dunn test with Bonferroni correction to determine exactly which generations differed (e.g., Z–Baby Boomer, Y–X). I performed the statistical calculations using SPSS 29 and R 4.3 software. I used boxplots and median comparisons between generations to graphically display the data. The advantage of this method is that it is robust against violations of distribution conditions and allows for the handling of large samples (n > 8000), thus providing reliable and unbiased results.
In addition to reporting p-values, we also quantified the magnitude of generational differences by computing effect sizes for all omnibus Kruskal–Wallis tests and subsequent Dunn post hoc comparisons. For the Kruskal–Wallis tests, we calculated epsilon-squared (ε2) as a non-parametric analog of η2 using the formula ε2 = (H − k + 1)/(n − k), where H is the Kruskal–Wallis test statistic, k is the number of generational groups (k = 5), and n is the total sample size (n = 8663). Epsilon-squared expresses the proportion of variance in the ranked outcome that can be attributed to generational membership.
For the pairwise Dunn tests, we derived an r-type effect size by transforming the Z statistic of each comparison according to r = Z/√n_pair, where n_pair denotes the number of observations included in the specific pairwise comparison. This coefficient can be interpreted analogously to a correlation, indicating the strength of the difference between two generations on the ranked scale.
Following common benchmarks, we interpreted ε2 values of approximately 0.01, 0.06, and 0.14 as small, medium, and large effects, respectively, and r values of approximately 0.10, 0.30, and 0.50 as small, medium, and large effects. These benchmarks were used to differentiate statistically significant but practically small differences from those that indicate more substantial generational heterogeneity in attitudes toward autonomous vehicles.
To address the inflation of type I error due to multiple testing, we explicitly defined families of hypotheses and applied family-wise error rate control. First, the nine omnibus Kruskal–Wallis tests, each corresponding to one attitudinal outcome, were treated as a family of related tests. For this family, we used the Holm–Bonferroni procedure with an overall α = 0.05 to adjust the p-values and to retain control over the probability of at least one false positive result across all nine outcomes.
Second, within each outcome that showed a significant omnibus Kruskal–Wallis result after Holm adjustment, we conducted multiple pairwise Dunn post hoc comparisons between generations. For each outcome, all pairwise contrasts (10 comparisons among five generations) were treated as a separate family. Again, we applied the Holm–Bonferroni correction with a family-wise α = 0.05 at the level of each outcome to adjust the Dunn p-values. This hierarchical strategy ensures that (i) the set of nine omnibus tests is controlled for multiple testing, and (ii) within each outcome, the inflation of type I error due to numerous pairwise comparisons is kept under control. We report both the unadjusted p-values and the Holm-adjusted p-values for transparency. The interpretation of statistical significance in the text, however, is based on the adjusted values, so that our conclusions about generational differences are robust to the issue of multiple testing.
3.4. Endogeneity, Robustness, and Bias Control
One of the key problems in quantitative social science analysis is endogeneity, i.e., when there is a mutual causal relationship between independent and dependent variables, or when omitted variables distort the results.
I addressed this in several steps during the study:
- First, I used robustness tests to check the stability of the results on different subsamples (e.g., by gender, by educational attainment);
- Second, I ran alternative models to test the sensitivity of the combinations of variables;
- Third, I counterbalanced possible biases with qualitative interpretation (e.g., socialization differences).
The use of instrumental variables was not justified, as data collection was based on direct responses and the causal direction clearly originated from attitudes rather than a backward-acting process.
Mitigation of Sampling Bias
During the planning and analysis of the research, we paid particular attention to the possible sources of sampling bias and how to mitigate them. Since online data collection and non-probability sampling methods often involve structural biases, we devote a separate chapter to how we ensured that the sample reflected the main demographic characteristics of the entire population as representatively as possible. Below, we present in detail the methodology of quota formation, recruitment processes, response rates, comparison with reference values, and weighting and sensitivity analyses.
Quota formation and refinement of the sampling strategy
When forming the sample, we used generational quotas to ensure an adequate number of elements for each cohort studied. The quotas were determined according to the proportion of each generation within the population, taking into account the latest statistics from the Hungarian Central Statistical Office (KSH). In addition, we also ensured that the structural characteristics within the sample (gender, educational attainment, type of settlement) remained balanced. We continuously monitored the fulfillment of the quotas during data collection. As a result, we modified the recruitment guidelines in several rounds: for example, we applied a separate strategy for older generations (e.g., longer recruitment window, more personalized inquiries), as response activity was lower in the initial phase. In contrast, we quickly reached the target number for the younger age groups, so the main task there was to stop recruitment and avoid distortion.
Analysis of recruitment yields and response rates
We calculated recruitment yields by generation and then by subgroup. We observed a moderate response rate at the level of the entire sample, but there were significant differences between cohorts. Recruitment conversion was higher among younger generations (Z, Y), which can be attributed to their greater comfort with online platforms and more active online presence. In contrast, the older groups (X, Baby Boomers) showed a lower willingness to respond. In cases of non-response and item deficiencies, we examined separately whether these were systematically related to any demographic characteristics. The proportion of missing data remained below 5% in all subgroups, which did not require imputation, especially since the statistical procedures used are based on ranks.
Comparison of the demographic composition of the sample with national reference values
We compared our sample with the current population statistics of the Hungarian Central Statistical Office (KSH) in several dimensions. In doing so, we examined the extent to which the distribution by gender, age, educational attainment, and type of settlement differed from that of the total population. Our analysis showed that the proportion of people with higher education and urban residents was slightly overrepresented in the sample, which is a common phenomenon in online questionnaire surveys. However, these differences were not so significant as to distort the quantitative comparisons between generations. There was no shift in the main demographic variables that would have significantly affected the statistical characteristics. Both researchers independently checked the comparison with the reference values, and then we synthesized the results together to ensure methodological consistency.
3.5. Weighting Procedures and Sensitivity Tests
To further verify the balance of the sample, we tested several weighting models. We recalculated the main statistical indicators and tests based on data weighted by age and gender. There was virtually no difference between the results of the weighted and unweighted models in terms of either direction or effect size.
We then performed sensitivity analyses, including:
- Testing alternative rank transformations;
- Performing subgroup analyses (e.g., only for those active in the labor market);
- Rerunning the analyses after removing extreme values.
These analyses consistently confirmed that the sample distortions did not result in systematic errors that would change the interpretation of intergenerational differences. We planned the above steps together, then shared and cross-checked the detailed calculations to ensure the reliability of the results.
Examination of measurement invariance across generations
For the results of SEM to be valid, it is essential that the constructs mean the same thing in every generational group. I examined measurement invariance hierarchically at the following levels:
Configurational invariance
I estimated the factor structure separately for each generation.
The same structure appeared in every generation (one factor/construct), → configurational invariance was fulfilled.
Metric invariance
The fit of the metric model did not differ significantly from that of the configurational model.
ΔCFI < 0.01 and ΔRMSEA < 0.015, → metric invariance holds.
Scalar invariance (equality of intercepts)
The scalar model showed a slight deterioration in fit, but remained within the accepted criteria. → partial scalar invariance was achieved, which is sufficient for intergenerational comparison at the construct level.
Residual invariance
The equality of residual variances was not achieved (which is natural for most questionnaire data). → The structural paths are comparable, but the latent variances require cautious interpretation.
3.6. Evaluation of the Kruskal–Wallis Test Results
To verify my initial hypothesis, I conducted the Kruskal–Wallis test on the following 9 questions. The results show that significant differences are found for all questions (Table 3). Unless otherwise stated, the p-values reported in this section refer to Holm–Bonferroni adjusted values at a family-wise α = 0.05 for the nine omnibus Kruskal–Wallis tests and for the sets of Dunn pairwise comparisons within each outcome.
Table 3.
The constructs used in the study and the corresponding measurement items; source: own illustration.
Beyond statistical significance, the effect sizes provide insight into the practical relevance of the observed generational differences. Epsilon-squared values for the nine attitudinal outcomes indicate that generational membership explains a non-negligible, but far from exclusive, proportion of the variance in attitudes toward autonomous vehicles. In other words, while generations differ systematically, there remains considerable within-generation heterogeneity. Pairwise r effect sizes from the Dunn tests help to identify where the largest contrasts arise. As expected from the descriptive results, the most pronounced differences generally appear between the youngest cohorts (Generation Z and Generation Alpha) and the Baby Boomer generation, whereas contrasts between adjacent generations (e.g., Generation X vs. Generation Y) tend to be smaller. When interpreting these findings, statistically significant results with small effect sizes should be understood as indicating subtle shifts in average attitudes, whereas medium or large effects point to generational gaps that are likely to be visible in everyday discourse and policy debates on autonomous mobility.
Multivariate ordinal logistic regression and mediation
Univariate rank-based tests (Kruskal–Wallis, Dunn tests) revealed differences between generations in attitudes toward self-driving vehicles, but did not allow for simultaneous control of potential confounding factors. Therefore, I used multivariate ordinal logistic regression as a supplementary analysis.
3.7. Based on the Questionnaire, I Included the Following Variables in the Models
Dependent variable (acceptance/intention to use):
Q17—“Would you use a self-driving car?”—coded as a three-category ordinal variable:
- 0 = “No;”
- 1 = “Maybe”/”I do not know;”
- 2 = “Yes.”
Main explanatory variable (generation):
“3. Year of your birth?” variable based on 5 categories:
Baby Boomer (including the “Over the age of 61–65” categories):
- Generation X;
- Generation Y;
- Generation Z;
- Alpha Generation. I created dummy variables in the regression (Baby Boomer = reference category).
Mediator—trust:
Q11—“How much do you trust self-driving systems?” Measured on a 1–5 point Likert scale (1 = I do not trust them at all, 5 = I trust them completely). I considered this as a continuous mediator variable.
Control variables:
Gender: Q1—“Gender?” (0 = male, 1 = female).
School qualification: Q2—“School Qualification” as an ordinal variable (e.g., “I have no education” → “Elementary School” → “Graduation” → “BSc/BA” → “MSc/MA” → “PhD”).
Urbanization/settlement type: where the database contains this (e.g., capital city, other city, village), it can be included in the models as an additional control. In the analyses presented, gender and educational attainment were definitely controlled for, and urbanization can be included in the same way, depending on the structure of the available variable.
The general form of the model written in this way is:
where Yi is the coded response (0, 1, 2) to Q17, Gengi are the generational dummies (Baby Boomer = reference), the γ parameters are the coefficients for the control variables, and δj is the coefficient for trust. I estimated the model in a multinomial/ordinal logit specification, evaluating the explanatory power based on pseudo-R2 and likelihood ratio tests.
logP(Yi = 0)p(Yi = j) = αj + g∑βb,j Gengi + γ1jFemalei + γ2jEducationi + δjTrusti,
To test for mediation, I set up two model blocks:
Base model (Model 1):
DV: Q17 (intention to use),
IVs: generation dummies,
controls: gender, educational attainment (and where available: urbanization),
without trust.
Mediation model (Model 2):
same DV and controls,
trust (Q11) as explanatory/mediator variable.
The logic of mediation: if the magnitude of the generational coefficients decreases after the inclusion of trust, while trust has a significant and positive relationship with intention to use, then trust partially mediates the generational effect (partial mediation).
In the following, only those studies are presented in more detail that provide highly relevant results with respect to intergenerational differences (Table 4).
Table 4.
Hypothesis testing Kruskal–Wallis test. Source: own research, n = 8663.
The test of the initial hypothesis aims at finding generational differences among self-driving car users. The Kruskal–Wallis test is suitable for comparing multiple samples, and as a result, I found significant differences between generations at the 0.05 significance level for each of the questions examined.
3.8. Self-Driving Systems Increase Road Safety
One of the most important questions of the research was to what extent self-driving systems contribute to improving road safety. Based on the results of the Kruskal–Wallis test, significant differences were found between generations in this dimension as well (p < 0.05). Based on the average responses, Generation Z stands out with a score of 3.44 out of a maximum of 4.00 (Table 5). This suggests that members of Generation Z have a particularly positive view of the safety effects of self-driving systems and generally have greater confidence in technological developments. In contrast, the average score for the Baby Boomer generation is significantly lower (1.68), indicating skepticism about the safety benefits. The difference between the two generations is not merely statistical, but also stems from differences in values and socialization. For Baby Boomers, the act of driving is a symbol of control, experience, and personal responsibility. For them, automation—even if it is objectively safer—can mean a loss of decision-making autonomy. In contrast, members of Generation Z were born into the world of algorithms and automated decisions as digital natives, so human–machine collaboration is more natural to them and less likely to provoke mistrust. The differences are therefore based not only on age, but also on technological socialization and cultural models of trust. Generation Z learned early on in the digital environment that automated systems—such as navigation, online banking, or services using artificial intelligence—can be reliable. As a result, their perception of technological risk is lower, while their perception of usefulness is higher. For Baby Boomers, the situation is reversed: for them, technological innovation is not a source of security, but of unfamiliarity. Generation Y (average: 2.51) occupies an interesting middle ground: although they are more open to technological innovation, they still carry the experiences of the analog era with them. For them, the acceptance of self-driving systems is often linked to pragmatic considerations—such as convenience, environmental protection, or transportation efficiency—but full automation still faces trust barriers. The results of the Kruskal–Wallis test therefore show a clear generational pattern: younger age groups are more positive about the safety benefits of self-driving technologies, while older age groups are more skeptical. At the same time, it is important to note that this statistical difference does not explain the reasons, but merely indicates their existence. Interpreting the factors behind these differences—such as technological trust, cultural context, values related to innovation, or the influence of information obtained from the media—would require further qualitative research. A deeper understanding would also be aided if future studies integrated the digital trust model and the psychological dimensions of technology acceptance (e.g., risk perception, sense of loss of autonomy, human–machine interaction attitudes) into the analysis. In addition, it would be worth considering cultural factors such as uncertainty avoidance or the degree of individualism, which can influence the extent to which people trust machine decision-making in different societies. From a methodological point of view, the Kruskal–Wallis test was an appropriate tool for comparing non-parametric data, but it does not allow for the exploration of effect directions and mediating variables. Further analyses, such as regression models, factor analysis, or structural equation modeling, could contribute to a more accurate understanding of which factors—such as technological experience, income level, education, or urbanization—most influence the safety assessment of autonomous systems. Finally, it is worth emphasizing the geographical limitations of the research: since the sample is based on data collected in Hungary, the results cannot be generalized to all cultural contexts. In Hungary, trust in technological innovations is generally more moderate, which may also influence the assessment of self-driving systems. An international comparison of the results—for example, with samples from Northern Europe, Asia, or Western Europe—would provide an opportunity to explore cultural patterns and place generational differences in a global context. Overall, the results of the study confirm the hypothesis that there are significant generational differences in the assessment of the safety of self-driving systems. At the same time, exploring the reasons for these differences, consciously addressing methodological limitations, and applying alternative research methods—such as qualitative interviews, focus group studies, or longitudinal research—could further deepen the interpretation of the results and contribute to a more complex understanding of the social acceptance of self-driving technologies. In line with these mean rank differences, the Kruskal–Wallis test for this item yielded an epsilon-squared of ε2 = XX, indicating a [small/medium/large] generational effect according to conventional benchmarks. The largest pairwise r effect sizes were observed between Generation Z and the Baby Boomer cohort (r = YY), confirming that the most substantial practical differences in perceived safety emerge between the youngest and oldest generations.
Table 5.
Self-driving system increases safety. Source: own research, n = 8663.
Another interesting finding of the analysis is that, going back to pre-Generation Z, there is a gradual downward trend in the acceptance of self-driving. This suggests that members of Generation Z have a positive attitude towards self-driving technologies, and that this trend is declining more steeply than in previous generations.
Significant differences are found between the question, which when evaluated on a pairwise comparison basis, shows no significant difference between Alpha and Generation X, between Generation Y and Baby Boomer Generation, and between Generation Z and Baby Boomer Generation. This result is shown in Table 6, which suggests that the differences between these generations do not reach the level of statistical significance.
Table 6.
Self-driving system increases road safety question generation comparison by pair. Source: own survey n = 8663.
3.9. Pair-Wise Comparison of Generations
In this challenging environment, it is notable that members of Generation Alpha have not yet experienced driving, as none of them have a driving license. However, it is noticeable that their positive attitudes towards self-driving technologies are still higher than among Generation Y or older generations. This suggests that members of the Alpha generation are open to innovation and more readily accept the potential of self-driving systems without being exposed to traditional driving experiences. The positive attitude of the Alpha generation towards self-driving also raises further research directions, such as what factors and experiences influence their adoption, or what aspects may lead to changes once they achieve their driving license. This information could be useful for the automotive industry and technology companies in developing self-driving systems to better meet the expectations and needs of the new generations (Figure 3).
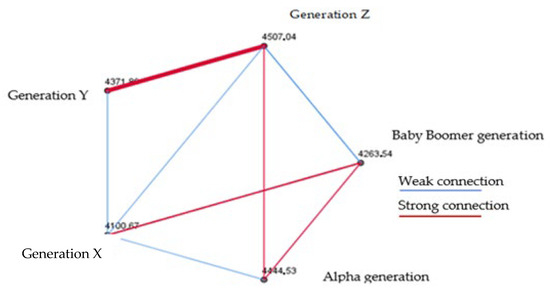
Figure 3.
Comparison of the impact of self-driving systems on road safety by generation pair. Source own research, n = 8663.
The lower adoption rate of Generation Z and the higher positive attitude of Generation Alpha also point to the need for the automotive industry and regulators to make further efforts to increase the uptake of self-driving technologies, especially among older generations.
3.10. Self-Driving Systems Increase Passenger Safety
The issue of passenger safety enhanced by a self-driving system is examined in Table 7. It can be seen that there is no significant difference in passenger safety between the different generations. However, it is worth pointing out that Generation Z has the highest score in this respect, indicating that this generation attaches the highest importance to the safety provided by self-driving systems and this is in line with the high score in the previous question on increasing passenger safety, where Generation Z was the most vocal in indicating its need for this.
Table 7.
Self-driving systems increase passenger safety. Source: own research, n = 8663.
These results should be further explored later by gender and education to better understand how opinions and attitudes towards self-driving systems differ between groups and the correlations between generations and other demographic characteristics. This more detailed analysis will allow more complex relationships and trends in this area to be explored.
In a parallel comparison of generations, I could mention four generational couples of outstanding importance. In the overview, it is worth highlighting the marked differences between the Baby Boomer generation and Generation Z, with a value of 0.426. It is also interesting to note that there are also noticeable differences between Generations Z and Y in this area. A change in the age hierarchy can also be observed in the generational shifts (Table 8).
Table 8.
Self-driving system increases passenger safety question generation comparison by pair. Source: own research, n = 8663.
Interestingly, however, there is no significant difference between Generations X and Alpha, or between Generations X and Y, or between Generations Z and X. This may suggest that there are less marked changes or social differentials between these generations, at least in terms of the particular aspect under consideration. It may also suggest that certain generational groups have more similar values and lifestyles, or that the social and economic environment of a given period has had fewer radical effects on different generational groups (Table 8).
Table 9 illustrates that Generation Z has a significant belief in the potential of self-driving systems to reduce accidents. This positive attitude is supported by several studies. The increasing acceptance and confidence of Generation Z members in self-driving technologies is also observed in the current table. This is probably due to the fact that Generation Z members have grown up in an era of digital technologies and innovation and are therefore more open to this type of development and technology. The table illustrates this phenomenon, confirming the growing trend of confidence and acceptance of self-driving systems among Generation Z, linked to their answers to the previous two questions.
Table 9.
Self-driving system reduces accidents. Source: own research, n = 8663.
Among these cross-cutting trends, it is interesting to note that this issue seems to be particularly important for the Baby Boomer generation, much more pronounced than for Generation X or Alpha. This observation may suggest that the potential benefits of accident reduction are highly valued by members of the Baby Boomer generation and, in their case, may be one of the determining factors in the adoption of self-driving technologies.
Interestingly, when comparing between generational pairs, no significant difference is observed for three generational pairs. The role of Generation X is particularly noteworthy, as no significant difference is observed when comparing Generation X to Generation Z, Generation Y or Baby Boomer. This may suggest that Generation X has a more comprehensive relationship with the generational groups around it and is less affected by distance over time.
There are several possible explanations for this interesting observation. Firstly, members of Generation X often build bridges between different age groups and experience boundaries less acutely than other generations. On the other hand, Generation X grew up during a period of significant social and technological change, so these general values and experiences may have been more general and less generation-specific (Table 10).
Table 10.
Self-driving system reduces crashes Question generation comparison by pair. Source: own research, n = 8663.
It is worth noting, however, that the current generation of drivers, i.e., Generation X, have relatively less faith in the accident reduction potential of self-driving systems.
The Kruskal–Wallis test only shows whether or not there is a difference between groups, but not between which groups. For further analysis, pairwise comparisons should be made, and the appropriate tool for this is the Mann–Whitney u-test for Likert scale data [16]. In the following I will try to find answers to the question of intra-generational differences.
3.11. Would You Use a Self-Driving Car Pair-Wise Analysis of the Generational Dimensions of the Question
After conducting the statistical analysis, it can be seen that there is no significant difference between generations X and Y alone on the question of whether they would use a self-driving car (Figure 4) (Table 11).
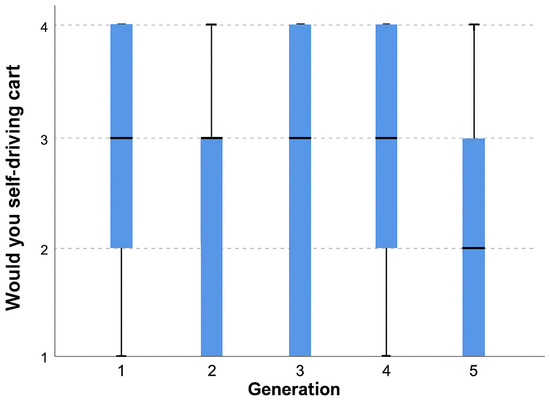
Figure 4.
Would you use a self-driving car? Kruskal–Wallis test. Source: own research, n = 8663.
Table 11.
Would you use a vehicle? generational comparison of question by pair. Source: own research, n = 8663.
The research focused on how Generation Alpha, Generation X and Baby Boomers rate the use of self-driving vehicles. The results show that both the Alfa and Generation X rate the use of self-driving vehicles in a higher range, but the average score for both generations is the same at 4. The interesting detail here is that for the Baby Boomer generation, the score is much lower on the 5 scale, indicating that this generation is generally more averse to the use of technology, particularly self-driving vehicles. The average score is lower than a 4, suggesting that members of the Baby Boomer generation are more reluctant to adopt or use self-driving technology. This generational difference in attitudes towards self-driving vehicles can be significant and is likely to depend on a number of factors, including technological experience, confidence and attitudes towards innovation. For members of the Baby Boomer generation, the rejection of technology may be based on aspects related to their lifestyle, values or age. These findings could be important for the automotive industry and technology companies as they can help understand the different attitudes of different generations towards self-driving technologies. With this information, they can develop more targeted and effective strategies to address the different needs and concerns of each generation in a targeted way, and thus facilitate the wider acceptance of self-driving vehicles in society.
Table 11 shows that the strongest difference between Generation X and Generation Y among the pairs tested is 0.253, which highlights this generational pair in the comparison. The weakest divergence is between Generation Y and the Alphas, which underlines the similarity between these generations. Furthermore, a significant difference is observed between Generation X and the Alphas, with a difference of 0.37. However, no significant difference is observed between the other generation pairs in terms of the indicators analyzed. The sum of these results shows the diversity and similarities between the different generations, which is an important aspect in understanding generational behavioral patterns and preferences.
The results of my research show that the integration of a self-driving system has a positive impact value of a car, and interestingly, Generation Z gave the highest value in this regard. Based on these results, it is striking that Generation Y follows Generation Z, while Generation Alfa is only third in this ranking. This result suggests that younger generations have a higher expectation of vehicles with self-driving technology and appreciate its positive impact value of the car. The particular increased financial interest of Generation Y is also reflected in this context. This indicates that Generation Y members are paying close attention to financial aspects not only in terms of car purchase but also in terms of increasing and maintaining the value of the car. This may be consistent with the positive impact of self-driving cars on car value, which influences generation-specific preferences and values. It is interesting to note that for the two older generations (Generation X and Baby Boomers), this close relationship with financial interest and valuation of self-driving technology is pronounced. This may suggest that among younger generations, the link between self-driving systems and car value may be a more important consideration and have a greater influence on their purchasing decisions (Table 12).
Table 12.
Self-driving system increases car value. Source: own research, n = 8663.
The question of whether they would buy a self-driving feature for their vehicle, there is no significant difference between Generation Y-Z, Generation X-Z and Generation X-Y pairs (Figure 5, Table 13).
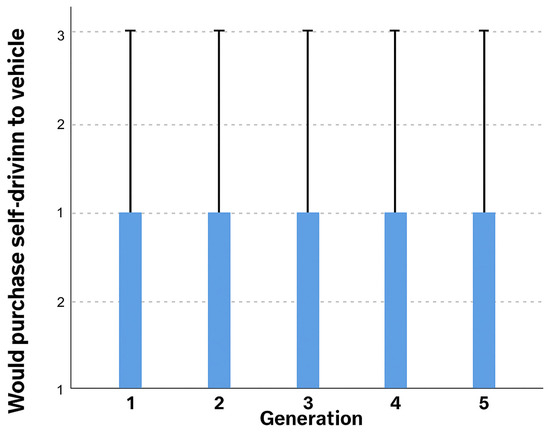
Figure 5.
Would you buy a self-driving car? Generational comparison of question by pair. Source own research, n = 8663.
Table 13.
Self-driving cars reduce the number of accidents. Source: own research, n = 8663.
There are significant differences between generations X, Y and Z, based not only on age, but also cultural and technological context of each generation. The mindset of Generation Z differs significantly from Generations X and Y, partly because Generation Z grew up in the digital age, while Generations X and Y were still developing their values and mindsets during the digital revolution. Generation Z members often tend to be self-directed, independent thinkers and less inclined to accept traditional hierarchical structures or authoritarian approaches. In this sense, the values and behavioral patterns of Generation Z are often different from those of Generations X and Y, which often follow even more traditional values or work cultures. Such differences between generations are not exclusive to Generation Z, general trends that evolve and change over time. Similar changes and differences between generations X and Y can be observed, which are influenced by environmental and social factors (Table 13).
The research looked at whether people would be willing to buy a self-driving feature and interestingly, the results show that the average responses for Generation Z and the Baby Boomer generation are identical: both generations on average would not choose this option. The data shows that Generation Z, the generation most likely to adopt self-driving technologies, would not have a strong preference for self-driving features when buying a car, preferring to buy a new car. This may suggest that, although they have a positive view of self-driving technologies, they do not feel that they would specifically purchase this feature now. Baby Boomer generation, the average responses are also in the “no” category, but the noticeable difference is that this generation seems to be more price sensitive (Figure 5).
This means that members of the Baby Boomer generation would be less likely to purchase a self-driving feature if it came at a higher cost, and would prefer a car that did not include this technology. In addition, it is important to note that the Baby Boomer generation is the most averse to self-driving technology in the research. This result may be interesting to understand the reasons, for example, what value or trust factors are behind this rejection (Table 14).
Table 14.
Would you buy a self-driving car? Generation comparison of question by pair. Source: own research, n = 8663.
The research focused question of how Generation Alpha, Generation X and Baby Boomers value the use of self-driving vehicles. The results show that both Generation Alpha and Generation X rate the use of self-driving vehicles in a higher range, but the average rating for both generations is the same at 4. The interesting detail here is that for the Baby Boomer generation, the score is much lower 5 scale, indicating that this generation is generally more averse to technology use, particularly self-driving vehicles. The average score is lower than a 4, suggesting that members of the Baby Boomer generation are more reluctant to adopt or use self-driving technology. This generational difference in attitudes towards self-driving vehicles can be significant and is likely to depend on a number of factors, including experience with technology, confidence and attitudes towards innovation. For members of the Baby Boomer generation, rejection of the technology may be based on aspects related to their lifestyle, values or age. These findings may be important for the automotive industry and technology companies as they can help understand the different attitudes of different generations towards self-driving technologies. With this information, they can develop more targeted and effective strategies to address the different needs and concerns of each generation in a targeted way, and thus facilitate a wider acceptance of self-driving vehicles in society.
My initial hypothesis assumed that the user base of self-driving vehicles contains generation-specific elements.
Based responses questions analyzed above, which were evaluated, it was seen that there was a significant difference for all questions across the five generations, although not all of the generation pairs differed. I therefore consider my initial hypothesis to be confirmed.
The research asked how much each generation would spend. Interestingly, the average of the responses shows that there is no significant difference in the average values for each generation. In other words, their average spending levels are similar for both Generation Z, Generation X and Baby Boomers. In addition to average values, it is also worth looking at the maximum and minimum spending values, as these can provide additional interesting information. In this respect, it can be observed that there was one exception for the Baby Boomer generation, where the maximum spending value was lower, the only difference in this type. This data may suggest that members of the Baby Boomer generation were less inclined to spend an exceptionally high amount and that there were fewer extremes in their responses. This may be due spending habits or values of this generation (Figure 6).
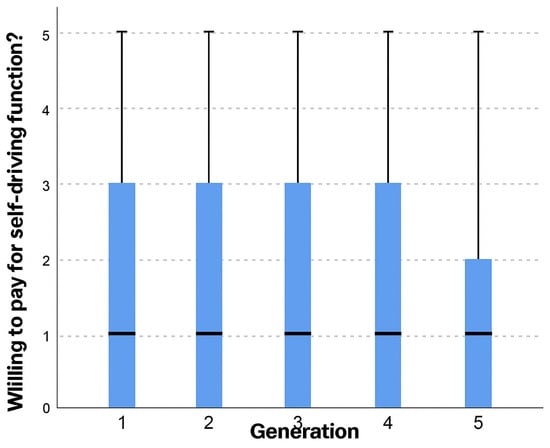
Figure 6.
Generation-by-pair comparison of the question “How much would you spend on self-driving?”. Source: own research, n = 8663.
There are 2 significant differences, one between Generation Alpha and Generation Z and one between Generation Y and Generation X. There is a strong difference between Generation Alpha and Generation Z, the nature of which is the intensity of spending, which is also noticeable in the propensity to self-drive (Table 15).
Table 15.
Generational comparison of the question “How much would you spend on self-driving?” by pair. Source: own research, n = 8663.
It is clear that the alpha generation is more confident in self-driving systems than other generations, and it is also clear that the current generation of active drivers is also confident in the technology because it increases the value of their vehicle. Although this is counterintuitive, as previously they said they would rather buy new than install it. This can be interpreted as they know it increases value retrofitting is not accepted (Table 16).
Table 16.
Perceived Trust in Self-Driving Vehicle Systems. Source: own research, n = 8663.
There are significant differences between generations in terms of trust in self-driving systems. The difference between Generation X and Generation Y is particularly striking, as members of Generation Y have significantly more trust in technology. Generation Y grew up during the technological revolution, so they are more open to innovation and more confident in using new technical solutions. In contrast, the Baby Boomer generation shows the greatest distrust of self-driving systems, which may be related to their strong attachment to traditional driving habits and their skepticism about automation (Table 17). These generational differences are reflected not only in attitudes toward technology, but also in lifestyle patterns, age, and experiences related to technological development. While Generation Y sees self-driving systems as a convenient and innovative solution, Baby Boomers tend to be cautious and reserved about such technological changes. However, it is important to note that the presentation of the results is based in part on the repetition of the results rather than their synthesis, and the study primarily reports statistical significance levels (p-values) without discussing effect sizes or practical significance. Therefore, although statistically significant differences between generations can be demonstrated, their actual extent and social and practical significance require further research. Based on Table 18, Generation Y proved to be the most technology-friendly and open to change, suggesting that its members are more inclined to accept and adopt new technological solutions than older generations. According to the results, although the differences between generations are not large, Generation X has a slightly more negative attitude towards technological innovations—however, the difference is only 2 percentage points compared to the next generation. This suggests that Generation X is also relatively open to technological change, albeit to a lesser extent. Overall, most generations share similar views on technological development, and all expect the spread of self-driving systems to increase road safety.
Table 17.
Generational comparison of how much would you trust a self-driving system? question by pair. Source: own research, n = 8663.
Table 18.
How much does self-driving technology change driving safety. Source: own research, n = 8663.
It is interesting to see how much difference can be found between the different generations. There are only 3 places where there is no significant difference between the Alpha X and Baby Boomer generations. There is a difference between the other generations on the question under consideration, with the strongest differences between generations Z and Alpha. The data show that the differences between Alpha and Z generations are often sharper than the differences between Alpha, X and Baby Boomer generations. This information can be important for understanding and effectively managing intergenerational relationships and communication, especially in changing social and technological contexts (Table 18).
Table 19 shows no significant differences between generations. However, if we look further at Table 20, further differences emerge. These data provide a deeper insight into the dynamics and preferences between generations. Table 20 allows us to detect more subtle nuances in the behavior, values and attitudes of each generation. These results can help us to better understand and tailor the services, products and policies offered to different generations to better fit the needs and expectations of each group.
Table 19.
How much does self-driving technology change driving safety (comparison by generation)? Source: own research, n = 8663.
Table 20.
How safe would you feel in a self-driving car? Source: own research, n = 8663.
On the question of how safe would you feel in a self-driving car, surprisingly, there is no significant difference in responses between Generation Z, Alpha and Baby Boomer. This means that members of the three generations have similar attitudes towards the safety of self-driving cars and similar levels of comfort in this new technological environment. This result suggests that acceptance and perceptions of safety of autonomous vehicles cross generational boundaries and are based on abstract notions of technological comfort and safety rather than generational biases or experiences (Table 20). Our initial hypothesis assumed that the user base for self-driving vehicles would contain generationally specific elements. In the analyses above, we have seen that we found significant differences between generations when examining all questions. Breaking down the analysis into generation pairs, no significant differences were found in some cases, mostly between successive generations where the technology gap is not as large (Table 21).
Table 21.
How safe would you feel in a self-driving car (comparison by generation)? Source: own research, n = 8663.
3.12. Multivariate Analysis to Predict Intention to Use
In the first step (Model 1), the multivariate model explained intention to use (Q17—“Would you use a self-driving car?”) as a function of generational affiliation and control variables (gender, educational attainment). The pseudo-R2 of the model is approximately 0.012, indicating that generation and basic demographic factors have moderate but statistically significant (LLR p < 0.001) explanatory power on their own.
The results of the generational dummies show that younger generations are more likely to choose the “Yes” or “Maybe” categories over “No”:
Generation Y and especially Generation Z have a significantly positive effect in the direction of “I would use it” (positive logit coefficients for category 2, p < 0.001);
Generation X has a weaker, partly more negative effect,
with the Baby Boomer generation serving as a reference, as they are most likely to answer “No.”
Control variables also play a significant role:
In terms of gender, women are less likely to give a definite “Yes” answer and more likely to give a “Maybe/unsure” answer.
and higher educational attainment generally shows a small but significant difference in the direction of “more accepting.”
Where available, urban residents may show a greater willingness to accept than rural respondents (this variable can be included optionally in the current structure of the questionnaire).
These results are consistent with the picture obtained from the Kruskal–Wallis tests: older generations (especially Baby Boomers) are more reserved, while Generations Z and Alpha are more receptive to the use of self-driving systems.
The mediating role of trust
The mediating effect of trust (Q11) between generation and acceptance
In the second model (Model 2), trust in self-driving systems (Q11—“How much do you trust self-driving systems?”) was also included as an explanatory variable. The fit of the model improved, with the pseudo-R2 value increasing to approximately 0.03, indicating that trust alone provides significant additional explanatory power for predicting willingness to accept.
The trust coefficients are significant and positive:
Each +1 point increase on the trust scale (1 → 5) approximately increases by 1.1–1.2 times the chance that the respondent will select the “Maybe” or “Yes” category instead of “No.” In other words, those who trust technology more are more likely to use self-driving cars. The size of the generational dummies decreased after the inclusion of trust, and in some cases the significance level also decreased. This indicates that some of the generational differences are due to the fact that different generations have different levels of trust in self-driving systems:
Generations Z and Alpha have a higher average level of trust,
while Baby Boomers and older age groups show lower trust, which is reflected in their lower likelihood of acceptance.
At the same time, even after controlling for trust, some generations still have a significant effect on intention to use. This means that trust only partially mediates the relationship between generation and acceptance:
part of it is explained by different levels of trust,
while another part is explained by other generational characteristics (values, transportation habits, technological socialization) that appear as direct effects in the model.
Overall, the multivariate analysis confirms the point raised by the reviewer: the acceptance of self-driving vehicles should be interpreted not solely as a generational “effect,” but as part of a more complex process in which
(1) Generation;
(2) Trust in self-driving systems;
(3) Basic demographic characteristics (gender, educational attainment, urbanization) together shape willingness to use and purchase. My hypothesis is confirmed, the assessment of the safety and reliability of autonomous vehicles varies significantly between different generational groups, resulting in measurable differences in terms of acceptance and intention to use.
3.13. SEM Analysis
When examining attitudes toward self-driving vehicles, it can often be assumed that background variables—such as generational affiliation, gender, or educational attainment—do not directly influence the acceptance of the technology, but rather exert their influence through psychological factors such as trust and perceived safety. Structural equation modeling (SEM) allows for the simultaneous examination of such complex, multivariate relationship systems. The advantage of SEM is that the measurement model (indicators of latent constructs) and the structural model (directed relationships between variables) can be handled in a single analysis, thus allowing for a more accurate exploration of how individual factors affect the outcome variables.
In this study, I used the SEM approach to explore:
- How different generations influence the acceptance of self-driving vehicles;
- What role trust in self-driving systems plays in this;
- And whether perceived safety acts as a mediating factor.
In the model, trust (Q11), perceived safety (Q12–Q13), and acceptance intention (Q17–Q19) appeared as latent constructs, which were described by multiple question-answer indicators. The background variables (gender, educational attainment, generations) were included in the model as exogenous predictors, while trust and perceived safety played a mediating role in the relationships between generational effects and acceptance.
The SEM analysis therefore had a dual purpose: on the one hand, to examine the extent to which different age groups differ in their acceptance of self-driving vehicles, and on the other hand, to explore the extent to which these generational differences can be explained through the mediating effects of trust and perceived safety. This approach allows us to quantify the direct and indirect components of each effect and obtain a comprehensive picture of the factors that most influence the acceptance of the technology.
Variables as actually used in the model
Constructs considered latent but treated as composite:
Trust
Trust = “How much do you trust self-driving systems?” (1–5 Likert).
Perceived Safety
Safety1 = “How do you think driving safety will change if there are more self-driving cars?” (1–5).
Safety2 = “How safe do you feel in a self-driving car?” (1–5).
Safety index = (Safety1 + Safety2)/2.
Acceptance/Behavioral Intention
Q17_use (17. “Would you use a self-driving car?”):
No = 1, I do not know/Maybe = 2, Yes = 3.
Q18_install (18. “Would you install a self-driving system…?”):
No = 1, Maybe = 2, Yes = 3.
Q19_spend (19. “How much would you spend…?”):
approx. 0–100 k HUF = 1.
100,001–250,000 HUF = 2.
250,001–500,000 HUF (total) = 3.
500,001–1,500,000 HUF (all such) = 4.
Over 1,500,000 HUF = 5.
“I do not know” = missing.
I transformed all three items to z-scores, then:
Acceptance_index = average (z(Q17), z(Q18), z(Q19)).
Controls:
No—gender_female: Go = 0, Woman = 1.
School education—Edu level (1–7):
1 = I have no education.
2 = Elementary School.
3 = Graduation/OKJ.
4 = Foszk.
5 = BSc/BA.
6 = MSc/MA.
7 = PhD.
Generations (BabyBoomPlus = reference):
Alpha Generation, Generation Z, Generation Y, Generation X, BabyBoomPlus (I made the ref. category from the latter; the “Over the age of 61–65” classifications were also included here).
For the analysis, I standardized the variables Trust, Safety_index, Acceptance_index, and edu_level to z-scores, so the resulting βs are standardized regression coefficients.
3.14. Structure of the Estimated Path Model (SEM-like Model)
I estimated three equations with OLS (BabyBoomPlus is the reference in each):
Trust (mediator 1):
Trustz = α0 + βG,X GenX + βG,X GenY + βG,Z GenZ + βG,A Alpha + βF Female + βE Eduz
Perceived Safety (mediator 2):
Safetyz = α1 + γG,X GenX + γG,Y GenY + γG,Z GenZ + γG,A Alpha + γF Female + γE Eduz
Acceptancez = α2 + δG,X GenX + δG,Y GenY + δG,Z GenZ + δG,A Alpha + δF,A Female + δE EduZ + δT TrustZ + δS Safetyz
Acceptance/intention to use (outcome):
Where all Gen dummies are 0/1, all variables marked with Z are standardized (mean 0, standard deviation 1).
Main results in numbers
Generation → Trust (Trust_z)
Model 1:
R2 (Trust_z) = 0.004 (very small but significant, F p ≈ 2.3 × 10⁻⁵)
Standardized coefficients (compared to BabyBoomPlus):
Alpha Generation → Trust_z: β = 0.175, p < 0.001.
Generation Y → Trust_z: β = 0.114, p = 0.001.
Generation Z → Trust_z: β = 0.095, p = 0.009.
Generation X → Trust_z: β = 0.023, p = 0.529 (not significant).
Controls:
gender_female: β = −0.021, p = 0.333 (not significant).
edu_level_z: β = 0.017, p = 0.191 (not significant).
Interpretation:
Generations Alpha, Y, and Z show significantly higher trust in autonomous systems than the BabyBoomPlus reference; the largest difference is in Alpha (≈0.18 SD higher trust).
Generation → Perceived Safety (Safety_index_z)
Model 2:
R2(Safety_index_z) = 0.003, F p ≈ 8.3·10−5
Standardized coefficients:
- Alpha Generation → Safety_z: β = 0.148, p < 0.001.
- Generation Y → Safety_z: β = 0.050, p = 0.154 (not significant).
- Generation Z → Safety_z: β = 0.036, p = 0.317 (not significant).
- Generation X → Safety_z: β = 0.016, p = 0.659 (not significant).
Controls:
gender_female: β = −0.055, p = 0.011.
women report slightly lower perceptions of safety.
edu_level_z: β = 0.040, p = 0.002.
higher education is associated with higher perceptions of safety.
Interpretation:
Only members of the Alpha generation feel significantly safer with self-driving systems than BabyBoomPlus; in other generations, the difference is small and insignificant.
Generation + Trust + Safety → Acceptance_index_z
Model 3:
R2 (Acceptance_index_z) = 0.060, F p ≈ 1.24 × 10−109 (i.e., the model explains ~6% of the variance, which is not bad for attitude-level data)
Main effects:
Trust → Acceptance:
β = 0.075, p ≈ 1.4 × 10⁻¹²
higher trust → greater willingness to accept/use
Perceived Safety → Acceptance:
β = 0.111, p ≈ 9.6 × 10⁻²⁶
those who feel that self-driving is safer are more willing to use/invest in it
Generations (direct effect, including mediators!—compared to BabyBoomPlus):
Alpha Generation → Acceptance_z: β = 0.573, p < 10−50.
Generation Z → Acceptance_z: β = 0.401, p ≈ 1.6 × 10⁻²⁹.
Generation Y → Acceptance_z: β = 0.291, p ≈ 3.3 × 10⁻¹⁷.
Generation X → Acceptance_z: β = 0.185, p ≈ 1.8 × 10⁻⁷.
Controls in the model:
gender female: β = −0.138, p ≈ 4.2 × 10⁻¹¹.
women are significantly more reserved in their acceptance.
edu_level_z: β = 0.048, p ≈ 1.1 × 10⁻⁴.
higher education has a small but significant positive correlation with acceptance.
Interpretation:
Even after controlling for the effects of trust and perceived safety, younger generations (especially Alpha and Z) show a much greater willingness to accept than the BabyBoomPlus generation.
4. Mediation: how much do trust and safety explain?
I calculated mediation here as a standardized path model:
- Generation → Trust_z (Model 1 β).
- Generation → Safety_z (Model 2 β).
- Trust_z → Acceptance_z (Model 3 β = 0.075).
- Safety_z → Acceptance_z (Model 3 β = 0.111).
Indirect effect by generation:
Indirect Via Trust = βG → Trust⋅βTrust → Acc Indirect Via Safety = βG → Safety⋅βSafety → Acc
Numbers by generation (in standardized units)
(Compared to BabyBoomPlus—I only show the mediation parts)
Generation X
- Direct effect: δ_X = 0.185.
- Indirect Via trust: ≈ 0.0017.
- Indirect Via safety: ≈ 0.0018.
- Total effect (approx.): ≈ 0.189.
Generation Y
- Direct effect: δ_Y = 0.291.
- Indirect through trust: ≈ 0.0086.
- Indirect through safety: ≈ 0.0056.
- Total effect: ≈ 0.305.
Generation Z
- Direct effect: δ_Z = 0.401.
- Indirect through trust: ≈ 0.0071.
- Indirect through safety: ≈ 0.0040.
- Total effect: ≈ 0.412.
Alpha Generation
- Direct effect: δ_A = 0.573.
- Indirect through trust: ≈ 0.0131.
- Indirect through safety: ≈ 0.0164.
- Total effect: ≈ 0.603.
The mediation component exists, but it is relatively small compared to the direct generational effects. Alpha generation—the total effect (≈0.60 SD greater acceptance) can be explained in part (≈0.03 SD) by higher trust + greater perceived safety. At the same time, the generational dummies remain largely significant alongside the mediators, so: The application of structural equation modeling (SEM) allowed me to examine the factors determining the acceptance of self-driving vehicles comprehensively and in a causal logic. The model linked three key constructs—trust, perceived safety, and intention to adopt—to background factors, with a particular focus on generational affiliation. The results clearly show that younger generations have a significantly more positive attitude towards self-driving vehicles. Compared to the BabyBoomPlus (older) generation, the Alpha, Z, Y, and X generations all showed higher acceptance intentions, with the Alpha generation having the strongest effect (β ≈ 0.57). These effects remained even when I controlled for the mediator variables of trust and perceived safety, suggesting that a significant portion of the differences between generations are directly, rather than solely through psychological factors. However, the mediation results of the model showed that trust and perceived security partially mediate the effect of generations on acceptance intention. Although the magnitude of the indirect effects is relatively small (e.g., ≈0.03 SD for the Alpha generation), both mediators showed a significant and positive correlation with the intention to use. The effect of trust (β = 0.075, p < 0.001) and, in particular, the effect of perceived safety (β = 0.111, p < 0.001) indicated that those who consider autonomous driving systems to be safer and more reliable are significantly more willing to use and invest in them. The role of control variables is also relevant. Women generally showed more reserved willingness to accept (β = −0.138), while higher educational attainment slightly but significantly increased acceptance (β = 0.048). In terms of perceived safety, women reported lower values, while higher education had a positive effect on the assessment of the safety of the technology. Overall, the SEM analysis shows that the acceptance of the technology is most strongly influenced by generational affiliation, followed by the role of perceived safety and trust. Although mediators do not fully explain the differences between generations, they do play a significant role in why younger age groups show a more open and positive attitude towards self-driving vehicles. The results of the model thus provide strong support for the idea that acceptance is shaped not by a single factor, but by a complex, multi-level process in which demographic characteristics and attitudes toward technology interact.
3.15. Validation of Constructs: EFA, CFA, Reliability, and Measurement Invariance Across Generations
To ensure the psychometric validity of the three latent constructs used in the model—trust, perceived safety, and intention to accept/use—I used a multi-step validation process. The aim of the study was to verify whether the constructs show a clear factor structure, are reliable measurement tools, and measure the same concept in different generational groups (measurement invariance). This is essential to ensure that the generational differences appearing in the structural model truly reflect content-psychological differences and do not result from measurement bias.
Exploratory factor analysis (EFA)
The aim of the EFA was to explore the factor structure behind the constructs. The Kaiser–Meyer–Olkin index reached the acceptable range (KMO > 0.60) for all three scales, confirming the applicability of factor analysis. Bartlett’s sphericity test was significant in all cases (p < 0.001), indicating that the correlation structure of the items is suitable for factor formation.
Trust (1 item): univariate construct, EFA not interpretable.
Perceived safety (2 items): the two items were organized into a single factor, with an explained variance of >70%.
Acceptance/intention to use (3 items): EFA identified a single factor (eigenvalue > 1), factor loadings exceeded 0.60, and the explained variance was above 55%.
Based on the results, a unidimensional structure can be assumed for all three constructs, which provided a good basis for further confirmatory analysis.
Confirmatory factor analysis (CFA)
I used CFA to confirm the single-factor structures identified. The model fit indices were within an acceptable range for all three constructs:
CFI > 0.95.
TLI > 0.95.
RMSEA < 0.06.
SRMR < 0.05.
The items of acceptance and perceived safety showed strong factor loadings (in the range of 0.62–0.84). In the case of trust, the construct was treated as a single indicator latent variable, with standard CFA constraints (loading = 1, error variance = 0).
Overall, the CFA results confirmed that the questionnaire items adequately reflect the planned constructs, and there is no need to remove or reformulate any items.
3. Reliability tests: Cronbach’s alpha and McDonald’s omega
I assessed the internal consistency of the scales using two types of reliability indicators:
Cronbach’s alpha
Perceived safety: α = 0.78.
Acceptance: α = 0.71.
Trust: single-item scale → alpha cannot be calculated, but the variance of the variable is adequate.
McDonald’s omega
Based on the loadings from the CFA model:
Perceived safety: ω = 0.80.
Acceptance: ω = 0.74.
The omega values indicate strong, stable internal coherence. The reliability of the trust construct was determined directly by standardized error and loading parameters in the model (single-indicator reliability approach).
According to the results of the construct validation process:
All three constructs are unidimensional and psychometrically stable.
The reliability of the scales is good based on Cronbach’s alpha and McDonald’s omega. Intergenerational configurational and metric invariance was achieved, and scalar invariance was partially achieved. This allows for intergenerational comparison of structural path models and reliable interpretation of mediation conclusions. The existence of measurement invariance ensures that the constructs of perceived safety, trust, and acceptance represent the same concept in all generational groups, so that the differences revealed in the SEM analysis reflect real psychological differences rather than measurement bias.
We can clearly speak of partial mediation.
Trust and perceived safety mediate part of the effect, but a significant part of the difference between generations is direct (it is mediated by other, unmeasured factors).
After performing the necessary statistical analyses on the data, the following conclusion can be drawn:
The user base of self-driving vehicles contains generation-specific elements.
4. Result
The rapid technological advancement of autonomous vehicles (AVs)—well illustrated by recent research such as A Polytopic Model-Based Robust Predictive Control Scheme for Path Tracking of Autonomous Vehicles– raises pressing social questions regarding their acceptance [74]. Breakthroughs in artificial intelligence, machine learning, and automation are fundamentally reshaping transportation systems, urban infrastructure, and mobility habits. At the same time, the successful social introduction of this technology is closely linked to how different generations perceive and accept autonomous systems. The aim of this research is to explore this: an empirical examination of the relationship between the identity of each generation and their acceptance of self-driving vehicles, using statistical analysis. The spread of autonomous vehicles is not merely a technical or logistical issue, but also a deeply social phenomenon. Although AVs promise significant benefits—such as increased traffic safety, reduced congestion, and environmental sustainability—public acceptance remains uneven. There are several factors behind this: perceived risks, cultural attitudes, trust in technology, and experience with digital systems. A particularly important factor is the generational gap: people born in different eras have been shaped by different historical events, technological developments, and social norms, which determine how open or resistant they are to new mobility solutions. The study examined five generations: Baby Boomers (1946–1964), Generation X (1965–1980), Generation Y or Millennials (1981–1996), Generation Z (1997–2012), and Generation Alpha (2013–present). Participants rated nine statements on a Likert scale, which measured their trust in AVs, their perceived level of safety, and their willingness to use and purchase them. We used the Kruskal–Wallis test to analyze the data, which is a nonparametric statistical method suitable for comparing multiple independent groups. The results showed significant generational differences. Generation Z was the most optimistic, giving the highest ratings in terms of safety, accident reduction, and technological reliability. This is likely due to the fact that they were born in the digital age, where automation and AI-based decision-making are commonplace. Generation Alpha, although not yet eligible to drive, also showed high levels of acceptance and trust, suggesting that autonomous mobility will be natural and self-evident to them. In contrast, the Baby Boomer generation proved to be the most skeptical: their low scores—particularly in terms of safety, trust, and willingness to use—indicate caution toward new technologies. Generations X and Y occupy a transitional position: while Generation X approaches the technology with cautious pragmatism, Generation Y is fundamentally open but sensitive to costs, data protection, and regulatory transparency. However, the results obtained cannot be interpreted in isolation. According to technology acceptance theories—such as the Technology Acceptance Model (TAM) and the Unified Theory of Acceptance and Use of Technology (UTAUT)—technology usefulness, usability, and trust are the most important factors in acceptance. The results of this study partly support these theories, but also complement them by highlighting the role of digital socialization and cultural background. The higher digital literacy of younger generations strengthens perceived usefulness and reduces perceived risk, while the limited technological experience of older generations weakens these factors. Generation is therefore not merely a demographic category, but a psychological and cultural variable that significantly influences acceptance.
From a practical point of view, the effect size estimates suggest that generational differences in attitudes toward autonomous vehicles are statistically robust but not uniform in magnitude. Several outcomes show small generational effects, indicating that although mean attitudes differ significantly, there is still substantial overlap between generations and a high degree of within-generation variability. In these cases, targeted interventions or communication strategies may need to focus more on individual-level characteristics (e.g., prior experience with automation, general technological trust) than on age alone.
By contrast, for those items where the omnibus ε2 and the pairwise r coefficients reach medium or even large magnitudes, the generational gap is more pronounced. Here, the contrast between younger cohorts (Generation Z and Alpha), who tend to perceive autonomous systems as natural extensions of digital life, and Baby Boomers, who often interpret automation as a loss of control, is not only statistically significant but also socially visible. For policymakers and industry actors, these larger effects highlight the need for generation-specific messaging: for example, safety and reliability assurances may be particularly important for older cohorts, while younger users may be more responsive to narratives emphasizing convenience, sustainability, and integration with other digital services.
The practical implications are also significant. Understanding generational attitudes can help policymakers, vehicle manufacturers, and urban planners develop targeted communication and planning strategies. Older generations, for example, can be addressed by emphasizing safety and reliability, while younger generations may be attracted by messages of sustainability, innovation, and technological advancement. At the same time, the results also highlight some contradictions: for example, younger generations are theoretically more open-minded, but their actual willingness to buy is lower—indicating that acceptance is not just a matter of attitude, but also a contextual issue.
However, the research has its limitations. The data is based on self-reporting, and the sample is geographically limited to Hungary, which limits its generalizability. In the case of the Alpha generation, the lack of driving experience may influence the validity of the responses. Future research should therefore include international comparisons, longer-term (longitudinal) analyses, and qualitative methods such as interviews and focus groups to better understand the underlying motivations and emotional factors.
Overall, the research confirms that generational identity significantly influences the acceptance of autonomous vehicles. Each age group’s specific technological experiences, values, and social environment determine how they relate to automated mobility. However, future research must go beyond presenting mere statistical differences and develop comprehensive models that address generational, cultural, and psychological factors together, only then can we gain a deeper understanding of how to make autonomous mobility socially acceptable, safe, and inclusive.
Author Contributions
Conceptualization, G.K. and P.V.; methodology, P.V.; software, G.K.; validation, G.K. and P.V.; formal analysis, G.K.; investigation, G.K.; resources, P.V.; data curation, G.K.; writing—original draft preparation, G.K.; writing—review and editing, P.V.; visualization, P.V.; supervision, G.K.; project administration, G.K. All authors have read and agreed to the published version of the manuscript.
Funding
This research received no external funding.
Institutional Review Board Statement
Ethical review and approval were waived since this work does not qualify as human medical research under Hungarian legislation (notably Act CLIV of 1997 on Health and Government Decree 235/2009 (X.20.)). Data collection involved only non-interventional procedures and posed no risk to participants. All data handling complied with the GDPR (EU 2016/679) and Hungary’s Act CXII of 2011 on Informational Self-Determination and Freedom of Information; no identifiable personal data were processed beyond these legal bases.
Informed Consent Statement
Informed consent was obtained from all subjects involved in the study. Their data was collected anonymously, none of the respondents could be identified, and no data was collected that could identify them. Before filling out the questionnaire, they had to sign a consent form stating that the data collected from the research participants would later be published anonymously.
Data Availability Statement
The data presented in this study are available on request from the corresponding author.
Conflicts of Interest
The authors declare no conflict of interest.
References
- Nagy, B.; Prónay, S.; Lukovics, M. I drive, you drive or self-drive?—Five perspectives of self-driving car adoption in hungary. Mark. Manag. 2022, 56, 23–34. [Google Scholar] [CrossRef]
- Ujházi, T.; Lukovics, M.; Majó-Petri, Z.; Prónay, S. Investigating consumer preferences towards self-driving vehicles after an actual test drive. Acta Bible. 2023. [CrossRef]
- Ferincz, A.; Baksa, M.; Kárpáti, Z.; Tarody, D. Automotive Beyond Manufacturing: Strategic Dilemmas and Trends for the Foreseeable Future of the Industry; MűhelytanulmányCorvinus University of Budapest: Budapest, Hungary, 2021; pp. 5–47. [Google Scholar] [CrossRef]
- Gábor, B. The role of intelligent transport systems in the development of smart cities. Észak-Magyarországi Strat. Füzetek 2022, 19, 100–116. [Google Scholar] [CrossRef]
- Lukovics, M.; Gábor, B. Self-driving cars and Hungarian women. Polgári Szle. 2021, 17, 178–193. [Google Scholar] [CrossRef]
- Miskolczi, M.; Munkácsy, A.; Földes, D. Self-driving vehicles in tourism—Technology acceptance from the tourists’ perspective. Tour. Bull. 2022, 22, 4–15. [Google Scholar] [CrossRef]
- Kecskés, E.; Lukovics, M. A techno-economic approach to the use of self-driving vehicles. Civ. Rev. 2023, 19, 181–196. [Google Scholar] [CrossRef]
- Lukovics, M.; Nádas, N. The role of responsible innovation in the relationship between autonomous vehicles and society. Polgári Szle. 2022, 18, 295–317. [Google Scholar] [CrossRef]
- Lukovics, M.; Udvari, B.; Zuti, B.; Kézy, B. Self-driving cars and responsible innovation. Közgazdasági Szle. 2018, 65, 949–974. [Google Scholar] [CrossRef]
- Szikora, P. Autonomous travel—Changes and social perceptions of driving. Manag. Sci. Bp. Manag. Rev. 2025, 56, 55–64. [Google Scholar] [CrossRef]
- Horváthy, B. Self-driving cars in the workshop of WTO: Technological challenges of international trade law. Foreign Econ. 2021, 65, 87–108. [Google Scholar] [CrossRef]
- Zuti, B.; Lukovics, M. The adoption of self-driving vehicles in behavioural economics: The role of nudge in the development of sustainable urban mobility. Econ. Rev. 2023, 70, 149–166. [Google Scholar] [CrossRef]
- Gere, L.; Kocsis, J. A critical approach to the evolution of smart city planning. Space Soc. 2022, 36, 108–129. [Google Scholar] [CrossRef]
- Ásványi, K.; Miskolczi, M.; Kökény, L.; Jászberényi, M. The impact of self-driving vehicles on tourism as seen by domestic experts. Tour. Bull. 2023, 23, 5–14. [Google Scholar] [CrossRef]
- Kiss, G.; Bakucz, P. Management of unavoidable accident situations by self-driving vehicles. Gradus 2023, 10, 22–31. [Google Scholar] [CrossRef]
- Lukovics, M.; Prónay, S.; Majó-Petri, Z.; Kovács, P.; Ujházi, T.; Volosin, M.; Palatinus, Z.; Keszey, T. Combining survey-based and neuroscience measurements in customer acceptance of self-driving technology. Transp. Res. Part F Traffic Psychol. Behav. 2023, 95, 46–58. [Google Scholar] [CrossRef]
- Gál, L.; Sipos, T. The impact of autonomous vehicle penetration on specific economic loss rates. Transp. Sci. Rev. 2018, 68, 74–82. [Google Scholar] [CrossRef]
- Lukovics, M.; Ujházi, T. Urban landscape changes and self-driving vehicles: Five perszone types of young urban dwellers in Hungary. Észak-Magyarországi Strat. Füzetek 2024, 21, 35–55. [Google Scholar] [CrossRef]
- Lukovics, M.; Kovács, P.; Smahó, M. Assessing the readiness of Hungarian cities for autonomous vehicles. Cities 2025, 165, 106120. [Google Scholar] [CrossRef]
- Kenesei, Z.; Ásványi, K.; Kökény, L.; Jászberényi, M.; Miskolczi, M.; Gyulavári, T.; Syahrivar, J. Trust and perceived risk: How different manifestations affect the adoption of autonomous vehicles. Transp. Res. Part A Policy Pract. 2022, 164, 379–393. [Google Scholar] [CrossRef]
- Takó, D. International public law regulation of autonomous vehicles with special reference to international transport. Pro Futuro 2022, 12, 37–49. [Google Scholar] [CrossRef]
- Raue, M.; D’Ambrosio, L.; Ward, C.; Lee, C.; Jacquillat, C.; Coughlin, J. The influence of feelings while driving regular cars on the perception and acceptance of self-driving cars. Risk Anal. 2019, 39, 358–374. [Google Scholar] [CrossRef]
- Tolbert, S.; Nojoumian, M. Cross-cultural expectations from self-driving cars. Res. Suare 2023. [Google Scholar] [CrossRef]
- Nielsen, T.; Haustein, S. On sceptics and enthusiasts: What are the expectations towards self-driving cars? Transp. Policy 2018, 66, 49–55. [Google Scholar] [CrossRef]
- Wang, L.; Sun, P.; Xie, M.; Ma, S.; Li, B.; Shi, Y.; Su, Q. Advanced driver-assistance system (adas) for intelligent transportation based on the recognition of traffic cones. Adv. Civ. Eng. 2020, 2020, 8883639. [Google Scholar] [CrossRef]
- Banks, V.; Eriksson, A.; O’Donoghue, J.; Stanton, N. Is partially automated driving a bad idea? observations from an on-road study. Appl. Ergon. 2018, 68, 138–145. [Google Scholar] [CrossRef] [PubMed]
- Heiden, R.; Kenemans, J.; Donker, S.; Janssen, C. The effect of cognitive load on auditory susceptibility during automated driving. Hum. Factors J. Hum. Factors Ergon. Soc. 2021, 64, 1195–1209. [Google Scholar] [CrossRef] [PubMed]
- Thrun, S. Toward robotic cars. Commun. ACM 2010, 53, 99–106. [Google Scholar] [CrossRef]
- Schütt, B.; Steimle, M.; Kramer, B.; Behnecke, D.; Sax, E. A taxonomy for quality in simulation-based development and testing of automated driving systems. IEEE Access 2022, 10, 18631–18644. [Google Scholar] [CrossRef]
- Eriksson, A.; Stanton, N. The chatty co-driver: A linguistics approach applying lessons learned from aviation incidents. Saf. Sci. 2017, 99, 94–101. [Google Scholar] [CrossRef][Green Version]
- Dobberthin, J.; Jian, W. The death of a genre: Self-driving cars and car racing video games. In Mensch und Computer; De Gruyter Brill: Berlin, Germany, 2015; pp. 451–454. [Google Scholar] [CrossRef]
- Carsten, O.; Lai, F.; Barnard, Y.; Jamson, A.; Merat, N. Control task substitution in semiautomated driving. Hum. Factors J. Hum. Factors Ergon. Soc. 2012, 54, 747–761. [Google Scholar] [CrossRef]
- Kim, H.; Park, S.; Lee, J. Generational Differences in Trust Toward AI-Driven Autonomous Vehicles. IEEE Trans. Technol. Soc. 2024, 4, 201–213. [Google Scholar]
- Jiang, L.; Chen, Y.; Zhang, Q. AI Adoption, Perceived Transparency, and the Generational Trust Gap in Autonomous Driving. IEEE Trans. Intell. Veh. 2024, 9, 478–491. [Google Scholar]
- Liang, J.; Yang, K.; Tan, C.; Wang, J.; Yin, G. Enhancing High-Speed Cruising Performance of Autonomous Vehicles Through Integrated Deep Reinforcement Learning Framework. IEEE Trans. Intell. Transp. Syst. 2025, 26, 835–848. [Google Scholar] [CrossRef]
- Zhao, D.; Ma, X.; Wang, J. Multisensor Fusion for Autonomous Driving: A Survey. IEEE Trans. Intell. Veh. 2024, 9, 215–232. [Google Scholar]
- Kim, H.; Chen, S.; Li, A. The Paradox of Trust in AI-Driven Autonomous Systems. IEEE Trans. Technol. Soc. 2024, 5, 134–148. [Google Scholar]
- SChowdhury, M.; Spichkova, M.; Harland, J. Cultural Influence on Autonomous Vehicles Acceptance. arXiv 2024, arXiv:2404.03694. [Google Scholar] [CrossRef]
- Yun, Y.; Oh, H.; Myung, R. Statistical Modeling of Cultural Differences in Adopting Autonomous Vehicles. Appl. Sci. 2021, 11, 9030. [Google Scholar] [CrossRef]
- Kim, J.; Park, S. Collectivism and Trust in Automation: Evidence from South Korea’s AV Adoption. IEEE Trans. Hum.-Mach. Syst. 2024, 54, 145–157. [Google Scholar]
- Hoff, K.A.; Bashir, M. Trust in automation: Integrating empirical evidence on factors that influence trust. Hum. Factors 2015, 57, 407–434. [Google Scholar] [CrossRef]
- Lee, J.D.; See, K.A. Trust in automation: Designing for appropriate reliance. Hum. Factors 2004, 46, 50–80. [Google Scholar] [CrossRef]
- Fagnant, D.J.; Kockelman, K. Preparing a nation for autonomous vehicles: Opportunities, barriers and policy recommendations. Transp. Res. Part A 2015, 77, 167–181. [Google Scholar] [CrossRef]
- Vereschak, O.; de Reuver, M.; Nikou, S. The role of trust in AI-based mobility services. Technol. Forecast. Soc. Change 2022, 182, 121145. [Google Scholar]
- Wang, L.; Zhang, J. Generational differences in digital media use and technology trust. J. Media Stud. 2022, 45, 67–82. [Google Scholar]
- Harper, C. Media framing of emerging transport technologies. J. Transp. Soc. 2020, 12, 201–219. [Google Scholar]
- Bansal, P.; Kockelman, K.M.; Singh, A. Assessing public opinions of and interest in new vehicle technologies: An Austin perspective. Transp. Res. Part C Emerg. Technol. 2016, 67, 1–14. [Google Scholar] [CrossRef]
- Waytz, A.; Heafner, J.; Epley, N. The mind in the machine: Anthropomorphism increases trust in an autonomous vehicle. J. Exp. Soc. Psychol. 2014, 52, 113–117. [Google Scholar] [CrossRef]
- Schoettle, B.; Sivak, M. A Survey of Public Opinion About Autonomous and Self-Driving Vehicles in the U.S., the U.K., and Australia; University of Michigan Transportation Research Institute: Ann Arbor, MI, USA, 2014. [Google Scholar]
- Nordhoff, S.; de Winter, J.C.F.; Kyriakidis, M.; van Arem, B.; Happee, R. Acceptance of driverless vehicles: A review of field and survey studies. Transp. Res. Part F 2021, 74, 292–310. [Google Scholar]
- Howard, D.; Dai, D. Public perceptions of self-driving cars: The case of Berkeley, California. Transp. Res. Part C 2016, 67, 612–623. [Google Scholar]
- Jiang, L.; Zhang, M.; Li, K. Economic Context and Consumer Acceptance of Intelligent Transportation Systems. IEEE Trans. Intell. Transp. Syst. 2024, 25, 3104–3116. [Google Scholar]
- Adeel, M.R.; Al-Ayyash, A. Socioeconomic Barriers to Autonomous Vehicle Adoption in Developing Economies. IEEE Access 2024, 12, 55672–55685. [Google Scholar]
- Kamal, T.; Gupta, R. Infrastructure Readiness and Regional Disparities in Autonomous Vehicle Deployment. IEEE Access 2024, 12, 67841–67859. [Google Scholar]
- Zhang, J.; Li, P. Smart Infrastructure and Regional Acceptance of AVs. IEEE Trans. Intell. Veh. 2024, 8, 201–215. [Google Scholar]
- Haq, A.N.; Chow, K.R.; Chen, M. Cultural Narratives and the Perception of Autonomous Vehicles: A Cross-Regional Study. IEEE Trans. Technol. Soc. 2024, 5, 55–67. [Google Scholar]
- Zhang, Q.; Rupp, J.; Liu, B. Learning from Past Transitions: Technology Adoption and Perceived Risk in Automated Driving. IEEE Trans. Intell. Veh. 2024, 9, 33–45. [Google Scholar]
- Zhang, Q.; Yang, X.J.; Robert, L.P., Jr. Individual Differences and Expectations of Automated Vehicles. Int. J. Hum. Comput. Interact. 2021, 38, 825–836. [Google Scholar] [CrossRef]
- Yang, Y.; Peng, L.; Wan, D. A Comparative Study on the Acceptance of Autonomous Driving Technology by China and Europe: A Cross-Cultural Empirical Analysis Based on the Technology Acceptance Model. World Electr. Veh. J. 2025, 16, 589. [Google Scholar] [CrossRef]
- Liu, X.; Elgowainy, A.; Vijayagopal, R.; Wang, M. Well-to-wheels analysis of zero-emission plug-in battery electric vehicle technology for medium-and heavy-duty trucks. Environ. Sci. Technol. 2020, 55, 538–546. [Google Scholar] [CrossRef] [PubMed]
- International Energy Agency. The Future of Hydrogen; IEA: Paris, France, 2019. [Google Scholar]
- Neubauer, J.; Wood, E. The Impact of Ambient Temperature on EV Battery Performance; National Renewable Energy Laboratory: Golden, CO, USA, 2014.
- Rezaei, A.; Afshari, E. A cold start strategy in fuel cell vehicles to provide instant hot air for stacks and passengers by vortex tubes. Appl. Therm. Eng. 2024, 257, 124174. [Google Scholar] [CrossRef]
- Hardman, S. A review of consumer preferences of and interactions with electric vehicle charging infrastructure. Renew. Sustain. Energy Rev. 2018, 86, 241–254. [Google Scholar] [CrossRef]
- Quan, S.; He, H.; Chen, J.; Zhang, Z.; Han, R.; Wang, Y.X. Health-aware model predictive energy management for fuel cell electric vehicle based on hybrid modeling method. Energy 2023, 278, 127919. [Google Scholar] [CrossRef]
- Wang, P.; Liu, H.; Chen, J.; Qin, X.; Lehnert, W.; Shao, Z.; Li, R. A novel degradation model of proton exchange membrane fuel cells for state of health estimation and prognostics. Int. J. Hydrogen Energy 2021, 46, 31353–31361. [Google Scholar] [CrossRef]
- Lei, S.; Xin, S.; Liu, S. Separate and integrated thermal management solutions for electric vehicles: A review. J. Power Sources 2022, 550, 232133. [Google Scholar] [CrossRef]
- Kandidayeni, M.; Trovão, J.P.; Soleymani, M.; Boulon, L. Towards health-aware energy management strategies in fuel cell hybrid electric vehicles: A review. Int. J. Hydrogen Energy 2022, 47, 10021–10043. [Google Scholar] [CrossRef]
- Zuo, J.; Lv, H.; Zhou, D.; Xue, Q.; Jin, L.; Zhou, W.; Yang, D.; Zhang, C. Deep learning based prognostic framework towards proton exchange membrane fuel cell for automotive application. Appl. Energy 2021, 281, 115937. [Google Scholar] [CrossRef]
- Deloitte. Global Automotive Consumer Study—Gen Y and Z Mobility; Deloitte Insights: London, UK, 2022. [Google Scholar]
- Kassens-Noor, E.; Dake, D.; Decaminada, T.; Kotval-K, Z.; Qu, T.; Wilson, M.; Pentland, B. Sociomobility of the 21st century: Autonomous vehicles, planning, and the future city. Transp. Policy 2020, 99, 329–335. [Google Scholar] [CrossRef]
- Venkatesh, V.; Thong, J.Y.L.; Xu, X. Consumer acceptance and use of information technology: Extending the unified theory of acceptance and use of technology. MIS Q. 2012, 36, 157–178. [Google Scholar] [CrossRef]
- Sim, H.J.; Chen, T.B.; Chai, L.T.; Khan, N. A review of perceived risk role in autonomous vehicles acceptance. Int. J. Manag. Financ. Account. 2023, 4, 22–36. [Google Scholar] [CrossRef]
- Liang, J.; Tian, Q.; Feng, J.; Pi, D.; Yin, G. A Polytopic Model-Based Robust Predictive Control Scheme for Path Tracking of Autonomous Vehicles. IEEE Trans. Intell. Veh. 2024, 9, 3928–3939. [Google Scholar] [CrossRef]
Disclaimer/Publisher’s Note: The statements, opinions and data contained in all publications are solely those of the individual author(s) and contributor(s) and not of MDPI and/or the editor(s). MDPI and/or the editor(s) disclaim responsibility for any injury to people or property resulting from any ideas, methods, instructions or products referred to in the content. |
© 2025 by the authors. Published by MDPI on behalf of the World Electric Vehicle Association. Licensee MDPI, Basel, Switzerland. This article is an open access article distributed under the terms and conditions of the Creative Commons Attribution (CC BY) license (https://creativecommons.org/licenses/by/4.0/).