Abstract
The large-scale adoption of electric vehicles has created an urgent need for the orderly management of charging loads in residential communities. While existing research on community-based orderly charging architectures and control strategies primarily focuses on connected charging piles (CPs) equipped with remote power control functions. However, in practical scenarios, most residential communities still rely on unconnected charging piles (UCPs) that lack remote communication capabilities, making it difficult to practically deploy many intelligent orderly architectures and control strategies that rely on communication with charging piles. Therefore, this paper proposes a non-intrusive orderly charging architecture tailored for UCPs. This architecture does not require modifying the hardware of UCPs; instead, it introduces pile-end management units (PMUs) to interact with users for orderly charging, thereby facilitating easier deployment and promotion. Based on this architecture, an optimized control strategy using the GD-SA (greedy-simulated annealing) algorithm for orderly charging is constructed, which considers the dual constraints of transformer capacity and charging demand. Case studies on a typical community in Tianjin, China, demonstrate that with the proposed order charging architecture and strategy, when users fully accept the orderly charging approach, the peak load can be reduced by over 17% compared to uncontrolled charging scenarios. Additionally, the effectiveness of the method has been validated through sensitivity analysis of user acceptance, stress scenario testing, and statistical analysis with a 95% confidence interval. Finally, this paper summarizes the practical value potential of supporting UCPs in achieving orderly charging, while also pointing out the limitations of the current research and identifying directions for further in-depth exploration.
1. Introduction
With the rapid growth in electric vehicle (EV) ownership, the large-scale integration of charging piles has significantly impacted the operation of distribution networks, making the orderly management of charging loads a critical issue for the optimal operation of power systems [1,2,3]. Current orderly charging strategies primarily adopt two approaches: time-of-use pricing-based load management for unconnected charging piles (UCPs) and active load adjustment for connected charging piles (CPs).
For the second approach, due to the superior communication conditions and remote power control capabilities of CPs, more complex control methods can be designed to proactively adjust charging loads. In recent years, some scholars have conducted analytical studies on the smart control architectures for EV charging [4,5]. Methods such as the time-of-use power allocation strategy based on model predictive control (MPC) and the dynamic charging scheduling method considering EV users’ travel demands [6] have been proposed. Relevant achievements have verified their effectiveness in reducing the peak-valley difference in distribution networks and improving equipment utilization rates. Some studies have also regulated users’ charging choices through price incentives or information feedback mechanisms [7,8,9], such as dynamic pricing models based on utility functions and learning-based response strategies integrating user habits [10].
Recently, some studies have proposed integrating distributed photovoltaics (PV), energy storage systems (ESS), or microgrids with coordinated planning of controlled charging strategies to achieve load regulation, alleviate grid pressure, and reduce demand-side reliance on the power grid [11,12,13,14]. Centralized and decentralized methods have also been widely applied in the charging management of EVs. Combined with technologies such as blockchain and Vehicle-to-Grid (V2G), these methods have achieved favorable effects in carbon reduction and load regulation [15,16,17,18]. Additionally, some scholars [19] have conducted research on energy management for fuel cell vehicles (FCVs), proposing a novel predictive energy management paradigm guided by deep reinforcement learning (DRL). This paradigm aims to maximize the operational efficiency and lifespan of FC systems without compromising fuel economy, and has demonstrated excellent performance in real-world dataset testing.
However, for UCPs, although existing studies have demonstrated the guiding effect of time-of-use (TOU) pricing [20,21,22,23], this approach also leads to concentrated user charging behavior, resulting in abrupt load surges. Some countries (e.g., UK Regulations: Electric Vehicle Smart Charge Points) have already enacted legislation mandating that charging points must be equipped with delayed charging functions. Consequently, there is a need to develop a more controllable orderly charging technical architecture specifically for UCPs to mitigate the potential risks of load exceedance that may arise from over-reliance on price mechanisms following large-scale UCPs integration. Given that UCPs generally lack communication and control capabilities as well as V2G functions, centralized or distributed complex control strategies proposed in existing literature—those dependent on communication between charging piles and backend systems—are often impractical to deploy. Currently, there remains a gap in published research addressing how to enable interaction between grid operators and users, as well as implement corresponding control strategies, without modifying UCP hardware.
Therefore, to address the orderly charging management needs of community-based UCPs, this paper proposes a non-intrusive architecture and control strategy that supports one-way active load management for UCPs without modifying the original charging equipment hardware. Considering the practicality and ease of deployment and promotion by power grid companies, a centralized architecture is adopted instead of a blockchain-based decentralized architecture. The methodology comprises: (1) Monte Carlo simulation of user travel-linked stochastic charging; (2) Greedy-Simulated Annealing (GD-SA) optimization for charging scheduling under transformer capacity constraints; (3) Validation in ordinary residential communities (ORCs) and old residential communities (OLCs).
Compared with existing research, the proposed architecture and method in this paper exhibit better practicality and feasibility for UCPs, providing greater reference value for power grid enterprises in their large-scale deployment
2. Orderly Charging Technical Architecture and Control Process Based on the Active Reservation Mechanism of UCPs
2.1. Charging System Technical Architecture
This study proposes a non-invasive retrofitting architecture that preserves existing charging pile hardware, thereby minimizing resistance to user adoption.
As illustrated in Figure 1, the dotted box represents a retrofitting unit, which encompasses an existing UCP, its user, and the newly added Pile-end Management Unit (PMU). PMUs are additionally deployed outside UCPs. Specifically, PMUs are installed either at the input or output terminals of the user’s distribution cabinet connected to the charging pile.
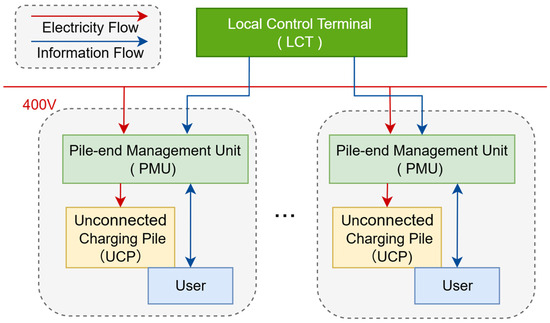
Figure 1.
Orderly charging technical architecture based on the active reservation mechanism of UCPs.
The PMUs feature remote active switching functionality while recording users’ charging information and uploading it to the local control terminal (LCT). The LCT is deployed within the distribution cabinet of the transformer area connected to the user’s distribution cabinet. The LCT can connect to remote back-end systems while enabling local autonomous control. It receives vehicle information from PMUs and collects user load data within the transformer area. Using this data, it generates orderly charging schedules. UCP users will actively book charging time slots generated by the LCT. By controlling the closing/disconnecting operations of PMUs, the LCT ensures EVs are charged during scheduled periods defined by the controlled charging strategy.
The PMU and LCT are compact in size. In the actual investigation, it was found that the user’s distribution cabinet and the distribution cabinet of the transformer area have sufficient installation space. The relatively simple technical architecture also enables effective cost control, making large-scale deployment feasible.
The PMUs and LCT in the current architecture can flexibly adapt to various physical layer solutions. In future practical deployments, we will consider the following solutions to ensure communication and data security based on scenario requirements:
For short-distance scenarios (<50 m), industrial-grade RS485 wired communication technology is selected (supporting adaptive baud rates of 9600/115,200 BPS); for long-distance or unobstructed environments, low-power wide-area network technologies such as LoRa are adopted; while in complex environments, signal transmission is enhanced by deploying relay equipment.
In the demonstration project, we adopt widely used industrial standard protocols in the field (such as Modbus-RTU) to ensure transmission reliability and prevent data tampering through application layer encryption (such as TLS). Moreover, the user interface will be given significant consideration in the subsequent demonstration phase.
2.2. Control Process
The control protocol operates through four-phase actuation process:
- User Input Phase: Upon physical connection of the charging connector (i.e., when the plug is engaged), users are required to immediately specify two key parameters via the PMU interface: the target State-of-Charge (SOC) and the expected departure time. This input occurs synchronously with the plug-in action, providing foundational data for subsequent processes.
- Data Transmission Phase: PMUs maintain a normally open status while transmitting operational parameters to the LCT.
- Optimization Phase: The GD-SA (Greedy-Simulated Annealing) Algorithm scheduler determines optimal charging start times under transformer capacity constraints.
- Execution Phase: PMUs activate charging circuits at scheduled times, sustaining operation until the target SOC is attained.
The system recommends a reservation time through the GD-SA algorithm based on the user’s input target SOC and expected departure time. If user input errors cause the calculation to fail to generate a feasible time that meets the constraints, the system will reject the user’s charging request and provide a prompt.
3. Controlled Charging Strategy for UCPs
3.1. EV Load Forecasting
For a residential community, the load characteristics of EVs are influenced by the behavior of residential users. Based on the statistics of NHTS 2022, this study predicts the load of EVs in residential communities based on factors such as the start charging time and the single charging duration.
3.1.1. EV Arrival Time Distribution
Due to the lack of a remote power control function in UCPs, for the sake of convenience, residential users generally start charging immediately upon arriving at home. Therefore, it is considered that the time at which the EV user returns home is the time at which the EV starts charging. Based on the statistics of NHTS 2022, this time follows a beta distribution which is shown in Figure 2. Its probability density function can be expressed as follows:
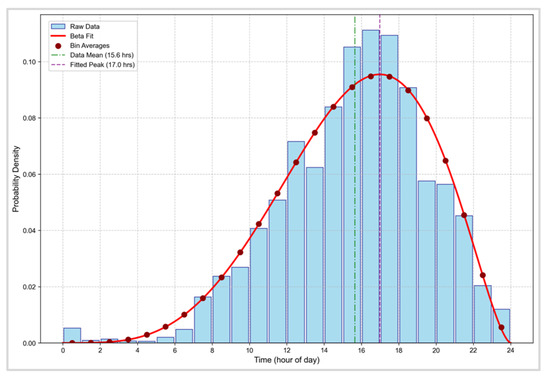
Figure 2.
EV Arrival Time Distribution.
3.1.2. Distribution of Single Charging Duration
The charging time is affected by the electricity consumption of the trip and the power of the charging station. The formula for calculating the charging time is as follows:
refers to the vehicle’s operation from the last full charge to the current charging, is the charging upper limit set by the user. Residential users exhibit significant stochasticity in travel behavior. Based on the Annual Report on the Big Data of New Energy Vehicle in China [24]; therefore, a log-normal distribution is adopted to model their travel distances which is shown in Figure 3, with the probability density function can be expressed as follows:
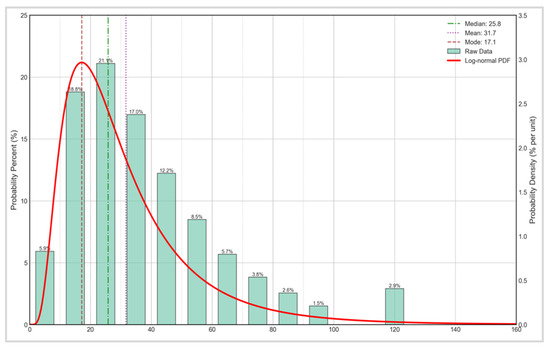
Figure 3.
Distribution of travel distances.
3.1.3. EV Charging Load Stimulation
Based on the probability distribution characteristics, the Monte Carlo method is employed to sample the daily mileage and charging start times of vehicles in the community within the 0–24 h time window of a day, following their respective probability distributions. Random matching is then performed on these sampled values to generate multiple random samples, thereby deriving the charging load of the community’s vehicles.
3.2. Controlled Charging Optimizes Scheduling Schemes
3.2.1. Objective Function
The goal of this study is to optimize the EV charging scheduling scheme globally, with the specific goal of minimizing the variance of the overall load curve after the superposition of the user load and the EV charging load. The mathematical expression is as follows:
can be expressed as:
For the th EV, the charging load in time can be expressed as:
The goal of optimization is to find the scheduling scheme with least out of all possible scenarios.
The controlled charging strategy needs to meet the constraints that each EV should complete the charging before it leaves, and the residential community’s total load of each charging time should not exceed the transformer capacity.
3.2.2. Scheduling Scheme Generation
Through the aforementioned non-intrusive retrofitting, UCPs have been equipped with scheduled charging capabilities. A controlled charging strategy based on the GD-SA algorithm has been designed for partially controllable UCPs. The generation process is shown in Figure 4.
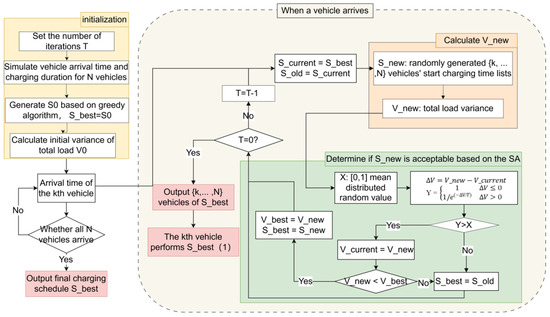
Figure 4.
Simulation process of sequential charging strategy based on the SA algorithm for UCPs.
- (1)
- Initialization of The EV Charging Scheduling Scheme
EV charging scheduling scheme based on GD algorithm is shown in Figure 5.
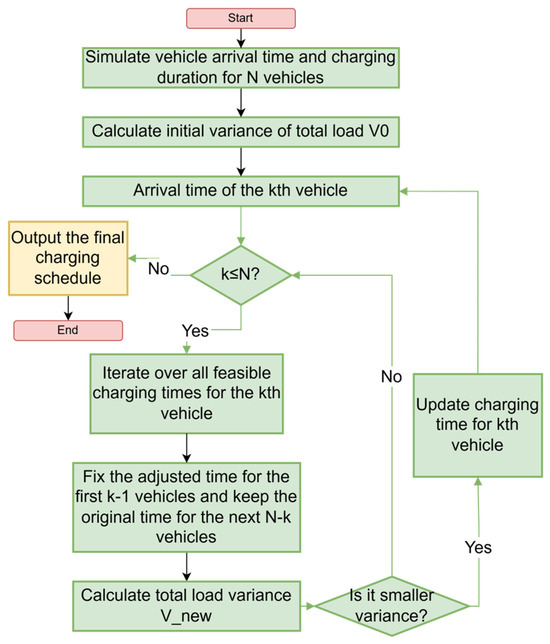
Figure 5.
EV charging scheduling scheme based on GD algorithm steps.
Firstly, the arrival times and driving electricity consumption of all vehicles in a residential community are simulated based on the probability distributions, and the corresponding charging durations are calculated.
Use a GD algorithm (Greedy algorithm) to create the initial EV scheduling scheme. When a vehicle arrives, update the daily total load curve to include the charging load curve of the arrived vehicle, the predicted charging load curve of the unarrived vehicles, and the predicted user load curve based on historical data. Only adjust the start charging time for the arriving vehicle, and select the scheduling scheme with the smallest variance from the feasible solutions as the initial scheduling scheme.
- (2)
- EV Charging Scheduling Scheme Based on GD-SA (Greedy-Simulated Annealing) Algorithm
Since the GD algorithm only optimises the initial charging time for arriving EVs, the impact of subsequent EV co-adjustment on overall variance is not considered. Due to the irreversibility of the decision time series, the strategy generated by the GD algorithm will converge to a local optimal solution. For example, selecting an imperfect solution for the arrival of an EV may create a more suitable time window for subsequent EVs, a possibility that the greedy strategy cannot capture.
This study proposes an optimization algorithm “GD-SA” that combines the GD algorithm with simulated annealing (SA) to get rid of the local optimum domain. The initial solution is the locally optimal solution of the GD algorithm, which ensures that the result of the GD-SA algorithm is at least as good as the result of the GD algorithm.
In each iteration, the GD-SA algorithm randomly adjusts the charging start time of the EV in each iteration by setting the initial temperature , temperature decay factor and the termination temperature (unlike the GD algorithm, it no longer defaults to the arrival time as the start charging time for vehicles that have not yet arrived).
If , the new EV charging scheduling scheme Snew must be accepted. If , the acceptance probability is used to decide whether to accept Snew; the acceptance probability is negatively correlated with the current temperature T. Under the premise of satisfying the boundary conditions, the EV charging scheduling scheme’s variance is gradually reduced to approximate the global optimal solution.
Although traditional traversal can also obtain the global optimal solution, the computational effort required is too great. Assuming t is the number of selectable times for a single electric vehicle (EV) and n is the total number of EVs, traditional traversal requires the calculation of tn combinations. The computational amount increases exponentially with n, and the complexity of the GD algorithm is O(n·t). In contrast, the simulated annealing (SA) approach uses random sampling to solve the problem and converge on a global optimum in polynomial time.
EV charging time optimization involves coordinating multiple EVs’ start times to minimize load variance (a high-dimensional, combinatorial optimization problem with multiple local optima). GD-SA is uniquely adapted to this scenario for reasons:
Dynamic Adjustment Capability: Vehicle arrival times and charging demands are often uncertain (e.g., user behavior variability). GD-SA’s stochastic search mechanism naturally accommodates such uncertainties by allowing iterative refinement of solutions as new information (e.g., late arrivals) emerges.
Parameter Flexibility: GD-SA’s key parameters (initial temperature T0, cooling rate α, and termination temperature T min) can be tuned to the problem’s scale. For instance, a larger T0 enables broader exploration in large-scale EVs, while a faster cooling rate α reduces iteration steps without sacrificing solution quality—critical for real-time or near-real-time scheduling.
In summary, GD-SA enhances the GD algorithm by breaking free from local optima through controlled randomness, balances computational effort with optimization quality, and aligns well with the dynamic, combinatorial nature of EV charging time optimization. This combination makes GD-SA a robust choice for addressing the study’s objectives.
- (3)
- Reduce the Error Between the Predicted and Actual Arrival Times of EVs.
Taking into account the difference between the actual and predicted arrival times of EVs when the strategy is generated, the EV charging scheduling scheme Si is regenerated each time an EV arrives, with only the vehicle currently arriving charging according to Si.
4. Case Study
4.1. Parameter Settings and Configuration
4.1.1. Modeling of EV Behaviors and Electrical Constraints of the Distribution Transformer
The simulation is conducted to analyze two types of typical communities—ordinary residential communities (ORCs) and old residential communities (OLCs). The purpose of the case study is to evaluate the influence of the orderly charging scheduling strategy based on the active reservation mechanism of UCPs on the smoothness of the overall load curve and peak control under different residential community conditions.
Compared with ORCs, OLCs are typically characterized by small transformer capacities, high load rates, and a large proportion of vehicles using UCPs.
It is assumed that the arrival times and daily travel distances of each EV are independent random variables, and that all EVs are fully charged by the end of the charging period. Additionally, the arrival times and daily travel distances of EV users in ORCs and OLCs follow the probability distributions shown in Table 1.

Table 1.
Parameter Values for ORCs and OLCs.
Based on typical residential electricity load data from a community in Tianjin, China, this paper constructs a base load curve in Figure 6.
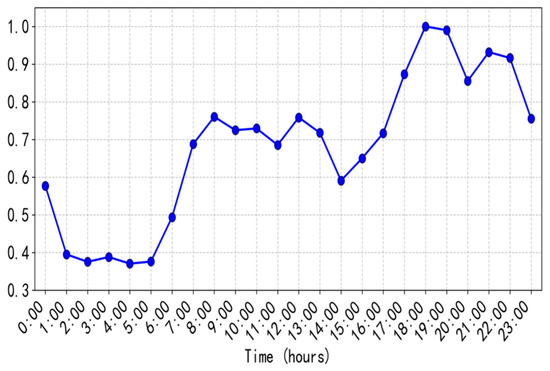
Figure 6.
User load characteristics.
4.1.2. Parameter Configuration for the SA Algorithm
To determine the optimal parameter configuration for the SA algorithm, this study conducted a systematic parameter sensitivity analysis. Algorithm performance was primarily evaluated using three metrics: (1) Solution quality: represented by load variance, where lower variance indicates a better solution; (2) Stability: measured by the standard deviation of variance across 30 independent runs, where a smaller standard deviation indicates greater algorithm stability; (3) Computational efficiency: expressed as the average runtime (seconds).
Seven parameter combinations were designed as shown in Table 2, covering different initial temperatures (), cooling rates (), and termination temperatures () to comprehensively explore the parameter space. These parameter settings reference classical design principles for the SA algorithm: the initial temperature should be sufficiently high to allow the algorithm to accept suboptimal solutions early on, avoiding getting stuck in local optima; the cooling rate should be sufficiently slow to ensure the algorithm has ample search time; the termination temperature should be sufficiently low to guarantee algorithm convergence.
Table 2.
SA Algorithm Parameter Combinations Design.
To comprehensively evaluate the performance of various parameter combinations, a multi-criteria decision-making method based on weighted scoring was adopted. First, the three evaluation metrics were normalized to eliminate dimensional effects. Subsequently, weights were assigned based on the importance of each metric: solution quality (load variance) was weighted at 0.6, stability (variance standard deviation) at 0.3, and computational efficiency (runtime) at 0.1. The parameter combination with the highest weighted score was ultimately selected as the optimal configuration.
Sensitivity analysis results as shown in Table 3 indicate significant differences in optimal parameters across scenarios. For ORCs, parameter combination 3 performed best with a weighted score of 0.870. This combination achieved a good balance between solution quality (variance = 1542) and stability (standard deviation = 87). For the OLCs scenario, due to its more complex solution space, parameter combination 7 performed optimally with a weighted score of 0.858. The higher initial temperature ( = 150) aided the algorithm in escaping local optima within the more intricate search space.
Table 3.
Comparison of Parameter Performance under Different Scenarios.
Based on the above analysis, this study ultimately selected parameter combination 3 ( = 50, = 0.99, = 1) for ORCs and parameter combination 7 ( = 150, = 0.985, = 0.5) for OLCs to conduct all subsequent simulation experiments.
4.2. Simulation Results
4.2.1. ORCs and the OLCs Simulation Results
Figure 7 shows the simulation results for the total load curves of the ORCs and the OLCs, following the implementation of EV charging scheduling schemes based on greedy and GD-SA algorithms.
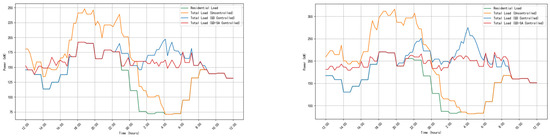
Figure 7.
The total load curve of the ORCs and OLCs before and after the electric vehicle charging scheduling scheme is adopted.
The changes before and after the EV charging scheduling scheme based on the GD algorithm and the GD-SA algorithm are shown in Table 4, under the condition of satisfying the same charging demand.
Table 4.
Effectiveness of scheduling scheme in ORCs and OLCs.
Table 4 compares the effects of the EV charging scheduling scheme based on the GD algorithm and the GD-SA algorithm on the variance and maximum load of the total load in the two scenarios of ORCs and OLCs. The results show that the EV charging scheduling scheme based on the GD-SA algorithm shows better regulation effect than the GD algorithm, both in ORCs and OLCs.
In the ORCs, the EV charging scheduling scheme based on the GD-SA algorithm reduces the load variance by 67.1%, which is still significantly higher than the 58.4% based on the GD algorithm. Moreover, the 95% confidence interval for GD-SA is also more concentrated.
At the same time, the maximum load reduction (e.g., around 18:00–22:00) has also increased from 14.8% of the EV charging scheduling scheme based on the GD algorithm to 30.3% of the EV charging scheduling scheme based on the GD-SA algorithm.
In the OLCs, in terms of maximum load reduction, the values of the two schemes reached 17.7% and 22.6%, respectively, indicating that the improvement effect of the OLCs was more obvious than that of the ORCs.
Overall, the EV charging scheduling scheme based on the GD-SA algorithm offers significant advantages in terms of load regulation. It is particularly effective in reducing the maximum load in OLCs with uneven load distribution, providing robust support for optimizing the grid regulation strategy.
4.2.2. Simulation Results Under Different User Acceptance Ratios
To verify the reliability of the strategy under the risk of user non-cooperation with recommended charging times, this paper configures multiple user acceptance levels and employs Monte Carlo simulations to stochastically simulate whether users adopt the controlled charging strategy. When strategy is rejected and spare capacity permits, users are allowed to charge according to self-defined schedules. However, limit violation risks trigger rejection of user charging plans. Furthermore, the effectiveness of the strategy under different user acceptance levels is simulated, and the results are presented in Figure 8.
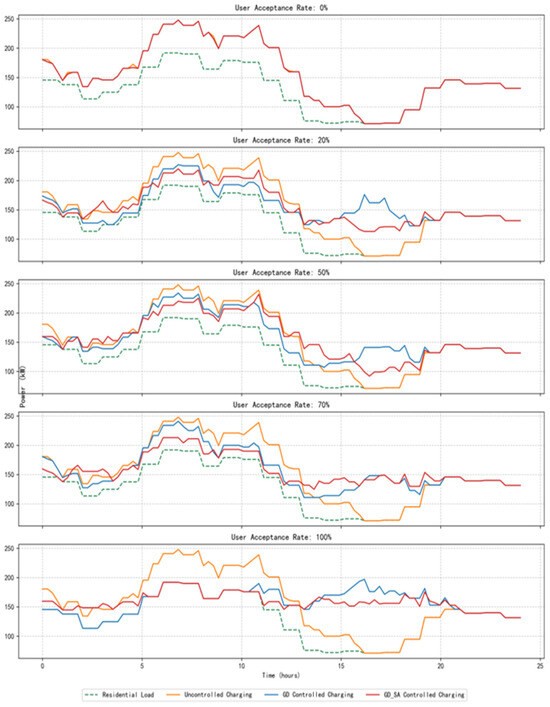
Figure 8.
Load comparison under different user acceptance.
When the user acceptance is less than 50%, both orderly charging modes do not have a significant effect on peak shifting of the grid, and compared with the total peak load of the grid under the uncontrolled charging mode, the GD controlled charging mode reduces 8.5% and the GD-SA controlled charging mode reduces 9.3%.
When the user acceptance is greater than 70%, the GD controlled charging mode shows some effect, but the peak shaving effect is not good. The GD-SA controlled charging mode presents good peak shaving performance. 58.3% of the charging load occurs during late-night hours (e.g., after 22:00) and 18.8% during the afternoon (e.g., 12:00–18:00). Compared with the total peak hour load of the grid in the uncontrolled charging mode and GD controlled charging mode, the GD-SA controlled charging mode reduces 11.6% and 3.2%, respectively.
4.2.3. Stress Test Results
Under the condition that the penetration rate of electric vehicles has doubled, the effect of changes in the simulated load are shown in Figure 9.
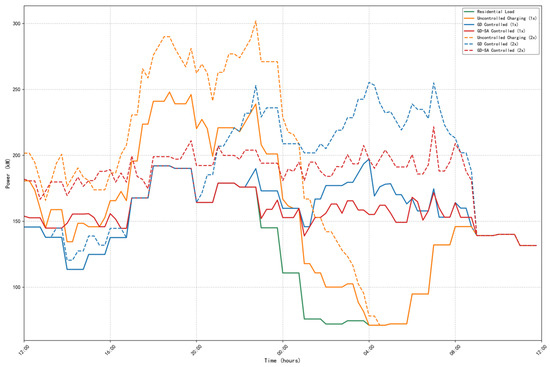
Figure 9.
Load comparison when the penetration rate of electric vehicles doubles.
The stress test results are shown in Table 5.
Table 5.
Stress test results.
Assuming 100% user acceptance, when the number of EVs is doubled, under the GD controlled charging mode, there will be some vehicles charging before 00:00, and at 22:45, the total load is 301.9 kW, creating a new load peak. Only 2.2% of the charging electricity occurs during the afternoon (e.g., 12:00–18:00), and the daytime capacity utilization is low. In the GD-SA controlled charging mode, the charging load rises uniformly throughout the day, and during the evening peak period (18:00–22:00), the total load increases to 199 kW, which is only a 3.5% increase in comparison to the residential load, with 20.1% of the charging load occurring during the afternoon (e.g., 12:00–18:00), and 58.3% of the charging load occurring during late-night hours (e.g., after 22:00).
Under the stress test scenario, the GD-SA controlled charging mode shows good peak shaving and valley filling performance, which verifies the stability and reliability of the algorithm.
5. Conclusions
The issue of grid safety caused by the large-scale connection of charging piles has created an urgent need for orderly management of community charging loads. Existing research has proposed various centralized and decentralized community orderly charging control strategies, but most of these strategies are based on the assumption that charging piles have remote communication control capabilities. However, the majority of charging stations currently deployed in residential communities are UCPs without communication capabilities. There is currently a lack of practical control architectures and control strategies for achieving orderly charging control for UCPs without upgrading hardware. Addressing this practical bottleneck, this paper proposes a non-intrusive modification architecture and corresponding orderly control optimization algorithm to achieve orderly charging control for UCPs, transforming this traditional disorderly charging load into a dispatchable flexibility resources.
The core innovations of this paper are twofold: first, a non-invasive architecture that does not require replacing UCPs or distribution equipment has been designed. By introducing PMUs, this architecture equips UCPs with the active reservation charging time function, allowing UCPs to participate in orderly charging. This architecture offers ease of deployment and scalability, enabling power grid companies or charging operators to achieve active management of unidirectional loads for community UCPs without altering UCP hardware, ensuring that the charging behavior of individual UCP users does not exceed transformer or power line capacity limits. Second, a hybrid GD-SA charging scheduling algorithm was developed based on this architecture. This algorithm models user random behavior and distributed capacity constraints to generate an optimal charging plan for community users, thereby achieving orderly management of total load. Validation using actual data from a typical residential area in Tianjin, China, demonstrates that under a scenario where 100% of users accept the optimized plan, this framework and algorithm can achieve a 17.7% reduction in peak load. Statistical feature comparisons using a 95% confidence interval further validate the effectiveness of the solution.
This study establishes a practical technical architecture and optimization strategy for achieving orderly charging control of UCPs. However, it has not yet conducted an in-depth analysis of user behavior prediction errors and their impacts. Further research is needed on the applicability verification of the GD-SA algorithm, computational efficiency optimization, model parameter selection and sensitivity analysis, and comparative analysis with mainstream reinforcement learning methods. Additionally, the control strategy in this study primarily focuses on the optimization and control of UCP charging stations under normal operating conditions. Future research could explore collaborative optimization strategies for UCPs, CPs, and related distributed resources, as well as cost–benefit optimization strategies under user economic incentive mechanisms, thereby continuously improving community-based orderly charging strategies. Furthermore, this study has not yet considered practical deployment challenges such as communication reliability, data security, and user interface design, nor has it addressed the impacts of user input errors or non-cooperative behaviors on dispatching results and system stability—these aspects will be analyzed in detail in future work.
Although there are still many directions for further in-depth research, this paper innovatively proposes a non-intrusive technical architecture and a user-reservation-based interactive optimization control strategy for UCP, a traditional resource that has been difficult to achieve orderly charging. This not only provides a more practical solution for addressing orderly charging control of UCPs in practice but also serves as a valuable supplement to existing orderly charging research literature.
Author Contributions
Conceptualization, S.H. and M.J.; methodology, G.Z.; software, Z.Z.; validation, Z.Z. and S.L.; formal analysis, G.Z. and J.Z.; investigation, M.J.; resources, J.Z. and S.L.; data curation, Z.Z. and G.Z.; writing—original draft preparation, M.J.; writing—review and editing, S.H. and G.Z.; visualization, S.L.; supervision, S.H. and G.Z.; project administration, J.Z. All authors have read and agreed to the published version of the manuscript.
Funding
The work is funded by the National Key R&D Program of China (2022YFB2403900).
Data Availability Statement
The original contributions presented in this study are included in the article. Further inquiries can be directed to the corresponding author.
Conflicts of Interest
Shuang Hao, Minghui Jia, Jian Zhang, Zhijie Zhang, Guoqiang Zu, Shaoxiong Li were employed by State Grid Tianjin Electric Power Company. All authors declare that the research was conducted in the absence of any commercial or financial relationships that could be construed as a potential conflict of interest.
Abbreviations
| Variables | Definition |
| Stronger traffic flow intensity | |
| Traffic flow volatility or sensitivity to arrival delays. | |
| Mean of the probability distribution of EV driving distance. | |
| Standard deviation of the probability distribution of EV driving distance | |
| Charging duration of vehicle j | |
| Charging power of the charging pile | |
| Charging efficiency of charging piles | |
| H | Electricity consumption per kilometer |
| Charging upper limit set by the user | |
| Battery capacity | |
| Total load of the residential community at time t | |
| Users’ base load at time t | |
| Users load factor | |
| Charging load of vehicle j at time t | |
| Arrival time of vehicle j | |
| Departure time of vehicle j | |
| EV charging start-time sequence. | |
| Rated capacity of the transformer | |
| Average power factor of the transformer | |
| Transformer operating efficiency | |
| Initial temperature of the SA algorithm | |
| Cooling rates | |
| Termination temperature of the SA algorithm | |
| S | EV charging scheduling scheme |
| V | Load variance under the EV charging scheduling scheme |
References
- Li, A.; Chen, Y.; Xiang, X.; Xu, C.; Wan, M.; Huo, Y.; Geng, G. Orderly Charging Control of Electric Vehicles: A Smart Meter-Based Approach. World Electr. Veh. J. 2024, 15, 449. [Google Scholar] [CrossRef]
- Xu, C.; Li, J.; Wang, W.; Xu, C.; Hu, Y.; Geng, G. Revenue Estimation for Orderly Charging of Electric Vehicles Based on Smart Meters. In Proceedings of the 2023 IEEE 7th Conference on Energy Internet and Energy System Integration (EI2), Hangzhou, China, 15 December 2023; IEEE: New York, NY, USA, 2023; pp. 3287–3292. [Google Scholar] [CrossRef]
- Zhu, C.; Xie, X.; Zhang, M.; Yao, Y. An orderly charging strategy for electric vehicles in residential areas with limited power infrastructure. In Proceedings of the 2023 IEEE 6th Student Conference on Electric Machines and Systems (SCEMS), HuZhou, China, 7 December 2023; IEEE: New York, NY, USA, 2023; pp. 1–5. [Google Scholar] [CrossRef]
- Faujdar, B.; Pandey, R.K. Overview of EV Charging Smart Control Architecture-Recent Developments. In Proceedings of the 2023 International Conference on Power, Instrumentation, Energy and Control (PIECON), Aligarh, India, 10 February 2023; IEEE: New York, NY, USA, 2023; pp. 1–6. [Google Scholar] [CrossRef]
- Udomparichatr, P.; Vateekul, P.; Rojviboonchai, K. End-to-End Smart EV Charging Framework: Demand Forecasting and Profit Maximization with Causal Information Enhancement. In Proceedings of the 2023 International Electrical Engineering Congress (iEECON), Krabi, Thailand, 8 March 2023; IEEE: New York, NY, USA, 2023; pp. 289–294. [Google Scholar] [CrossRef]
- Zhang, K.; Tian, Y.; Shen, B.; Su, Y.; Zhou, C.; Zhang, M. Orderly Charging Strategy for Residential Areas Taking into Account Demand from both Sides of Supply and Demand. In Proceedings of the 2022 4th International Conference on Smart Power & Internet Energy Systems (SPIES), Beijing, China, 9 December 2022; IEEE: New York, NY, USA, 2022; pp. 1744–1748. [Google Scholar] [CrossRef]
- Sheng, L. Charging and Discharging Control Strategies for Electric Vehicles Based on Real-Time Electricity Pricing; Northeast Petroleum University: Daqing, China, 2024. [Google Scholar] [CrossRef]
- Atthaporn, S.; Charoenlarpnopparut, C.; Suksompong, P.; Kudtongngam, J. An Optimized Charging for EV using Numerical Method in Consideration of TOU. In Proceedings of the 2023 IEEE PES 15th Asia-Pacific Power and Energy Engineering Conference (APPEEC), Chiang Mai, Thailand, 6 December 2023; IEEE: New York, NY, USA, 2023; pp. 1–5. [Google Scholar] [CrossRef]
- Park, J.-S.; Hussain, S.; Lee, J.-O.; Kim, B.H.; Kim, Y.-S. Time-of-Use (TOU) Electricity Rate for Vehicle-to-Grid (V2G) to Minimize a Charging Station Capacity. Int. J. Electr. Power Energy Syst. 2024, 161, 110209. [Google Scholar] [CrossRef]
- Zhang, M.; Yan, Q.; Guan, Y.; Ni, D.; Tinajero, G.D.A. Joint planning of residential electric vehicle charging station integrated with photovoltaic and energy storage considering demand response and uncertainties. Energy 2024, 298, 131370. [Google Scholar] [CrossRef]
- Zhu, T. The Impact and Optimization Strategies of Distributed Photovoltaic Grid Connection and Electric Vehicle Charging on the Distribution Network. Master’s Thesis, Nanchang Institute of Technology, Nanchang, China, 2024. [Google Scholar] [CrossRef]
- Georgiev, M.; Stanev, R.; Krusteva, A. Flexible load control in electric power systems with distributed energy resources and electric vehicle charging. In Proceedings of the 2016 IEEE International Power Electronics and Motion Control Conference (PEMC), Varna, Bulgaria, 25–28 September 2016; IEEE: New York, NY, USA, 2016; pp. 1034–1040. [Google Scholar] [CrossRef]
- Sasidharan, C.; Kalia, S. Smart Charging Strategies for the Changing Grid. In Smart Charging Solutions for Hybrid and Electric Vehicles; Wiley: Hoboken, NJ, USA, 2022; pp. 83–103. [Google Scholar] [CrossRef]
- Ding, Y.; Zeng, S.; Zhang, B.; Wang, Y.; Liu, C.; Fu, Z.; Zhang, J. Orderly charging strategies and application effects of Photovoltaic-DC smart charging piles. Electr. Power 2024, 57, 70–77. [Google Scholar] [CrossRef]
- Graber, G.; Galdi, V.; Calderaro, V.; Lamberti, F.; Piccolo, A. Centralized Scheduling Approach to Manage Smart Charging of Electric Vehicles in Smart Cities. In Proceedings of the 7th International Conference on Smart Cities and Green ICT Systems (SCITEPRESS), Funchal, Portugal, 16–18 March 2018; Science and Technology Publications: Setúbal, Portugal, 2018; pp. 238–245. [Google Scholar] [CrossRef]
- Triviño, A.; López, A.; Yuste, A.J.; Cuevas, J.C. Decentralized EV Charging and Discharging Scheduling Algorithm Based on Type-II Fuzzy-Logic Controllers. J. Energy Storage 2024, 93, 112054. [Google Scholar] [CrossRef]
- Kakkar, R.; Chaudhary, S.; Gupta, R.; Tanwar, S.; Kumar, S. Blockchain-based Decentralized Application for Electric Vehicle Scheduling at Charging Station. In Proceedings of the 2024 ACM Southeast Conference, Marietta, Georgia, 18–20 April 2024; ACM: New York, NY, USA, 2024; pp. 2–8. [Google Scholar] [CrossRef]
- Mets, K.; Verschueren, T.; Turck, F.D.; Develder, C. Exploiting V2G to optimize residential energy consumption with electrical vehicle (dis)charging. In Proceedings of the 2011 IEEE First International Workshop on Smart Grid Modeling and Simulation (SGMS), Brussels, Belgium, 17 October 2011; IEEE: New York, NY, USA, 2011; pp. 7–12. [Google Scholar] [CrossRef]
- Jia, C.; Liu, W.; He, H.; Chau, K. Superior energy management for fuel cell vehicles guided by improved DDPG algorithm: Integrating driving intention speed prediction and health-aware control. Appl. Energy 2025, 394, 126195. [Google Scholar] [CrossRef]
- Yu, H.; Mou, X.; Liu, J.; Yang, Z.; Lin, F.; Wu, C.; Lin, Y. An orderly charging strategy for electric vehicles in residential communities based on dynamic time-of-use charging price response. Power Syst. Big Data 2022, 25, 34–42. [Google Scholar] [CrossRef]
- Pan, Y.; Chen, Z. An orderly charging strategy for electric vehicles in old residential areas based on user responses. Electr. Eng. Mater. 2024, 195, 50–55. [Google Scholar] [CrossRef]
- Zhao, Y. Research on Electric Vehicle Charging Strategy considering Real-Time Electricity Prices and Master-Slave Game Theory. Master’s Thesis, Yanshan University, Qinhuangdao, China, 2024. [Google Scholar] [CrossRef]
- Yang, Y.; Duan, W.; Wang, W.; Zhang, X.; Peng, X.; Han, Q.; Li, Y.; Li, S.; Gao, S. EV Senseless Orderly Charging Technology for High User Participation Rate in Residential Area. World Electr. Veh. J. 2022, 13, 126. [Google Scholar] [CrossRef]
- Wang, Z. Annual Report on the Big Data of New Energy Vehicle in China (2022); Springer Nature: Singapore, 2024. [Google Scholar] [CrossRef]


Disclaimer/Publisher’s Note: The statements, opinions and data contained in all publications are solely those of the individual author(s) and contributor(s) and not of MDPI and/or the editor(s). MDPI and/or the editor(s) disclaim responsibility for any injury to people or property resulting from any ideas, methods, instructions or products referred to in the content. |
© 2025 by the authors. Published by MDPI on behalf of the World Electric Vehicle Association. Licensee MDPI, Basel, Switzerland. This article is an open access article distributed under the terms and conditions of the Creative Commons Attribution (CC BY) license (https://creativecommons.org/licenses/by/4.0/).