1. Introduction
The long-term sustainable development goals set by several countries around the globe have resulted in an enormous increase in clean energy alternatives in the energy and transportation sectors. Electric vehicles (EVs) are receiving significant attention these days as an environmentally friendly transportation measure to eliminate the tailpipe emissions of IC engine-based vehicles [
1]. Two-wheeler EVs account for 30% of global mobility, as per the [
2] reports. E-mobility using light electric vehicles (LEVs) is considered to be an affordable choice for developing economies, which has put a lot of focus on two-wheeler EV research and development. The major drawbacks of EVs are the lack of charging infrastructure, charging time, concerns about vehicle safety, battery life, and driving range. These concerns are fading away due to affordable smart charging techniques [
3] and larger-capacity batteries with good life span capabilities. The driving range [
4] of an EV is mainly dictated by the efficient design of the power train components, like batteries and motor drives.
The battery is one of the core components of the EV drive train. Commercial EV batteries with different chemistries are available on the market, such as lead–acid, nickel–cadmium, nickel–metal hydride, and Li-ion batteries. These batteries differ concerning their energy density, power density, and weight figures. The present trend in the EV market is for Li-ion batteries due to their advantages like higher energy density and longer life. Li-ion batteries have some variants like lithium iron phosphate (LFP), lithium cobalt oxide (LCO), and lithium titanium oxide (LTO), depending on the type of cathode materials [
5]. Lithium-ion batteries are being preferred not only in hybrid and pure EVs but have also become the battery of choice for two-wheeler EVs as well.
The technological challenges [
6] associated with EV batteries include higher initial costs, limited lifetime reliability, and performance degradation due to several factors like user behaviour [
7,
8] and thermal characteristics [
9]. As the battery is an important and expensive component in an EV drive train, it should be ensured that it is being used optimally to meet the predicted lifetime duration provided by the manufacturers and to minimise any inadvertent situations that demand battery replacements.
Multiple factors, like temperature [
10], charging methods, vehicle usage patterns, and the weight of the vehicles, affect the life and performance of an EV battery [
11]. The temperature factor not only considers the ambient temperature but also includes the internal heat generated within the battery pack, which again depends on the usage pattern of the battery. Battery packs are usually designed to operate in a range of temperatures. Any temperature outside the optimum operating range specified by the manufacturer will reduce the lifetime of the battery. Similarly, high-speed charging and deep discharging factors can degrade the batteries faster and reduce their lifetime [
12].
One of the main factors that impacts the battery’s performance and lifetime is the usage pattern of the batteries. The battery performance and degradation assessment studies are usually carried out by modelling the capacity fade of the battery cells using electrochemical equations [
13], mathematical modelling of cell impedance [
14], or empirical approaches [
15]. However, these studies do not consider battery usage in real-world driving scenarios.
Drive cycles can be used to characterise the users’ driving patterns for the vehicles. Based on real-world driving data, drive cycles provide a platform to test the vehicles before performing on-road tests. A drive cycle is usually a speed–time trace, which is mainly used for the evaluation of vehicle performance and optimisation [
16]. Drive cycles [
17] are usually country-specific [
18] and also vary concerning urban [
19] and rural roads [
20]. Within the same road, the traffic pattern of the area and the driver’s behaviour also impact the battery’s performance. The vehicle speed profiles on different types of road conditions and traffic patterns will have an impact on the battery energy consumption trends, and an aggressive driving profile with high power demands during acceleration and deceleration modes can reduce the life of the battery pack [
21]. The user’s driving pattern can have significant impacts on the performance and lifetime of the batteries. These challenges mandate research on battery system models and optimisation with user behaviours.
A common method to assess the various user driving patterns and battery performance is by comparing the battery performance parameters with standard drive cycles. The drive cycle-based performance assessment of EVs and their sub-components [
22] has been reported in the literature with various standard drive cycles [
23]. However, the studies relating to two-wheeler EV drive trains, including the models of two-wheeler vehicle dynamics, battery pack, motor, power train control configurations, and models of user driving behaviour impact on battery performance, are lacking in the presented literature.
To carry out efficient EV power train design and component optimisation, virtual tests and model-based approaches [
24,
25] are commonly used by EV manufacturers to decrease the time and cost aspects of optimising the power train components. The model-based approaches have the provisions to test vehicle performance with different drive patterns and environmental conditions in terms of ambient temperatures and road gradability features.
MATLAB–Simulink is an efficient modelling tool that enables developers to model and assess the performance of the EV power train and its sub-components based on the various levels of model fidelity [
26,
27]. Sub-components like vehicle dynamics and battery pack characterisation can be rapidly developed using the physical system models in the Simscape environment. The non-linearities, thermal effects, and battery degradation behaviour can be analysed using the Simscape models of the battery [
28,
29]. In addition to the system-level battery models, parameterised models representing the datasheet characteristics of the batteries can also be implemented with the Simscape battery library.
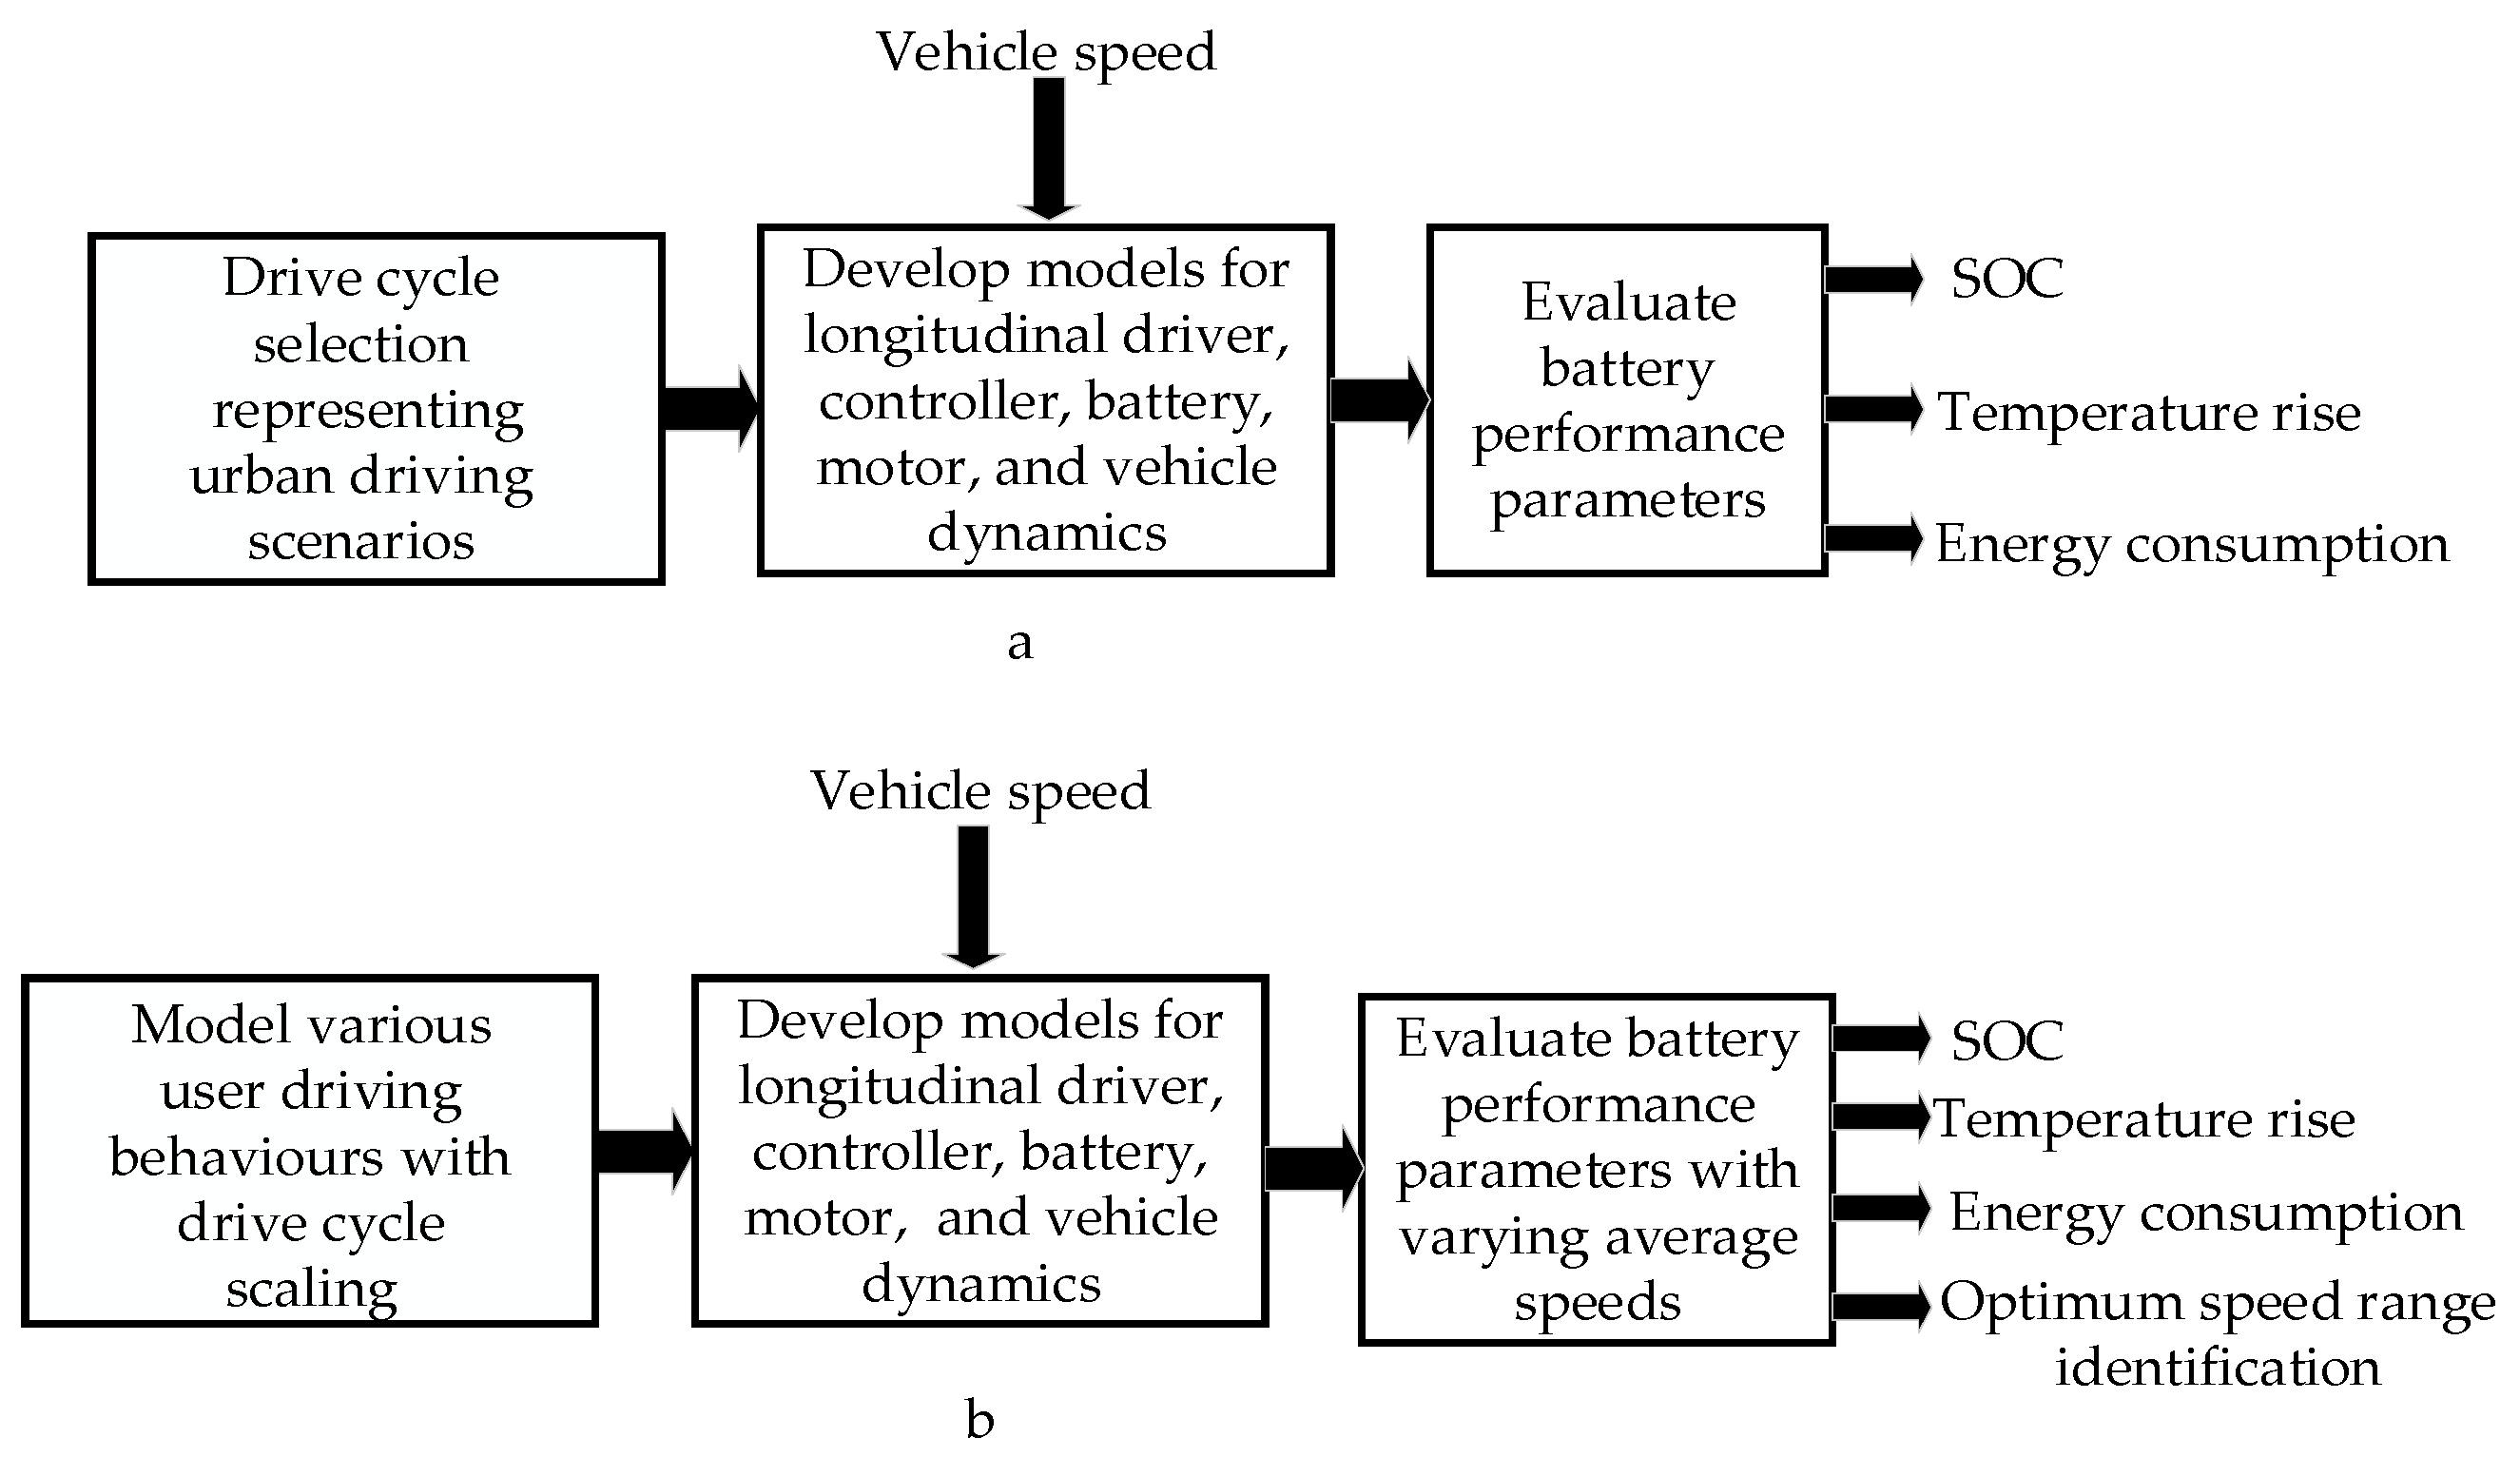
The main contributions of this paper include a system-level design and model of a two-wheeler EV drive train developed with the motors, Li-ion battery pack, vehicle dynamics, and power train controls. This drive train model has been used to assess battery performance with various user driving patterns. In addition to the standard drive cycles, various user driving behaviours are modelled by modifying the speed trace of the actual drive cycles by the velocity scaling approach [
30]. The impact of user driving behaviour on battery performance is evaluated in terms of battery energy consumption, state of charge (SOC) degradation, and thermal behaviour of the battery pack. This study has resulted in the identification of the optimum speed range under each selected drive cycle to minimise battery energy consumption. The optimum speed range identification and quantification of the battery performance parameters with the modelled drive cycle behaviour, focusing on a two-wheeler EV drive train, is one of the major novel results of this study. These results can be considered significant for optimising battery pack performance by keeping battery energy consumption and degradation to a minimum.
Section 2 describes the methodology and EV drive train system with all the sub-components of the drive train model, while
Section 3 presents the various drive cycle characteristics and the models of the modified user drive cycle characteristics.
Section 4 discusses the results and discussions, followed by the conclusion section.
3. Performance Assessment of Two-Wheeler EV Batteries with User Driving Patterns
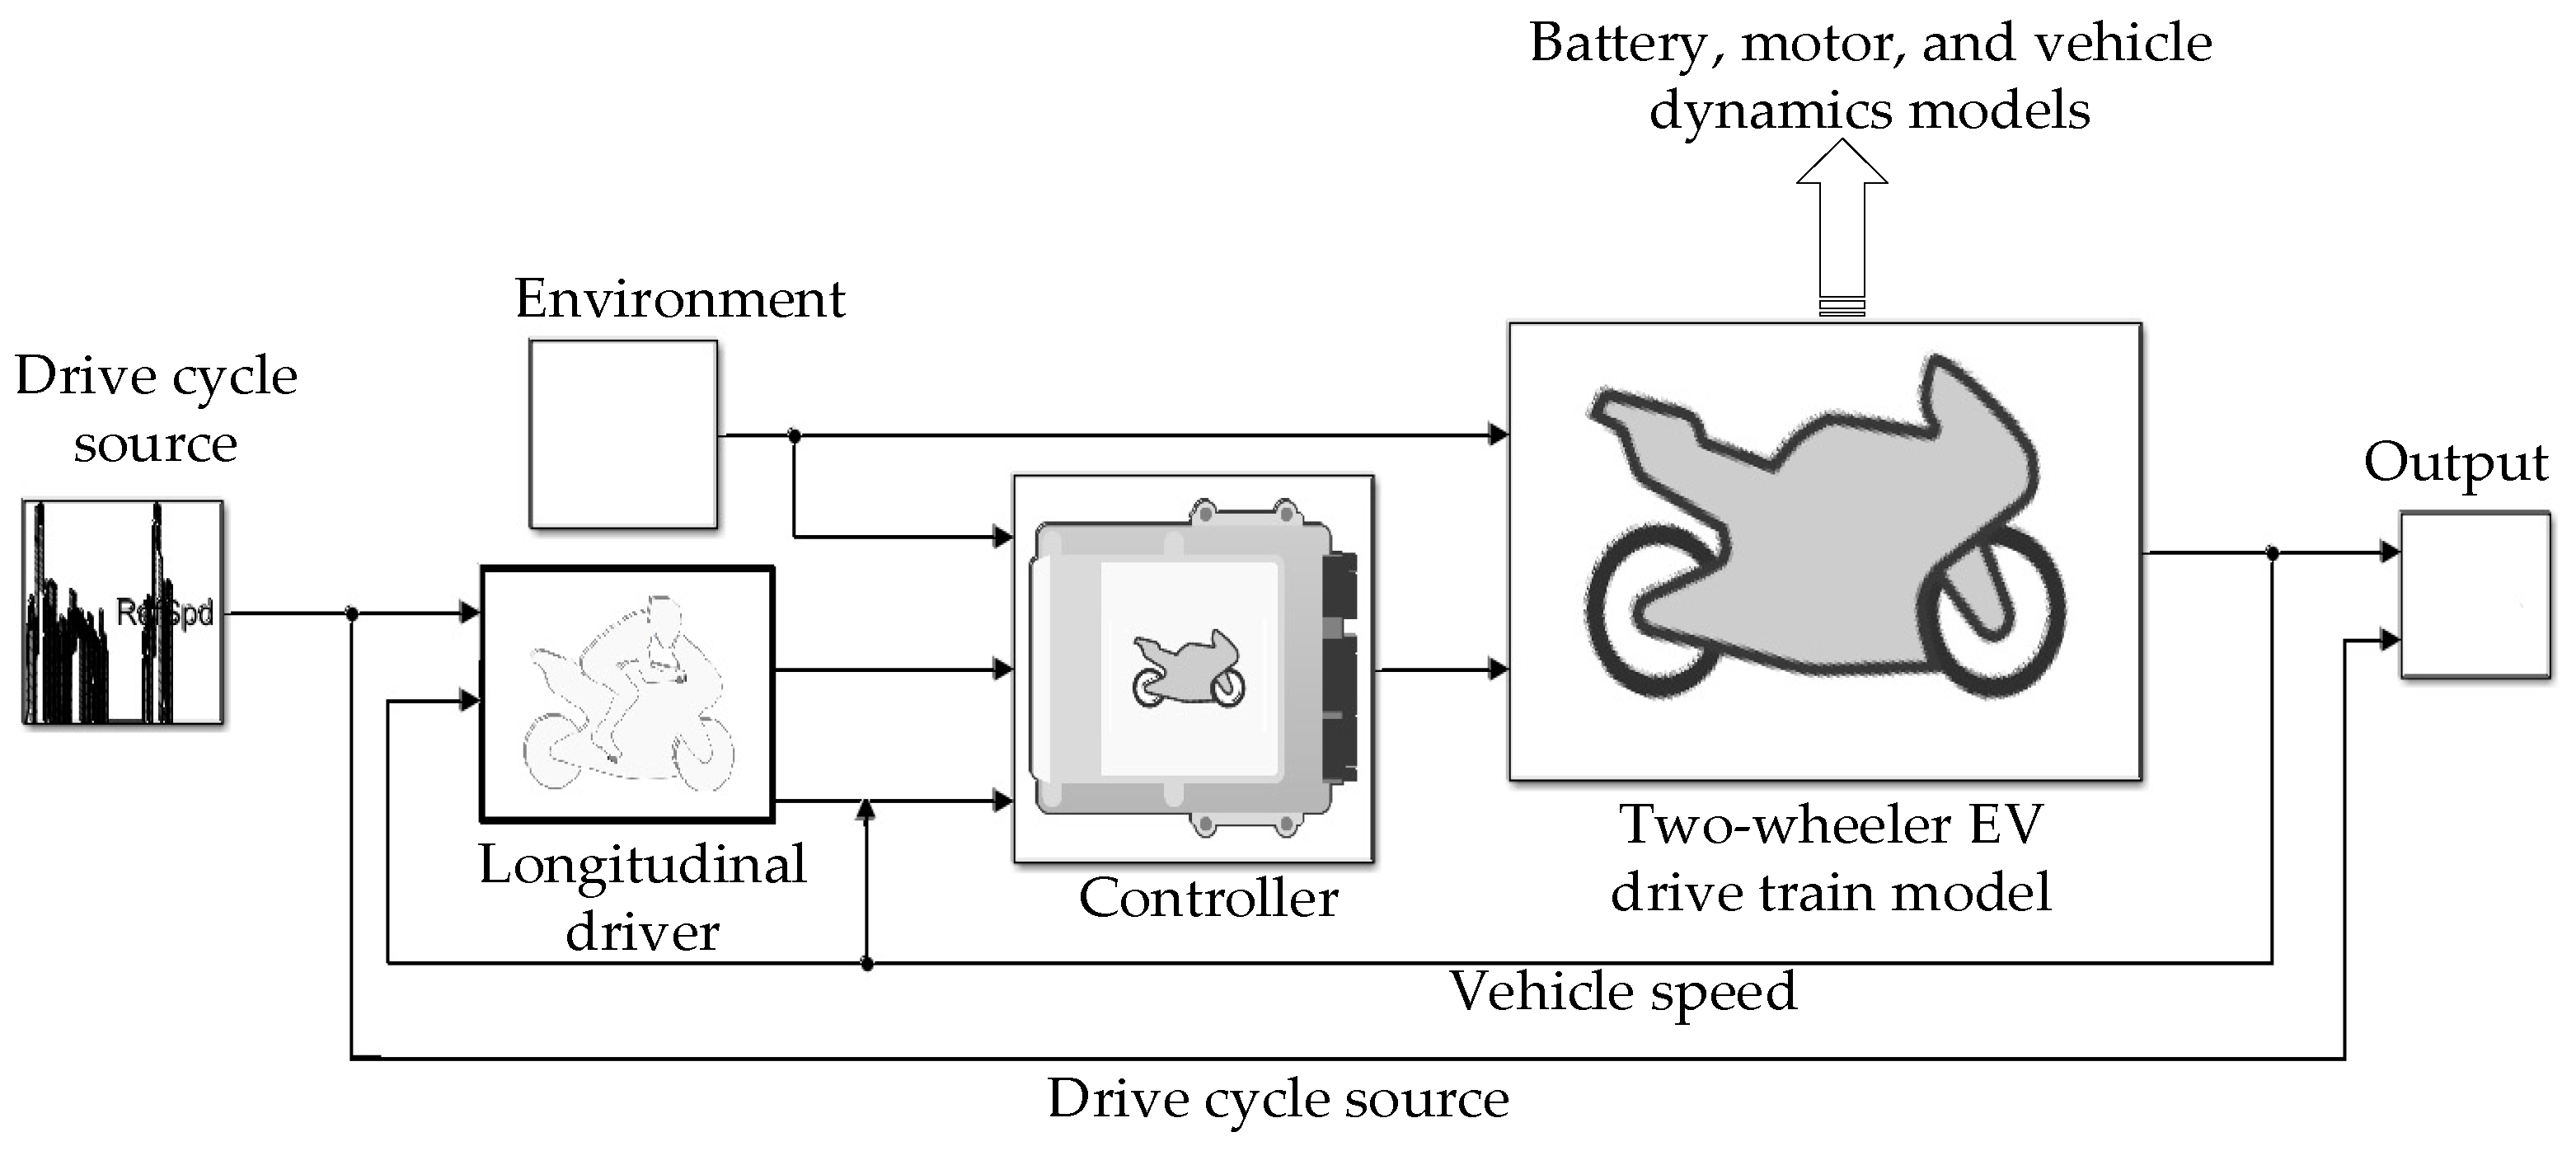
The model-based simulation tools are reported to be used by many EV industries in the present-day scenario to optimise vehicle design and control performance. However, the performance analysis of two-wheeler EVs, along with their battery performance for different drive cycles, needs investigation. The vehicle models are useful to predict the emissions from the vehicles using standard, realistic drive cycle information. The two-wheeler EV drive train model is presented in
Figure 3, which is developed based on the EV reference model of the Mathworks [
31]. The components of the drivetrain models are illustrated below.
3.1. Longitudinal Driver Model
The longitudinal driver model in the vehicle dynamic block set of MATLAB–Simulink has a longitudinal proportional-integral (PI) speed-tracking controller. The actual speed of the vehicle and the drive train commands are given as input to the longitudinal driver model. This block mimics the dynamic response of the driver and generates the necessary commands to track the longitudinal drive cycle, which is the load imposed on the vehicle. With the drive cycle information and vehicle speed feedback, the longitudinal driver model generates the necessary acceleration and deceleration commands, which are sent to the controller.
The controller generates the required torque command for the power control unit based on the actual vehicle speed and the operational commands of the longitudinal driver. The motor parameters, torque constant, and emf constant characterise the electric motor model as explained in
Section 2.3 and generate the motor torque demand. The current proportional to the torque demand of the motor is modelled as the discharge current of the EV battery. The torque demand is also given as an input to the vehicle dynamics block, which in turn outputs the actual vehicle speed using the vehicle dynamic characterisation model.
3.2. Drive Cycles
Drive cycles are the second-by-second speed trace of the vehicle on a time scale to represent a specific type of driving. Drive cycles are typically used by the EV industry to predict the performance, emission levels, and fuel consumption aspects of the vehicles and to optimise the vehicle control system’s performance. Different standard drive cycles are available in different countries. The characteristics of the drive cycles differ on urban roads and highways depending on their maximum speed, time of run, and acceleration and deceleration levels.
The vehicle dynamic block set of the MATLAB–Simulink tool is equipped with a drive cycle source library with speed–time traces to represent the various driving patterns. The drive cycle source block is capable of generating vehicle longitudinal speeds on time in a repeating sequence to depict several acceleration, deceleration, and stoppage times of the vehicles according to the selected drive cycle source in the road (like urban, rural, and motorway) and country-specific driving patterns.
Four different drive cycles have been considered in this study to represent the city driving scenarios with low average speeds and accelerations with frequent stops, which will justify the two-wheeler driving pattern in urban areas. The selected drive cycles are characterised by different behaviours concerning high and low speeds and starting and stopping time intervals, as illustrated by their speed–time traces. The battery performance parameters, battery energy consumption, and torque demand from the vehicle power train will be different for the selected power cycles according to the drive cycle characteristics. A brief characterisation of the selected drive cycles is illustrated below.
3.2.1. Worldwide Harmonised Light Vehicles Test Cycle (WLTC) Class 1 and Class 2 Drive Cycles
WLTC drive cycles are widely used for emission and fuel consumption analysis of light-duty vehicles [
32,
33]. They are considered to be the global standardised and realistic driving cycle for emission and fuel consumption analysis of light-duty electric vehicles. WLTC drive cycles are categorised into three classes based on the power-to-mass ratio (PMR) of the vehicles, which is defined as the ratio of rated power in watts divided by the kerb mass of the vehicles in kg. For PMR less than or equal to 22, WLTC class 1 category drive cycles are used; for PMR between 22 and 34, WLTC class 2 category drive cycles are used; and for PMR greater than 34, WLTC class 3 category drive cycles are used.
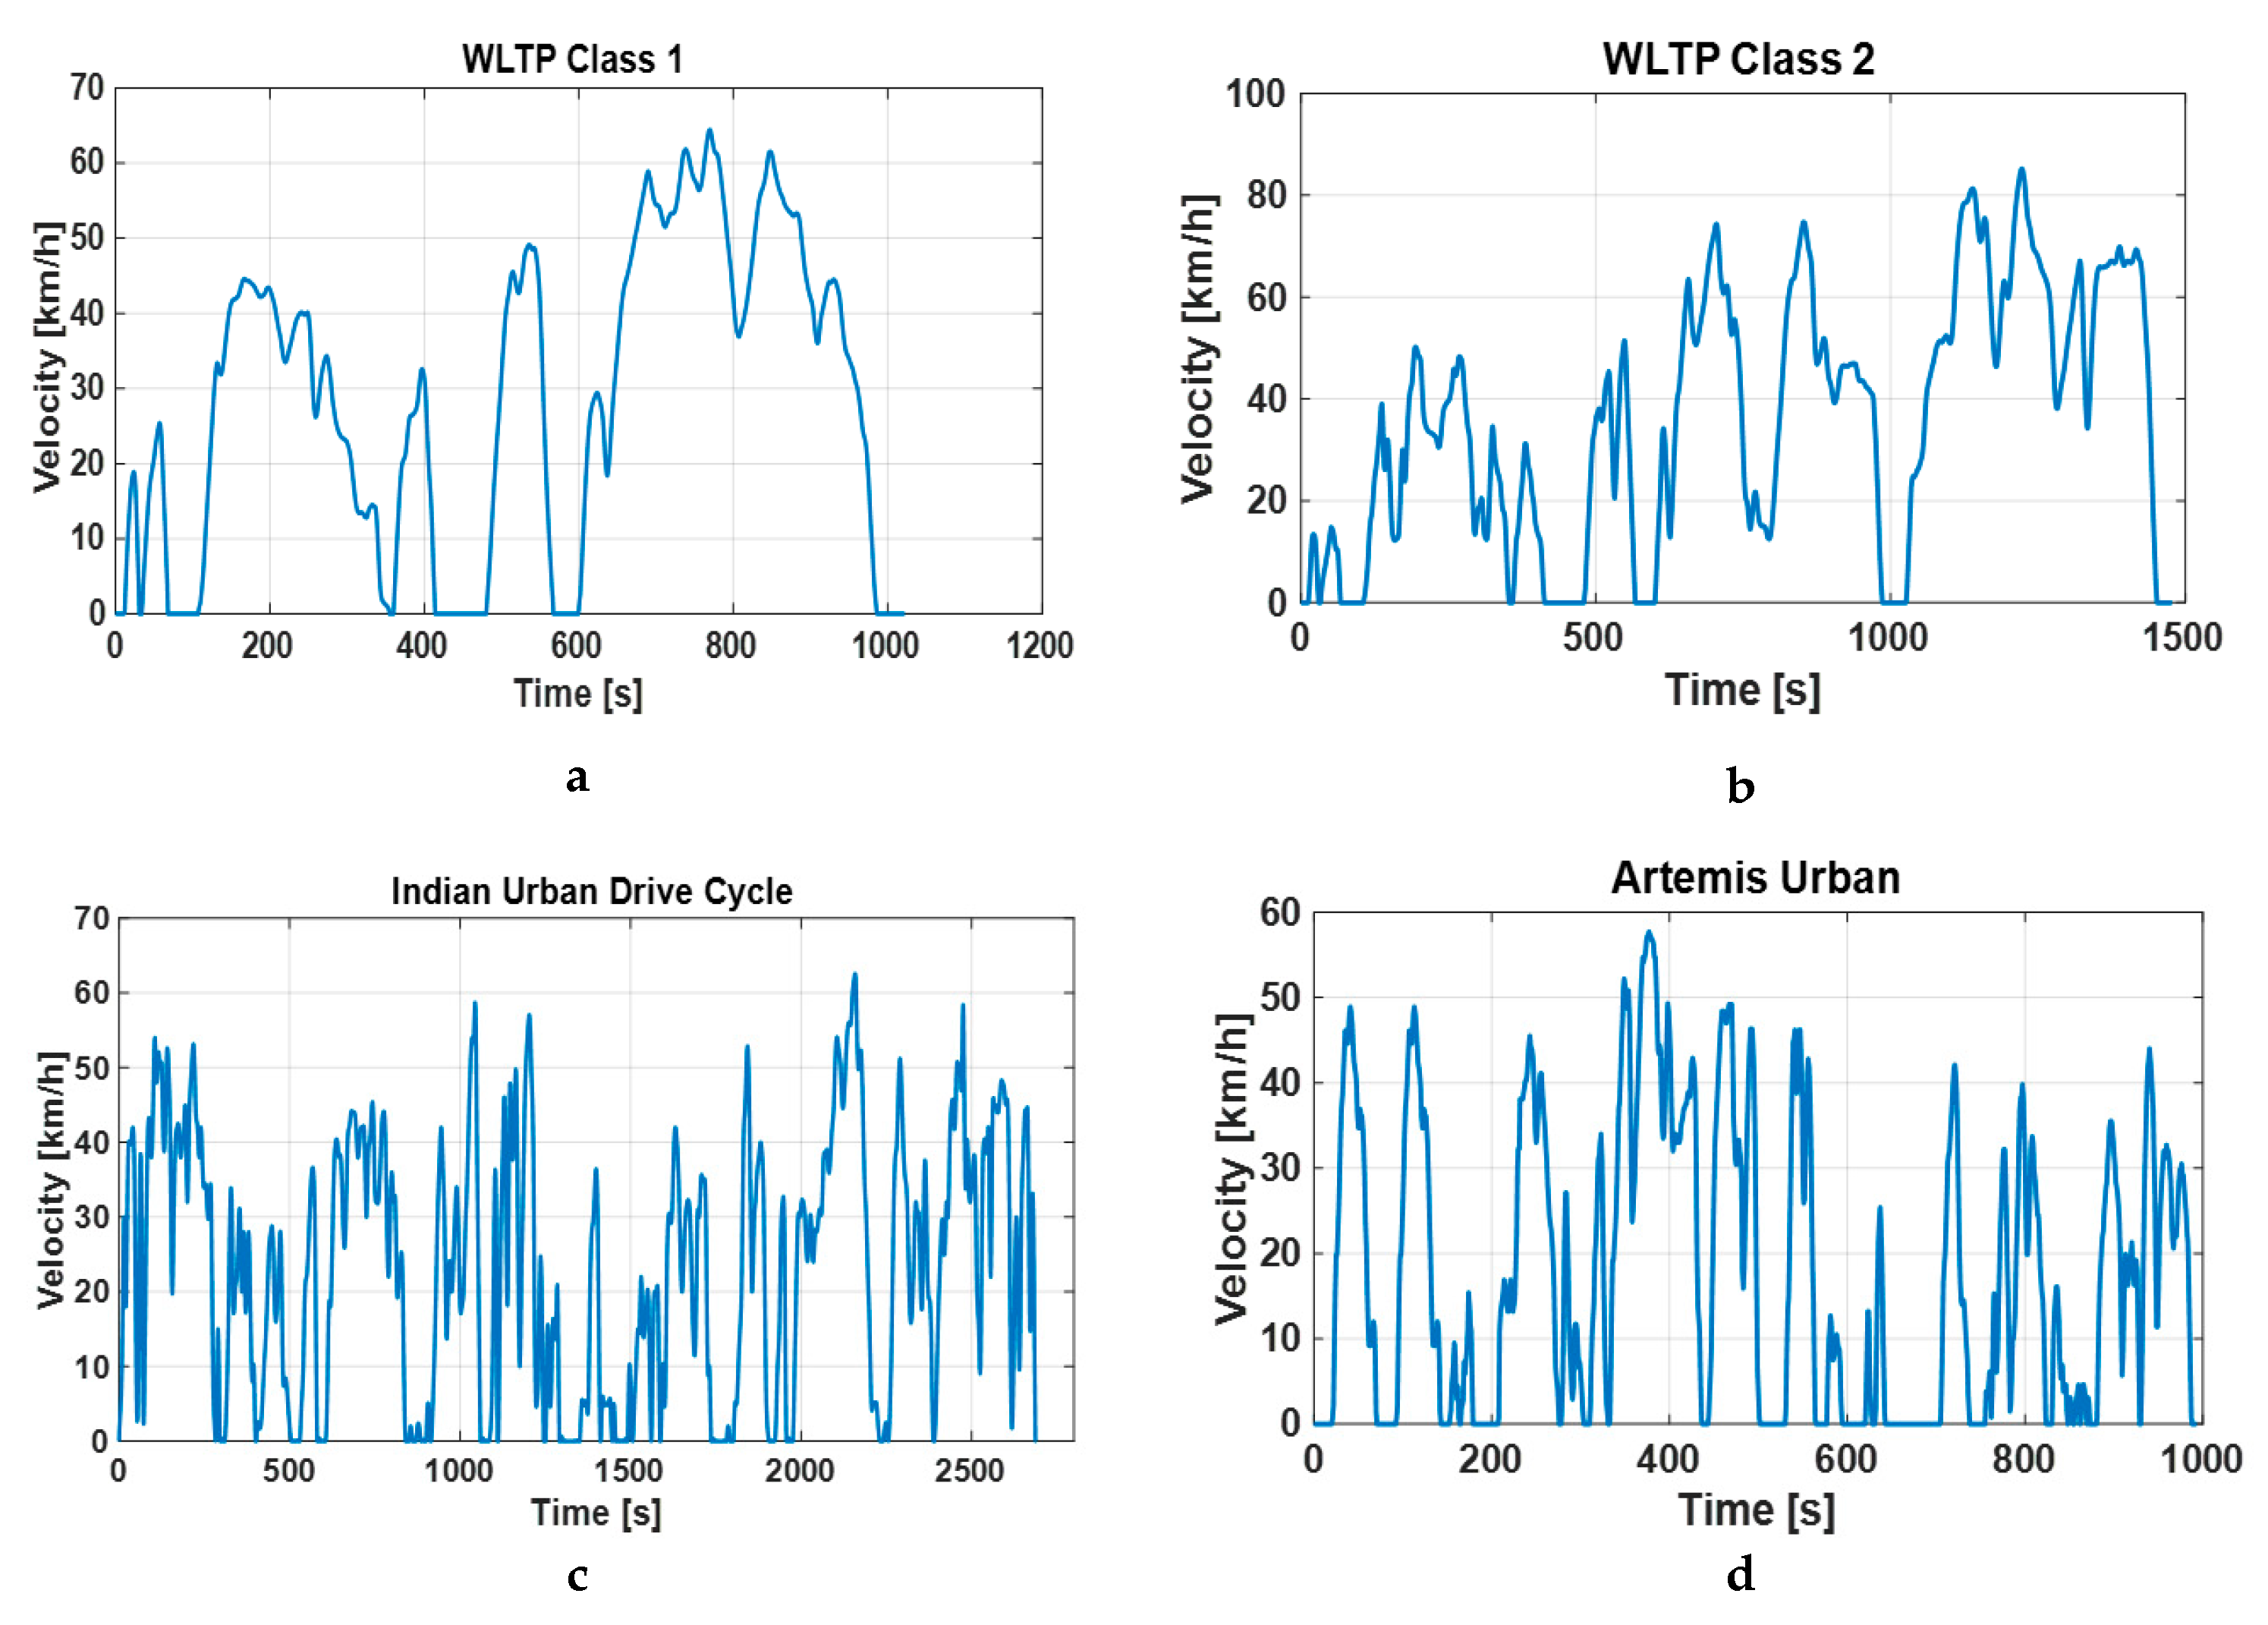
WLTC class 1 and WLTC class 2 cycles represent the low-power vehicles driven in India, Europe, and Japan. As two-wheeler EVs are the focus of this paper, WLTC class 1 and WLTC class 2 drive cycles are considered in this study, which are presented in
Figure 4a,b. The WLTC class 1 drive cycle has an average speed of 28.5 km/h and a maximum speed of about 64 km/h. Moreover, the WLTC class 2 drive cycle is characterised by an average speed of 35 km/h and a maximum speed of about 85 km/h.
3.2.2. Indian Urban Drive Cycle (IUDC)
The IUDC has a low average speed and rapid acceleration. The IUDC characteristics are plotted in
Figure 4c. IUDC has a maximum speed of 64 km/h and an average speed of 24 km/h. The IUDC characteristics are similar to those of the WLTC class 1 cycle.
3.2.3. Artemis Urban Drive Cycle
Artemis (assessment and reliability of transport emission models and inventory systems) is a standardised reference drive cycle based on European real-world driving patterns, with three driving categories representing urban, rural, and motorway roads. The Artemis urban drive cycle is plotted in
Figure 4d, which has an average speed of 18 km/h and a maximum speed of 58 km/h.
3.3. Modeling of Various User Driving Behaviours
The multiplier drive cycle approach was used by [
30] to study the impact of drive cycle aggressiveness on hybrid electric vehicles. A similar approach is used to model the various user driving behaviours by drive cycle modifications representing slow, moderate, and aggressive driving behaviours. An increase in the vehicle speed models the aggressive driving behaviour, which is obtained by scaling up the velocity trace of the drive cycle by the chosen scaling factor. Similarly, a decrease in the vehicle speed models the slow driving behaviour by scaling down the velocity trace of the drive cycle. As within the same time frame, velocity alone is scaled, this accounts for scaling in the acceleration factor as well.
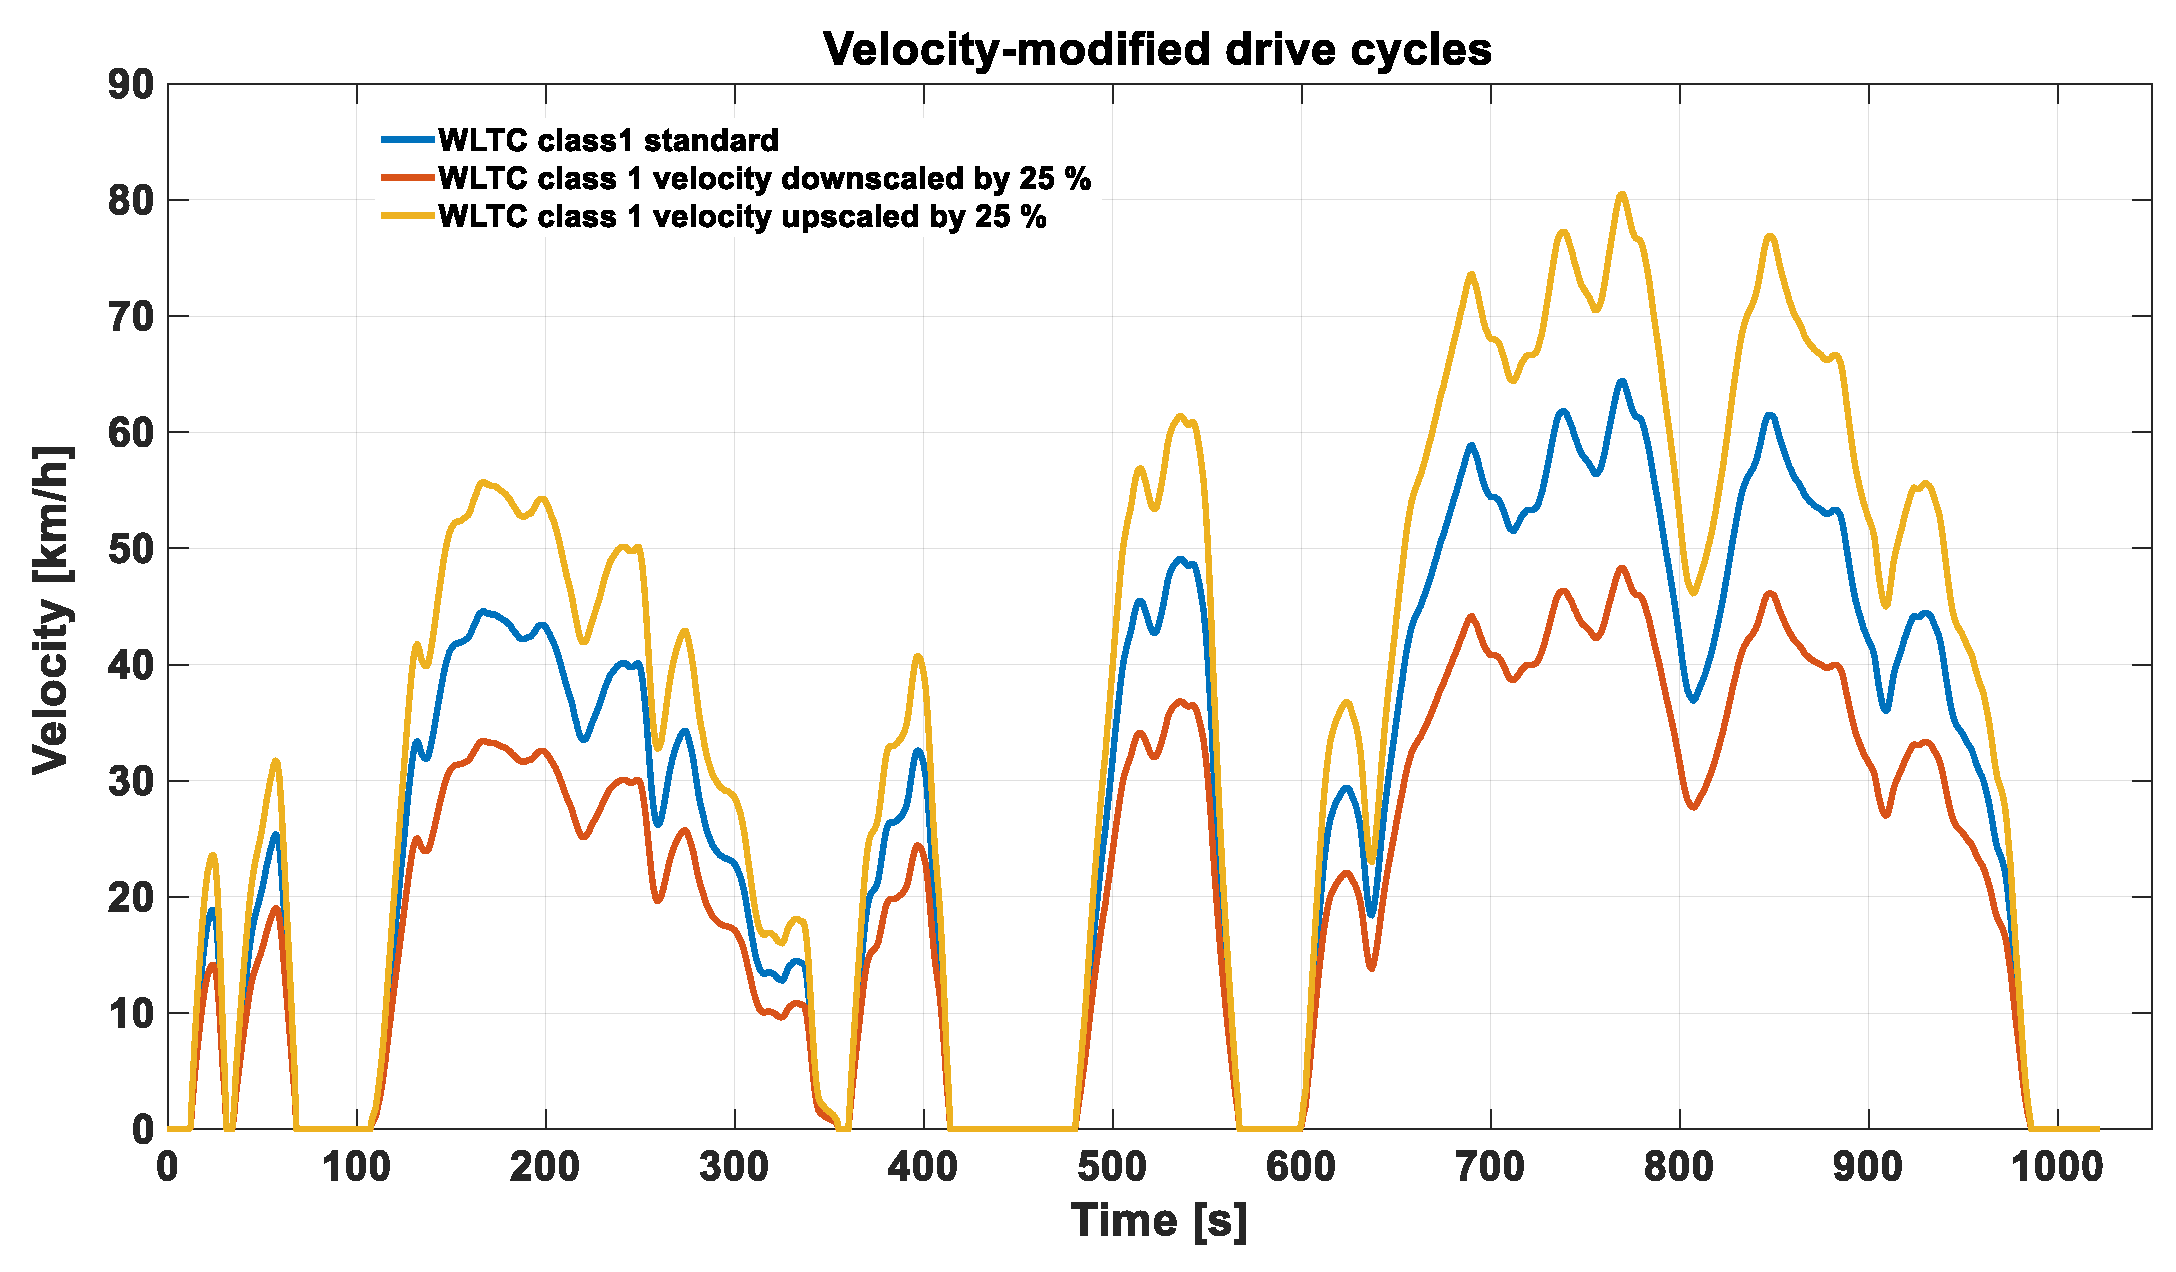
Figure 5. represents the modelled user driving behaviours by the multiplier drive cycle approach for the WLTC class 1 driving cycle with a scaling factor of ± 25%. Slow (−25%, −10%, and −5%), moderate (+5% and +10%), and aggressive (+25%) user driving behaviours are modelled by scaling up and scaling down the velocity trace of the selected standard drive cycles by the multiplier drive cycle approach. These velocity-modified drive cycles are used to analyse the battery performance of the two-wheeler EV drive train for various user driving behaviours.
4. Results and Discussions
The EV drive train with its sub-components were modelled and simulated in the MATLAB–Simulink environment. A Simscape parameter-based battery model was used with the thermal port. The battery was rated at 72 V and 60 Ah. The parameters of the two-wheeler drive train are presented in
Table 1. The developed two-wheeler EV model in Simulink was tested and validated for the WLTC class 1, WLTC class 2, Indian urban drive cycle (IUDC), and Artemis urban drive cycles.
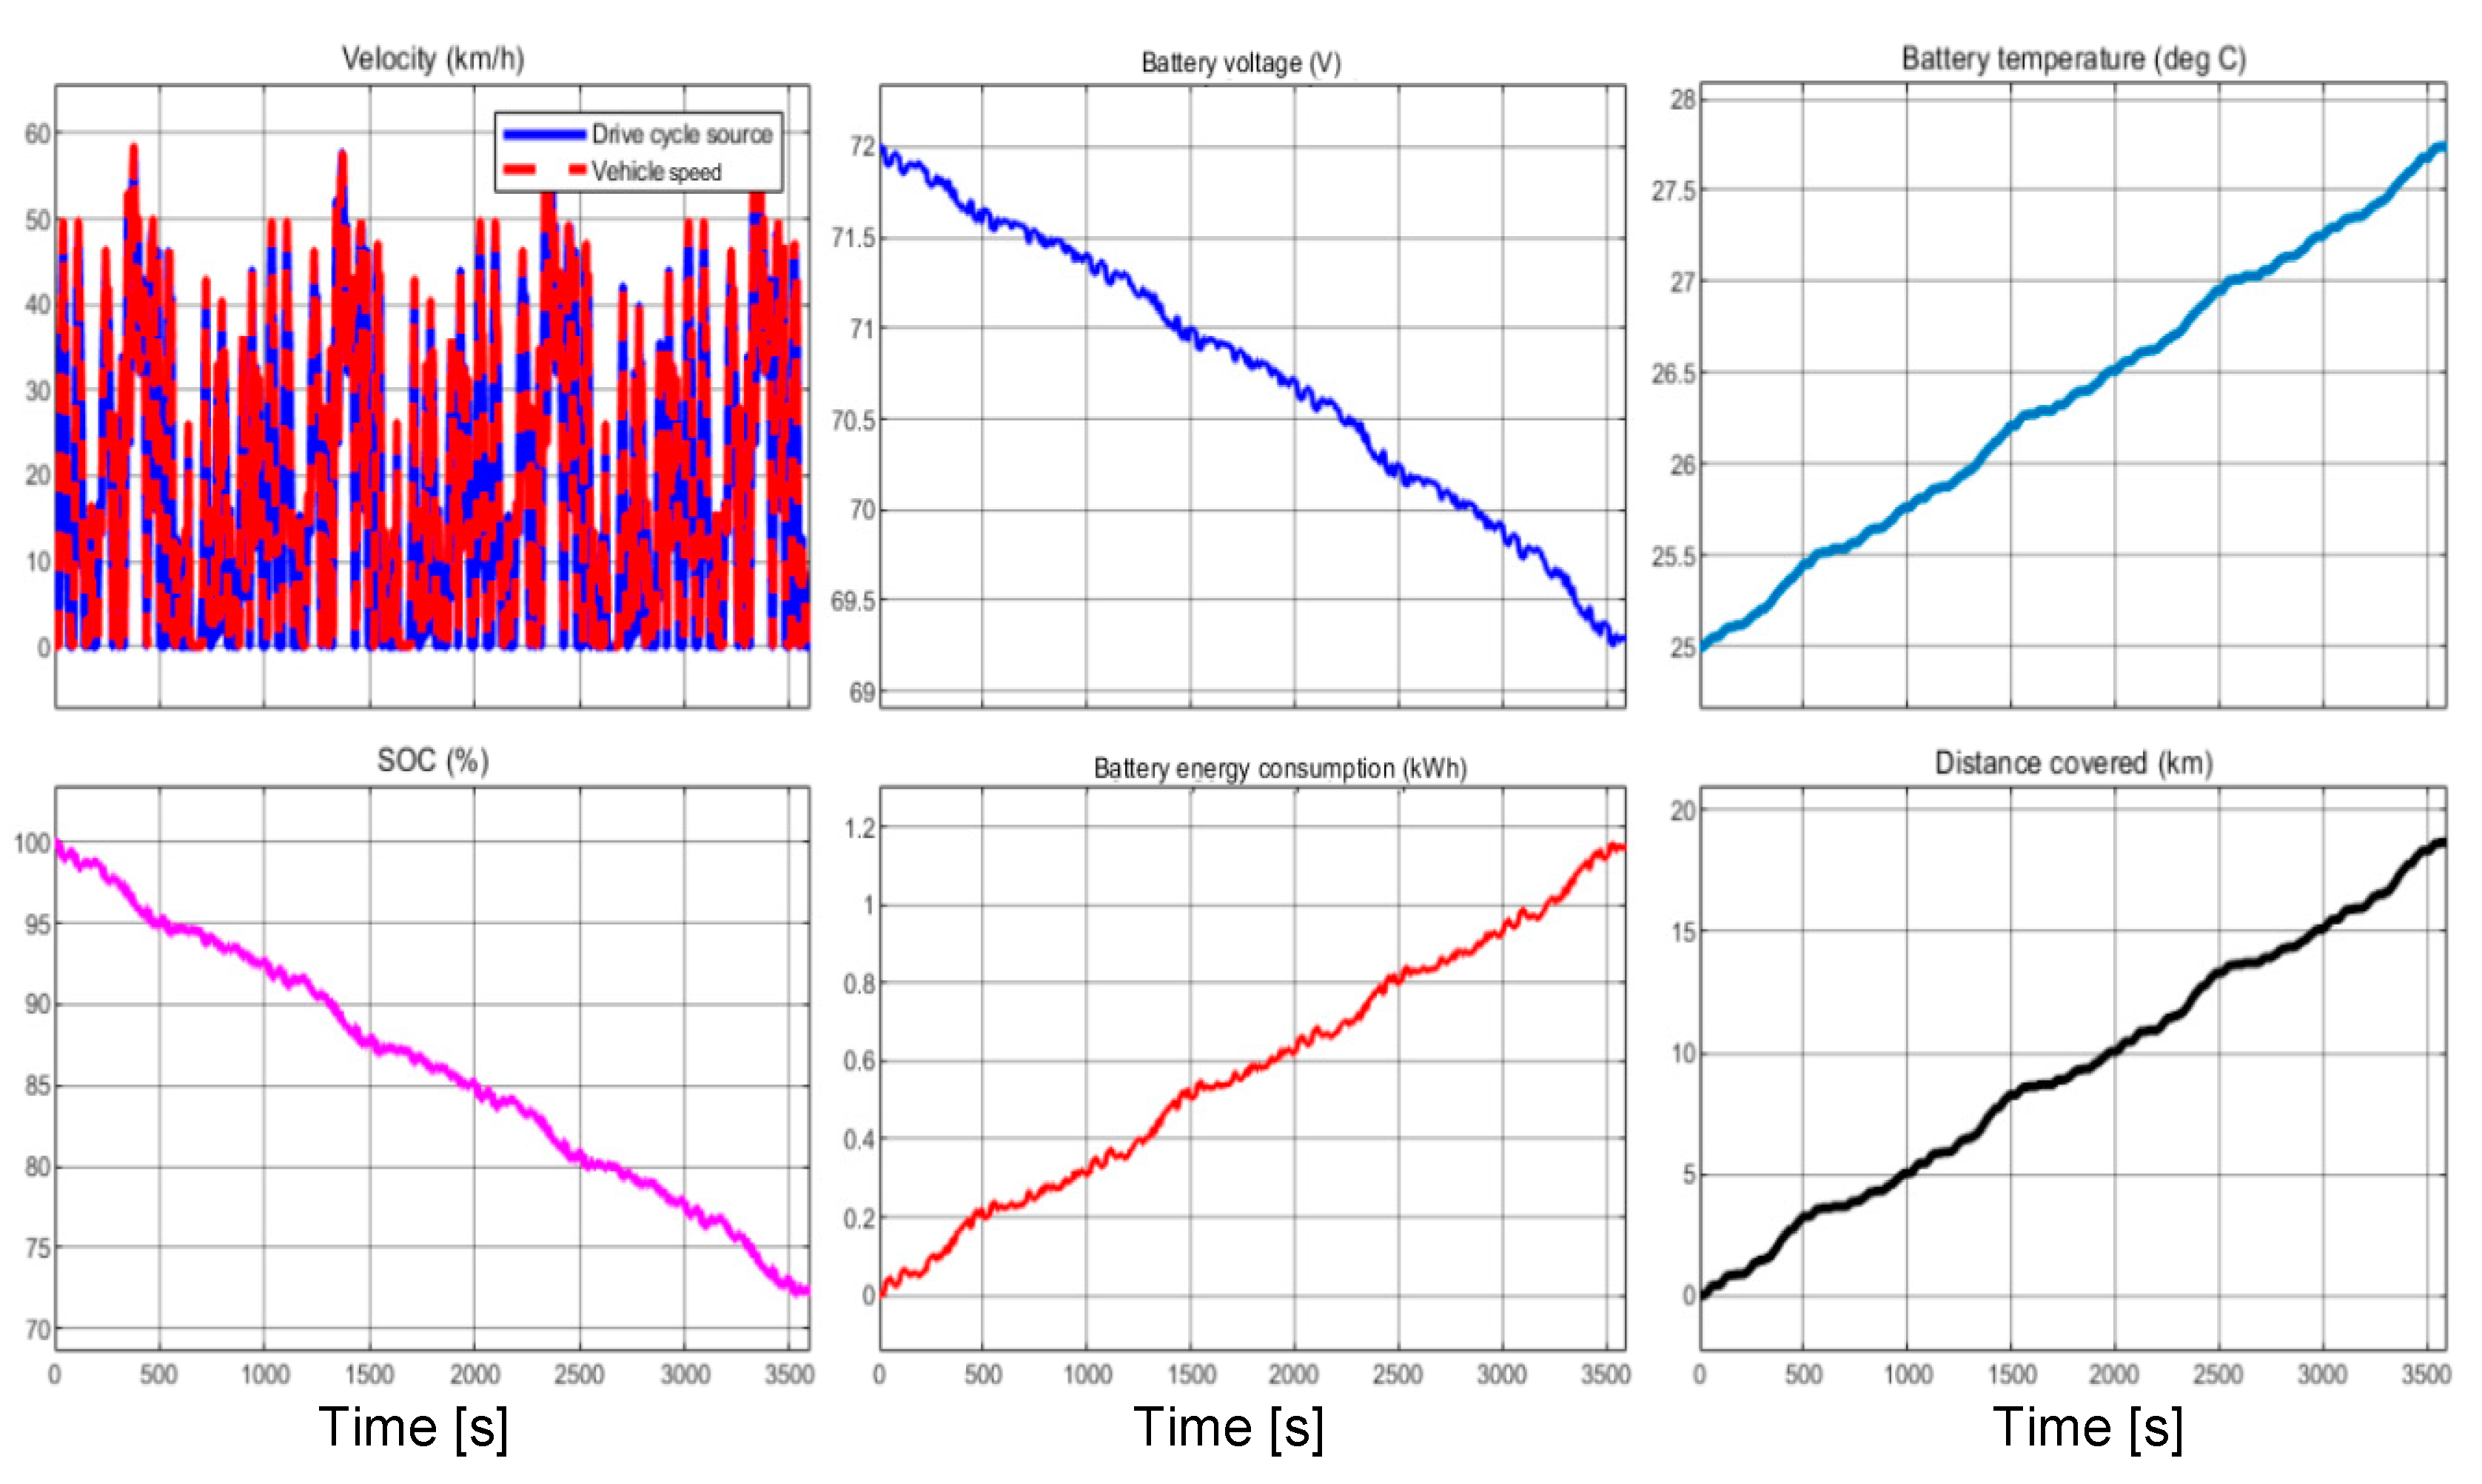
The two-wheeler EV drive train was simulated for 3600 s. For all the selected drive cycles, the drive cycle pattern was repeated cyclically to cover the base period of 3600 s. The initial battery temperature and initial SOC were considered at 25 °C and 100%, respectively, for all drive cycles. The vehicle velocity, the battery voltage variation, the battery temperature increase, SOC degradation, battery energy consumption, and the total distance covered were plotted to illustrate the battery performance with the selected drive cycles. The two-wheeler EV drive train model closely follows the speed traces of the selected drive cycles considered. Various user driving behaviours were modelled by the velocity-scaled drive cycles, as explained in the previous section. The battery performance was evaluated with various user driving behaviours on the selected drive cycles, which are illustrated in this section.
4.1. Two-Wheeler EV Battery Performance Evaluation with Standard Drive Cycles
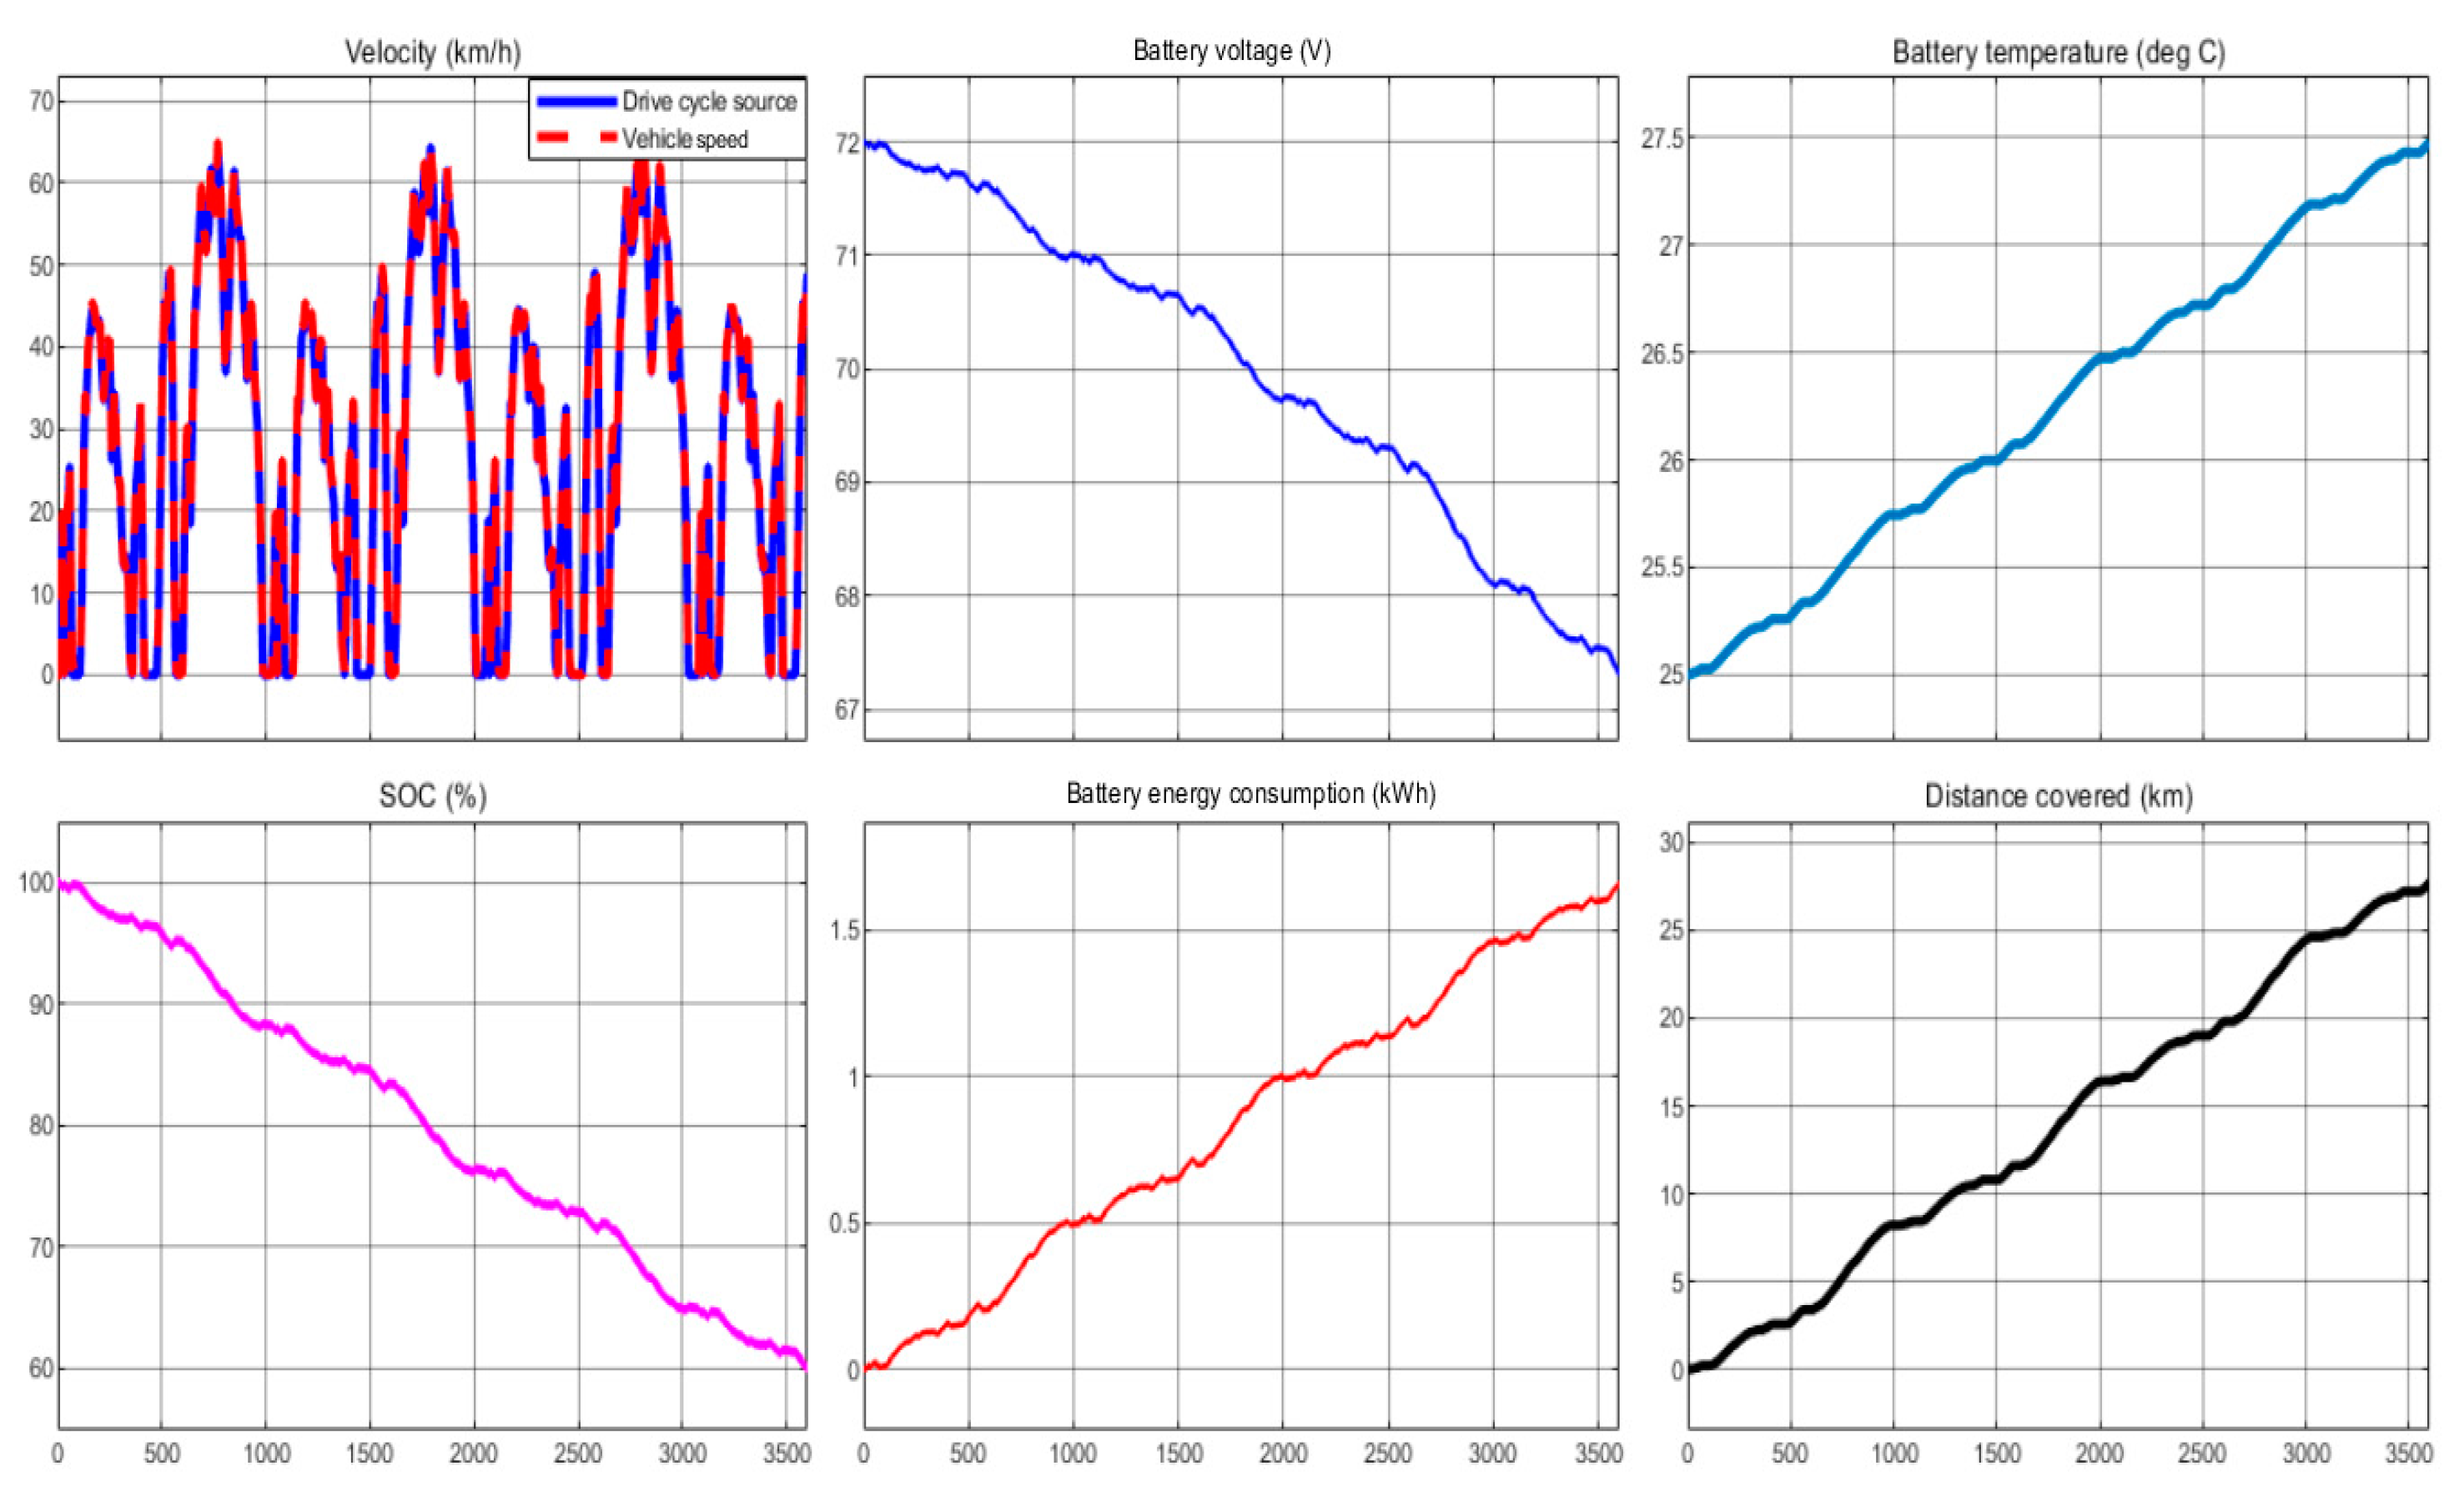
Figure 6 illustrates the validation of the two-wheeler drive train model with a WLTC class 1 drive cycle source and battery performance parameters. The actual vehicle velocity matches the drive train commands of the WLTC class 1 drive cycle source. The total distance covered was 27.7 km, and the battery energy consumption was 1.66 kWh for the WLTC class 1 drive cycle with the considered base period. The final SOC after travelling 27.7 km was 60%, with a rise in battery temperature of 2.48 °C.
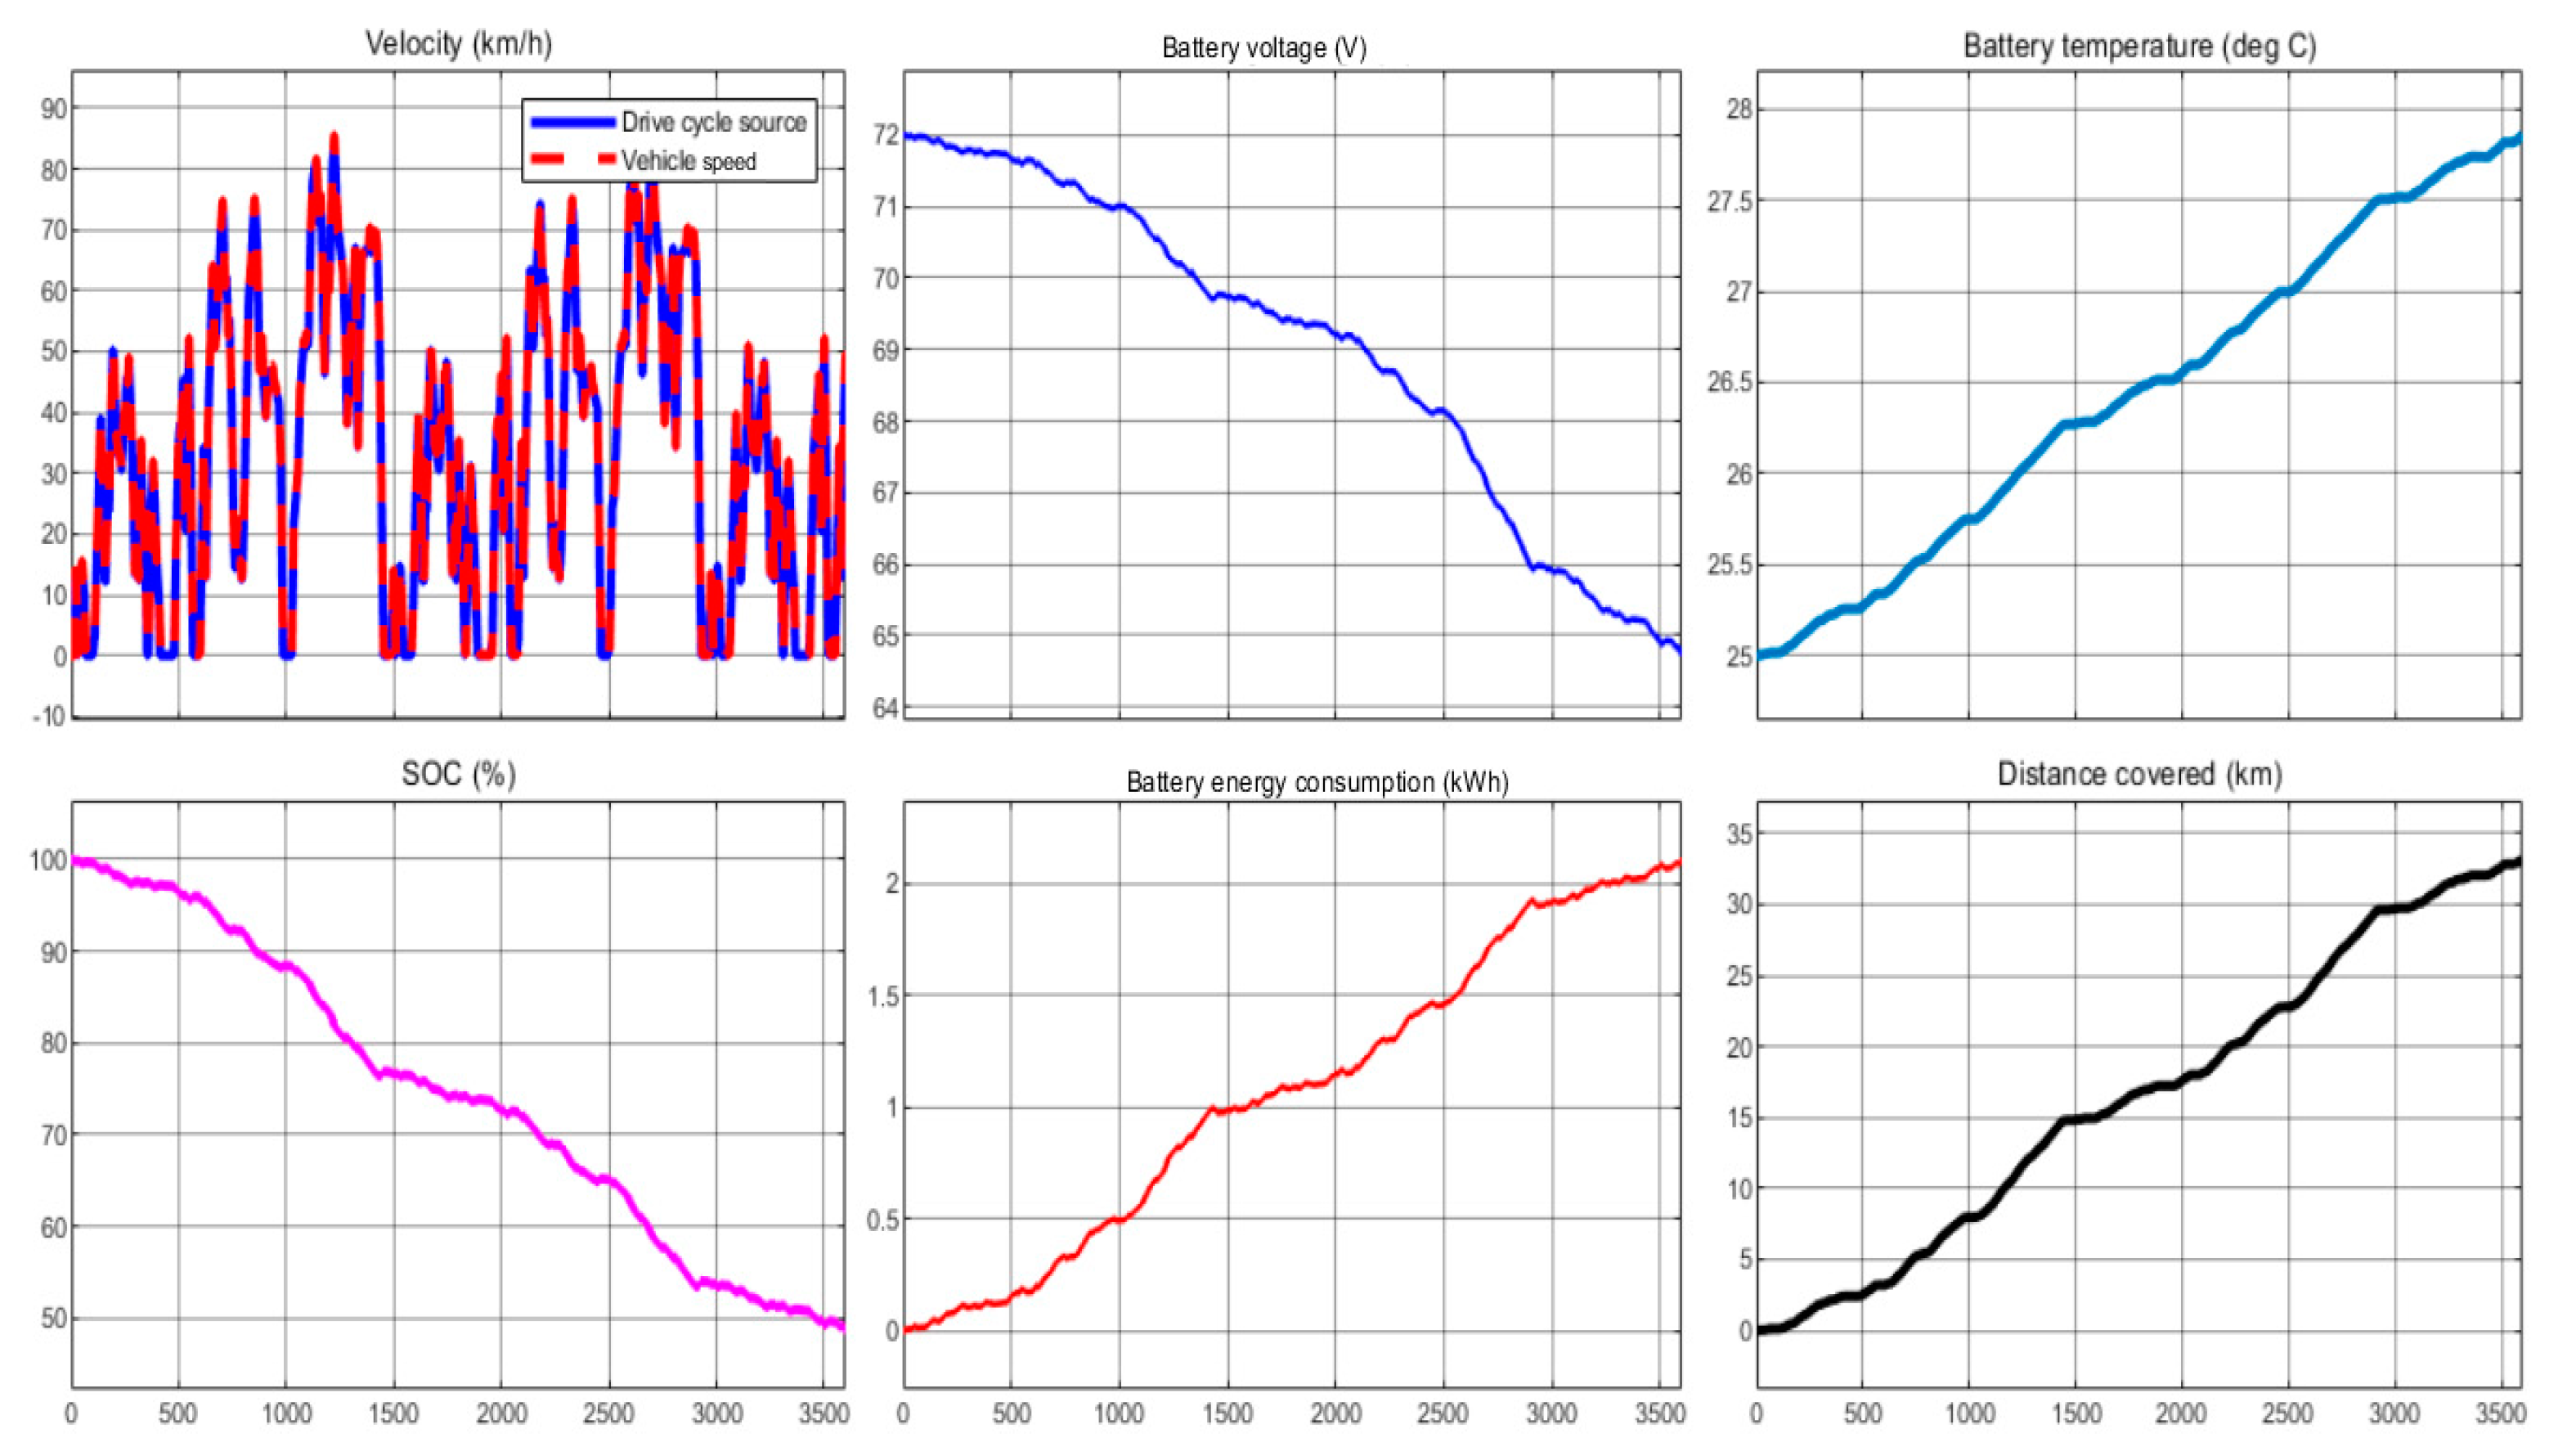
Figure 7 illustrates the validation of the actual vehicle velocity with the drive train commands and the battery performance parameters of the WLTC class 2 drive cycle source. The total distance covered was 33.17 km, and the battery energy consumption was 2.1 kWh for the WLTC class 2 drive cycle with the considered base period. The final SOC after travelling 33.17 km was 49%. The battery temperature rise was 2.86 °C. The average and maximum velocity in the WLTC class 2 cycles were higher than the WLTC class 1 drive cycle. This can be seen in the results by the increase in the distance travelled and other battery performance parameters of the WLTC class 2 drive cycle as compared to the WLTC class 1 drive cycle.
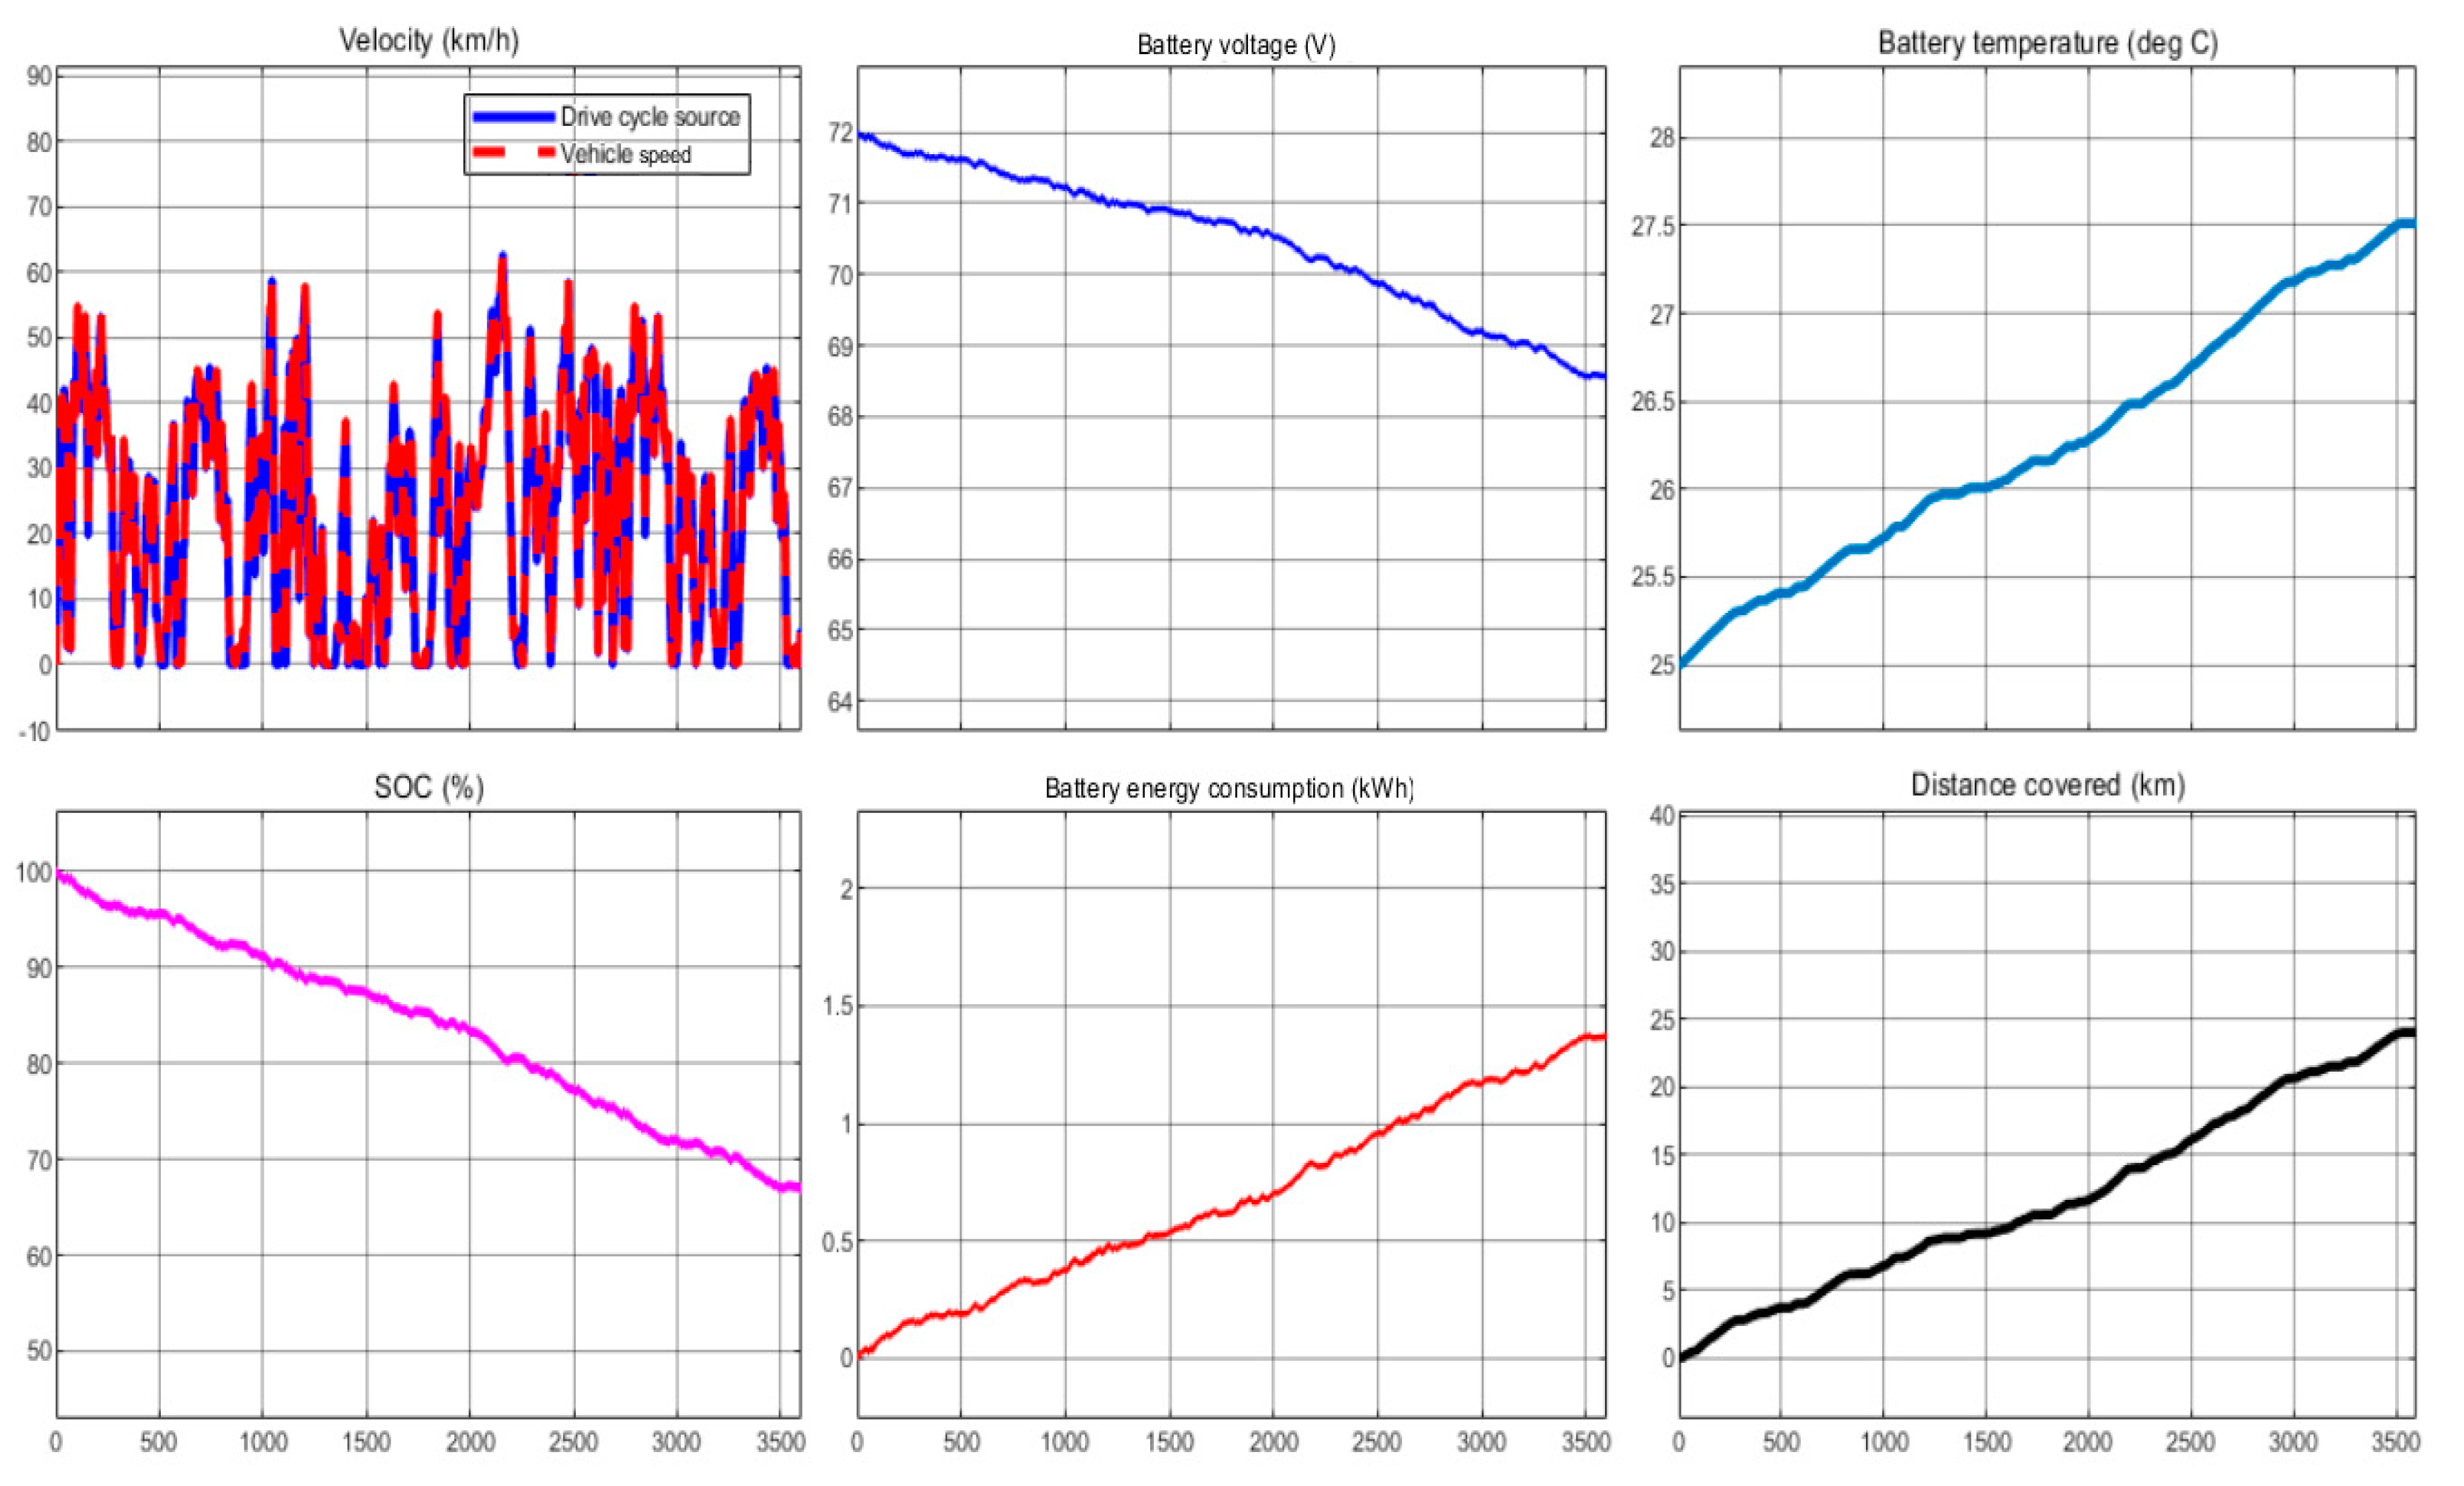
Figure 8 illustrates the validation of the two-wheeler drive train model with the Indian urban drive cycle and the battery performance parameters. The total distance covered was 24.07 km, and the battery energy consumption was 1.3 kWh for the IUDC with the considered base period. The final SOC after travelling 24.07 km was 68%. The battery temperature rise was 2.51 °C. The total distance covered, temperature rise, and battery energy consumption of IUDC remain almost closer to the WLTC class 1 cycle.
Figure 9 illustrates the validation of the two-wheeler drive train model with the Artemis urban drive cycle source and battery performance parameters. The total distance covered was 18.7 km, and the battery energy consumption was 1.15 kWh for the Artemis urban drive cycle with the considered base period. The final SOC after travelling 18.7 km was 72%. The battery temperature rise was 2.74 °C. Compared to the other three drive cycles, the Artemis urban drive cycle is characterised by a low average speed, which can be seen from the performance parameters of the battery. The temperature rise in WLTC class 2 and the Artemis urban drive cycle are close. However, in the same period, the Artemis drive cycle only covered 18.7 km as compared to the 33.2 km of the WLTC class 2 drive cycle. This is because the velocity of the Artemis urban drive cycle remained at its maximum for longer durations within the total time of 3600 s. This demanded continuous peak currents to be drawn from the battery for longer durations, increasing the battery temperature.
The battery performance parameters are presented in
Table 2 for the selected drive cycles. The battery energy consumption in Watt-hour per km remained higher for the WLTC class 2 drive cycle at 63.3 Wh/km and remained lower for the IUDC at 55.8 Wh/km. The difference in energy consumption among different drive cycles is due to the different velocity and acceleration levels. A drive cycle that represents smooth acceleration and deceleration forces and avoids long stop times will be able to use the battery optimally.
4.2. Two-Wheeler EV Battery Performance Evaluation with Various User Driving Behaviours
The two-wheeler EV battery performance was assessed with standard drive cycles in the previous section. This section considers the performance evaluation under various user driving behaviours for the selected drive cycles.
To model the various user driving behaviours, the modified drive cycles were created by scaling up and scaling down the velocity traces of standard drive cycles in the range of ±25%, ±10%, and ±5%. This categorised the user’s driving behaviour into slow (−25%, −10%, and −5%), moderate (+5% and +10%), and aggressive (+25%) driving modes for the standard drive cycle characteristics. This was essentially carried out to understand the battery performance parameters for various user driving behaviours using the developed two-wheeler EV drive train models. Based on these studies, the battery energy consumption, SOC degradation, and thermal behaviours were analysed concerning the average speeds in the different driving modes for the selected drive cycle patterns.
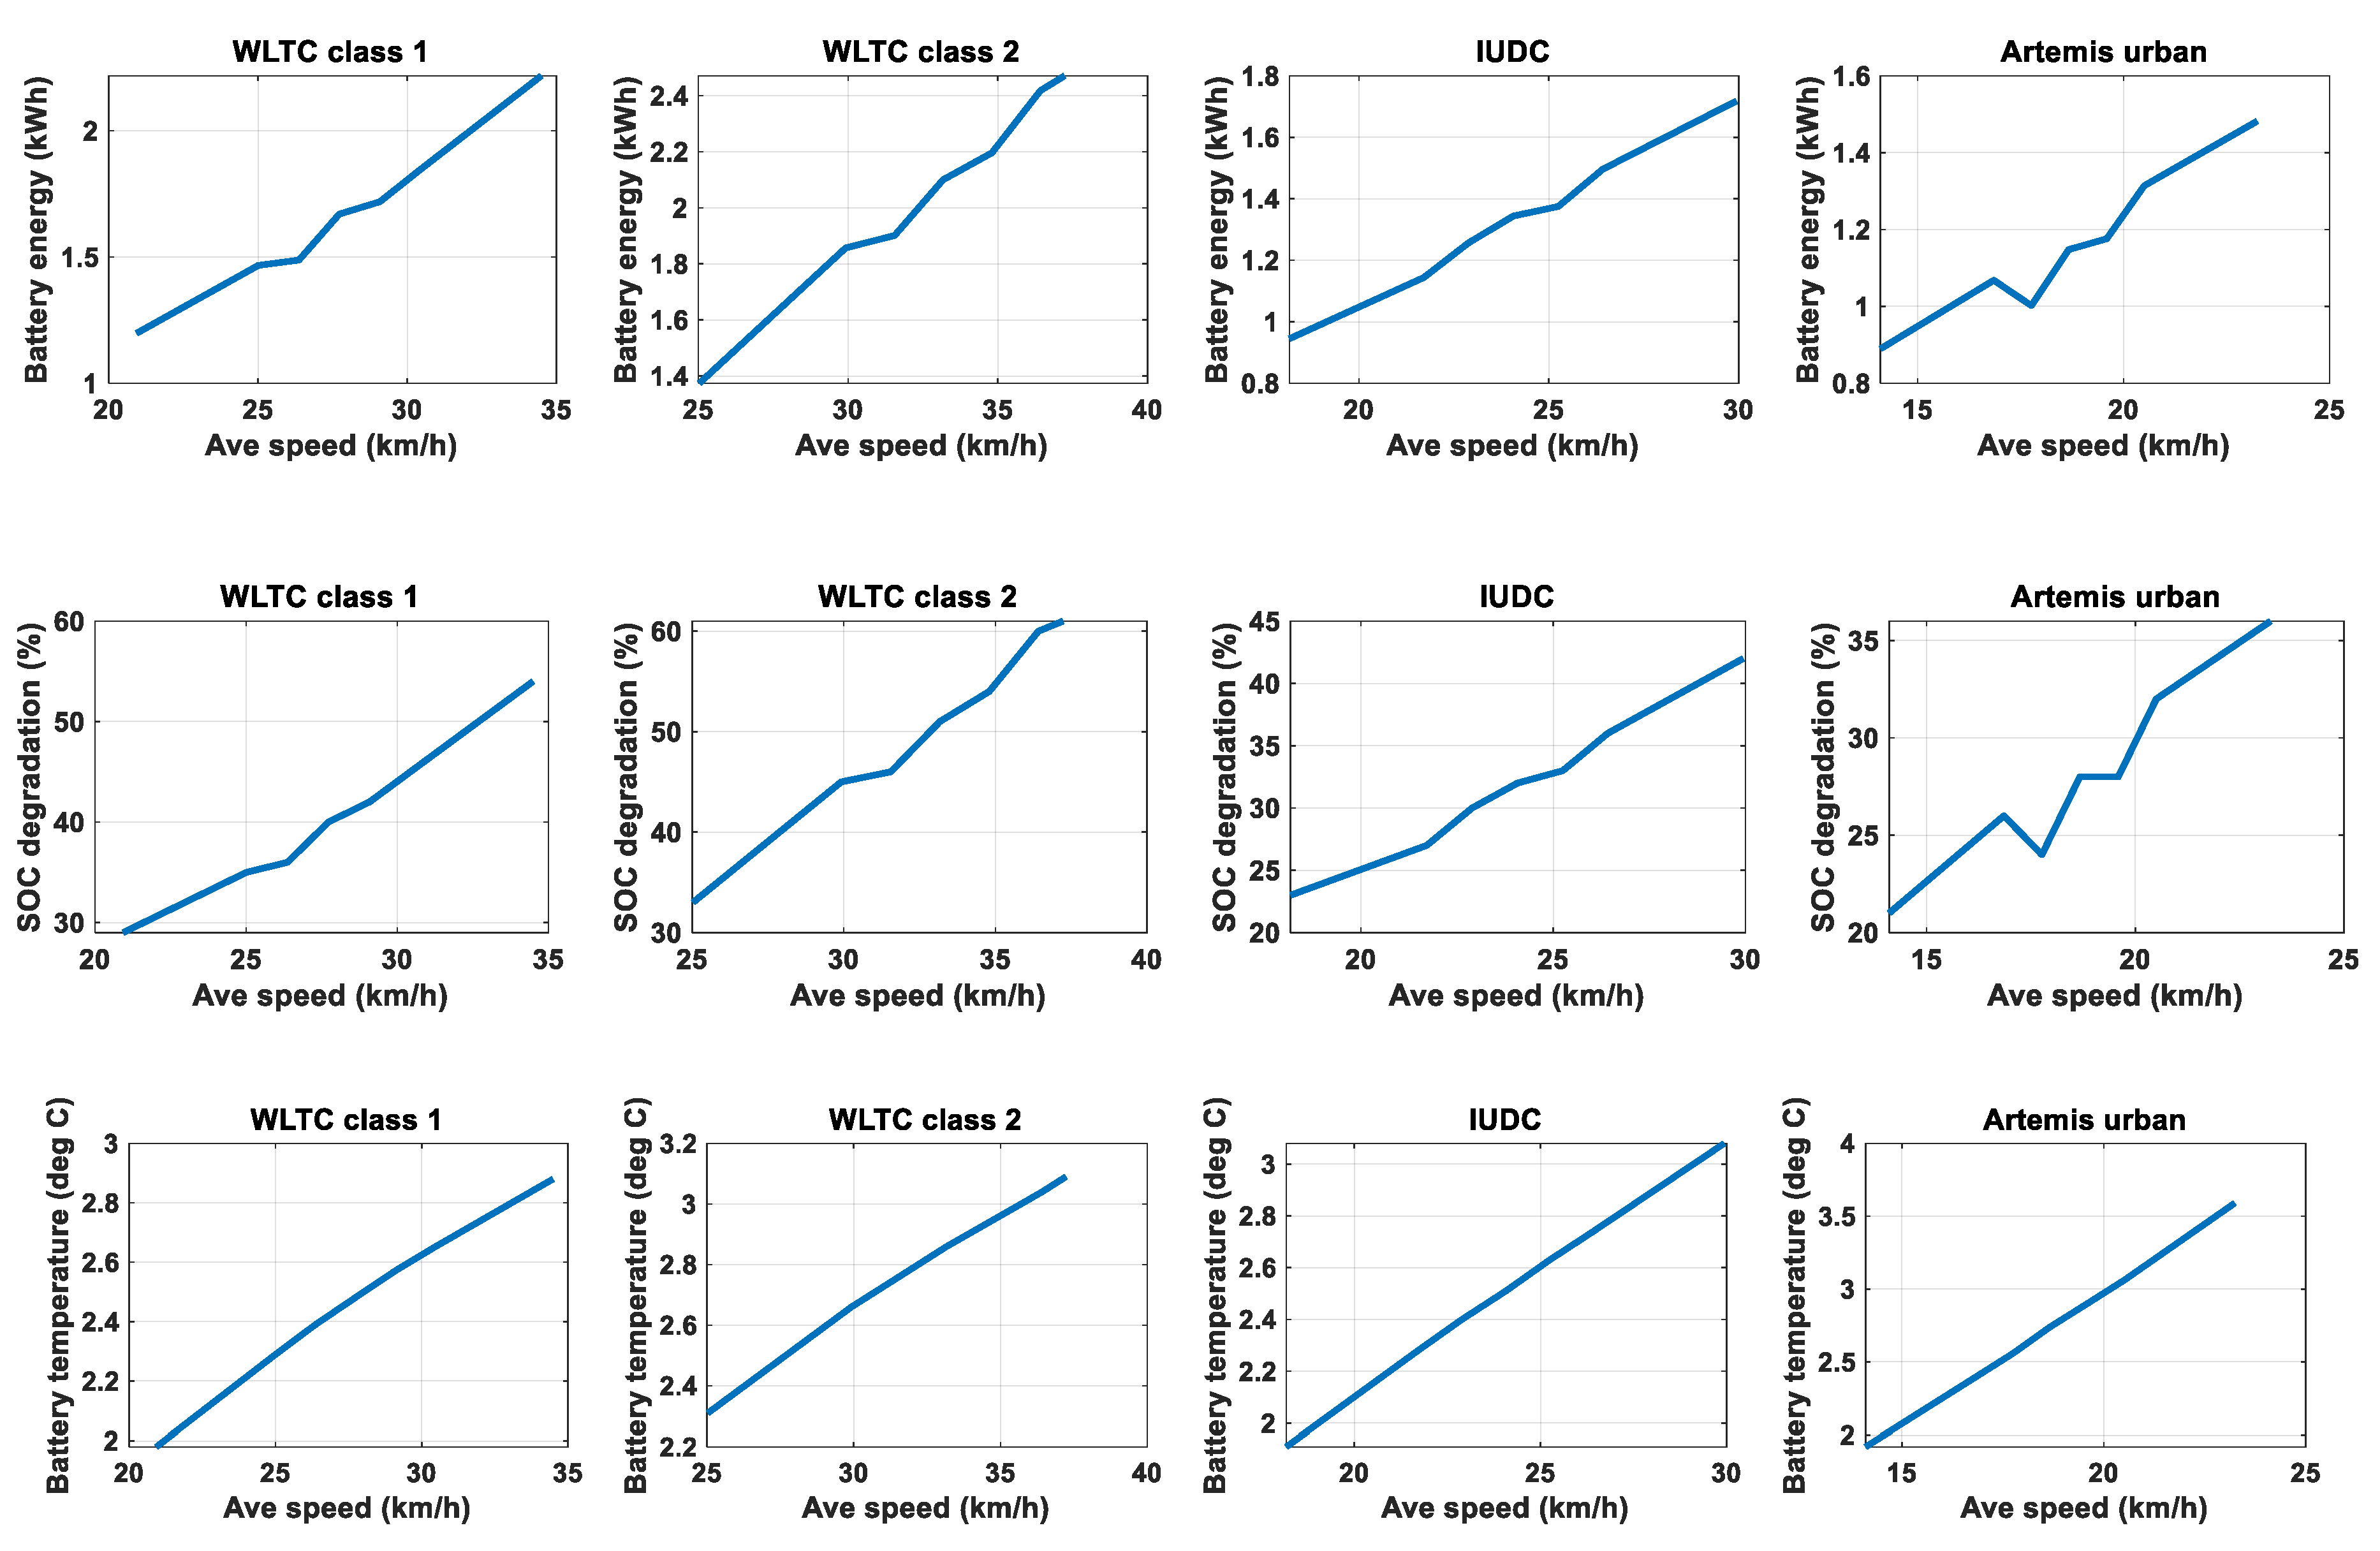
Figure 10 illustrates the battery energy consumption, SOC, and the battery temperature rise of the two-wheeler EV for the velocity-scaled drive cycles with the WLTC class 1, WLTC class 2, IUDC, and Artemis urban drive cycles against the average speed. From these plots, it was observed that the battery energy consumption and SOC degradation plots against the average speed followed the same pattern for all the selected drive cycles. However, the rate of change in energy consumption and the battery performance parameters varied for the selected drive cycles according to the drive cycle characteristics. It was also observed that battery energy consumption remained minimal for a particular average speed range in all the selected drive cycles. This can be considered the optimum average speed for each of the drive cycles, which would keep the battery energy consumption at a minimum.
In the WLTC class 1 drive cycle, the average speed range was between 25 km/h and 30 km/h; for the WLTC class 2 drive cycle, the average speed range was between 30 km/h and 34 km/h. For the IUDC, a speed range between 22 km/h and 26 km/h, and in the Artemis urban drive cycle, an average speed range between 17 km/h and 21 km/h was identified as the optimum speed range, where the rate of change in battery energy consumption is at a minimum value through this study. Below and above this optimum speed range, the battery energy consumption increases linearly for the slow and aggressive driving modes in all the selected drive cycles. A similar pattern was observed with the SOC percentage degradation as well. However, the battery temperature rise remained linear over the average speed range for all the selected drive cycles. The rate of change in temperature rise for the Artemis urban drive cycle remained higher at 0.18 °C/km. The rate of change in temperature rise for the IUDC was 0.11 °C/km. The WLTC class 1 drive cycle had a temperature rise of 0.066 °C/km, and the WLTC class 2 drive cycle had a temperature rise of 0.064 °C/km. The optimum speed range of the two-wheeler EV with the selected drive patterns can be expected to prolong the battery life by keeping energy consumption and battery degradation at a minimum.
4.3. Discussion and Comparison of the Energy Consumption Estimates
The conventional approaches may use different ways to model the individual components of the drive train, like the battery, electrical motor, and longitudinal driver models. While the basic approach to modelling the two-wheeler EV drive train remains the same, the fidelity and accuracy of the models may change depending on the individual component models. A rigorous investigation of the battery performance parameters with selected urban drive cycles is the main focus of this paper.
To confirm the performance of the proposed method and to validate the accuracy of the simulations, the results presented in this paper are compared with the reported work in [
34]. The baseline electrical consumption for an electric scooter with specifications of vehicle mass = 150 kg, battery capacity = 2.16 kWh, a drag coefficient of 0.6, frontal area of 1.25 m
2, and an accessory electrical load of 50 W for different drive cycles are reported in [
34]. With similar specifications, the results of the proposed work were evaluated, and the electrical consumption in Wh/km was compared. The results of the proposed work are in close agreement with the reference values of electrical consumption in Wh/km, which are presented in
Table 3.
5. Conclusions
A two-wheeler EV powertrain model was developed and simulated to assess the battery performance under the four selected drive cycles, namely the WLTC class 1, WLTC class 2, IUDC, and Artemis urban drive cycles. The battery performance parameters like the battery energy consumption, SOC degradation, and thermal behaviour of the two-wheeler EV battery pack were analysed for the selected drive cycles, representing the urban driving scenario of a two-wheeler EV. The analysis of the selected urban drive cycles reveals that the battery energy consumption and the SOC degradation can be correlated with the average velocity and the average current drawn from the battery, while the thermal behaviour is characterised by the time duration of the peak current drawn from the battery and the peak current magnitude. The amount of battery energy consumption for each kilometre of the two-wheeler EV was found to be 60.3 Wh/km for the WLTC class 1 cycle, 63.3 Wh/km for the WLTC class 2 cycle, 55.8 Wh/km for the IUDC, and 61.5 Wh/km for the Artemis urban drive cycles from the developed two-wheeler EV drive train model.
The impact of various user driving behaviours categorised as slow, moderate, and aggressive driving modes was evaluated using the modelled drive profiles with modified velocities on the battery performance. The impact of various user driving behaviours on battery energy consumption, SOC degradation, and temperature rise of the battery is quantified in this study. The battery energy consumption increases linearly in the slow and aggressive driving modes. An average speed range was identified where the rate of change in battery energy consumption is at a minimum for the selected drive cycles. This average speed range of the selected drive cycles can be considered the optimum speed range, which can help increase the lifetime performance of the batteries. The thermal characteristics are quantified by the rate of increase in the temperature rise for the selected drive cycle patterns concerning the variations in the average speed. Further studies will focus on analysing the health parameters of the two-wheeler EV battery pack and its usage behaviour. The results of the proposed model are validated by comparing them against the reference values reported in previous works.
The limitations of the present work reported in this paper include braking models and strategies for recovering braking energy, which will be considered in future works.


