Article

Data Acquisition and Performance Analysis during Real-Time Driving of a Two-Wheeler Electric Vehicle—A Case Study

by
Divyakumar Bhavsar
1,
Ramesh Kaipakam Jaychandra
2 and
Mayank Mittal
1,*
1
Indian Institute of Technology Madras, Chennai 600036, India
2
Dewetron GmbH, Chennai 600096, India
*
Author to whom correspondence should be addressed.
World Electr. Veh. J. 2024, 15(3), 121; https://doi.org/10.3390/wevj15030121
Submission received: 13 February 2024 / Revised: 8 March 2024 / Accepted: 18 March 2024 / Published: 21 March 2024

Abstract

:
Data acquisition from a vehicle operating in real driving conditions is extremely useful for analyzing the real-time behavior of the vehicle and its components. A few studies have measured the real-time data for a four-wheeler electric vehicle. However, no attempts have been reported to measure the real-time data and find the inverter efficiency for a two-wheeler electric vehicle. The present work has accomplished successful real-time data acquisition from a two-wheeler electric vehicle. The real-time current and voltage coming in and going out from the inverter, frequency of the motor operation, power factor, distance covered, and velocity have been measured. The inverter efficiency is found to be over 95% for over 80% of the total drive time, and the power factor for the motor is over 0.8 for almost 50% of the total drive time. A few insights on driver behavior and finally the torque-speed characteristics and two quadrant operation of the motor are discussed.

1. Introduction

Worldwide transportation mainly runs on internal combustion engine (ICE)-based vehicles. ICE-based vehicles gained massive popularity in the past few decades because of the availability of the fuel being used to run them, large-scale manufacturing of engines, and global industrialization. This class of vehicles underwent a considerable paradigm shift in technology concerning their power output, efficiency, and, most importantly, their emissions. Despite several advances in the technology of ICE-based vehicles, fuel economy, type of fuel, and engine emissions pose a conundrum to advance towards the saturation in their technology. One among many such developments is the use of alternate fuels. Bae and Kim (2017) [1] gave a detailed review of alternate fuels for IC engines by giving an explanation of compressed natural gas (CNG), liquefied petroleum gas, hydrogen, methanol, and ethanol for spark ignition (SI) engines, and biodiesel, di-methyl ether for compression ignition (CI) engines. The use of CNG and biogas in engines for transit buses was reviewed in technical and operational aspects [2], where the use is justified by the reduction of NOx and CO2 emissions by using such fuels. Green ammonia broadens the scope of alternate fuels, particularly for CI engines. A detailed review of using green ammonia along with secondary fuels such as dimethyl ether, diesel, and kerosene was performed in [3], where the effect of the higher auto-ignition temperature of ammonia brings a challenge to its acceptance. Still, it could be overcome using advanced injection strategies, hydrogen addition, etc.
Due to tighter emission norms, the technology in small SI engines witnessed a transition to using a port fuel injection technique instead of a conventional carburetor. Besides the PFI technique, direct injection (DI) for gasoline engines (SI engines) is also gaining momentum, where the fuel is injected directly into the combustion chamber. The reviews performed in [4,5] provide a comprehensive explanation of the applicability of DI for gasoline engines. Taking a step further into this technology, Jose et al. (2021) [6] developed a small-bore gasoline DI engine and attempted to enhance its performance using multiple injection strategies. Further, they performed CFD simulations and experiments to study the influence of the number of injections per cycle and their timings on combustion characteristics and emissions. They found enhancement in the engine performance by using multiple-injection strategies, observed as the enhancement in combustion rate and lowering of in-cylinder temperatures. Gasoline CI technology is also gaining popularity in research, as it brings high thermal efficiency like the diesel engine. It simultaneously brings ease to control the particulate matter (PM) and NOx emissions. This technology auto-ignites the gasoline fuel (which is difficult to auto-ignite) using appropriate injection strategies [7]. The authors in [8] used gasoline CI technology in a single-cylinder diesel engine and observed reduced soot emissions. However, the proportion of carbon monoxide (CO) and unburnt hydrocarbon (HC) in the exhaust increased. Particularly for CI engines, dual fuel combustion and low-temperature combustion (LTC) are promising technologies as they help to reduce NOx and soot emissions simultaneously. A critical review to evaluate various LTC strategies for diesel fuel was performed in [9], and experiments to study LTC for a diesel engine were performed and discussed in [10,11]. Despite the above-discussed technological advances, IC engine-based vehicles are still being improvised to arrive at the best outcomes.
This motivates the technological world to shift to the next class of vehicles, which emerged as a step to curb emissions; these are hybrid electric vehicles (HEVs). When designed and controlled properly, these vehicles provide efficient operation and optimum performance of the multiple sources used in the powertrain. Usually, the vehicles use a battery in conjunction with an engine; a controller unit decides the power split between these two sources and performs the energy management. The energy management of an HEV is a predicament for most HEV manufacturers. Several classes of strategies could perform energy management, like rule-based and optimization-based strategies, the latter being expensive in terms of computational time and cost, hence finding fewer applications in real-time HEVs. Rule-based strategies bring a lower computational time and cost along with their simple algorithms but demand a certain level of expertise to be designed and deployed. Thermostat control strategy (TCS) and power follower control strategy (PFCS) are two simple and common rule-based strategies. The work done in [12] resulted in the development of an adaptive hybrid thermostat control strategy for series HEVs, which has the advantages of both a TCS and PFCS. It showed better battery life and resulted in better battery and engine performance. The authors in [13] specifically designed two rule-based control strategies for a two-wheeler HEV, where the motive was to understand the level of abuse one source undergoes if the control strategy, by its nature, pays little attention to its performance. The authors developed energy management at different HEV levels in [14] using a metaheuristics approach for a rule-based strategy where two sources, one with high specific energy and another with high specific power, were controlled for the effective use of the sources. The optimization-based strategies are complex and time-consuming. However, they are effective in optimizing the problem within the defined constraints. The authors in [15] developed a real-time energy management strategy, which does not need prior driving cycle information and optimizes the operation such that both the sources are effectively used, and the overall energy consumption is kept minimum. Despite several advantages of HEVs over ICE-based vehicles, the major drawback of developing a two-wheeler HEV is that the compact arrangement of all the components is complicated.
This attracts the demand for electric vehicles, which has seen a considerable rise in the past couple of years and is expected to grow rapidly through the next few decades. Though electric vehicles eliminate greenhouse gas emissions (provided that the electricity is generated using renewable sources) and are better in terms of efficiency when compared to IC engine-based vehicles, they have yet to reach the stage of saturation in terms of achieving the highest efficiency of individual components, and eventually the overall powertrain. The technology for electric vehicles is not yet completely matured and needs to focus on research and development in multiple areas. One such area is the controlled operation of an electric vehicle at a particular operating point where the energy consumption is optimal, the operating temperature is acceptable, and the overall operation is safe, which demands a real-time performance analysis of the vehicle’s behavior.
Numerous studies have been carried out on the individual components of an electric vehicle, both in simulation and in experiment. A model to estimate the energy consumption of an EV was developed in [16,17,18] and validated using readily available real-time data of a four-wheeler EV. The authors in [16] used the readily available real-time data from a Nissan Leaf four-wheeler EV. They used it to understand the effect of ambient temperature on energy consumption through a quasi-backward looking simulation model. The same data was used in [17] for a similar model development where the authors brought new insights on regenerative energy efficiency over different drive cycles. Yang et al. (2014) [19] developed an energy estimation model to study the influence of road gradient on vehicle performance. Similarly, many other studies have been successful in analyzing the performance of electric vehicles by simulation or by performing experiments in a static environment. However, very little work has been done to investigate the performance of electric vehicles in real-time along with dynamic conditions like road gradient and load due to variable traffic. Kolachalama et al. (2023) [20] developed an interpretation of the thermal operating point of an electric vehicle using the real-time recorded data of the battery, motor, and inverter temperatures. They then used the same data in [21] to train a neural network model that can predict the thermal operating point in real-time to control the temperatures of the battery, motor, and inverter in their corresponding favorable range. They analyzed the data and the performance using simple statistical tools like minimum, maximum and mean values of the recorded data. Wu et al. (2015) [22] collected real-time vehicle data from a four-wheeler for about five months and found some interesting insights related to driver behavior in the context of road traffic and energy consumption; they also developed a power estimation model and compared the simulation results with the one recorded in real-time. The real-time effects of ambient temperature and velocity on the energy consumption of a four-wheeler EV were analyzed in [23] by driving the vehicle in the metropolitan regions of the UK, and using driving distance and stop time percentage as key parameters they concluded that the specific energy consumption got higher at lower temperatures. Similar work in [24] studied the effect of temperature on the energy consumption of an EV. This was carried out on a massive scale by deploying a fleet consisting of twenty-four different EVs. The innovation of utilizing real-time recorded data to control the cabin heating by various rule-based, fuzzy logic, and optimization-based strategies was presented by the authors of [25], where they recorded real-time data from a BMW four-wheeler EV and used that data to parameterize the models for strategies and later validate the model results. The medium- and heavy-duty vehicles powered by battery were brought under performance evaluation by performing experiments and acquiring real-time data on a vehicle chassis dynamometer [26] under a static environment. The vehicle was subjected to a variety of heavy-duty drive cycles, and the energy consumption was compared to conventional heavy-duty diesel vehicles, where they found better energy consumption for battery-powered vehicles. A similar study for electric buses was performed in [27]. Such performance analysis is crucial for the future development of vehicles, showing energy efficiency and safe operation. The calculation of inverter efficiency is not a new task to be performed; the studies conducted in [28,29] used a conventional power loss modeling approach to calculate inverter efficiency, which is cumbersome and needs several other electrical parameters as inputs. Realizing this gap in the complex modeling of inverters, the authors of [30] laid down a simple approach to calculate the efficiency of the inverter by measuring the required parameters on a static test bench designed to equip an electric powertrain and concluded their study by claiming this method as being beneficial for the ease of developing such components. However, their study lacked the useful effects of testing a dynamic environment on a real-time system, which motivated the authors of the present work to look for potential gaps, where dynamic real-time testing of two-wheeler electric vehicles, along with the calculation of corresponding inverter efficiency, remains unexplored. Additionally, the discussed literature highlights the importance of real-time data acquisition for energy estimation and other applications for individual components like inverters, which highlights the importance of developing a simple approach to finding out the inverter’s efficiency.
Hence, the literature review concludes as follows: all the above-discussed work, and a few others, were performed using the real-time data acquisition of four-wheeler electric vehicles. Real-time data acquisition for a two-wheeler electric vehicle in a dynamic environment, and using that data to calculate inverter efficiency, has not been reported in the literature to date. Hence, it is necessary to perform a similar study for a two-wheeler electric vehicle and analyze its performance.
This study mainly focuses on developing a real-time data acquisition setup on a two-wheeler electric vehicle with the help of the data acquisition system (DEWE3-A4) provided by Dewetron GmbH. The present work successfully mounted the data acquisition system on a two-wheeler electric vehicle; electrical tapings were made at the output of the battery, which goes as the DC input to the inverter, and similar tapings were made for the three-phase output of the inverter, which goes as the AC input to the motor. These tapings, along with current and voltage clamps, were used to record the current and voltage data, along with the frequency and power factor. Through CAN bus data, these data are recorded in the system. The GPS sensor helps to record distance, velocity, latitude, and longitude. The above-recorded data is then successfully used to calculate the inverter efficiency using a non-conventional approach. Finally, the battery and motor output are analyzed, and the two-quadrant operation of the motor is discussed.
Section 2 describes the specifications and methodology adopted to acquire the real-time data and the method to calculate different quantities. Section 3 discusses the recorded results and plots along with their statistical aspects, followed by Section 4, which is the conclusion and future scope.

2. Methodology

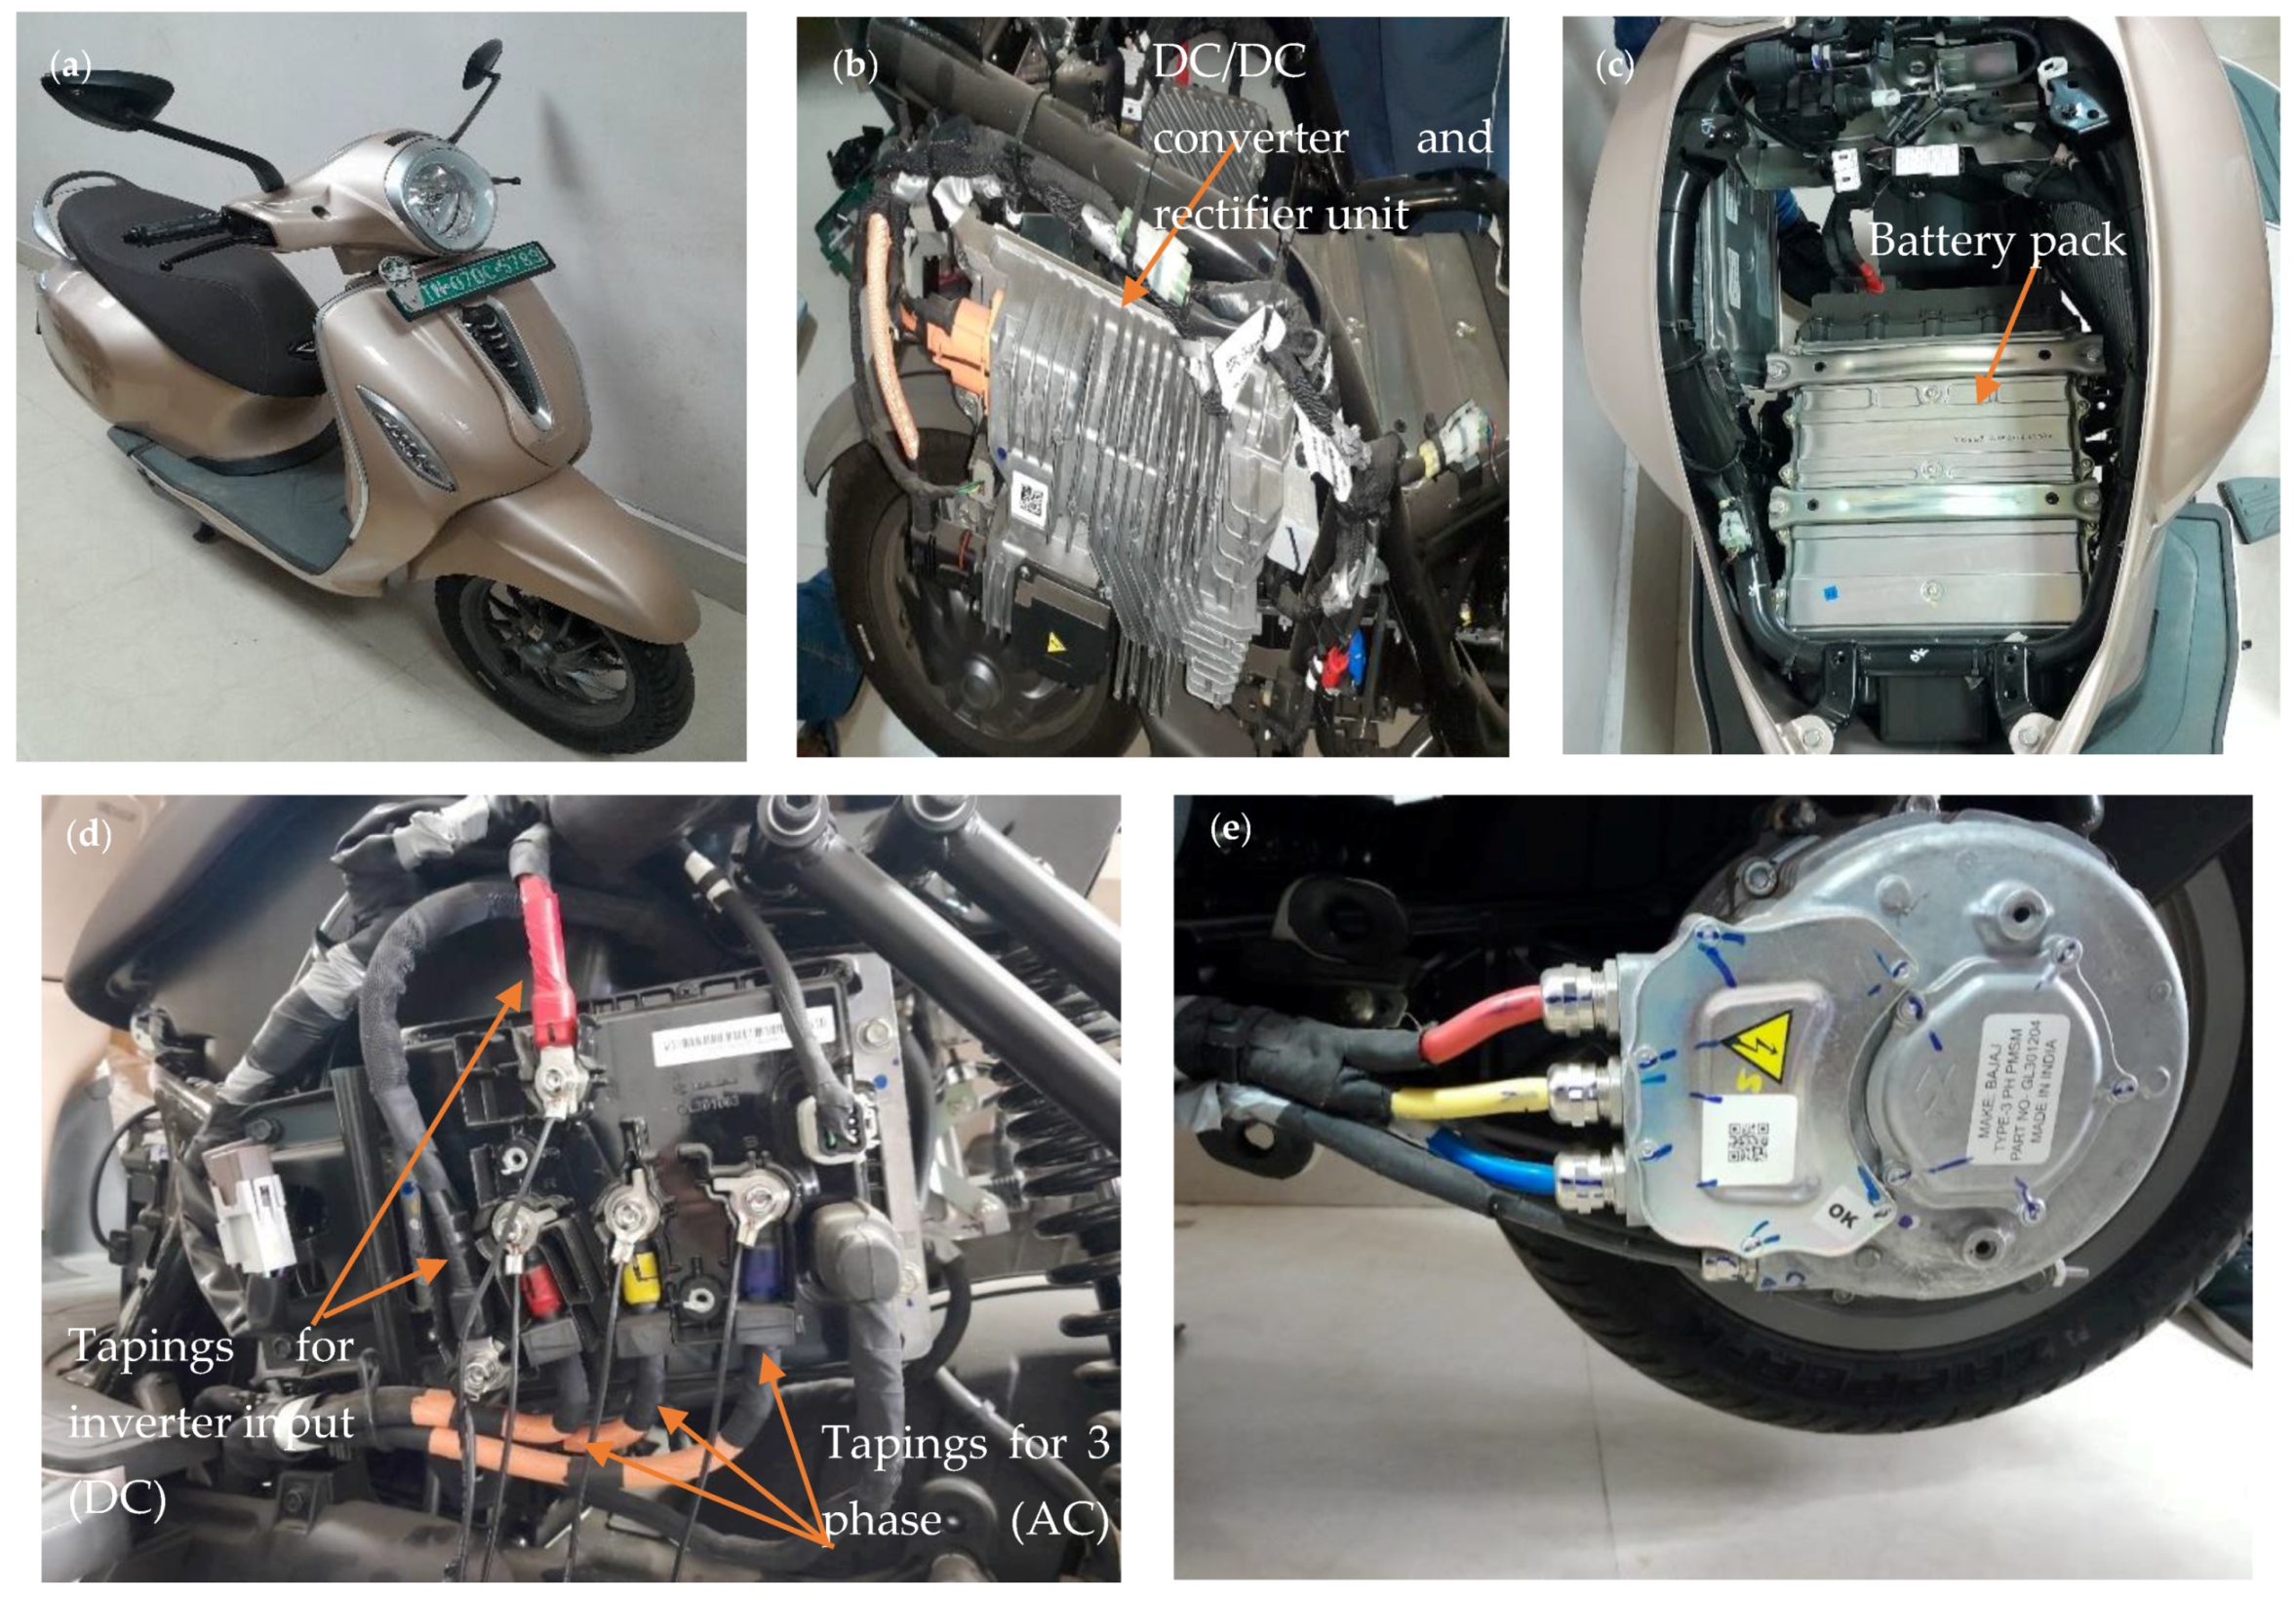
2.1. Specifications of the Electric Vehicle

The vehicle used for this work was a two-wheeler electric vehicle, the specifications of which are mentioned in Table 1. Figure 1a shows the image of the vehicle used for this study. Electric vehicle architecture mainly consists of four units. The first unit is the DC/DC converter and the rectifier unit. The purpose of this unit is to convert the AC input coming from the supply while charging to a DC output, which is then modulated; either a step-up or step-down of voltage happens based on the battery voltage specification. For the present case, this unit converts the AC charging supply (230 V) to a DC output and then steps down the voltage to around 50 V for the input to the battery pack. Figure 1b shows the image of this unit inside the vehicle. It can be observed that the converter and rectifier unit have fins mounted on their outer surface. The purpose of these fins is to provide faster convective heat transfer and dissipate the heat generated during the charging process to the surroundings. Figure 1c shows the top view of the battery pack, which is situated under the seat of the vehicle; the battery pack is sealed for protection along with its battery management system; specifications of the same are mentioned in Table 1. The battery pack is supported by a small fan to provide air cooling during the operation, but such cooling does not stand equal to liquid cooling.
The next and most important unit is the inverter and motor control unit; it is essential because the inverter used in electric vehicles is mostly a three-phase inverter. After all, almost all electric vehicles now use three-phase AC motors for traction. Such inverters come along with six switches, which are essential for its operation; this brings along two loss components, which are switching losses and conduction losses. These losses significantly impact the performance of the inverter and, eventually, the performance of the vehicle. Hence, the inverter efficiency must be found for the operation of any electric vehicle. The method to determine the inverter efficiency is discussed in the subsequent section. Figure 1d shows the inverter and motor control unit for the present vehicle under study. The tapings for single-phase (DC) input to the inverter and three-phase (AC) output from the inverter are highlighted in the image. These tapings help measure the real-time current and voltage using the data acquisition system discussed in the subsequent section. The final unit is the motor, which provides the traction to the vehicle; for the present vehicle under study, the motor used is a three-phase permanent magnet synchronous motor (PMSM). Figure 1e shows the image of the motor used in the vehicle along with its three-phase input coming from the inverter.

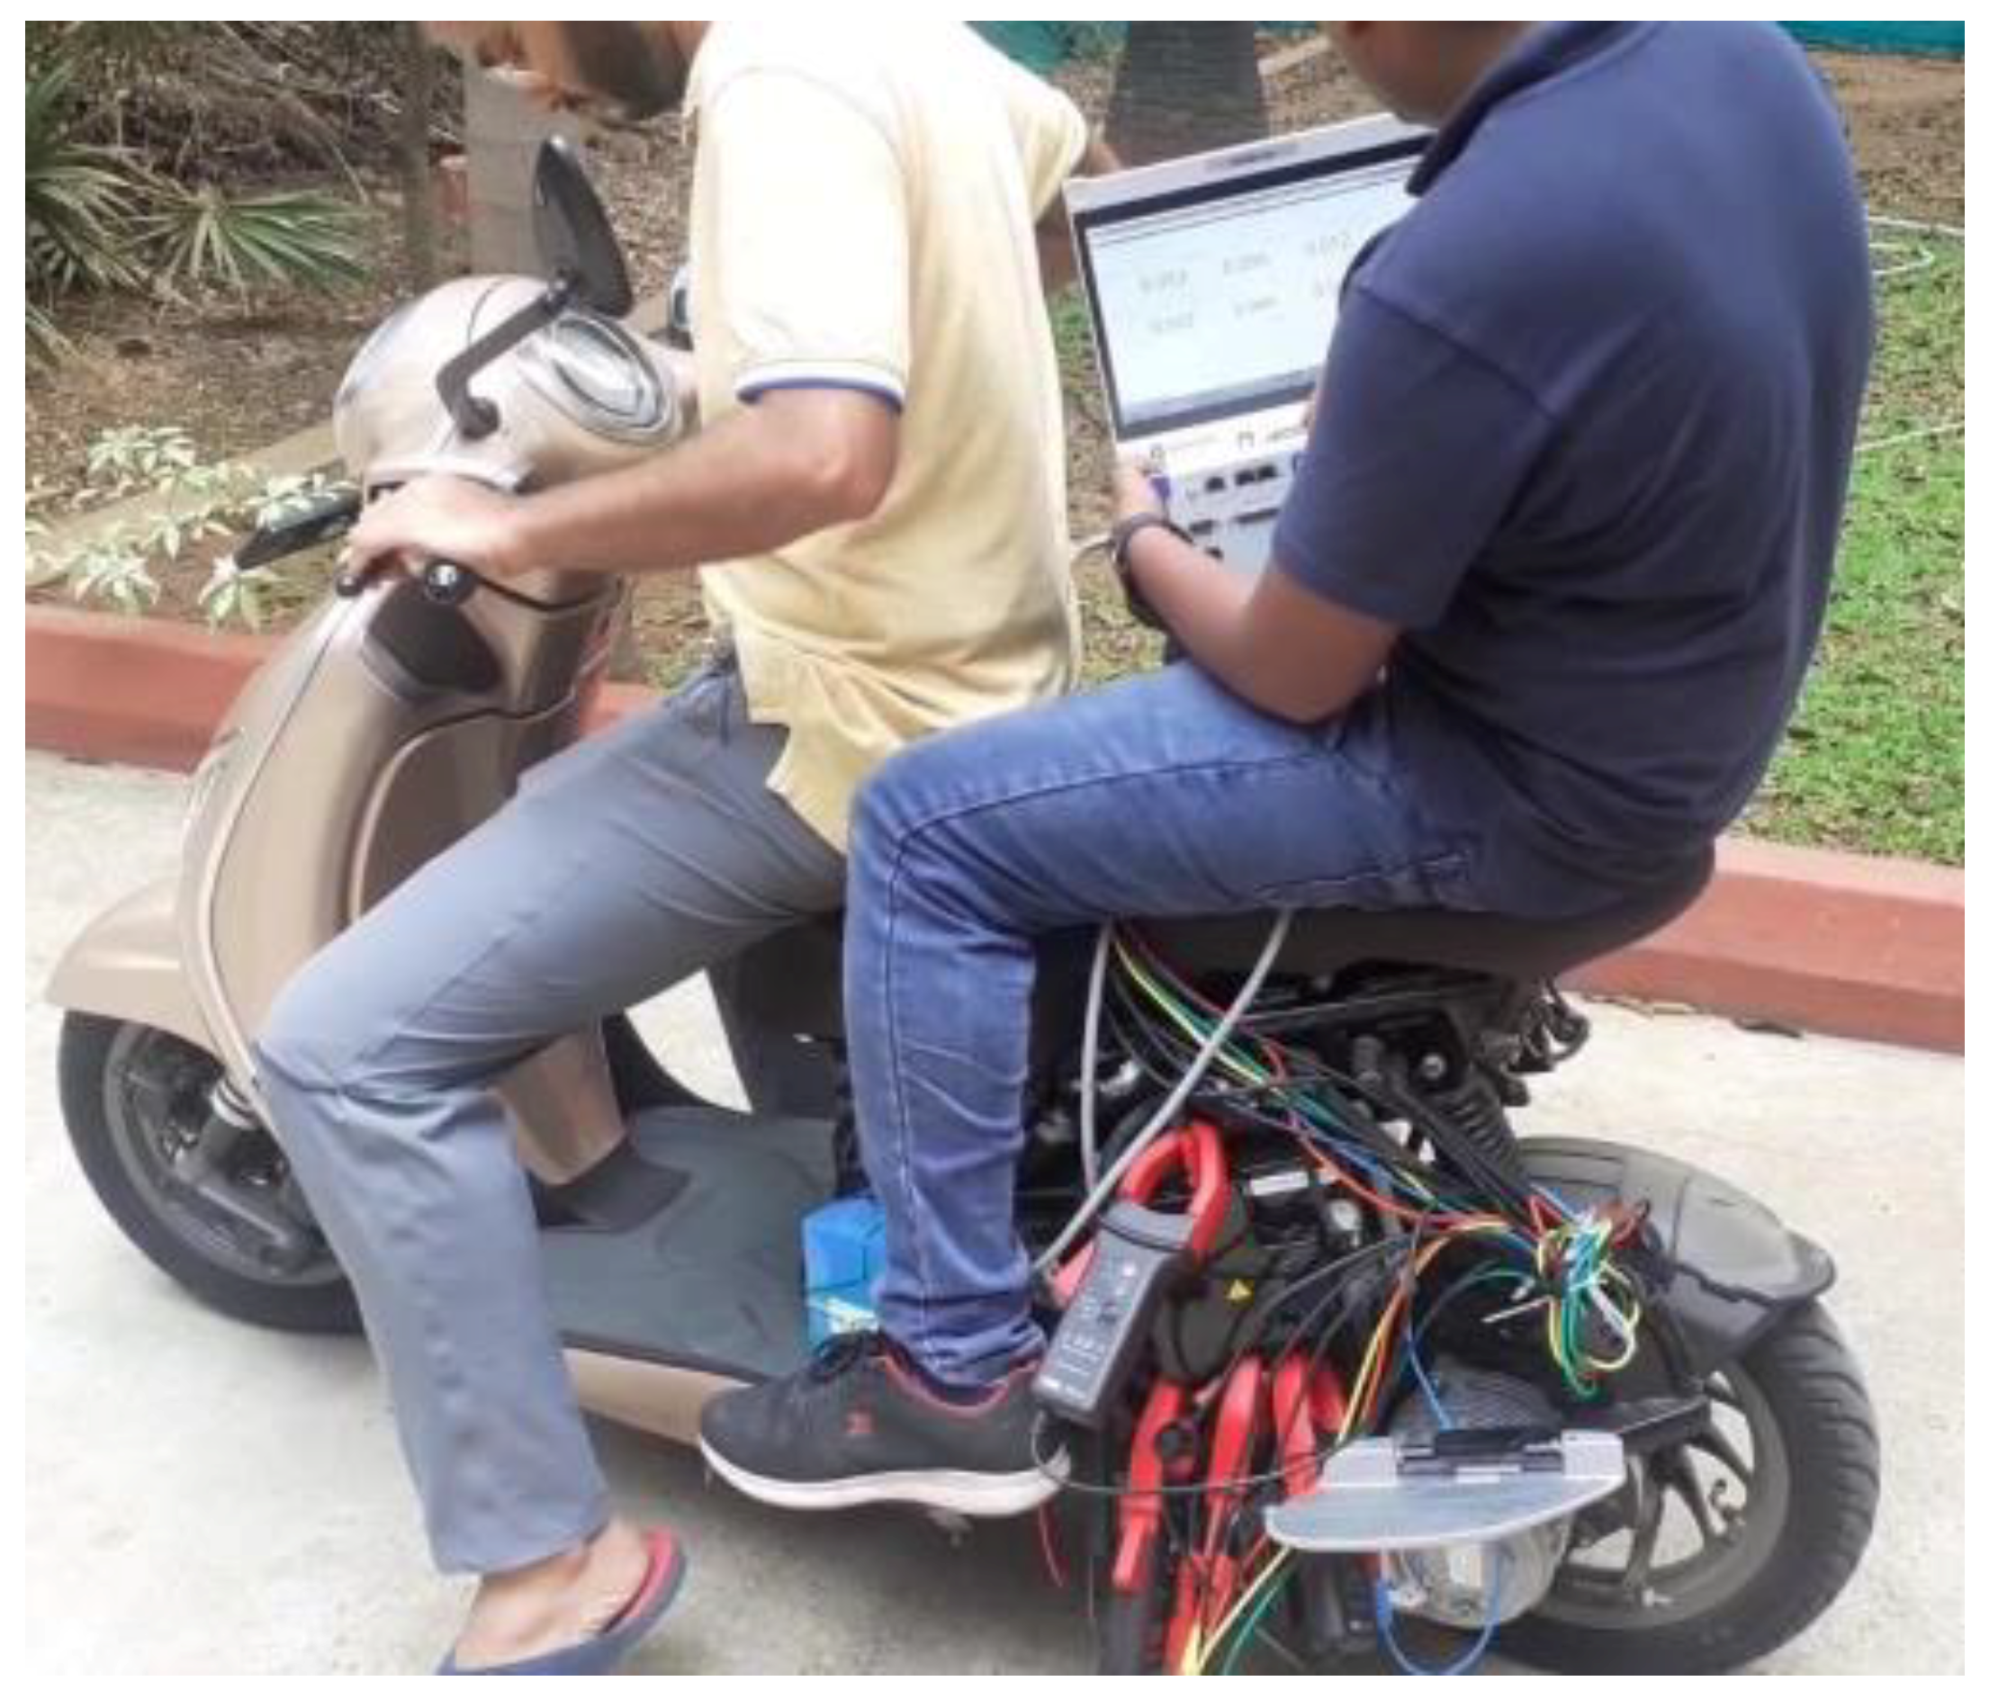
2.2. Data Acquisition System (DEWE3-A4)

The data acquisition system DEWE3-A4 is designed to measure and analyze the performance of electric vehicles. The DEWE3-A4 system is a modular, flexible solution that can be configured to meet the specific needs of electric vehicle testing. It includes high-speed analog and digital channels for measuring various signals, such as motor currents, voltages, temperatures, and CAN bus data. The system also includes specialized software (OXYGEN 6.5.1 by Dewetron, Austria) for real-time data visualization and analysis and powerful post-processing tools for in-depth analysis and reporting.
The data acquisition system DEWE3-A4 was successfully mounted on the two-wheeler electric vehicle. Also, electrical tapings were made at the output of the battery, which goes as the DC input to the inverter, and similar tapings were made for the three-phase output of the inverter, which goes as the AC input to the motor. These tapings, along with current and voltage clamps, were used to record the current and voltage data, along with frequency and power factor. The above-mentioned data were recorded in the DEWE3-A4 system via CAN bus data. The GPS sensor helped to record the distance, velocity, latitude, and longitude. Figure 2 shows a real-time image, where the data acquisition system DEWE3-A4 is carried on the vehicle; the connections from the tapings were connected to DEWE3-A4 through CAN buses, following which a real-time drive on the vehicle was performed, and the real-time data was recorded.

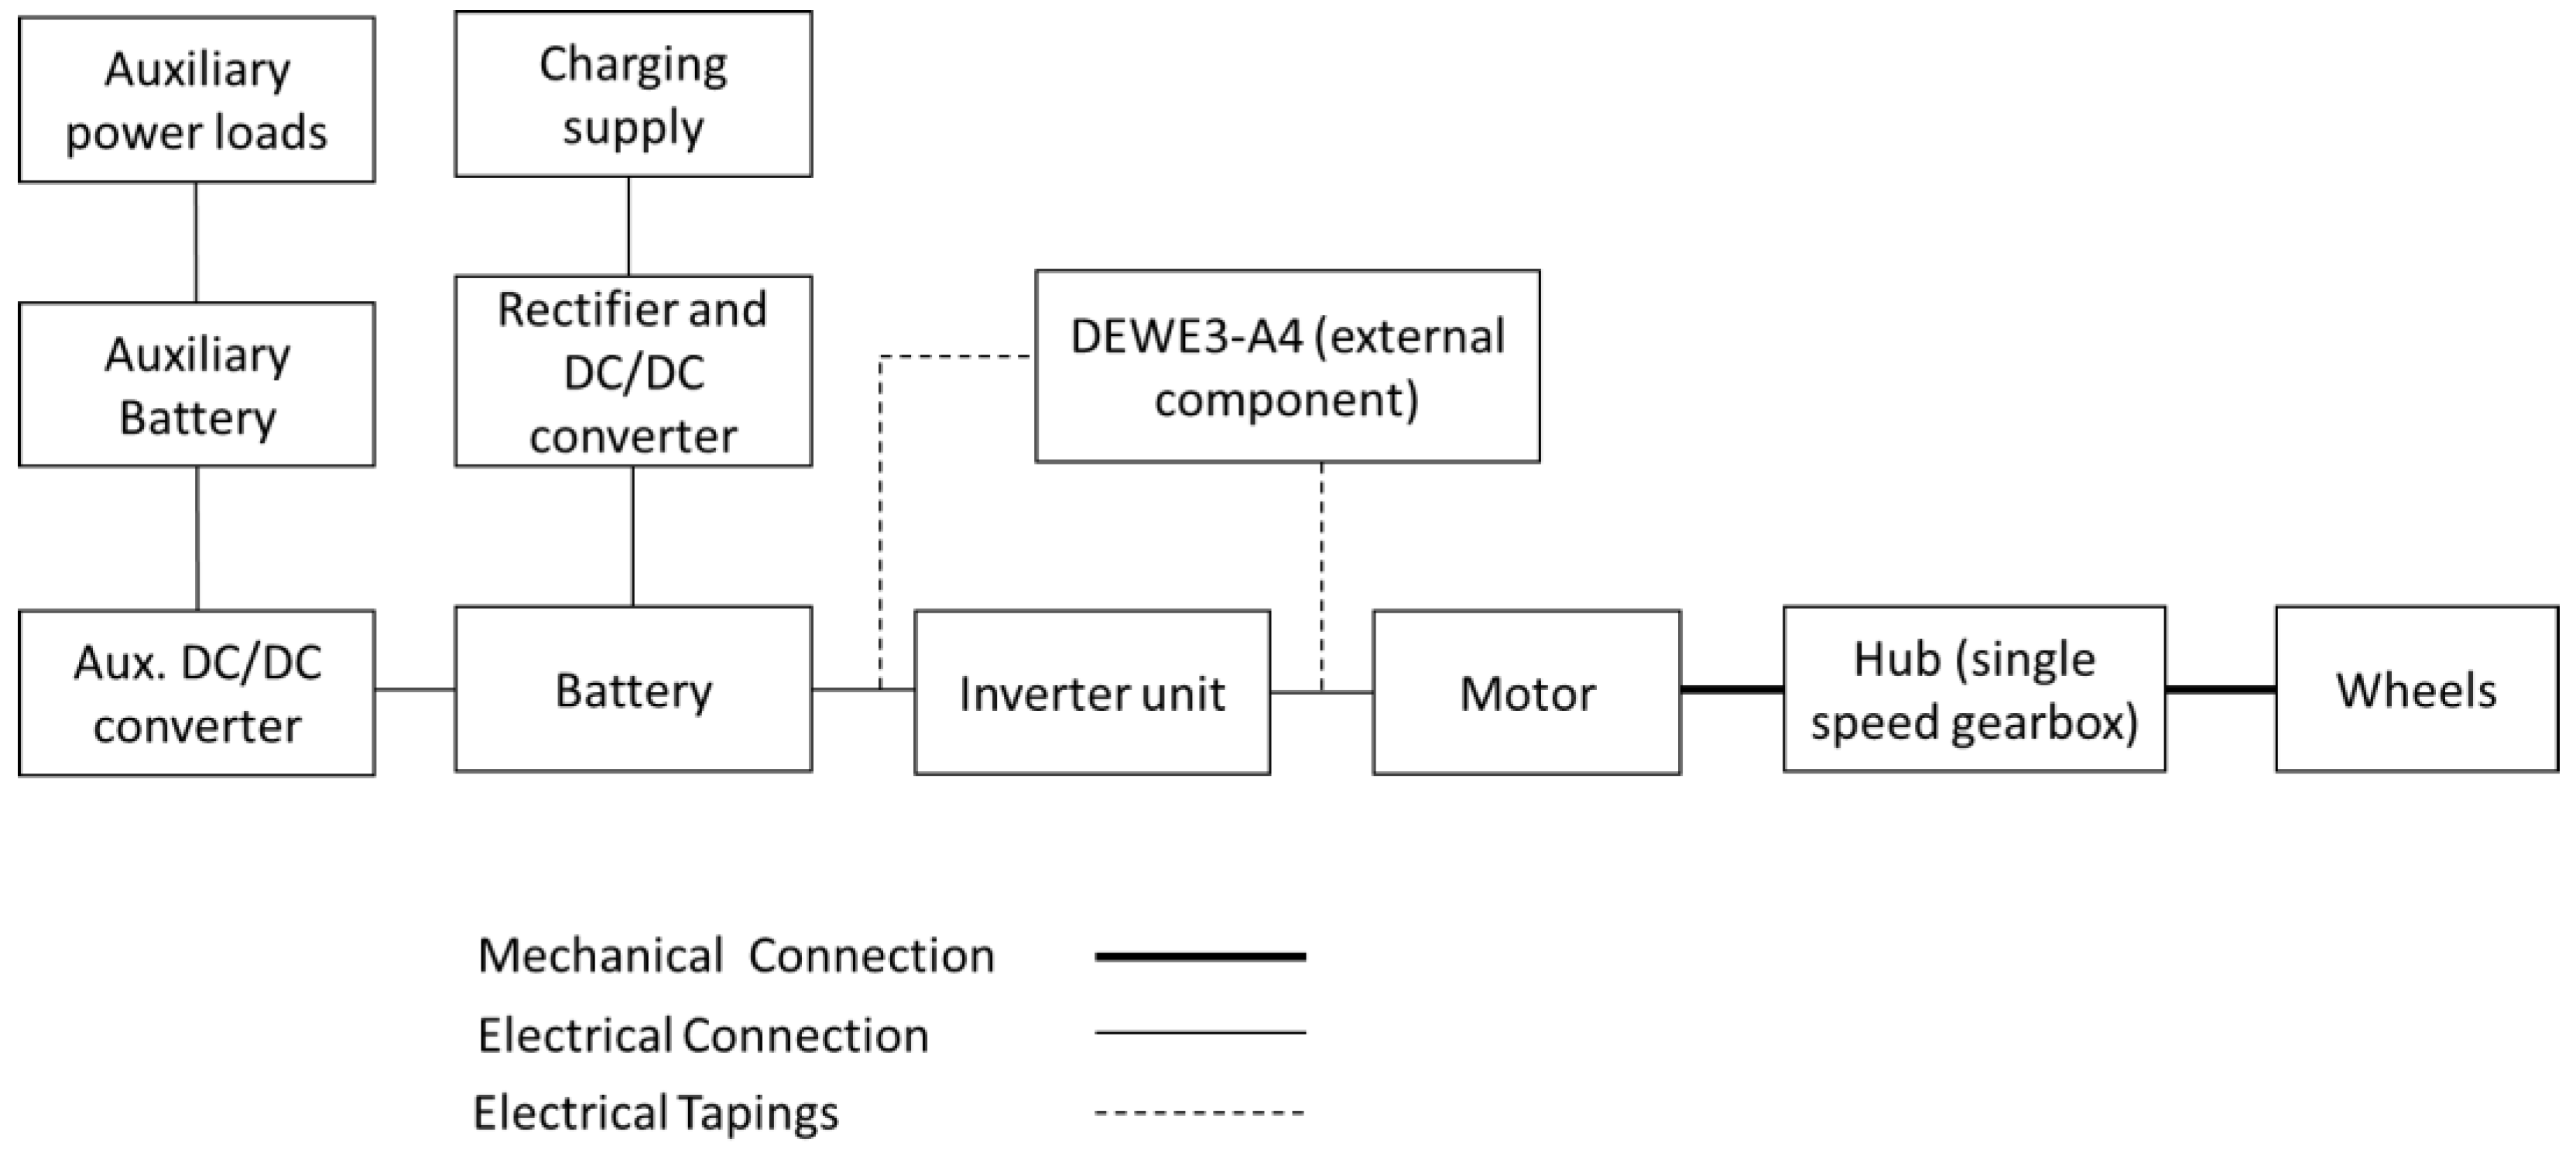
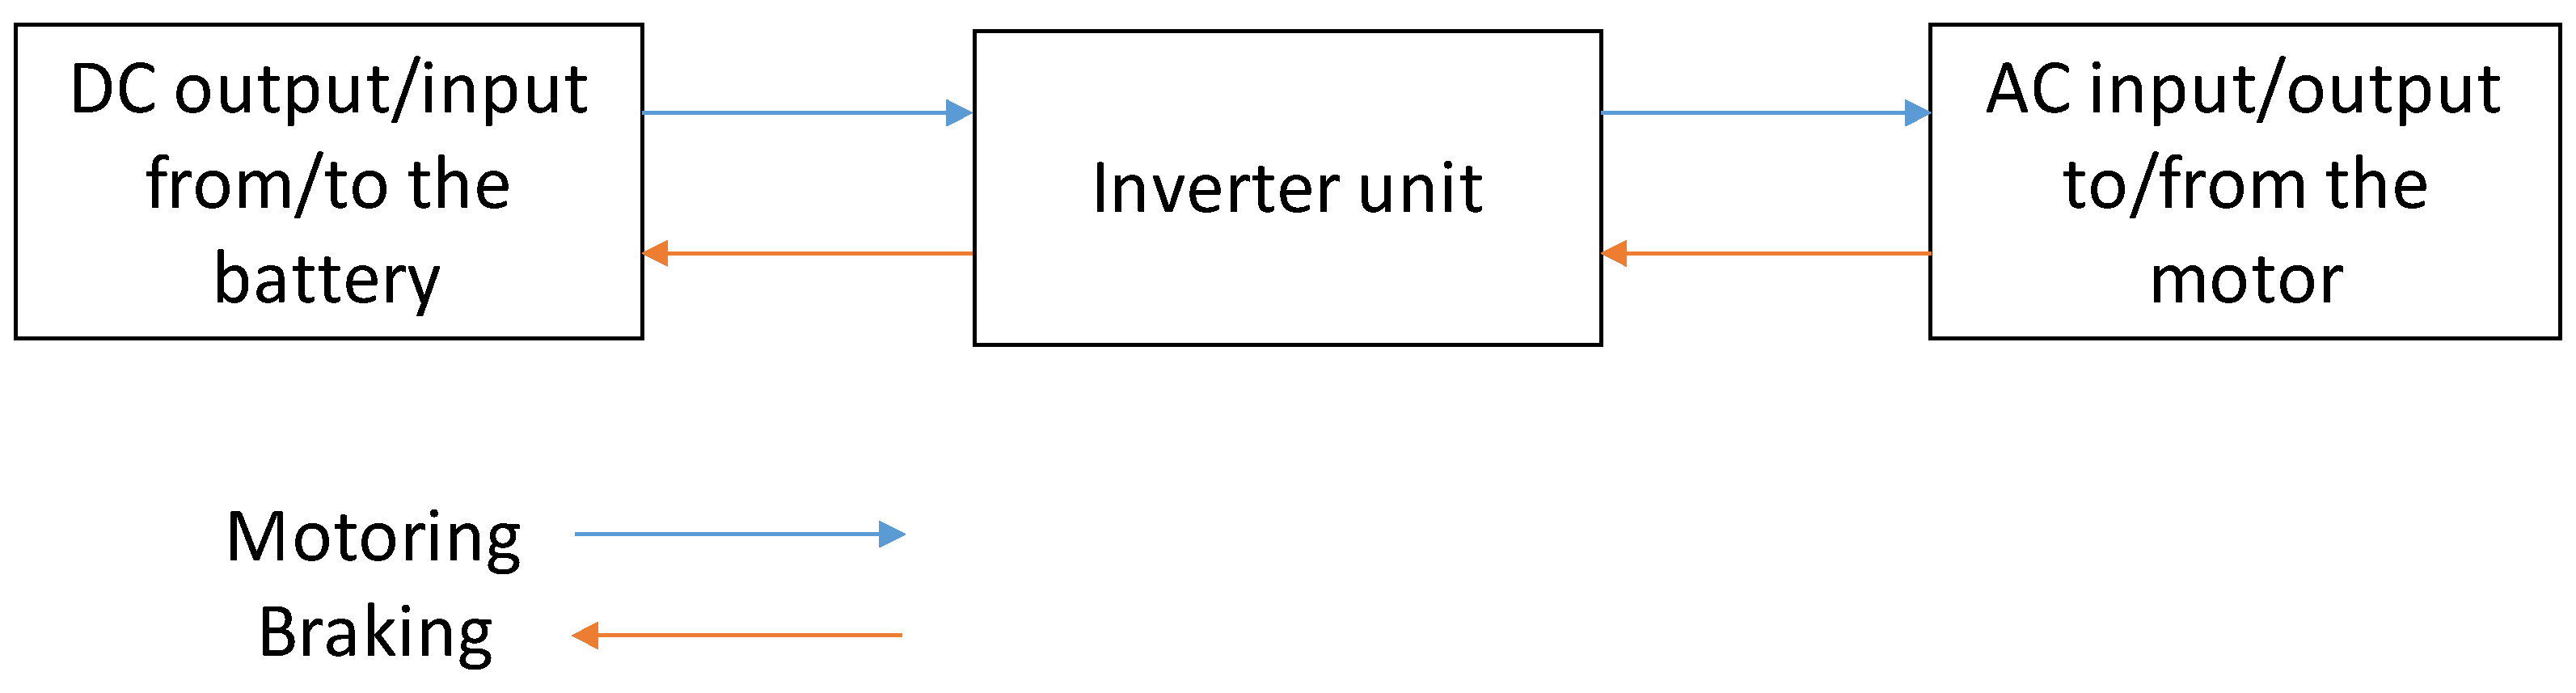
2.3. Block Diagram of the Vehicle Architecture

Figure 3 shows a block diagram of the major components of the electric vehicle under study. The data acquisition system is externally connected to the input and output of the inverter. The charging supply, as shown, is connected to the rectifier and DC/DC converter unit, which converts the incoming AC supply to DC and further steps down the voltage to battery level. The charging is done only when the vehicle is in a standstill position. The auxiliary power loads, such as headlamps, display panels, etc., work on an auxiliary battery that receives power from the main battery through a DC/DC converter. The rectifier unit, along with the DC/DC converter, is connected to the battery and functions to charge it. The battery is further connected to the inverter, which converts the incoming DC supply of the battery to AC output to the motor. Finally, the motor is coupled to a single-speed reducer gear, which is coupled to the rear wheel. The specifications of all the components are mentioned in Table 1. The auxiliary components and the charging components are not taken under analysis, as this work deals only with the real-time data acquisition performance analysis of the major components involved.

2.4. Measured and Calculated Quantities

During the real-time data acquisition, the following quantities were measured:
  • DC current and voltage output from the battery (during motoring) and into the battery (during regeneration)
  • AC currents and AC voltages input to the motor (output from the inverter)
  • Fundamental frequency of the operation and power factor (AC side)
  • Distance covered, velocity, acceleration, and GPS parameters
The following quantities were calculated using measured quantities:
  • DC power output from the battery (during motoring) and into the battery (during regeneration)
  • AC power input to the motor (output from the inverter)
  • Inverter efficiency
  • Battery state of charge (SoC)
  • Torque and speed of the motor.

2.4.1. Calculation of Power Output from the Battery (DC) and Power Input to the Motor (AC)

The power output from the battery (PDC) (W) (during motoring) is calculated by multiplying the DC current (IDC) (A) and DC voltage (VDC) (V) coming out from the battery, which is mathematically represented by Equation (1). The same Equation (1) is applicable for regeneration as well, the only difference being the current (IDC) would be negative, which would make the power (PDC) negative.
PDC = VDC × IDC
The power input to the motor (PAC) (W) is calculated by multiplying the per-phase AC current (Ia) (A), per-phase AC voltage (Va) (V) coming out from the inverter, power factor, and square root of three, which is mathematically represented by Equation (2).
PAC = Va × Ia × PF × √3

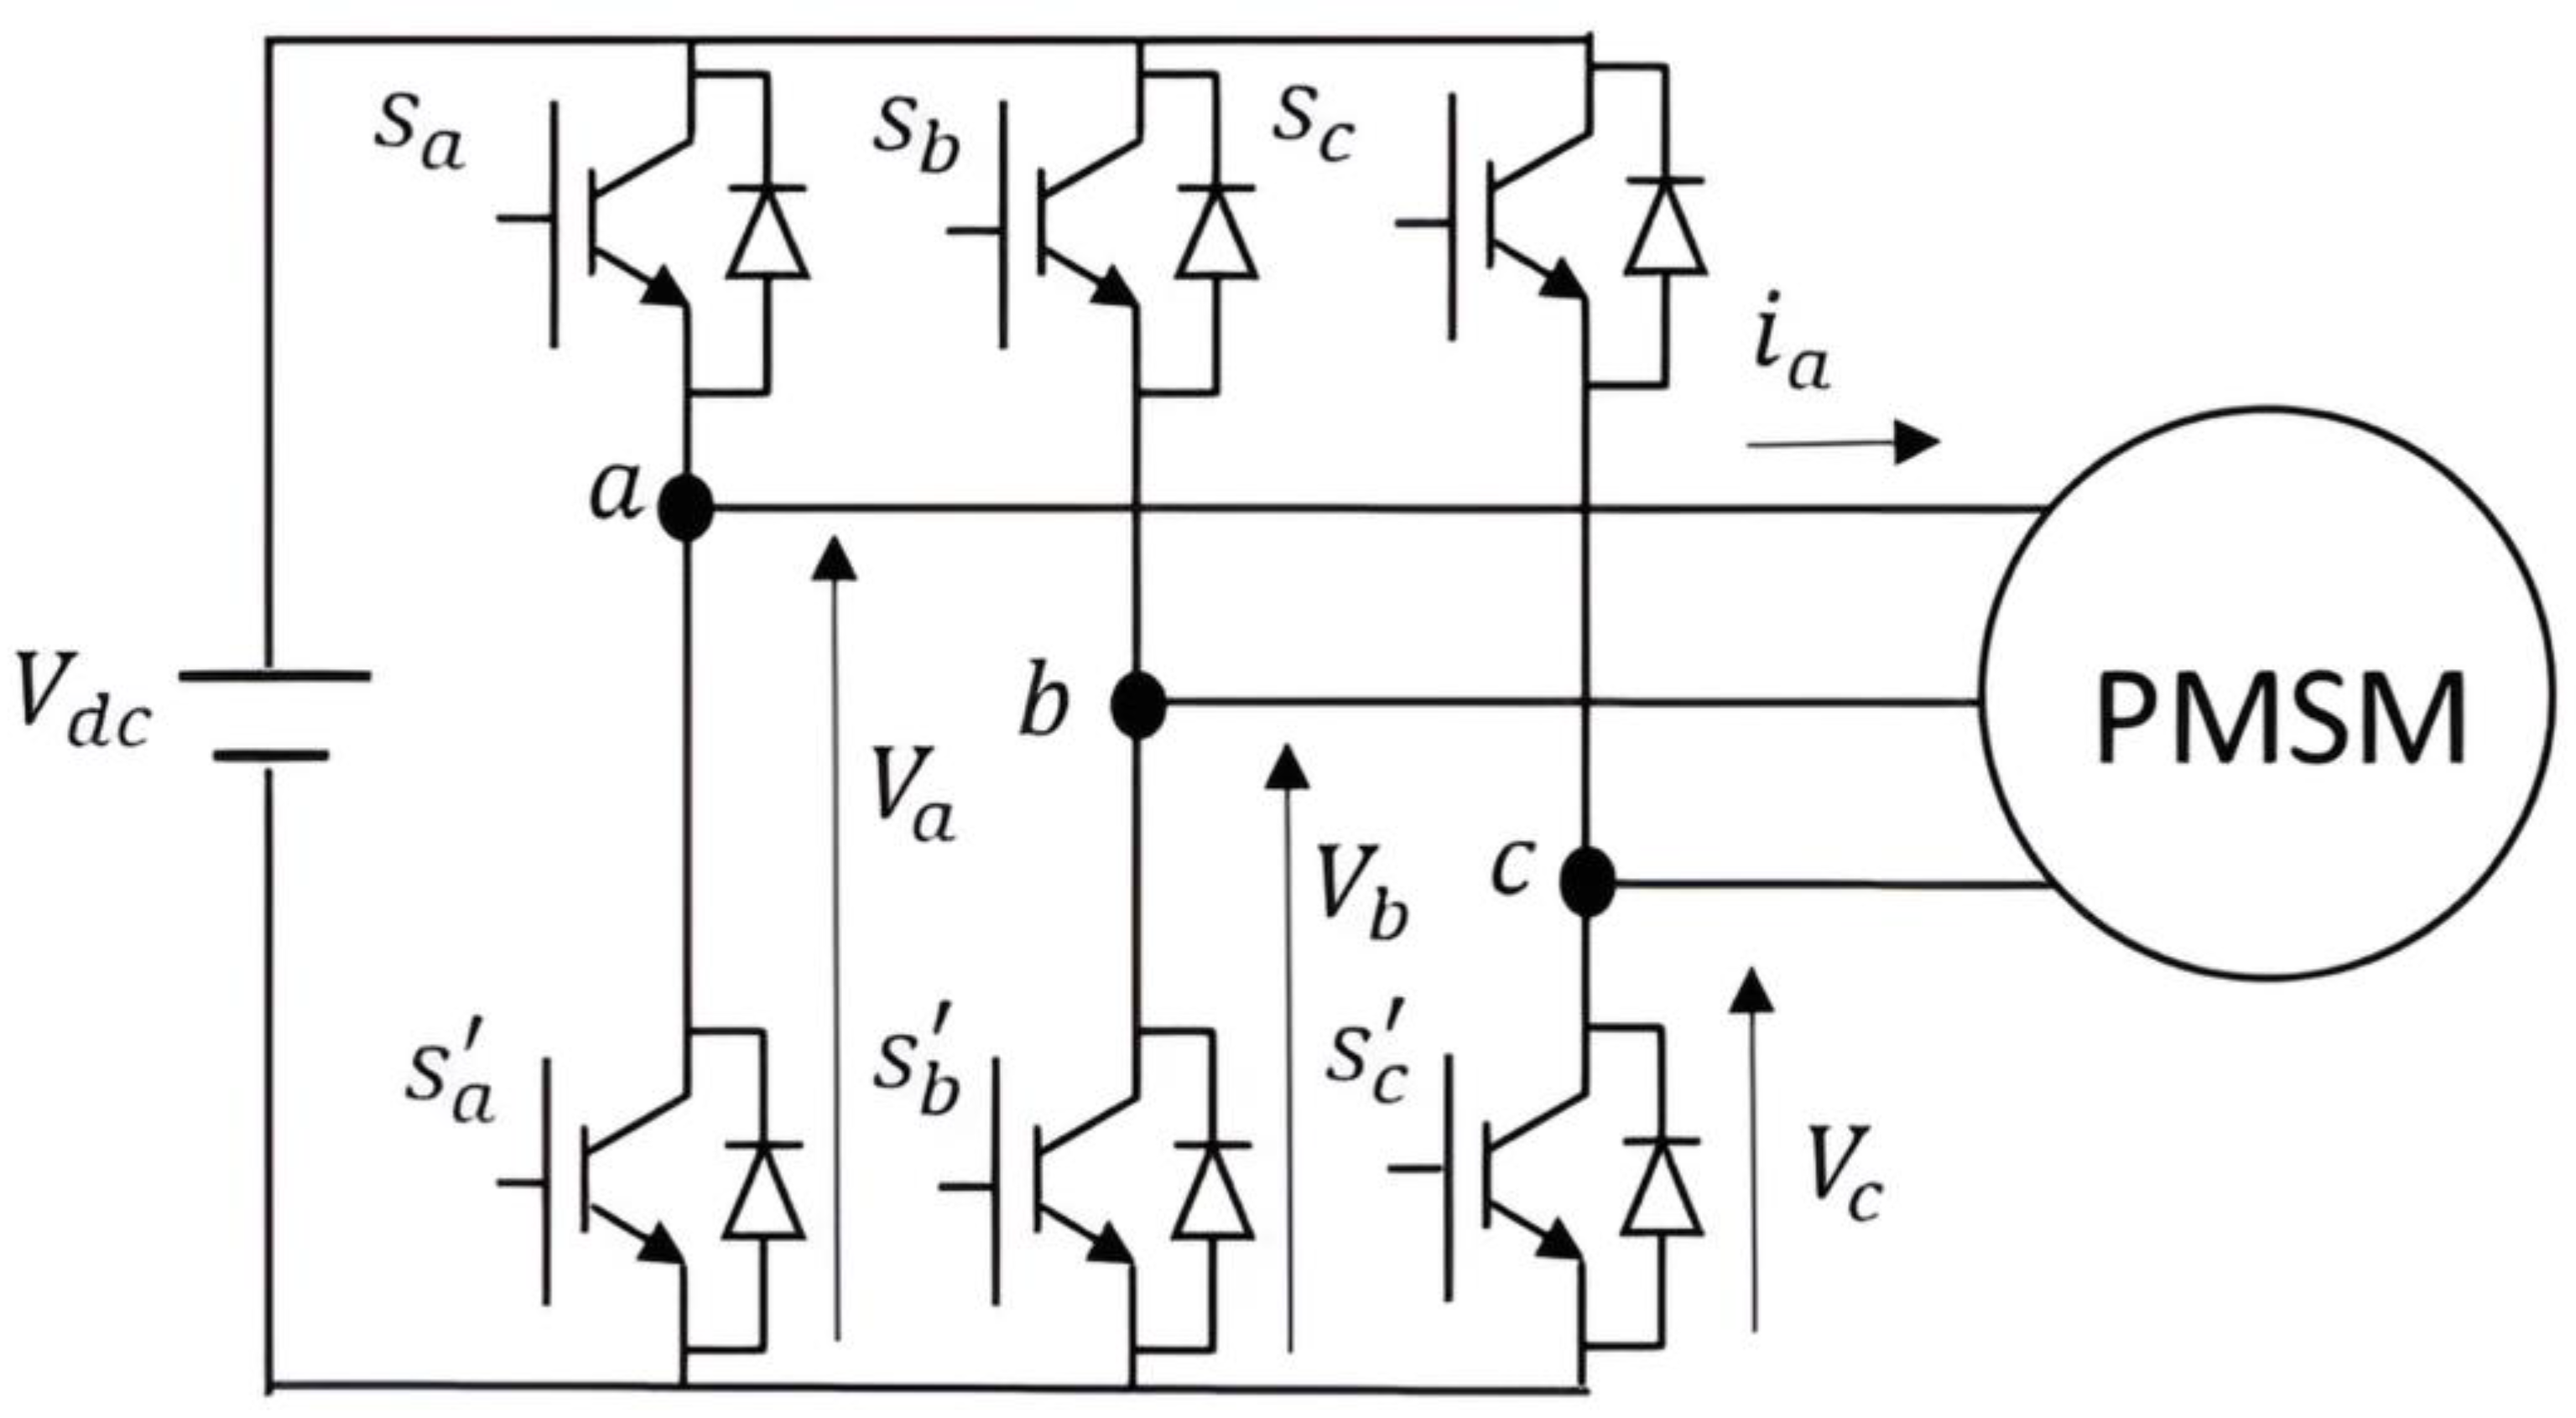
2.4.2. Inverter Topology and Calculation of Inverter Efficiency

The inverter used under study is a three-phase inverter. Figure 4 shows the topology of such an inverter. The heart of this inverter topology is the six switches (Sa, Sb, Sc, S’a, S’b, S’c), along with their individual anti-parallel diodes. The input to the inverter is the DC voltage (Vdc) coming from the battery, and the output voltages (Va, Vb, Vc) and output currents (Ia, Ib, Ic) go to the three-phase load connected to the inverter, which in this case is a three-phase PMSM motor.
The inverter unit is the most essential electronic power device inside any electric or hybrid powertrain. The way it operates affects the entire operation of the vehicle. Hence, it becomes necessary to study its performance under different conditions and use it efficiently. Inverter efficiency is the parameter that tells us how the inverter performs under different situations. The inverter efficiency during motoring operation is found by dividing the output power from the inverter by the power input to the inverter, and during braking it is the ratio of the energy transferred to the battery to the energy received from the wheels, which is mathematically represented by Equation (3). The prime advantage of this method is calculating inverter efficiency without needing to model the switching and conduction losses occurring in the six switches of the inverter. Figure 5 shows the inputs and outputs to the inverter during the motoring and braking modes.
η   =   P A C P D C   for   motoring   mode η   =   P D C P A C   for   braking   mode

2.4.3. Battery State of Charge (SoC)

The battery SoC (%) represents the amount of charge that is currently stored inside the battery; indirectly, it represents the amount of energy that is available to use until the battery dies off. It is the ratio of the remaining capacity (Ah) to the battery’s total capacity (Ah).
S o C   =   R e m a i n i n g   c a p a c i t y   ( A h ) T o t a l   c a p a c i t y   ( A h )
Battery SoC has an immense significance for any electric vehicle, as it directly impacts many control decisions of the battery management system, thermal management system, and range of the vehicle, which can cause driver anxiety. Coulomb counting is one of the simplest techniques to estimate a battery’s SoC, given that the initial SoC is known and the current measurement is accurate. For the present work, the initial SoC was noted down from the display panel of the vehicle before starting the test, and the current measurement is accurate. The SoC is estimated using the coulomb counting technique, which is described below.
Q   in / out   ( Ah )   =   1 3600   ×   t 1 t 2 I   d t Q ( t )   =   ( Initial   charge     Q   in / out ) , SoC   ( % )   =   Q ( t ) Q t o t a l   ×   100
The charge taken out or put in at any time is calculated using the integration of the current over time. The SoC is calculated by dividing charge at any instant with the total charge capacity of the battery, as described in Equation (5), where the initial charge could be found by multiplying the initial SoC by the total charge capacity.

2.4.4. Calculation of Motor Speed and Torque

One of the most significant tools for analyzing the performance of a motor is the torque speed characteristics of that motor. This demands the calculation of the motor torque and speed. The motor speed (N) in rpm can be obtained from Equation (6), where the frequency (f) (Hz) is measured during the real-time data acquisition, and the number of poles (p) is also known (mentioned in Table 1). The motor torque (T) is obtained from the conventional equation, which relates the power, speed, and torque, as described in (7). This calculation assumes that the transmission efficiency is unity.
N   ( rpm ) = 120   ×   f p
T   ( Nm ) = P   ×   60 2   ×   π   ×   N

3. Results and Discussion

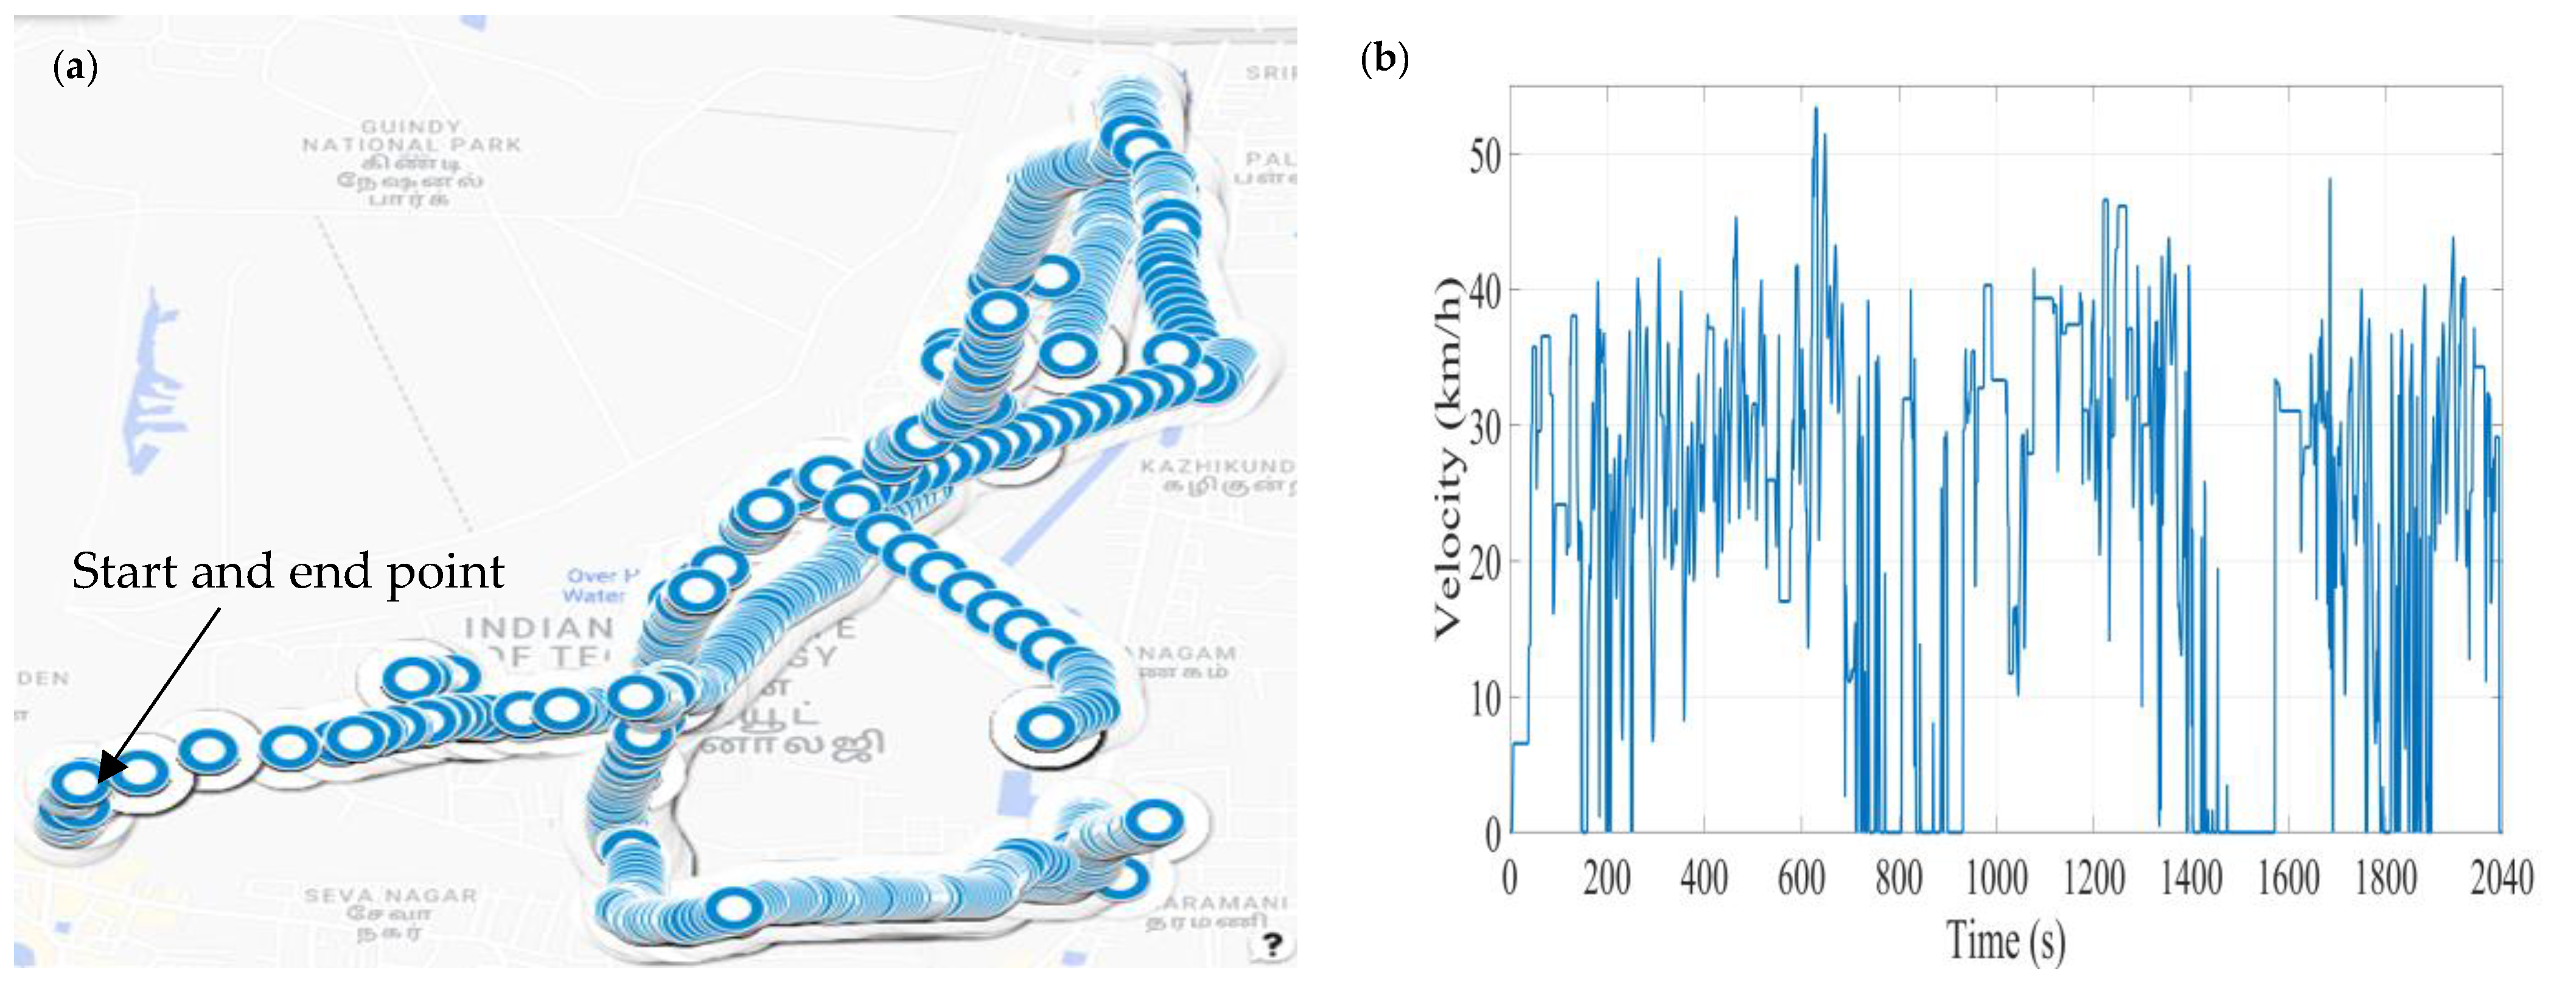
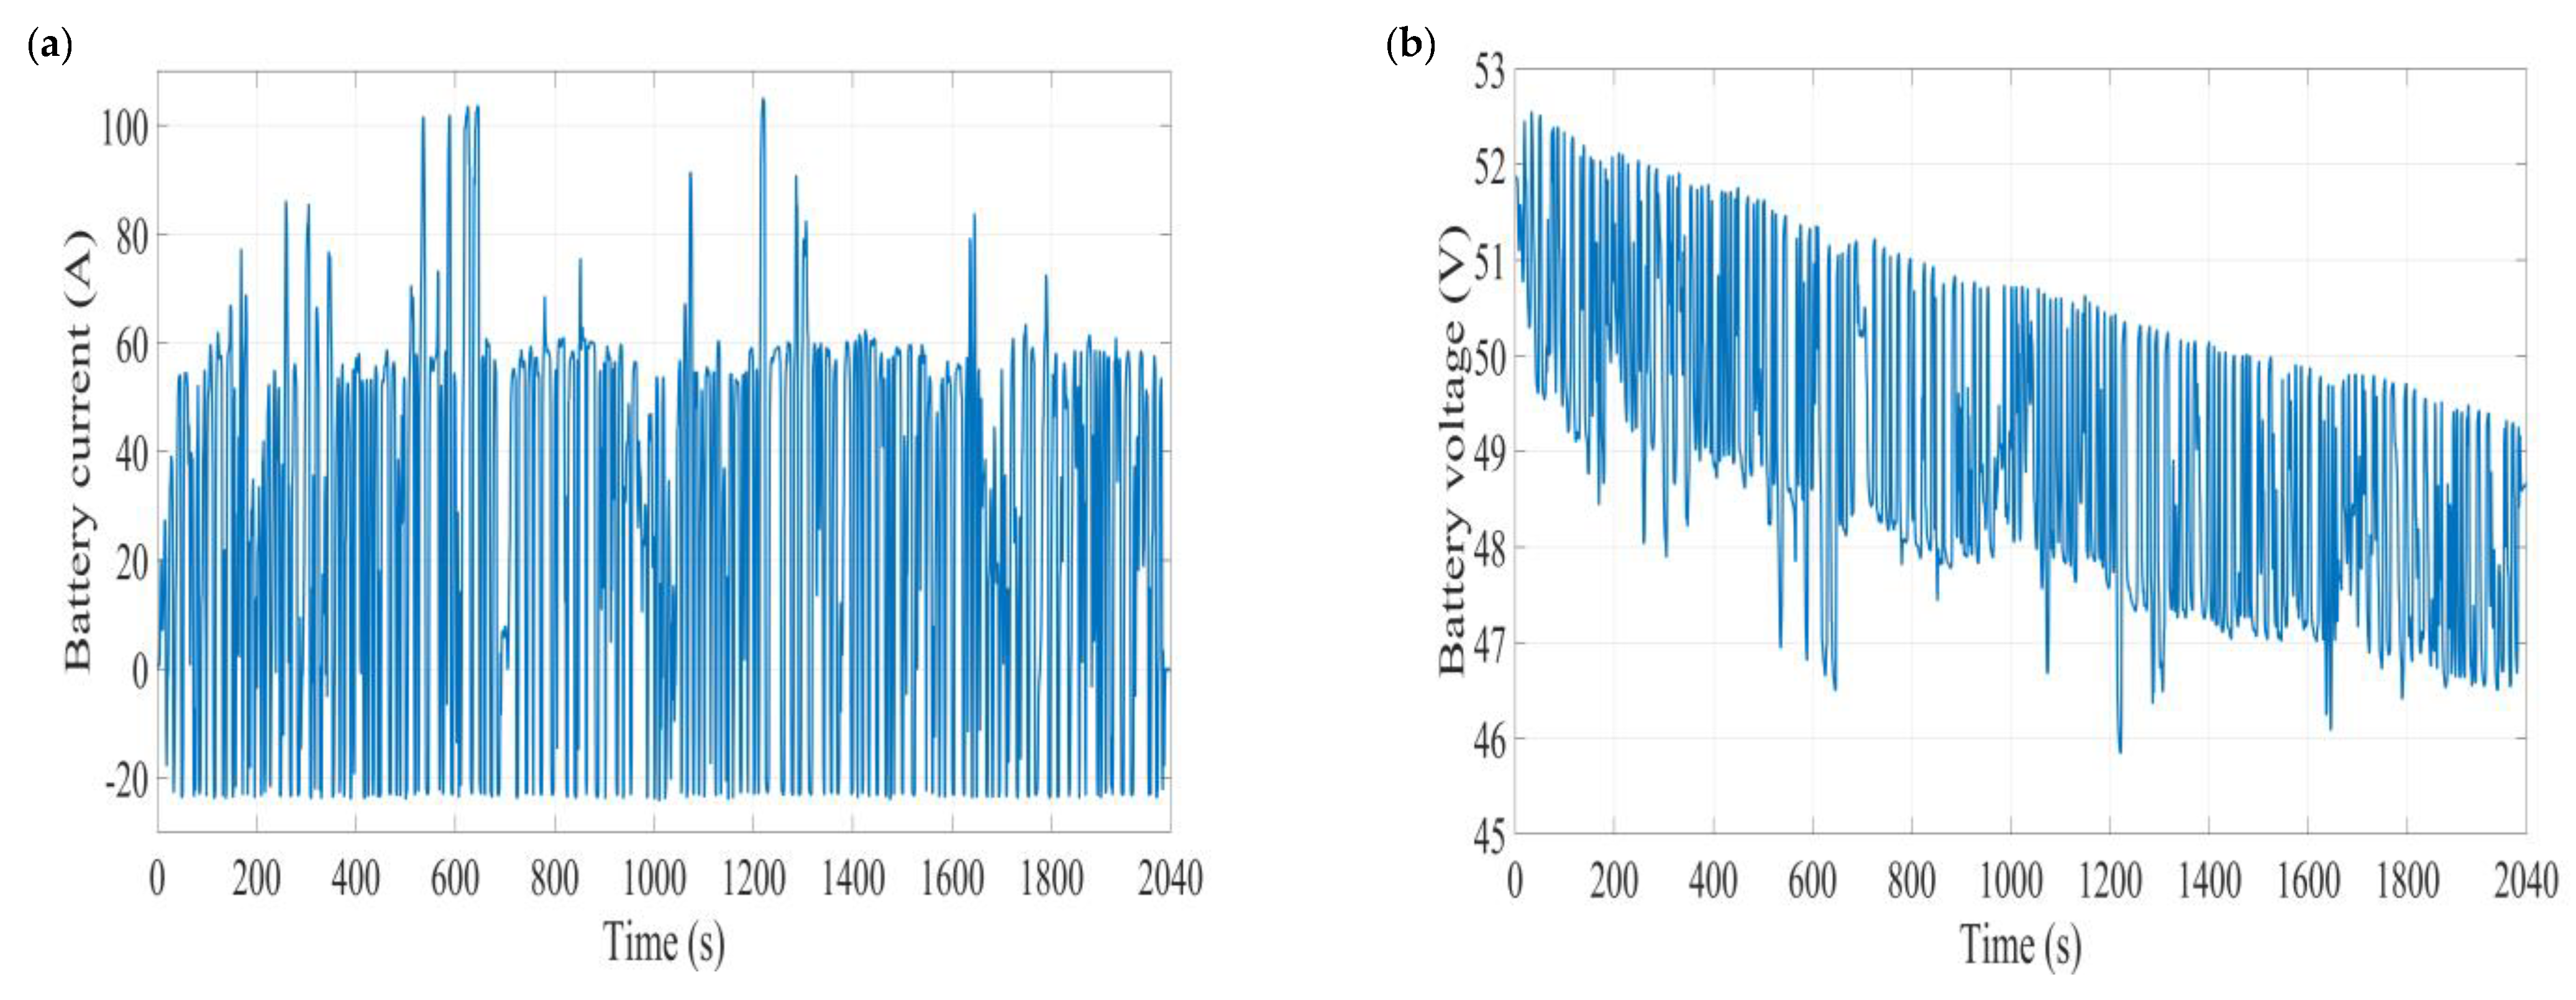
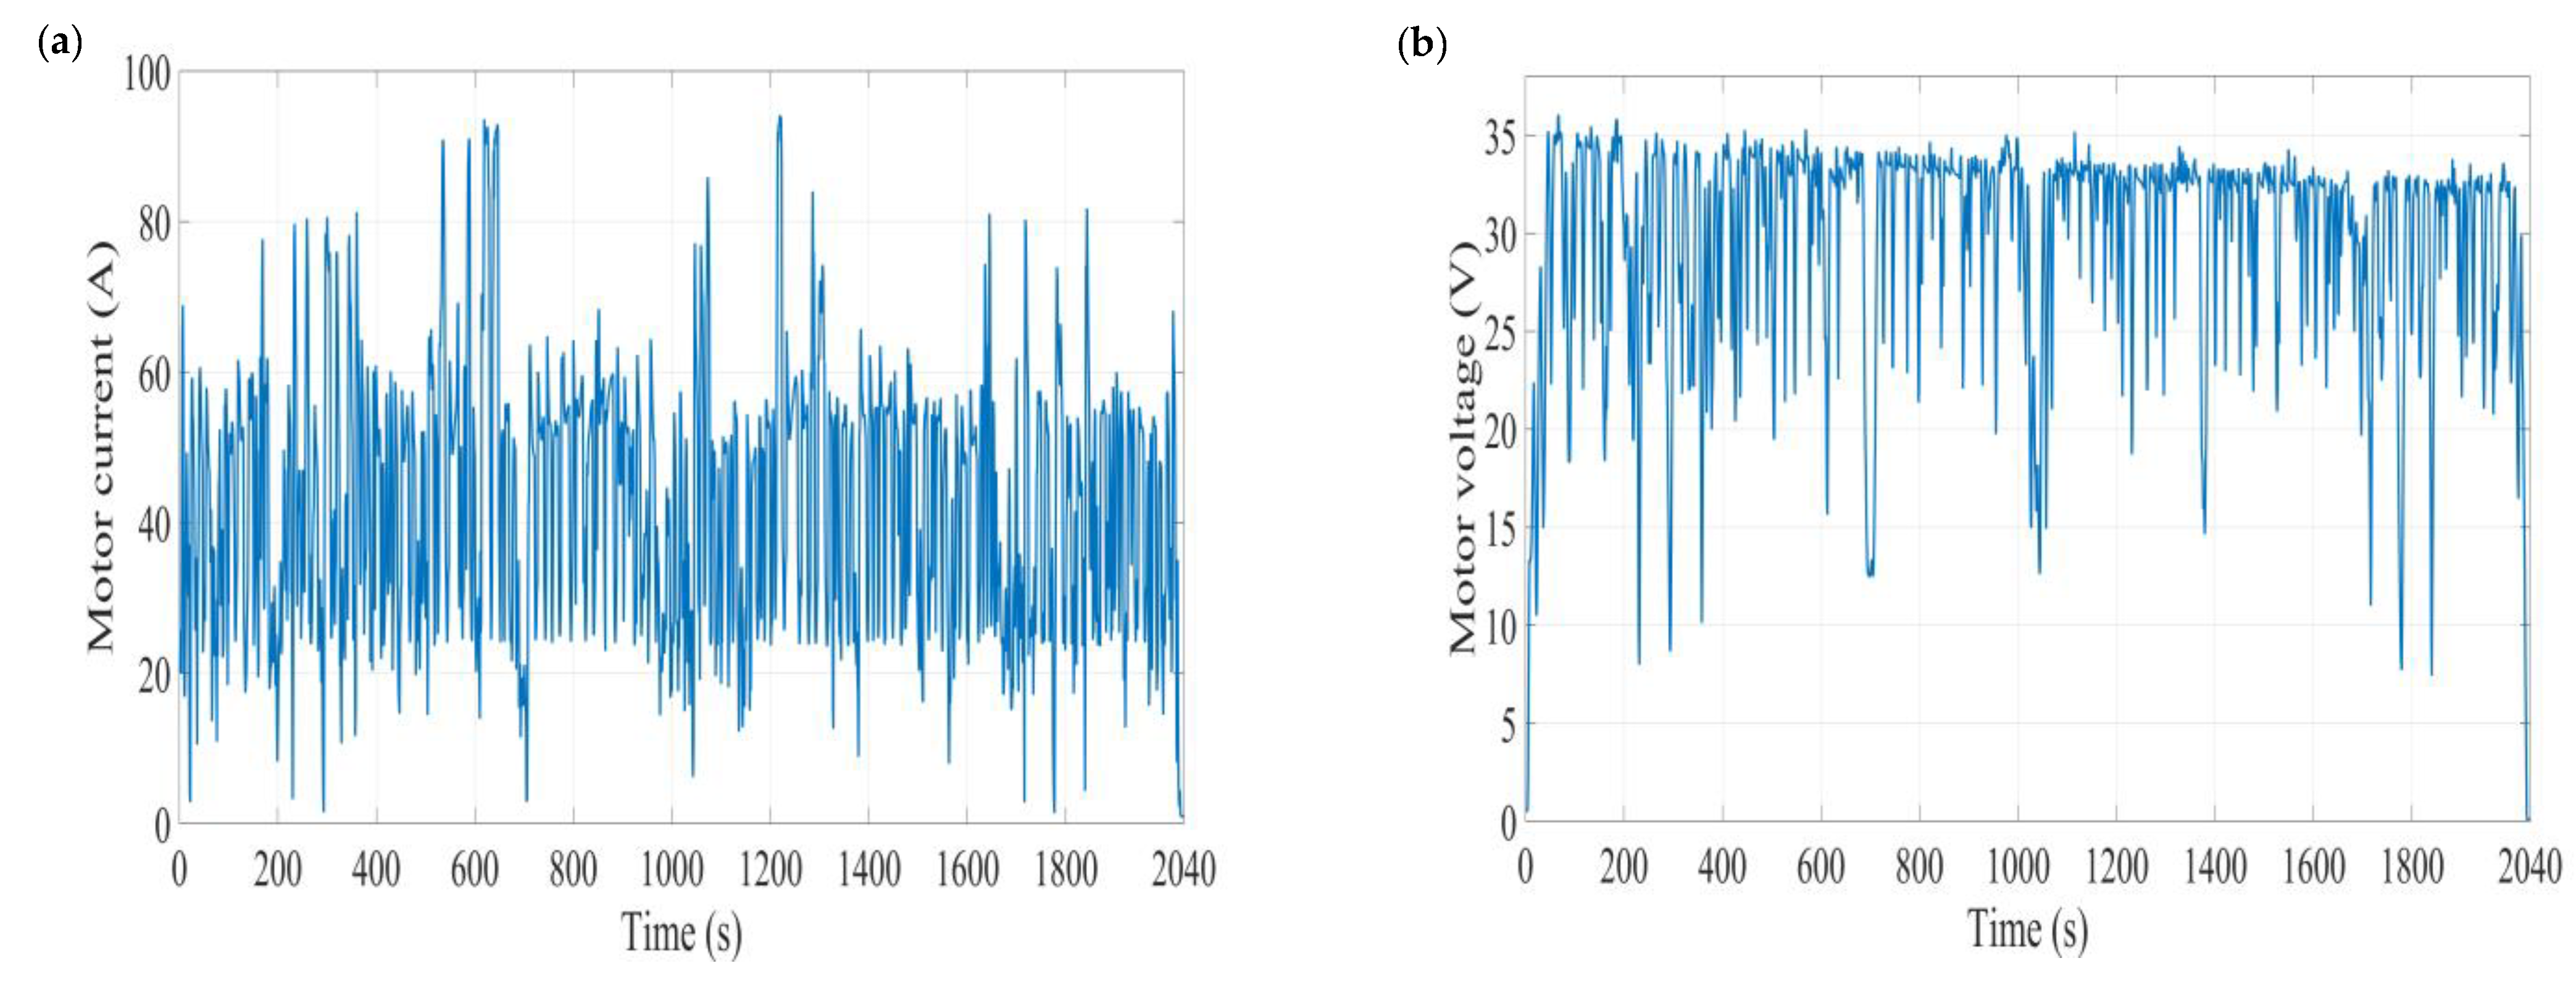
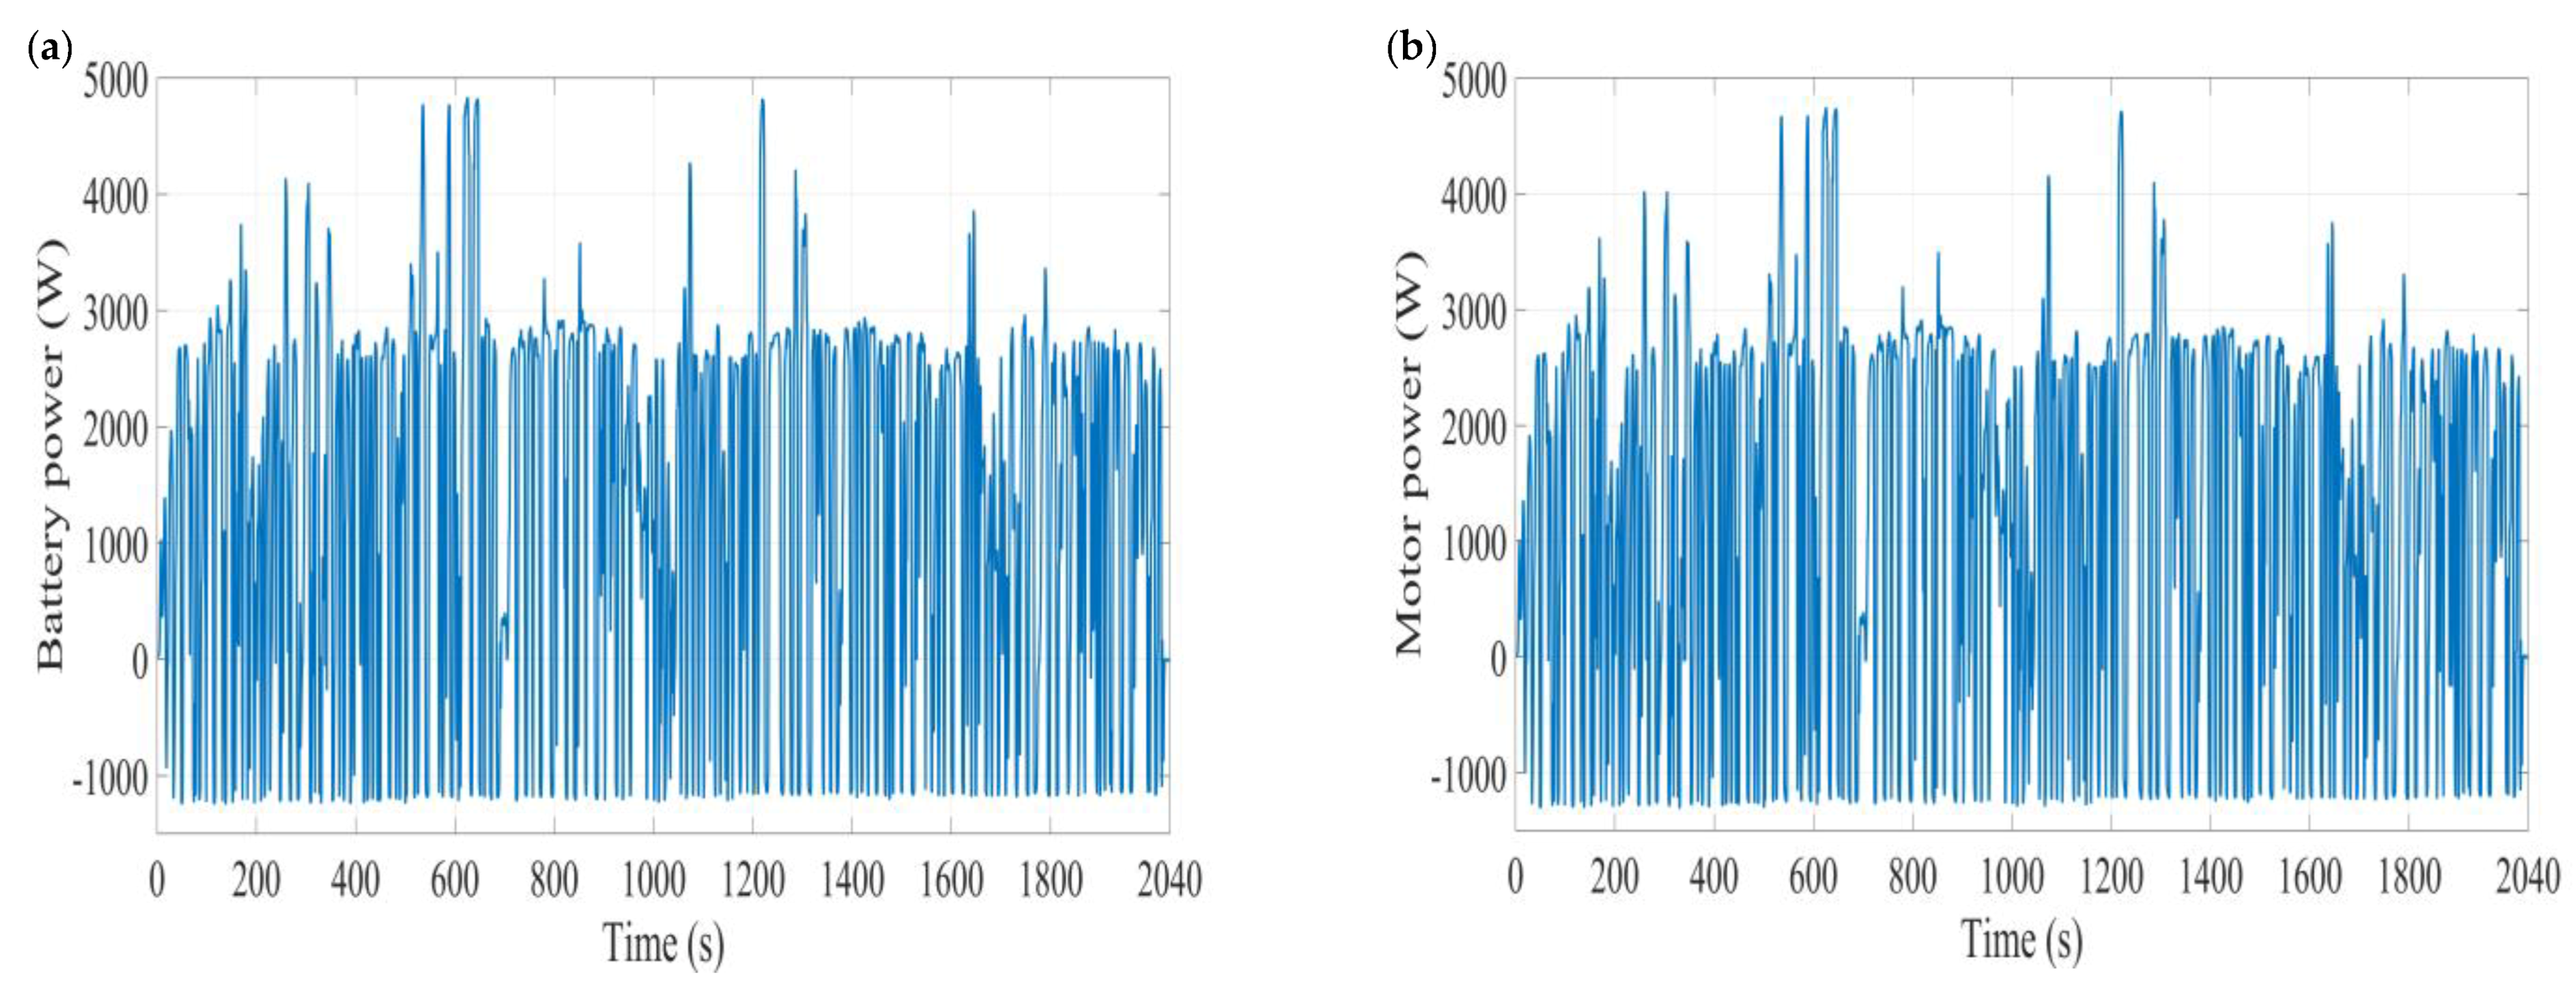
3.1. Recorded Data and Plots

The real-time data was recorded using the DAQ system DEWE3-A4 for 2040 s, during which time a total distance of 14.5 km was covered over a route inside the campus of the Indian Institute of Technology Madras; the route map shown in Figure 6a was plotted using the real-time recorded values of latitude and longitude. The recorded velocity profile of the vehicle over time is shown in Figure 6b. The average velocity and maximum velocity for the entire drive profile were 23.1 km/h and 53.4 km/h, respectively. Figure 7a shows the DC output current from the battery, which is also the current input to the inverter. The negative value of the current represents the energy flowing back from the wheels to the battery during the braking operation, also known as regeneration. The battery current ranges between −24.3 A and 105 A, with an average current of 28.4 A. Figure 7b shows the terminal voltage of the battery; the terminal voltage reduces when the operation is motoring and increases when the operation is braking. The terminal voltage ranges from 45.8 V to 52.6 V.
Figure 8a shows one of the three phases of the output current from the inverter, which is then fed to the motor; hence, the plot is described as motor current. The minimum, maximum, and average recorded inverter output current per phase (RMS) are 0 A, 94.1 A, and 42.5 A, respectively. Figure 8b shows one of the three phases of the output voltage from the inverter, which is then fed to the stator terminals of the motor; hence, the plot is described as motor voltage. The minimum, maximum, and average recorded inverter output voltage per phase (RMS) are 0 V, 36 V, and 29.6 V, respectively. Figure 9a shows the power output from the battery, which is also the power input to the inverter unit (neglecting the conduction loss in the cables), which has a similar nature to the battery current output plot. The negative value of the power represents the energy flowing back from the wheels to the battery during the braking operation, which is also known as regeneration. The battery power ranges between −1247.8 W and 4833.7 W, with an average power of 1353 W. The points with higher battery power are also the same, which have higher battery currents, because during the motoring operation, as the voltage reduces, any power higher than the other one will naturally draw more current than the other one. Higher-drawn battery currents are further due to high-velocity demands or high accelerations.
Figure 9b shows the power supplied by the motor to the wheels. The negative value of the power represents the energy flowing back from the wheels to the battery during the braking operation, which is also known as regeneration. The minimum, maximum, and average recorded motor power are −1308.2 W, 4747.5 W, and 1287.2 W, respectively. Figure 10a shows the inverter efficiency, which is found using the method discussed in Section 2. The average inverter efficiency is calculated as 95%, and the maximum efficiency is found as 99.7%. The efficiency is zero for a few points at the beginning and at the end because the velocities at those points are zero, which leads to no power demand, and hence, the inverter efficiency is zero. However, this is merely due to zero power demand, because even if at these points the vehicle demands some output, then the inverter would perform similar to the other operational points, and the efficiency would not be zero. The relation between the current drawn from the battery and the power output is pretty straightforward; the power output should increase linearly with the amount of current drawn from the battery. Figure 10b shows the relation of DC power output from the battery versus the DC current drawn from the battery. The plot clearly describes a linear relationship between the two variables, with a trend line fitting the data points with an R2 value of 0.9991, which is almost an exact fit. This further clarifies that all the recorded data is pretty accurate because the DC battery voltage is also found to be the same as the ratio of DC battery power to the DC battery current, and the other AC quantities also look reasonable when examined along with the DC quantities. Hence, the real-time experiment that was performed provided accurate measurements of the major parameters of an electric vehicle, which also helped to find the inverter efficiency.

3.2. Battery SoC

The procedure to calculate the battery SoC was described in Section 2.4.3; the battery current data which was recorded and plotted in Figure 11 were used along with an initial SoC of 57% (noted during the start of test) in Equation (5) to get the SoC plot during the test. Figure 11 shows the SoC plot obtained using the same.
It is observed from Figure 11 that the test ride starts with a SoC of 57%, and at the end of the ride (after 2040 s), it drops to 27.82%. It can also be observed that during the ride the SoC drops and also rises during some intervals. This is because of regenerative braking, which is one of the major advantages of an electric vehicle over conventional vehicles. This can be clearly observed from the zoomed section shown inside Figure 11, the instance at 1587 s where the SoC is 33.3%, after which the battery draws [47.6, 54.3, 56.2, 56.7, 54.7, 52.6, 53.8, 53.8, 52.6, 52.3, 46.6, 22.4] A of current and [2263.5, 2569.6, 2653, 2675.1, 2583.4, 2485.9, 2539.1, 2541.5, 2486, 2468.8, 2211, 1080.9] W of power from the battery until 1599 s, all of which is positive for a motoring operation, and therefore the SoC continuously drops from 33.3% to 33.01%. Similarly, between 1600 and 1604 s, the driver applies the brakes, from which the battery receives power due to regeneration, and the current input to the battery is [−18.7, −23.1, −17.6, −23.3, −22.7] A, the corresponding power is [−927.2, −1150.8, −875.4, −1162.4, −1132.2] W, and the SoC increases from 33.01% to 33.06%.

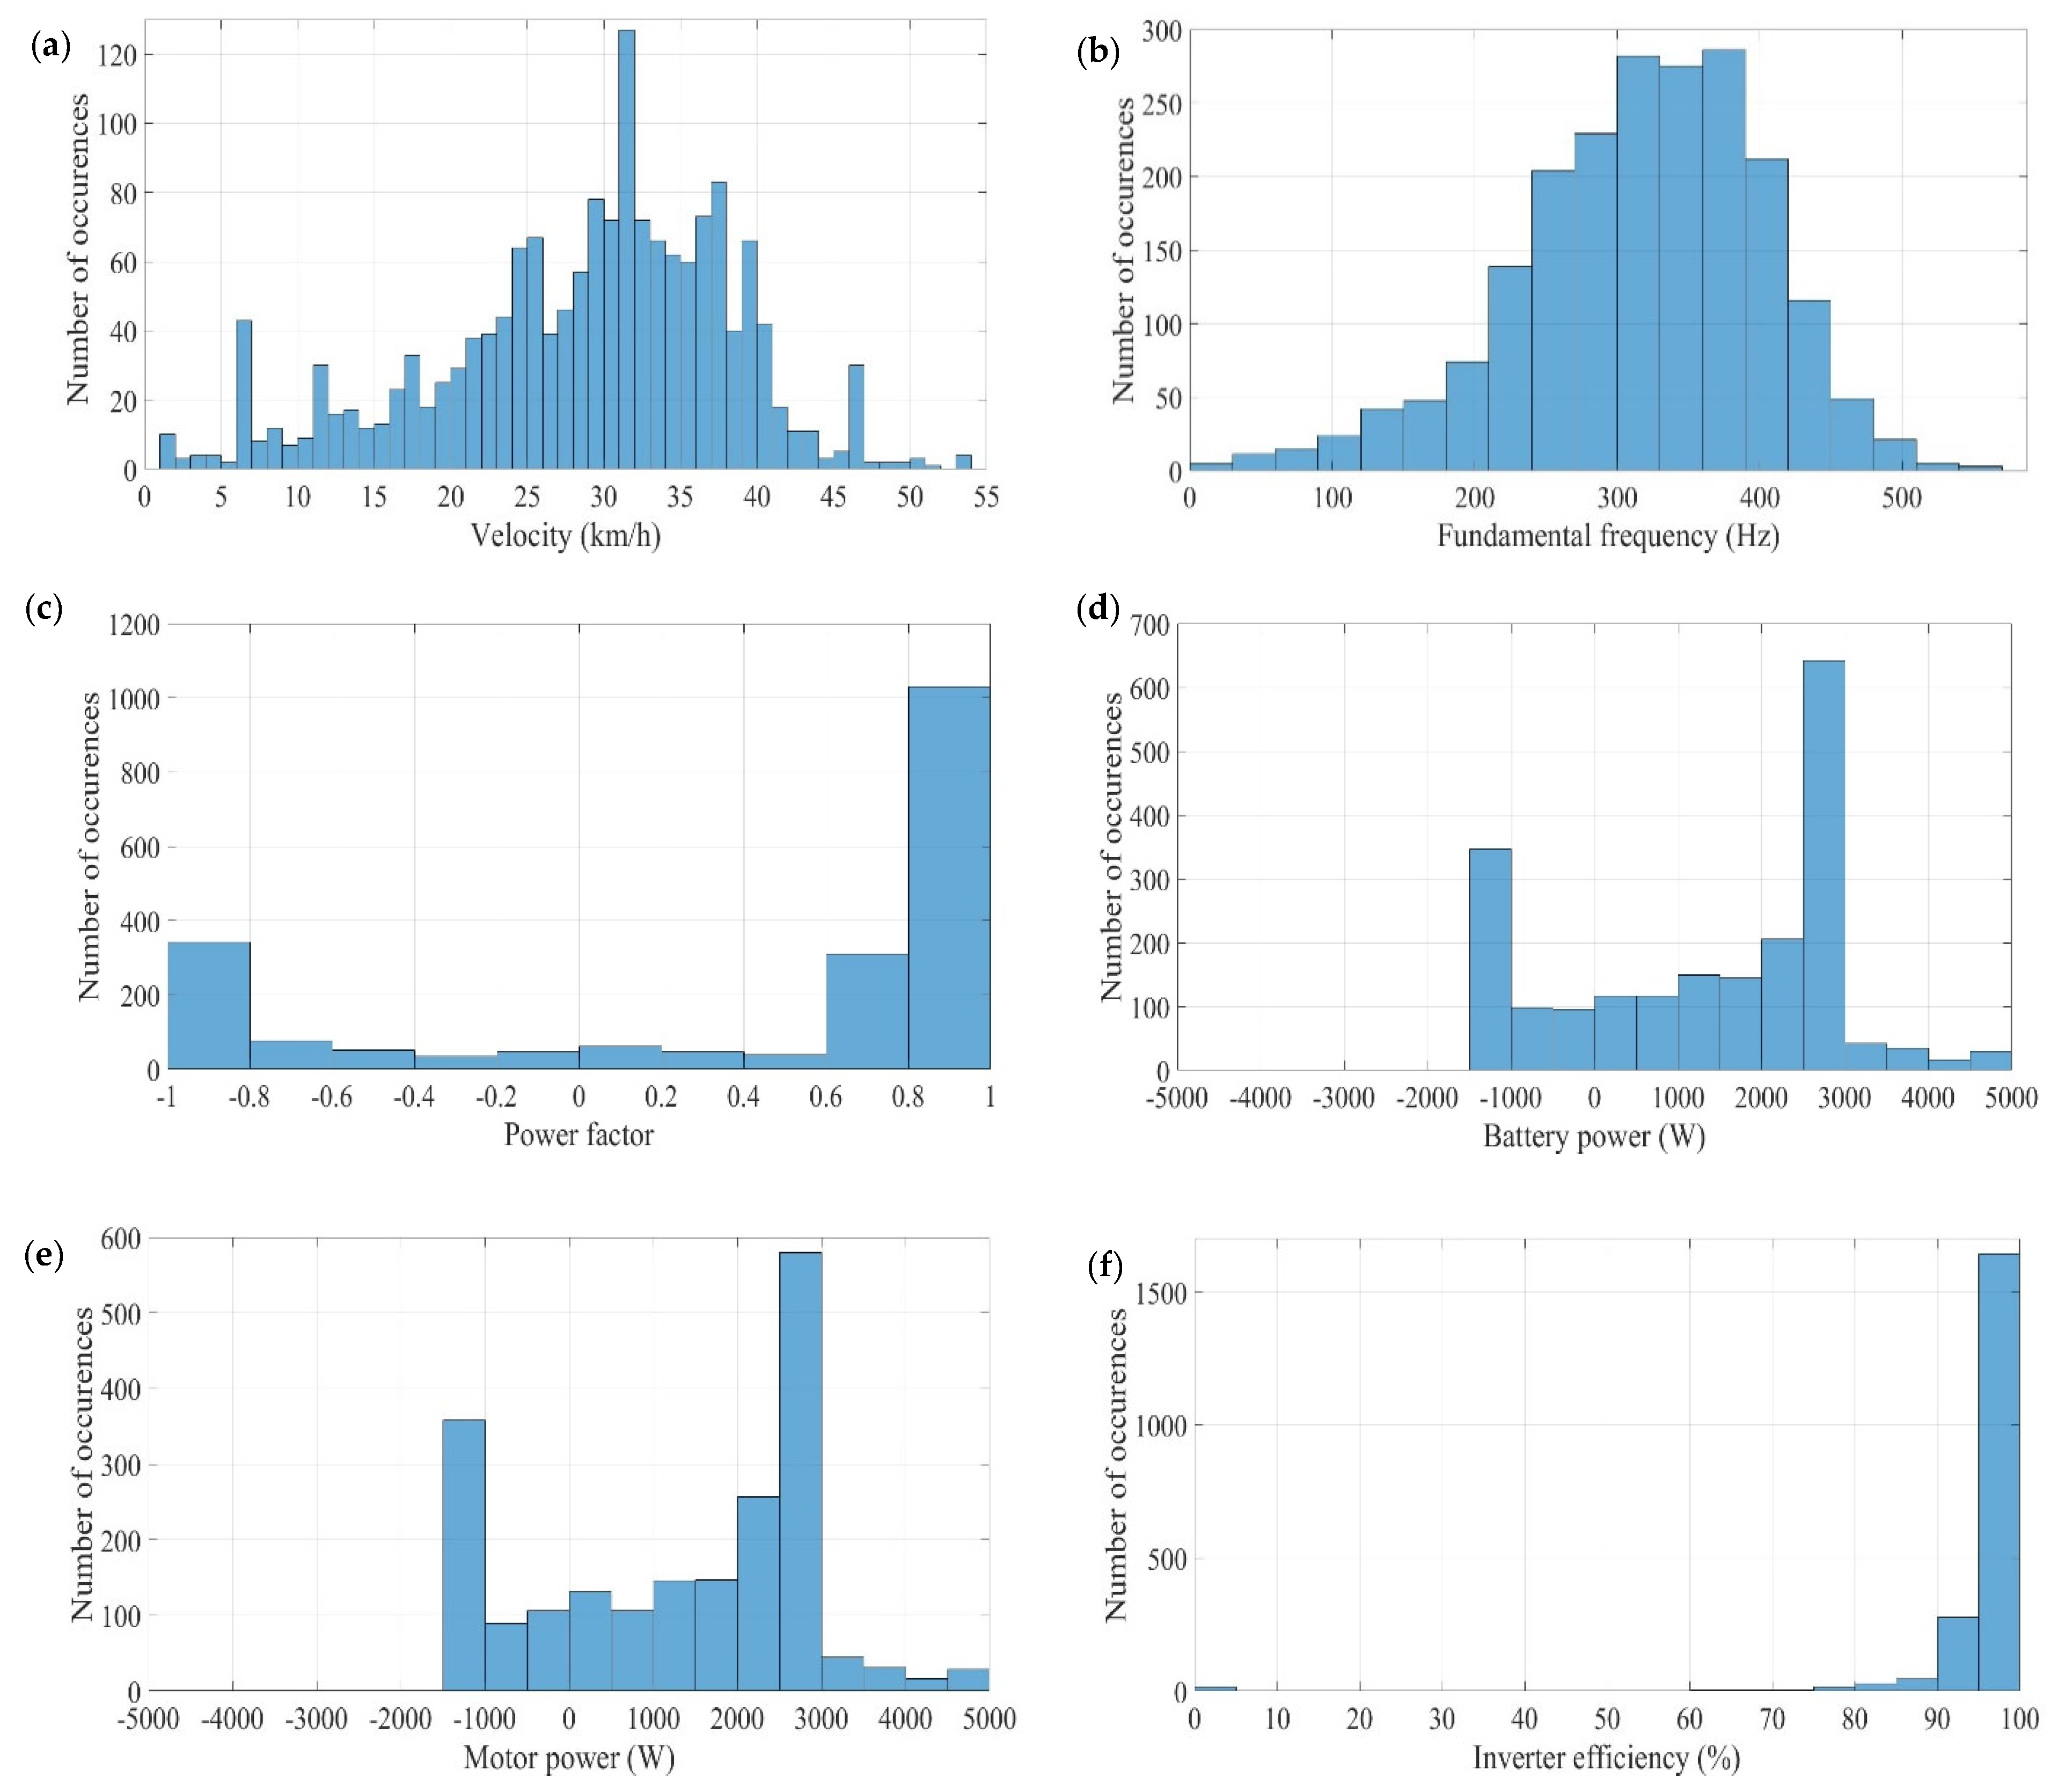
3.3. Statistical Analysis

The results discussed in the previous section do not give clear insights about what the range of velocity is that the driver drives for most of the time, in what range the motor delivers the power for most of the time, or what the inverter efficiency is for about 80% of the total drive time. To get such insights from the recorded data, a statistical analysis of the data is necessary. Statistical tools such as histograms are exceptional to other tools because of the ease of arrival to the plots and the simplicity in understanding them. These plots become extremely useful for engineers who wish to understand the behavior of the vehicle and build better versions of the vehicle in the future. These plots tell the designer about the range in which the components operate most of the time, along with the maximum and minimum values. Hence, this section provides insights from the statistical analysis of a few of the recorded parameters. Figure 12a shows the histogram plot of the velocity recorded during the drive cycle. It is observed that the driver rode the vehicle in a range of 20 to 40 km/h for almost 80% of the total drive time, and in that range he was more inclined to drive between 25 to 35 km/h, which is a plausible speed limit restriction in the academic zone. He might fall out of the range of 25–35 km/h due to some speed breaker or some sudden acceleration near the upper limit of the 25–35 km/h range. This speed range is also a desirable speed limit for an electric vehicle, as higher speeds draw higher battery currents, which further results in high heat generation in batteries, which would further reduce vehicle range. This shows that an EV driver would pay a good amount of attention to the energy use of the vehicle rather than the travel time, which is essential for someone driving an IC engine-based vehicle; this inference is in line with the results about EV driver behavior obtained in [15]. The velocity distribution has a close resemblance to a normal distribution. Looking at Figure 12b, which shows the histogram of the fundamental frequency of operation of the motor by graphical means, we can observe that the distribution closely follows a normal distribution, just like the velocity distribution. This is because the frequency of operation of a motor is further used to calculate the motor speed in rpm; with the knowledge of the number of poles in the motor, this motor rpm further boils down to the vehicle’s velocity using conventional equations. For almost 80% of the total drive time, the fundamental frequency of operation lies between 200–400 Hz. Figure 12c shows the histogram plot for the power factor of the motor, where it is observed that for around 27% of the total drive time, the motor power factor is negative, which means that the motor is under regeneration. For positive values of power factor, it is observed that for more than 69% of the time, the motor power factor is greater than 0.8 and less than 1.0, which shows an efficient operation of the motor.
Observing Figure 12d,e, which shows the histogram plots of battery and motor power, it becomes evident that both of them are almost close to each other. The reason is clear; the motor power is just a factor away from the battery power, the factor being the efficiency of the inverter unit. Both powers fall in the range of 1000–3000 W for about 56% of the total drive time, which intuitively relates to the velocity range of 25–35 km/h. The higher powers (greater than 3000 W) account for 6% of the total drive time, which relates to the velocities greater than 40 km/h. The negative values of power correspond to the occurrence of regeneration, which is about 27% of the total drive time, which matches the results obtained from the power factor plot. The final histogram plot for inverter unit efficiency is shown in Figure 12f. It can be observed that the inverter efficiency is greater than 90% for more than 94% of the total drive time and more than 95% for more than 80% of the total drive time. This depicts the high energy efficiency of the inverter unit in an electric vehicle, which is a major component in any electric vehicle. Table 2 shows the minimum, maximum, and mean values for all the major recorded parameters.

3.4. Torque Speed Characteristics and Two-Quadrant Operation of the Motor

The torque speed characteristic is a curve that is plotted between the developed torque and the rotational speed of the motor; it provides vital information about the change of torque with the increase in speed. The torque speed characteristic for any motor is an important plot, which helps engineers to understand the operation of the motor at different points, and provides valuable insights for further research and developments of the motor. In simple terms, it is a plot of torque versus speed at all the operational points. Figure 13a shows the operational torque versus speed plot for the real-time operation of the motor. The motor employed in the current vehicle is capable of performing four-quadrant operation, however, during the real-time test, the driver did not operate the vehicle in the second and fourth quadrant, due to which the scatter plot only shows the first- and fourth-quadrant operation. The region with positive speed and positive torque values is the first quadrant of operation, which is also called the forward motoring operation, and the region with positive speed and negative torque values is the fourth quadrant of operation, which is also called the forward regeneration operation. The maximum torque at which the motor operated was 9 Nm at 4413 rpm. The minimum positive torque at which the motor operated was 2.53 Nm at 5196 rpm. The point with maximum motor power corresponds to a torque of 6.1 Nm and 7433 rpm, which gives a power of around 4748 W. The maximum negative operating torque was −3.9 Nm at 2887 rpm. The point with the least motor power corresponds to a torque of −3.06 Nm and 4068 rpm, which gives a power of around −1308 W.
Figure 13b shows the histogram of the motor torque, where it is observed that for over 73% of the total driving time the torque is positive, which matches the positive motor power occurrence (which is also just over 73% of the total driving time), which further validates the methodology used to calculate the torque and other involved parameters. Further, it is observed that for 45% of the total driving time the torque ranges between 3 Nm and 6 Nm; it also makes for around 61% of the total positive torque range. Negative torque has a high occurrence, in the range of −2 Nm to −3 Nm, around 46% of the total negative range. Looking closely at the region of positive torque operation, the curve closely follows a normal distribution pattern. The motor operates between 8 Nm and 9 Nm for only around 1% of the total positive torque range and for 14% in 0 Nm to 2 Nm, which makes the motor operate in a moderate torque range for 85% of the total drive time. This shows that the motor operation is denser in the medium-torque regions compared to the low- and high-torque regions; the primary reasons for such operation is because of driving at moderate velocities and the topography of the area, where there were not many gradients on the road profile.

4. Conclusions

The present study was conducted with the motive of understanding the real-time behavior of an electric vehicle, followed by a performance analysis of the vehicle. A data acquisition system (DEWE3-A4) was successfully mounted on a two-wheeler electric vehicle with the purpose to record real-time data. The vehicle was taken out for a drive for about a period of 2040 s, during which time the real-time data of DC and AC current, voltage, and power corresponding to the battery and motor were the major parameters recorded. GPS sensors provided real-time data for distance, velocity, latitude, and longitude. The recorded data was analyzed, and several inferences on the major recorded parameters were made, lastly, the inverter efficiency was calculated for both motoring and braking operations. To conclude, this study successfully observed different components present in the powertrain of a two-wheeler electric vehicle; performed real-time data acquisition on a real-time drive of the vehicle, of which the recorded data was analyzed, and certain inferences were discussed; and finally, a simple procedure to calculate the efficiency of the inverter using the real-time recorded data was explained along with the calculation of battery SoC using the simple and effective technique of coulomb counting. The importance of the statistical aspects for such a study, along with several key inferences, were discussed, where a few inferences on driver behavior were made based on the velocity distribution. Here, the driver is more concerned about energy use and efficiency, which is contrary compared to a driver who drives an IC engine-based vehicle, who is more concerned with travel time. The inverter efficiency was found to be more than 95% for over 80% of the total driving time, and the power factor of the motor was observed to be between 0.8 and 1.0 for over 67% of the total drive time. This explains the energy-efficient operation of an electric vehicle when driven in urban areas. Finally, the torque-speed characteristics and two-quadrant operation of the motor were discussed, where it was observed that the motor operated in a way that depicts the general characteristics of operation with the standard curve at a maximum operation at 9 Nm; further, due to the nature of the road profile, the motor showed a dense operation in the medium-torque region. The nature of this work lays a foundation for a lucid understanding of the operating ranges of various components, along with the vehicle, which helps developers to design any new upgrade for similar vehicles.
The present work can be taken forward in many aspects. The current set of experiments could be further followed by a new set of experiments by recording the temperature of the battery, motor, and inverter to develop a dataset. Along with this dataset and the information on battery internal resistance, heat generation within the battery (concerning different parameters such as temperature and SoC for real-time operation) could be analyzed, which would essentially help for the development of an upgraded battery/thermal management system. The acquired real-time data could be used to train a machine learning/deep learning model, which could be further used to predict optimal operating points in terms of temperatures or power and predict driver behavior, where it becomes easier for the control systems to operate at an optimal level during the entire operation of the vehicle. These models could be used to predict range, SoC, and operating point, and could be easily integrated for the development of any vehicle with similar specifications. Further, such an analysis is also useful for designing components for small hybrid electric vehicles. This work is expected to be extended by acquiring new data sets with the four-quadrant operation of the motor, which then would provide a complete understanding of the vehicle under study. Further, the work will be complete with the development of a physics-based simulation model and a machine learning-based model to predict energy demand and compare the results with real-time acquired data.

Author Contributions

Conceptualization, R.K.J. and M.M.; data curation, D.B. and M.M.; investigation, D.B. and M.M.; methodology, D.B., R.K.J. and M.M.; resources, D.B., R.K.J. and M.M.; software and validation, D.B., R.K.J. and M.M.; writing—original draft, D.B.; writing—review and editing, D.B., and M.M. All authors have read and agreed to the published version of the manuscript.

Funding

Financial support received in part by Dewetron GmbH through project number RB22231049MEDEWE008667 is gratefully acknowledged.

Data Availability Statement

The data presented in this study are available on request from the corresponding author.

Acknowledgments

The authors of the present work would like to extend their gratitude towards Magesh Kumar S. from Dewetron GmbH for providing support to mount the data acquisition system on the vehicle and helping to conduct the real-time test. The authors are also thankful to Ashish Raghav and Pratik Mondal for helping in conducting various activities during the real-time test.

Conflicts of Interest

Divyakumar Bhavsar and Mayank Mittal are employees of Indian Institute of Technology Madras and Ramesh Kaipakam Jaychandra is an employee of Dewetron GmbH. The paper reflects the views of the scientists, and not the company.

References

  1. Bae, C.; Kim, J. Alternative fuels for internal combustion engines. Proc. Combust. Inst. 2017, 36, 3389–3413. [Google Scholar] [CrossRef]
  2. Barbosa, F.C. Natural Gas and Biogas Use in Transit Bus Fleets—A Technical, Operational and Environmental Approach; SAE Paper No. 2014-36-0194; SAE: Warrendale, PA, USA, 2014. [Google Scholar]
  3. Kurien, C.; Mittal, M. Review on the production and utilization of green ammonia as an alternate fuel in dual-fuel compression ignition engines. Energy Convers. Manag. 2022, 251, 114990. [Google Scholar] [CrossRef]
  4. Duronioa, F.; Vitaa, A.D.; Alloccab, L.; Anatonea, M. Gasoline direct injection engines—A review of latest technologies and trends. Part 1: Spray breakup process. Fuel 2020, 265, 116948. [Google Scholar] [CrossRef]
  5. Duronioa, F.; Vitaa, A.D.; Montanarob, A.; Villantea, C. Gasoline direct injection engines—A review of latest technologies and trends. Part 2. Fuel 2020, 265, 116947. [Google Scholar] [CrossRef]
  6. Jose, J.V.; Mittal, M.; Ramesh, A. Development of a Small-Bore Gasoline Direct-Injection Engine, and Enhancement of Its Performance Using Multiple-Injection Strategies. SAE Int. J. Engines 2021, 14, 115–133. [Google Scholar] [CrossRef]
  7. Kalghatgi, G.; Agarwal, A.K.; Goyal, H.; Houidi, M.B. Introduction to Gasoline Compression Ignition Technology: Future Prospects Gasoline Compression Ignition Technology. In Energy, Environment, and Sustainability; Springer: Singapore, 2022. [Google Scholar] [CrossRef]
  8. Cung, K.; Moiz, A.A.; Smith, E.M., III; Bitsis, D.C., Jr.; Michlberger, A.; Briggs, T.; Miwa, J. Gasoline compression ignition (GCI) combustion of pump-grade gasoline fuel under high compression ratio diesel engine. Transp. Eng. 2021, 4, 100066. [Google Scholar] [CrossRef]
  9. Krishnasamy, A.; Gupta, S.K.; Reitz, R.D. Prospective fuels for diesel low temperature combustion engine applications: A critical review. Int. J. Engine Res. 2021, 22, 2071–2106. [Google Scholar] [CrossRef]
  10. Choi, D.; Miles, P.C.; Yun, H.; Reitz, R.D. A Parametric Study of Low-Temperature, Late-Injection Combustion in a HSDI Diesel Engine. JSME Int. J. Ser. B Fluids Therm. Eng. 2005, 48, 656–664. [Google Scholar] [CrossRef]
  11. Ramesh, N.; Mallikarjuna, J.M. Low temperature combustion strategy in an off-highway diesel engine—Experimental and CFD study. Appl. Therm. Eng. 2017, 124, 844–854. [Google Scholar] [CrossRef]
  12. Yang, Q.; Tian, S.; Wang, Z.; Xu, B. Adaptive Hybrid Thermostat Control Strategy for Series Hybrid Electric Vehicles; SAE Technical Paper 2021-01-7024; SAE: Warrendale, PA, USA, 2021. [Google Scholar]
  13. Bhavsar, D.; Nirapure, P.; Kanupriya, M.; Mittal, M. Modeling and Simulation of Energy Management for a Hybrid Electric Two-Wheeler. In Proceedings of the International Conference on Electrical, Computer, Communications and Mechatronics Engineering, Tenerife, Canary Islands, Spain, 19–21 July 2023. [Google Scholar] [CrossRef]
  14. Trovao, J.P.F.; Santos, V.D.; Antunes, C.H.; Pereirinha, P.G.; Jorge, H.M. A Real-Time Energy Management Architecture for Multisource Electric Vehicles. IEEE Trans. Ind. Electron. 2015, 62, 3223–3233. [Google Scholar] [CrossRef]
  15. Jinglai, W.; Jiageng, R.; Nong, Z.; Paul, D.W. An Optimized Real-Time Energy Management Strategy for the Power-Split Hybrid Electric Vehicles. IEEE Trans. Control. Syst. Technol. 2019, 27, 1194–1202. [Google Scholar] [CrossRef]
  16. Iora, P.; Tribioli, L. Effect of Ambient Temperature on Electric Vehicles’ Energy Consumption and Range: Model Definition and Sensitivity Analysis Based on Nissan Leaf Data. World Electr. Veh. J. 2019, 10, 2. [Google Scholar] [CrossRef]
  17. Fiori, C.; Ahn, K.; Rakha, H.A. Power-based electric vehicle energy consumption model: Model development and validation. Appl. Energy 2016, 168, 257–268. [Google Scholar] [CrossRef]
  18. Zhang, R.; Yao, E. Electric vehicles’ energy consumption estimation with real driving condition data. Transp. Res. Part D 2015, 41, 177–187. [Google Scholar] [CrossRef]
  19. Yang, S.C.; Li, M.; Lin, Y.; Tang, T.Q. Electric vehicle’s electricity consumption on a road with different slope. Phys. A Stat. Mech. Appl. 2014, 402, 41–48. [Google Scholar] [CrossRef]
  20. Kolachalama, S.; Surti, I.; Malik, H. Interpretation of the Electric Vehicle Operating Point in Real Time; Experimental Results; SAE: Warrendale, PA, USA; Volume 4, pp. 1–9. [CrossRef]
  21. Kolachalama, S.; Malik, H. Neural Network Model to Predict the Thermal Operating Point of an Electric Vehicle; SAE Technical Paper 2023-01-0134; SAE: Warrendale, PA, USA, 2023. [Google Scholar] [CrossRef]
  22. Wu, X.; Freese, D.; Cabrera, A.; Kitch, W.A. Electric vehicles’ energy consumption measurement and estimation. Transp. Res. Part D 2015, 34, 52–67. [Google Scholar] [CrossRef]
  23. Al-Wreikat, Y.; Serrano, C.; Sodr, J.R. Effects of ambient temperature and trip characteristics on the energy consumption of an electric vehicle. Energy 2022, 238, 122028. [Google Scholar] [CrossRef]
  24. Dost, P.; Spichartz, P.; Sourkounis, C. Temperature influence on state-of-the-art electric vehicles’ consumption based on fleet measurements. In Proceedings of the 2015 International Conference on Electrical Systems for Aircraft, Railway, Ship Propulsion and Road Vehicles (ESARS), Aachen, Germany, 3–5 March 2015; pp. 1–6. [Google Scholar] [CrossRef]
  25. Steinstraeter, M.; Buberger, J.; Minnerup, K.; Trifonov, D.; Horner, P.; Weiss, B.; Lienkamp, M. Controlling cabin heating to improve range and battery lifetime of electric vehicles. eTransportation 2022, 13, 100181. [Google Scholar] [CrossRef]
  26. Sato, S.; Jiang, Y.J.; Russell, R.L.; Miller, J.W.; Karavalakis, G.; Durbin, T.D.; Johnson, K.C. Experimental driving performance evaluation of battery-powered medium and heavy duty all-electric vehicles. Int. J. Electr. Power Energy Syst. 2022, 141, 108100. [Google Scholar] [CrossRef]
  27. Hairr, M.E.; Griffith, P.; Bailey, J.R.; Madden, W. Data Acquisition System for Electric- and Hybrid-Electric Buses. World Electr. Veh. J. 2009, 3, 413–419. [Google Scholar] [CrossRef]
  28. Kersten, A.; Kuder, M.; Grunditz, E.; Geng, Z.; Wikner, E.; Thiringer, T.; Weyh, T.; Eckerle, R. Inverter and Battery Drive Cycle Efficiency Comparisons of CHB and MMSP Traction Inverters for Electric Vehicles. In Proceedings of the 21st European Conference on Power Electronics and Applications, EPE 2019 ECCE Europe, Genova, Italy, 3–5 September 2019; pp. 1–12. [Google Scholar] [CrossRef]
  29. Pou, J.; Osorno, D.; Zaragoza, J.; Jaen, C.; Ceballos, S. Power losses calculation methodology to evaluate inverter efficiency in electrical vehicles. In Proceedings of the 2011 7th International Conference-Workshop Compatibility and Power Electronics (CPE), Tallinn, Estonia, 1–3 June 2011; pp. 404–409. [Google Scholar] [CrossRef]
  30. Hayashi, K.; Ijima, T.; Kobayashi, H. Power Measurement in the Development of EV Motors and Inverters; Hioki Technical Article; Hioki E.E.Corporation: Nagano, Japan, 2022. [Google Scholar]
Figure 1. (a) Vehicle under test, (b) DC/DC converter and rectifier unit, (c) sealed battery pack, (d) inverter and motor control unit, and (e) three-phase PMSM.
Wevj 15 00121 g001
Figure 2. Vehicle being taken out for real-time testing.
Wevj 15 00121 g002
Figure 3. Block diagram of vehicle architecture.
Wevj 15 00121 g003
Figure 4. Topology of the inverter.
Wevj 15 00121 g004
Figure 5. Input and output to the inverter.
Wevj 15 00121 g005
Figure 6. (a) Route map and (b) velocity profile.
Wevj 15 00121 g006
Figure 7. (a) Battery current and (b) battery voltage.
Wevj 15 00121 g007
Figure 8. (a) Per phase motor current and (b) per phase motor voltage.
Wevj 15 00121 g008
Figure 9. (a) Battery power and (b) motor power.
Wevj 15 00121 g009
Figure 10. (a) Inverter efficiency and (b) DC power v/s DC current.
Wevj 15 00121 g010
Figure 11. Battery SoC plot.
Wevj 15 00121 g011
Figure 12. Histograms of (a) Velocity, (b) fundamental frequency, (c) power factor, (d) battery power, (e) motor power, and (f) inverter efficiency.
Wevj 15 00121 g012
Figure 13. (a) Torque speed characteristics of the motor and (b) histogram of motor torque.
Wevj 15 00121 g013
Table 1. Specifications of the vehicle.
ParameterSpecification
Mass of the vehicle133 kg
Total mass (vehicle + riders + system)290 kg
Tire diameter304.8 mm
Top speed63 km/h
Maximum torque20 Nm at 1950 rpm
Vehicle range90 km (Eco mode) under standard conditions
Battery typeLithium-ion battery
Battery voltage50.4 V
Battery capacity57.24 Ah
Battery energy capacity2.9 kWh
Auxiliary battery12 V 3 Ah VRLAs
Charging supply specifications230 V, 5A, 50 Hz AC supply
Power electronic converter (AC to DC)Input: 160 to 265 V, 5.7 A max., 50 Hz
Output: 50 V, 16 A, 800 W
Motor type3-phase AC permanent magnet synchronous 8-pole machine
Continuous power4.1 kW
TransmissionSingle Speed Constant Mesh Gear Box
Table 2. Statistical values of the recorded data.
ParameterMinimumMaximumMean
Velocity (km/h)053.423.1
Battery current (A) (avg.)−24.310528.4
Battery voltage (V) (avg.)45.852.649
Battery power (W) (avg.)−1247.84833.71353
Motor voltage (V) (RMS per phase)03629.6
Motor current (A) (RMS per phase)094.142.5
Motor Power (W) (avg.)−1308.24747.51287.2
Inverter efficiency (%)099.795
Disclaimer/Publisher’s Note: The statements, opinions and data contained in all publications are solely those of the individual author(s) and contributor(s) and not of MDPI and/or the editor(s). MDPI and/or the editor(s) disclaim responsibility for any injury to people or property resulting from any ideas, methods, instructions or products referred to in the content.

