


Determination of the Performance Characteristics of a Traction Battery in an Electric Vehicle

 ,
,  ,
,  , ,
, ,
Abstract
1. Introduction
2. Materials and Methods
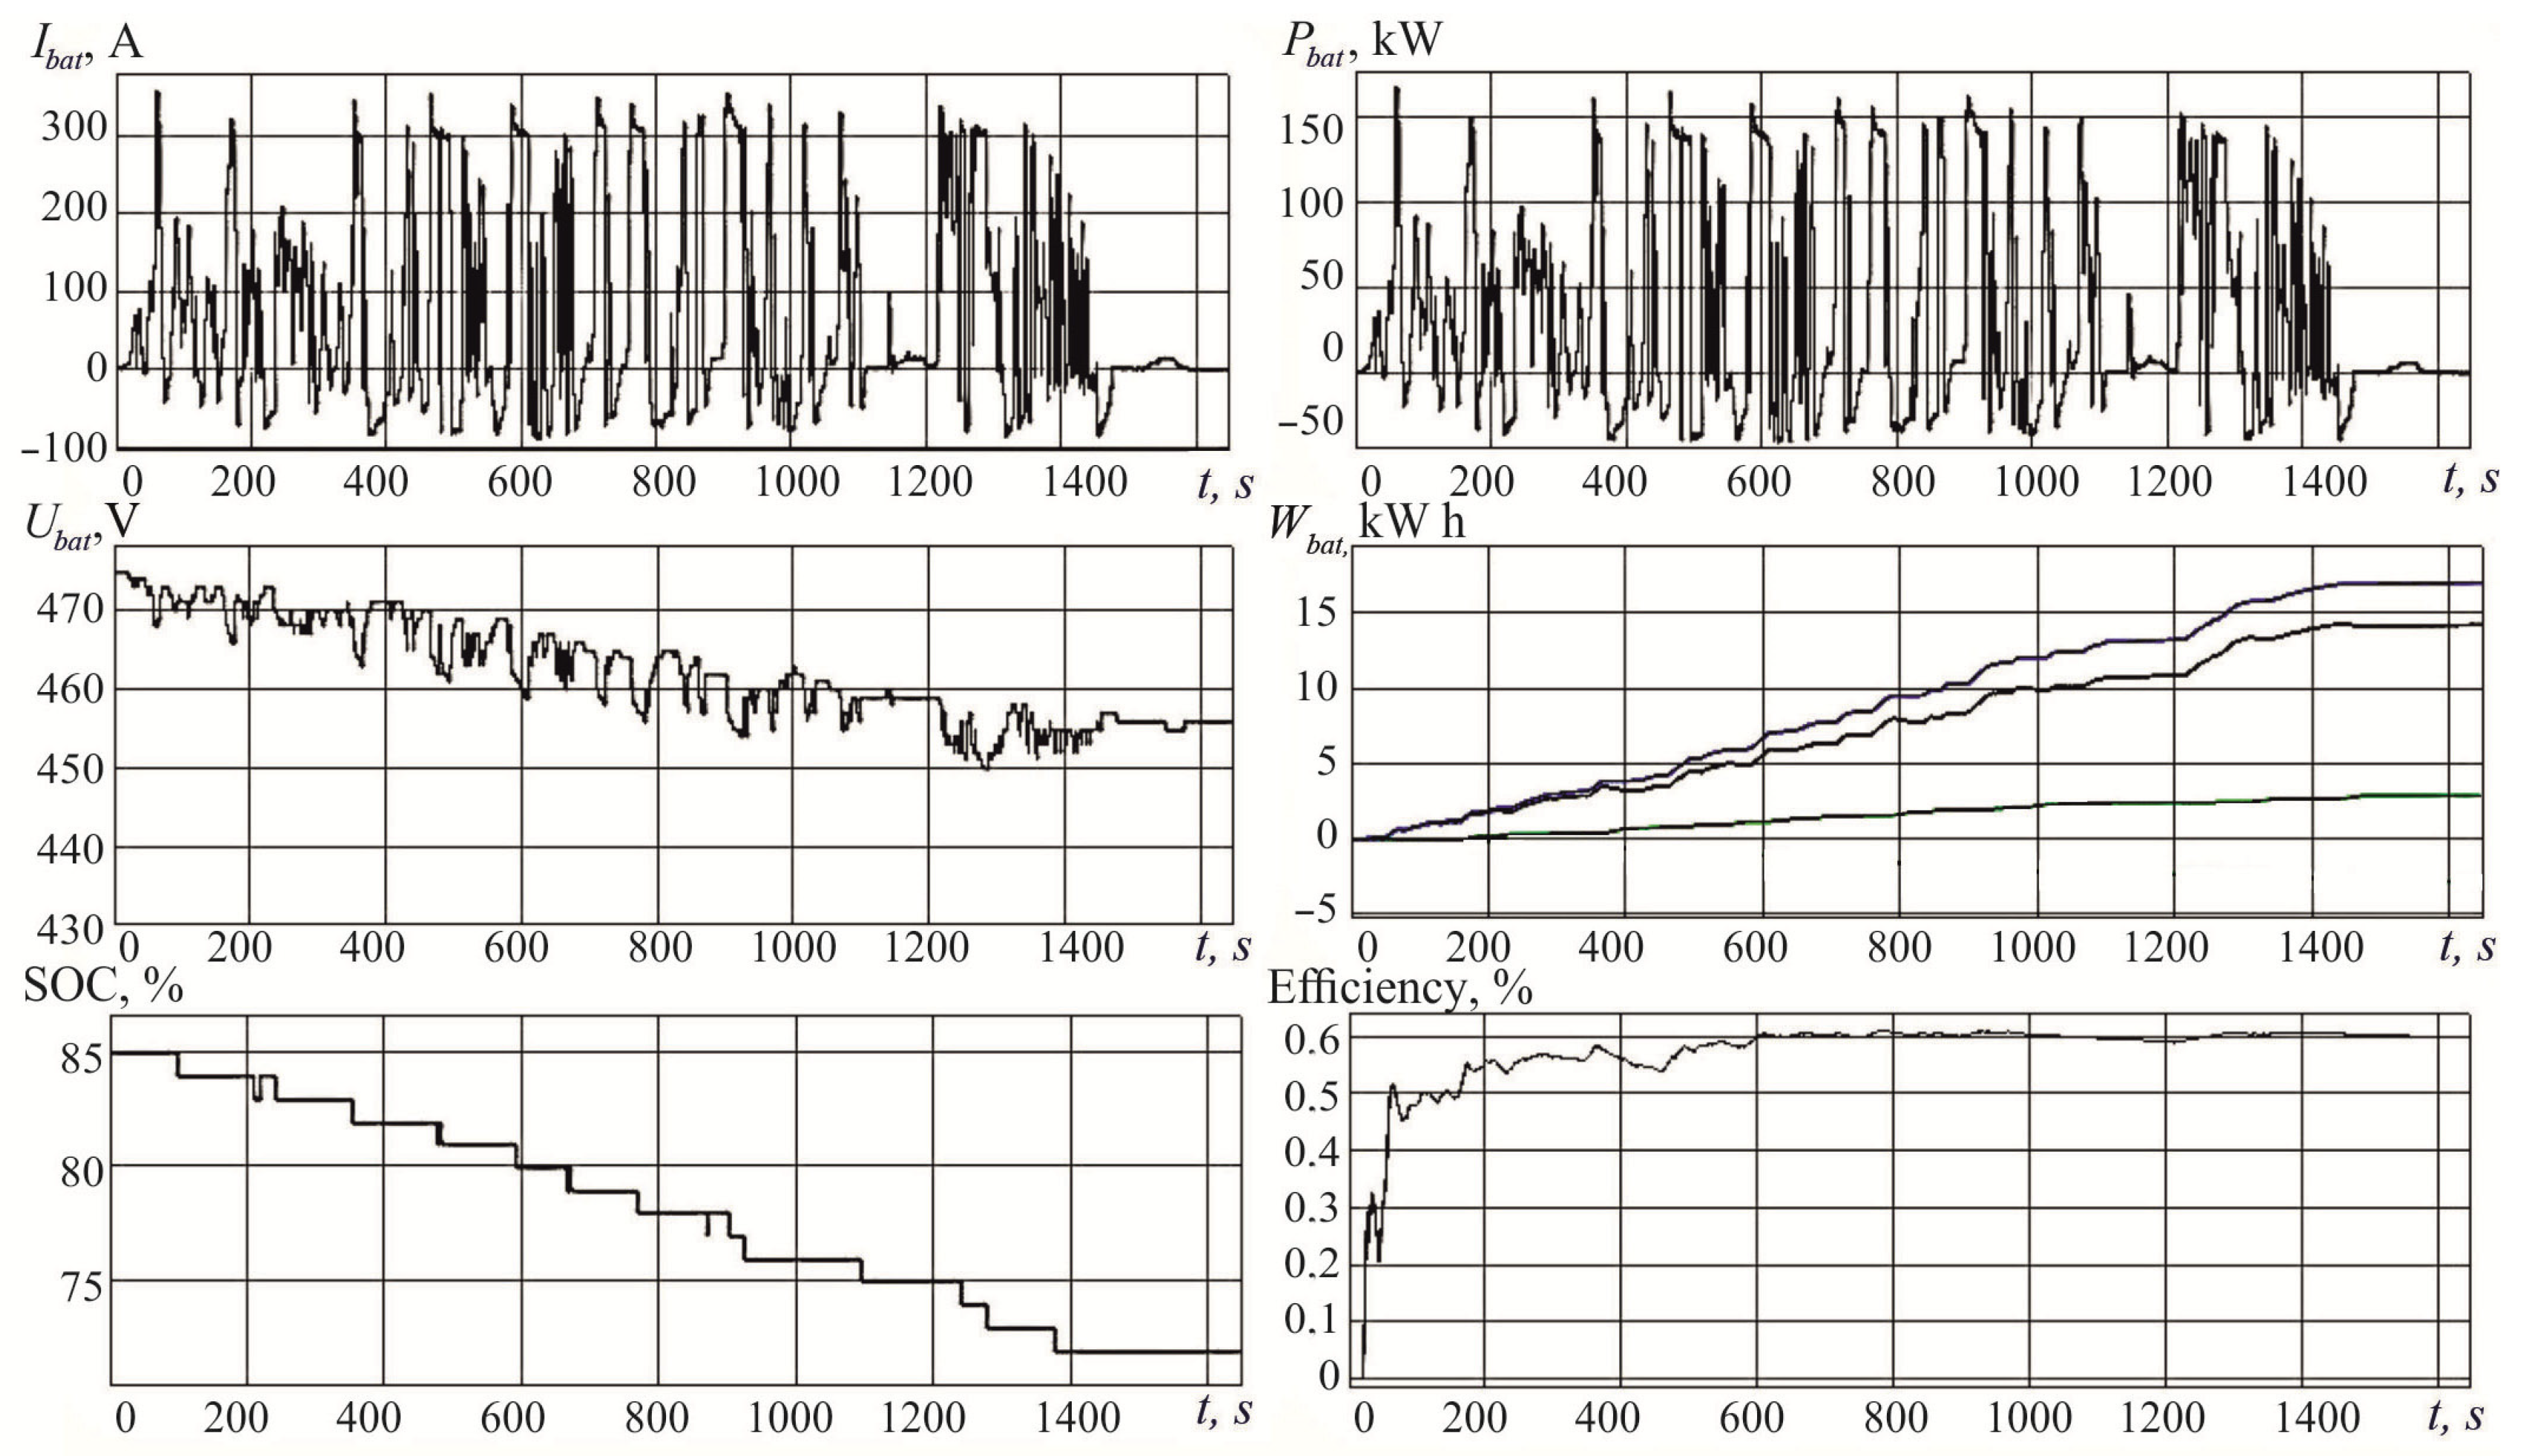
- The degree of charge of the battery;
- Torques of asynchronous electric motors;
- Temperature of electric motors and inverters;
- The battery voltage;
- The rotation frequency of the electric motor.
- Determining the depth of discharge of batteries during vehicle operation;
- Modelling the traction electrical system of an electric truck;
- Traction battery modelling;
- Modelling a system for the calculation of traction forces on a shaft in the electric motors.
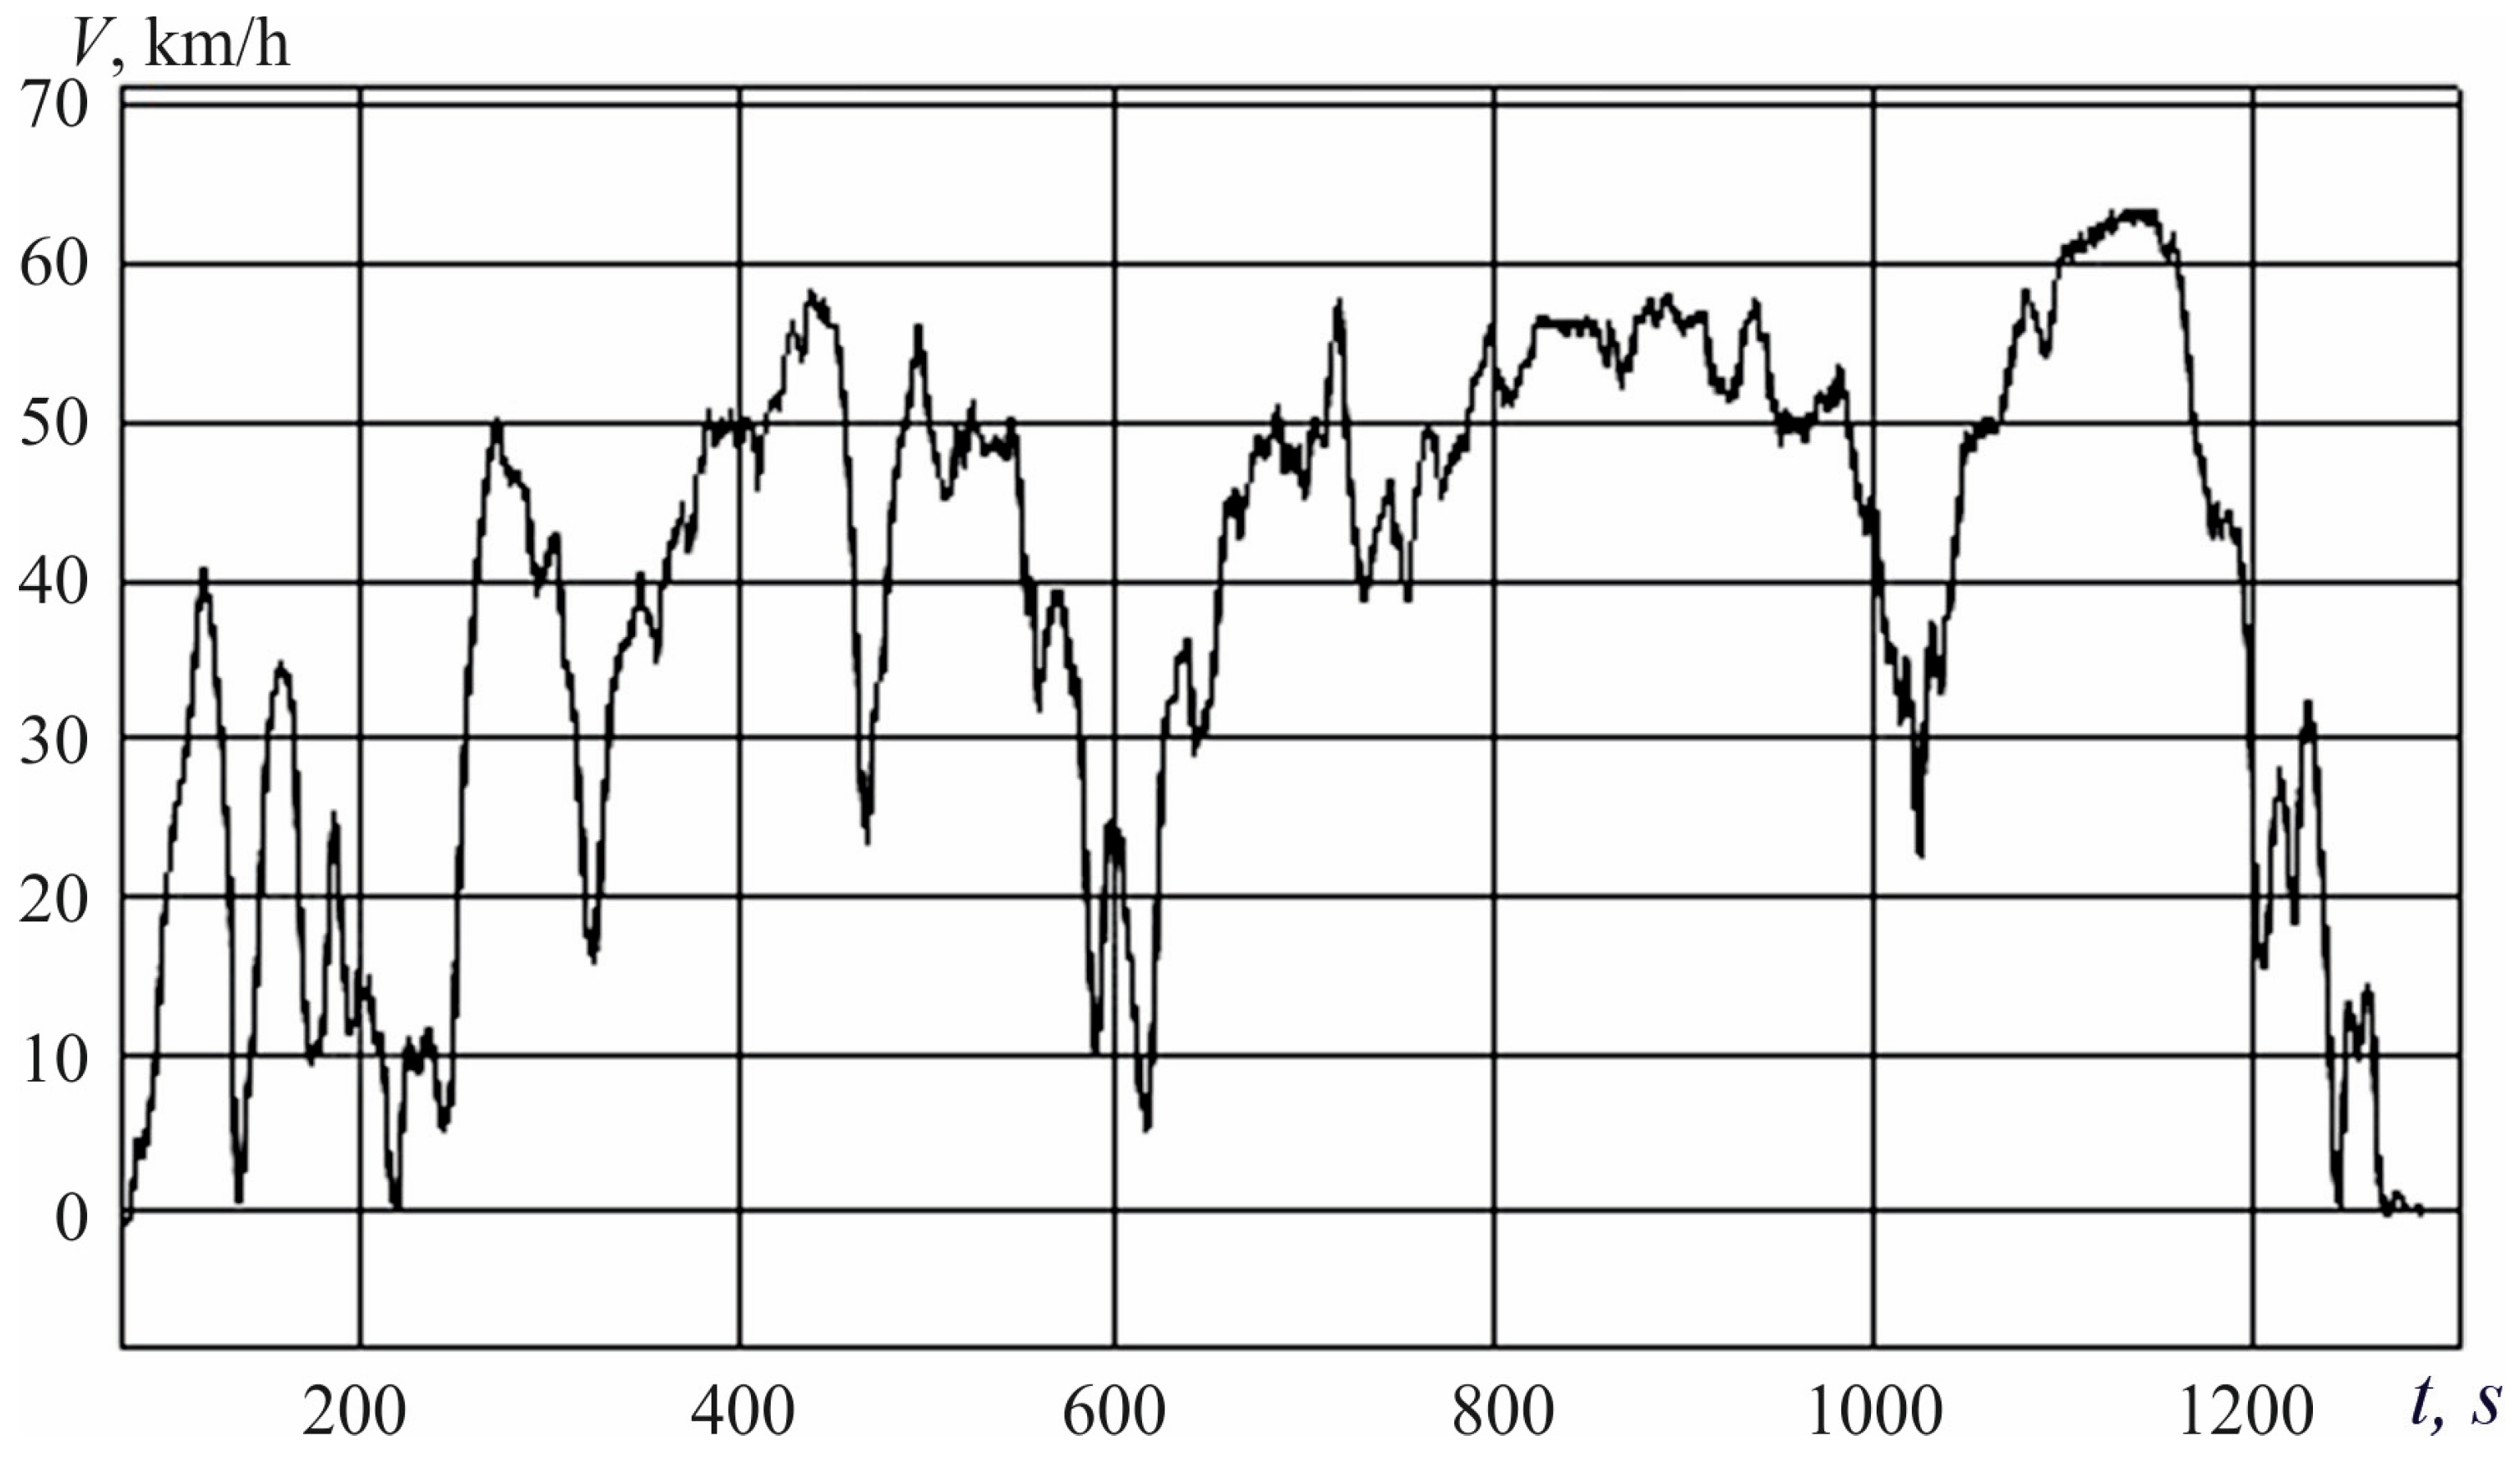
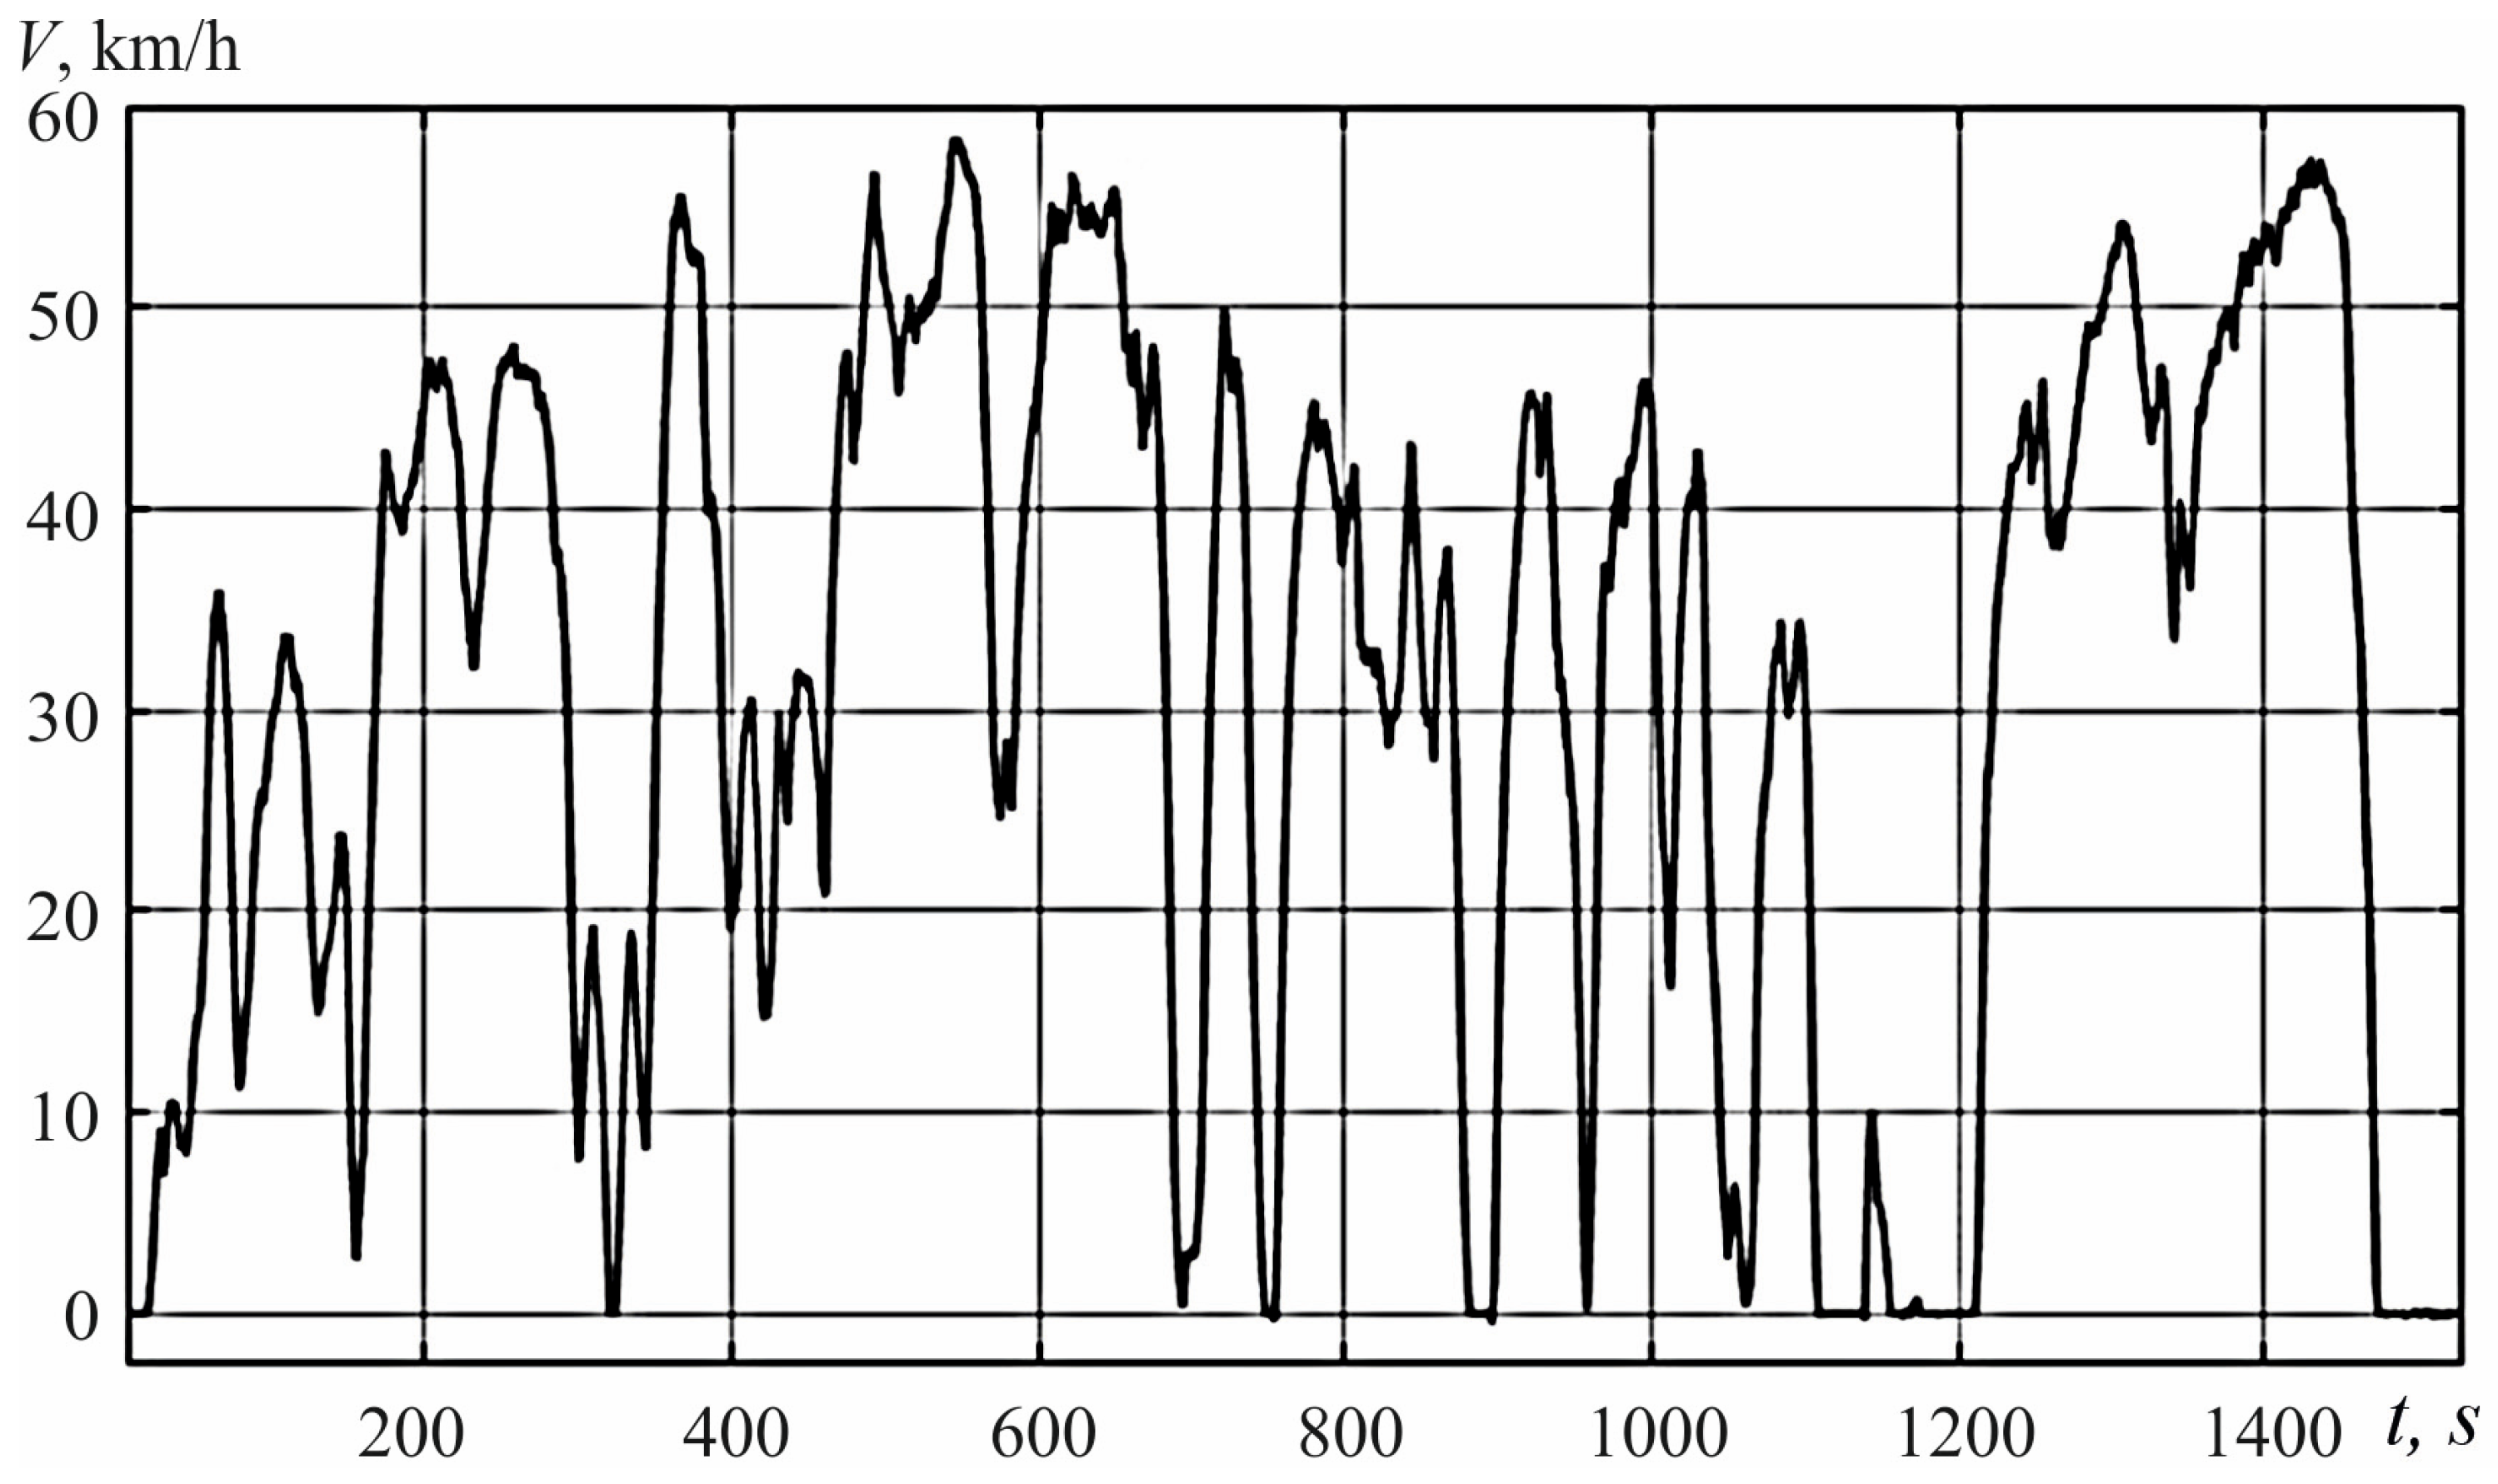
3. Determining the Depth of Discharge of Batteries during Vehicle Operation
4. Mathematical Modelling of the Traction Electrical System in an Electric Truck
- The development of a mathematical model that takes into account the mechanical characteristics of the vehicle;
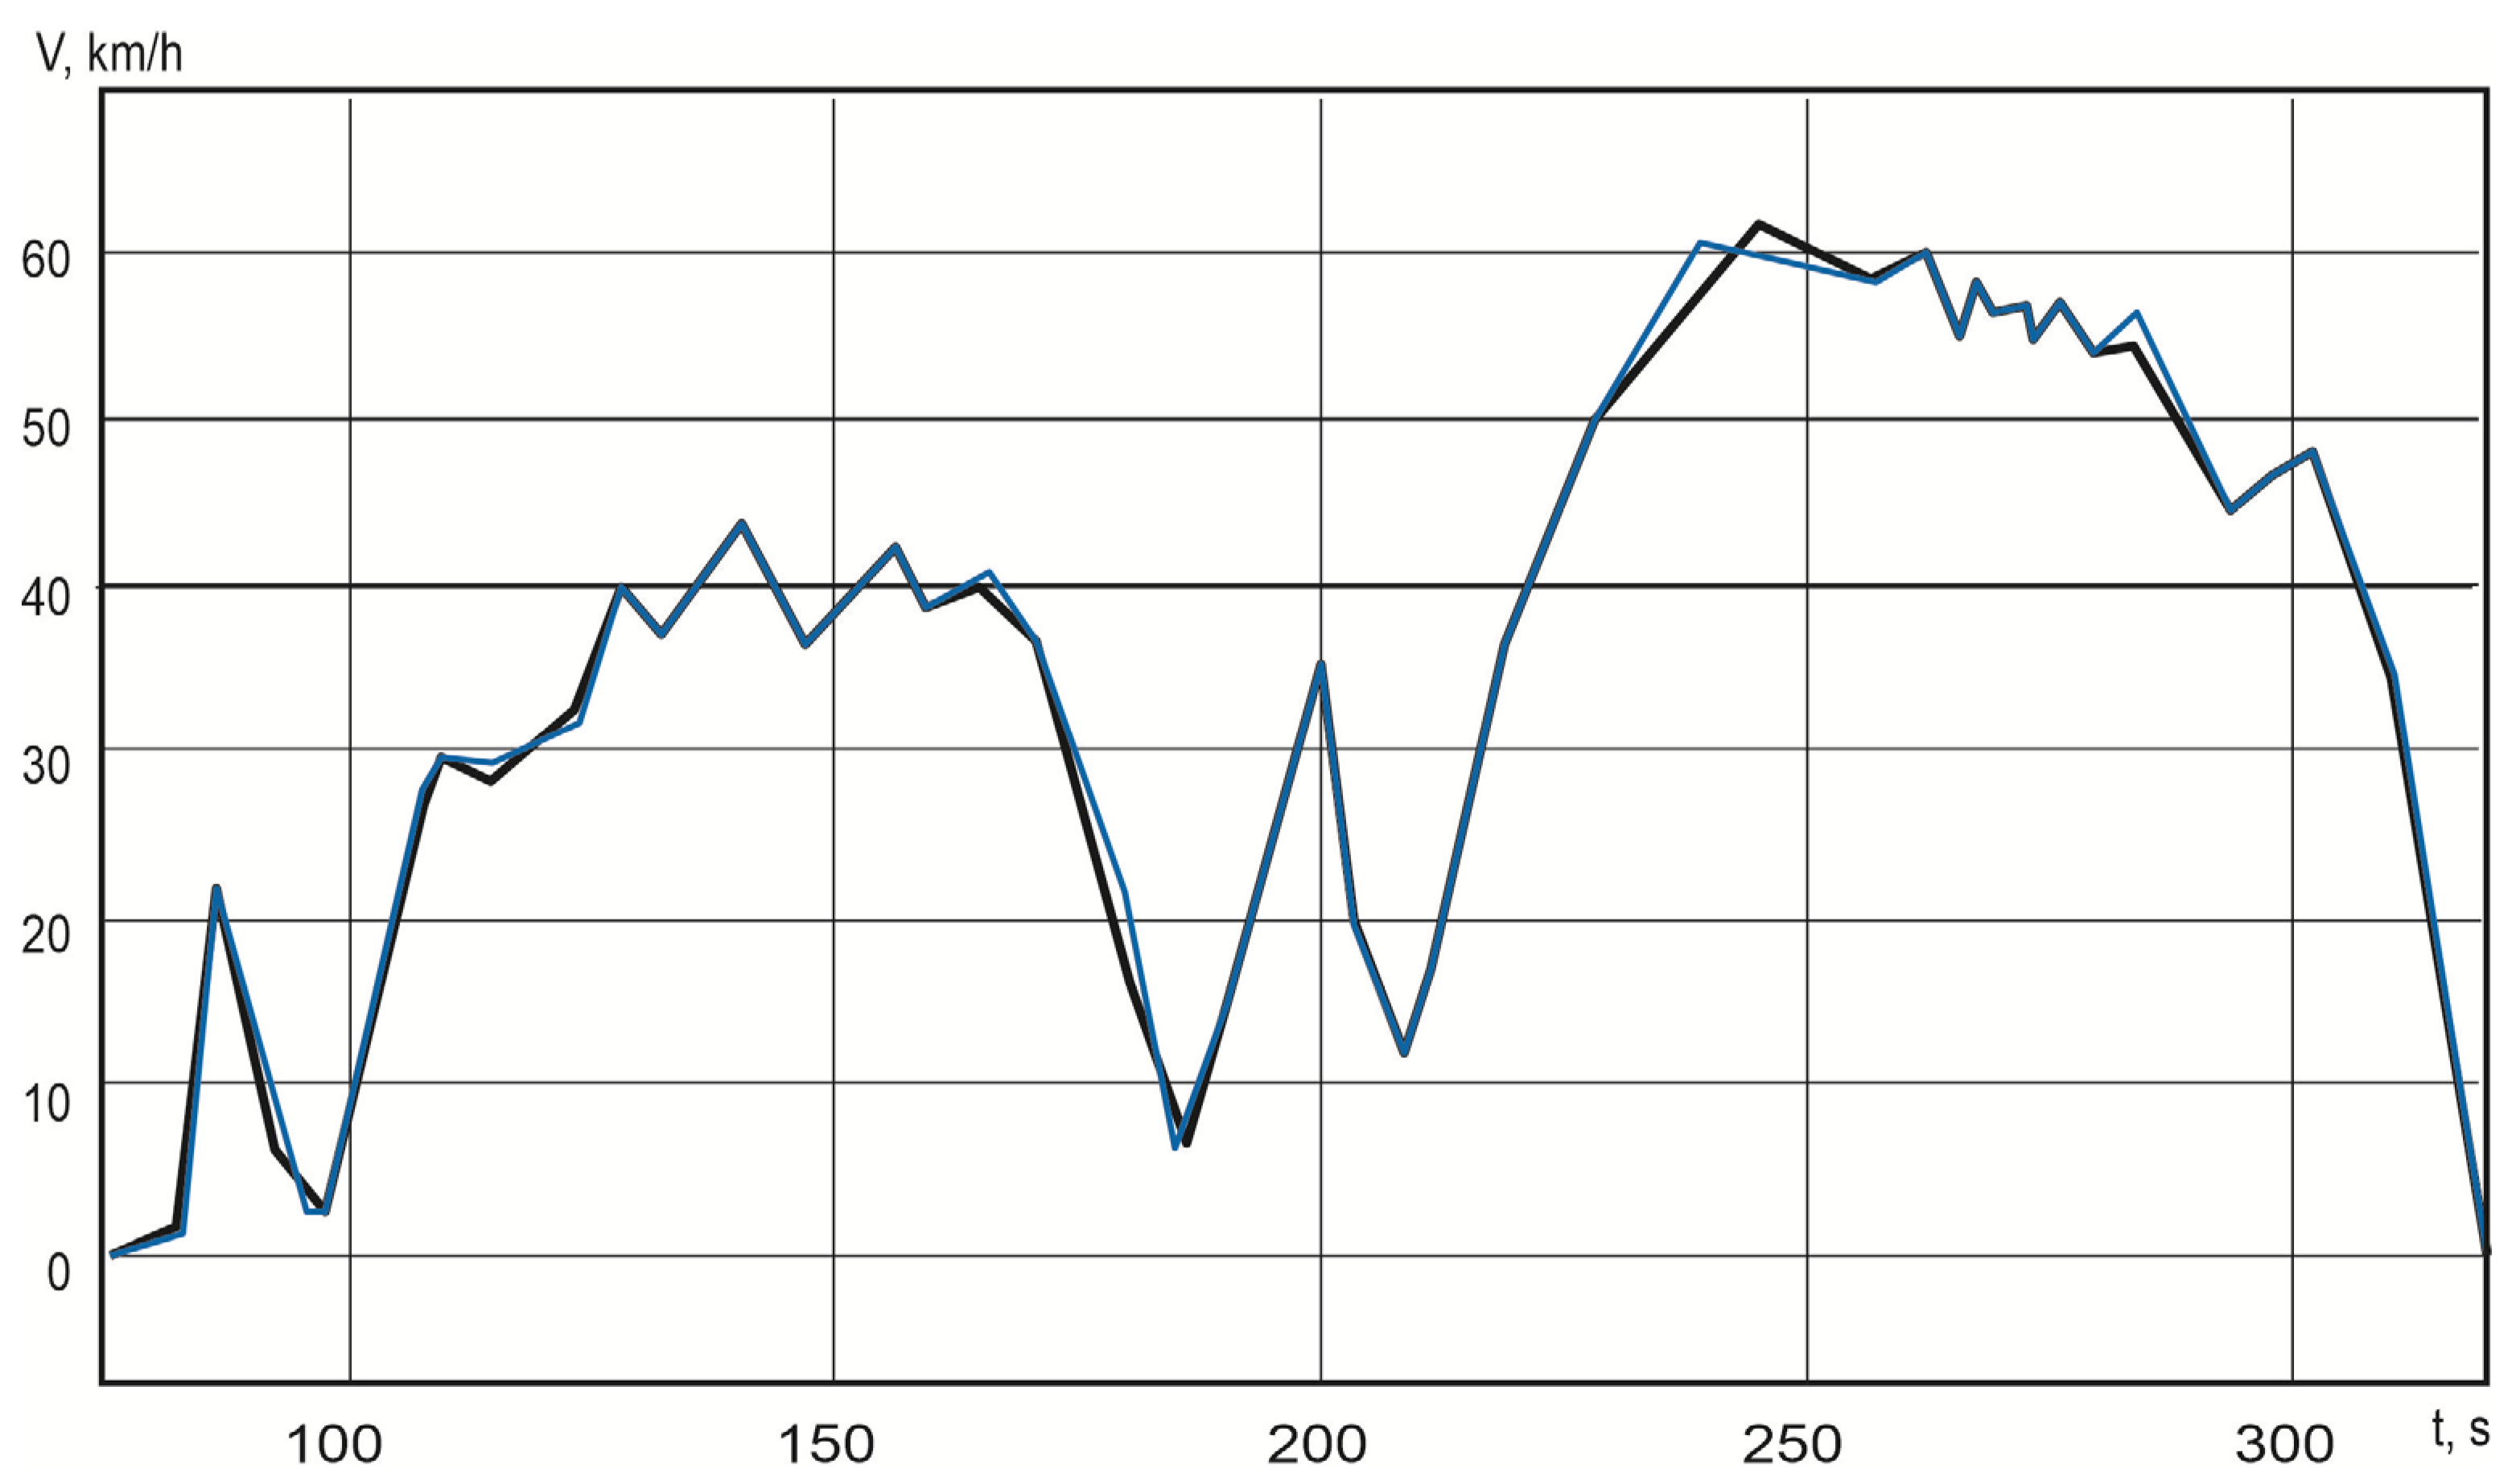
- Verification of the obtained data with the results of vehicle test runs by comparing the acceleration characteristics in the simulation with real characteristics when driving according to an acceleration cycle along a straight road;
- The integration of a mechanical model into the electrical model in order to calculate the energy performance, reliable traction electrical system (TES) parameters and vehicle dynamics (VD).
- -
- Required traction force on the drive wheels
- -
- the required torque on drive wheels is:
- -
- the speed of the TM shaft rotation is:
- -
- the required torque on the TM shaft is:
- -
- the drag torque on the electric vehicle (EV) shaft is:
- -
- the required power on the shaft of the TM is calculated by the following formula, kW:
- -
- The actual speed of the vehicle is calculated according to the speed of the TM shaft using the following expression:
- -
- EV acceleration is as follows:
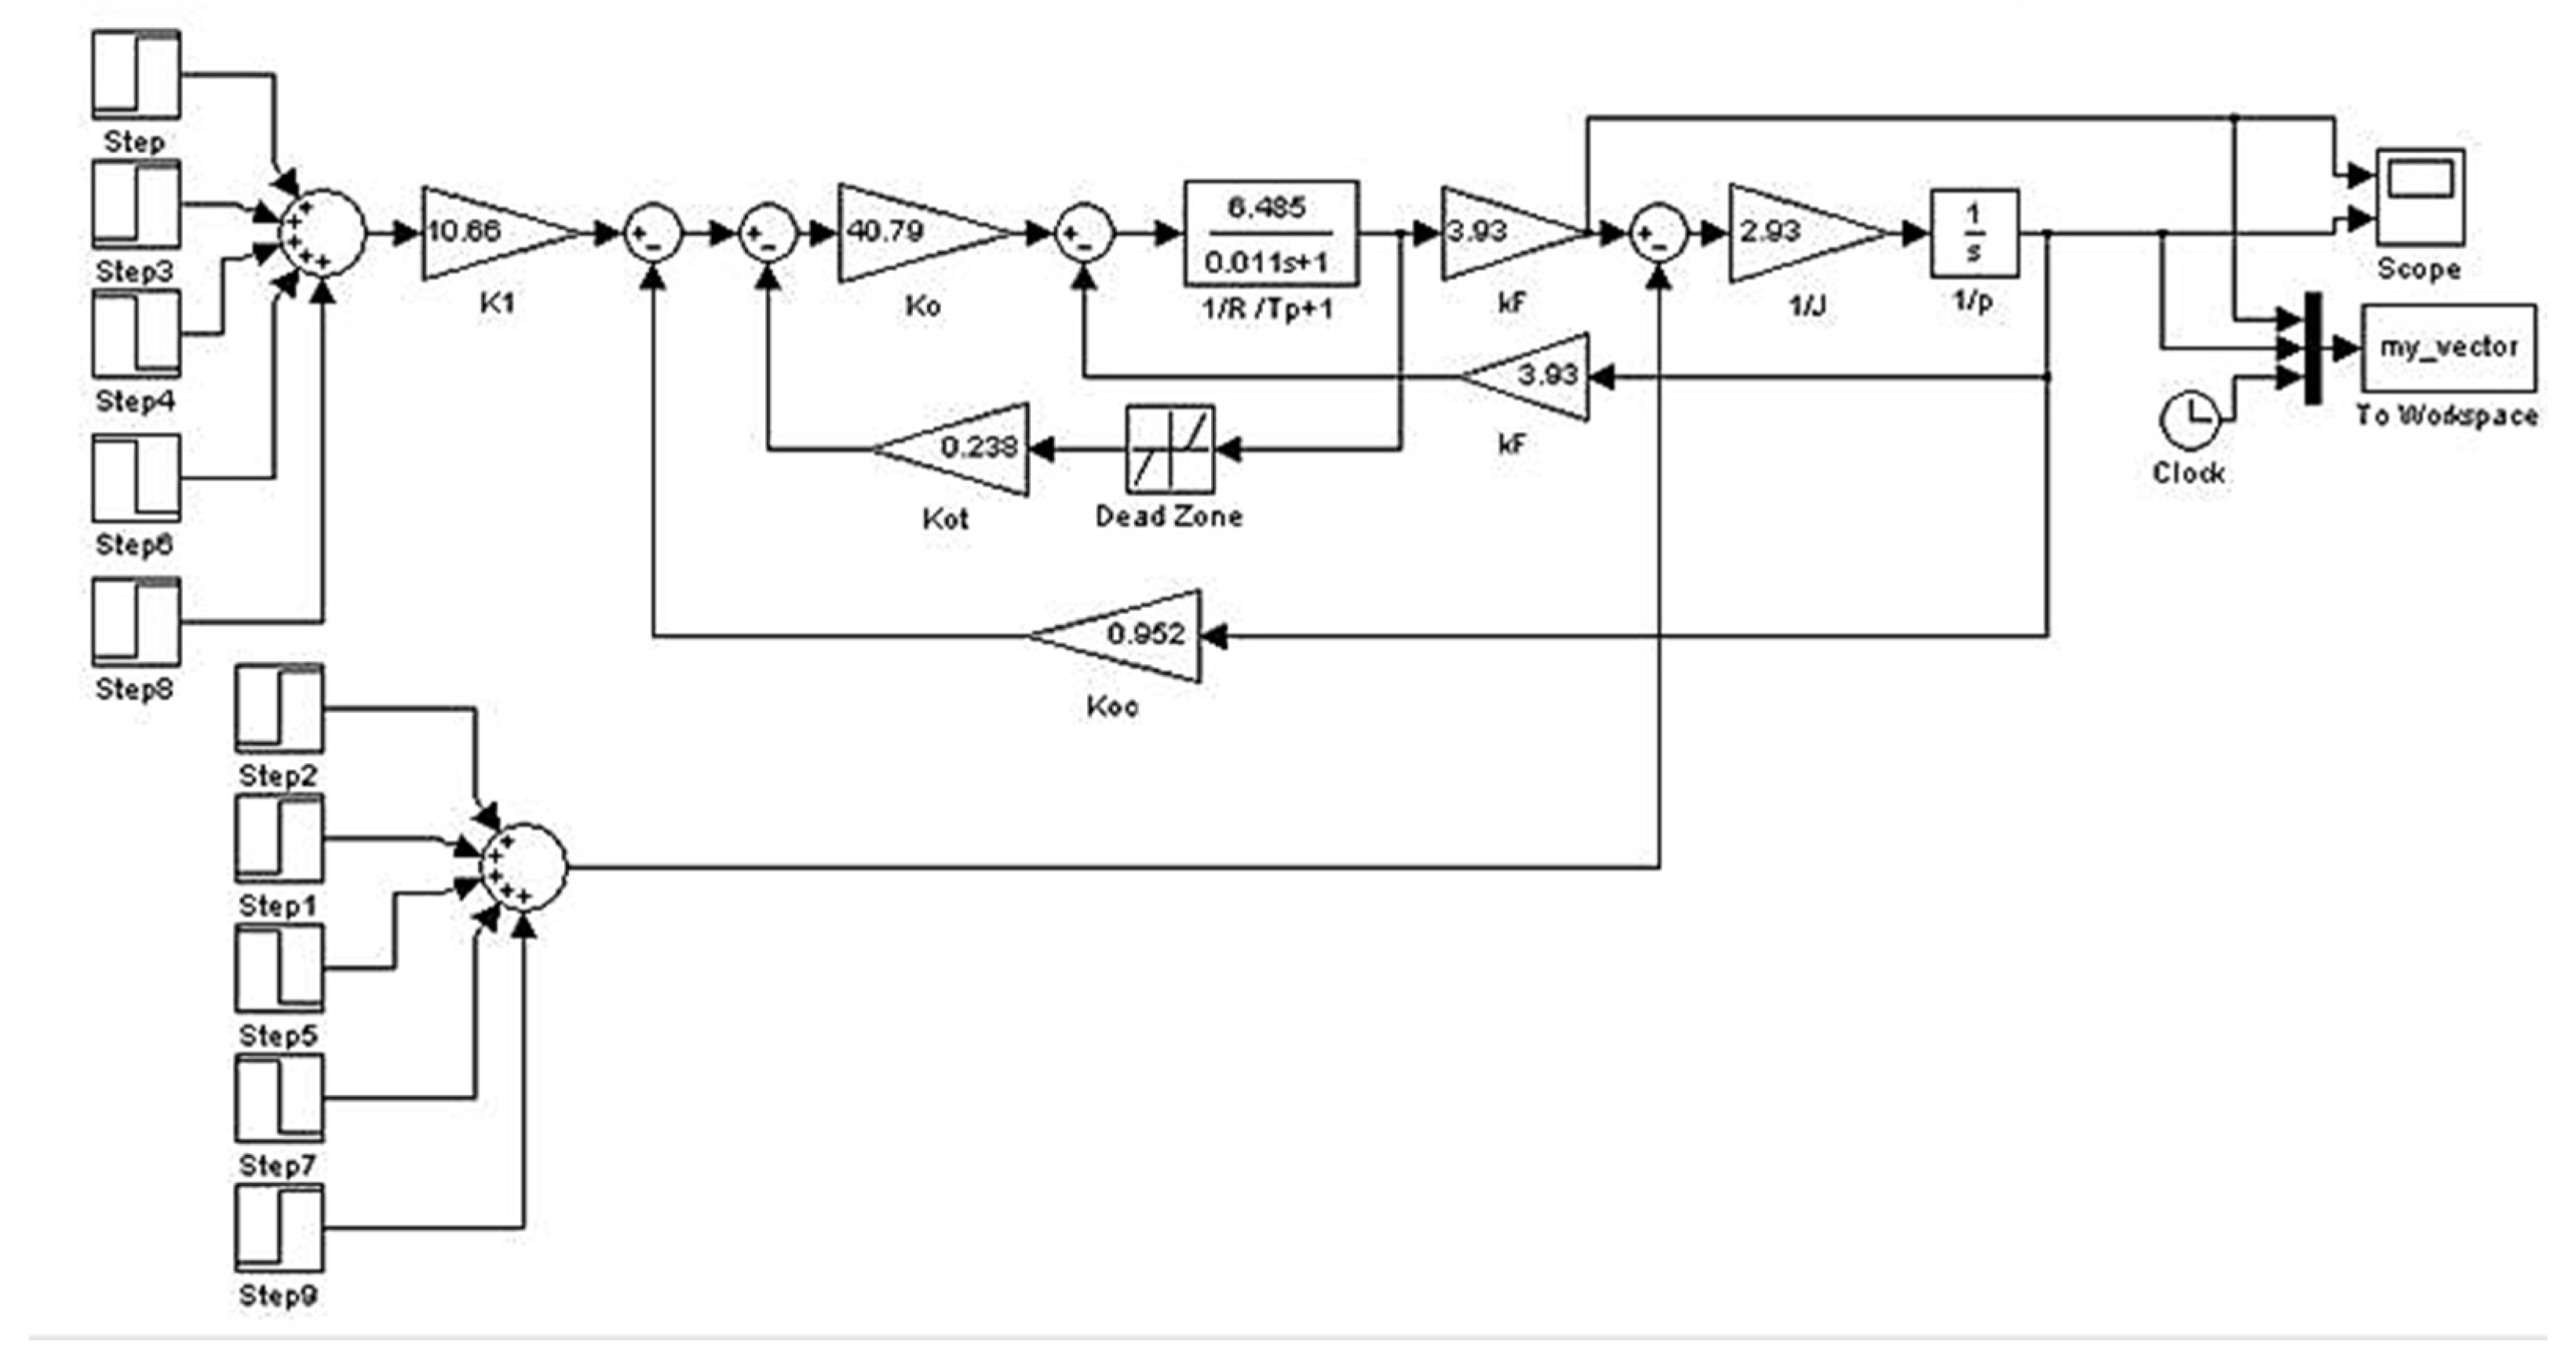
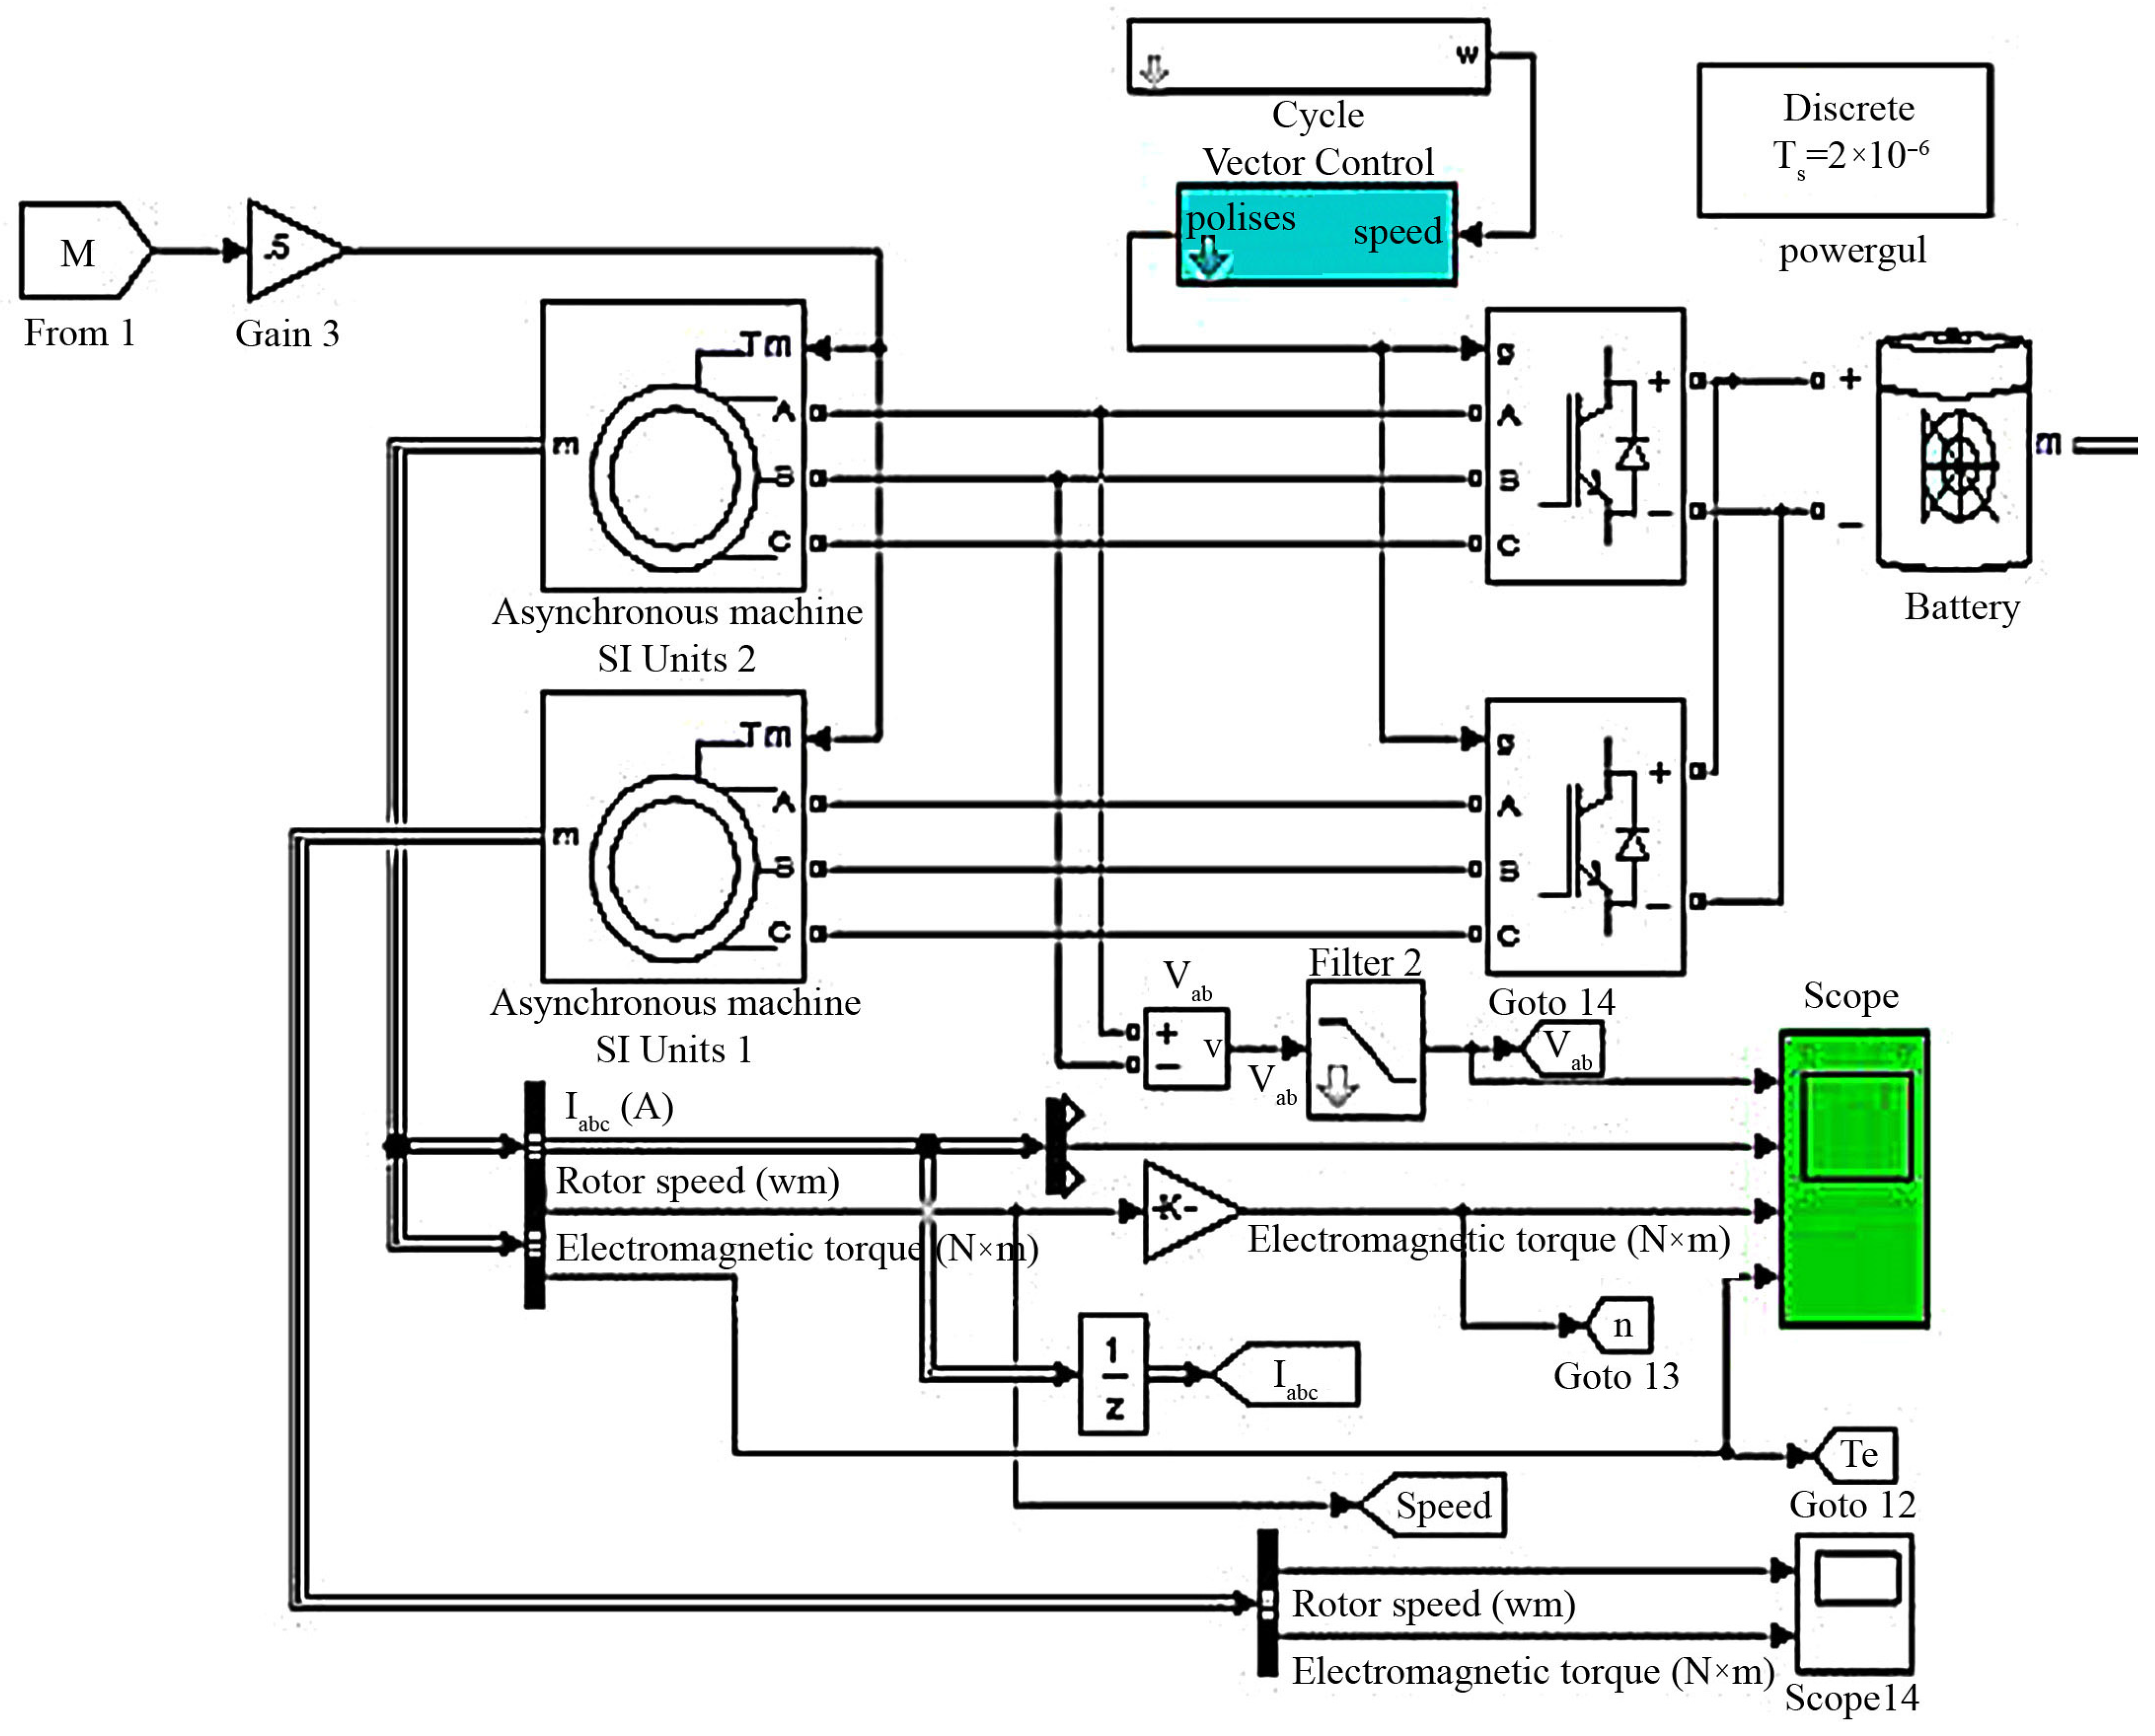
- Model of a traction electric machine;
- Model of an electric energy conversion and a control system for the traction electrical equipment (two inverters for each electric motor);
- Traction battery model;
- Model of a system for calculating traction forces on the shaft of electric motors.
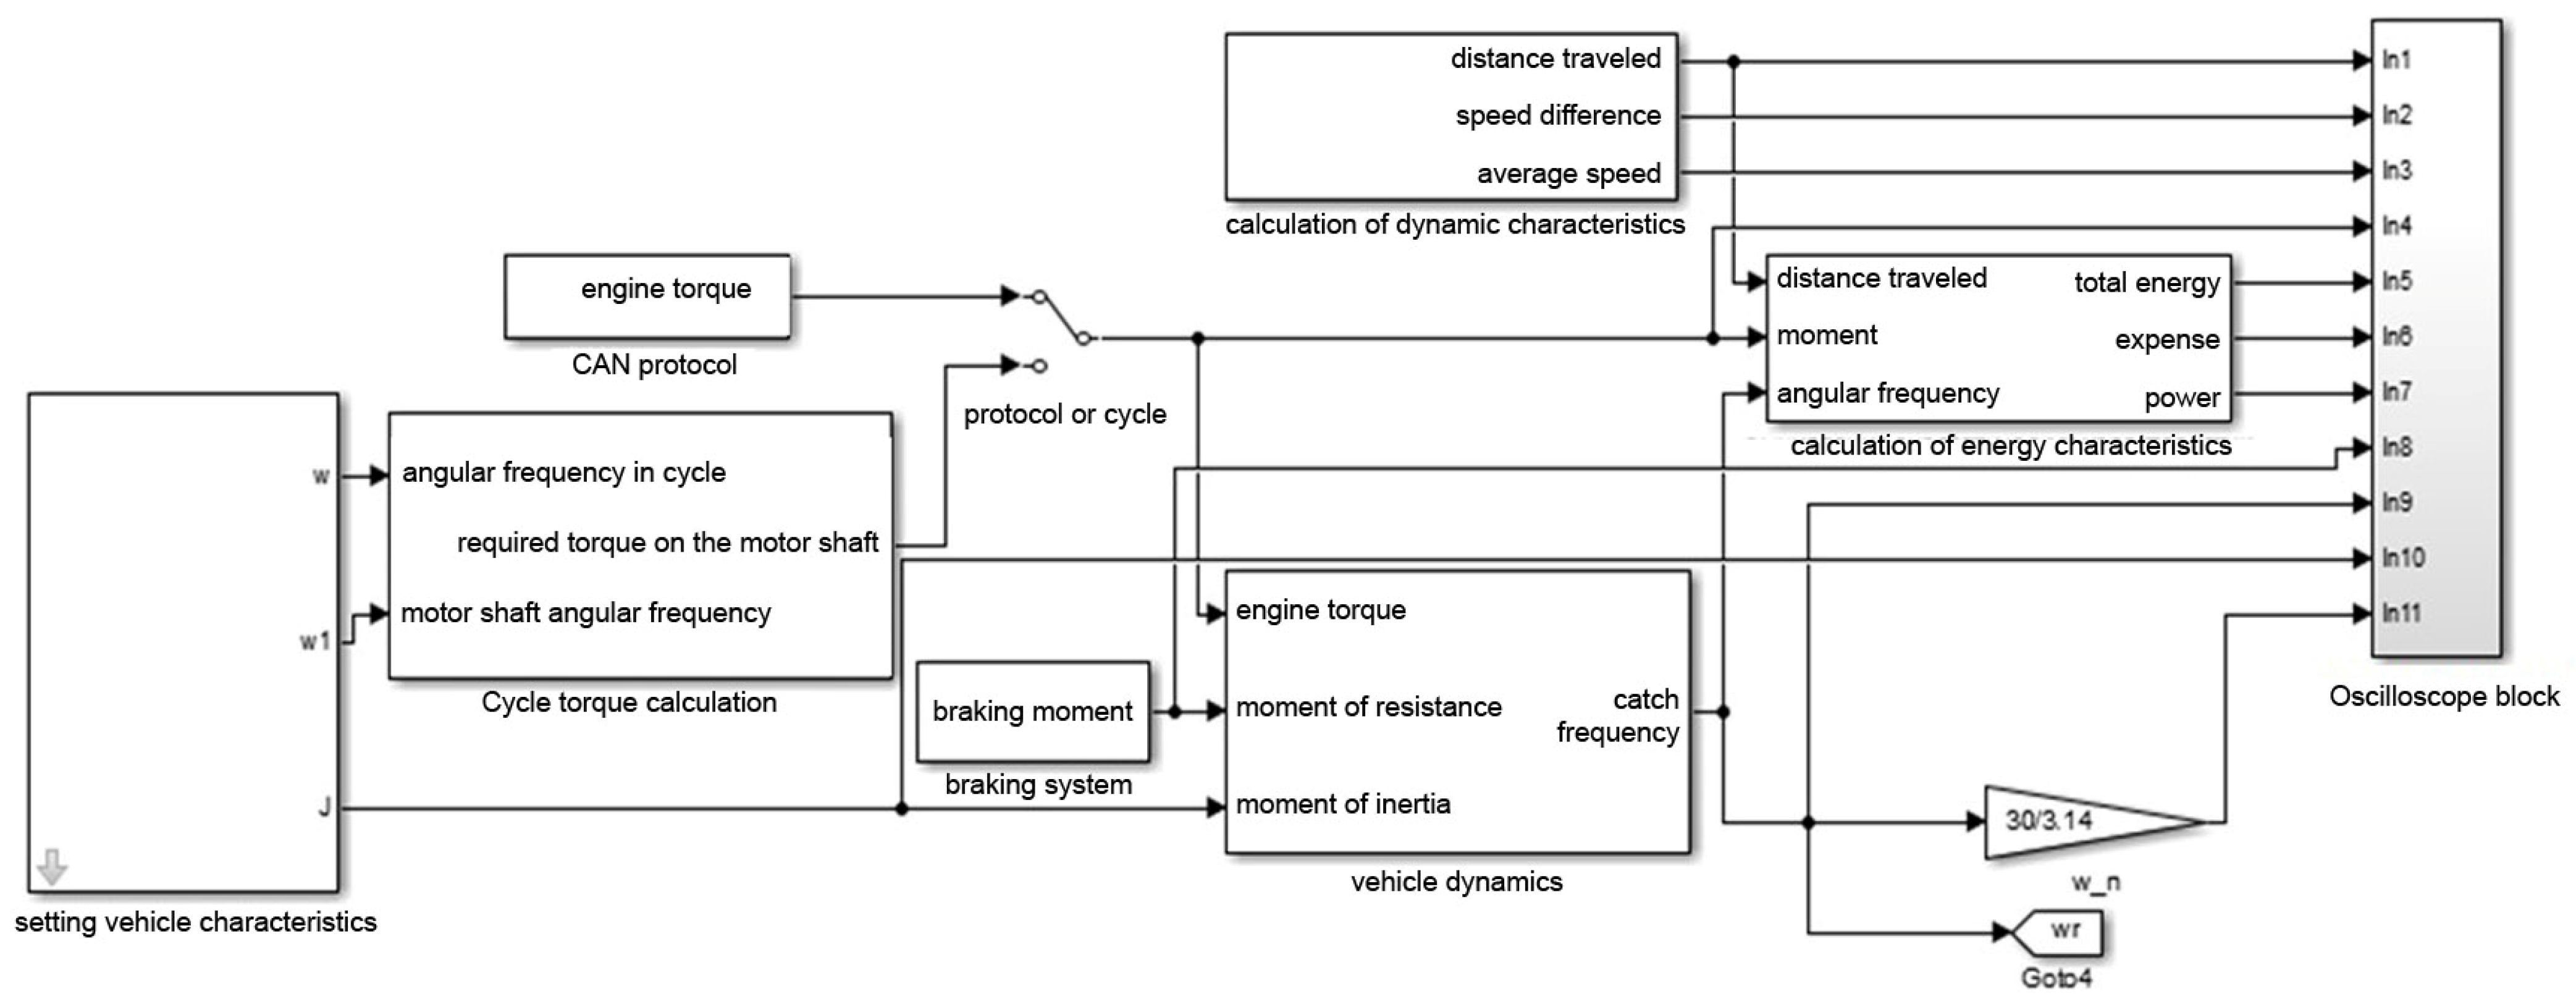
4.1. Mathematical Model Considering the Mechanical Characteristics of the Vehicle, and Subsequent Verification of Traction Characteristics
- A vehicle characterisation unit;
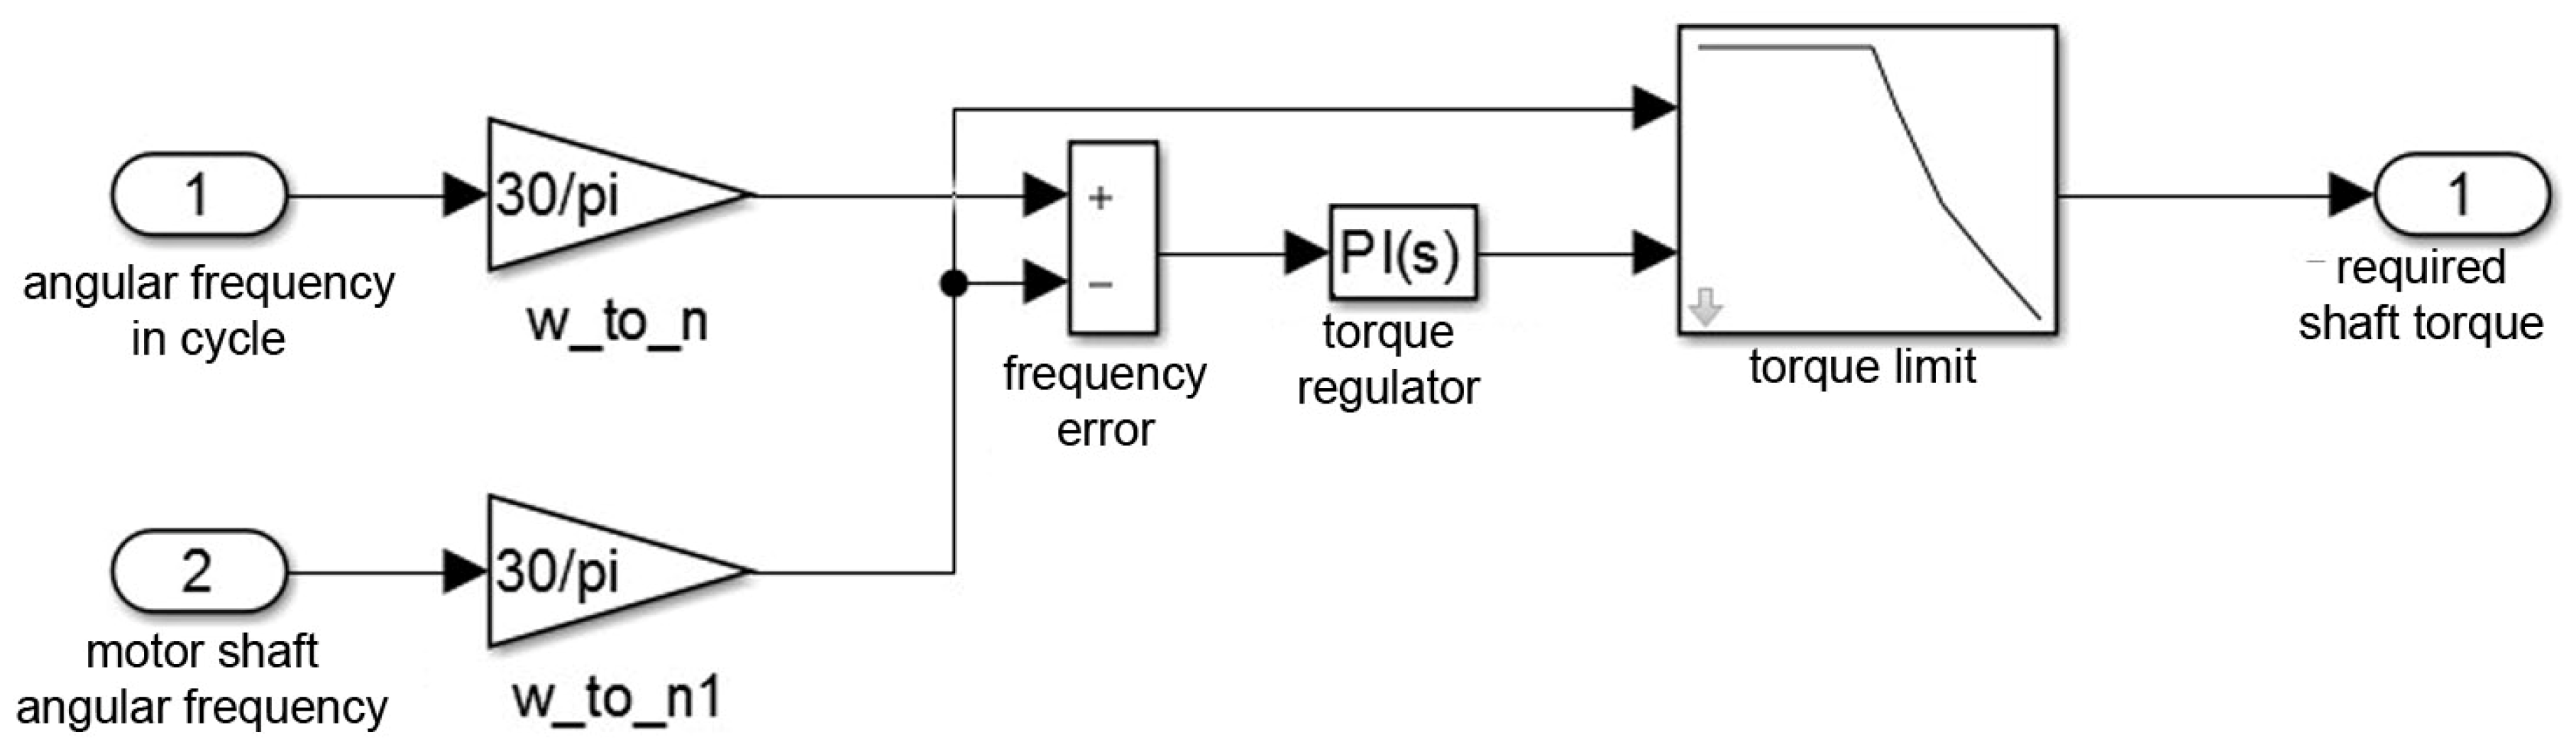
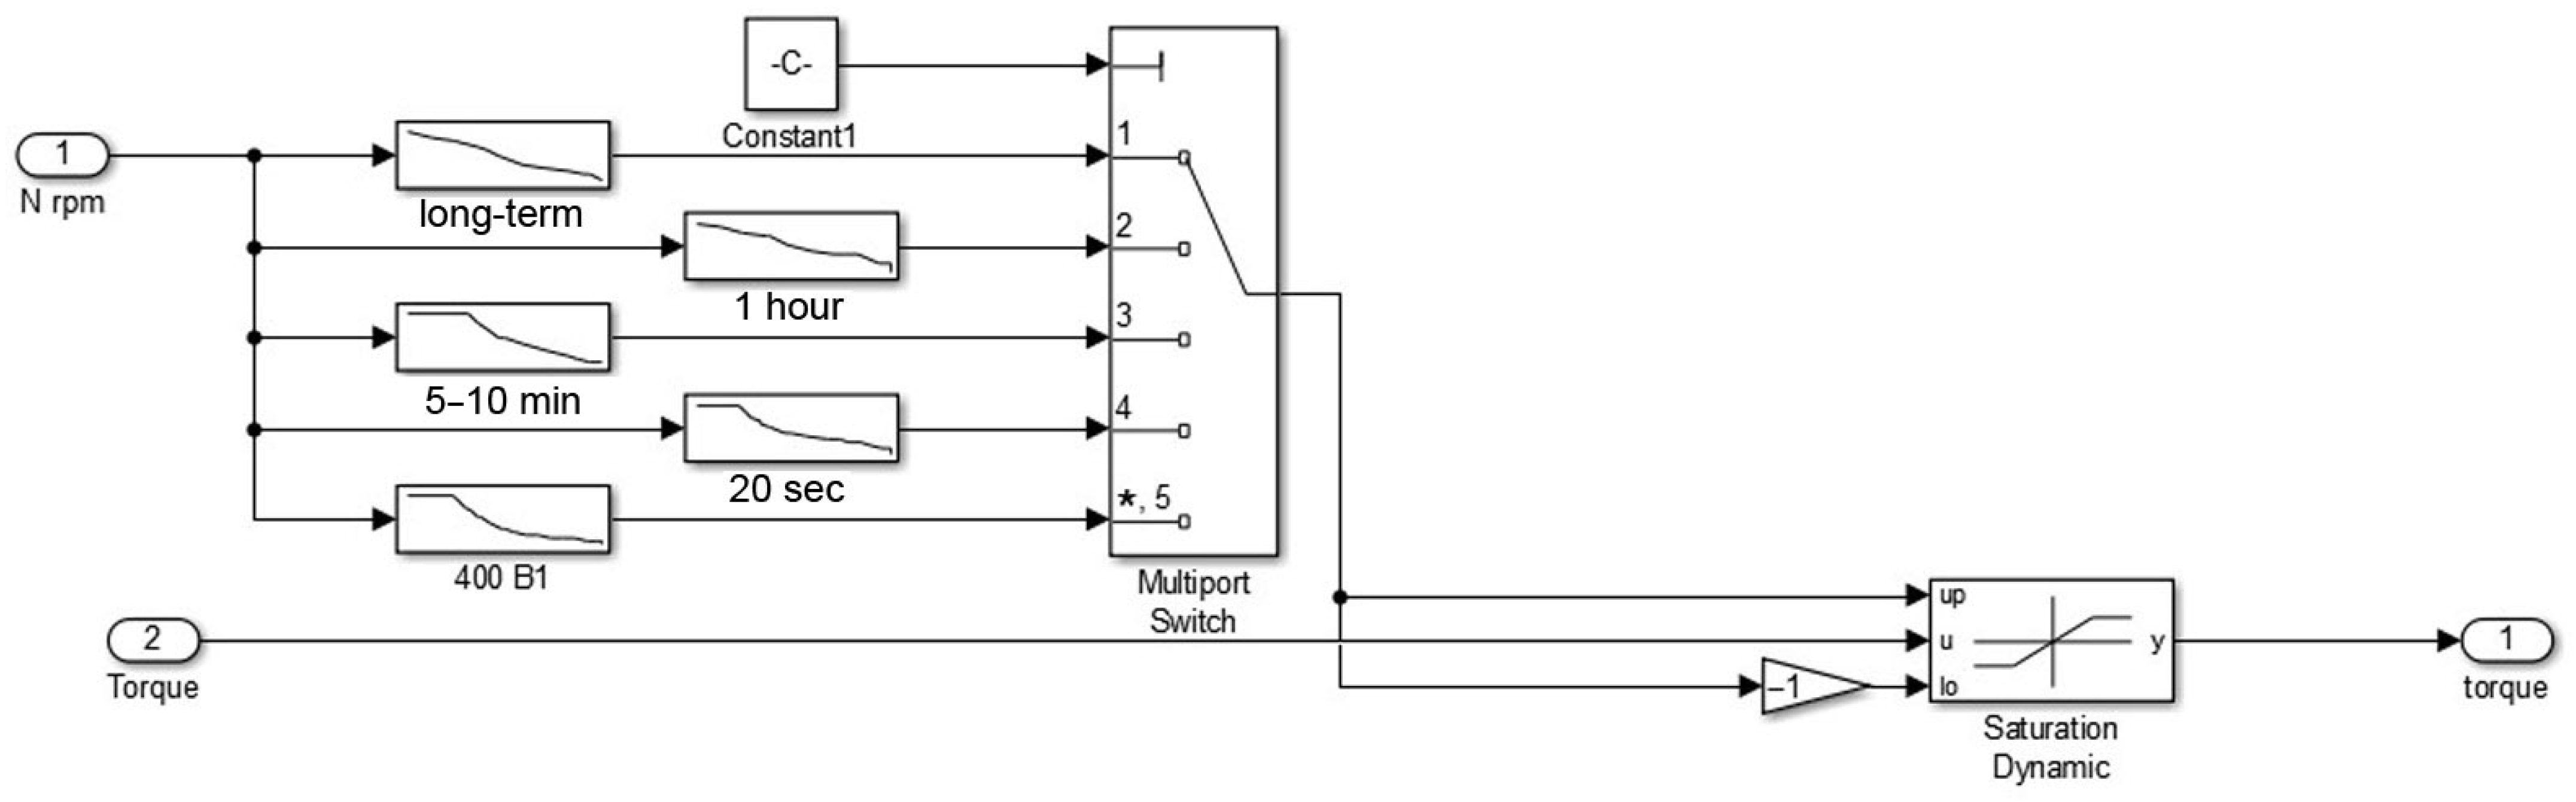
- A block for calculating the torque in a cycle;
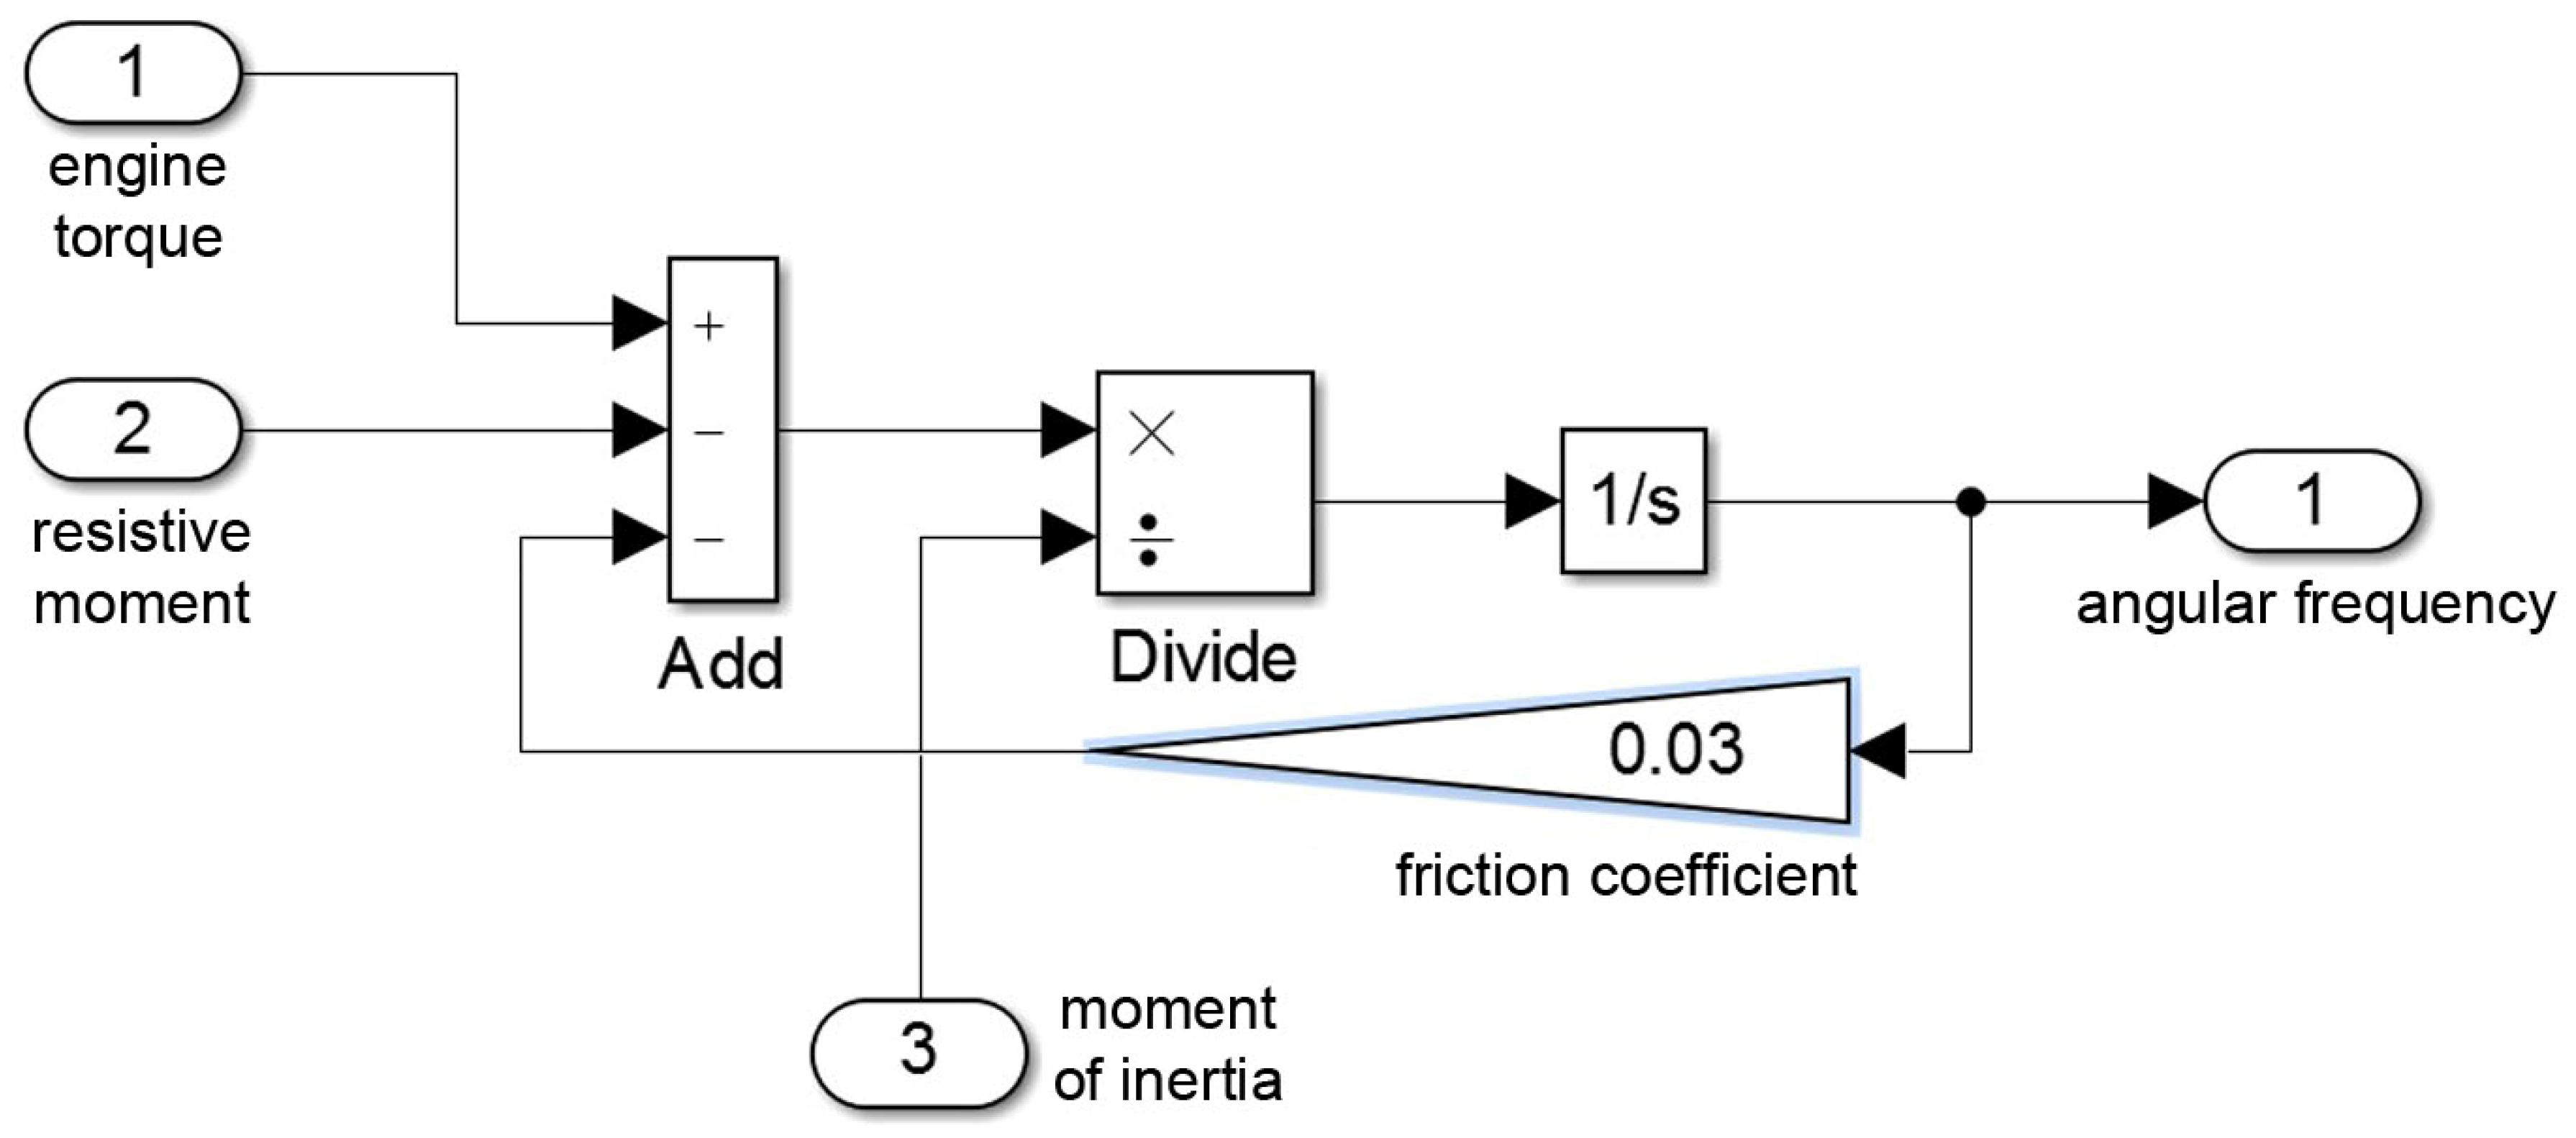
- A vehicle dynamics calculation unit;
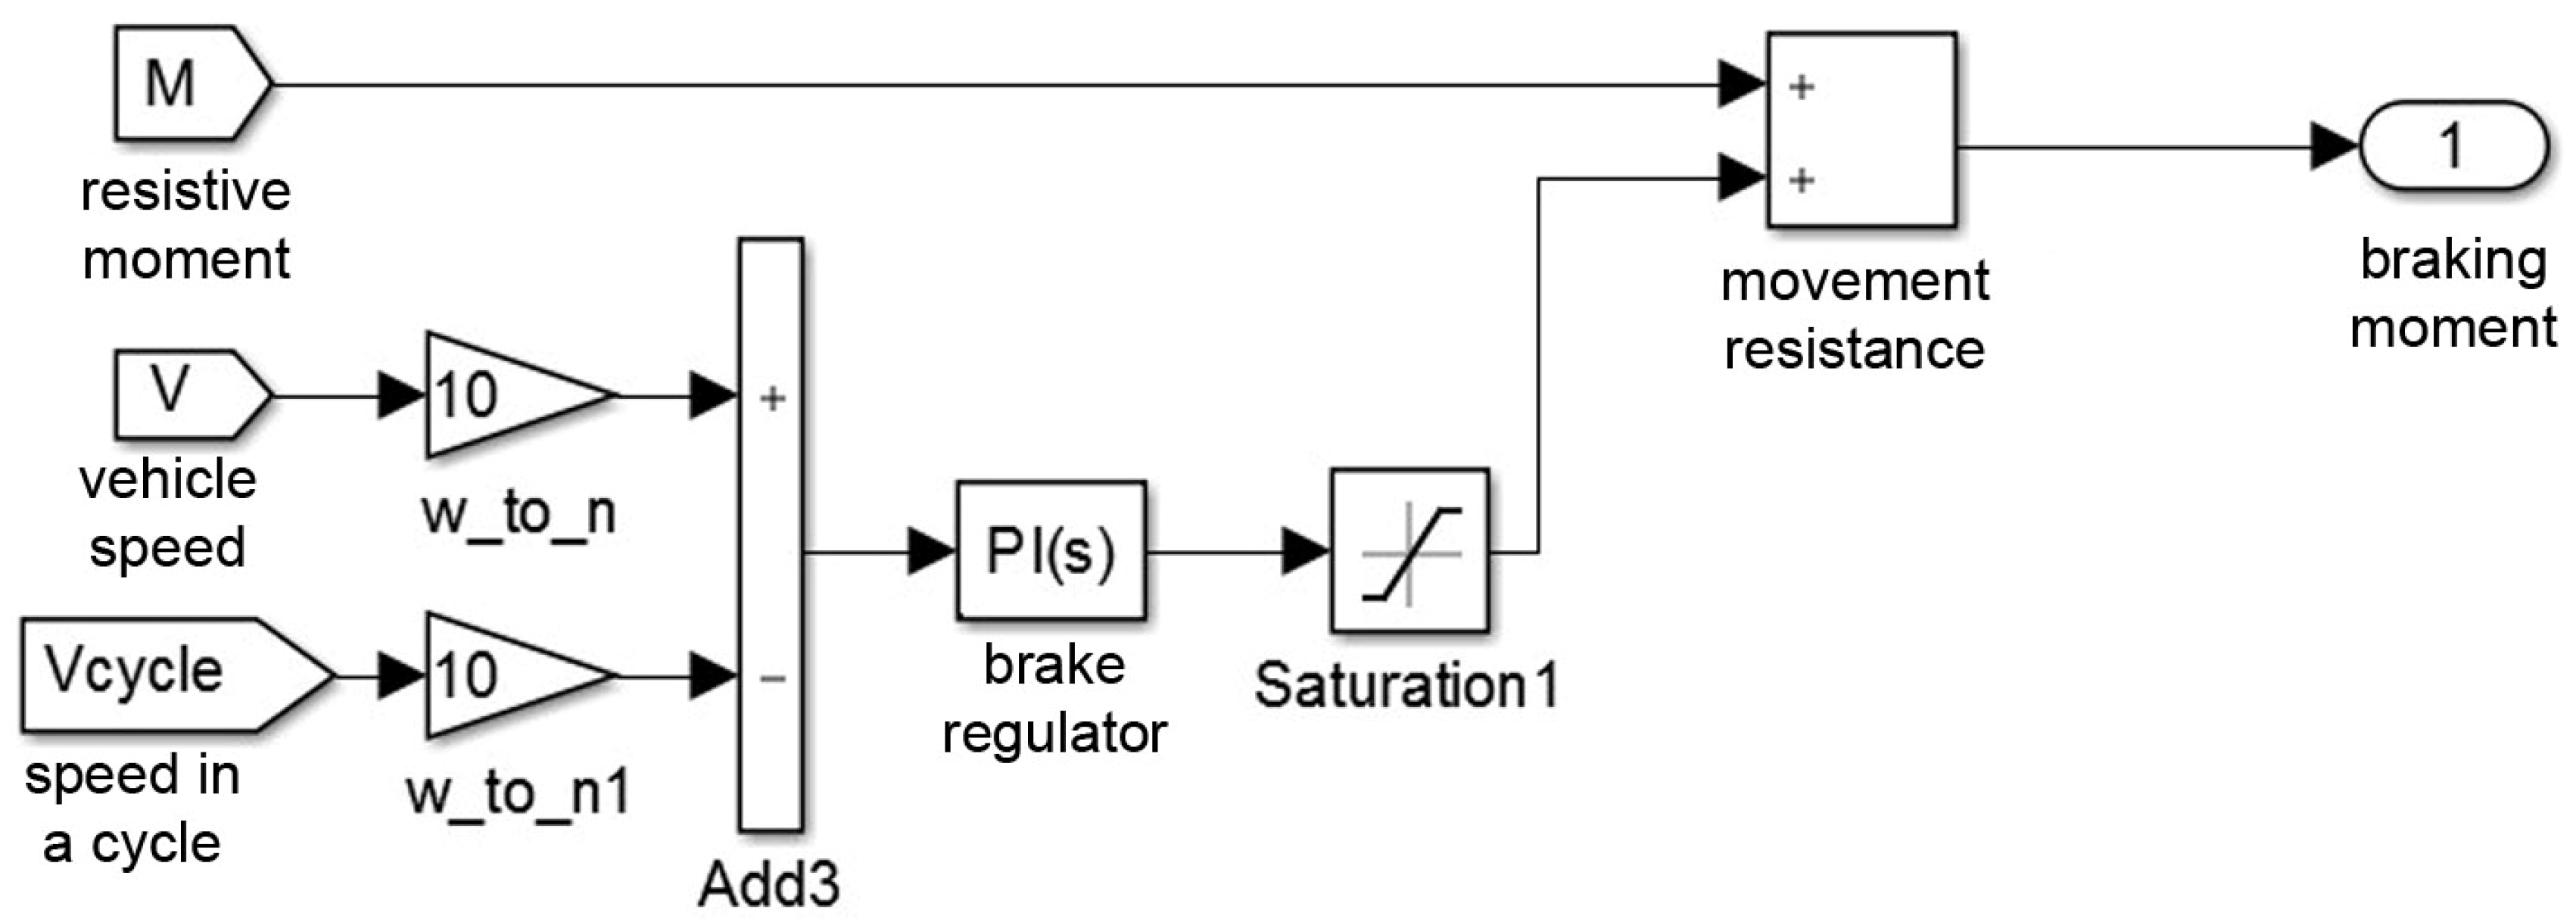
- A braking system unit;
- A dynamic characteristics calculation block;
- A block for calculating energy characteristics;
- An oscilloscope unit.
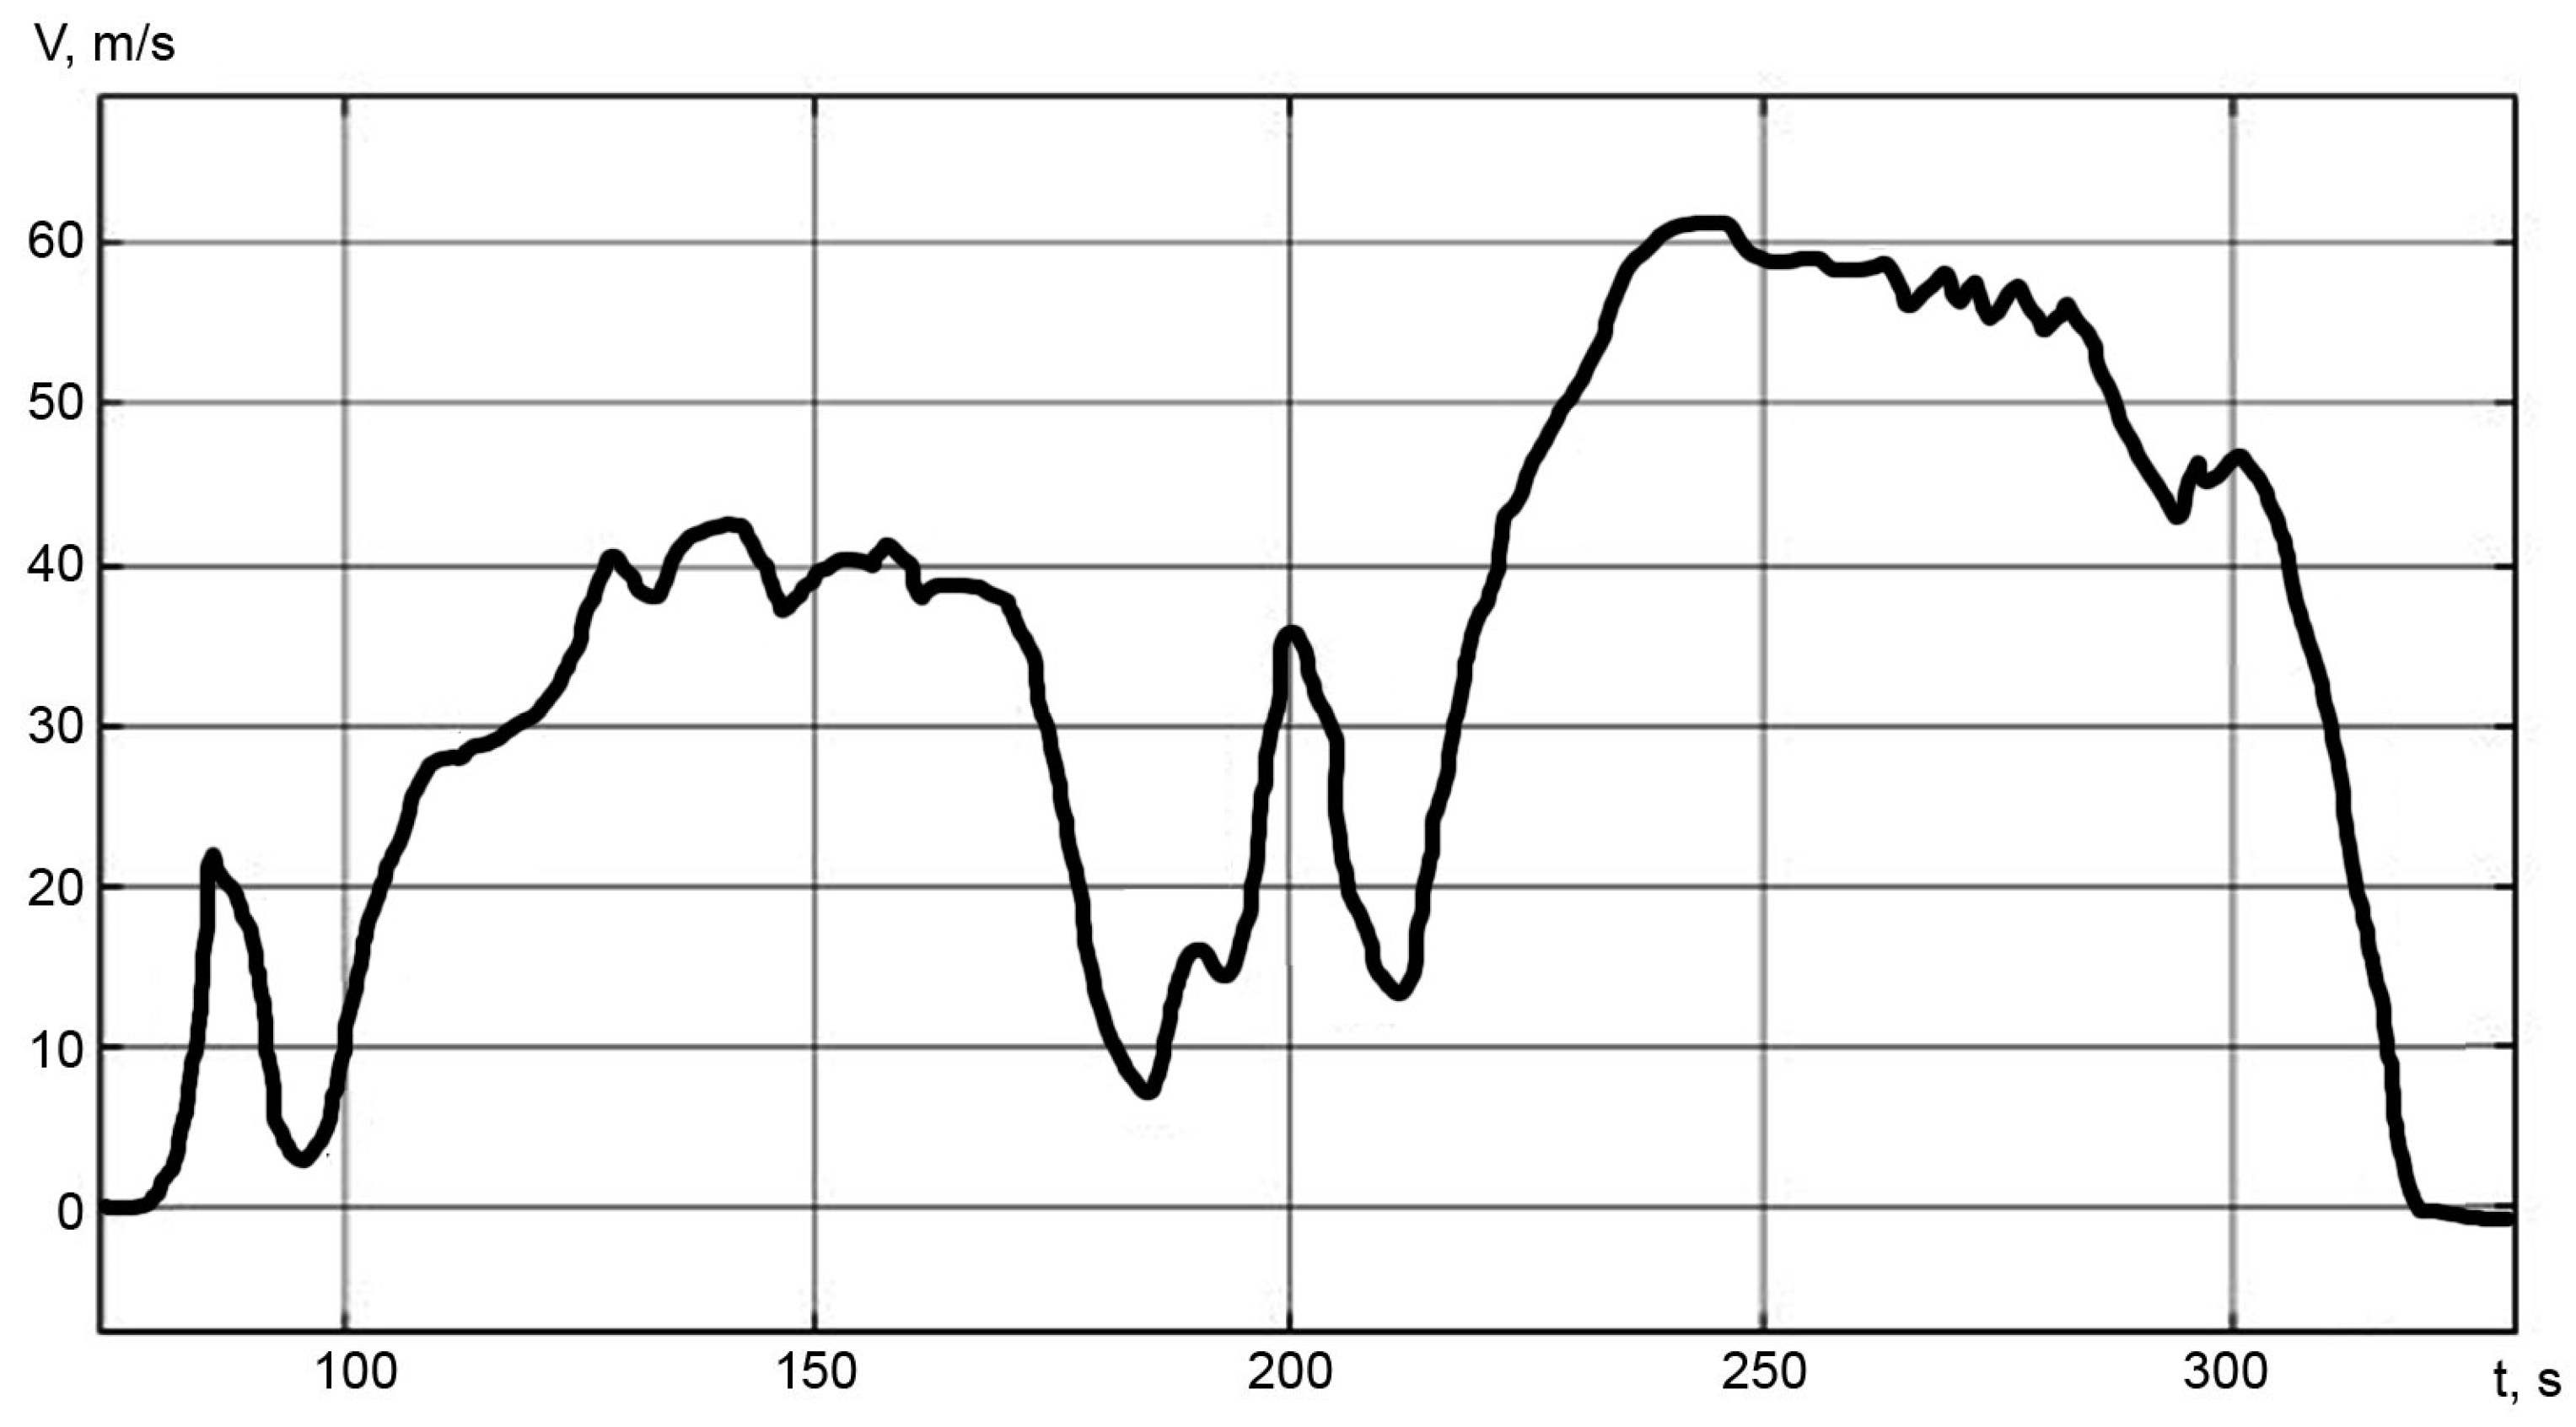
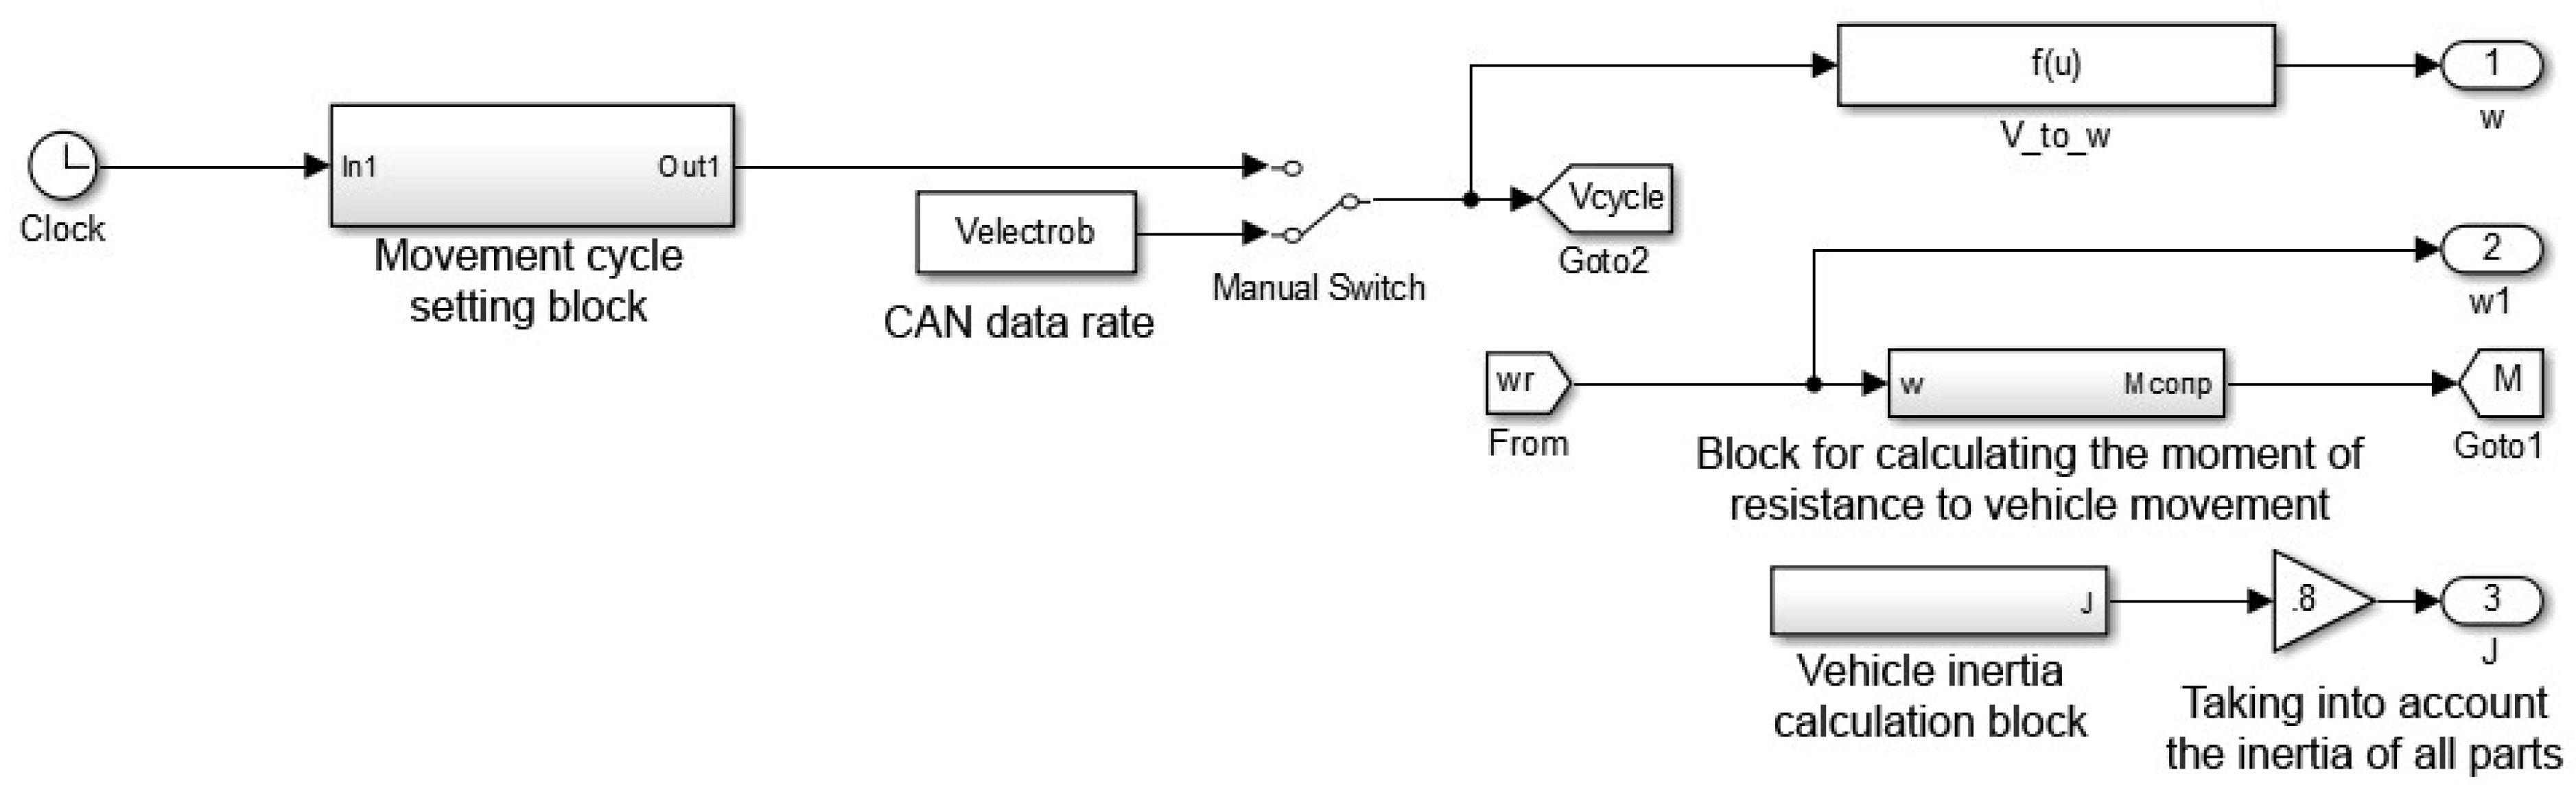
- A motion cycle setting unit;
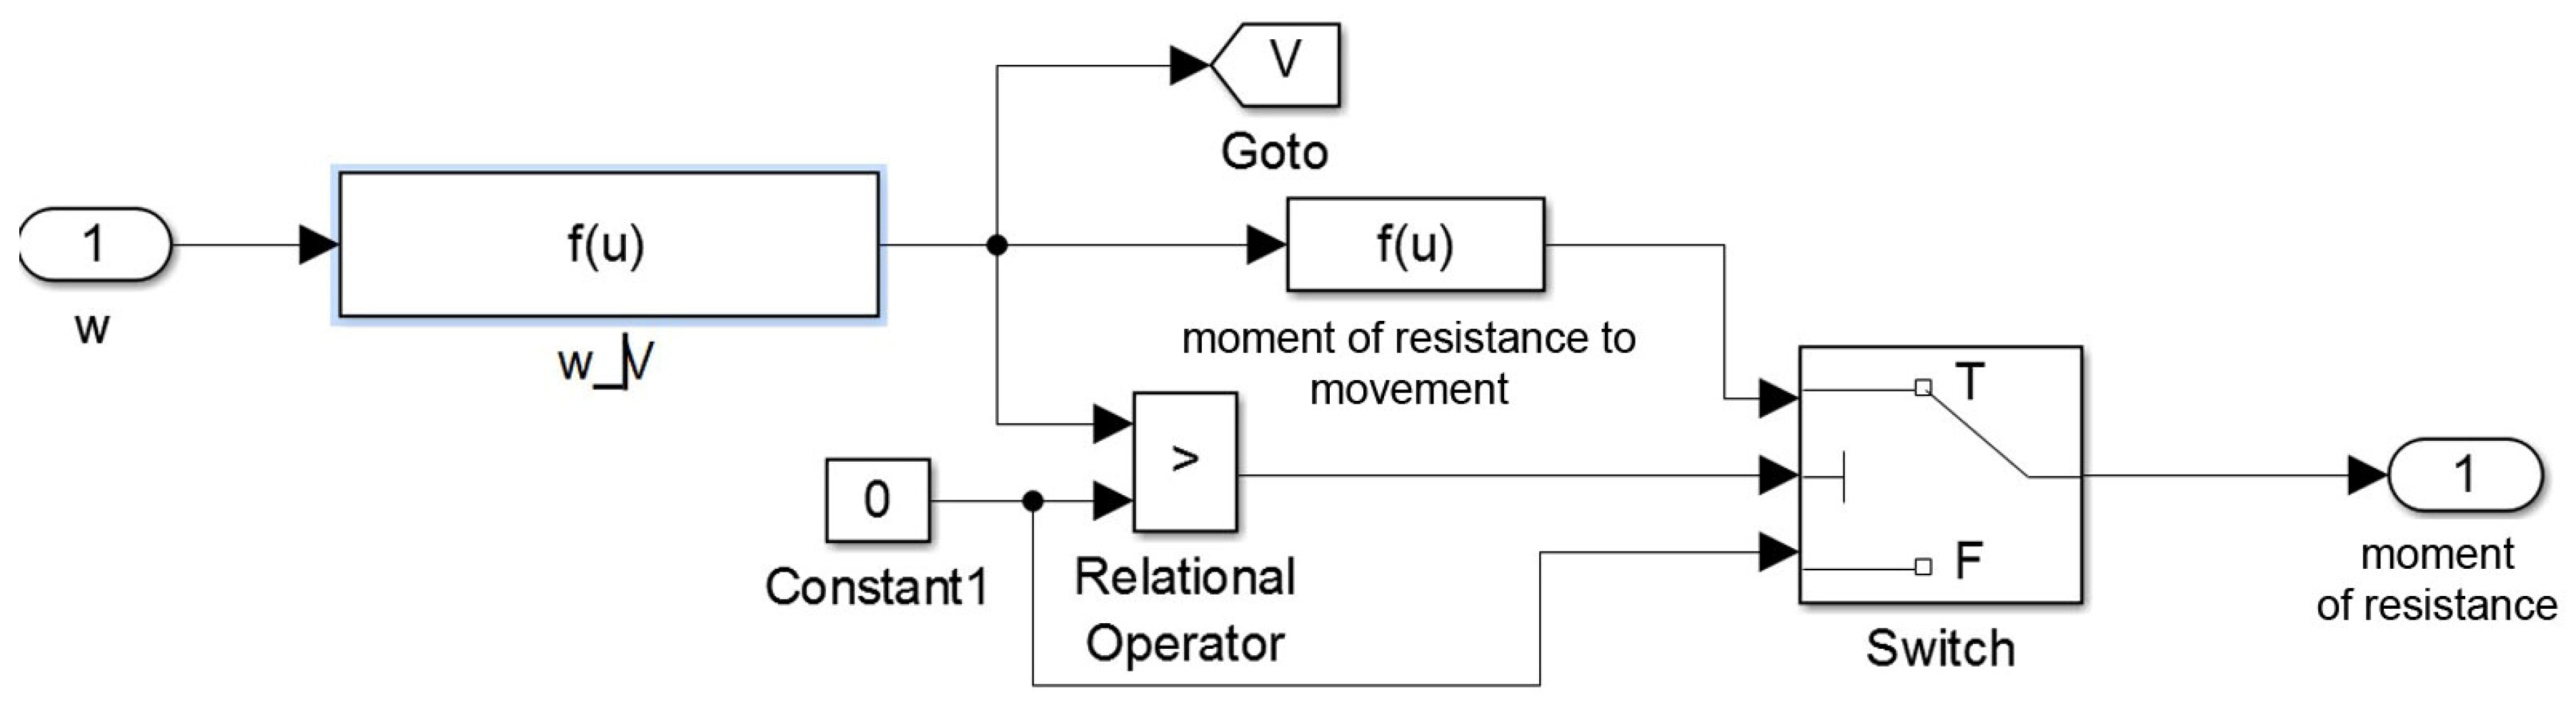
- A unit for calculating the moment of resistance to vehicle movement;
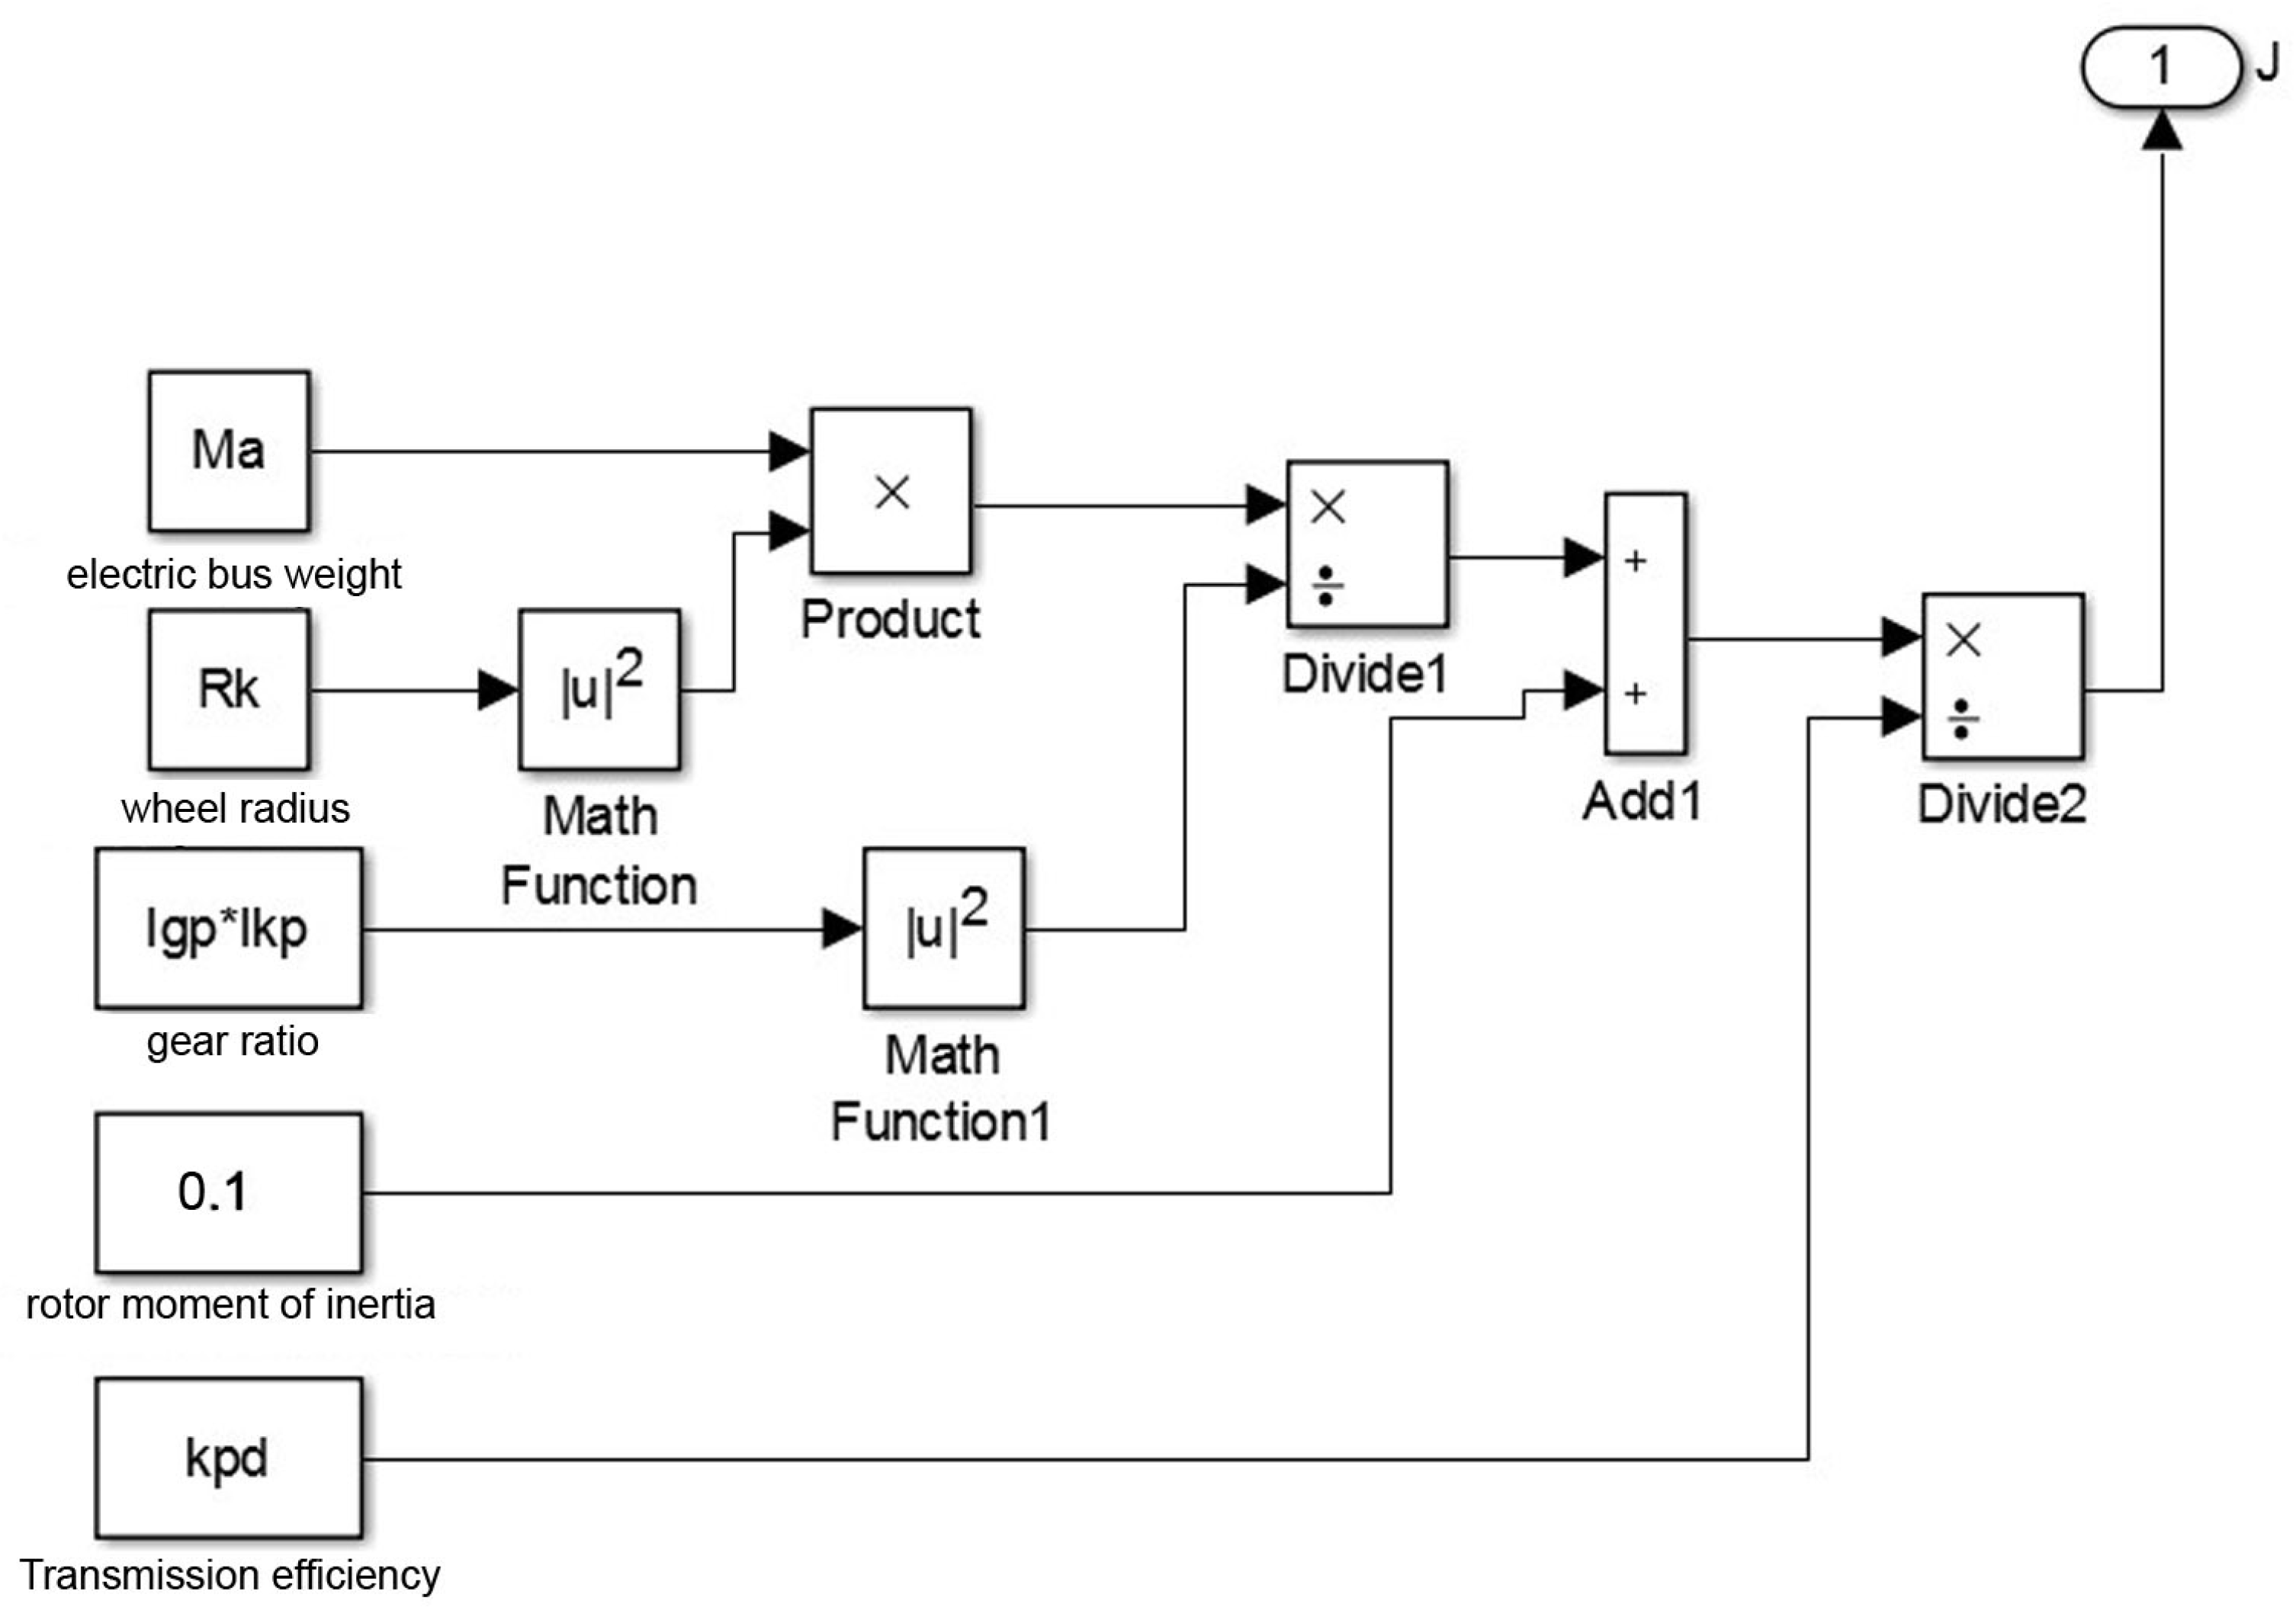
- A vehicle inertia calculation unit.
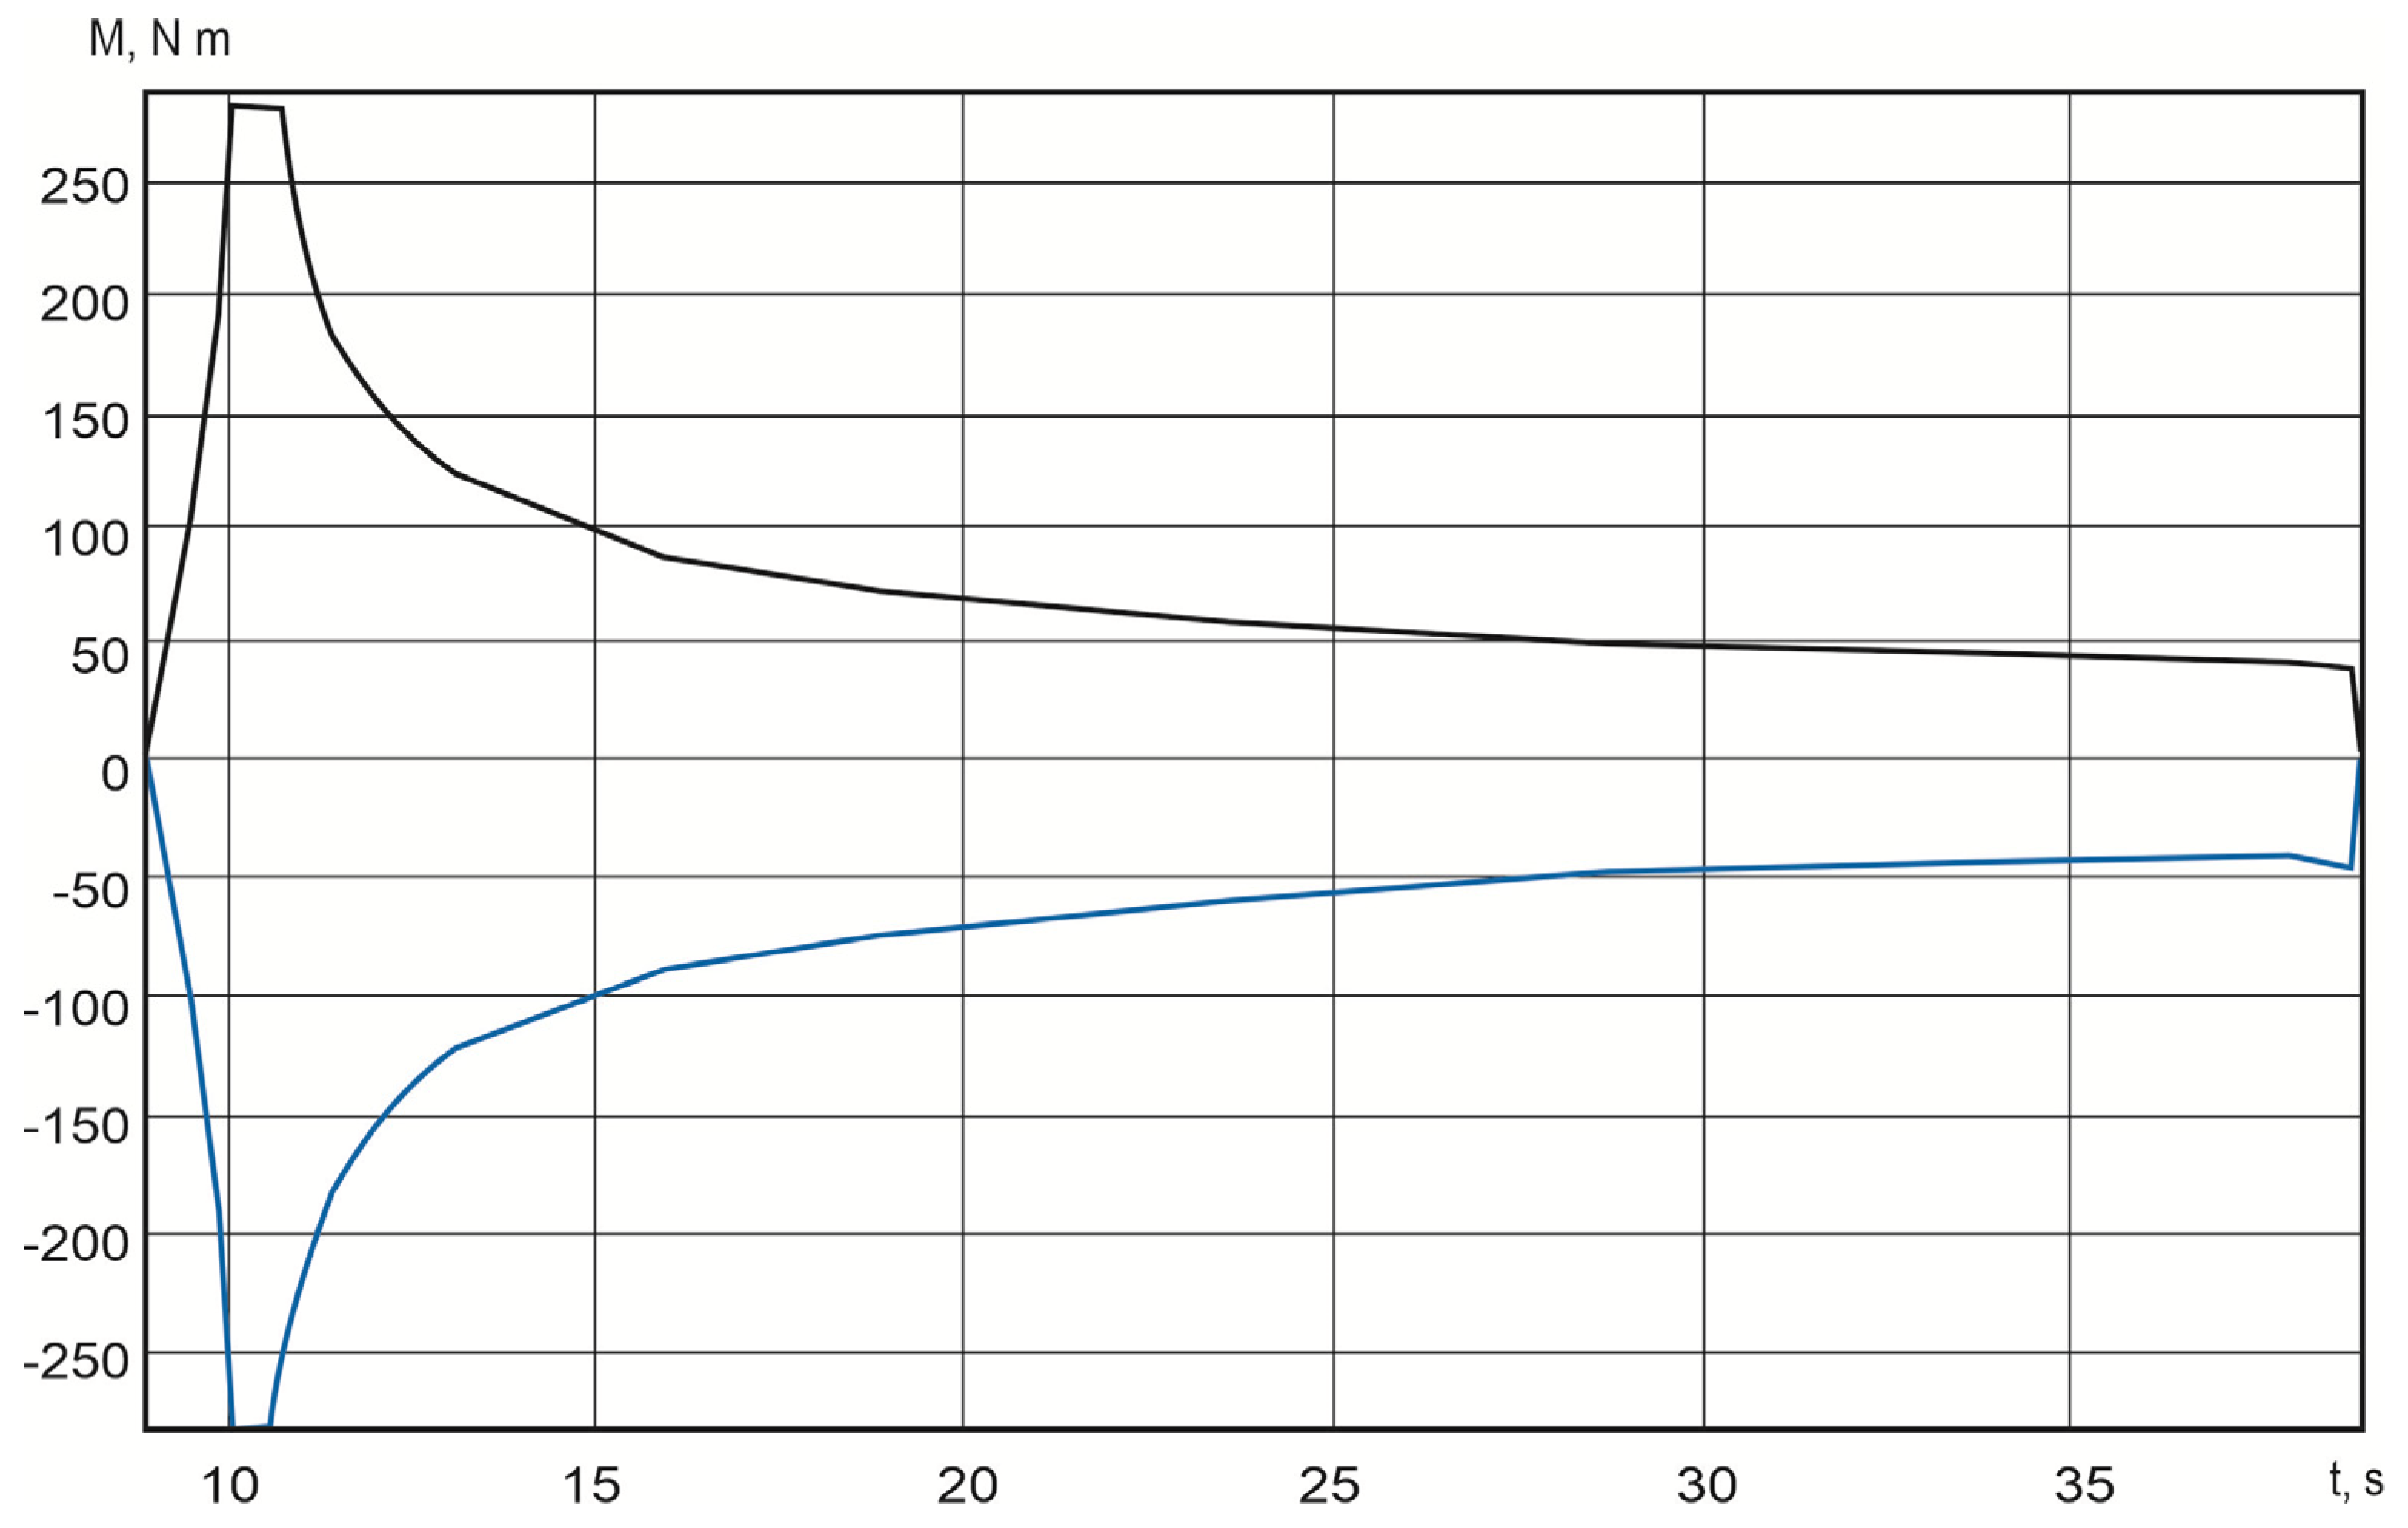
4.2. Verification of the Mechanical Model with Real Test Results
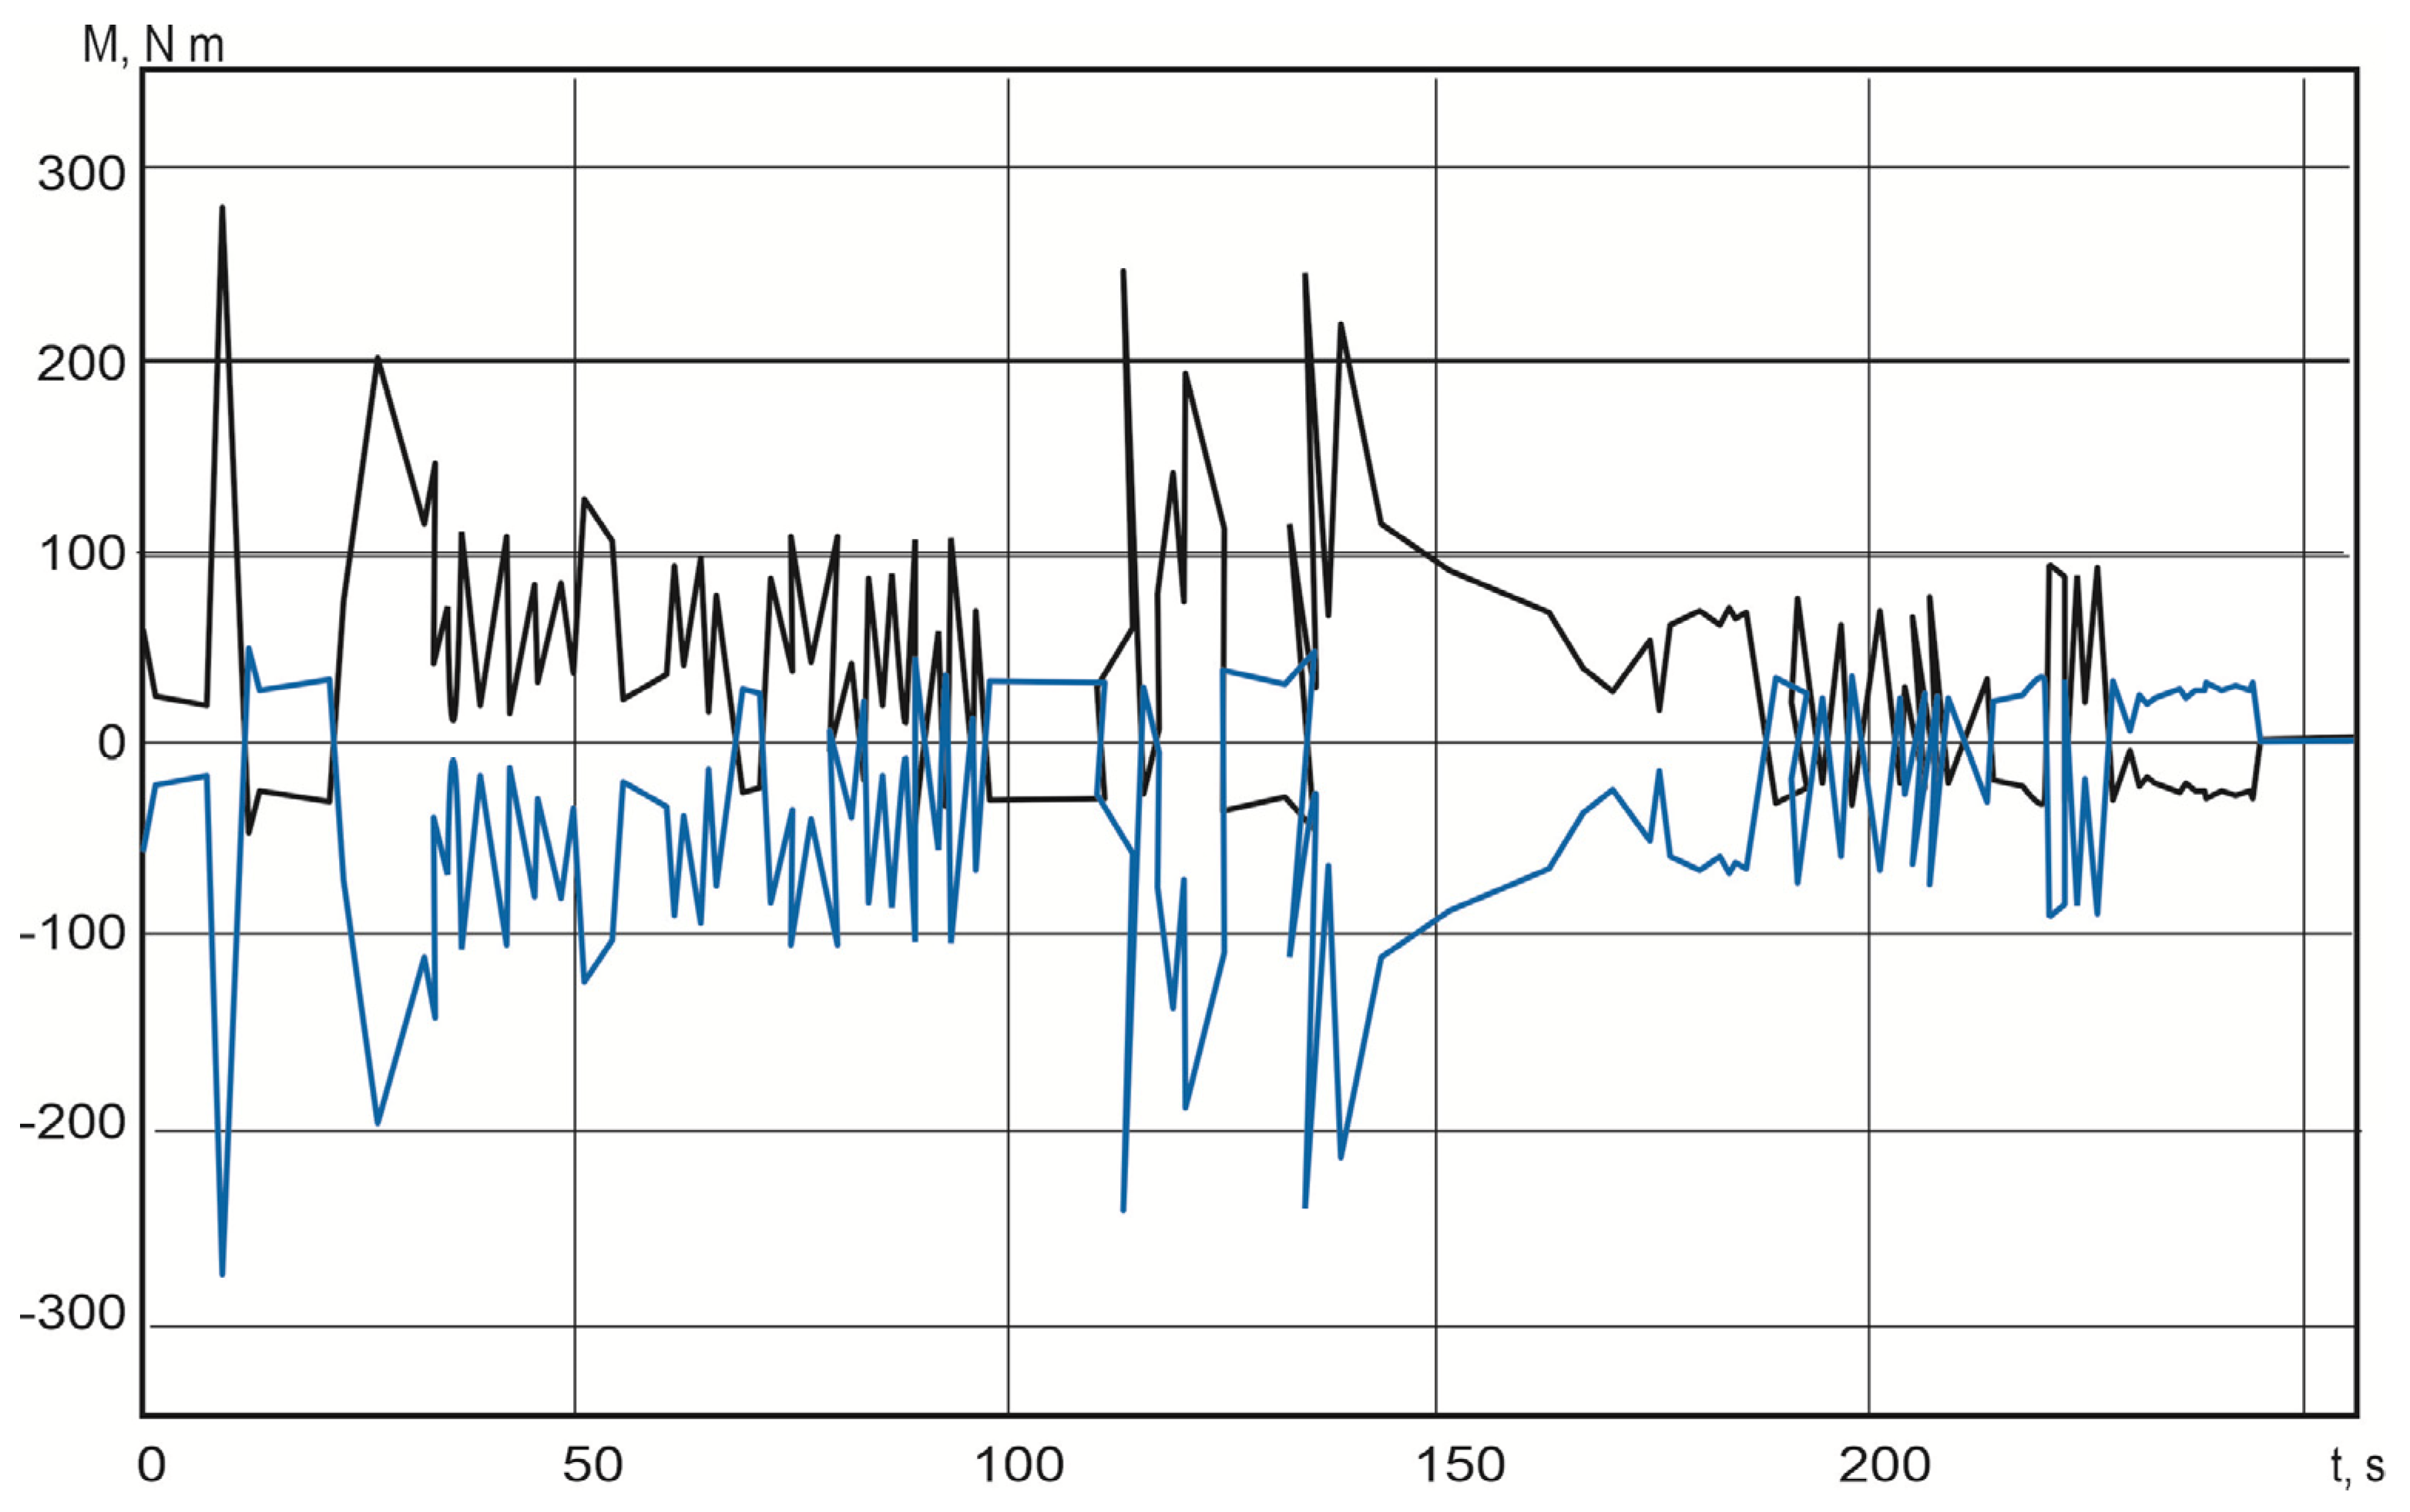
- Torques of electric motors;
- Motor shaft speed;
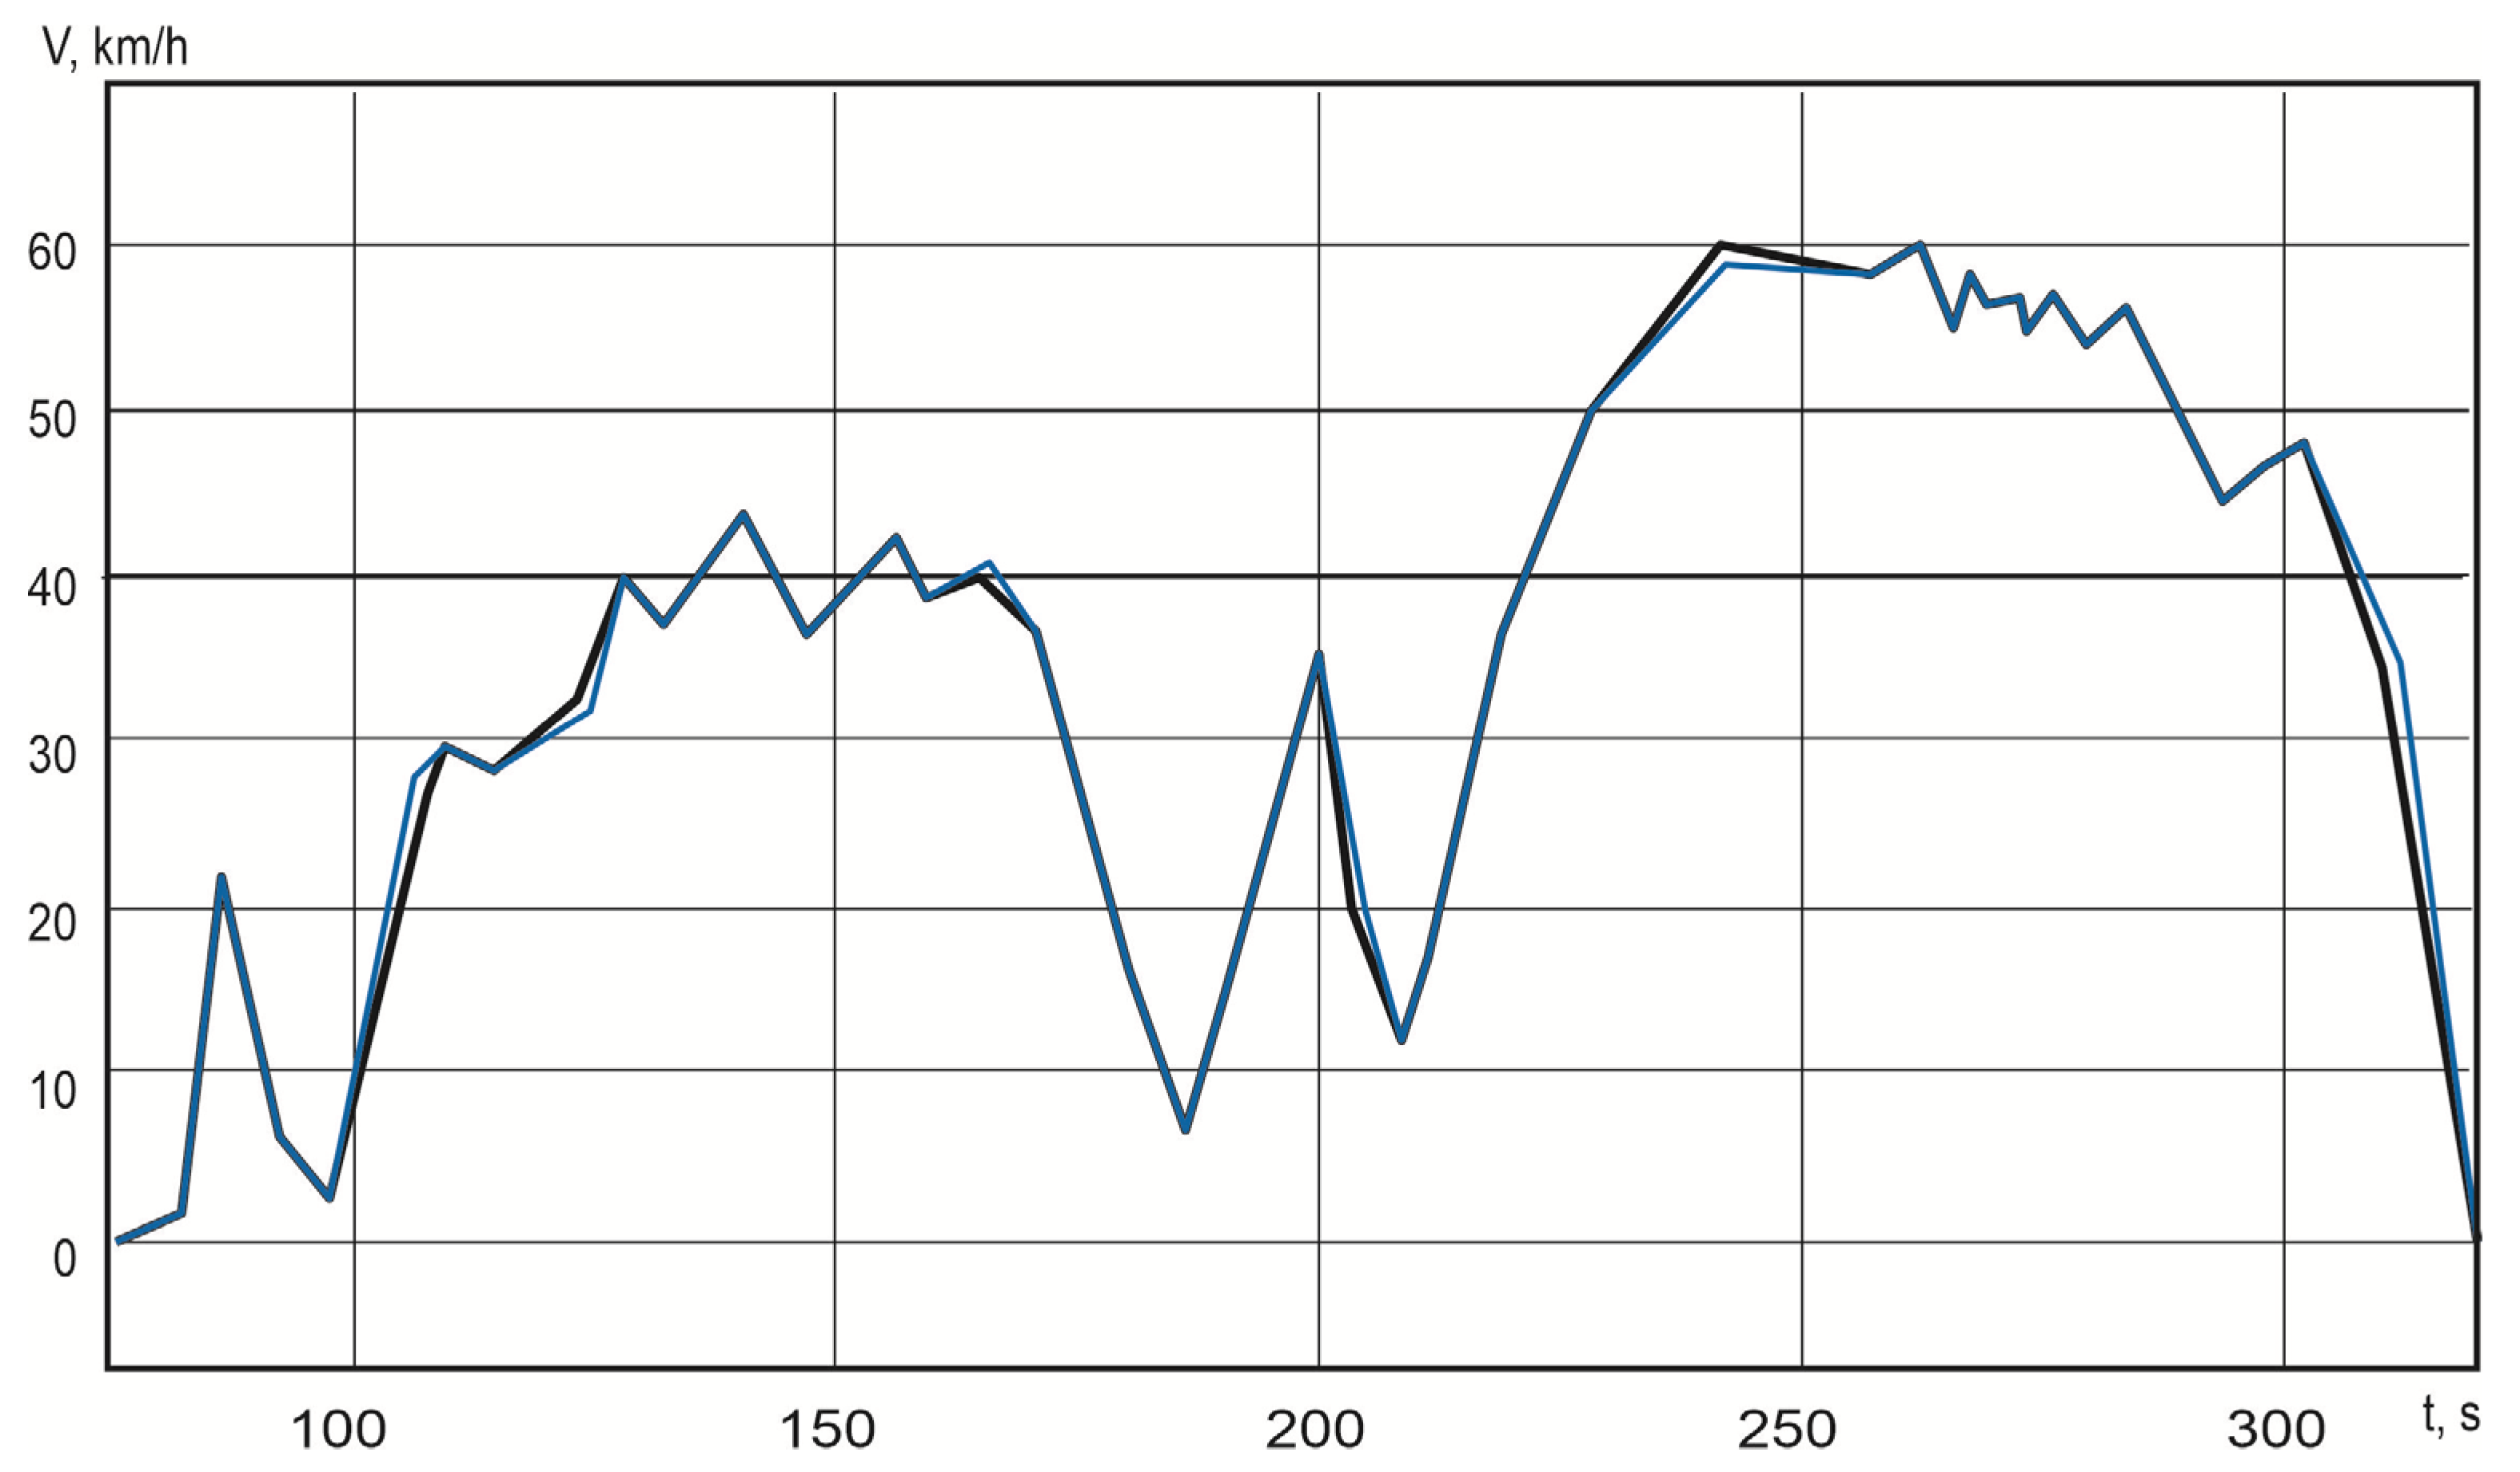
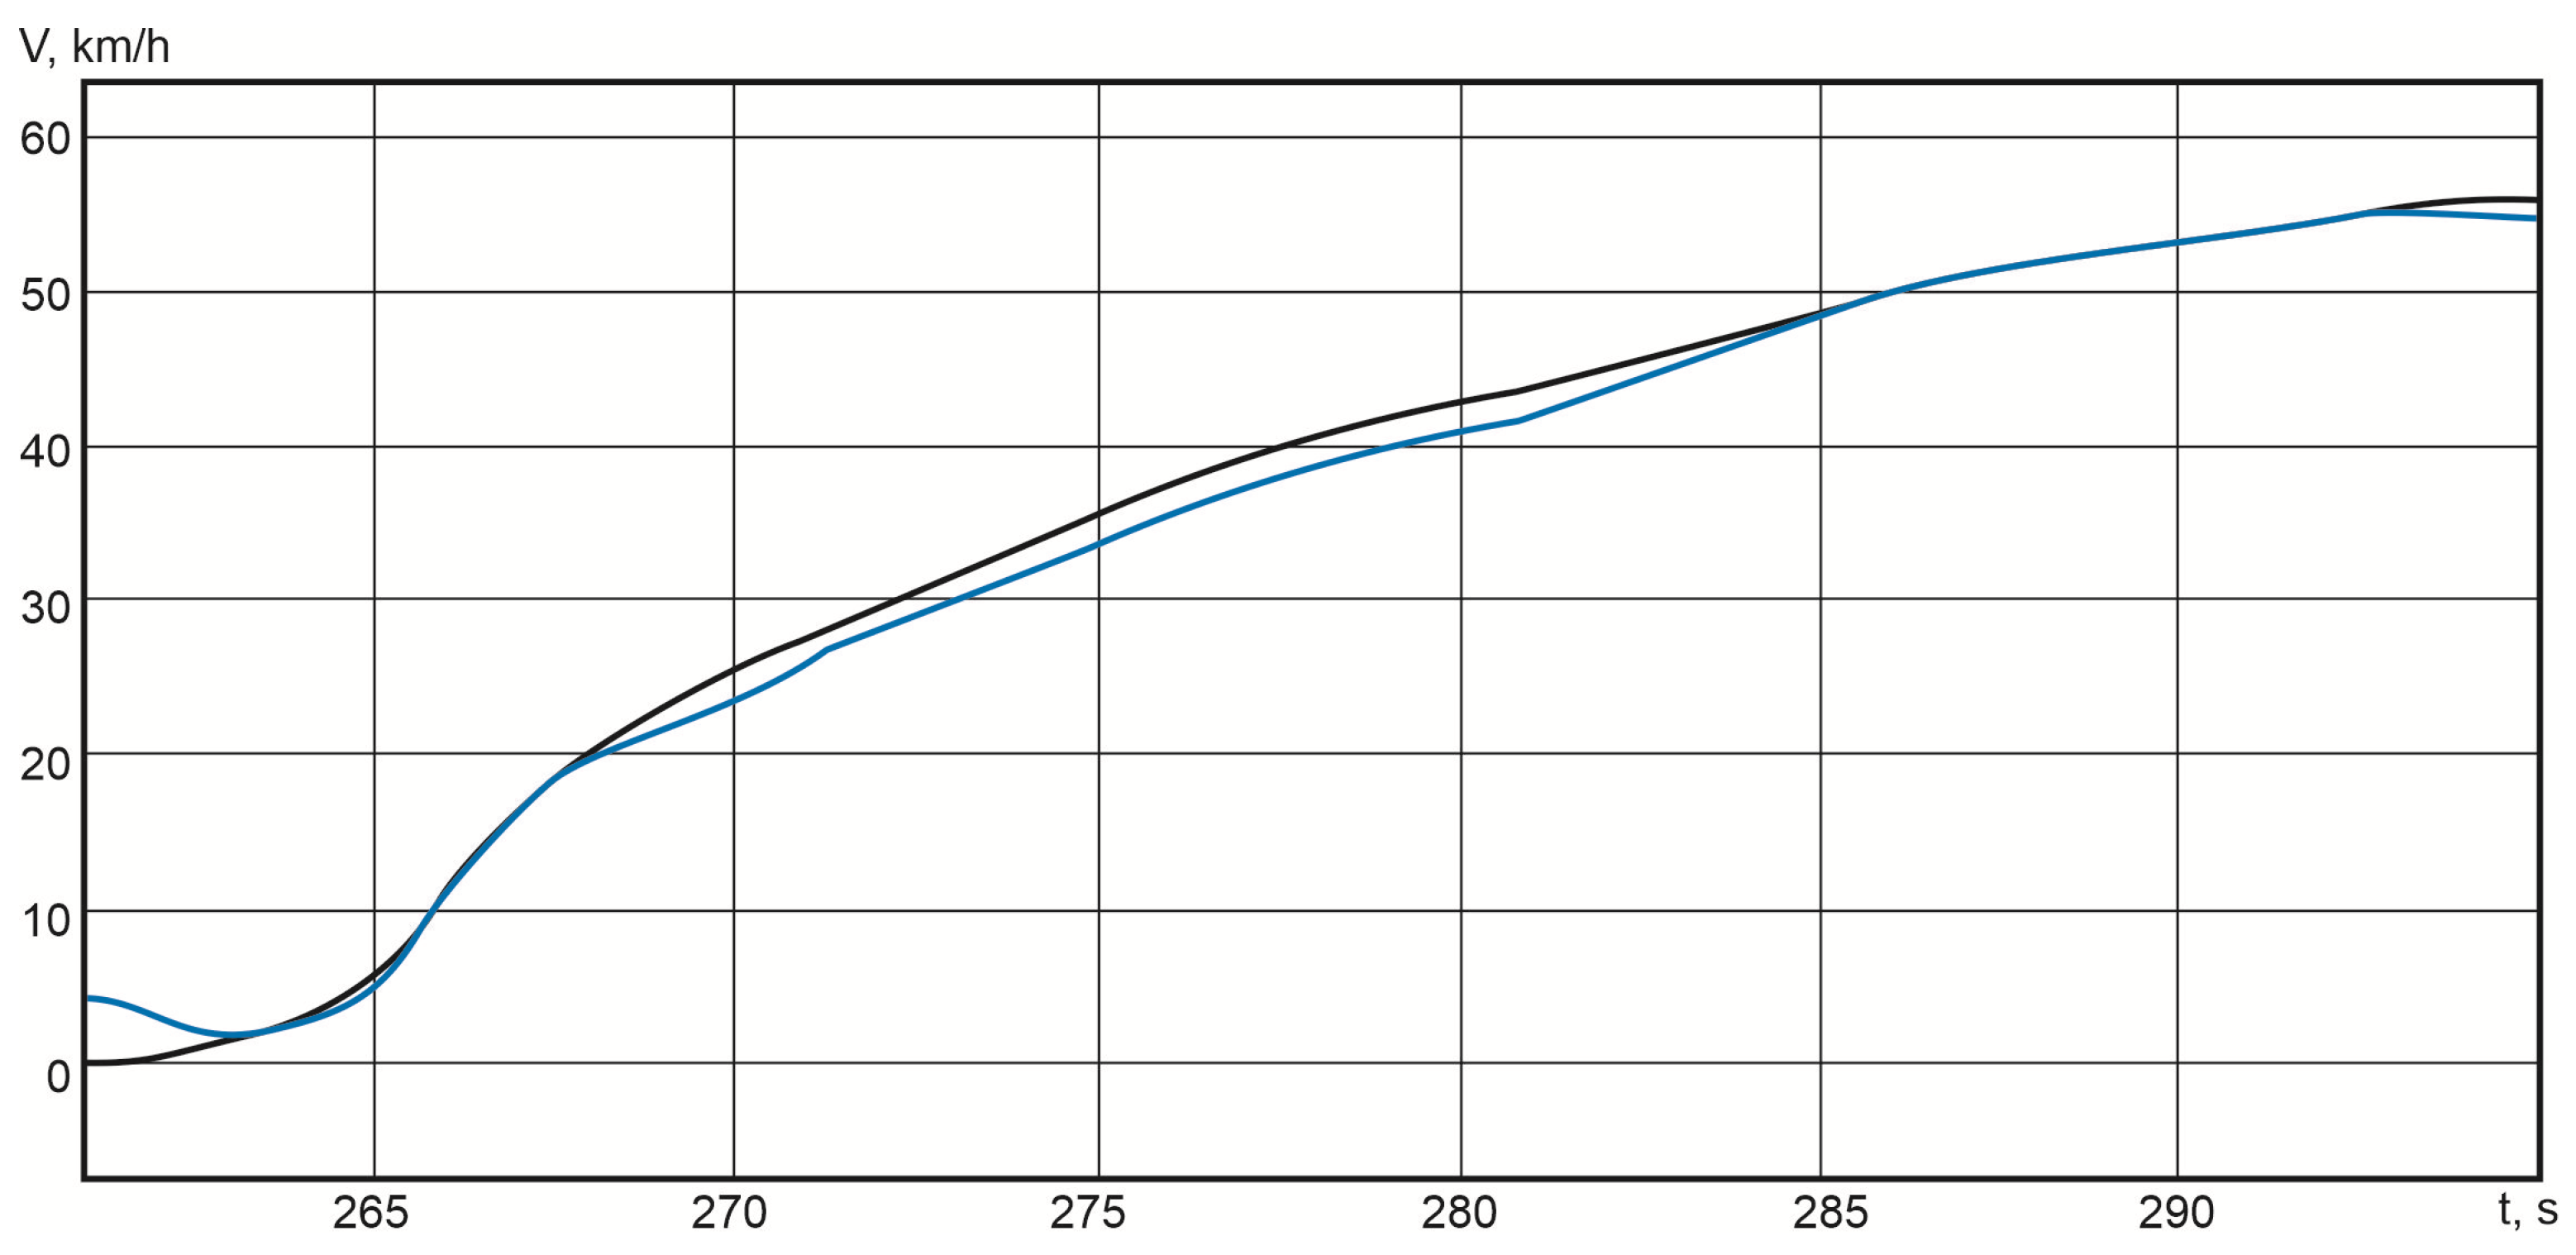
- Actual speed of the electric vehicle.
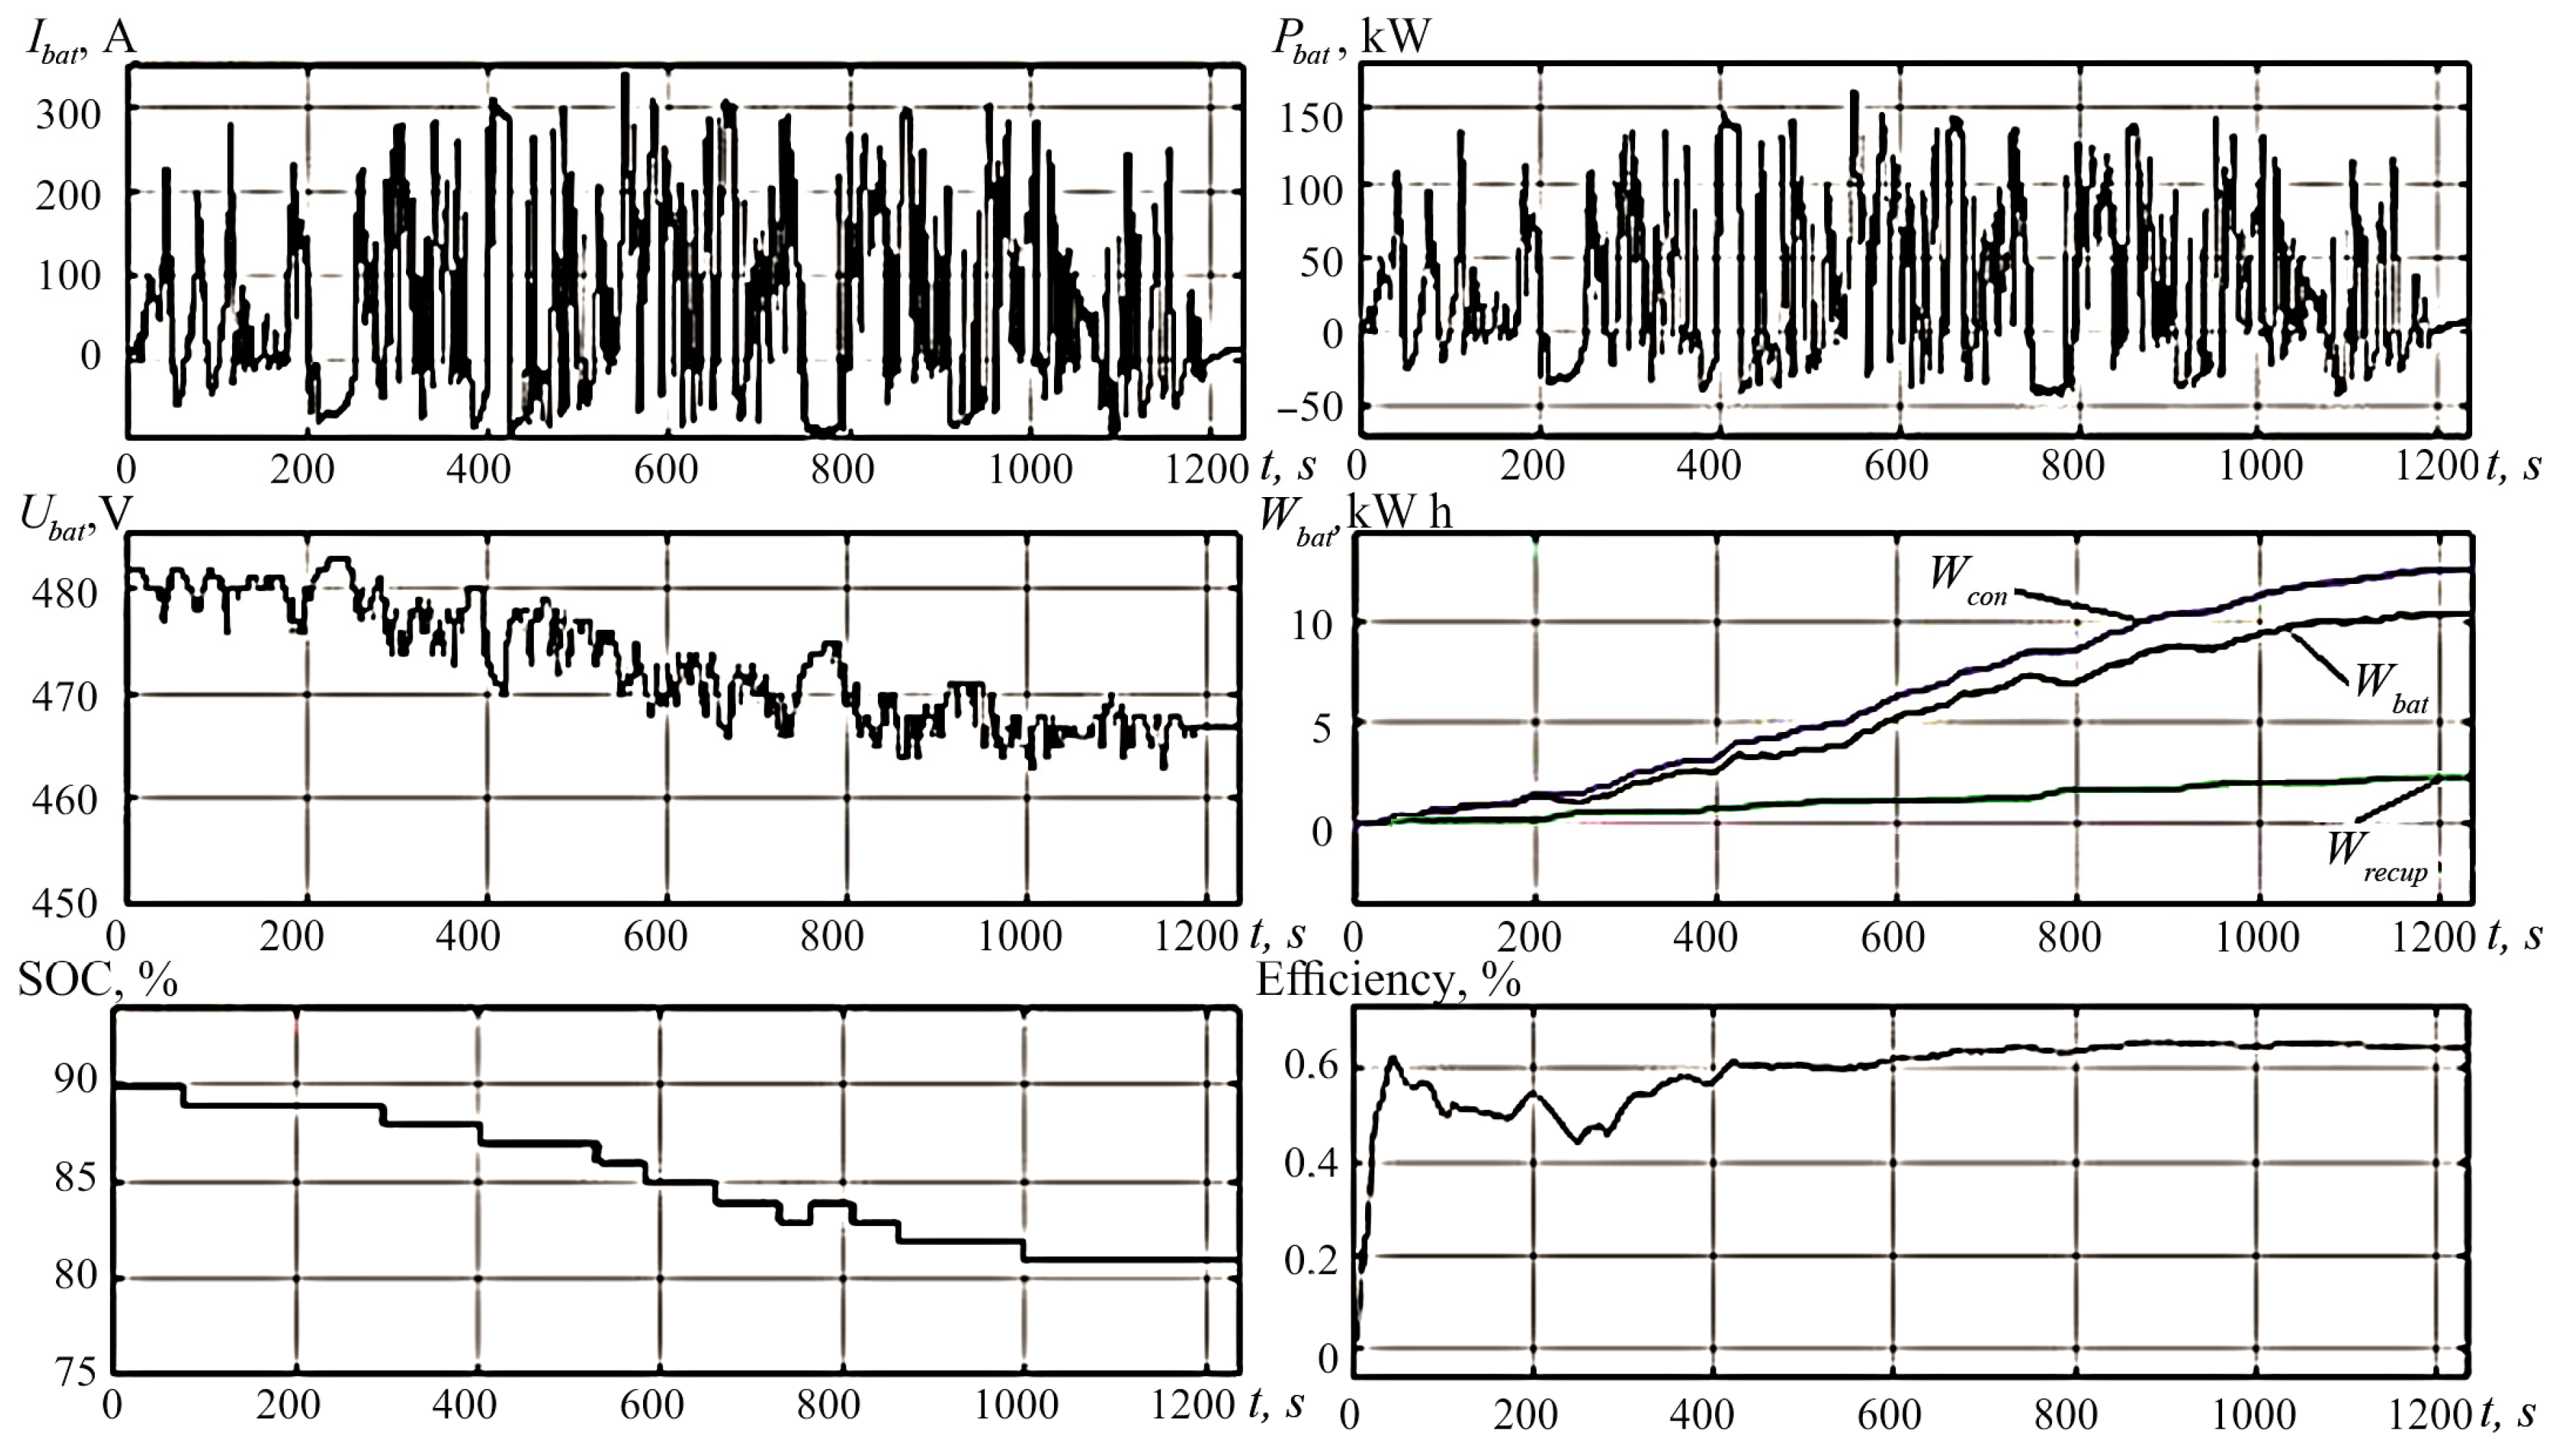
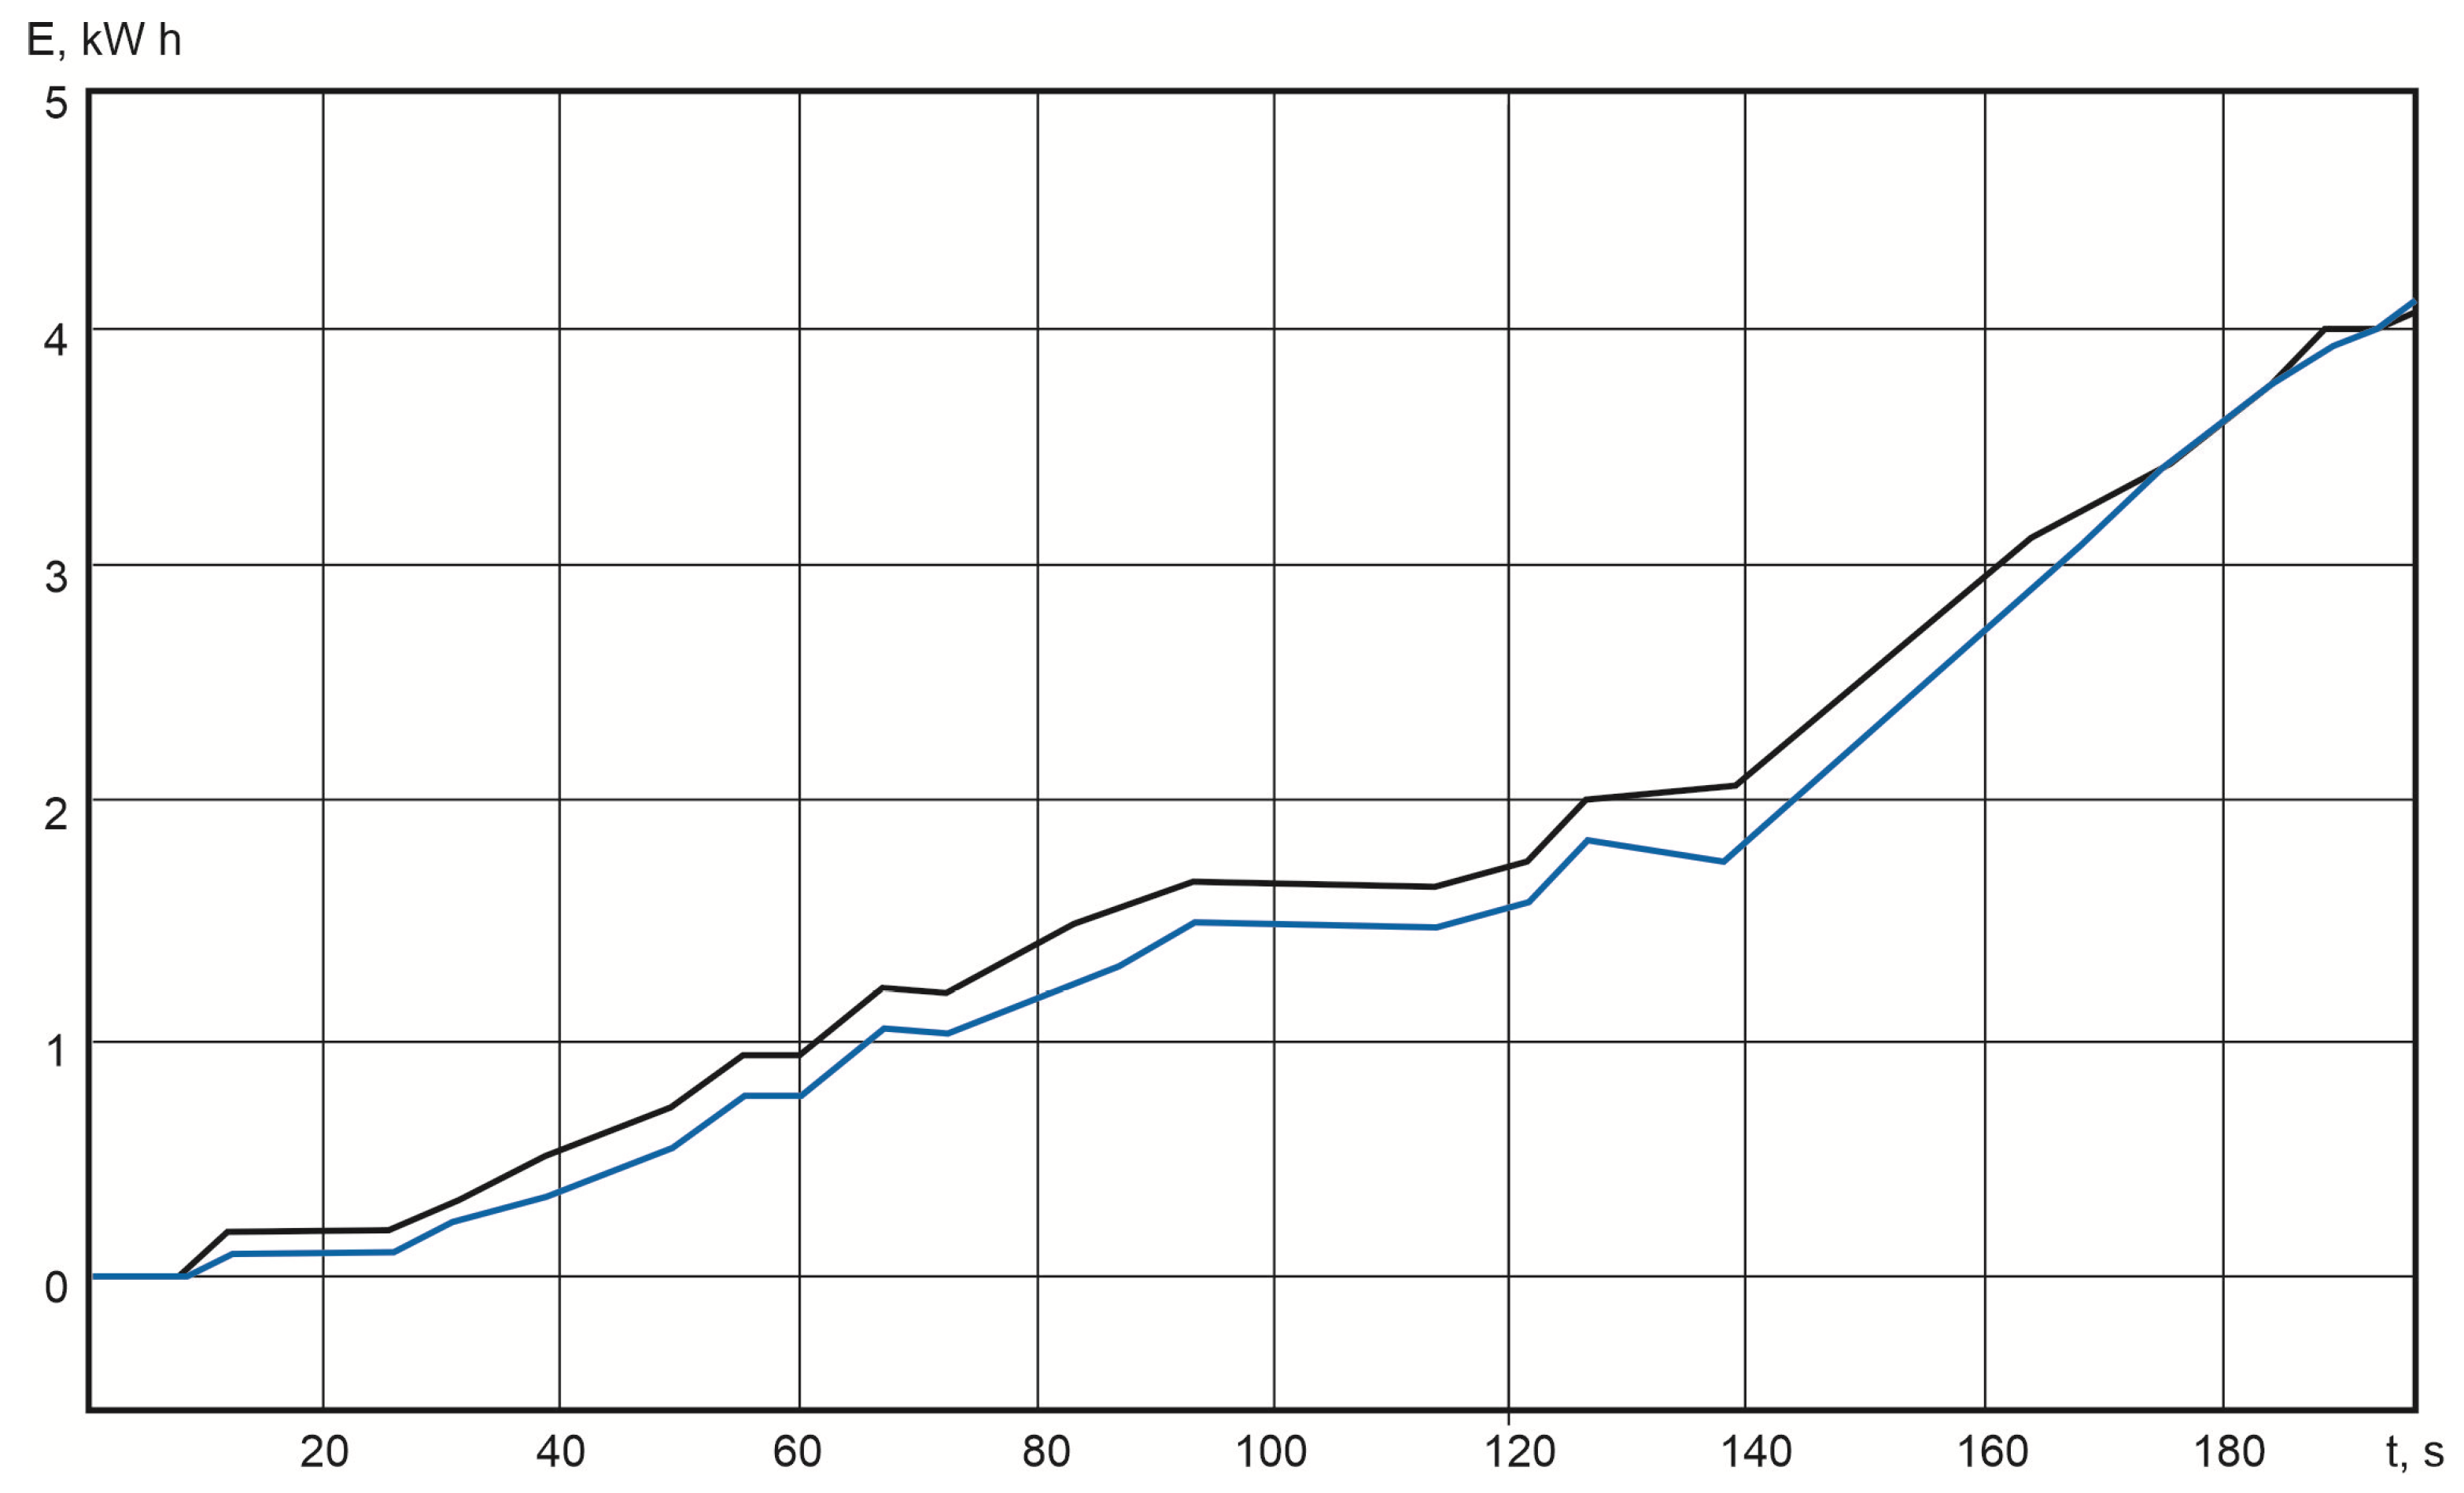
4.3. Verification of the Energy Performance of an Electric Bus
4.4. Verification of Speed Characteristics with a Test Report
5. Conclusions
Author Contributions
Funding
Data Availability Statement
Conflicts of Interest
References
- Casals, L.C.; Martinez-Laserna, E.; García, B.A.; Nieto, N. Sustainability analysis of the electric vehicle use in Europe for CO2 emissions reduction. J. Clean. Prod. 2016, 127, 425–437. [Google Scholar] [CrossRef]
- Colvile, R.N.; Hutchinson, E.J.; Mindell, J.S.; Warren, R.F. The transport sector as a source of air pollution. Atmos. Environ. 2001, 35, 1537–1565. [Google Scholar] [CrossRef]
- Waldmann, T.; Kasper, M.; Fleischhammer, M.; Wohlfahrt-Mehrens, M. Temperature dependent aging mechanisms in Lithium-Ion batteries—A Post-Mortem study. J. Power Sources 2014, 363, 129–135. [Google Scholar] [CrossRef]
- Filina, O.A.; Tynchenko, V.S.; Kukartsev, V.A.; Bashmur, K.A.; Pavlov, P.P.; Panfilova, T.A. Increasing the Efficiency of Diagnostics in the Brush-Commutator Assembly of a Direct Current Electric Motor. Energies 2024, 17, 17. [Google Scholar] [CrossRef]
- Xia, B.; Wang, S.; Tian, Y.; Sun, W.; Xu, Z.; Zheng, W. Experimental study on the linixcoymnzo2 lithium-ion battery characteristics for model modification of SOC estimation. Inf. Technol. J. 2014, 13, 2395–2403. [Google Scholar] [CrossRef]
- Boychuk, I.P.; Grinek, A.V.; Tynchenko, V.S.; Kukartsev, V.A.; Tynchenko, Y.A.; Kondratiev, S.I. A Methodological Approach to the Simulation of a Ship’s Electric Power System. Energies 2023, 16, 8101. [Google Scholar] [CrossRef]
- Li, X.; Jiang, J.; Zhang, C.; Wang, L.Y.; Zheng, L. Robustness of SOC estimation algorithms for EV lithium-ion batteries against modelling errors and measurement noise. Math. Probl. Eng. 2015, 2015, 719490. [Google Scholar]
- Tian, Y.; Xia, B.; Wang, M.; Sun, W.; Xu, Z. Comparison study on two model-based adaptive algorithms for SOC estimation of lithium-ion batteries in electric vehicles. Energies 2014, 7, 8446–8464. [Google Scholar] [CrossRef]
- Tseng, K.-H.; Liang, J.-W.; Chang, W.; Huang, S.-C. Regression models using fully discharged voltage and internal resistance for state of health estimation of lithium-ion batteries. Energies 2015, 8, 2889–2907. [Google Scholar] [CrossRef]
- Kukartsev, V.V.; Gozbenko, V.E.; Konyukhov, V.Y.; Mikhalev, A.S.; Kukartsev, V.A.; Tynchenko, Y.A. Determination of the Reliability of Urban Electric Transport Running Autonomously through Diagnostic Parameters. World Electr. Veh. J. 2023, 14, 334. [Google Scholar] [CrossRef]
- Hafsaoui, J.; Sellier, F. Electrochemical model and its parameters identification tool for the follow-up of battery aging. World Electric. Veh. J. 2010, 4, 386–395. [Google Scholar] [CrossRef]
- Prada, E.; Di Domenico, D.; Creff, Y.; Sauvant-Moynot, V. Towards advanced BMS algorithms development for (p)hev and EV by using a physics-based model of Li-Ion Battery Systems. World Electric. Veh. J. 2013, 6, 807–818. [Google Scholar] [CrossRef]
- Varini, M.; Campana, P.E.; Lindbergh, G. A semi-empirical, electrochemistry-based model for Li-ion battery performance prediction over lifetime. J. Energy Storage 2019, 25, 100819. [Google Scholar] [CrossRef]
- Ashwin, T.R.; McGordon, A.; Jennings, P.A. Electrochemical modelling of li-ion battery packs with constant voltage cycling. J. Power Sources 2017, 341, 327–339. [Google Scholar] [CrossRef]
- Somakettarin, N.; Pichetjamroen, A. A study on modelling of effective series resistance for lithium-ion batteries under life cycle consideration. IOP Conf. Ser. Earth Environ. Sci. 2019, 322, 012008. [Google Scholar] [CrossRef]
- Kuo, T.J.; Lee, K.Y.; Chiang, M.H. Development of a neural network model for SOH of LiFePO4 batteries under different aging conditions. IOP Conf. Ser. Mater. Sci. Eng. 2019, 486, 012083. [Google Scholar] [CrossRef]
- Davydenko, L.; Davydenko, N.; Bosak, A.; Bosak, A.; Deja, A.; Dzhuguryan, T. Smart Sustainable Freight Transport for a City Multi-Floor Manufacturing Cluster: A Framework of the Energy Efficiency Monitoring of Electric Vehicle Fleet Charging. Energies 2022, 15, 3780. [Google Scholar] [CrossRef]
- Mamun, K.A.; Islam, F.R.; Haque, R.; Chand, A.A.; Prasad, K.A.; Goundar, K.K.; Prakash, K.; Maharaj, S. Systematic Modelling and Analysis of On-Board Vehicle Integrated Novel Hybrid Renewable Energy System with Storage for Electric Vehicles. Sustainability 2022, 14, 2538. [Google Scholar] [CrossRef]
- Chao, P.-P.; Zhang, R.-Y.; Wang, Y.-D.; Tang, H.; Dai, H.-L. Warning model of new energy vehicle under improving time-to-rollover with neural network. Meas. Control 2022, 55, 1004–1015. [Google Scholar] [CrossRef]
- Pusztai, Z.; K’orös, P.; Szauter, F.; Friedler, F. Vehicle Model-Based Driving Strategy Optimisation for Lightweight Vehicle. Energies 2022, 15, 3631. [Google Scholar] [CrossRef]
- Mariani, V.; Rizzo, G.; Tiano, F.; Glielmo, L. A model predictive control scheme for regenerative braking in vehicles with hybridised architectures via aftermarket kits. Control Eng. Pract. 2022, 123, 105142. [Google Scholar] [CrossRef]
- Martyushev, N.V.; Malozyomov, B.V.; Filina, O.A.; Sorokova, S.N.; Efremenkov, E.A.; Valuev, D.V.; Qi, M. Stochastic Models and Processing Probabilistic Data for Solving the Problem of Improving the Electric Freight Transport Reliability. Mathematics 2023, 11, 4836. [Google Scholar] [CrossRef]
- Li, S.; Yu, B.; Feng, X. Research on braking energy recovery strategy of electric vehicle based on ECE regulation and I curve. Sci. Prog. 2020, 103, 0036850419877762. [Google Scholar] [CrossRef]
- Laadjal, K.; Cardoso, A.J.M. Estimation of Lithium-Ion Batteries State-Condition in Electric Vehicle Applications: Issues and State of the Art. Electronics 2021, 10, 1588. [Google Scholar] [CrossRef]
- Cordoba, A. Capacity and power fade cycle-life model for plug-in hybrid electric vehicle lithium-ion battery cells containing blended spinel and layered-oxide positive electrodes. J. Power Sources 2015, 278, 473–483. [Google Scholar] [CrossRef]
- Mei, J.; Zuo, Y.; Lee, C.H.; Wang, X.; Kirtley, J.L. Stochastic optimisation of multi-energy system operation considering hydrogen-based vehicle applications. Adv. Appl. Energy 2021, 2, 100031. [Google Scholar] [CrossRef]
- Wu, X. Research and Implementation of Electric Vehicle Braking Energy Recovery System Based on Computer. J. Phys. Conf. Ser. 2021, 1744, 022080. [Google Scholar] [CrossRef]
- Sorokova, S.N.; Efremenkov, E.A.; Valuev, D.V.; Qi, M. Review Models and Methods for Determining and Predicting the Reliability of Technical Systems and Transport. Mathematics 2023, 11, 3317. [Google Scholar] [CrossRef]
- Domanov, K.; Shatohin, A.; Nezevak, V.; Cheremisin, V. Improving the technology of operating electric locomotives using electric power storage device. E3S Web Conf. 2019, 110, 01033. [Google Scholar] [CrossRef]
- Debelov, V.V.; Endachev, D.V.; Yakunov, D.M.; Deev, O.M. Charging balance management technology for low-voltage battery in the car control unit with combined power system. IOP Conf. Ser. Mater. Sci. Eng. 2019, 534, 012029. [Google Scholar] [CrossRef]
- Malozyomov, B.V.; Martyushev, N.V.; Konyukhov, V.Y.; Oparina, T.A.; Zagorodnii, N.A.; Efremenkov, E.A.; Qi, M. Mathematical Analysis of the Reliability of Modern Trolleybuses and Electric Buses. Mathematics 2023, 11, 3260. [Google Scholar] [CrossRef]
- Liu, X.; Zhao, M.; Wei, Z.; Lu, M. The energy management and economic optimisation scheduling of microgrid based on Coloured Petri net and Quantum-PSO algorithm. Sustain. Energy Technol. Assess. 2022, 53, 102670. [Google Scholar] [CrossRef]
- Tormos, B.; Pla, B.; Bares, P.; Pinto, D. Energy Management of Hybrid Electric Urban Bus by Off-Line Dynamic Programming Optimisation and One-Step Look-Ahead Rollout. Appl. Sci. 2022, 12, 4474. [Google Scholar] [CrossRef]
- Zhou, J.; Feng, C.; Su, Q.; Jiang, S.; Fan, Z.; Ruan, J.; Sun, S.; Hu, L. The Multi-Objective Optimisation of Powertrain Design and Energy Management Strategy for Fuel Cell-Battery Electric Vehicle. Sustainability 2022, 14, 6320. [Google Scholar] [CrossRef]
- Wang, Y.; Chen, N.; Fan, G.; Yang, D.; Rao, L.; Cheng, S.; Song, X. DLPformer: A Hybrid Mathematical Model for State of Charge Prediction in Electric Vehicles Using Machine Learning Approaches. Mathematics 2023, 11, 4635. [Google Scholar] [CrossRef]
- Sorokova, S.N.; Efremenkov, E.A.; Qi, M. Mathematical Modelling the Performance of an Electric Vehicle Considering Various Driving Cycles. Mathematics 2023, 11, 2586. [Google Scholar] [CrossRef]
- Ehsani, M.; Wang, F.-Y.; Brosch, G.L. (Eds.) Transportation Technologies for Sustainability; Springer: New York, NY, USA, 2013. [Google Scholar]
- Voitovich, E.V.; Kononenko, R.V.; Konyukhov, V.Y.; Tynchenko, V.; Kukartsev, V.A.; Tynchenko, Y.A. Designing the Optimal Configuration of a Small Power System for Autonomous Power Supply of Weather Station Equipment. Energies 2023, 16, 5046. [Google Scholar] [CrossRef]
- Sorokova, S.N.; Efremenkov, E.A.; Qi, M. Mathematical Modelling of Mechanical Forces and Power Balance in Electromechanical Energy Converter. Mathematics 2023, 11, 2394. [Google Scholar] [CrossRef]
- Raugei, M.; Hutchinson, A.; Morrey, D. Can electric vehicles significantly reduce our dependence on non-renewable energy? Scenarios of compact vehicles in the UK as a case in point. J. Clean. Prod. 2018, 201, 1043–1051. [Google Scholar] [CrossRef]
- Xia, Q.; Wang, Z.; Ren, Y.; Sun, B.; Yang, D.; Feng, Q. A reliability design method for a lithium-ion battery pack considering the thermal disequilibrium in electric vehicles. J. Power Sources 2018, 386, 10–20. [Google Scholar] [CrossRef]
- Balagurusamy, E. Reliability Engineering, First. P-24, Green Park Extension; McGraw Hill Education (India) Private Limited: New Delhi, India, 2002. [Google Scholar]
- Malozyomov, B.V.; Martyushev, N.V.; Kukartsev, V.V.; Tynchenko, V.S.; Bukhtoyarov, V.V.; Wu, X.; Tyncheko, Y.A.; Kukartsev, V.A. Overview of Methods for Enhanced Oil Recovery from Conventional and Unconventional Reservoirs. Energies 2023, 16, 4907. [Google Scholar] [CrossRef]
- Khalikov, I.H.; Kukartsev, V.A.; Kukartsev, V.V.; Tynchenko, V.S.; Tynchenko, Y.A.; Qi, M. Review of Methods for Improving the Energy Efficiency of Electrified Ground Transport by Optimizing Battery Consumption. Energies 2023, 16, 729. [Google Scholar]
- Aggarwal, K.K. Maintainability and Availability, Topics in Safety Reliability and Quality; Springer: Dordrecht, The Netherlands, 1993. [Google Scholar]
- Shu, X.; Guo, Y.; Yang, W.; Wei, K.; Zhu, Y.; Zou, H. A Detailed Reliability Study of the Motor System in Pure Electric Vans by the Approach of Fault Tree Analysis. IEEE Access 2020, 8, 5295–5307. [Google Scholar] [CrossRef]
- Klyuev, R.V.; Dedov, S.I. Determination of Inactive Powers in a Single-Phase AC Network. Energies 2021, 14, 4814. [Google Scholar] [CrossRef]
- Klyuev, R.V.; Andriashin, S.N. Degradation of Lithium-Ion Batteries in an Electric Transport Complex. Energies 2021, 14, 8072. [Google Scholar] [CrossRef]
- Kukartsev, V.A.; Kukartsev, V.V.; Tynchenko, S.V.; Klyuev, R.V.; Zagorodnii, N.A.; Tynchenko, Y.A. Study of Supercapacitors Built in the Start-Up System of the Main Diesel Locomotive. Energies 2023, 16, 3909. [Google Scholar] [CrossRef]
- Xia, Q.; Wang, Z.; Ren, Y.; Tao, L.; Lu, C.; Tian, J.; Hu, D.; Wang, Y.; Su, Y.; Chong, J.; et al. A modified reliability model for lithium-ion battery packs based on the stochastic capacity degradation and dynamic response impedance. J. Power Sources 2019, 423, 40–51. [Google Scholar] [CrossRef]
- Isametova, M.E.; Nussipali, R.; Martyushev, N.V.; Malozyomov, B.V.; Efremenkov, E.A.; Isametov, A. Mathematical Modelling of the Reliability of Polymer Composite Materials. Mathematics 2022, 10, 3978. [Google Scholar] [CrossRef]
- Bolvashenkov, I.; Herzog, H.-G. Approach to predictive evaluation of the reliability of electric drive train based on a stochastic model. In Proceedings of the 2015 International Conference on Clean Electrical Power (ICCEP), Taormina, Italy, 16–18 June 2015; pp. 486–492. [Google Scholar]
- Ammaiyappan, B.S.; Ramalingam, S. Reliability investigation of electric vehicles. Life Cycle Reliab. Saf. Eng. 2019, 8, 141–149. [Google Scholar] [CrossRef]
- Khalilzadeh, M.; Fereidunian, A. A Markovian approach applied to reliability modelling of bidirectional DC-DC converters used in PHEVs and smart grids. IJEEE 2016, 12, 301–313. [Google Scholar]
- Kheradmand-Khanekehdani, H.; Gitizadeh, M. Well-being analysis of distribution network in the presence of electric vehicles. Energy 2018, 155, 610–619. [Google Scholar] [CrossRef]
- Sadeghian, O.; N-Heris, M.; Abapour, M.; Taheri, S.S.; Zare, K. Improving reliability of distribution networks using plug-in electric vehicles and demand response. J. Mod. Power Syst. Clean Energy 2019, 7, 1189–1199. [Google Scholar] [CrossRef]
- Galiveeti, H.R.; Goswami, A.K.; Choudhury, N.B.D. Impact of plug-in electric vehicles and distributed generation on reliability of distribution systems. Eng. Sci. Technol. Int. J. 2018, 21, 50–59. [Google Scholar] [CrossRef]
- Garcés Quílez, M.; Abdel-Monem, M.; El Baghdadi, M.; Yang, Y.; Van Mierlo, J.; Hegazy, O. Modelling, Analysis and Performance Evaluation of Power Conversion Units in G2V/V2G Application-A Review. Energies 2018, 11, 1082. [Google Scholar] [CrossRef]
- Yelemessov, K.; Sabirova, L.B.; Bakhmagambetova, G.B.; Atanova, O.V. Modelling and Model Verification of the Stress-Strain State of Reinforced Polymer Concrete. Materials 2023, 16, 3494. [Google Scholar] [CrossRef]
- Lacey, G.; Putrus, G.; Bentley, E. Smart EV charging schedules: Supporting the grid and protecting battery life. IET Electr. Syst. Transp. 2017, 7, 84–91. [Google Scholar] [CrossRef]
- Kasturi, K.; Nayak, C.K.; Nayak, M.R. Electric vehicles management enabling G2V and V2G in smart distribution system for maximizing profits using MOMVO. Int. Trans. Electr. Energy Syst. 2019, 29, e12013. [Google Scholar] [CrossRef]
- EN 1986-1:1997; Electrically propelled road vehicles—Measurement of energy performances. Slovenian Institute of Standardization: Ljubljana, Slovenia, 2024. Available online: https://standards.iteh.ai/catalog/standards/cen/b0a26ef0-5331-4c51-a488-c84e15b39b6e/en-1986-1-1997 (accessed on 20 December 2023).
- Malozyomov, B.V.; Kukartsev, V.V.; Martyushev, N.V.; Kondratiev, V.V.; Klyuev, R.V.; Karlina, A.I. Improvement of Hybrid Electrode Material Synthesis for Energy Accumulators Based on Carbon Nanotubes and Porous Structures. Micromachines 2023, 14, 1288. [Google Scholar] [CrossRef] [PubMed]
- Sorokova, S.N.; Efremenkov, E.A.; Qi, M. Mathematical Modelling of the State of the Battery of Cargo Electric Vehicles. Mathematics 2023, 11, 536. [Google Scholar] [CrossRef]
- Baranovskyi, D.; Bulakh, M.; Michajłyszyn, A.; Myamlin, S.; Muradian, L. Determination of the Risk of Failures of Locomotive Diesel Engines in Maintenance. Energies 2023, 16, 4995. [Google Scholar] [CrossRef]
- De Santis, M.; Silvestri, L.; Forcina, A. Promoting electric vehicle demand in Europe: Design of innovative electricity consumption simulator and subsidy strategies based on well-to-wheel analysis. Energy Convers. Manag. 2022, 270, 116279, ISSN 0196-8904. [Google Scholar] [CrossRef]
- Pollák, F.; Vodák, J.; Soviar, J.; Markovič, P.; Lentini, G.; Mazzeschi, V.; Luè, A. Promotion of Electric Mobility in the European Union-Overview of Project PROMETEUS from the Perspective of Cohesion through Synergistic Cooperation on the Example of the Catching-Up Region. Sustainability 2021, 13, 1545. [Google Scholar] [CrossRef]
- Volneikina, E.; Kukartseva, O.; Menshenin, A.; Tynchenko, V.; Degtyareva, K. Simulation-Dynamic Modelling of Supply Chains Based On Big Data. In Proceedings of the 2023 22nd International Symposium INFOTEH-JAHORINA, INFOTEH 2023, East Sarajevo, Bosnia and Herzegovina, 15–17 March 2023. [Google Scholar] [CrossRef]
- Tynchenko, V.S.; Tynchenko, Y.A.; Rogova, D.V.; Leonteva, A.A. Computational model of soldered details heating with considering the magnetic field distribution. J. Phys. Conf. Ser. 2022, 2373, 062015. [Google Scholar] [CrossRef]


| Route Number | Distance, km | Average Speed, km/h | Energy in Cycle, kW | Recovery Energy, kW∙h | Energy Consumption, kWh/km |
|---|---|---|---|---|---|
| 1 | 15.01 | 31.22 | 12.75 | 2.65 | 0.85 |
| 2 | 16.34 | 28.81 | 17.55 | 3.68 | 1.08 |
| Parameter | Designation | Significance | Unit |
|---|---|---|---|
| Wheel arrangement | 4 × 2 | ||
| Gross weight | ma | 16,000 | kg |
| Curb weight | mc | 10,000 | kg |
| Frontal projection area of the EV | Sa | 7.53 | m2 |
| Aerodynamic drag coefficient | cx | 0.86 | |
| Dynamic radius of the EV wheel | rk | 0.451 | m |
| Gearbox efficiency | 0.958 | ||
| Gear ratio of the first gearbox | igb1 | 5.82 | |
| Gear ratio of the second gearbox | igb2 | 3.92 | |
| Rolling resistance coefficient | f | 0.013 | |
| Speed of EV movement | Va | defined by a cycle | m/s |
| Maximum speed | Vmax | 80 | m/s |
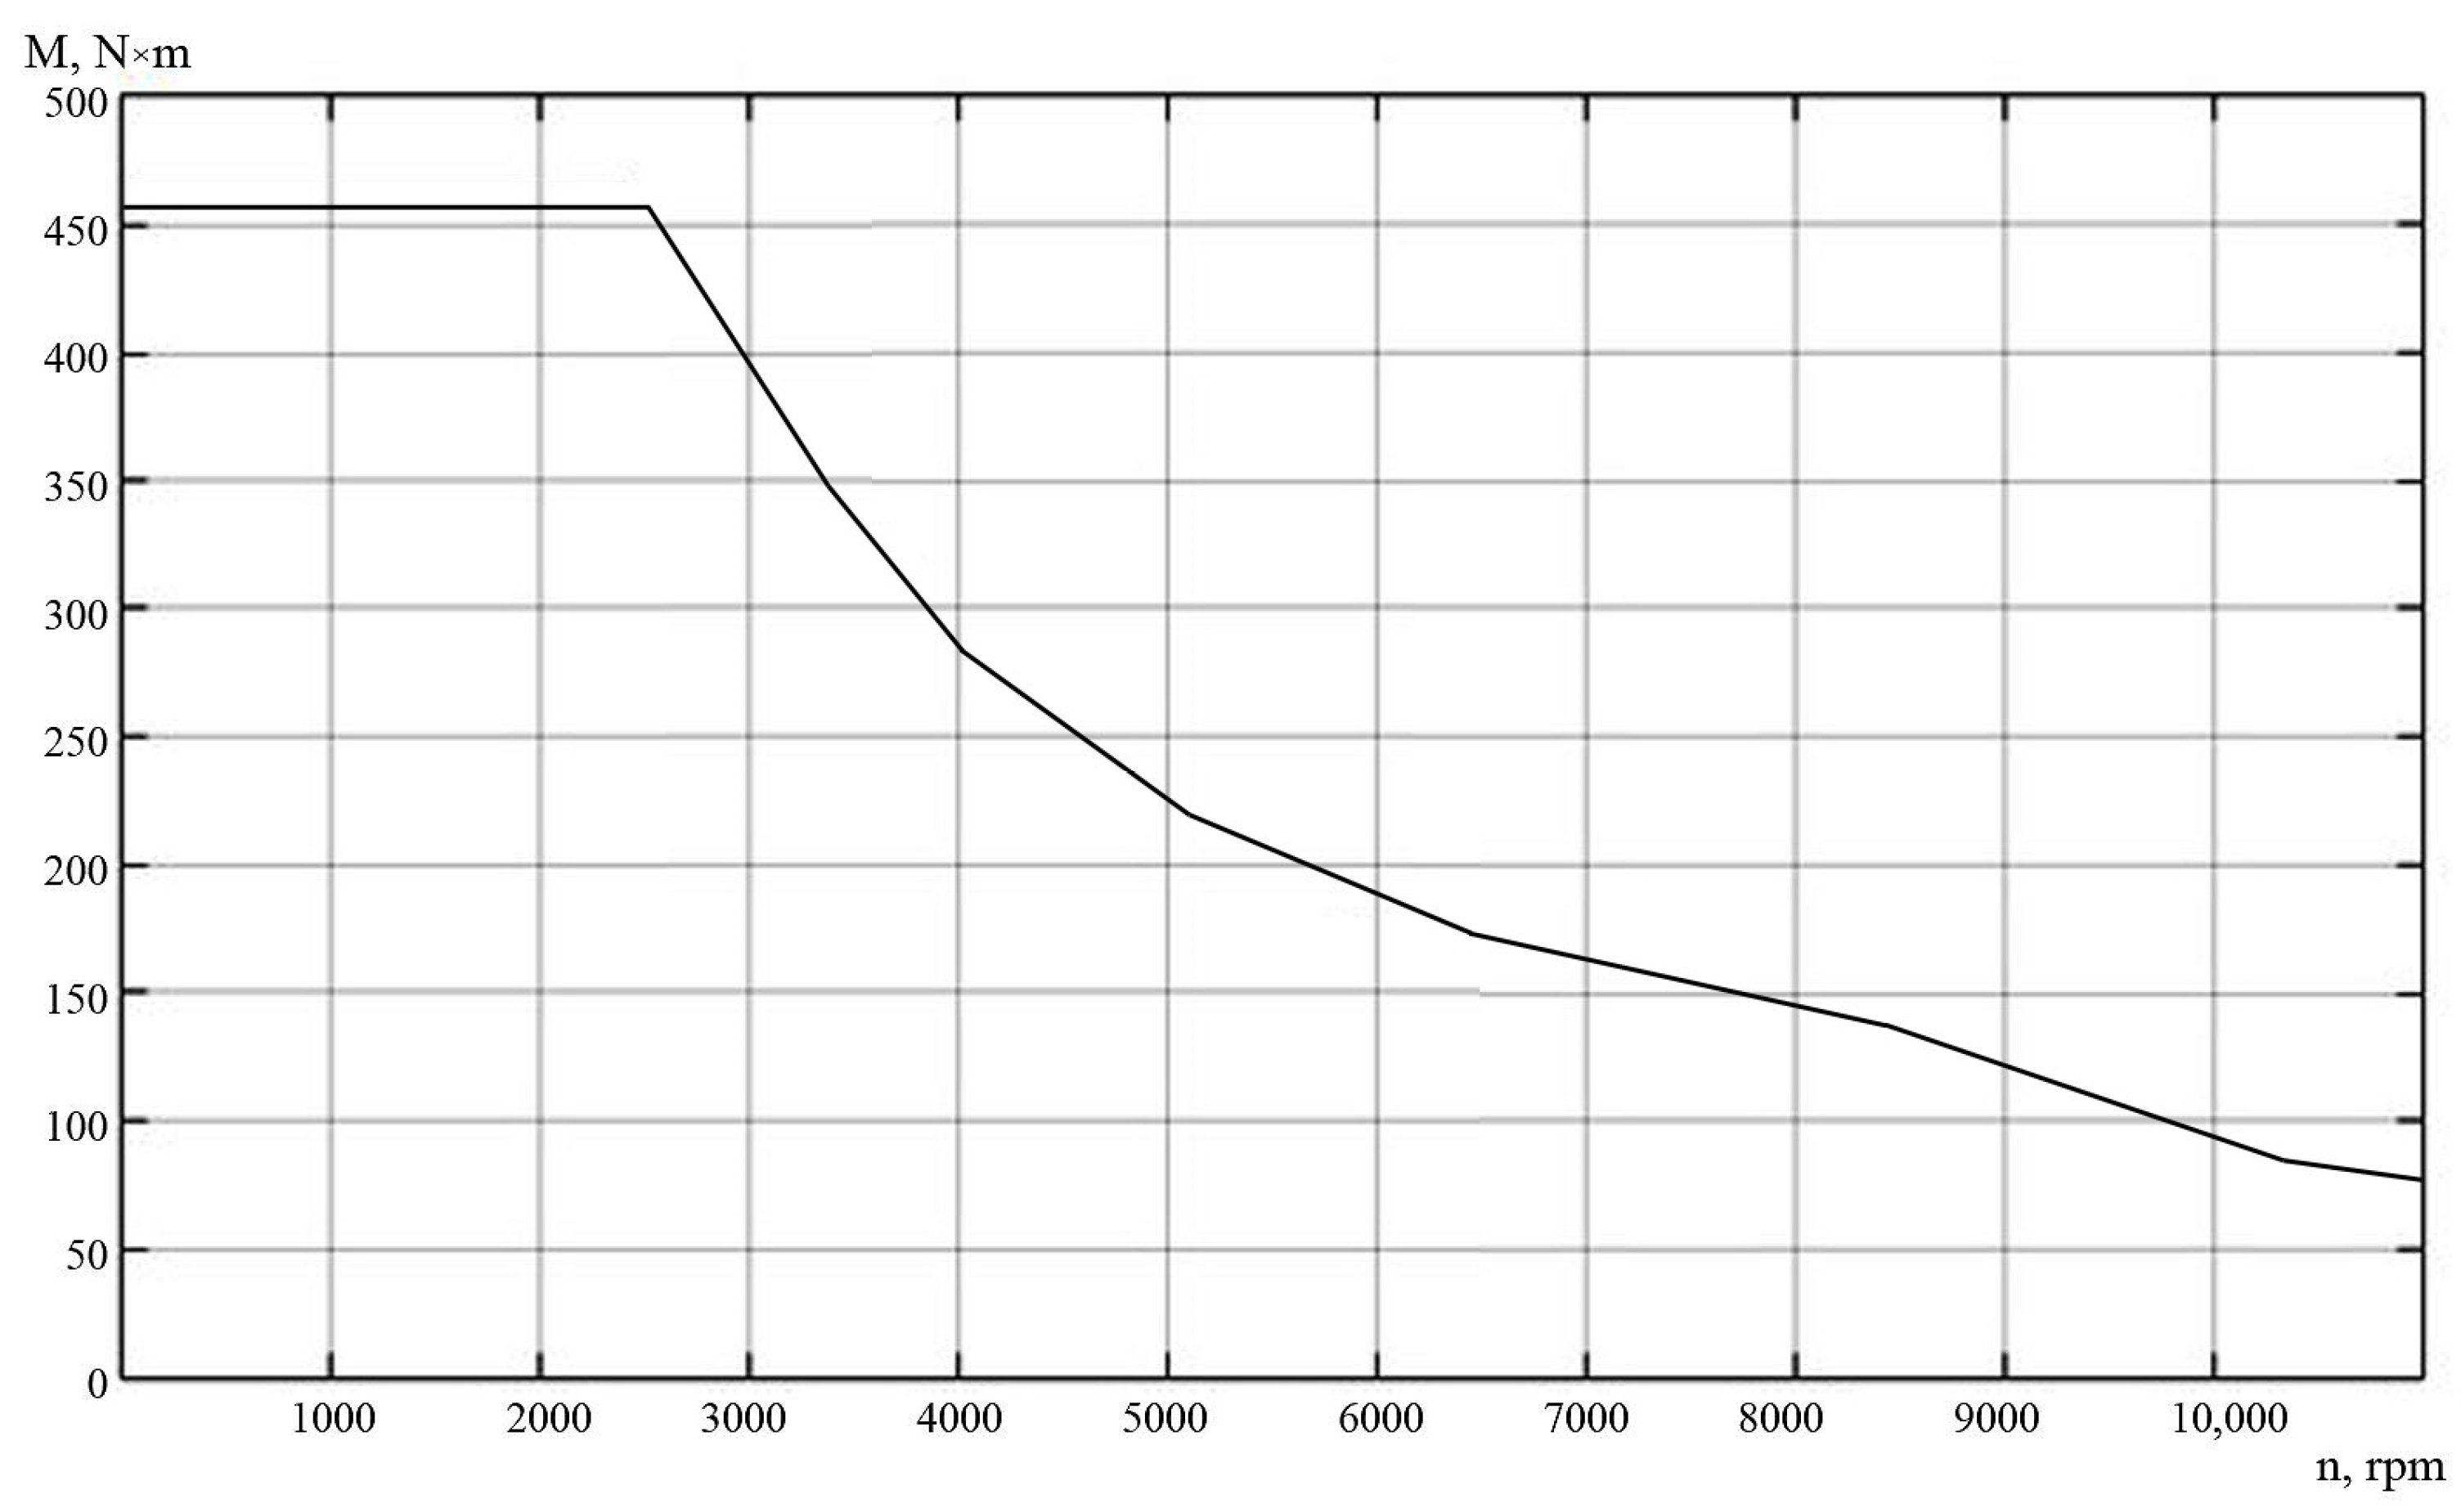
| Traction motor (TM) torque, nom/peak | Me | 260/450 | N m |
| Maximum speed of the TM | nmax | 11,500 | min−1 |
| Nominal/maximum battery voltage | UBAT | 460 | V |
| Battery capacity | C | 140 | A·h |
| Tyres | 245/70R 19.5 | ||
| Acceleration (deceleration) of the EV when driving | a | defined by a loop | m/s2 |
| Air density | r | 1.31 | kg/m3 |
| Free-fall acceleration | g | 9.81 | m/s2 |
| Angle of a track profile inclination | defined by a track profile | radians |
| Parameter | Unit | Significance |
|---|---|---|
| Maximum motor shaft torque including intermediate gearboxes | Nm | 485 |
| Maximum speed at a maximum torque | 1/min | 11,000 |
| Maximum power per shaft | kW | 120 |
| Maximum short-term effective current based on the maximum power rating | A | 350 A |
| Minimum DC voltage value | V | 580 |
| Maximum DC voltage value | V | 800 |
| Permissible ambient operating temperatures from −40 to 85 °C | °C | −40.85 |
Disclaimer/Publisher’s Note: The statements, opinions and data contained in all publications are solely those of the individual author(s) and contributor(s) and not of MDPI and/or the editor(s). MDPI and/or the editor(s) disclaim responsibility for any injury to people or property resulting from any ideas, methods, instructions or products referred to in the content. |
© 2024 by the authors. Licensee MDPI, Basel, Switzerland. This article is an open access article distributed under the terms and conditions of the Creative Commons Attribution (CC BY) license (https://creativecommons.org/licenses/by/4.0/).
Share and Cite
Malozyomov, B.V.; Martyushev, N.V.; Kukartsev, V.V.; Konyukhov, V.Y.; Oparina, T.A.; Sevryugina, N.S.; Gozbenko, V.E.; Kondratiev, V.V. Determination of the Performance Characteristics of a Traction Battery in an Electric Vehicle. World Electr. Veh. J. 2024, 15, 64. https://doi.org/10.3390/wevj15020064
Malozyomov BV, Martyushev NV, Kukartsev VV, Konyukhov VY, Oparina TA, Sevryugina NS, Gozbenko VE, Kondratiev VV. Determination of the Performance Characteristics of a Traction Battery in an Electric Vehicle. World Electric Vehicle Journal. 2024; 15(2):64. https://doi.org/10.3390/wevj15020064
Chicago/Turabian StyleMalozyomov, Boris V., Nikita V. Martyushev, Vladislav V. Kukartsev, Vladimir Yu. Konyukhov, Tatiana A. Oparina, Nadezhda S. Sevryugina, Valeriy E. Gozbenko, and Viktor V. Kondratiev. 2024. "Determination of the Performance Characteristics of a Traction Battery in an Electric Vehicle" World Electric Vehicle Journal 15, no. 2: 64. https://doi.org/10.3390/wevj15020064
APA StyleMalozyomov, B. V., Martyushev, N. V., Kukartsev, V. V., Konyukhov, V. Y., Oparina, T. A., Sevryugina, N. S., Gozbenko, V. E., & Kondratiev, V. V. (2024). Determination of the Performance Characteristics of a Traction Battery in an Electric Vehicle. World Electric Vehicle Journal, 15(2), 64. https://doi.org/10.3390/wevj15020064