Article

Thermal Performance Enhancement of Lithium-Ion Batteries Using Phase Change Material and Fin Geometry Modification

Department of Mechanical Engineering, Capital University of Science and Technology, Islamabad 44000, Pakistan
*
Author to whom correspondence should be addressed.
World Electr. Veh. J. 2024, 15(2), 42; https://doi.org/10.3390/wevj15020042
Submission received: 12 December 2023 / Revised: 22 January 2024 / Accepted: 26 January 2024 / Published: 30 January 2024
(This article belongs to the Special Issue Lithium-Ion Batteries for Electric Vehicle)

Abstract

:
The rapid increase in emissions and the depletion of fossil fuels have led to a rapid rise in the electric vehicle (EV) industry. Electric vehicles predominantly rely on lithium-ion batteries (LIBs) to power their electric motors. However, the charging and discharging processes of LIB packs generate heat, resulting in a significant decline in the battery performance of EVs. Consequently, there is a pressing need for effective battery thermal management systems (BTMSs) for lithium-ion batteries in EVs. In the current study, a novel experimental BTMS was developed for the thermal performance enhancement of an LIB pack comprising 2 × 2 cells. Three distinct fin configurations (circular, rectangular, and tapered) were integrated for the outer wall of the lithium-ion cells. Additionally, the cells were fully submerged in phase change material (PCM). The study considered 1C, 2C, and 3C cell discharge rates, affiliated with their corresponding volumetric heat generation rates. The combination of rectangular fins and PCM manifested superior performance, reducing the mean cell temperature by 29.71% and 28.36% compared to unfinned lithium-ion cells under ambient conditions at the 1C and 2C discharge rates. Furthermore, at the 3C discharge rate, lithium-ion cells equipped with rectangular fins demonstrated a delay of 40 min in reaching the maximum surface temperature of 40 ° C compared to the unfinned ambient case. After 60 min of battery discharge at the 3C rate, the cell surface temperature of the rectangular fin case only reached 42.7 ° C. Furthermore, numerical simulations showed that the Nusselt numbers for lithium-ion cells with rectangular fins improved by 9.72% compared to unfinned configurations at the 3C discharge rate.

1. Introduction

Concerns about the environment and the need for zero-emission transportation have pushed for the development of electric vehicles (EVs) [1]. In comparison to other popular rechargeable batteries, such as nickel–cadmium, ni–metal hydride, and lead-acid batteries, lithium-ion batteries have high energy and power densities and long service lives and they are environmentally friendly. Thus, they have been widely used in consumer electronics [2]. Because of their durability, extended cycle lives [3], low self-discharge rates, and large capacities [4], lithium-ion batteries are primarily used as power sources for electric vehicles. The primary difficulties for batteries are heat and severe temperatures, which can occur at high discharge rates during scenarios such as rapid acceleration [5]. To maintain an equal temperature distribution among the cells, an effective BTMS is necessary [6]. To address all of these requirements, research studies have been conducted on BTMSs using several media for heat transfer, such as air, liquid, and PCM-based cooling [7,8,9,10,11]. Lin et al. [12] investigated a temperature range of −10 ° C to 50 ° C, which has been identified as the optimum temperature range for a lithium-ion battery. However, their observations showed that lithium-ion batteries perform optimally between 20–40 ° C [13]. Motloch et al. [14] investigated operating temperatures within the 30–40 ° C range and found that every 1 ° C rise in temperature reduces the lifetime of a battery by approximately 2 months. Optimal li-ion battery operation can be achieved by maintaining battery temperatures that are within safe limits. There are several ways to control these temperatures, including liquid cooling [15], air cooling [16], and passive cooling using phase change materials. Al-Hallaj et al. [17] were the first to propose a BTMS based on phase change materials. Sabbah et al. [15] investigated cooling li-ion cells by air, as well as PCM-based cooling. Their results showed that high ambient temperatures combined with high discharge rates fail to maintain battery temperatures within safe limits. Chen et al. [18] numerically analyzed battery TMSs using air cooling and PCM-based cooling methods. Their simulations were conducted at various ambient temperatures, intake velocities for air cooling, and PCM phase change temperatures by applying the actual current profiles to the battery models. Their results showed that the air-cooling method is cheaper than PCM cooling, but over a longer life cycle, the air-cooling method shows nonuniformity. Wang et al. [19] experimentally investigated the effects of fins on battery TMS performance by using low-melting temperature (44 ° C) paraffin wax and found that battery temperatures reduce by 8 ° C, on average. Sun et al. [20] introduced a BMTS incorporating a CPCM and fins, featuring longitudinal cylindrical and longitudinal fins. Initial experiments were conducted to assess the performance of various BTMS configurations. It was deduced that the fin–PCM composite system has the best performance compared to the other cases at high heat generation rates of 20 W. Zhao et al. [21] enhanced a battery thermal management system (BTMS) using phase change material (PCM) and copper foam to address low thermal conductivity. They identified that active cooling using a cooling fluid through distributed tubes in the composite PCM (CPCM) results in 14 °C lower cell temperatures, indicating improved thermal management in the BTMS. Weng et al. [22] investigated the effects of surrounding temperatures on BTMSs. By conducting experimentations, it was found that steady-state current operations result in higher temperatures, resulting in the failure of the PCM-cooled BTMS and batteries. After 1500 s the at a surrounding temperature of 45 ° C, the battery temperatures were 54.0 ° C. This led to the development of a secondary cooling system using heat pipes. Safdari et al. [23] analyzed a BTMS using a coupled system with active cooling channels and PCM-based passive cooling for 18650 li-ion batteries. Their results showed that at low discharge rates, PCM-based cooling is effective in controlling temperatures; however, at high discharge rates, for the effective cooling of battery packs, the active air channels around the containers play a major role when passive cooling fails. Shojaeefard et al. [24] conducted a study to investigate BTMSs using six different fin types combined with PCM cooling. Their results indicated that horizontal fins have optimal cell temperature control compared to the other fin arrangements and types. Their results also indicated that BTMS temperatures are affected by changing fin alignment. Youssef et al. [25] conducted a unique design optimization to study the thermal performance of large li-ion batteries under high discharge rates and cyclic loading. Their results showed that out of all cooling methods, PCM combined with jute produced the lowest temperature of 35.09 ° C; However, at very high discharge rates, the PCM combined with jute cooling system produced the highest temperature of 36.29 ° C. This study did not account for the life cycle assessment of PCM–jute degradation. Huang et al. [26] numerically and experimentally studied BTMSs using PCM for 18650 li-ion batteries connected in parallel. The BTMS was analyzed based on a heating rate model developed from the internal resistance of the cells. Their results showed that battery temperatures reduce when the thermal conductivity of the PCM changes. However, at very high thermal conductivities of between 5–15 W/m-K, the temperature change is not significant. The lowest cell temperature achieved in this study was 44.5 ° C. El Idi et al. [27] studied a battery thermal management system (BTMS) using li-ion cells and metal foam. They conducted numerical and experimental analyses to understand the heat absorption capabilities of PCM and CPCM. Their study found that adding aluminum foam to cells improves thermal control and that the thickness of PCM significantly impacts BTMSs, although adding more volume has little effect on cell surface temperature. Their study also examined a PCM-based BTMS using capric acid as the PCM and the impact of ambient temperatures. Their study found that a PCM thickness of 3mm provides the optimum and lowest cell temperature of 32 ° C. Hemery et al. [28] studied the effects of increased internal resistance with age and thermal runaway when cells short circuit in lithium-ion batteries. In this study, for safety considerations, a combination of electrical heaters enclosed in casing was used instead of actual cells, along with forced air convection as a cooling medium. Cell surface temperature under failure was maintained at 60 ° C in the PCM-enhanced BTMS. In the case of forced air convection, cell temperatures exceeded 60 ° C. Also, the volume percentage of the PCM-enhanced BTMS was reduced from 79.7% [29] to 25% in comparison to those in previous studies.
The present investigation centered on using experimental and numerical methods to improve the energy and thermal performance of a BTMS. To the best of our knowledge, a combined PCM–fin BTMS using a battery test bench and steady-state discharge rates (heat generation rates) has not been studied. Also, the effects of tilting angle (taper fins) compared to rectangular fins with a constant effective fin surface have not been analyzed before. A novel battery test bench was developed to analyze lithium-ion cells made from aluminum combined with specialized ceramic heaters, forming a battery pack with different heat generation rates. The study also focused on the comparison of convective and diffusive heat transfer for different fin cases, including an unfinned case and rectangular fins, taper fins, and circular fins. The performance could be enhanced with passive cooling by using the phase change material Rubitherm GmbH RT-42. The need for numerical analysis along with concrete experimental results was due to errors involved in experimentation. The number of sensors that could be used in the physical setup was limited, which does not produce correct thermal scoping in some cases due to convection effects. However, as numerical solutions deal with the area-weighted averages of both the cell and PCM temperatures, they provide accurate results to nullify these errors.

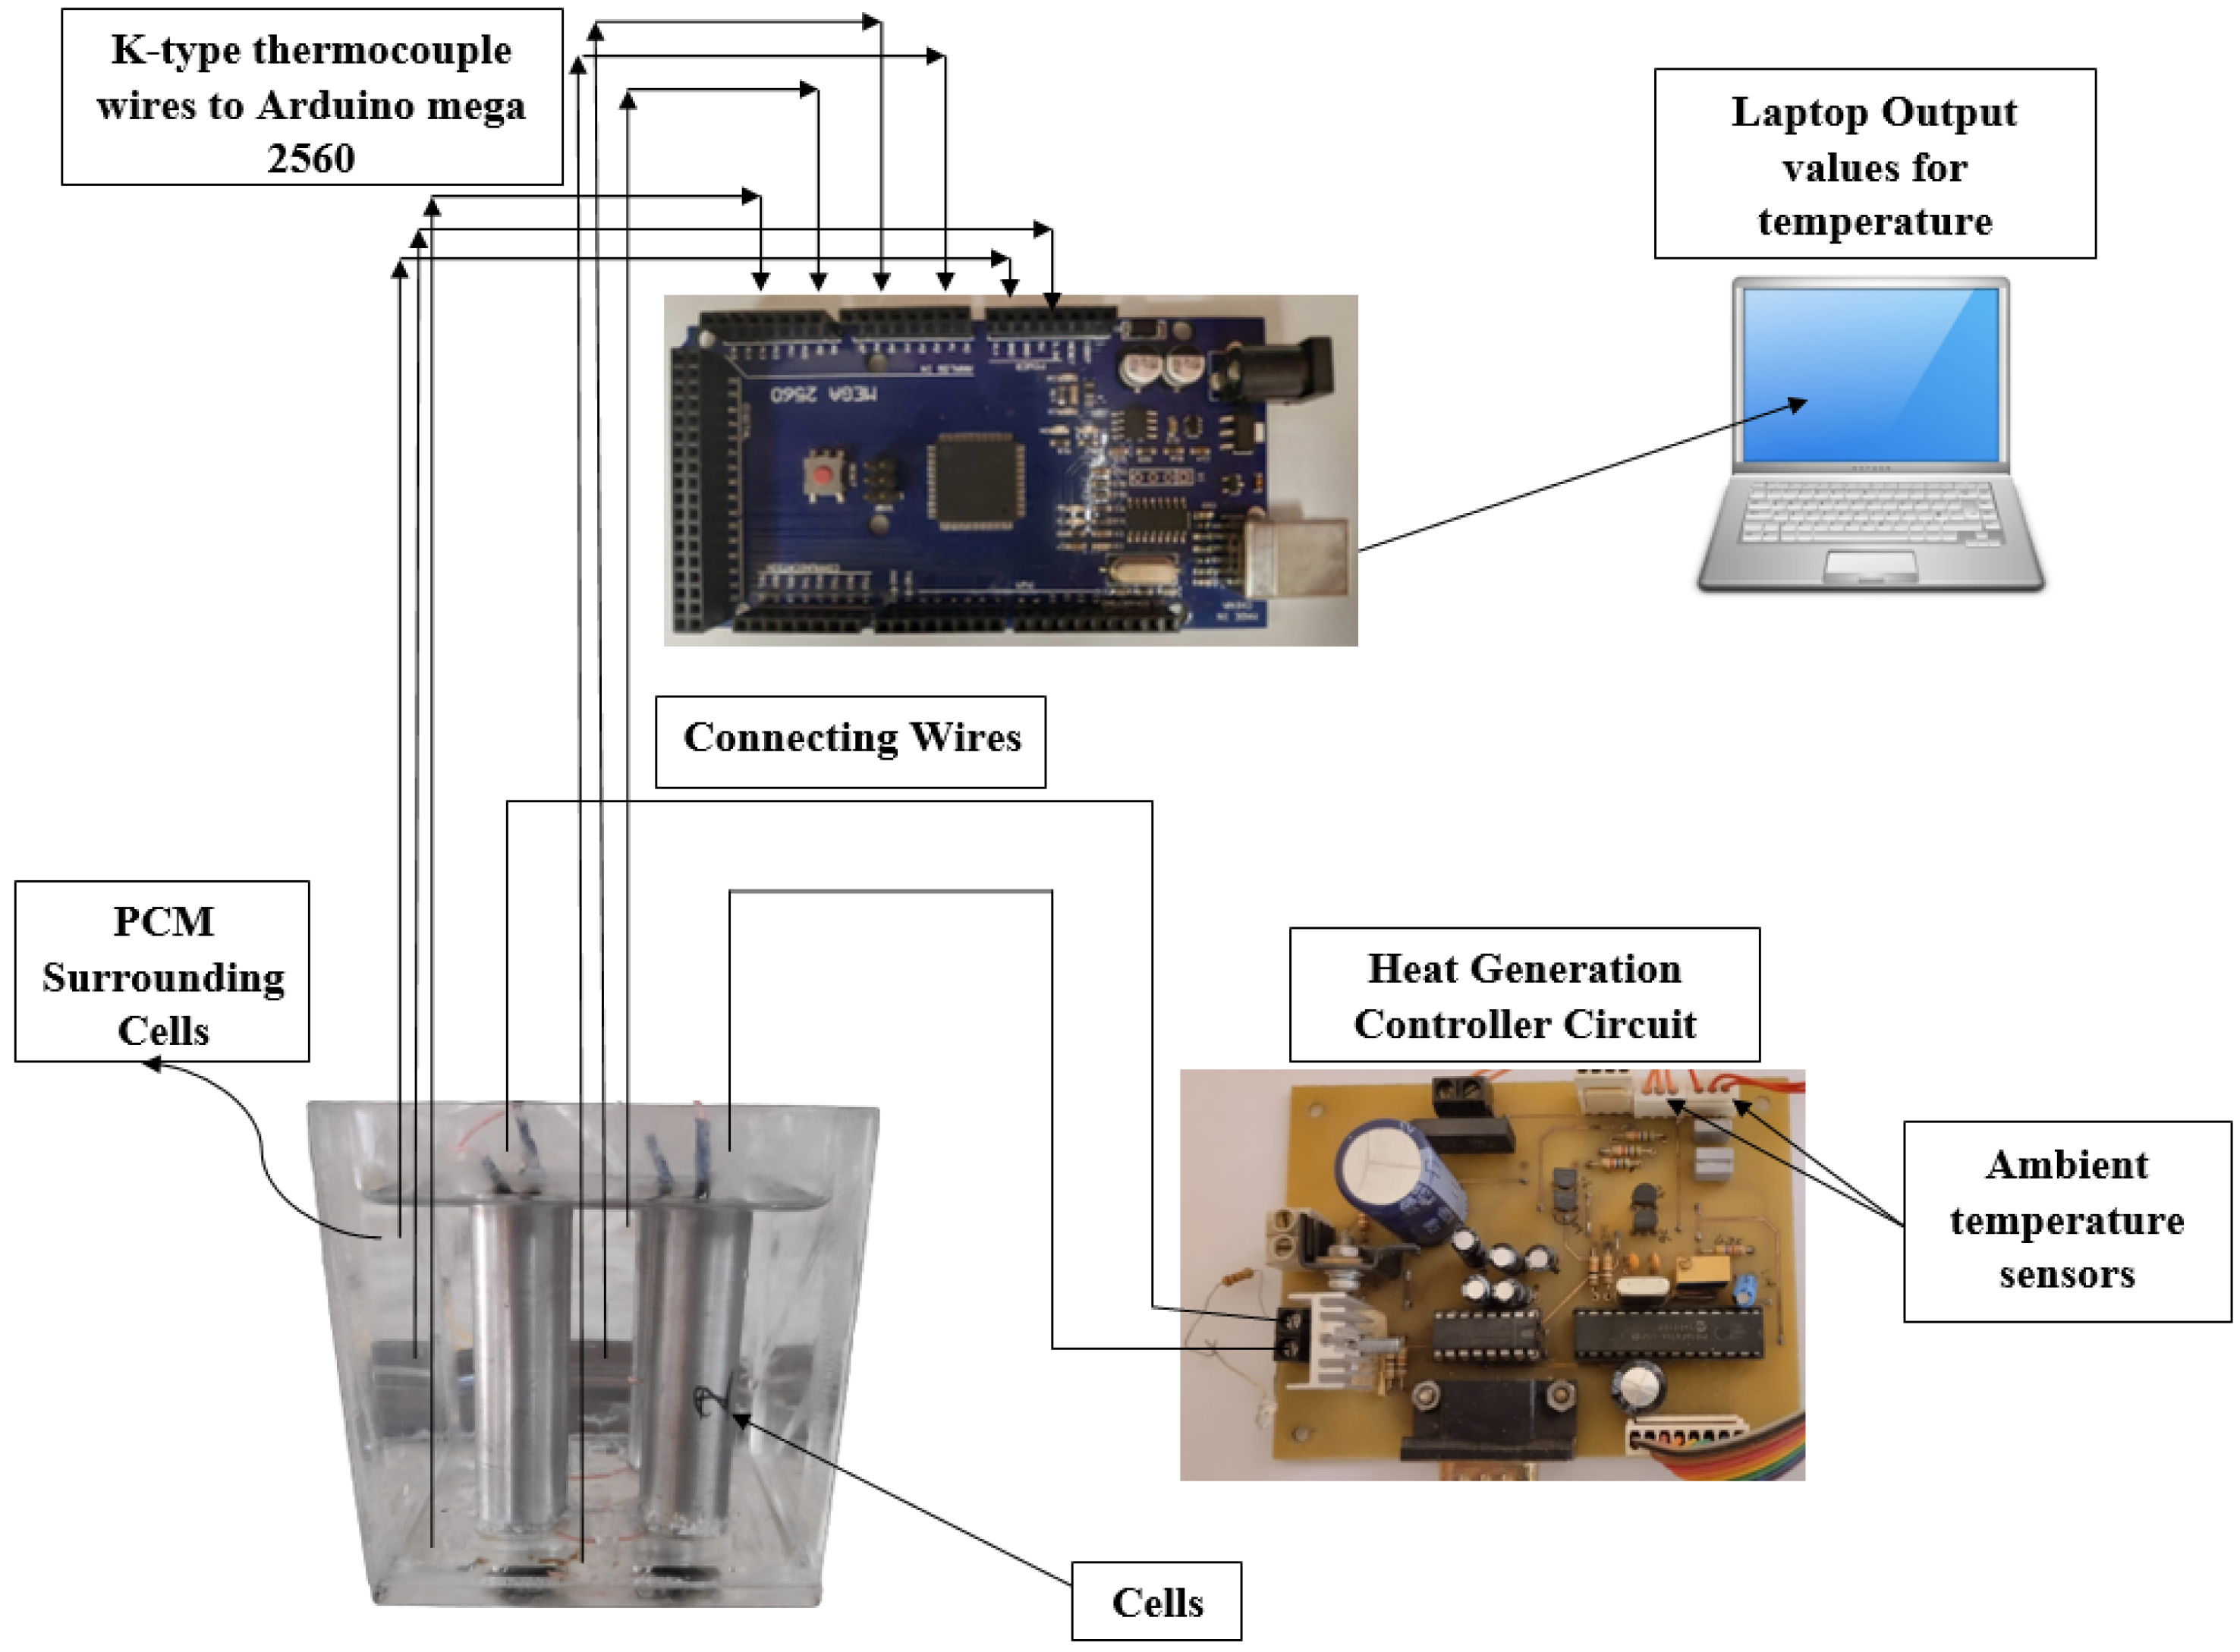
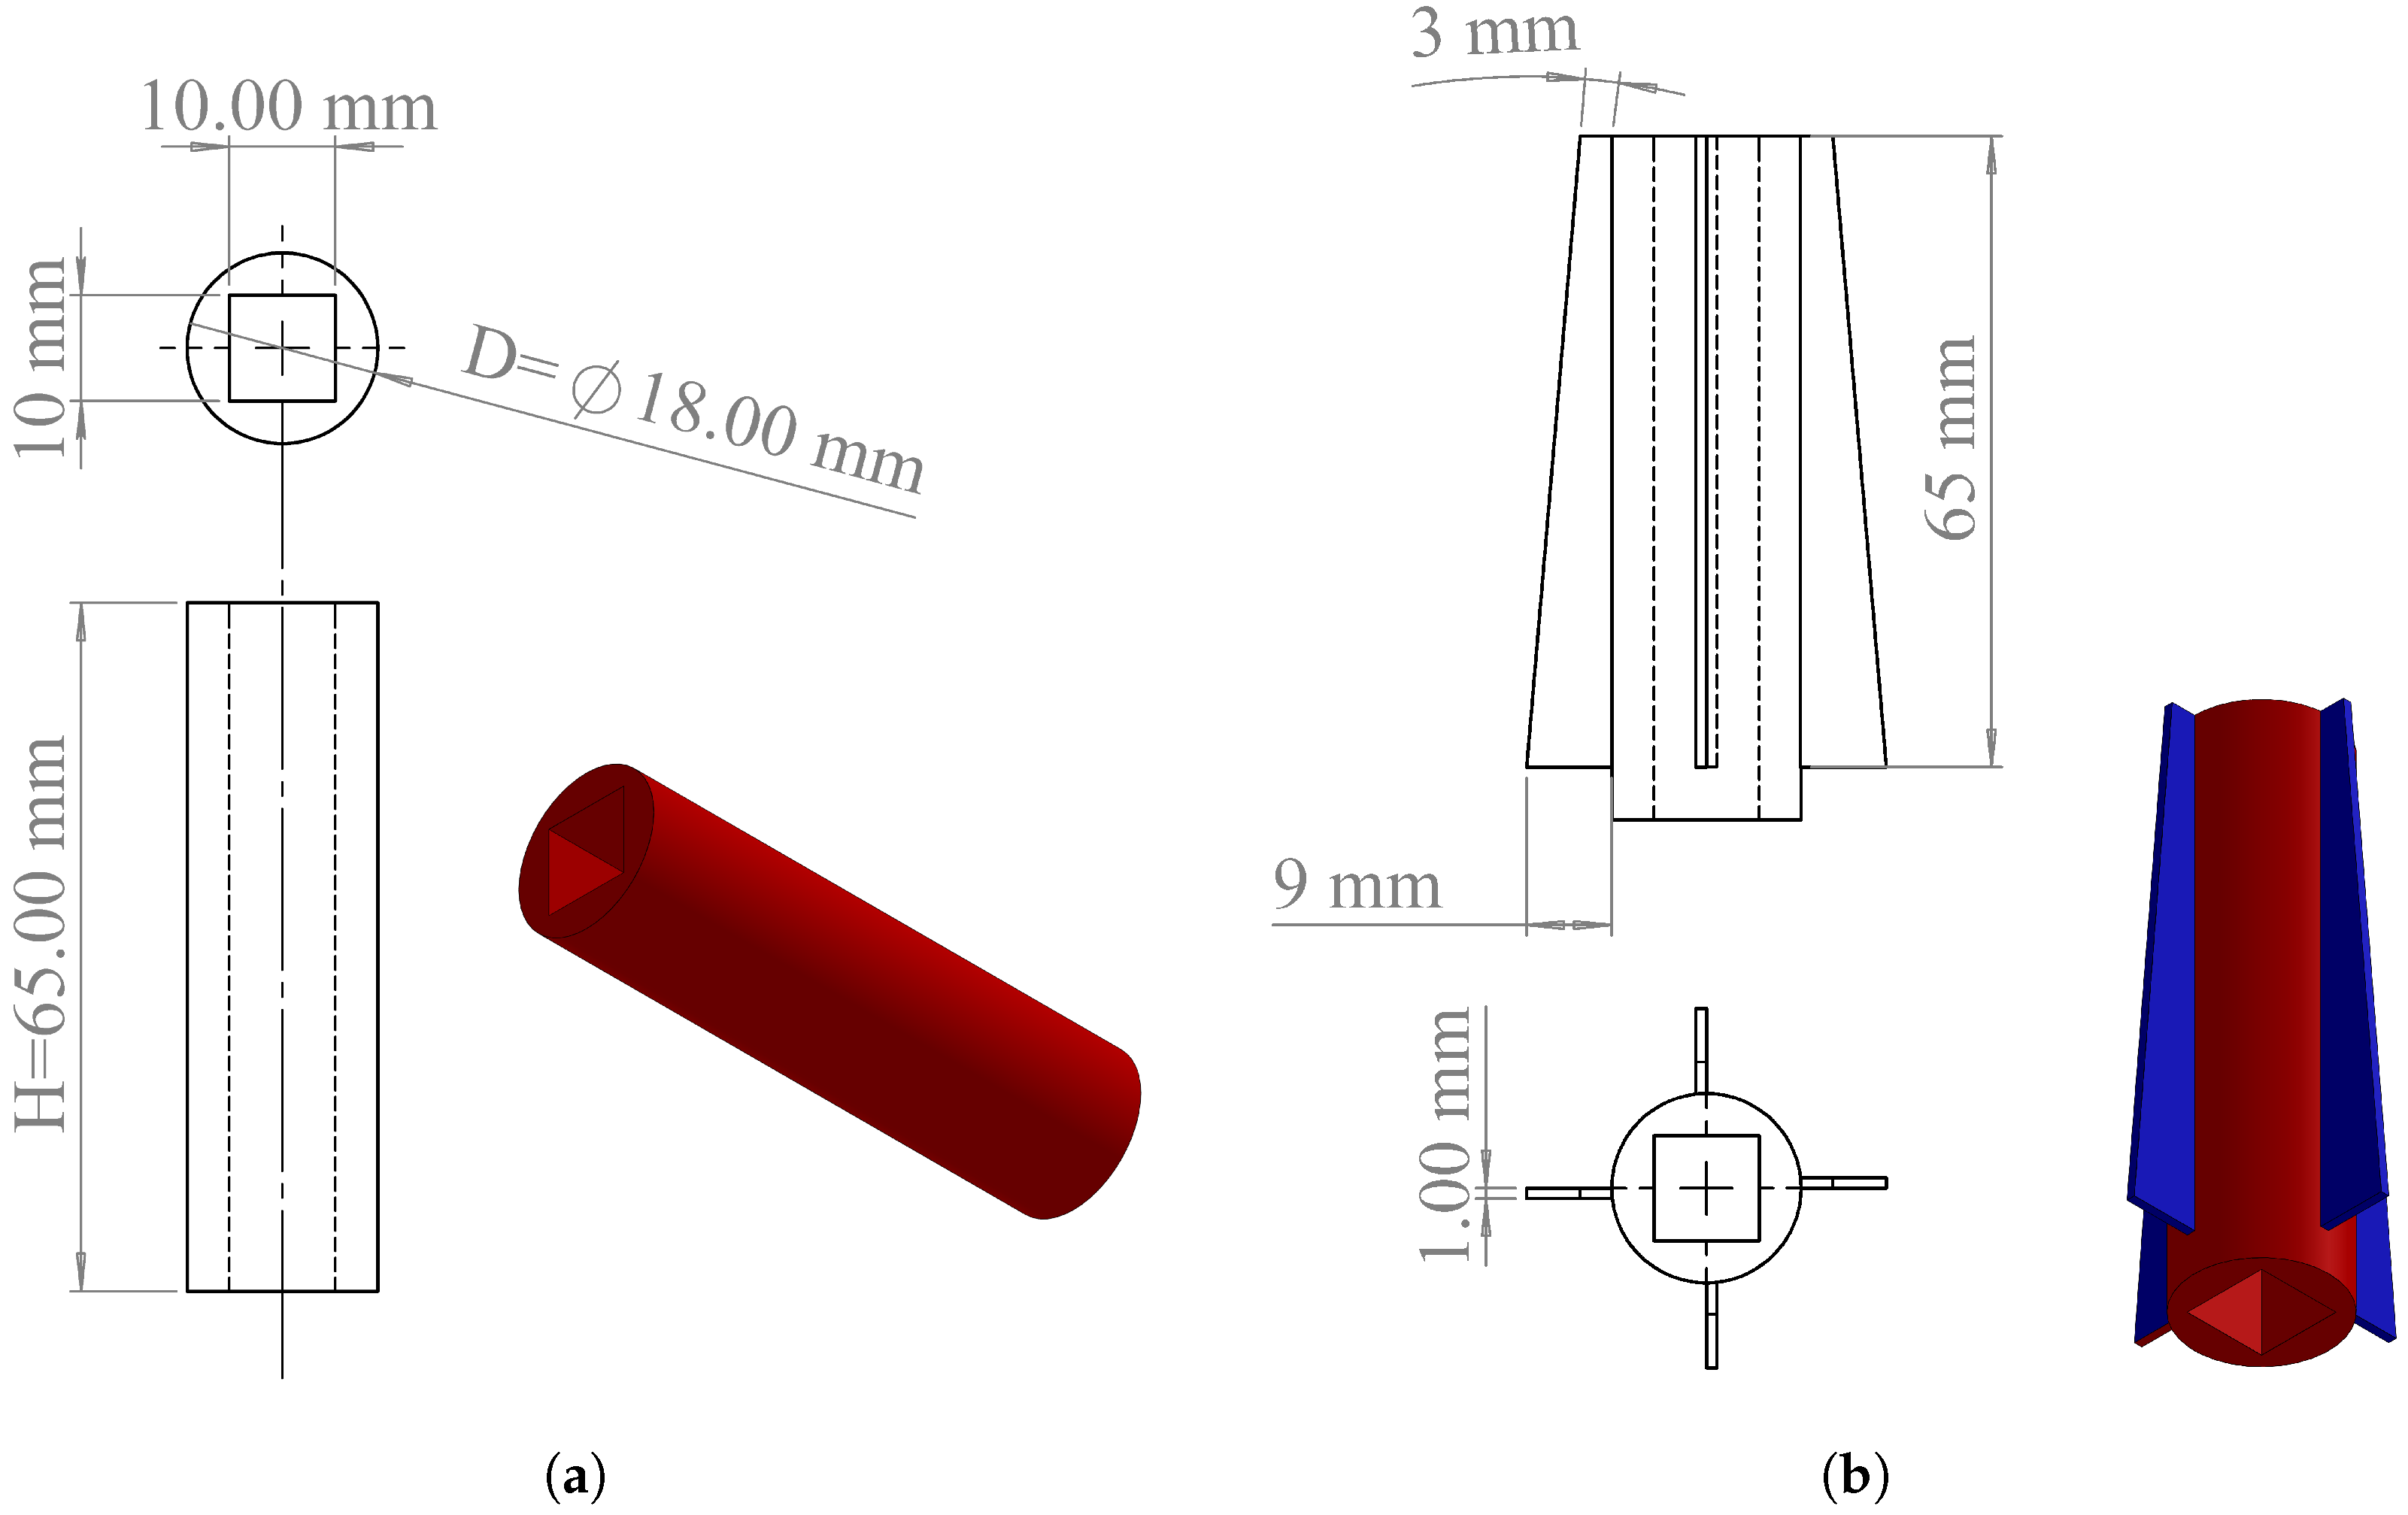
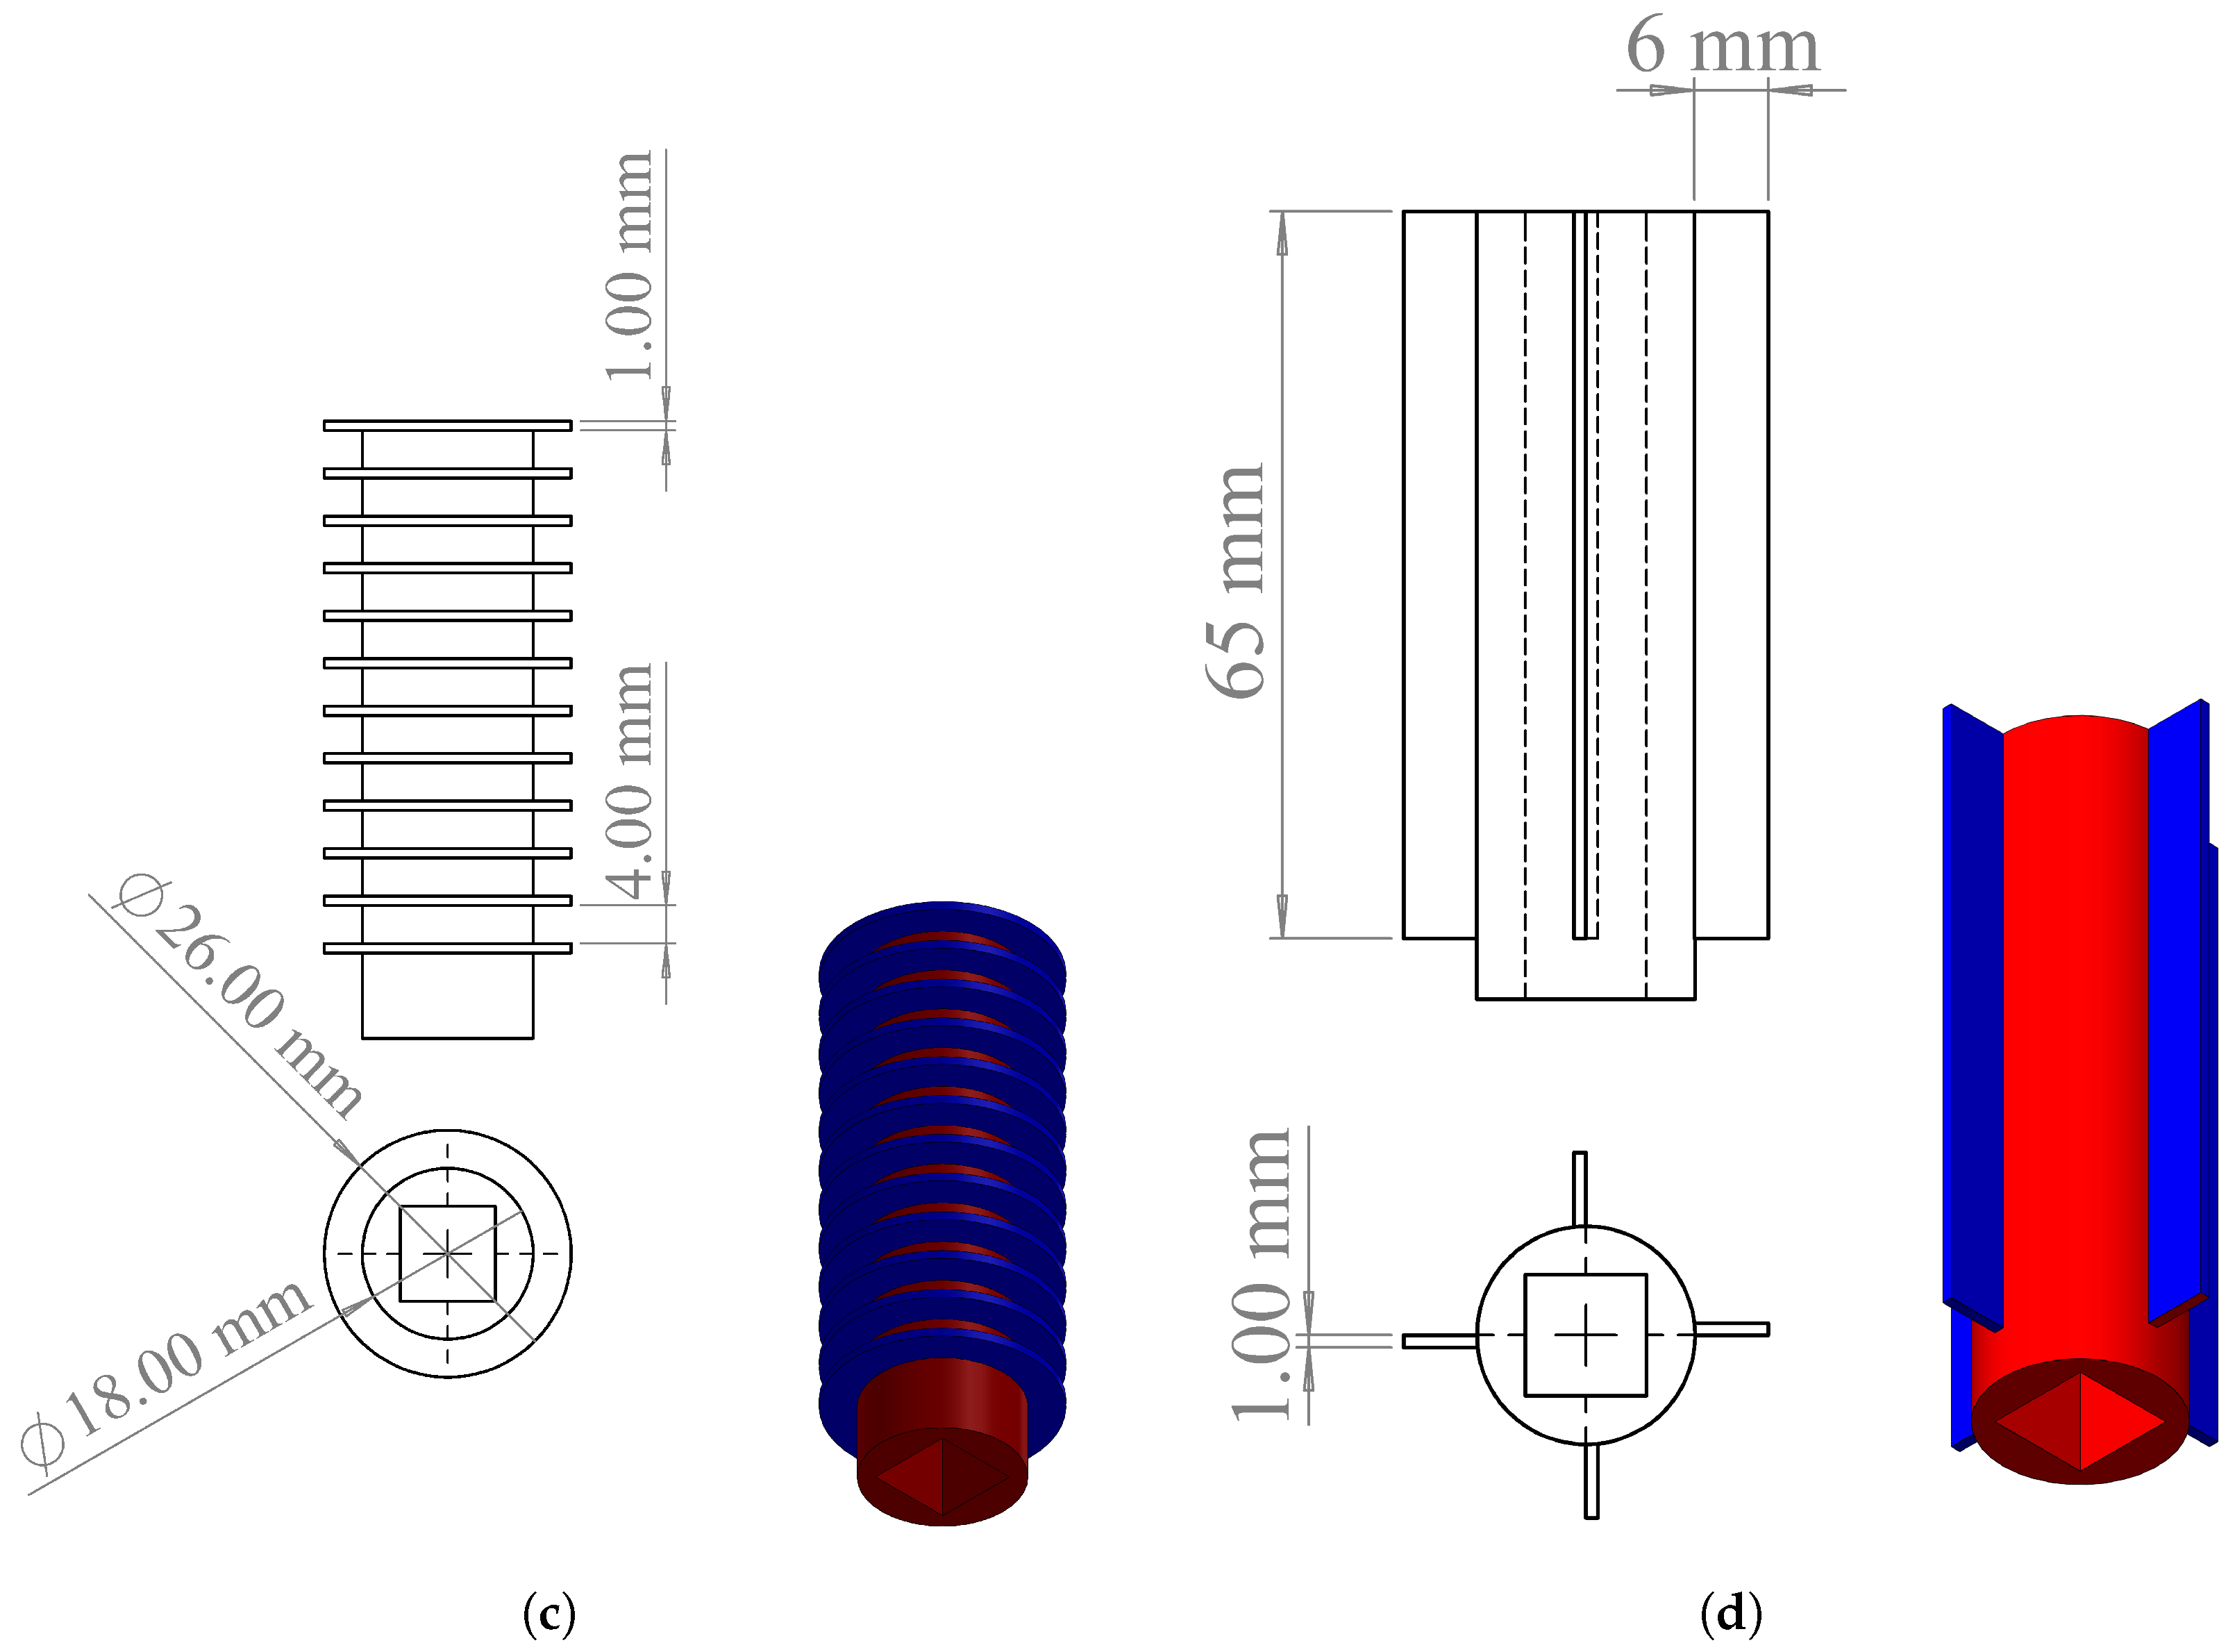
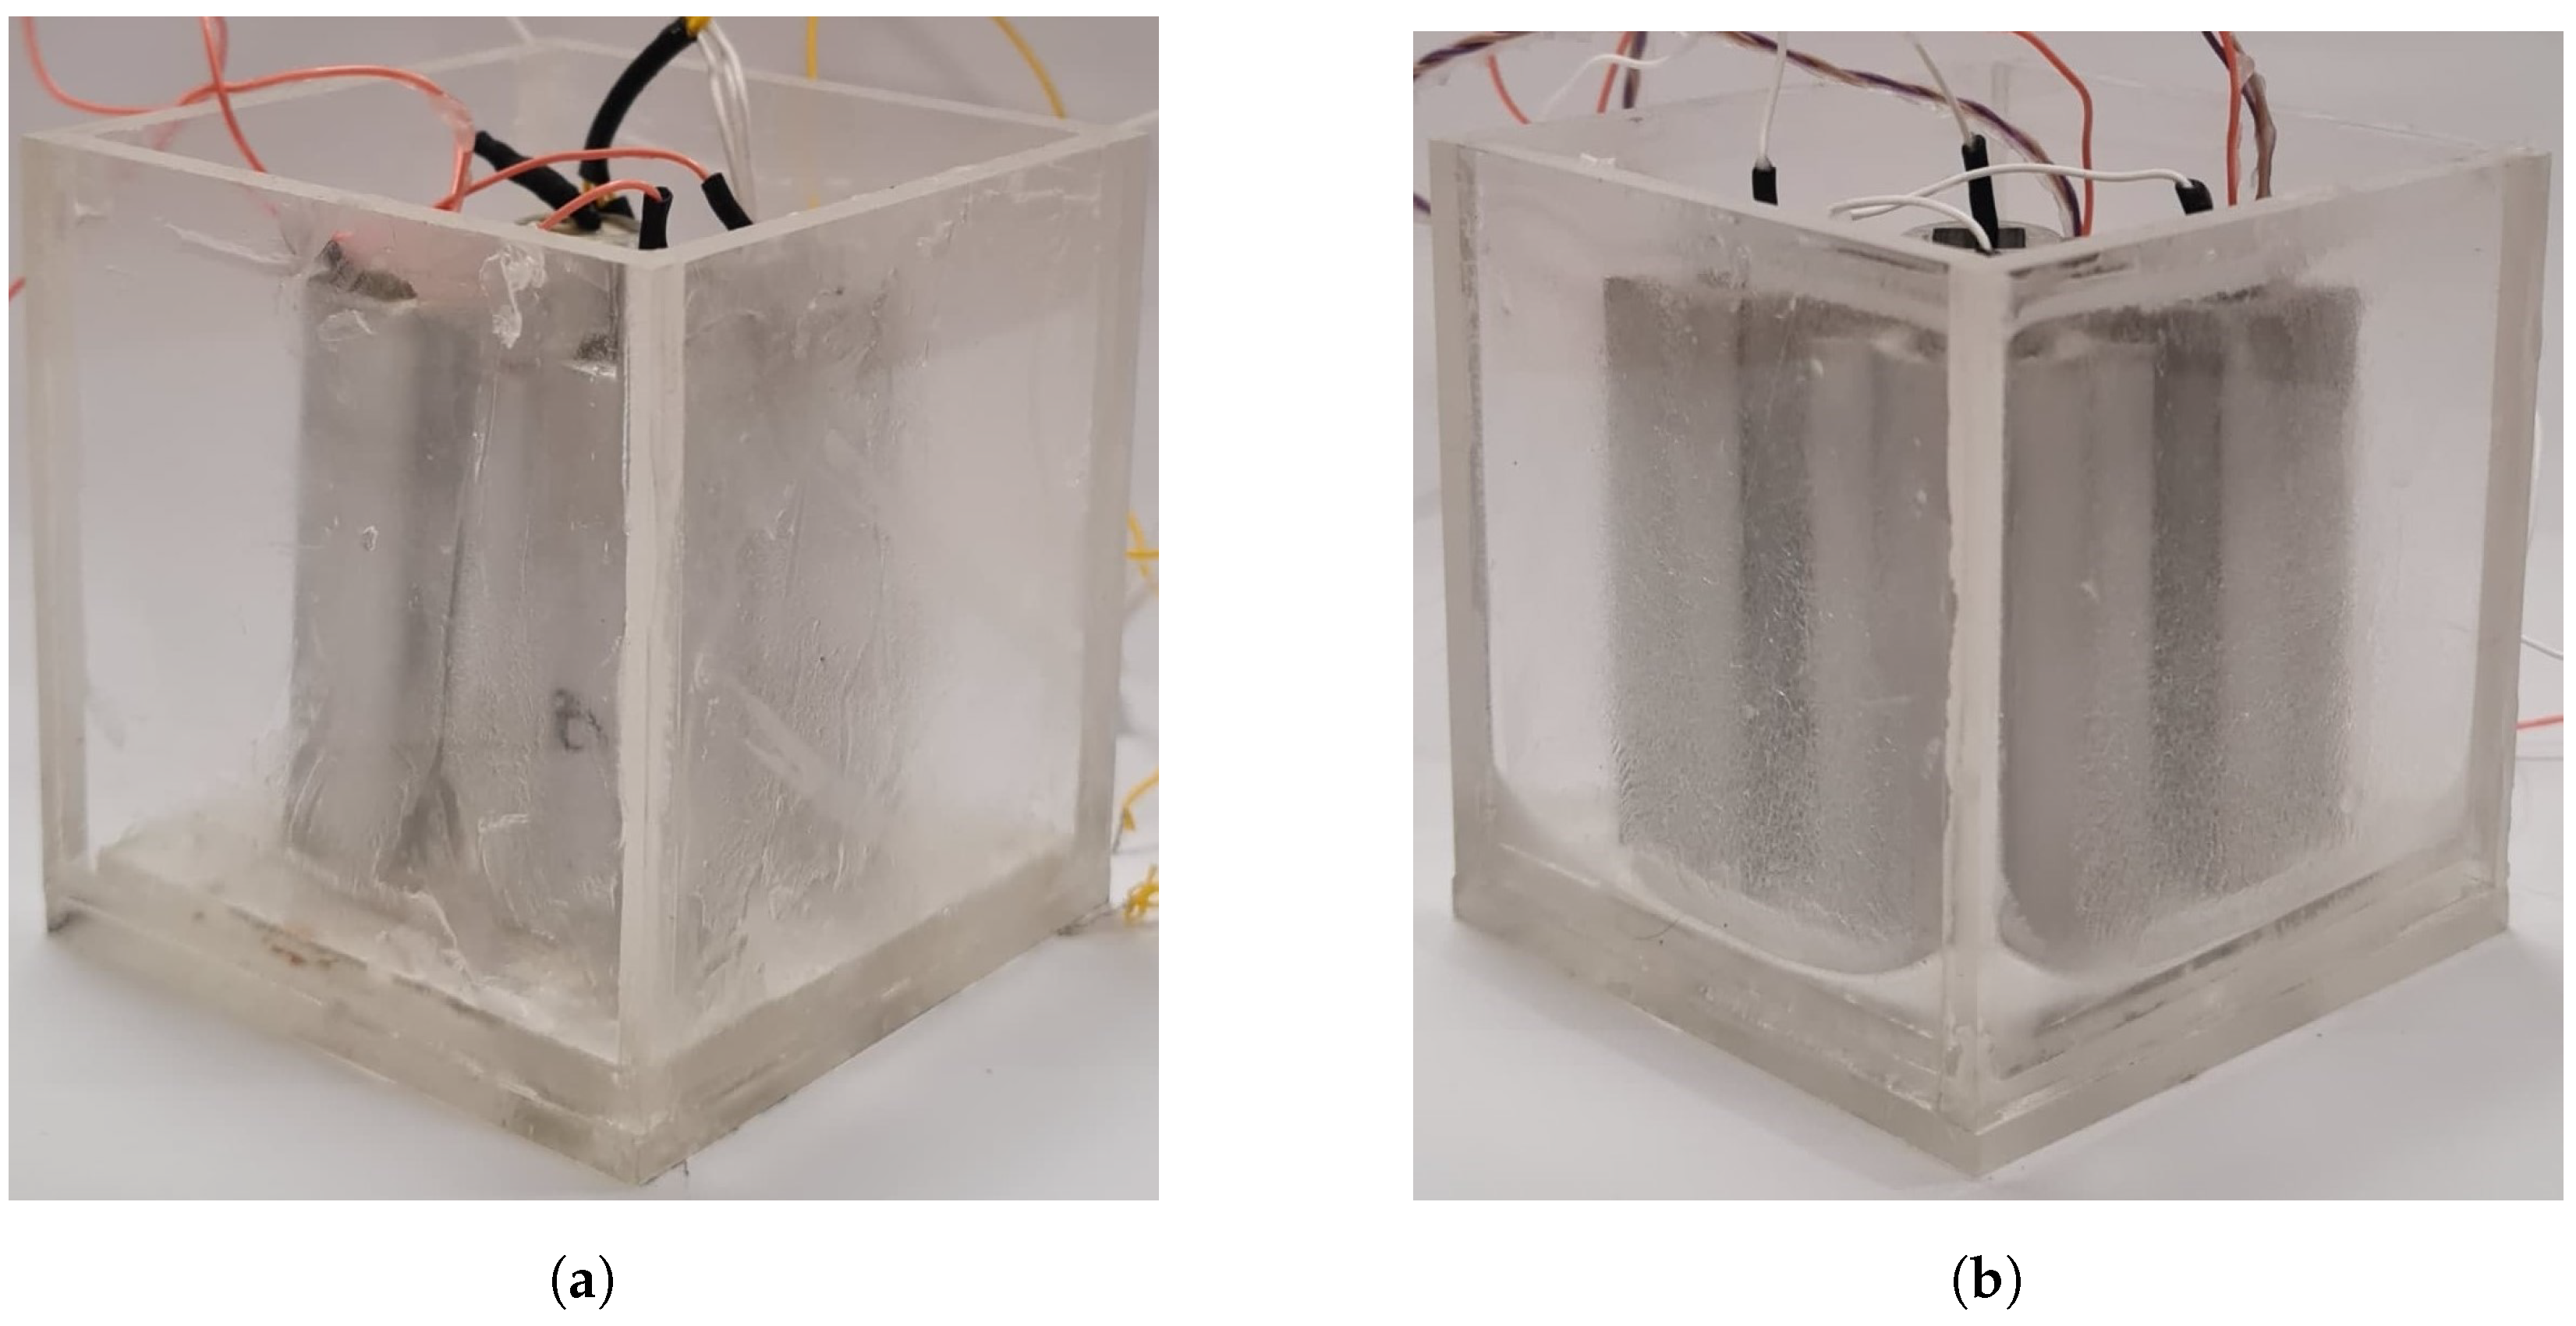
2. Experimental Setup

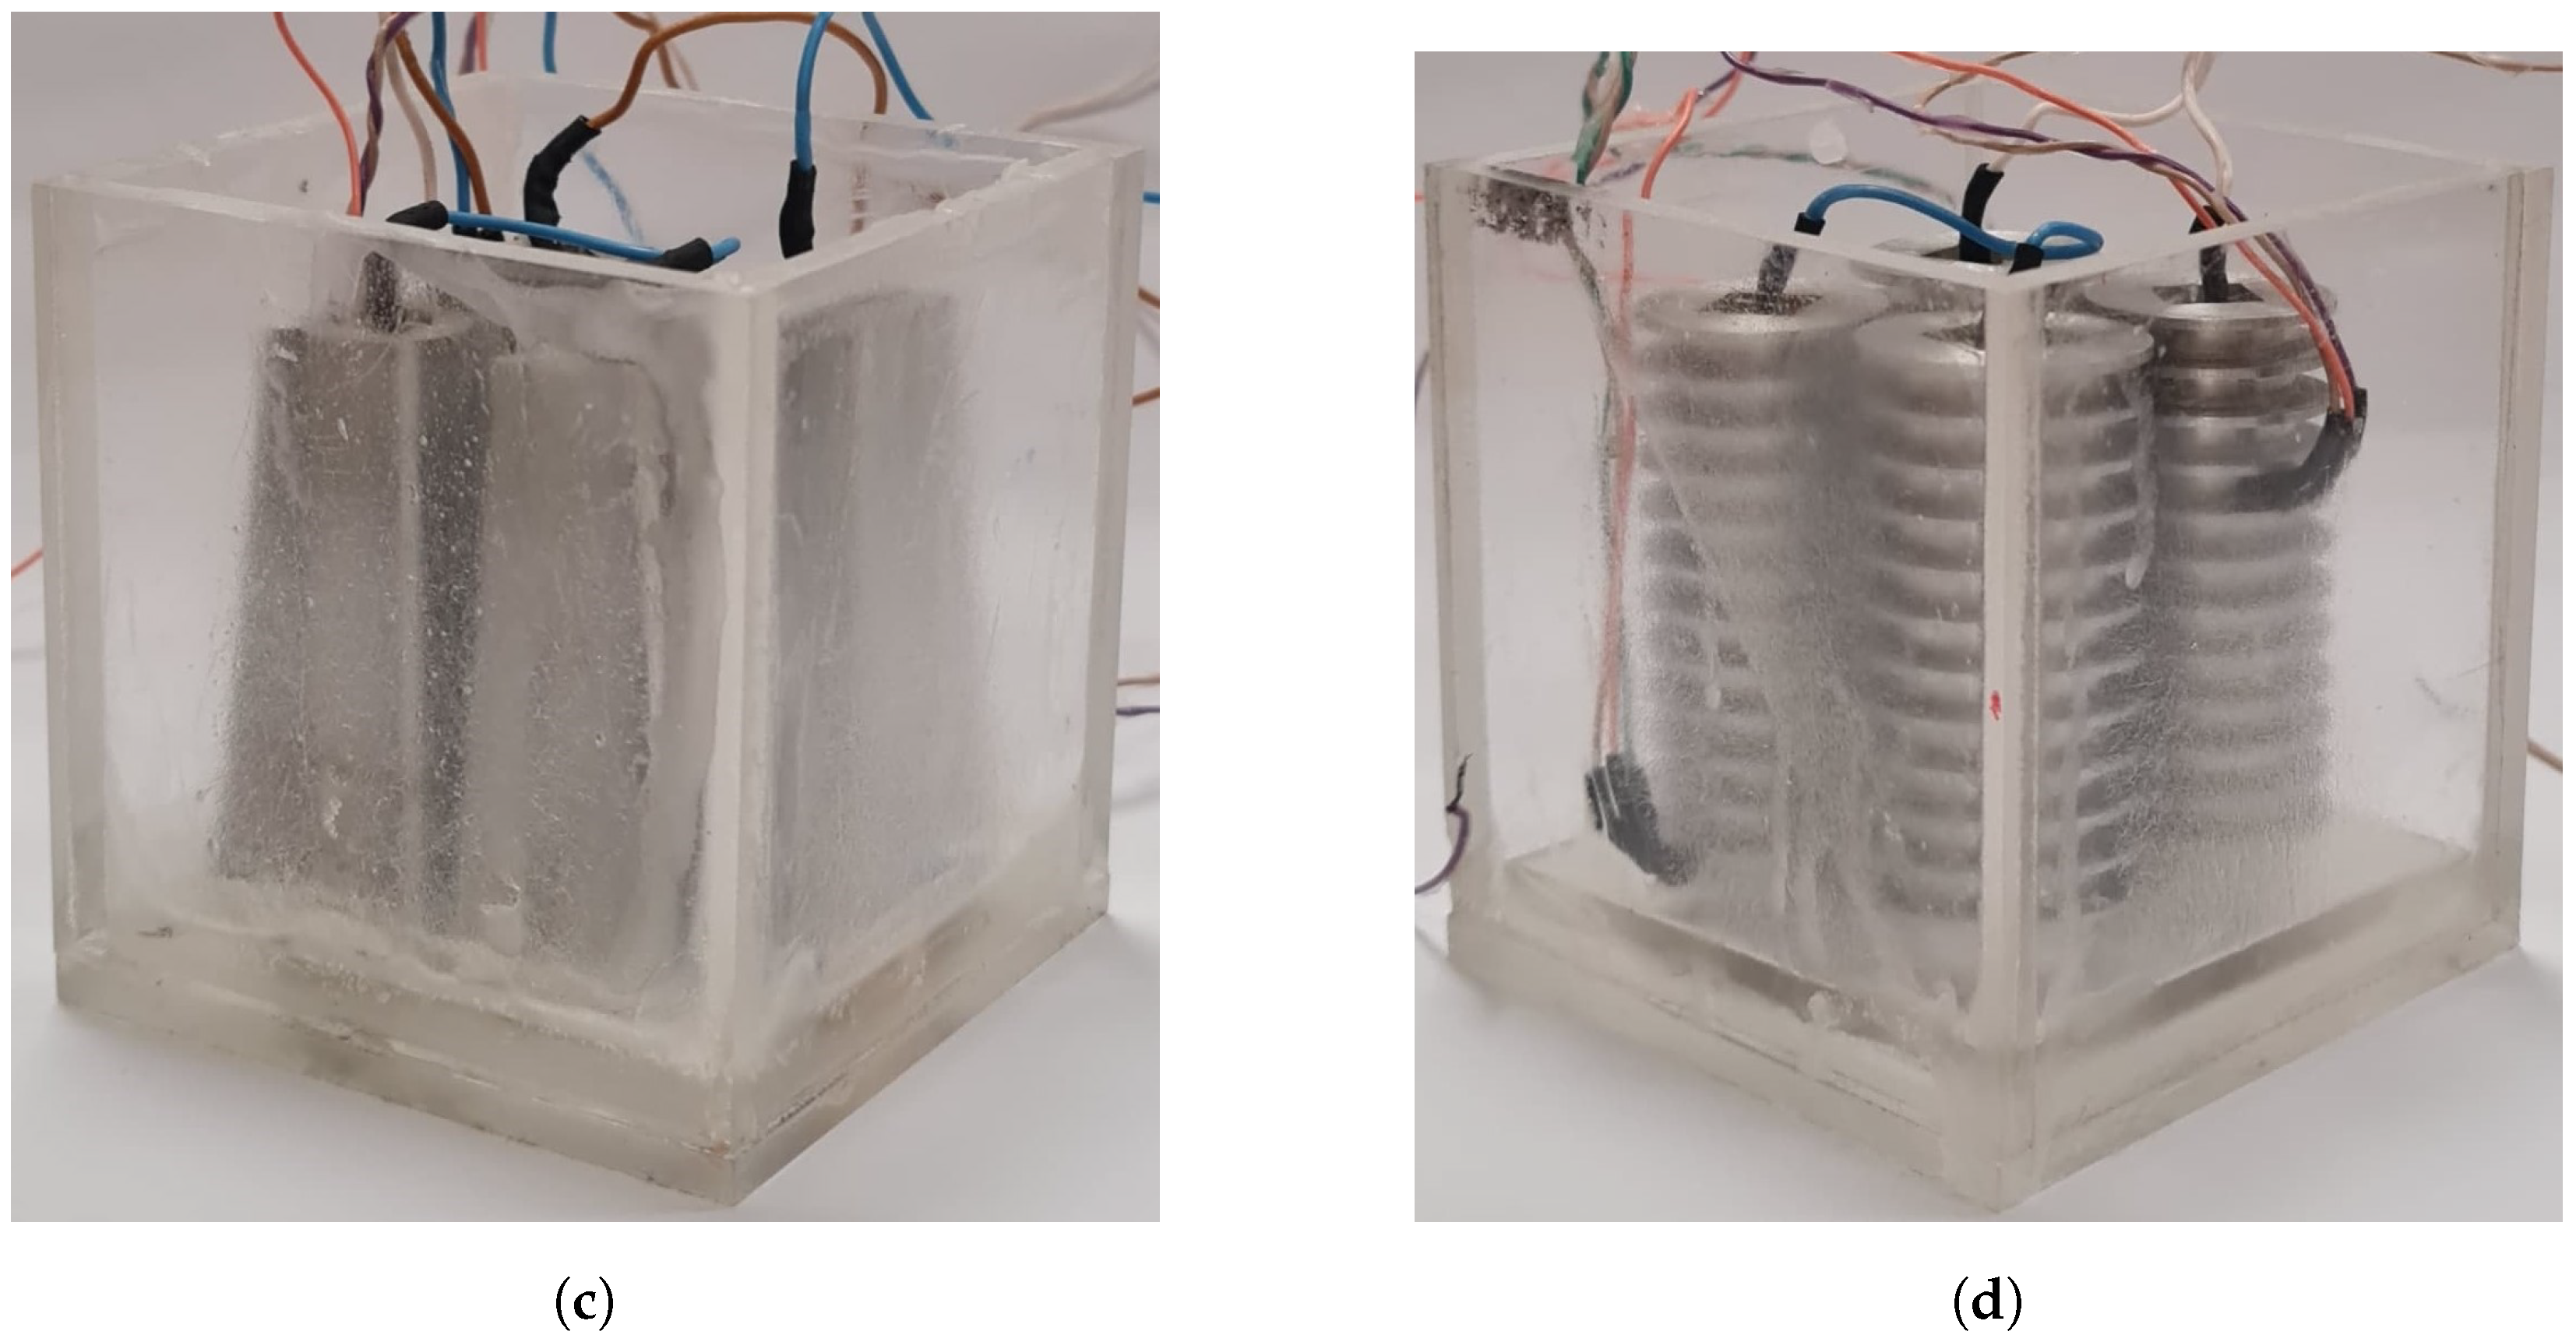
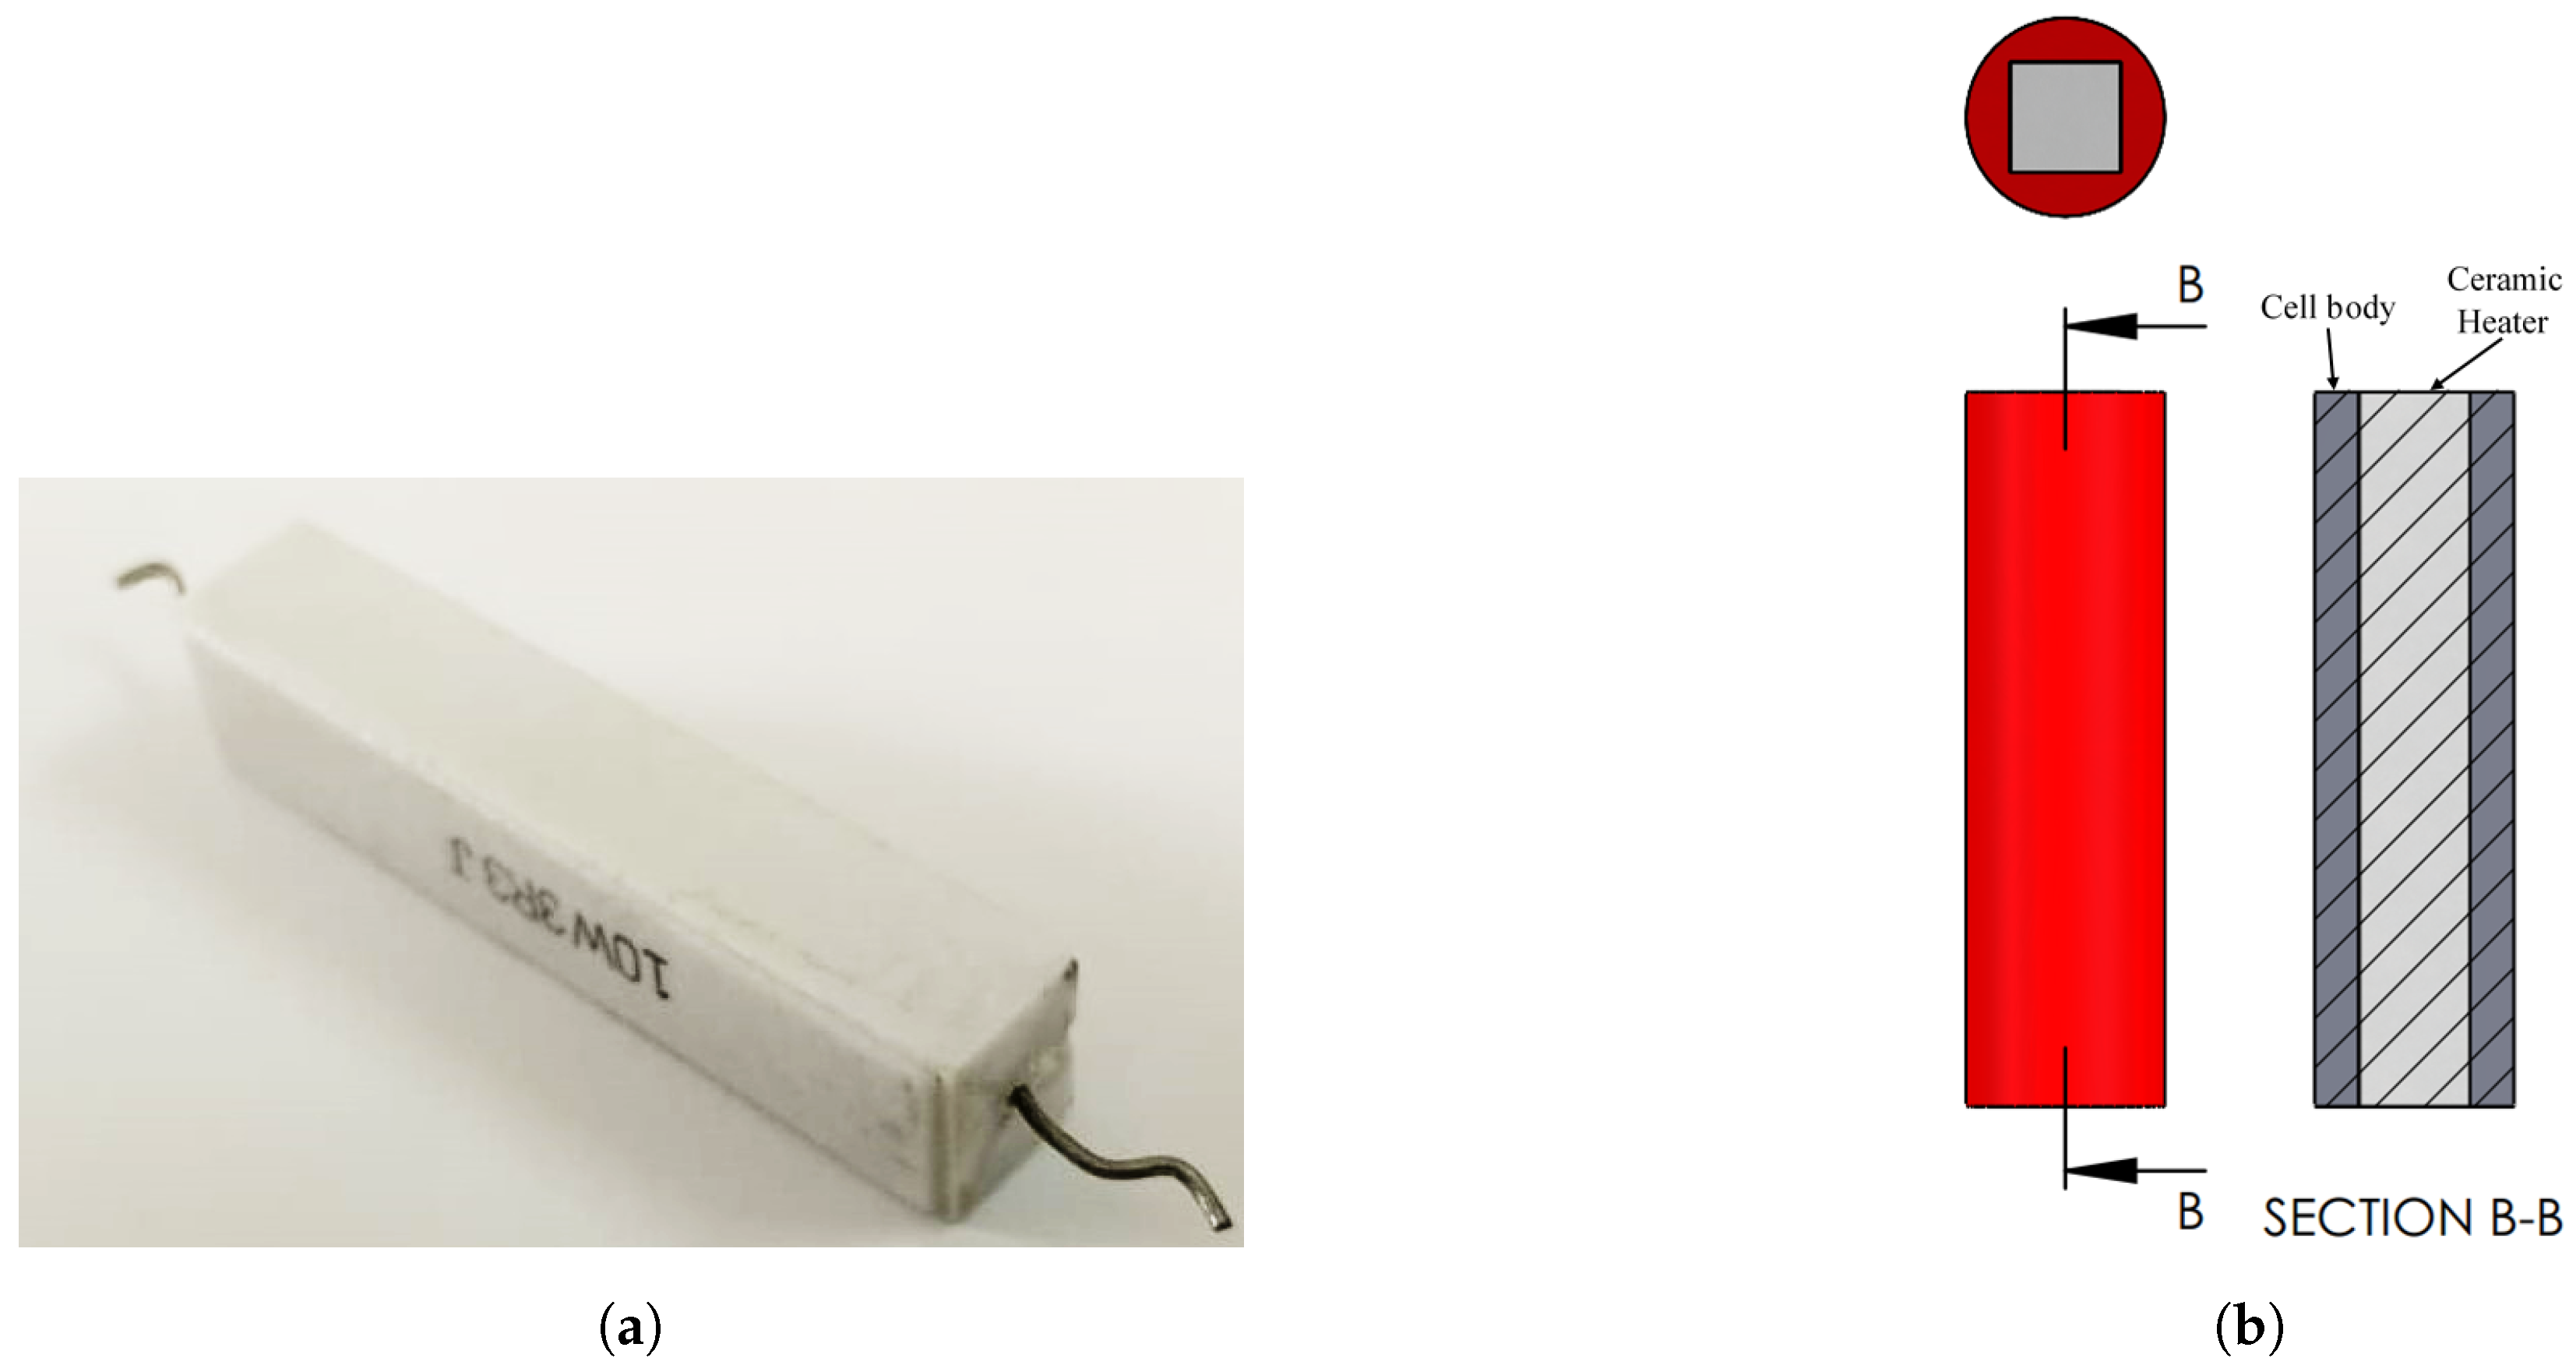
2.1. Battery Thermal Management System Design

The BTMS design comprises three main components: the battery pack, with cells submerged in the PCM; a heat generation circuit connected to the cells; the Arduino Mega 2560, which sends temperature sensor data to a computer, as shown in Figure 1. The housing of the battery pack is made up of a 5mm acrylic sheet. A working flow model of these key components is shown in Figure 1. The battery pack contains four cells, which are equally spaced. The cells are the same dimensions as 18650 li-ion cells and are covered with aluminum material. A modified ceramic heater 10W3R3J is placed in a 10 × 10 × 65 mm slot at the center of each cell to provide equal heat flux at each surface. A 2D representation of a cell with its dimensions is shown in Figure 2. The length, width, and height of the box, made out of acrylic, are 72 mm, 72 mm, and 85 mm, respectively. A fin thickness of 1 mm is constant for each case. The fin height is equal to the height H of the cells. The actual constructed LIB pack is shown in Figure 3. A brief schematic of the controller circuit and its working is shown in Figure 4. Thermocouples and LM-35 sensors provide temperature data for the PCM and cells, respectively. Further details of the circuit, heaters, and sensors are discussed in Section 2.3.

2.2. Phase Change Material Selection Criteria

The selected phase change material (PCM) was Rubitherm® RT-42. The reason for choosing this specific PCM was to be able to test the BTMS under higher, as well as moderate, ambient temperatures and the selected PCM has a melting range of 38 ° C to 43 ° C, which is suitable for testing under both temperature ranges. The selected PCM is chemically inert and stable with a long cyclic life. RT-42 is an organic PCM with a very high heat capacity (latent), which is advantageous for thermal energy storage and thermal enhancement applications.

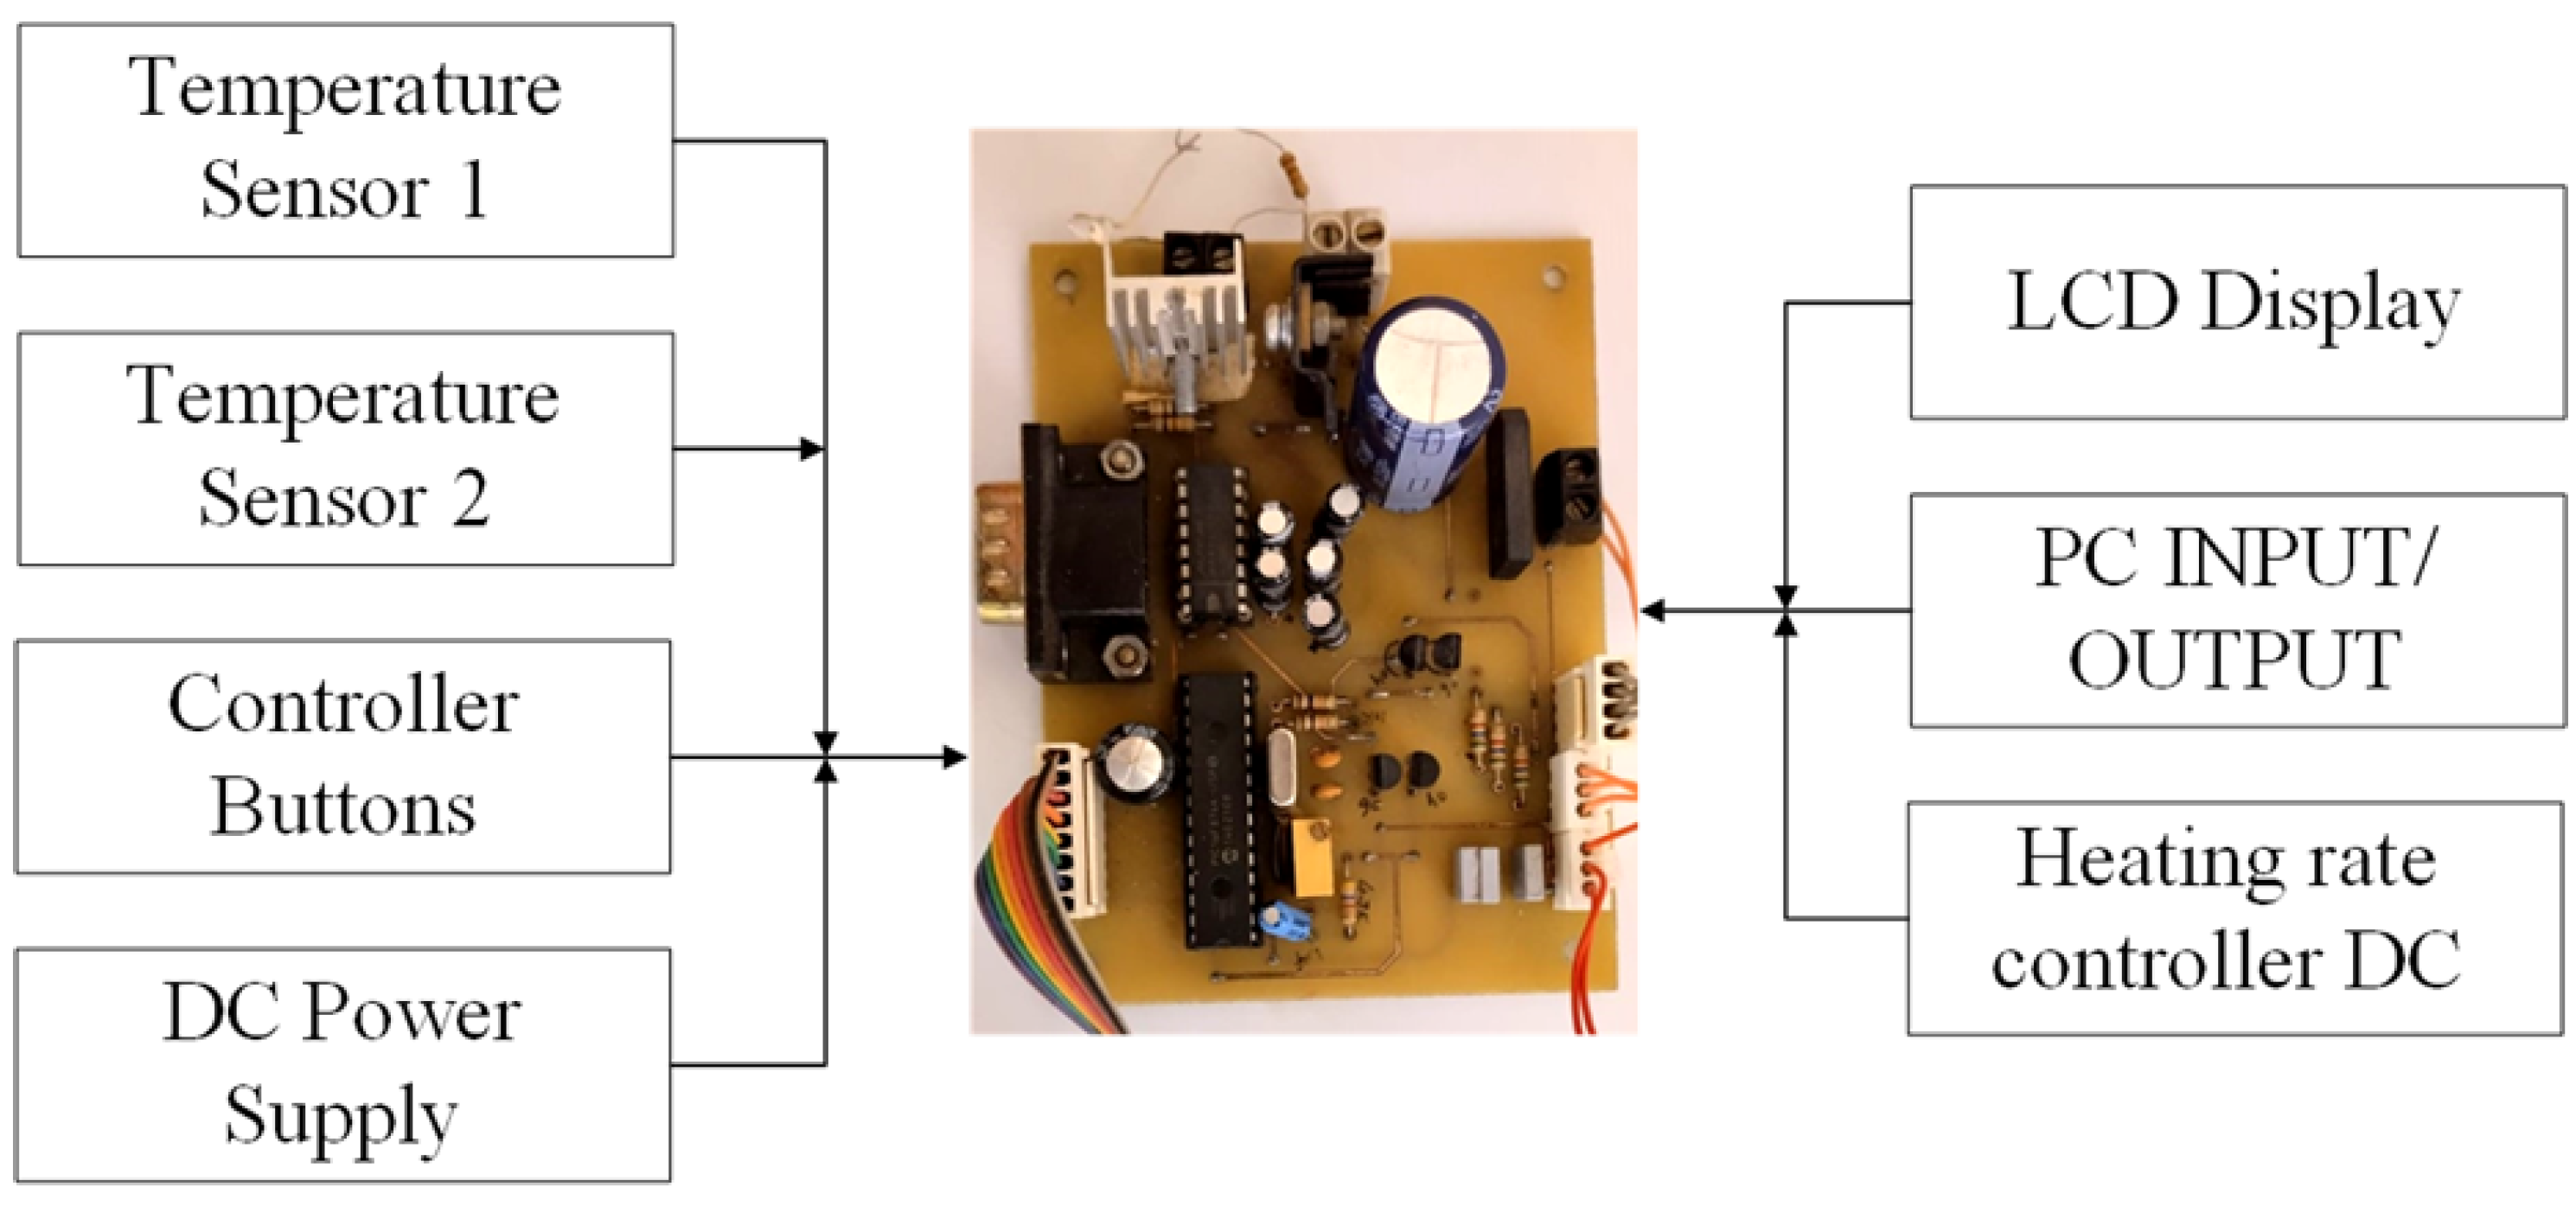
2.3. Controller Circuit and Heat Generation Rates

The controller circuit was made up of a combination of microcontrollers to produce smooth pulse wave modulation (PWM) with the ability to vary the heating rate for the ceramic heaters from 0.05 W to 6 Watts in the complete circuit, accommodating all losses. The ceramic heaters used in this study and their assembly in the unfinned case are shown in Figure 5.
The heat generation rates used, as quoted by Choudhari et al. [30], are shown in Figure 6. The heating rate for 1C was 0.2 W, 2C was 0.7 W, and 3C was 1.5 W per cell. So, for the 4-cell configuration, the circuit needed a heating rate of 4 times the rating. The steady-state heating rate applied for 1C was 0.8W, 2C was 2.80 W, and 3C was 6 W. The temporal response time of the controller circuit is also shown in Figure 6b with its different powers. The controller heat generation rates have been validated in the literature, which is illustrated in Figure 6. The cell surface temperature was measured using an LM-35 temperature sensor with a tolerance of ± 0.25   ° C. The cell surface temperature was measured at two locations with offsets from the top and bottom of the cells. Additionally, six K-type thermocouples with an accuracy of ±1.5 ° C were used to measure the temperature of the PCM. Arduino Mega 2560 and Arduino Uno were coded and used for the temperature measurements. For the constant ambient temperature measurements, the control circuit was maintained at 27 ° C. The thermocouple locations were set to scope the height of the box, as well as the length and width, to ensure the accuracy of PCM temperature measurements. The cycle time used to observe temperature evolution was kept fixed at 60 min for all cases. The T r e f for each cell was 23.18 ° C and the T r e f for the PCM was 26.29 ° C.

2.4. Boundary Conditions, Initial Conditions, and Thermophysical Properties

The boundary and initial conditions used in the numerical analysis were as follows:
  • The control volume for the heaters was given a volume condition as the heat generation rate (W/m3), according to Choudhari et al. [30], which was 94,023.8 (W/m3) for 3C, 41,788.37 (W/m3) for 2C, and 10447 (W/m3) for 1C;
  • The walls were exposed to the environment as the system was not kept adiabatic and had a natural convection coefficient of 2.5 W/m2·K;
  • The mushy zone constant was kept at the default level and solidification and melting were used to simulate the phase change process;
  • All thermophysical properties for both the numerical and experimental setups are shown in Table 1;
  • The solution was initialized and patched with 23.18 ° C for the cells and 26.29 ° C for the PCM, fins, and base plate temperatures, while the housing, which is exposed to the environment, was kept at 27 ° C. The reason for these selected temperatures was to maintain uniform reference temperatures for both the experimental and numerical analyses.

3. Numerical Problem Formulation

In order to perform numerical simulations, several assumptions were made and the system was simplified. The liquid phase of the PCM was defined as an incompressible, Newtonian, homogenous, and isotropic media and the radiation heat transfer was deemed insignificant compared to natural convection heat transfer. The buoyant force caused by temperature-dependent density fluctuations during PCM melting was modeled using the Boussinesq approximation. The volume expansions of the PCM were likewise omitted when using the Boussinesq approximation and natural convection was assumed to be laminar. For a proper comparison of results, two of the cell cases were chosen based on the experiments performed in the current study: the unfinned (base case) and the best-performing rectangular fin case.

3.1. Governing Equations

PCM melting includes a complicated two-phase flow simulation with strong natural convection effects. As a result, the enthalpy porosity approach of Voller and Prakash [31] was used to simulate the phase transition process using a single set of governing equations. The equations for continuity, momentum, and energy are shown in Equations (1)–(3), respectively.
ρ t + ( ρ u i ) x i = 0
( ρ u i ) t + ( ρ u i u j ) x j = p x i + μ 2 u i x j x j + F B i + F M i
( ρ h ) t + ( ρ u i h ) x i = x i λ T x i
where g, u, ρ , μ , and p are the gravitational acceleration, velocity density, viscosity, and pressure, respectively. Natural convection is induced during PCM melting due to temperature-dependent density differential and gravitational influences. The momentum equation’s buoyancy source term F B i was solved using the Boussinesq approximation: F B i = β ρ ( T T l ) g . In the energy equation, λ , h, and T are the thermal conductivity, enthalpy, and temperature, respectively.

3.2. Enthalpy Variations

Depending on the phase of the material, PCM enthalpy variations can be divided into three primary stages: (i) fully solid PCM; (ii) partially liquid and solid PCM; and (iii) fully liquid PCM. Equation (4) represents the phase segregation-based mathematical expressions for these enthalpies.
h = T R T C p s d T , if T < T s T R T s C p s d T + Δ H , if T s T < T l T R T s C p s d T + Δ H + T l T C p l d T , if T T l
where T R is the reference temperature, which had the value of 27 ° C in this study.

3.3. Melting Fraction

The latent heat content is denoted by Δ H, while the specific heat for liquid and solid PCM is denoted by C p l and C p s , respectively. The PCM melt fraction ( δ ) is given in Equation (5).
δ = Δ H L PCM = 0 , if T < T s T T s T l T s , if T s < T < T l 1 , if T > T l
Similar to the enthalpy variations, the melting fraction has three stages: (i) when temporal temperature is below the solidus temperature of PCM, the melting fraction is 0; (ii) when temporal temperature is above the liquidus temperature, the melting fraction is 1; (iii) when the temporal temperature is between the liquidus and solidus temperatures, the melt fraction is calculated using the ratio of the difference between the liquidus and solidus temperatures to the difference between the temporal and solidus temperatures.

3.4. Momentum Source Term

The momentum variation in liquid PCM induced by natural convection is described by the source term F M i in Equation (2). Additionally, Equation (6) represents the damping source term, which is characterized by Darcy’s law according to the model proposed by Olabi et al. [32].
F M i = A Mushy ( 1 δ ) 2 δ 3 + ξ u i
where A M u s h y serves as the mushy zone constant responsible for velocity damping. Values of A M u s h y generally range from 10 4 to 10 7 . The higher the value of A M u s h y , the slower the melting. The A M u s h y value chosen for this case was 10 5 .

3.5. Discretization Schemes

A buoyant two-phase (solidification/melting) laminar flow was simulated using Ansys Fluent 2021 R 2 . For the pressure-velocity coupling, the semi-implicit method for pressure-linked equations (SIMPLE) was used. The governing equation’s diffusive part was resolved using a second-order central differencing scheme and the momentum term was solved using the pressure staggering option (PRESTO) scheme. In the energy and momentum equations, the convection terms were resolved using a third-order monotone upstream-centered scheme for conservation laws ( M U S C L ) . Temporal discretization was achieved using a second-order implicit scheme, which is very stable. To obtain accurate results, the convergence criteria were set to 10 6 .

3.6. Timestep and Mesh Independence Study

To eliminate the effects of mesh and timestep on the solution, a mesh and timestep independence study was conducted. Three different grid sizes were created: 10,000, 20,033, and 36,668 elements. Also, for timestep independence, 0.5 s, 0.25 s, and 0.125 s were investigated on a grid size of 20,033 elements. No significant deviations were observed during either study. So, a timestep size of 0.5 s and a grid size of 20,033 elements were chosen. Figure 7 shows the time–temperature curve for each of the element sizes and timesteps.

4. Results and Discussion

Experimental Results

The performance of each case was evaluated based on its geometry. The main parameter under study was cell temperature. The base case, which was the unfinned case, was also evaluated without the PCM, which helped to create the baseline reference temperatures to compare the results to after the addition of the PCM and different fin structures, as shown in Figure 8c. The temperature variation in all four cases with respect to time is shown in Figure 8. The temperature variation in the 3C discharge rate is shown in Figure 3c, in which the unfinned case had the maximum temperature due to heat accumulation after the melting front completely traveled away from the cell surface. The maximum temperature achieved for the unfinned case was 45.87 ° C at 60 min. That is 5.87 ° C beyond the maximum temperature for 18650 li-ion cells. The taper and circular fin cases had maximum temperatures of 44.4 ° C and 42.9 ° C, respectively. However, the rectangular fin case was the best-performing case in all of the experiments performed, having a maximum temperature of 42.7 ° C at 60 min. The percentage decrease in temperature achieved for the 3C discharge rate with the rectangular fins was 6.91 % . Although the temperature at 60 min was above the optimum temperature, it can be seen that a significant increase in operation time to achieve the maximum optimal temperature. For instance, an unfinned case achieves 40 ° C at 28.08 min. However, the rectangular fins case achieved a temperature of 40 ° C at 43.17 min, which represented approximately 15 min more operation time below the maximum temperature. The reason for the increase in temperatures above the optimal cell temperature was because of the 0.2 W/m·K thermal conductivity of the phase change material, which created a thermal barrier with its high storage energy when the melting front was away from the cell surface, as well as the fin surfaces. Similarly, for the 2C discharge rate, the best-performing case was the rectangular fin case, with a maximum temperature of 33.915 ° C. The unfinned case had the highest temperature of 37.82 ° C, which showed that the rectangular fins had a very significant effect on the temperatures of the cells. All of the different geometries stayed below 40 ° C for the 2C and 1C cases as the conduction region of the PCM was very effective at limiting the cell temperature.
Figure 8 shows the key difference and effectiveness of the addition of the PCM and fins in the lIB pack. As a comparison, it can be observed in Figure 8c that the unfinned ambient 3C case achieved 40 ° C at 5.6 min, whereas the unfinned case with the PCM achieved the same temperature at 28.42 min and the rectangular fin case with the PCM achieved it at 43.17 min, which were significant changes. Also, Figure 8a,b shows the major effectiveness of the introduction of the PCM and fins in the LIB pack. For the unfinned ambient case at 1C, the temperature reached 36.11 ° C at 60 min compared to the optimum rectangular fin case, which had a maximum temperature of 25.38 ° C. So, a temperature improvement of 29.71% was observed for 1C. Similarly, for the 2C discharge rate, the maximum temperatures of the unfinned ambient and rectangular fin cases were 47.34 ° C and 33.92 ° C, respectively. A maximum temperature improvement of 28.35% was observed for the 2C discharge rate.

5. Thermal Performance of the BTMS

To evaluate thermal performance based on the temperature evolution during a fixed 60-min cycle for each discharge rate (heat generation rate), a performance enhancement factor Θ was defined, as shown in Equation (7).
Θ ( t ) = T cell ( t ) T ref ( t ) T cell ( t ) T initial ( t ) T ref ( t )
where T cell is the temperature at t = 60 min, T initial is the initial temperature of the cell at t = 0 min, and T ref is the reference temperature, which was the average ambient temperature kept constant at the time of each experiment and numerical simulation. Figure 9 depicts the thermal performance enhancement for the rectangular fin case, which was greater than all of the other cases (smaller bar heights represent better results) at the 3C and 2C discharge rates. However, the 1C case was only in the conduction region and the melting fraction remained zero throughout the time of the experiment and simulation, so the trends changed and the unfinned case performed better. The thermal performance factors for each Discharge rate are shown in Table 2.
The temperature ratio comparison shown in Figure 9 is based on the unfinned ambient case, which showed that the rectangular fin case at 3C tended to keep the temperature of the cells below the required level at θ = 4.18. The circular fin case was at the borderline for the 3C discharge rate.

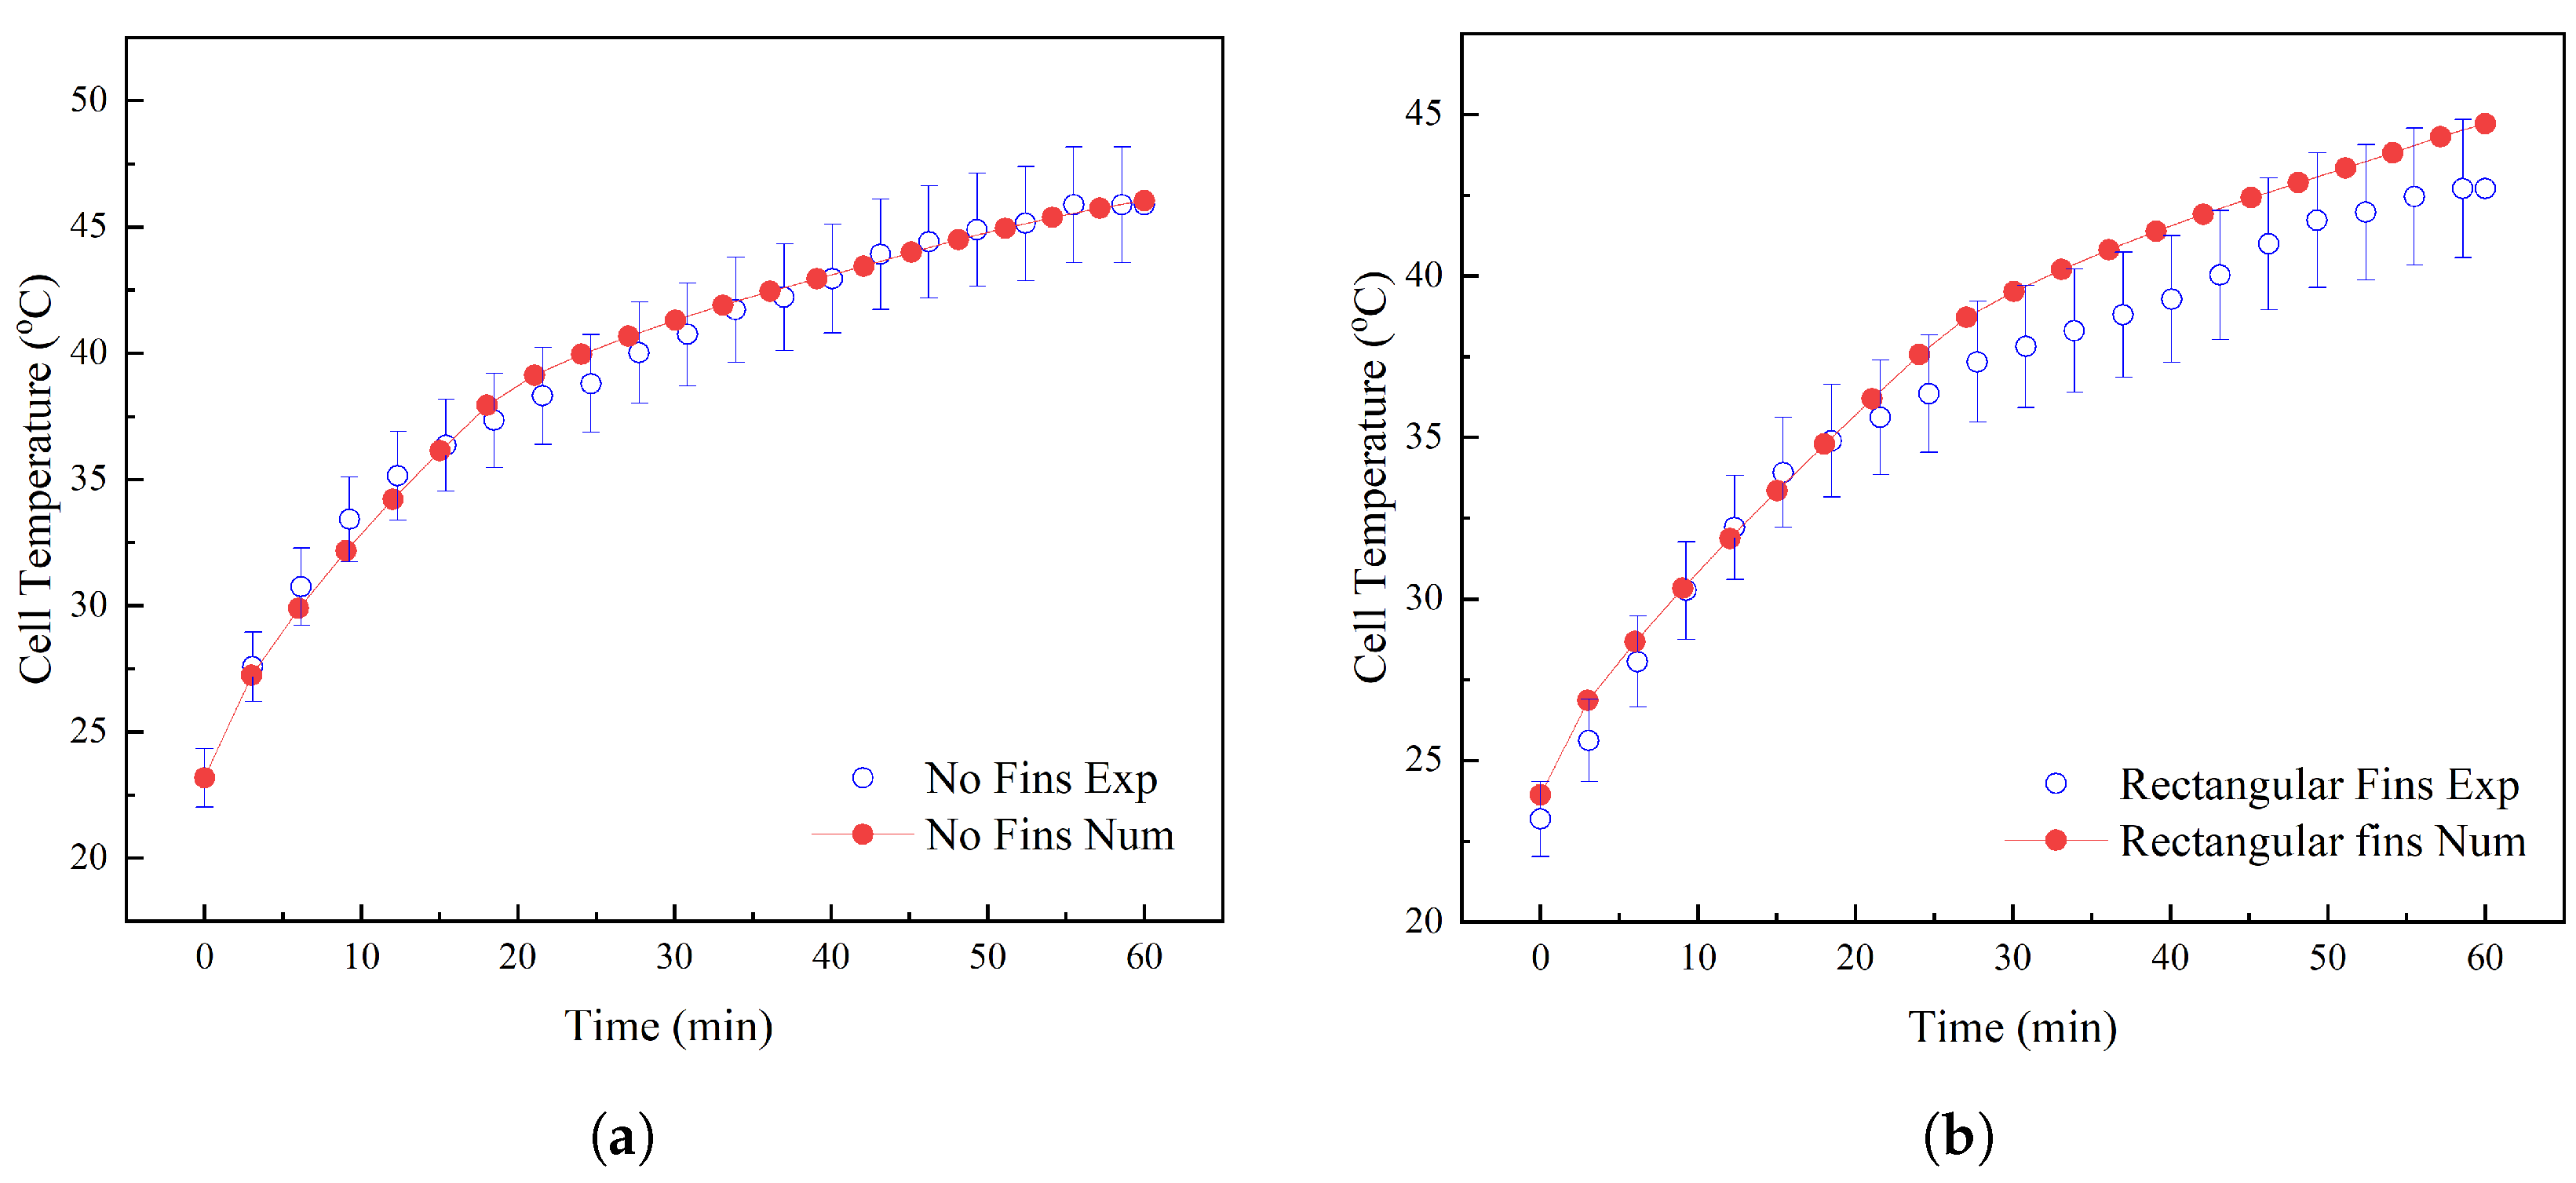
6. Comparison of Numerical and Experimental Results

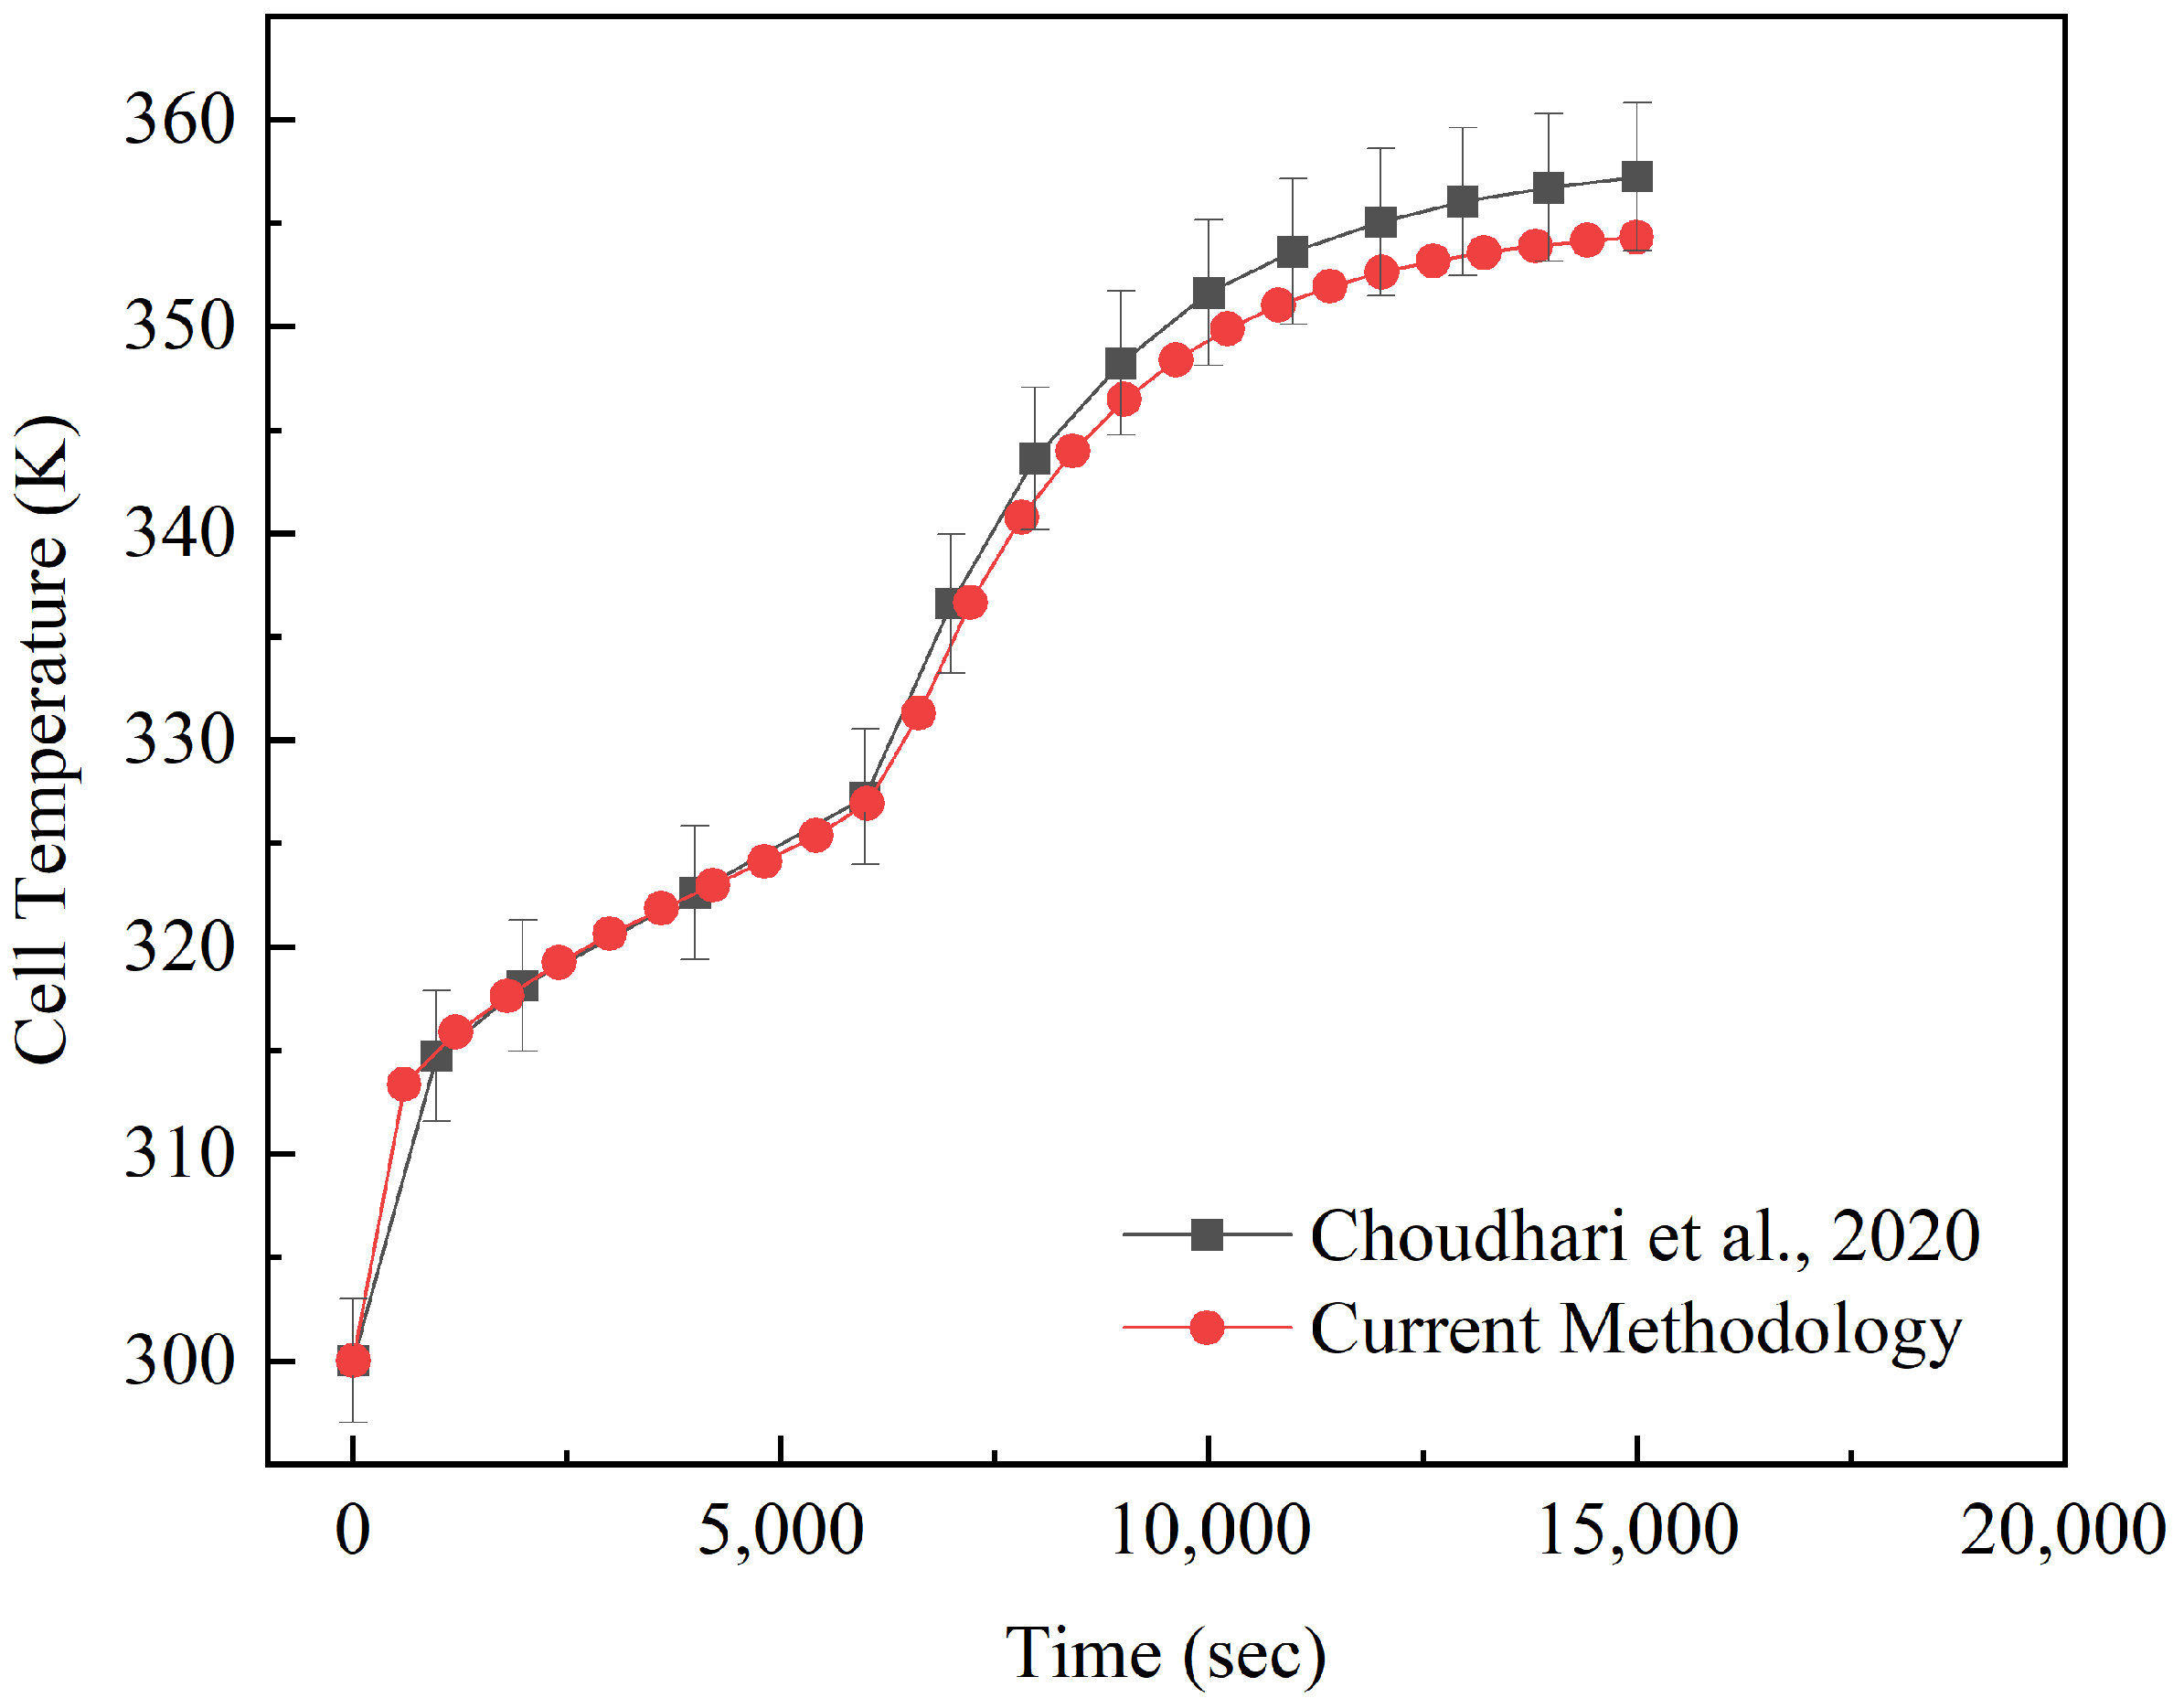
6.1. Numerical Validation

To verify the correctness of the numerical model, along with a comparison to the experimental results, the numerical model and methodology were also validated by reproducing the results and comparing them, as performed by [30]. Figure 10 shows the validation results with errors of less than 1%.
This verified that the numerical model created was correct and would give accurate results. The numerical model was then validated using the experimental results from the unfinned and rectangular fin cases at the 3C discharge rate, as shown in Figure 11. The results lay within the error range of 5%. So, the numerical predictions verified the correctness of the performed experimentation.

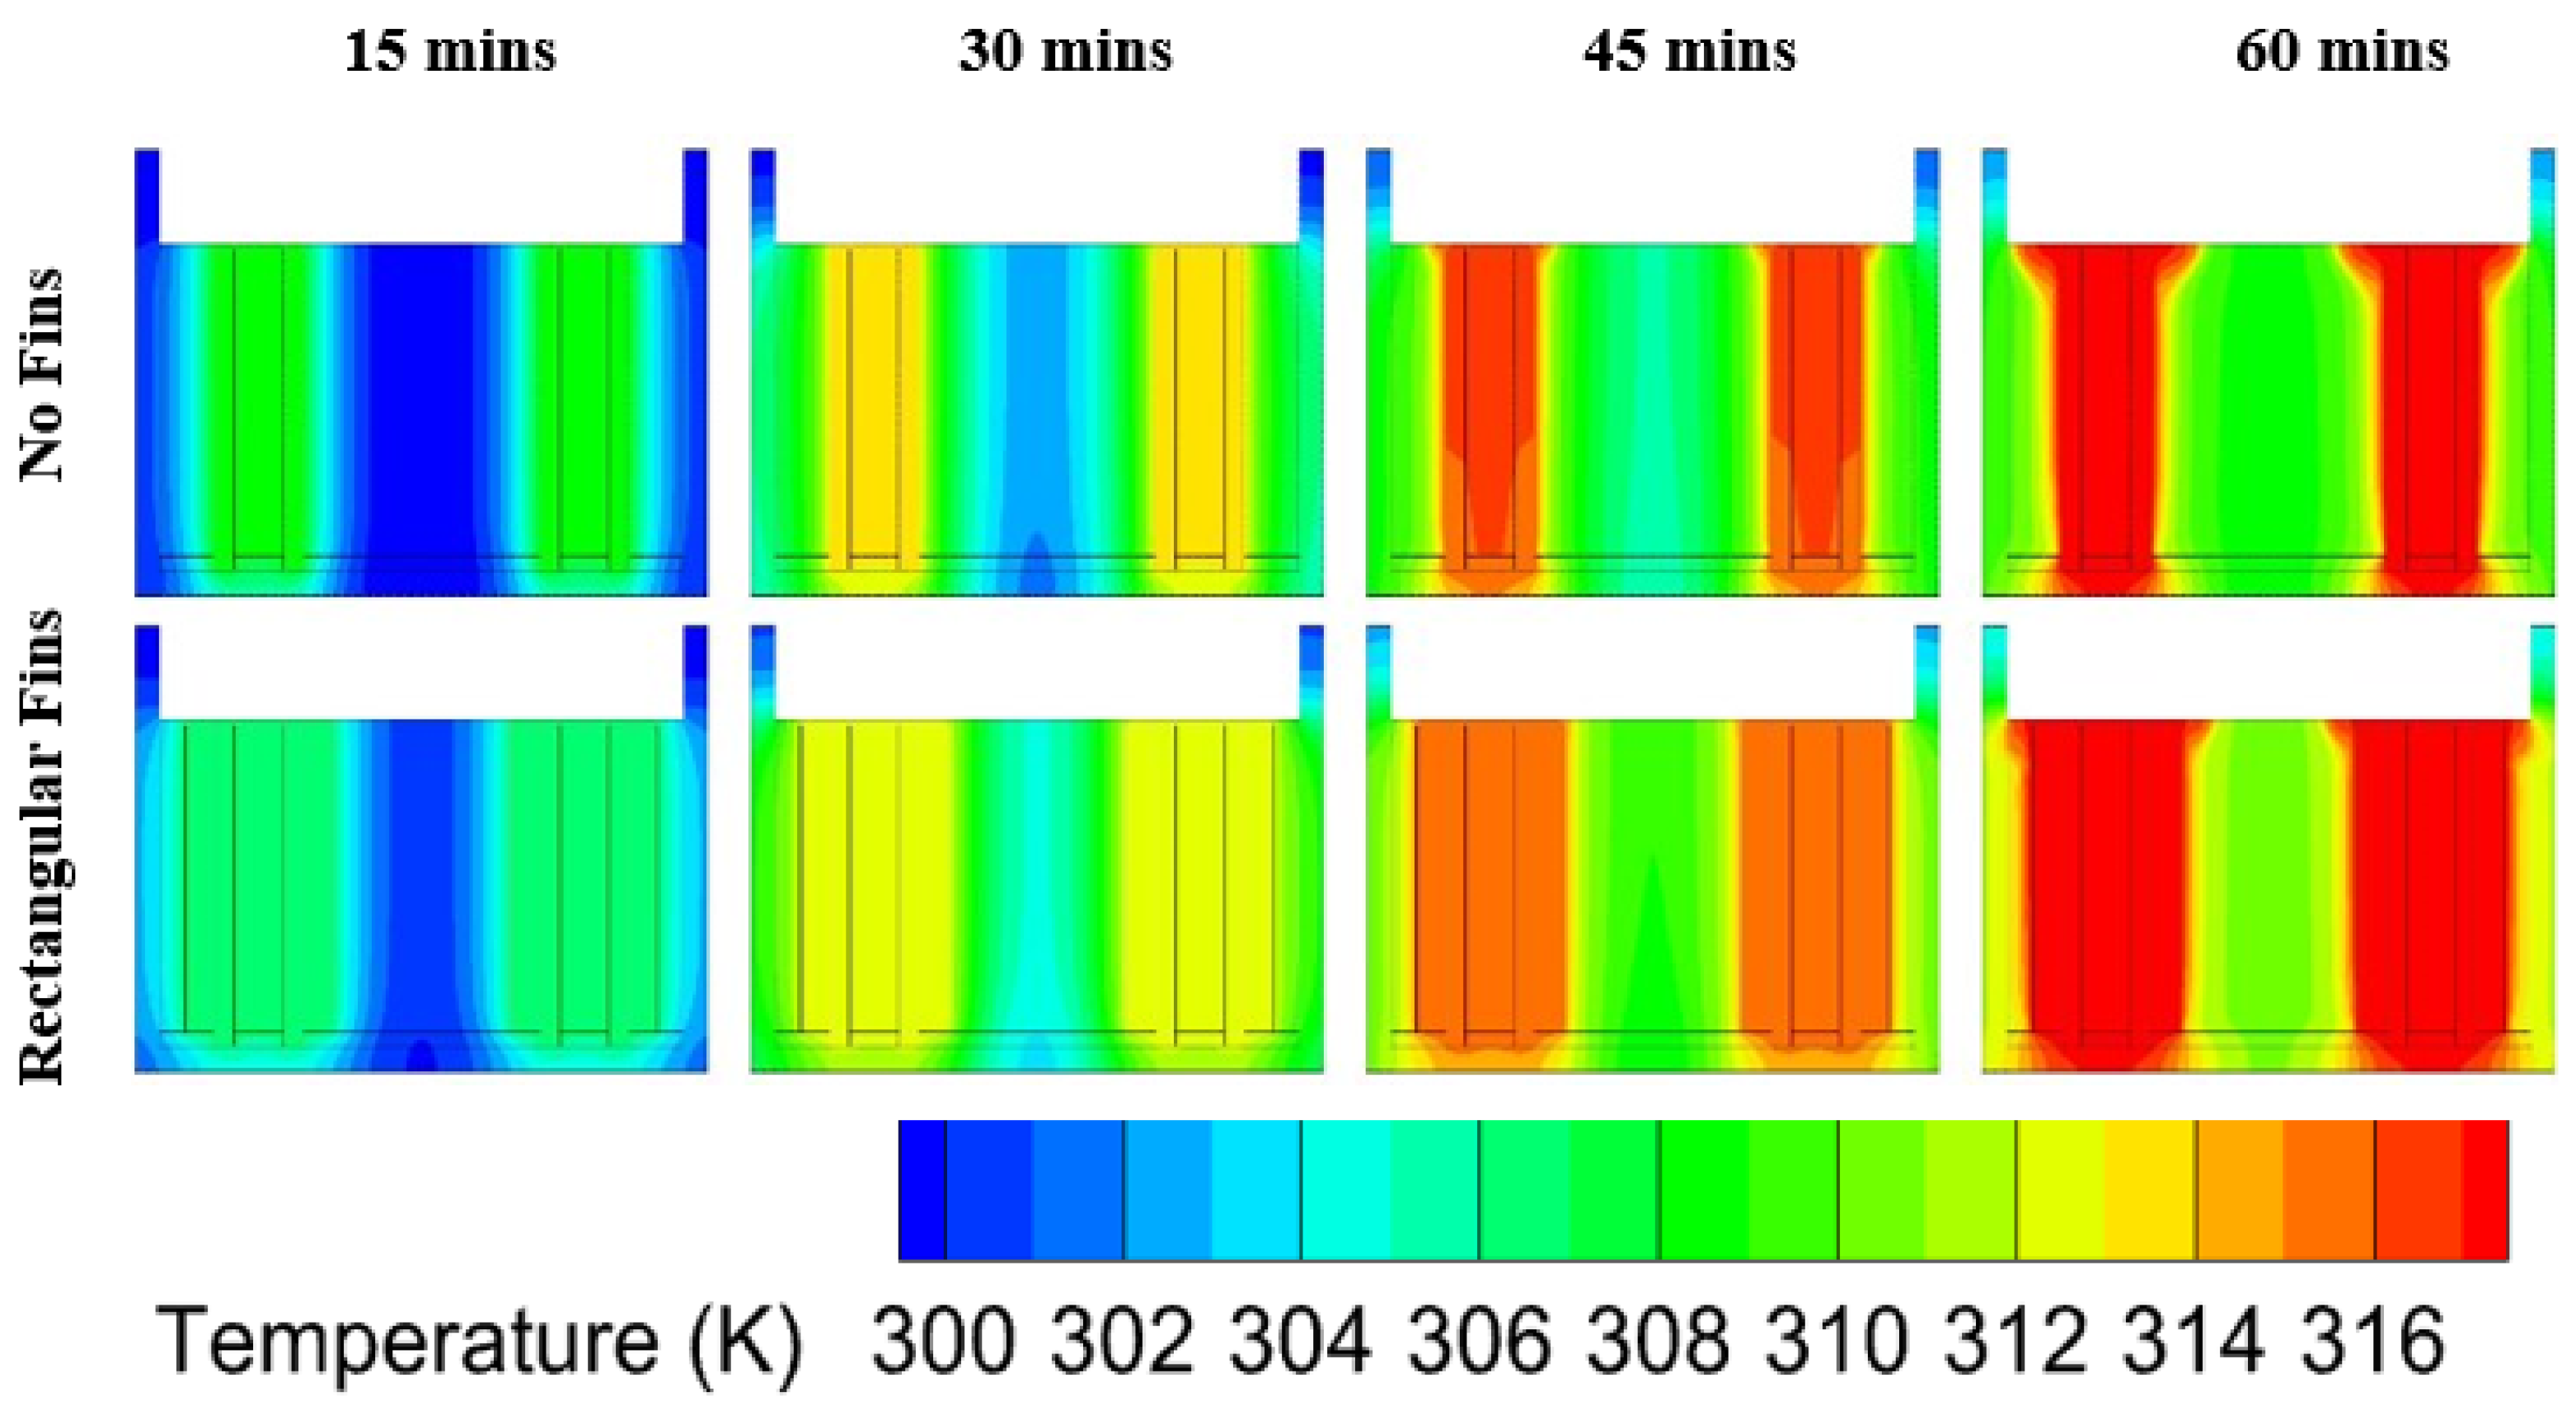
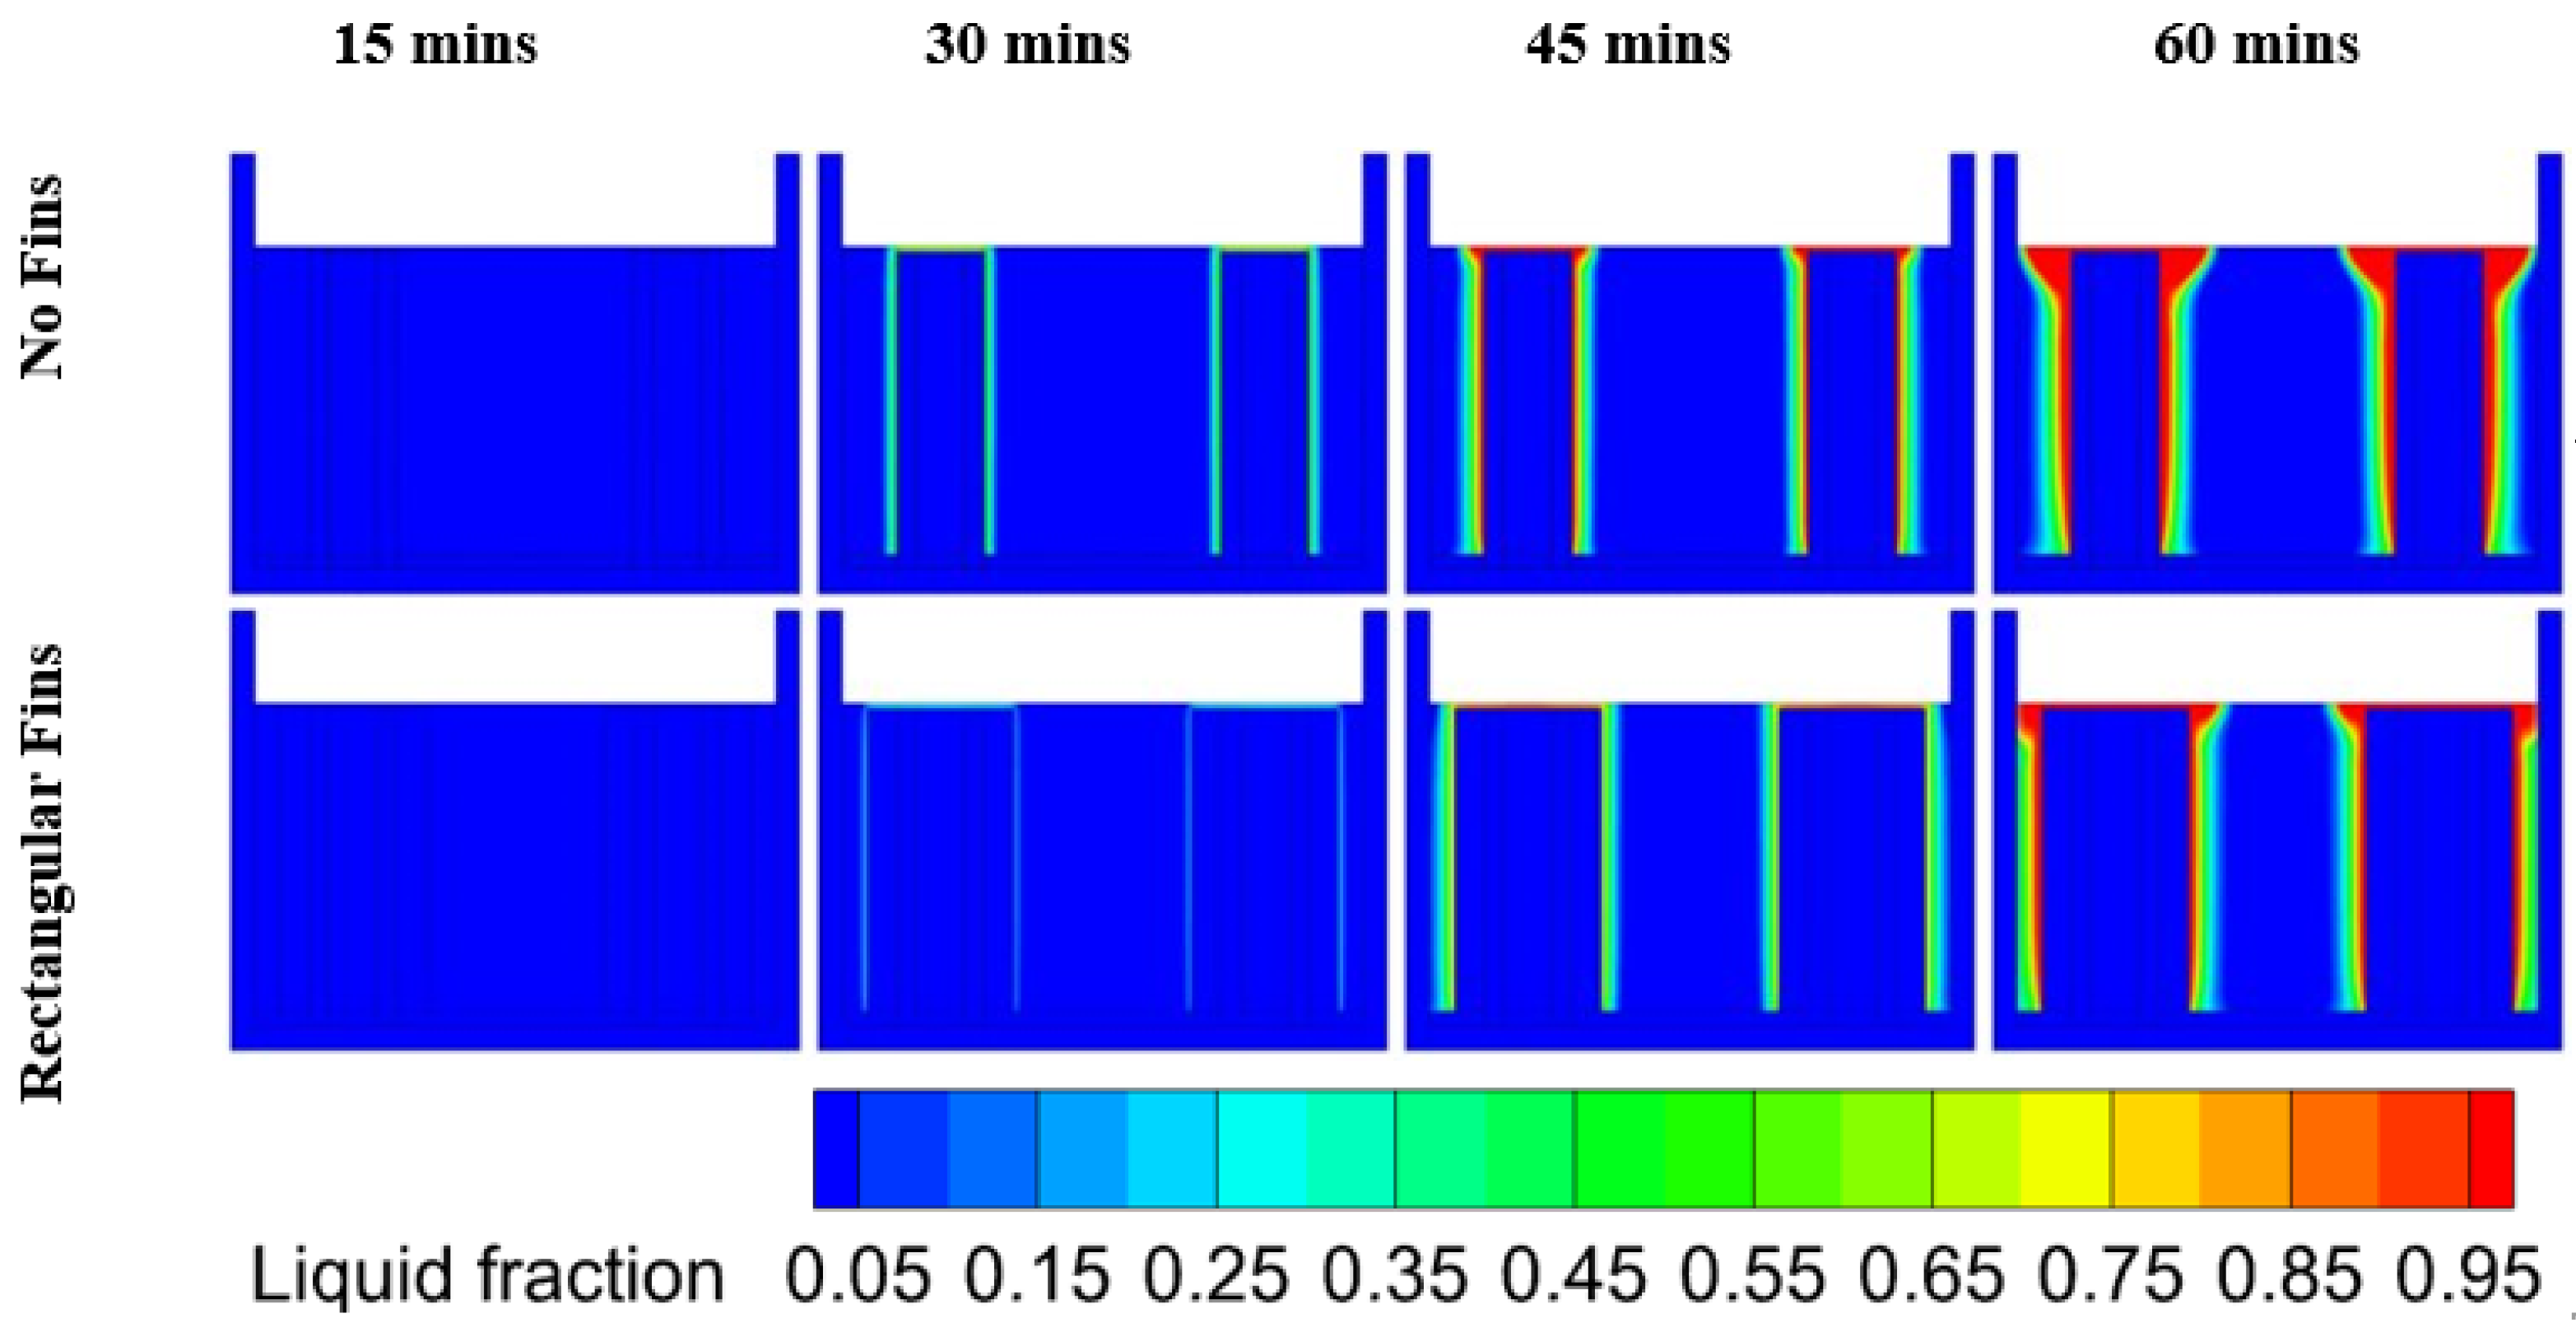
6.2. Heat Transfer in PCM at Different Discharge Rates

The temperature distribution and melt fraction evolution are shown in Figure 12 and Figure 13, which indicate that the temperature propagation for the rectangular fin case was higher compared to the unfinned case. The heat accumulation in the unfinned case at 45 min was due to the PCM having a melt fraction of 100% near the cell wall, which created a thermal barrier close to the wall due to the low thermal conductivity of the PCM. The rectangular fin case had lower cell temperatures and less heat accumulation as the fins propagated the heat into the PCM, even if the PCM at the cell surface was melted, which kept the cell temperatures lower than those of cells without fins. The corresponding melt fractions are shown in the figure. The PCM on the top surface of the cells melted faster than that at the height H of the cells, which led to the spread of the melt fraction and flow at the top surface.
The temperature variation at the 2C discharge rate had a similar behavior as discussed in the 3C section. The temperature contours are shown in Figure 14. The temperature propagation is also depicted and it can be seen that heat from the acrylic housing was lost to the environment at free stream temperature with a heat transfer coefficient of 2.5 W/m2-K. The melting fraction in the unfinned and rectangular fin cases remained 0% as the melting was only localized on the cell top surface and close to the cell wall along the height of the cells. The overall melt fraction reached a maximum value of 1.3% at 60 mins.
The temperature contours for the 1C discharge rate are shown in Figure 15. The heating rate was very low, which can be seen clearly in the results. However, the rectangular fin case tended to dominate in performance, keeping the temperatures lower than those in the unfinned case.

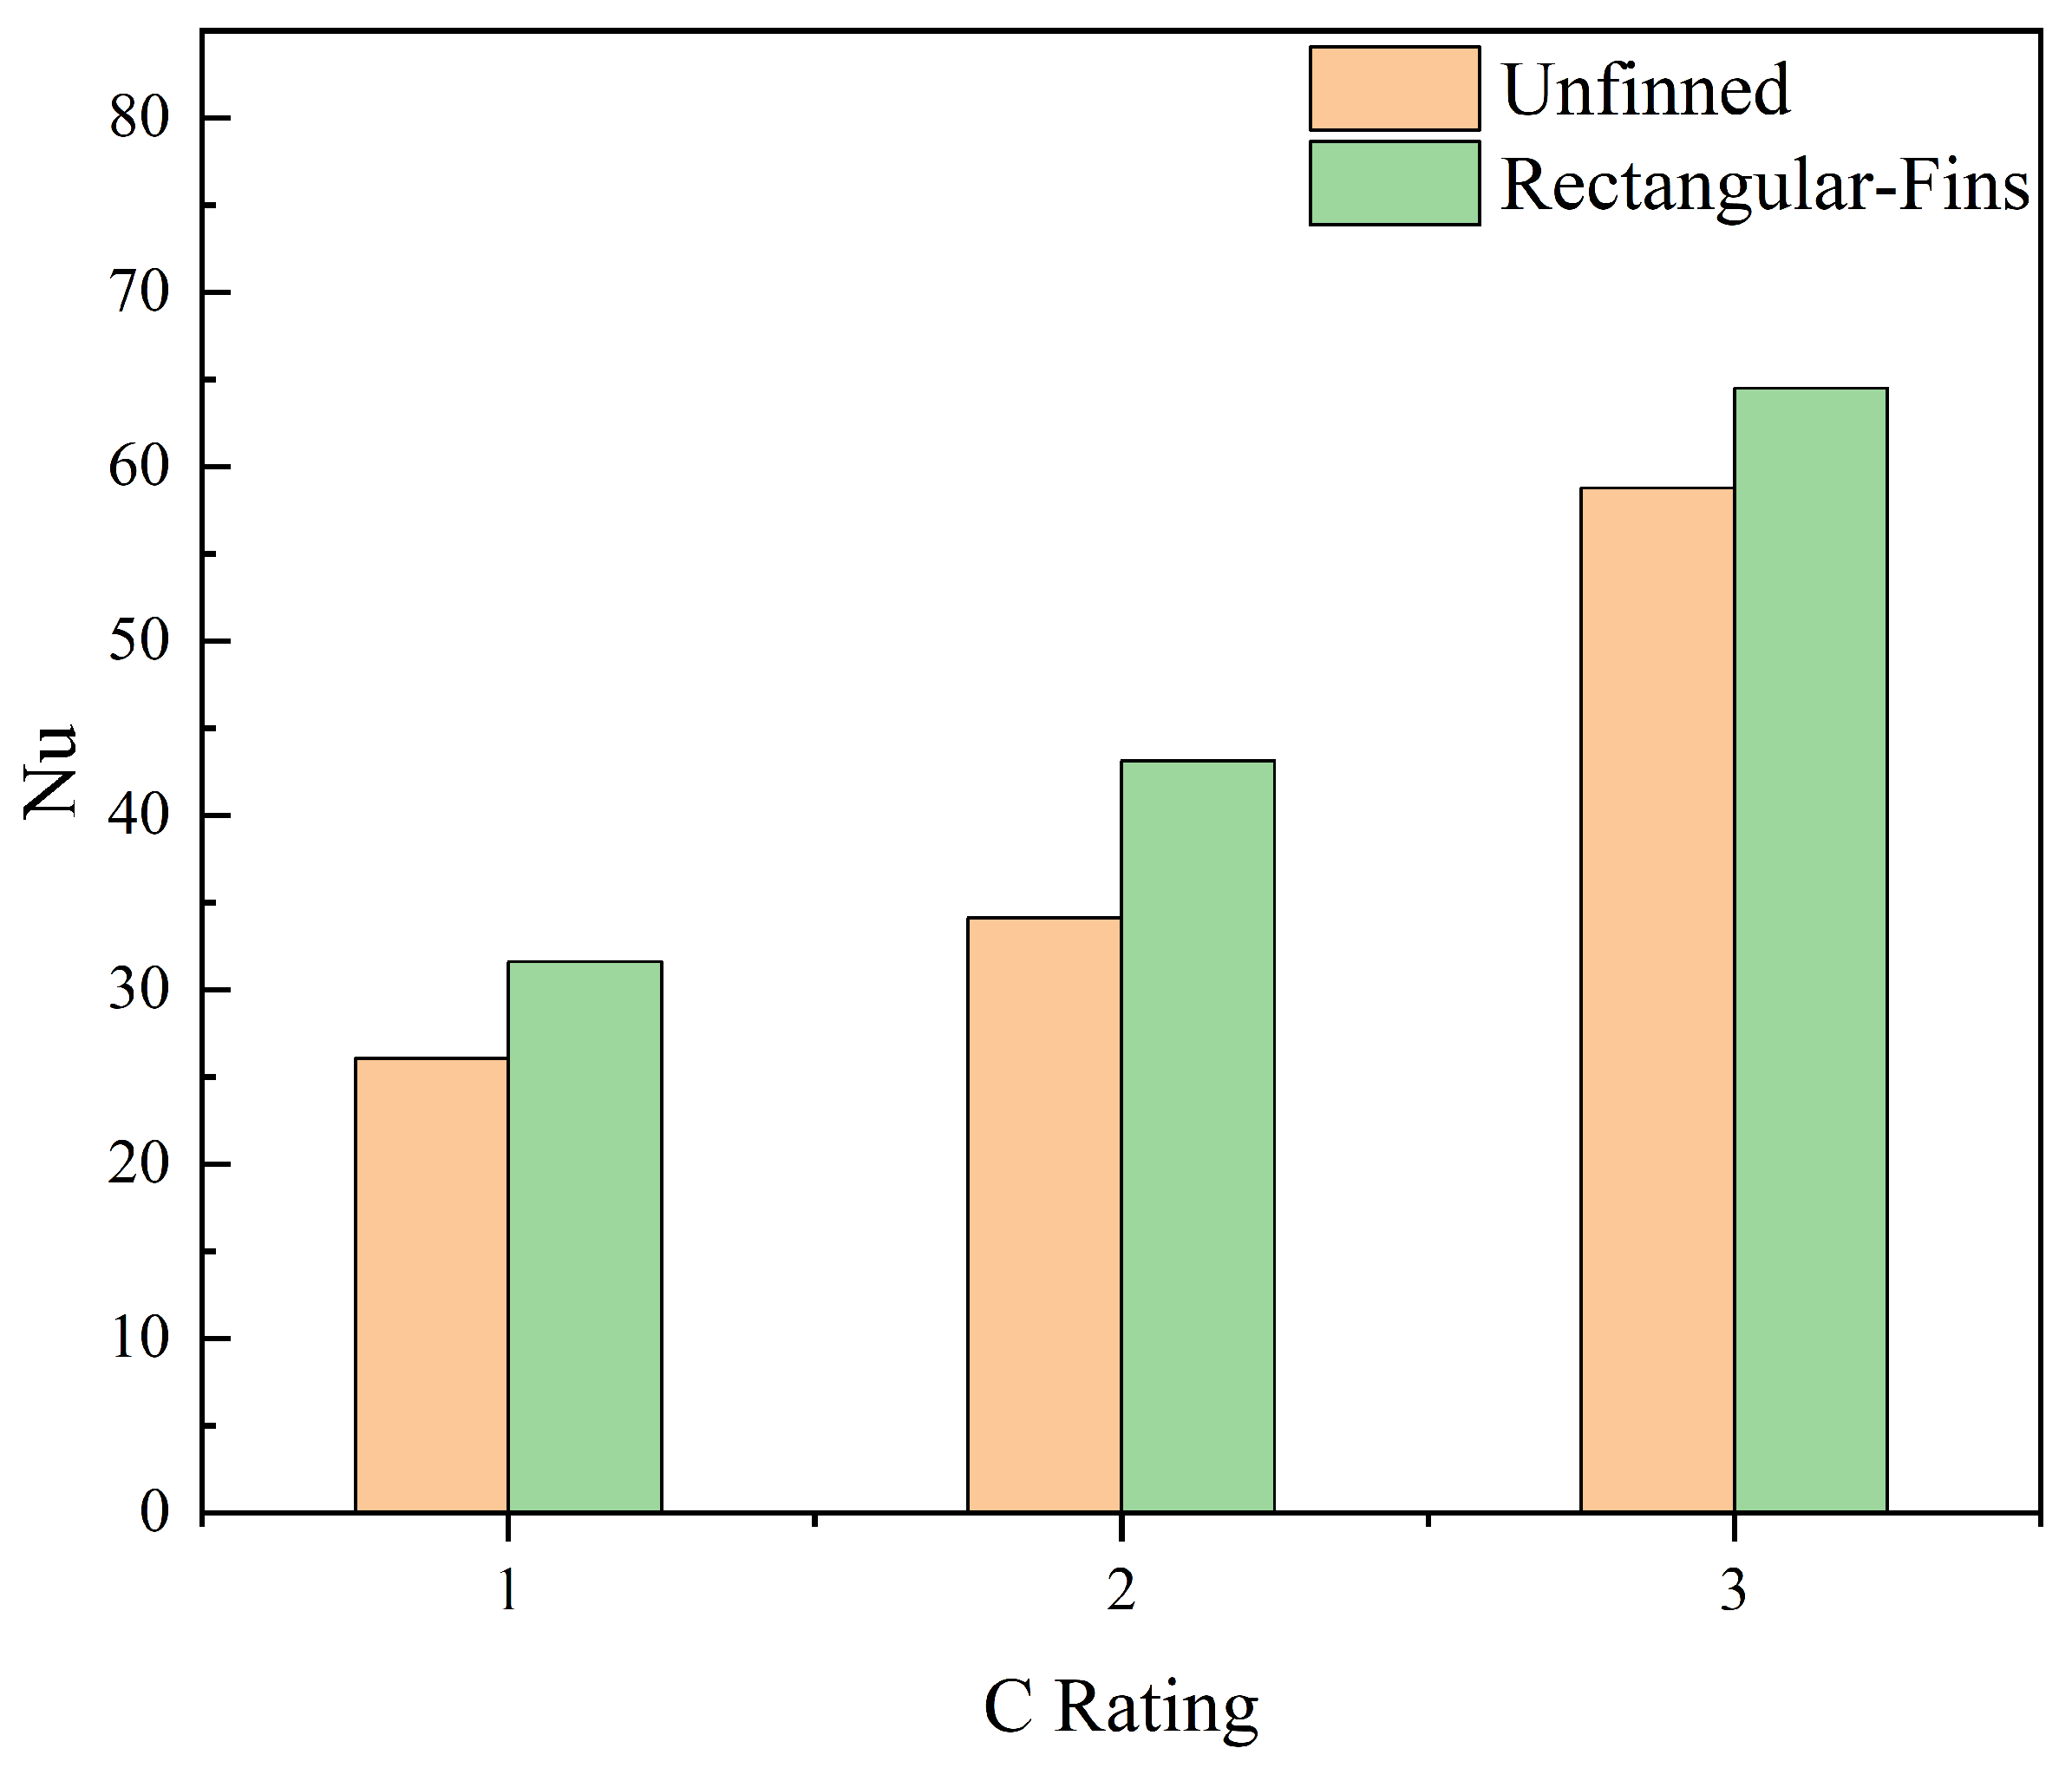
7. Average Nusselt Number and Heat Transfer Coefficient Variations

The heat transfer coefficient could be calculated using the energy stored in the PCM from the simulations. The values obtained for energy (J/kg) were multiplied by the mass of the PCM used in the system and by the flow time at that data point. The following mathematical formulation was used to calculate the heat transfer coefficient and Nusselt number:
Q ˙ ( t ) = Q ( J / kg ) · m ( kg ) t ( s )
The heat transfer coefficient was obtained from
Q ˙ ( t ) = h A s ( T pcm ( t ) T pcm , ref )
h ( t ) = Q ˙ ( t ) A s ( T pcm ( t ) T pcm , ref ( t = 0 ) ) ( W / ( m 2 - K ) )
where T pcm ( t ) is the temperature of the PCM at a specific timestep (flow time) and T ( pcm , ref ( t = 0 ) ) is the reference PCM temperature. The heat transfer coefficient could then be further used to calculate the Nusselt number for each case at the 1C, 2C, and 3C discharge rates.
N u = h L λ
where h is the heat transfer coefficient, L is the characteristic dimension (which was the height H of the cell in this case), and λ is the thermal conductivity of the PCM. The Nusselt numbers were then calculated for each timestep and averaged for each case to compare the convection to the diffusion. The average Nusselt numbers are shown in Figure 16, which indicate that the convective heat transfer of the PCM was stronger in the rectangular fin case due to the propagating heat transfer into the PCM compared to the unfinned case, where heat propagation slowed down as soon as the PCM around the cell melted and the localized temperature rise caused the PCM to melt only around the cell surface.

8. Conclusions

The thermal performance of a 2 × 2 li-ion battery pack was enhanced using the passive cooling method. The PCM RT-42 was highly effective compared to the system being placed in natural convection. The performance of the system was further investigated and enhanced by introducing fins on the external surfaces of the cells. It is pertinent to mention that the effective surface area and mass of the PCM were kept constant for all cases. The important conclusions are presented below:
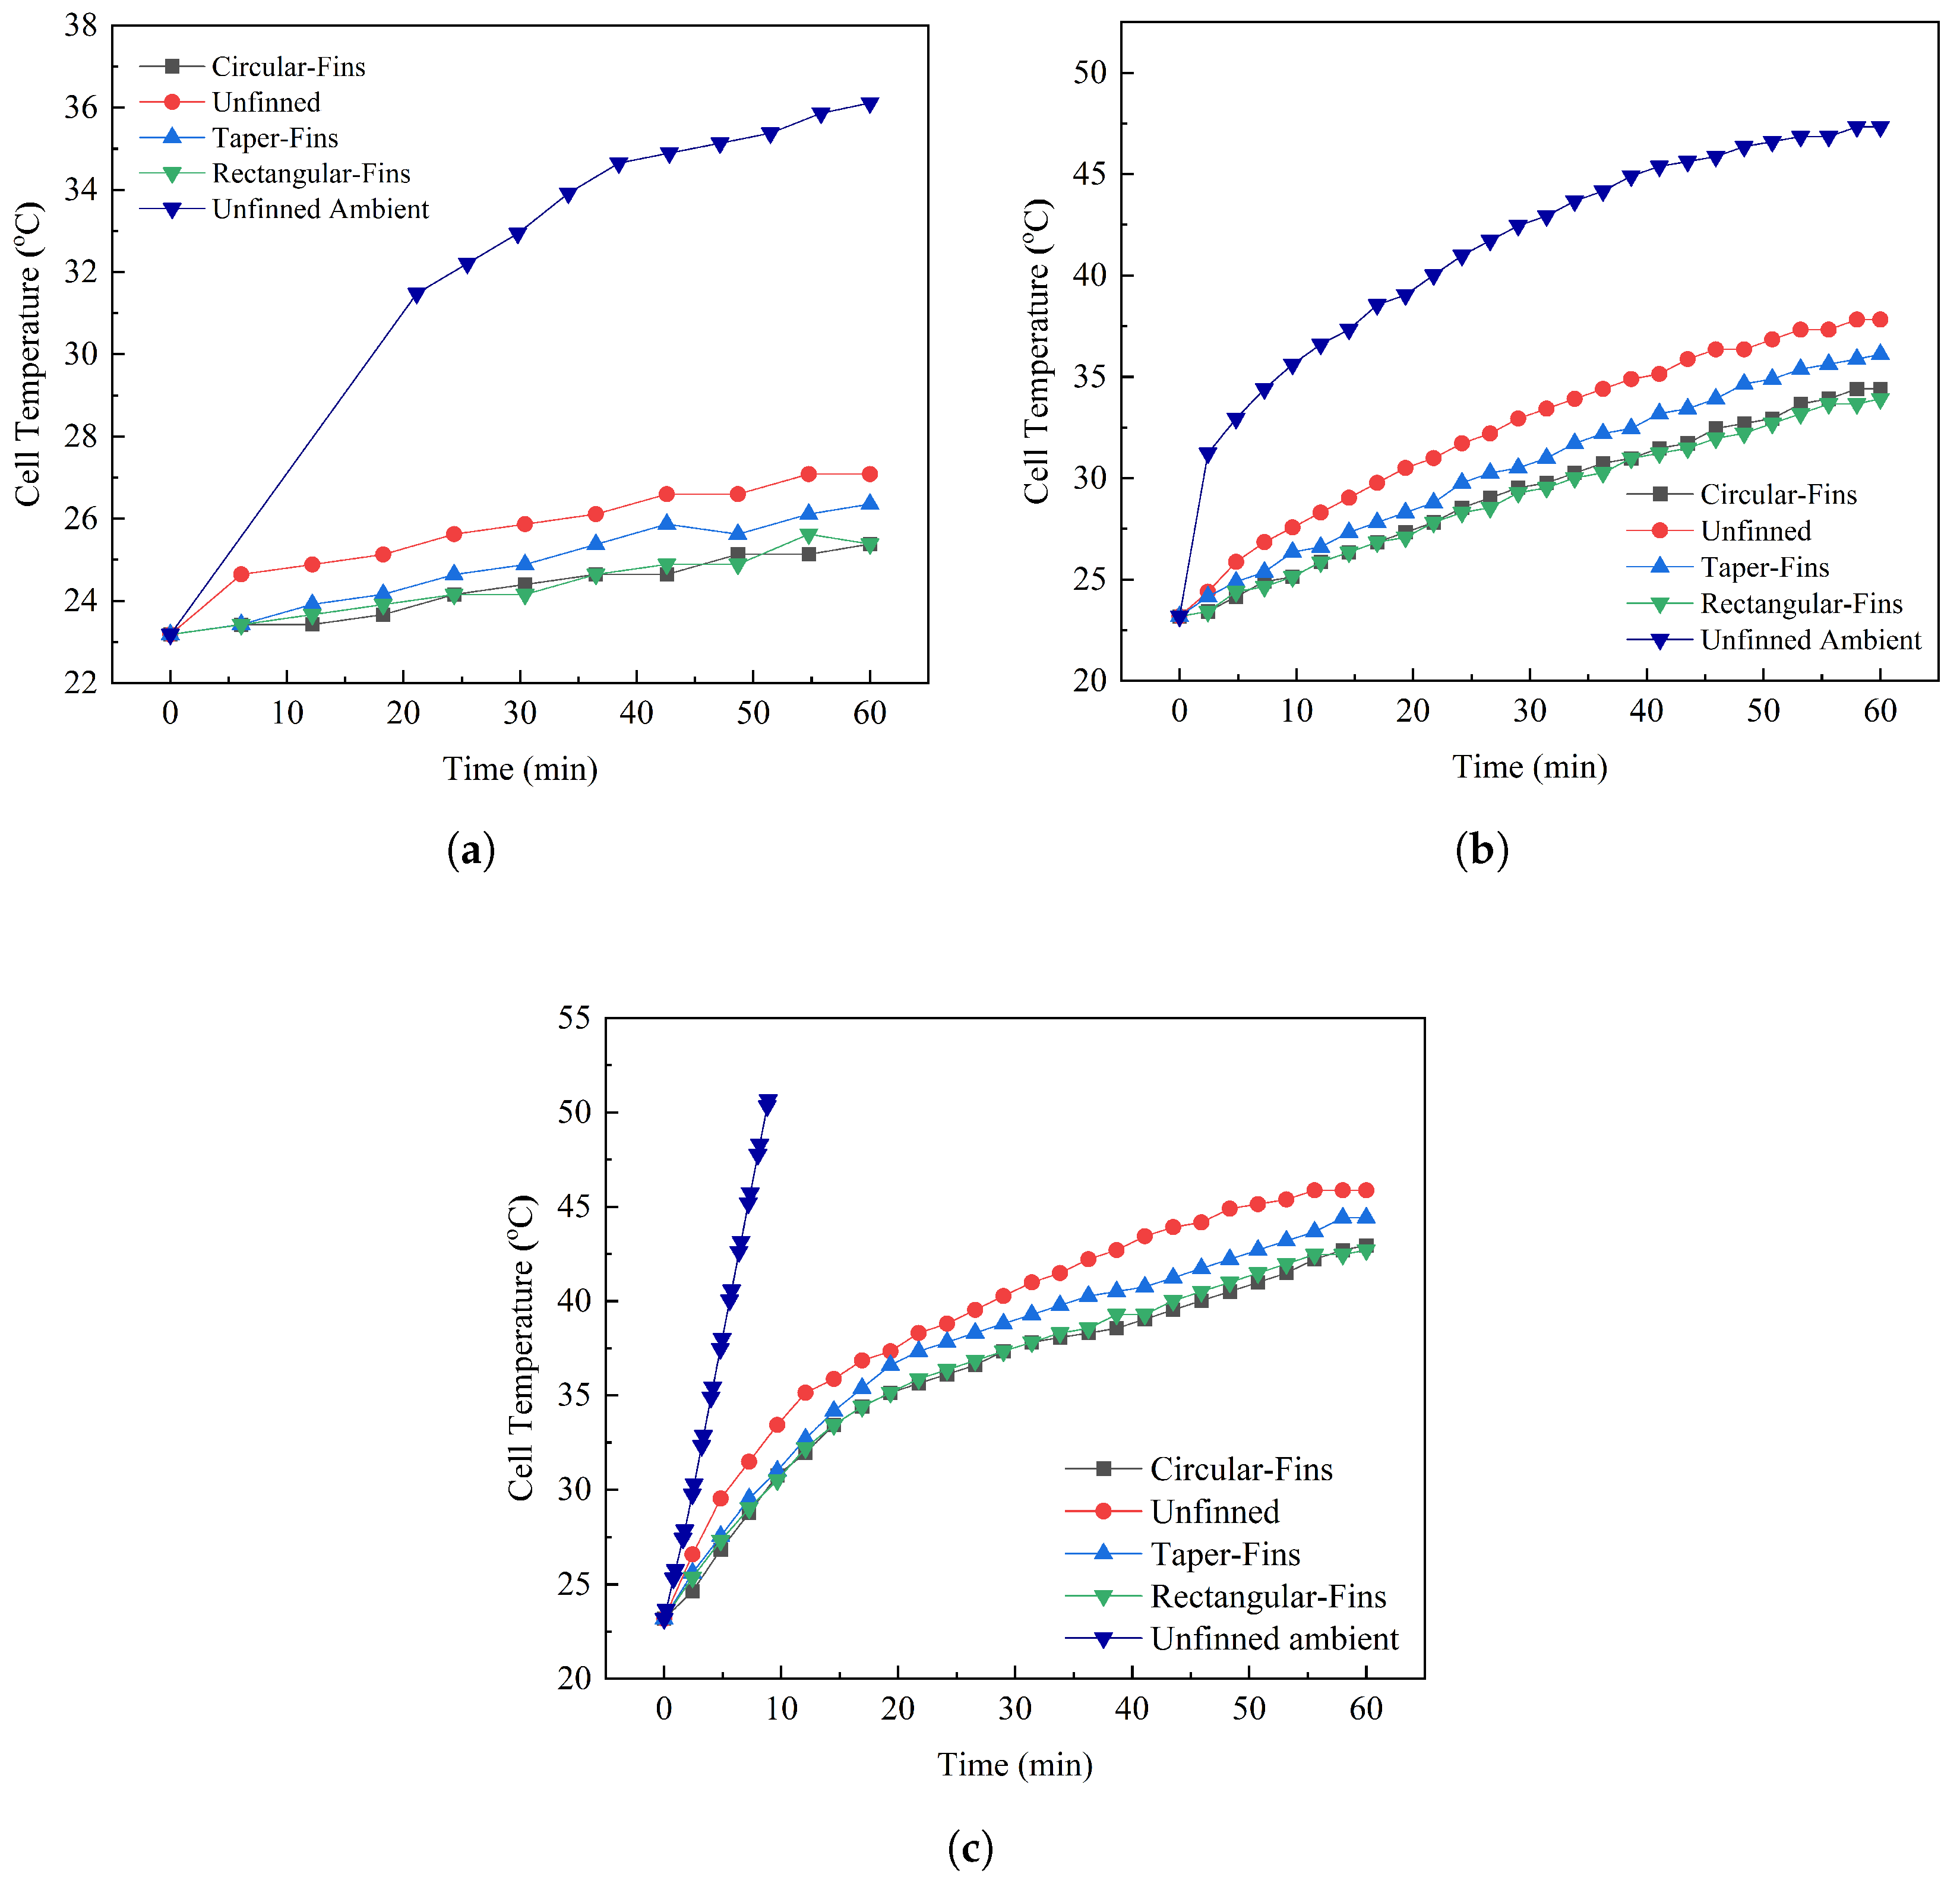
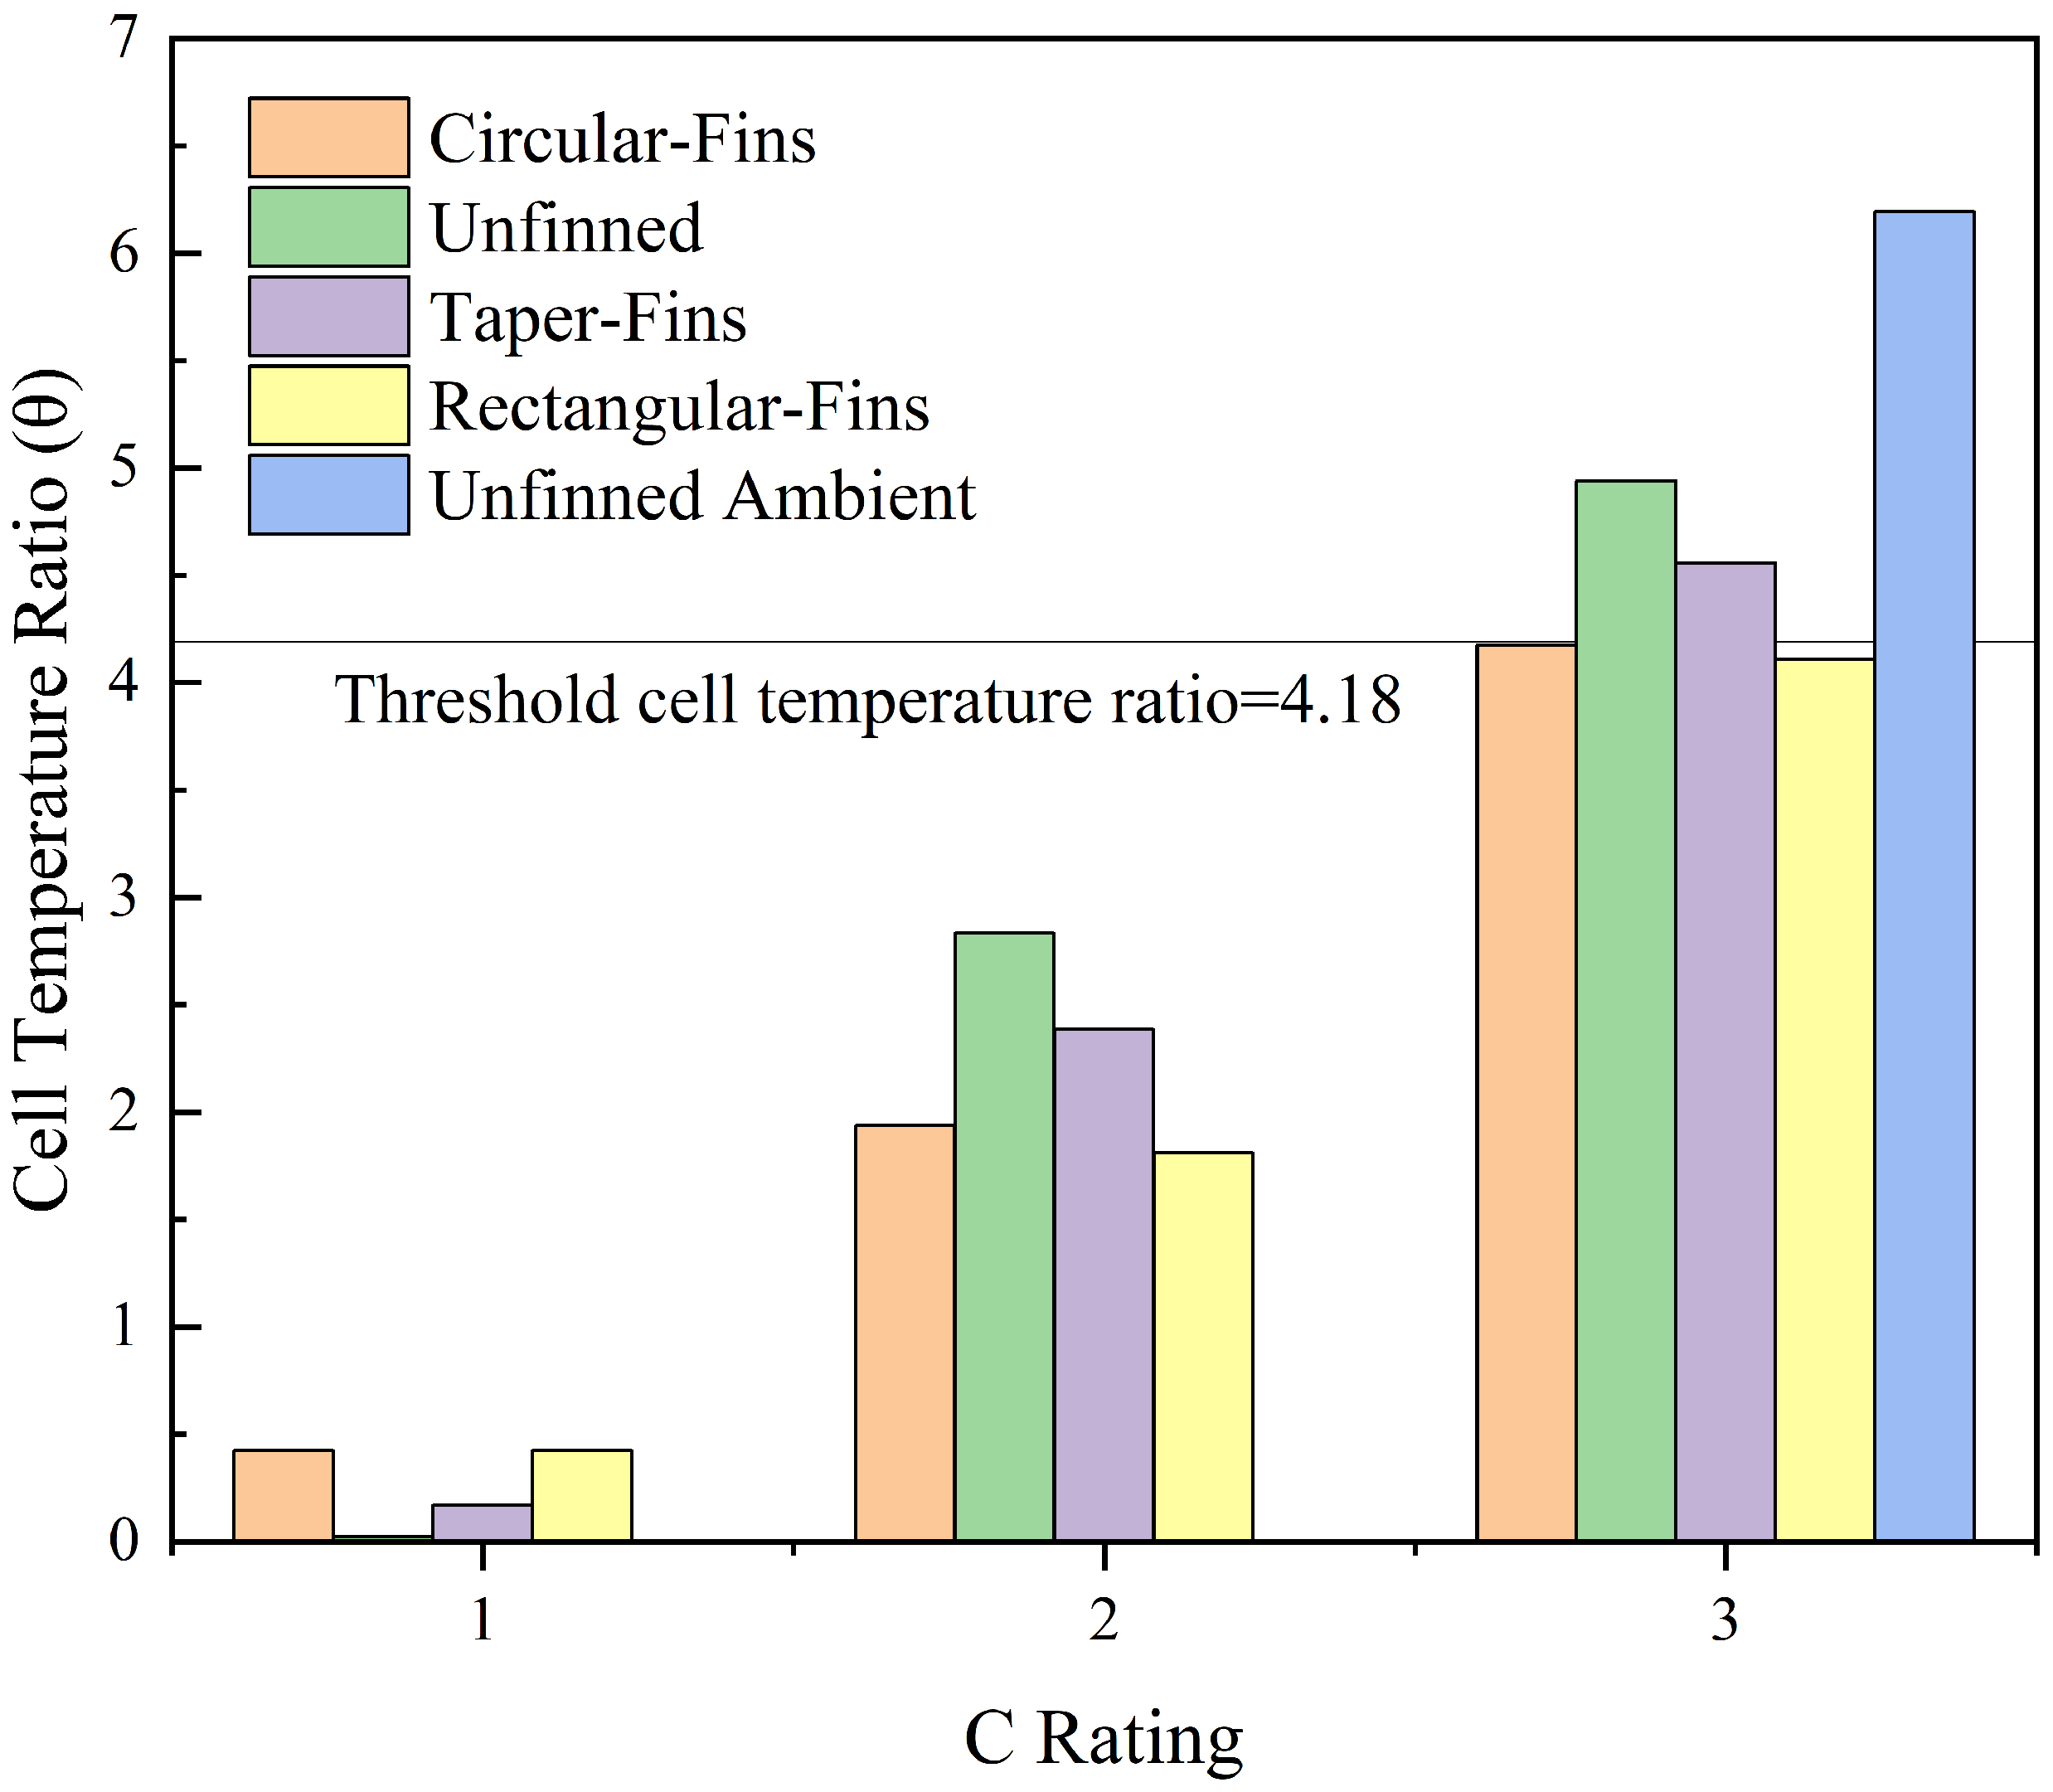
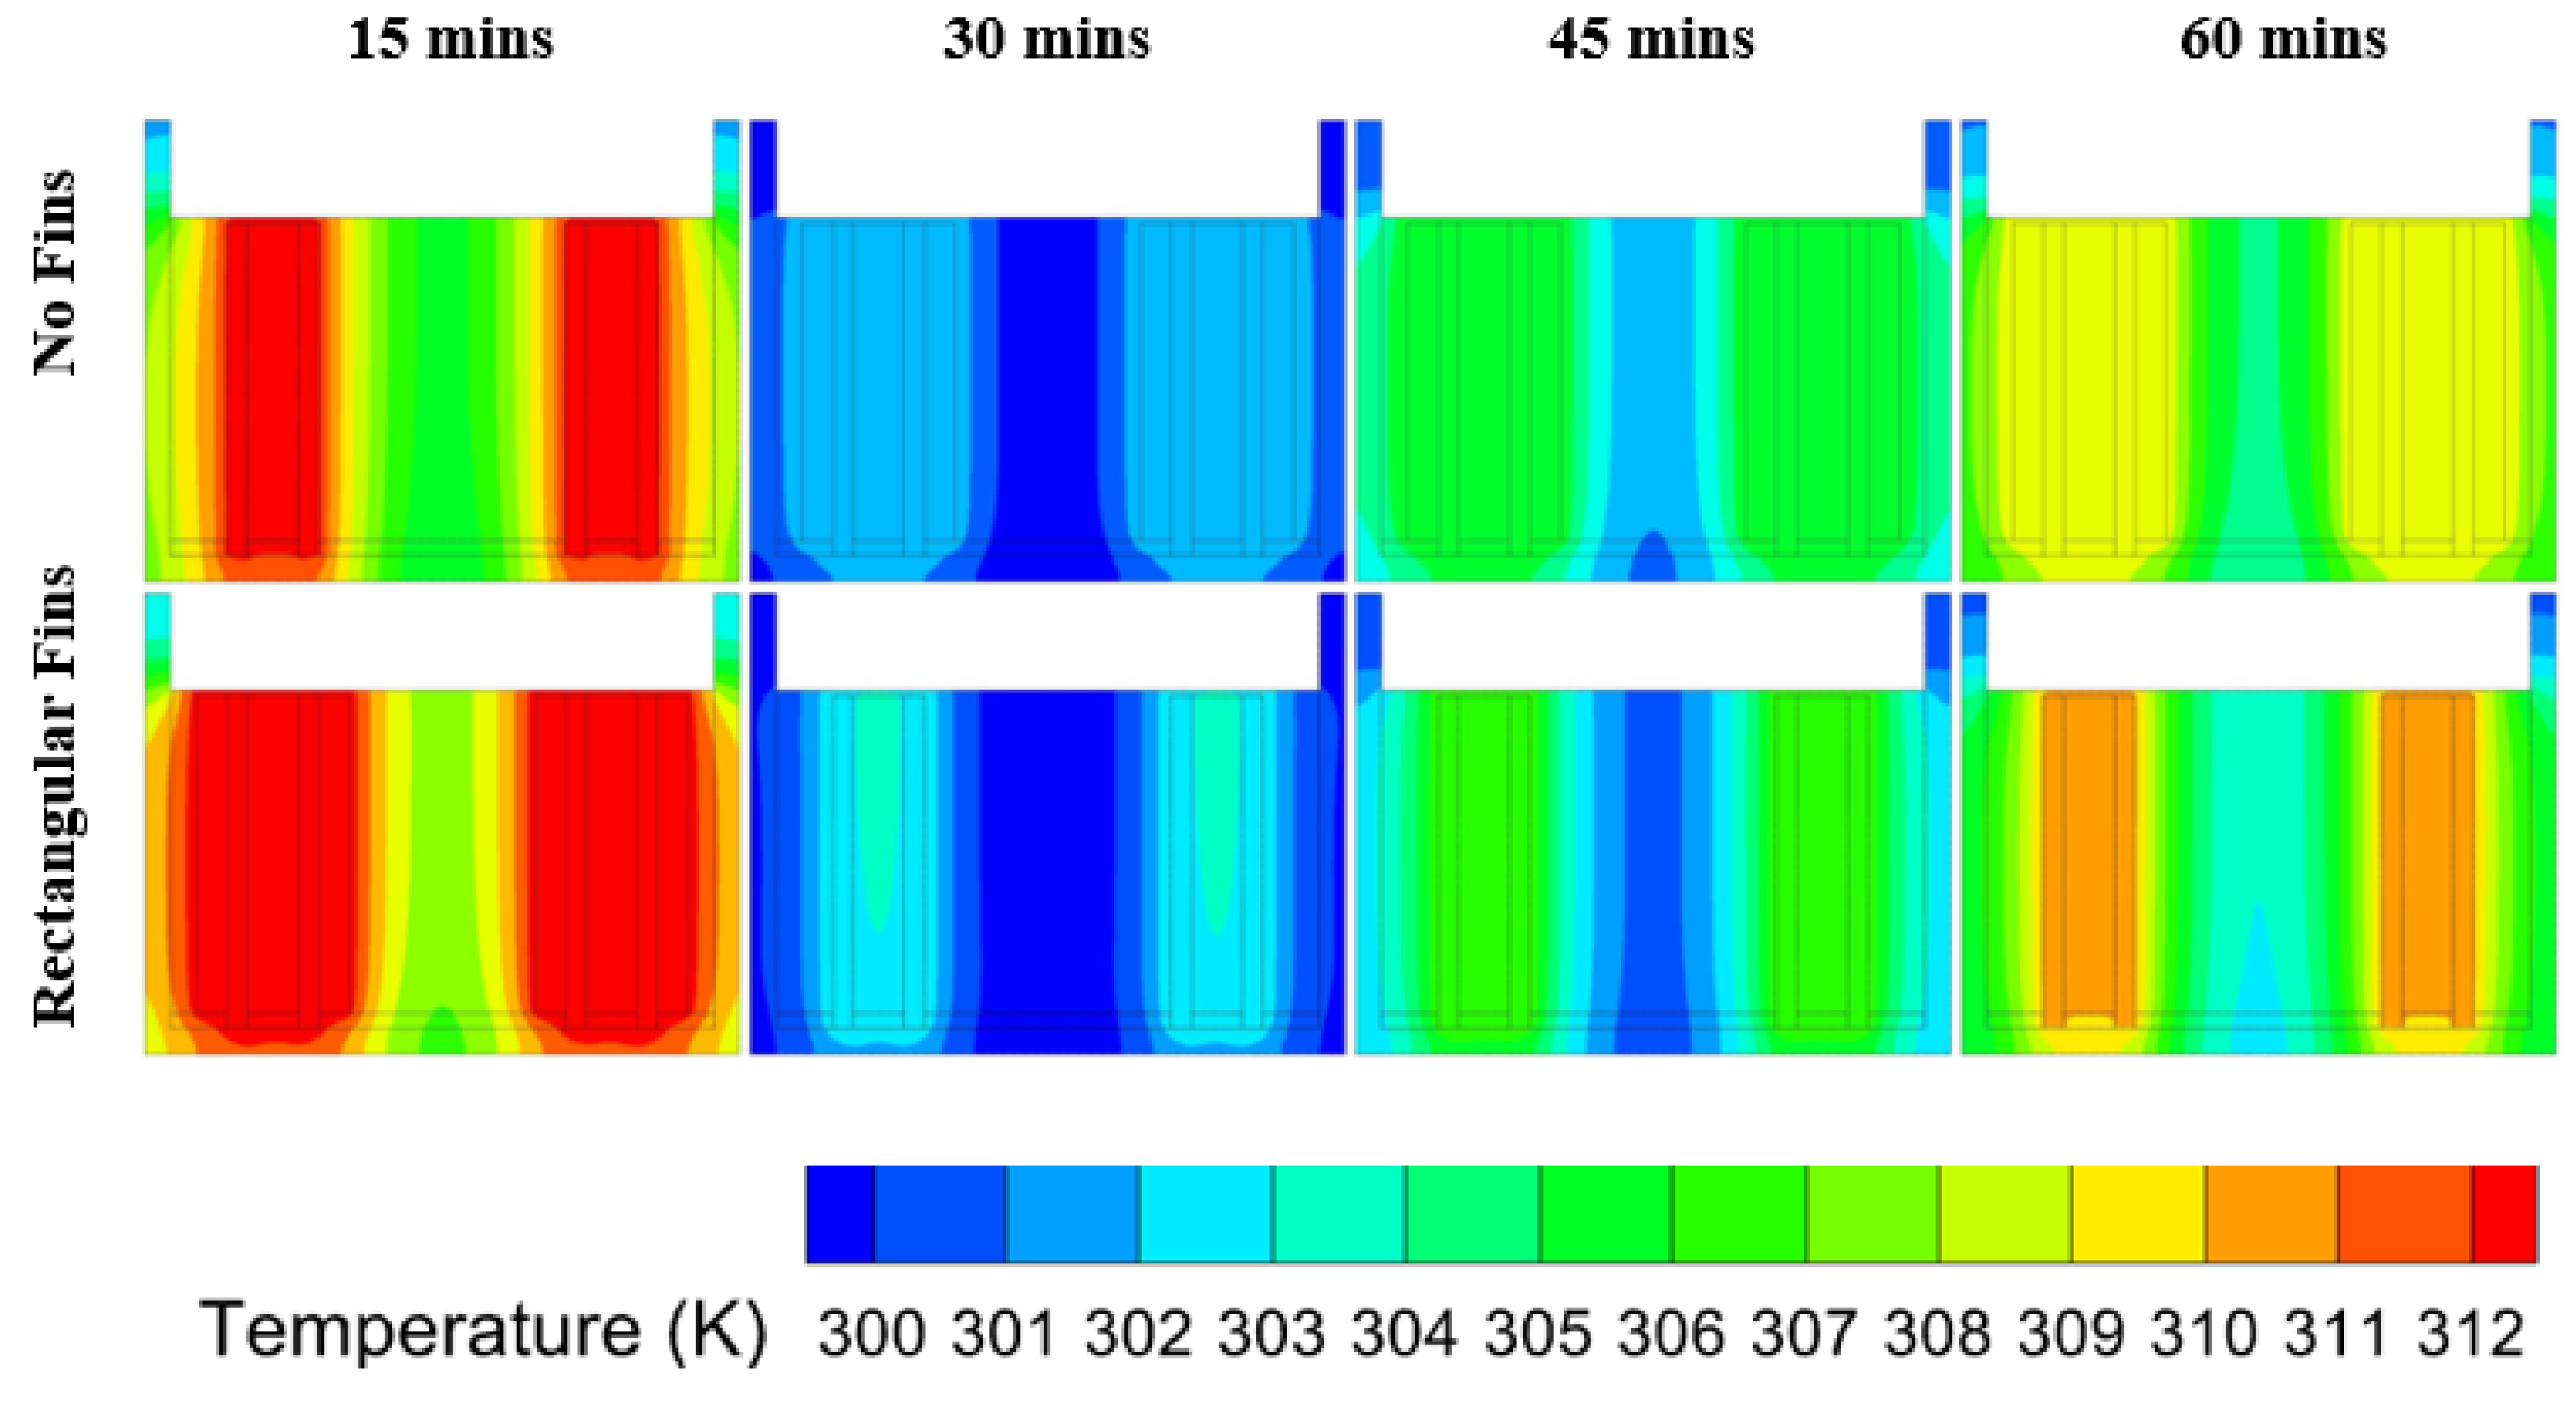
  • The thermal performance at the 3C discharge rate for the unfinned case placed in natural convection compared to being placed in the PCM had a temperature enhancement of 9.44% at the time endpoint, while the naturally cooled system reached 40 ° C at 5.6 min and the system placed in the PCM reached 40 ° C at 28.42 min, which showed an enhancement in operating time of 185%;
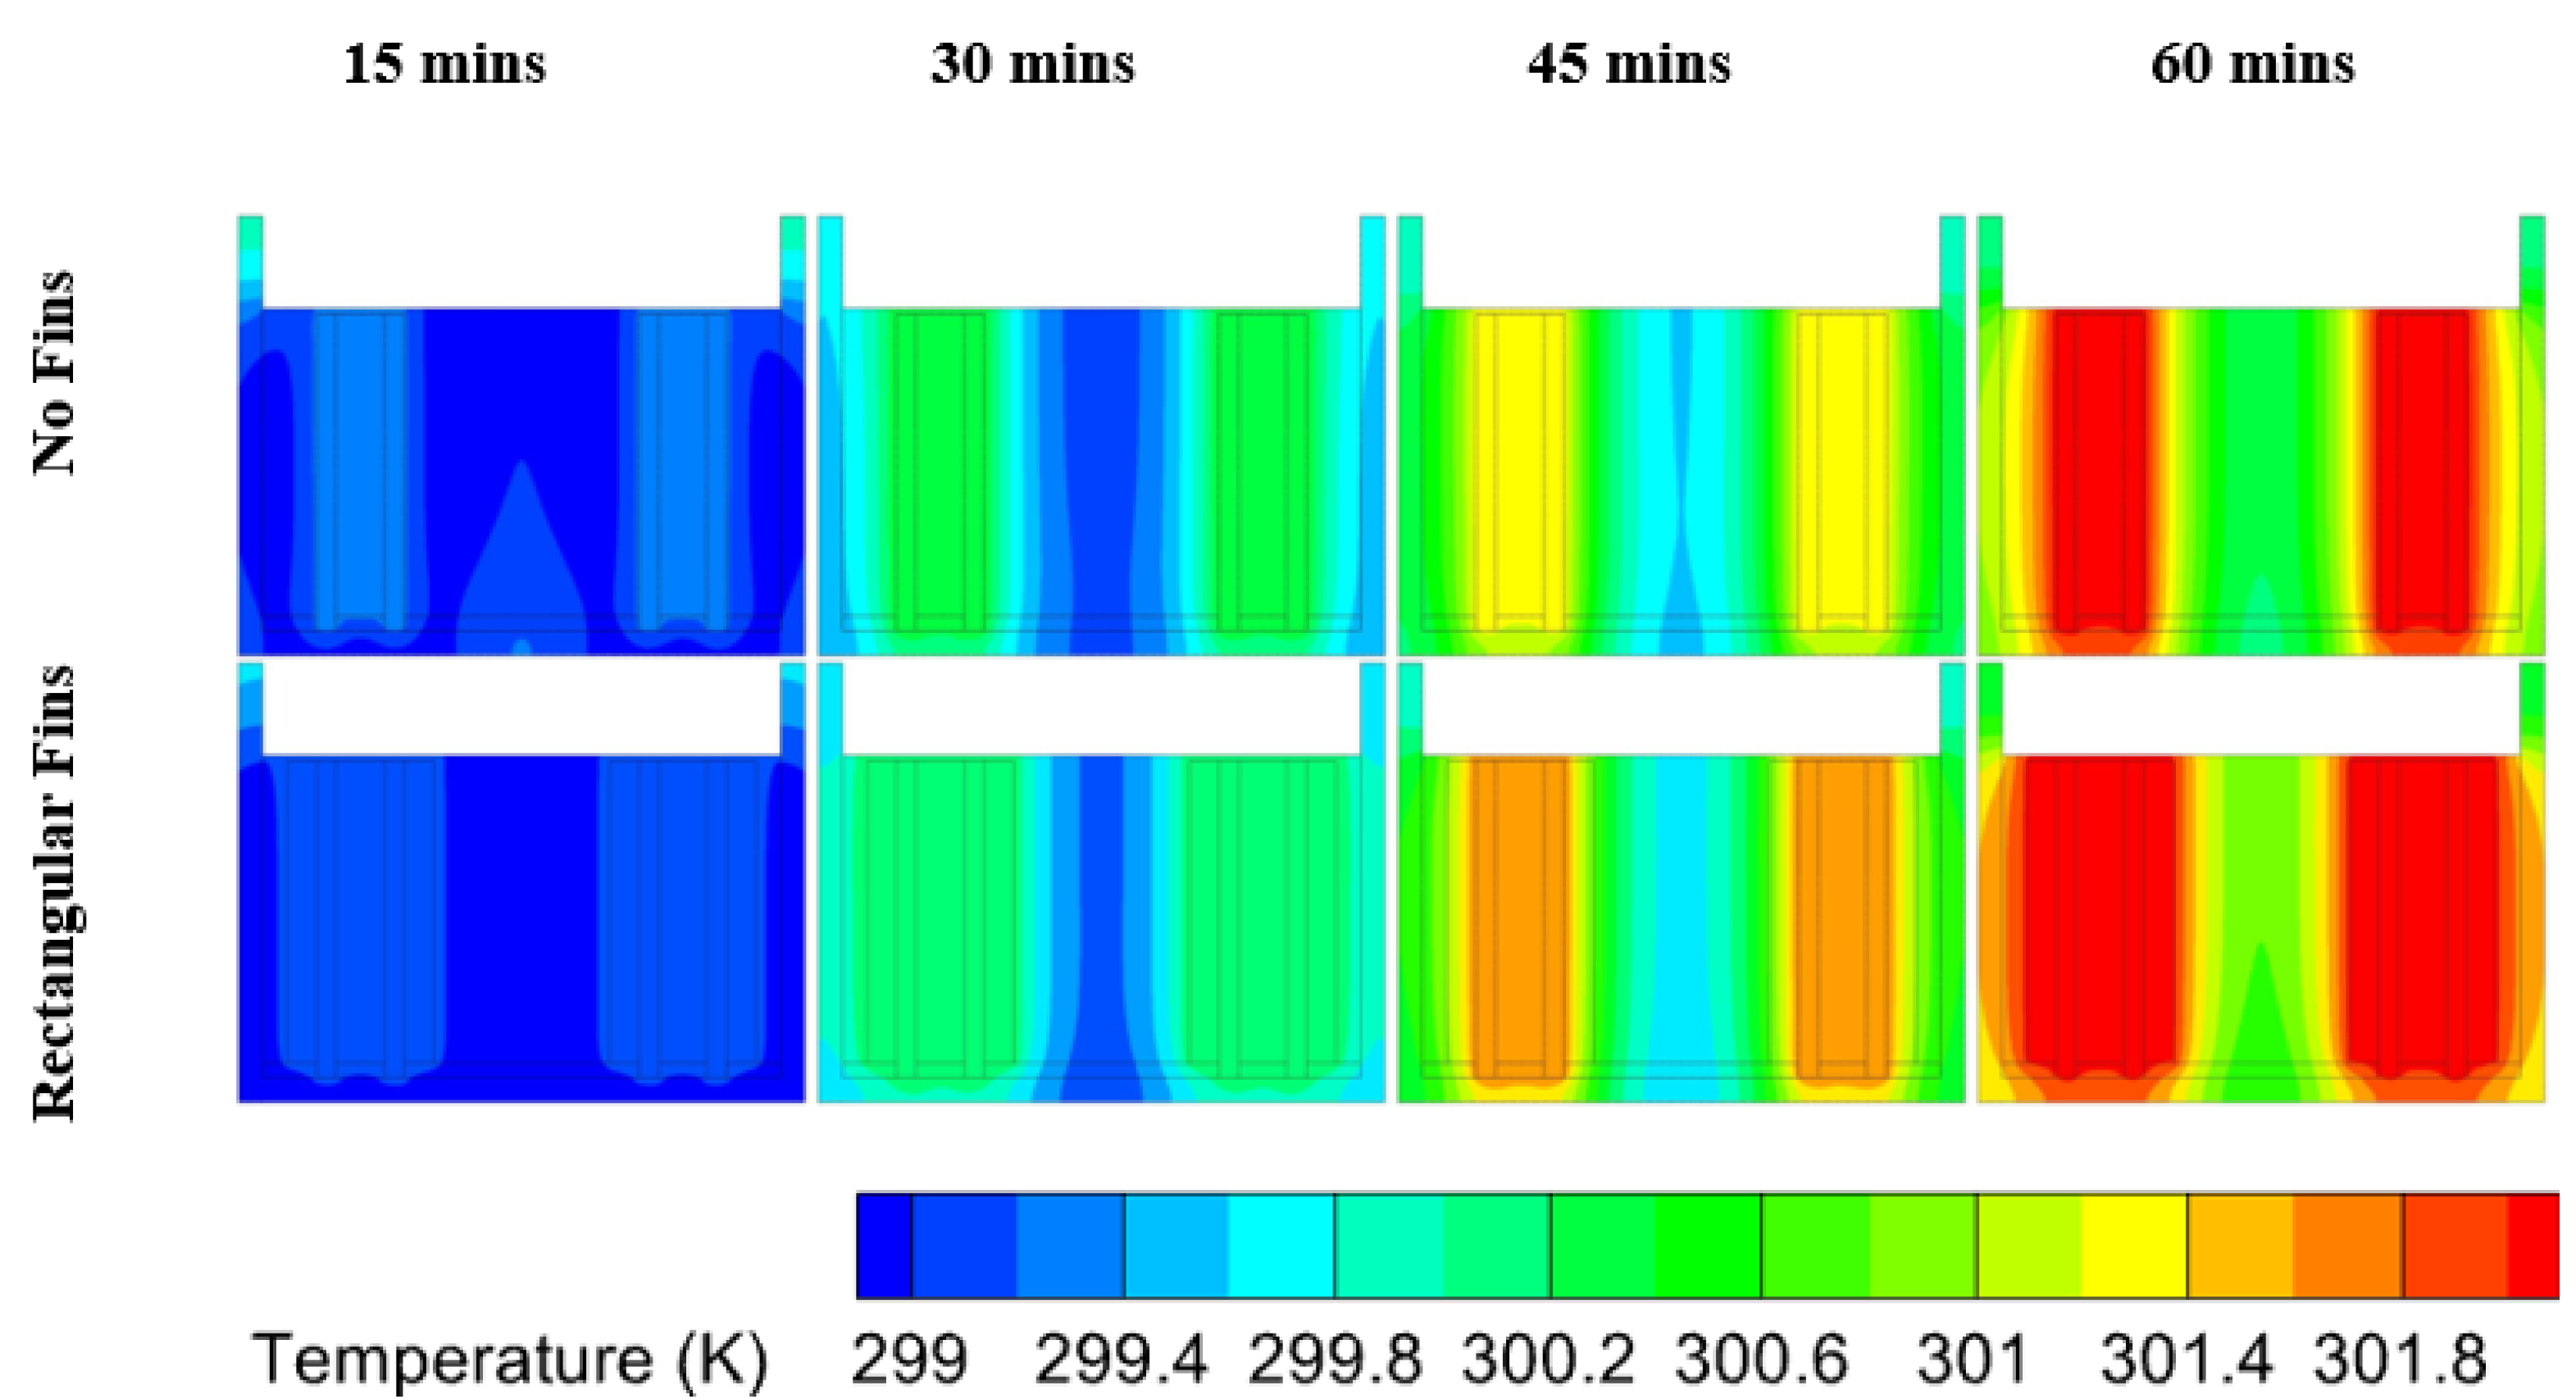
  • The optimal rectangular fin case produced the lowest temperatures at 60 min, which produced an operating time enhancement of 34.17% over the unfinned case, while the temperature enhancement for a 60-min cycle was 6.91%;
  • During a complete cycle of 60 min, most of the cases exceeded the optimal cell temperature as heat accumulated due to the PCM having low thermal conductivity;
  • Cases at the 1C and 2C discharge rates did not exceed the optimum cell temperature and the PCM remained in the conduction region for all the cases except the unfinned case;
  • An improvement in Nusselt number of 9.72% was observed when the rectangular fin and unfinned cases were compared.

Author Contributions

Conceptualization, M.M.K.; methodology, S.A., M.M.K. and M.I.; software, S.A., M.M.K. and M.I.; validation, S.A., M.M.K. and M.I.; formal analysis, S.A. and M.M.K.; investigation, S.A., M.M.K. and M.I.; resources, S.A., M.M.K. and M.I.; data curation, S.A., M.M.K. and M.I.; writing—original draft preparation, S.A.; writing—review and editing, S.A., M.M.K. and M.I.; visualization, S.A., M.M.K. and M.I.; supervision, M.M.K.; project administration, M.M.K.; funding acquisition, M.M.K. All authors have read and agreed to the published version of the manuscript.

Funding

This research received no external funding.

Institutional Review Board Statement

Not applicable.

Informed Consent Statement

Not applicable.

Data Availability Statement

The data presented in this study are available on request from the corresponding author, depending on author consent and the nature of the data asked for.

Conflicts of Interest

The authors declare no conflicts of interest.

Abbreviations

The following abbreviations are used in this manuscript:
PCMPhase change material
BTMSBattery thermal management system
LIBsLithium-ion batteries

References

  1. Chan, C.C. The state of the art of electric and hybrid vehicles. Proc. IEEE 2002, 90, 247–275. [Google Scholar] [CrossRef]
  2. Spiller, M.; Rancilio, G.; Bovera, F.; Gorni, G.; Mandelli, S.; Bresciani, F.; Merlo, M. A Model-Aware Comprehensive Tool for Battery Energy Storage System Sizing. Energies 2023, 16, 6546. [Google Scholar] [CrossRef]
  3. Hosen, M.S.; Youssef, R.; Kalogiannis, T.; Van Mierlo, J.; Berecibar, M. Battery cycle life study through relaxation and forecasting the lifetime via machine learning. J. Energy Storage 2021, 40, 102726. [Google Scholar] [CrossRef]
  4. Lu, L.; Han, X.; Li, J.; Hua, J.; Ouyang, M. A review on the key issues for lithium-ion battery management in electric vehicles. J. Power Source 2013, 226, 272–288. [Google Scholar] [CrossRef]
  5. Youssef, R.; Hosen, M.S.; He, J.; Jaguemont, J.; Akbarzadeh, M.; De Sutter, L.; Van Mierlo, J.; Berecibar, M. Experimental and numerical study on the thermal behavior of a large lithium-ion prismatic cell with natural air convection. IEEE Trans. Ind. Appl. 2021, 57, 6475–6482. [Google Scholar] [CrossRef]
  6. Kim, J.; Oh, J.; Lee, H. Review on battery thermal management system for electric vehicles. Appl. Therm. Eng. 2019, 149, 192–212. [Google Scholar] [CrossRef]
  7. Yang, T.; Yang, N.; Zhang, X.; Li, G. Investigation of the thermal performance of axial-flow air cooling for the lithium-ion battery pack. Int. J. Therm. Sci. 2016, 108, 132–144. [Google Scholar] [CrossRef]
  8. Wu, W.; Wang, S.; Wu, W.; Chen, K.; Hong, S.; Lai, Y. A critical review of battery thermal performance and liquid based battery thermal management. Energy Convers. Manag. 2019, 182, 262–281. [Google Scholar] [CrossRef]
  9. Wang, Q.; Jiang, B.; Xue, Q.; Sun, H.; Li, B.; Zou, H.; Yan, Y. Experimental investigation on EV battery cooling and heating by heat pipes. Appl. Therm. Eng. 2015, 88, 54–60. [Google Scholar] [CrossRef]
  10. Jaguemont, J.; Omar, N.; Van den Bossche, P.; Mierlo, J. Phase-change materials (PCM) for automotive applications: A review. Appl. Therm. Eng. 2018, 132, 308–320. [Google Scholar] [CrossRef]
  11. Ali, S.; Khan, M.M. Experimental Investigation of Battery Thermal Management System of Lithium-Ion Cells Using PCM. Eng. Proc. 2023, 45, 52. [Google Scholar]
  12. Lin, X.; Fu, H.; Perez, H.E.; Siege, J.B.; Stefanopoulou, A.G.; Ding, Y.; Castanier, M.P. Parameterization and observability analysis of scalable battery clusters for onboard thermal management. Oil Gas Sci. Technol. Rev. d’IFP Energ. Nouv. 2013, 68, 165–178. [Google Scholar] [CrossRef]
  13. Teng, H.; Ma, Y.; Yeow, K.; Thelliez, M. An analysis of a lithium-ion battery system with indirect air cooling and warm-up. SAE Int. J. Passeng. Cars Mech. Syst. 2011, 4, 1343–1357. [Google Scholar] [CrossRef]
  14. Motloch, C.G.; Christophersen, J.P.; Belt, J.R.; Wright, R.B.; Hunt, G.L.; Sutula, R.A.; Duong, T.; Tartamella, T.J.; Haskins, H.J.; Miller, T.J. High-power battery testing procedures and analytical methodologies for HEV’s. SAE Trans. 2002; 111, 797–802. [Google Scholar]
  15. Sabbah, R.; Kizilel, R.; Selman, J.; Al-Hallaj, S. Active (air-cooled) vs. passive (phase change material) thermal management of high power lithium-ion packs: Limitation of temperature rise and uniformity of temperature distribution. J. Power Source 2008, 182, 630–638. [Google Scholar] [CrossRef]
  16. Wei, Y.; Agelin-Chaab, M. Development and experimental analysis of a hybrid cooling concept for electric vehicle battery packs. J. Energy Storage 2019, 25, 100906. [Google Scholar] [CrossRef]
  17. Al Hallaj, S.; Selman, J. A novel thermal management system for electric vehicle batteries using phase-change material. J. Electrochem. Soc. 2000, 147, 3231. [Google Scholar] [CrossRef]
  18. Chen, F.; Huang, R.; Wang, C.; Yu, X.; Liu, H.; Wu, Q.; Qian, K.; Bhagat, R. Air and PCM cooling for battery thermal management considering battery cycle life. Appl. Therm. Eng. 2020, 173, 115154. [Google Scholar] [CrossRef]
  19. Wang, Z.; Zhang, H.; Xia, X. Experimental investigation on the thermal behavior of cylindrical battery with composite paraffin and fin structure. Int. J. Heat Mass Transf. 2017, 109, 958–970. [Google Scholar] [CrossRef]
  20. Sun, Z.; Fan, R.; Yan, F.; Zhou, T.; Zheng, N. Thermal management of the lithium-ion battery by the composite PCM-Fin structures. Int. J. Heat Mass Transf. 2019, 145, 118739. [Google Scholar] [CrossRef]
  21. Zhao, Y.; Zou, B.; Li, C.; Ding, Y. Active cooling based battery thermal management using composite phase change materials. Energy Procedia 2019, 158, 4933–4940. [Google Scholar] [CrossRef]
  22. Weng, J.; Ouyang, D.; Yang, X.; Chen, M.; Zhang, G.; Wang, J. Experimental study on thermal behavior of PCM-module coupled with various cooling strategies under different temperatures and protocols. Appl. Therm. Eng. 2021, 197, 117376. [Google Scholar] [CrossRef]
  23. Safdari, M.; Ahmadi, R.; Sadeghzadeh, S. Numerical investigation on PCM encapsulation shape used in the passive-active battery thermal management. Energy 2020, 193, 116840. [Google Scholar] [CrossRef]
  24. Shojaeefard, M.; Molaeimanesh, G.; Ranjbaran, Y.S. Improving the performance of a passive battery thermal management system based on PCM using lateral fins. Heat Mass Transf. 2019, 55, 1753–1767. [Google Scholar] [CrossRef]
  25. Youssef, R.; Hosen, M.S.; He, J.; Mohammed, A.S.; Van Mierlo, J.; Berecibar, M. Novel design optimization for passive cooling PCM assisted battery thermal management system in electric vehicles. Case Stud. Therm. Eng. 2022, 32, 101896. [Google Scholar] [CrossRef]
  26. Huang, R.; Li, Z.; Hong, W.; Wu, Q.; Yu, X. Experimental and numerical study of PCM thermophysical parameters on lithium-ion battery thermal management. Energy Rep. 2020, 6, 8–19. [Google Scholar] [CrossRef]
  27. El Idi, M.M.; Karkri, M.; Tankari, M.A. A passive thermal management system of Li-ion batteries using PCM composites: Experimental and numerical investigations. Int. J. Heat Mass Transf. 2021, 169, 120894. [Google Scholar] [CrossRef]
  28. Hémery, C.V.; Pra, F.; Robin, J.F.; Marty, P. Experimental performances of a battery thermal management system using a phase change material. J. Power Source 2014, 270, 349–358. [Google Scholar] [CrossRef]
  29. Khateeb, S.A.; Farid, M.M.; Selman, J.R.; Al-Hallaj, S. Design and simulation of a lithium-ion battery with a phase change material thermal management system for an electric scooter. J. Power Source 2004, 128, 292–307. [Google Scholar] [CrossRef]
  30. Choudhari, V.; Dhoble, A.; Panchal, S. Numerical analysis of different fin structures in phase change material module for battery thermal management system and its optimization. Int. J. Heat Mass Transf. 2020, 163, 120434. [Google Scholar] [CrossRef]
  31. Voller, V.R.; Prakash, C. A fixed grid numerical modelling methodology for convection-diffusion mushy region phase-change problems. Int. J. Heat Mass Transf. 1987, 30, 1709–1719. [Google Scholar] [CrossRef]
  32. Olabi, A.; Maghrabie, H.M.; Adhari, O.H.K.; Sayed, E.T.; Yousef, B.A.; Salameh, T.; Kamil, M.; Abdelkareem, M.A. Battery thermal management systems: Recent progress and challenges. Int. J. Thermofluids 2022, 15, 100171. [Google Scholar] [CrossRef]
Figure 1. Schematic and working flow model of the proposed battery thermal management system.
Wevj 15 00042 g001
Figure 2. Detailed dimensions of the used fins: (a) the unfinned case; (b) taper fins; (c); circular fins; (d) rectangular fins.
Wevj 15 00042 g002aWevj 15 00042 g002b
Figure 3. Illustration of the actual manufactured and assembled BTMS with all electrical connections to heaters: (a) the unfinned case; (b) rectangular fins; (c) taper fins; (d) circular fins.
Wevj 15 00042 g003aWevj 15 00042 g003b
Figure 4. Schematic to explain the working of the battery simulator, as well as a visualization of the actual circuit.
Wevj 15 00042 g004
Figure 5. (a) Ceramic heater used for volumetric heat generation; (b) CAD illustration of the assembly of a ceramic heater fixed in an unfinned cell.
Wevj 15 00042 g005
Figure 6. (a) Reproduced heat generation rates from [30]; (b) temporal response times for heat generation in the controller circuit, as well the corresponding power.
Wevj 15 00042 g006
Figure 7. (a) Mesh independence; (b) timestep independence.
Wevj 15 00042 g007
Figure 8. Temperature compared to time variation, along with the effects of the system being placed in natural convection and the PCM: (a) 1C discharge rate; (b) 2C discharge rate; (c) 3C discharge rate.
Wevj 15 00042 g008
Figure 9. The thermal performance enhancement ratios at different discharge rates compared to the unfinned ambient case as a benchmark.
Wevj 15 00042 g009
Figure 10. Numerical validation curve comparison to [30].
Wevj 15 00042 g010
Figure 11. Comparison and validation of numerical prediction using experimental results: (a) unfinned case; (b) rectangular fin case.
Wevj 15 00042 g011
Figure 12. Temporal evolution of temperature for the unfinned and rectangular fin cases at the 3C discharge rate.
Wevj 15 00042 g012
Figure 13. Temporal evolution of liquid fraction in the unfinned and rectangular fin cases, with the maximum melt fraction occurring at 60 min at the 3C discharge rate.
Wevj 15 00042 g013
Figure 14. Temporal evolution of temperature for the unfinned and rectangular fin cases at the 2C discharge rate.
Wevj 15 00042 g014
Figure 15. Temporal evolution of temperature for the unfinned and rectangular fin cases at the 1C discharge rate.
Wevj 15 00042 g015
Figure 16. Average Nusselt number variations with C rating, averaged for different timesteps for comparison.
Wevj 15 00042 g016
Table 1. Thermophysical properties used in the experimental and numerical models.
PropertyRT-42AluminumAcrylicCeramic Heaters
Solidus Temperature ( ° C)38---
Liquidus Temperature ( ° C)43---
Heat Storage Capacity (J/kg)165,000---
Specific Heat Capacity (kJ/kg·K)28711300850
Solid Density (kg/m3)880271912152630
Liquid Density (kg/m3)760---
Thermal Conductivity (W/m·K) 0.2 152 0.17 12
Thermal Exp. Coefficient (K−1)0.0006---
Table 2. Theta values at different discharge rates.
θ
Discharge RateUnfinned CaseRectangular FinsTaper FinsCircular Fins
1C0.0230.420.170.42
2C2.831.812.381.94
3C4.944.114.564.18
3C Ambient6.19
Disclaimer/Publisher’s Note: The statements, opinions and data contained in all publications are solely those of the individual author(s) and contributor(s) and not of MDPI and/or the editor(s). MDPI and/or the editor(s) disclaim responsibility for any injury to people or property resulting from any ideas, methods, instructions or products referred to in the content.

