Article

Electric Vehicle Traction Battery Recycling Decision-Making Considering Blockchain Technology in the Context of Capacitance Level Differential Demand

School of Economics and Management, Hubei University of Automotive Technology, Shiyan 100083, China
*
Author to whom correspondence should be addressed.
World Electr. Veh. J. 2024, 15(12), 561; https://doi.org/10.3390/wevj15120561
Submission received: 24 October 2024 / Revised: 21 November 2024 / Accepted: 25 November 2024 / Published: 3 December 2024
(This article belongs to the Topic Electric Vehicles Energy Management, 2nd Volume)

Abstract

:
In recent years, the rapid growth in electric vehicle ownership has resulted in a significant number of decommissioned traction batteries that will require recycling in the future. As consumer expectations for electric vehicle range continue to rise, the turnover of traction batteries has accelerated substantially. Consequently, there is an urgent need for electric vehicle manufacturers to establish an efficient, recyclable supply chain for the return of end-of-life (EOL) electric vehicle (EV) traction batteries. In this paper, we investigate the closed-loop recycling supply chain for retired power batteries in electric vehicle manufacturers, taking into account blockchain technology and the high range preferences in the electric vehicle market, which are influenced by varying demand for different levels of electric vehicle capacitance. Blockchain, as a distributed and decentralized technology, offers features such as consensus mechanisms, traceability, and security, which have been effectively applied across various fields. In this study, we construct four models involving EV battery manufacturers, EV retailers, and battery comprehensive utilization (BCU) enterprises participating in the recycling process. Through the analysis of a Stackelberg response model, we find that (1) single-channel recycling is less efficient than dual-channel recycling models, a difference driven by the diversity of recycling channels and the variability in recycling markets; (2) Recycling models incorporating blockchain technology demonstrate superior performance compared to those that do not utilize blockchain technology, particularly when the intensity of recycling competition is below 0.76; (3) Traction batteries integrated with blockchain technology exhibit higher recycling rates when the optimization index is below 0.96. Electric vehicle battery manufacturers must evaluate the benefits and costs of adopting blockchain technology; (4) With lower recycling incentive levels and EV range preferences, the single-channel recycling model yields better returns than the other three recycling models. EV manufacturers can enhance overall battery supply chain revenues by establishing varying incentive levels based on market demand for different capacitance levels.

1. Introduction

With the rapid development of electric vehicles, new electric vehicle registrations in China reached 8.1 million in 2023. This growth in the industry has driven increased demand for traction batteries. Consequently, the number of decommissioned traction batteries has risen significantly. The battery capacity of electric vehicles gradually diminishes during the charging and discharging cycles. When the capacity declines to less than 80%, the battery is considered decommissioned [1]. In 2020, the Chinese market retired 240,000 tons of traction batteries. If these batteries are not scientifically recovered and properly treated, they could lead to severe environmental pollution and resource waste [2]. Furthermore, as the demand for electric vehicles with extended ranges increases, there is an escalating need for batteries with higher capacity, which accelerates the consumption of rare and precious metal resources. In October 2021, the Chinese government released the “Carbon Peak Action Program by 2030”, aimed at vigorously developing a green, low-carbon, and sustainable circular economy. The program focuses on significantly reducing the resource and energy consumption associated with traction battery manufacturing through remanufacturing, high-quality refurbishment, and other technological innovations. Consequently, establishing an efficient recycling supply chain for retired traction batteries has become an urgent priority. The predominant methods for managing retired traction batteries currently involve echelon utilization and dismantling for recycling [2]. The most recent version of the Law of the People’s Republic of China on the Prevention and Control of Environmental Pollution by Solid Waste, enacted in 2023, mandates that enterprises producing products such as electrical and electronic appliances, lead–acid batteries, and automotive traction batteries establish recycling systems for used traction batteries. These systems, whether self-constructed or outsourced, must align with the volume of products sold in accordance with the Extended Producer Responsibility System. Nevertheless, the upstream and downstream segments of the reverse traction battery recycling supply chain for electric vehicles encounter numerous challenges. A significant issue is the lack of timely supervision and traceability in the recycling process, leading to opaque information and compromised security. This lack of transparency increases communication and trust costs, which substantially impacts the efficiency of recycling decommissioned traction batteries.
In 2019, Volvo Cars partnered with Ningde Times and LG Chem to implement blockchain technology for tracing cobalt materials in batteries. By 2023, Dudu Traction Exchange had utilized on-chain battery data to establish a reliable information bridge within the new energy sector. This innovation has significantly reduced the costs associated with the collection of decommissioned batteries and enhanced trust among trading parties. Blockchain, as a decentralized distributed technology, provides mechanisms for sharing, traceability, security, and trustworthiness. These attributes effectively address the challenges associated with multi-party and bilateral information security sharing. The advantages of this technology have been demonstrated in numerous applications [3]. The secure information-sharing mechanism inherent in blockchain technology addresses the challenges of high trust costs and insufficient interoperability in traction battery recycling transactions. Furthermore, traceability facilitates the real-time tracking of every stage in the waste battery lifecycle, including generation, transportation, dismantling, and remanufacturing. By analyzing the operational data of each traction battery, timely actions such as returns and recycling can be effectively implemented. This approach significantly reduces data collection costs associated with the traction battery recycling process and ensures that retired traction batteries are recycled in an environmentally friendly and safe manner. Studies have investigated the integration of blockchain technology into the recycling supply chain for retired traction batteries. A closed-loop supply chain model has been developed, incorporating traction battery manufacturers and retailers of new energy vehicles. These studies analyze optimal recycling strategies for both manufacturers and retailers, utilizing the traceability information facilitated by blockchain technology. The application of blockchain technology in the recycling supply chain for retired traction batteries offers significant advantages for electric vehicle manufacturers. It not only optimizes the recycling process and reduces costs associated with raw materials but also enhances overall efficiency. This technological integration ensures greater reliability within the supply chain, effectively addressing the increasing demands of the electric vehicle market. Despite the growing body of research on decommissioned traction battery recycling and blockchain technology, several issues remain unresolved:
(1)
What is the equilibrium decision for each member of the supply chain when there is a variation in the demand for capacitors in the electric vehicle market?
(2)
Given the costs associated with implementing blockchain technology and the benefits of enhanced recovery processes, under what conditions would a manufacturer opt for blockchain technology to achieve the optimal outcome? How do external factors such as recycling incentives, competitive intensity, and recycling cost optimization affect the recycling rate of decommissioned EV traction batteries and maximize benefits for supply chain members?
(3)
What is the recycling rate of decommissioned traction batteries across different recycling methods, and how does fluctuating demand for capacitance levels in the electric vehicle market influence this rate?
This paper is organized as follows: Section 2 presents a comprehensive literature review, while Section 3 elaborates on the model’s construction, including the problem description, assumptions, and notation. Section 4 constructs the mathematical model, encompassing the following: (1) single-channel recycling of retired traction batteries by electric vehicle (EV) retailers; (2) a circular supply chain model featuring dual recycling by both battery circular utilization (BCU) enterprises and EV retailers; (3) an EV retailer recycling model that employs blockchain technology; (4) a circular supply chain model integrating the dual recycling of traction batteries by BCU enterprises and EV retailers, utilizing blockchain technology; and (5) an analysis and comparison of the equilibrium results of these models. Section 5 presents data simulations of the model, followed by a summary in Section 6.

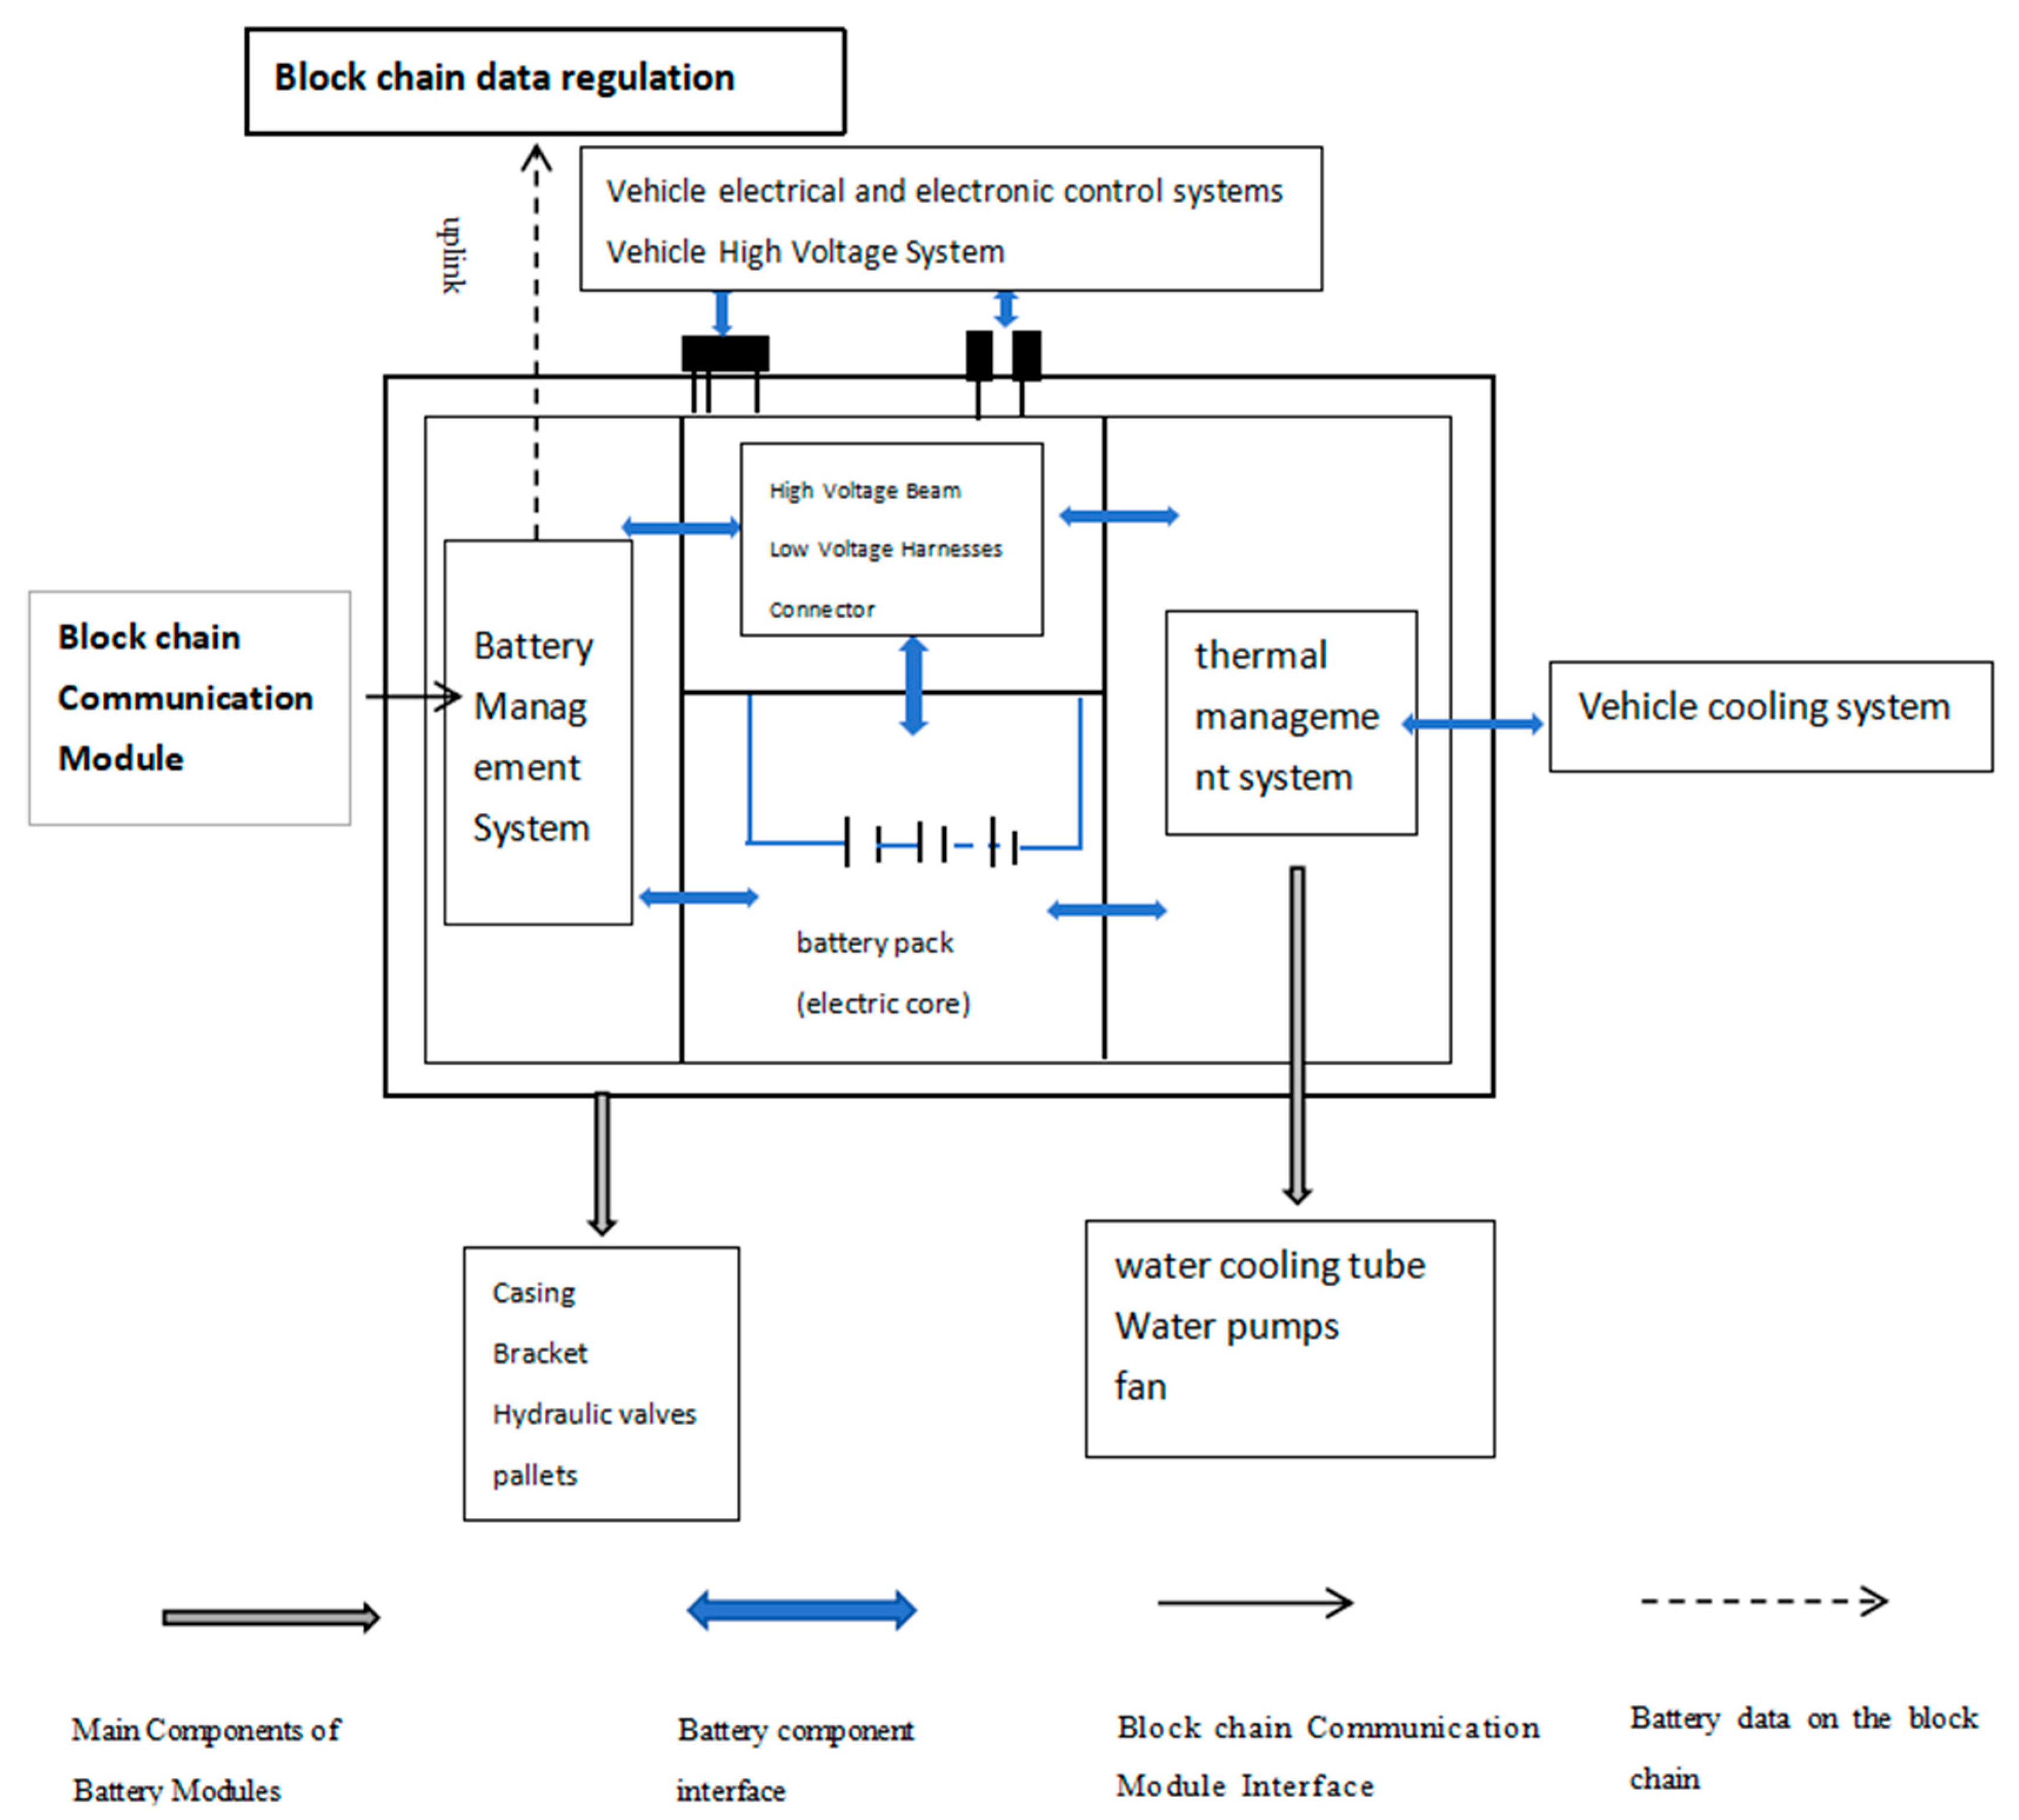
2. Electric Vehicle and Traction Battery Packs

The technology underlying electric vehicles has experienced remarkable growth over the past decade, accompanied by a diverse array of emerging innovations [4]. According to Figure 1, modern electric vehicles are generally categorized into three components: the auxiliary system, the power system, and the drive motor. Notably, the power supply system has become the primary focus of competition among many electric vehicle manufacturers. Battery packs are a critical component of the power supply system. Depending on the vehicle design, each power system may consist of one or more battery packs. As illustrated in Figure 2, a battery pack comprises battery modules (cells), high- and low-voltage electrical components, a thermal management system (including radiators, fans, water-cooled tubes, etc.), and a battery management system. The battery management system is responsible for overseeing the battery pack, which includes monitoring the voltages and temperatures of the batteries to ensure safe and efficient operation, as well as performing battery equalization management.
The batteries currently used in electric vehicles predominantly include lithium iron phosphate (LFP) and lithium ternary (NMC) variants. Each type has its advantages and disadvantages. Lithium iron phosphate batteries are known for their high safety, long lifespan, excellent environmental protection, and low cost. However, they also exhibit lower energy density and subpar low-temperature performance. Notable examples include Ningde Times’ Shenxing superfast charging battery and BYD’s blade battery. In contrast, ternary lithium batteries are preferred for their high energy density, superior low-temperature performance, and efficient charging and discharging capabilities, but they come with relatively lower safety, shorter lifespan, and higher costs. A more established option in this category is Ningde Times’ Kirin battery.
Up to now, many enterprises have achieved a high level of maturity in the research and development, as well as manufacturing processes, of back-end batteries. However, significant challenges remain in the recycling phase of these batteries. Due to inconsistencies among the cells within the battery packs of LFP and NMF Li-ion batteries, each cell may exhibit a different state of degradation [5]. This aging variation manifests as capacity imbalances, inconsistent internal resistance evolution, and differences in charge states [6]. Consequently, the conventional approach involves disassembling the battery packs, assessing the health of each cell, and selecting the appropriate cells for reassembly into new battery packs [7]. However, in practice, many recycling enterprises that lack the necessary technology and manpower can only dismantle and crush retired batteries for scrap, subsequently selling the heavy metals contained within them directly. This approach is neither economical nor efficient. Currently, some enterprises have developed blockchain communication modules integrated into battery management systems. The purpose of this integration is to record the battery’s status on the blockchain, allowing health information to be transmitted to the battery life cycle management system. As a result, recycling parties can access all the health data of the battery without the need to dismantle each unit individually. To ensure safety and facilitate gradual usage, blockchain technology enables the ’chaining’ of battery data, which helps to reduce the costs associated with assessing the wear and tear of retired batteries. Furthermore, the traceability, security, and trustworthiness inherent in blockchain technology address the challenges of securely sharing information, thereby significantly lowering the cost of trust within the battery recycling supply chain.

3. Literature Review

3.1. Relevant Literature Research on Retired Traction Battery Recycling

The literature relevant to this thesis encompasses two primary aspects: the current state of research on the recycling of traction batteries and the current state of research on the recycling of traction batteries utilizing blockchain technology. Alessandra Zanoletti et al. argue that effective battery recycling necessitates a comprehensive strategy, termed Design for Recycling, aimed at optimizing both the battery and the recycling processes [7,8]. Jiumei Chen and Wen Zhang studied the design of subsidy policies aimed at promoting the recycling of used traction batteries for electric vehicles. They established a game model to compare three different policies: no subsidy, a subsidy based on capacitance levels, and a one-time subsidy [9]. Pierre Kuntz et al. argue that the aging of batteries significantly impacts their safety throughout the entire life cycle [10]. Through the application of Life Cycle Assessment (LCA) and Life Cycle Cost Assessment (LCCA) Meegoda et al. concluded that recycling batteries significantly reduces environmental impact and proves to be economically viable when compared to utilizing new materials for the production of new devices [11]. Maryori C. Díaz-Ramírez et al. argue that a promising approach to achieve significant reductions in the material impacts of supply chains is to incorporate circular economy principles, such as material recycling strategies. Optimizing these recycling strategies enhances the overall performance and economic viability of the system being analyzed [12]. In the context of carbon emission reduction Chuan Zhang et al. examine battery echelon utilization and material recycling from the perspective of a closed-loop supply chain for end-of-life (EOL) products. They derive equilibrium results for three cyclical models using the Stackelberg equation [13]. According to Tang et al. the study identifies the optimal solution among various recycling modes by using total social welfare as the criterion for selecting the most effective recycling approach. By developing a multilevel supply chain network for the sale of new energy vehicles and the recycling of traction batteries, as well as by examining the contractual coordination within a closed-loop supply chain primarily driven by battery producers across various recycling models [14]. According to Ote Amuta et al. at a given ambient temperature and constant current charge, the state of health (SOH) of similar cells can be estimated by comparing the voltage integrals of relatively new and older cells of the same type with known SOH [15]. Xie Jiaping et al. determined the optimal conditions for government intervention to effectively balance sales and recycling efforts [16]. Huang et al. and Wang et al. argued that the demand in both the electric vehicle (EV) and ladder markets is linearly related to a product’s sale price. Specifically, as the sale price increases, market demand tends to decrease, a relationship that has been widely accepted in previous studies [17,18]. Pengli Yu et al. regard energy management strategy as a critical issue for fuel cell hybrid systems; thus, ensuring its efficiency across the entire system lifecycle is essential [19]. Carlos Antonio Rufino Júnior and Eleonora Riva San Severino 2022 argued that the use of technologies such as the Internet of Things (IoT), data processing, and blockchain enables companies to serve their customers with higher quality, efficiency, and reliability in the shortest possible time. They justified the use of blockchain technology to track batteries by identifying relevant studies, evaluating and summarizing similar research, and comparing and extracting data from various papers [20]. Ahasan Habib et al. considering the importance of understanding traction density, lifespan, adaptive electrochemical behavior, and temperature tolerance of batteries, found that battery management systems play a crucial role in electric vehicles and renewable energy storage systems [21]. Venkata Satya Rahul Kosuru et al. proposed a battery data system that enables deep learning-based detection and classification of faulty battery sensors and their transmission information [22]. Zhao SX and Wang YC, argued that information asymmetry and security issues in mobile traction hinder supply efficiency. They proposed that energy blockchain technology can enhance the security of traction transactions and validated this possibility using genetic algorithms and the Multi-Objective Particle Swarm Optimization (MOPSO) algorithm. By constructing a tripartite evolutionary game model involving battery producers, vehicle manufacturers, and the government, we explore the investment behaviors in blockchain technology by automobile producers under government participation [23]. You Jianxin et al. analyzed the behavioral choices and evolutionary equilibrium states among the three types of participants and simulated the impacts of the characteristic parameters of blockchain technology and government involvement on the system’s steady state through simulation [24]. Ilias Belharouak et al. summarized the recycling methods for batteries and found that the application of electrochemical leaching significantly enhanced the recovery efficiency of rare metals from lithium batteries [25]. Gernot Schlögl et al. analyzed battery pack connection and separation technologies, concluding that the non-destructive separation of traction batteries facilitates a second life for battery components [26]. Nerijus Paulauskas, and Vsevolod Kapustin, maximized the economic benefits of various electricity markets by analyzing the dispatch of electricity to residential energy storage systems with two types of batteries: 5 kW/10 kWh and 10 kW/10 kWh [27]. Zeyad A. Almutairi and Ali M. Eltamaly, compared the advantages and disadvantages of vanadium redox flow (VRF) batteries and lithium-ion (Li-ion) batteries in the context of energy storage systems, identifying the most suitable option for a zero-carbon smart grid [28].

3.2. Application of Blockchain Technology in Recycling-Related Fields

One study investigated how data sharing and information technology can enhance circularity within the electric vehicle supply chain, focusing on the role of blockchain technology in fulfilling the circularity requirements for battery tracking and capacity sharing [29]. The study’s findings indicate that blockchain technology can effectively eliminate existing barriers to the circular economy. Centobelli P et al. argue that trust, traceability, and transparency are key factors in designing circular blockchain platforms for supply chains. They propose an integrated triple retesting framework for blockchain platforms, demonstrating that blockchain’s role as a technological capability can effectively enhance waste flow control and improve product return management activities [30]. Xugang Zhang et al. proposed a blockchain-based integration framework for PBRSC management, addressing the numerous challenges faced in the recycling of traction batteries [31]. Feng, H, argues that blockchain’s inherent traceability and tamper-proofness make it well suited for traceability applications [32]. Peng, Xing, and Yao, Junzhu et al. established a closed-loop traction chain (CLSC) model that integrates a traction battery manufacturer with a new energy vehicle retailer. They optimized the recycling processes for both entities by employing a traceability information strategy based on blockchain technology [33]. Zhang Meimei et al. highlight that the lack of comprehensive life cycle traceability for traction batteries, along with the uncertainty regarding their remaining performance, results in high transaction costs for battery laddering enterprises. To address this issue, they propose a traction battery laddering scheme based on blockchain technology. This scheme aims to establish a full life cycle information storage chain for batteries utilizing a consensus mechanism [34], Simulations demonstrate that the blockchain-based scheme achieves decentralization, enhances data security and economic efficiency, significantly reduces transaction and detection costs associated with traction battery laddering, and increases the residual value of the batteries. Antônio Rufino Júnior, provides a systematic review of an extensive body of literature, surveys the current applications of blockchain technology in battery regulation, and examines the feasibility of using blockchain [20]. In the view of Berger et al. when blockchain technology is implemented, the need to share information regarding products and materials can be facilitated by digital battery passports, thereby promoting the development of more sustainable products [35]. According to Olivetti, the implementation of blockchain can enhance the traceability of product information within Product-Based Real Supply Chains (PBRSCs), decentralize transactions, strengthen collaborative relationships among supply chain firms, improve regulatory capabilities, and facilitate the integration of information technology and intelligent systems within PBRSCS [36].

3.3. Research Gaps

Firstly, there are few studies that have analyzed the forward electric battery supply chain alongside the reverse supply chain for retired traction battery recycling, particularly in relation to the capacitance level demand associated with electric vehicle range. The capacitance level of traction batteries in electric vehicles (EVs) is influenced by consumers’ varying preferences regarding capacitance levels within the market. Additionally, changes in the capacitance level of traction batteries will impact their recycling processes. There is a certain dynamic game situation between EV manufacturers and retailers supplying the market with EV sales that will have a certain dynamic impact on the recycling of decommissioned traction batteries by EV retailers and BCU enterprises. Secondly, while there have been relevant studies exploring the integration of blockchain technology into the recycling management of decommissioned traction batteries, most of these studies tend to focus on overview narratives. Consequently, very few have incorporated blockchain into game theoretic models to analyze the recycling mode choices of electric vehicle manufacturers regarding decommissioned traction batteries. Last but not least, how the application of blockchain technology in the traction battery recycling supply chain will affect the reverse recycling supply chain of decommissioned traction batteries, as well as how it will affect the revenue of EV manufacturers, the recycling rate of EV retailers, and the recycling rate of laddering vendors, is also the focus of this study. The following list outlines the key foci of this study:
(1)
In this paper, we develop a three-party evolutionary game model that examines the interactions among electric vehicle manufacturers, electric vehicle users utilizing ladder technology, and retailers. This model enhances the existing two-party game framework by integrating a traction battery recycling model with capacitance level preferences related to the demand for electric vehicle range in China.
(2)
Based on traction battery recycling, due to the lack of reliable regulation leading to unnecessary information exchange costs and security costs, etc., the introduction of blockchain technology to the cost optimization parameters of the traction battery recycling process enriches the existing theory of traction battery recycling and makes practical reference significance for the current stage of traction battery recycling.
(3)
The traction battery recycling supply chain is established by integrating key influencing factors, including recycling incentives and competition, while considering the dual consumer markets of the traction battery recycling sector and the secondary utilization market. Ultimately, this approach aims to optimize the recycling rate and maximize revenue.

4. Problem Statement

This study examines a closed-loop supply chain for retired batteries, comprising a single EV manufacturer, a single BCU enterprise, and a single EV retailer. The EV manufacturer serves as the dominant player in the traction battery supply chain and considers integrating blockchain technology into the retired traction battery recycling process. In this framework, BCU enterprise companies and retailers function as followers, adopting the blockchain technology provided by the electric vehicle manufacturer. Given the rigorous demands of electric vehicles on traction battery strength, batteries are deemed decommissioned when their capacity drops below eighty percent. However, these decommissioned batteries still possess significant capacity. Following testing and compliance with standards for echelon utilization, these batteries can be disassembled, restructured, and repurposed for various applications, including electrical energy storage in the clean energy sector and use in low-speed vehicles. In today’s market, characterized by a limited density of electric vehicle charging stations, a greater driving range is increasingly appealing to consumers. The driving range of an electric vehicle is largely proportional to the capacity of its traction battery. Therefore, traction battery manufacturers can enhance product sales and maximize revenue by prioritizing research and development to improve battery capacity. Consequently, it is essential to incorporate a preference factor for EV range capacitance levels. The integration of blockchain technology into the recycling processes of traction batteries can significantly reduce the associated recycling costs. Therefore, electric vehicle manufacturers should consider implementing blockchain technology to optimize recycling expenses for traction batteries.
The markets for traction battery consumption and gradient battery consumption are distinct, with no interaction between the two demand streams. Market surveys and the literature indicate that the recycling of retired traction batteries is typically managed either solely by electric vehicle (EV) retailers or collaboratively by battery charge unit (BCU) enterprises and retailers.
BYD collaborates with its retailers to promote the recycling of decommissioned traction batteries. Additionally, China’s largest BCU enterprise, Tieta, partners with major automotive retailers to facilitate the collection of retired batteries. TETRA has established its own recycling facilities to oversee the recycling process in collaboration with these partners. This paper examines four primary scenarios regarding the adoption and non-adoption of blockchain technology by electric vehicle manufacturers, considering various levels of capacitance. The analysis focuses on the variations in decision-making depending on whether blockchain technology is implemented or not. The scenarios discussed include the (1) single-channel recycling of decommissioned traction batteries by EV retailers, (2) collaborative recycling of decommissioned traction batteries by BCU enterprises and EV retailers, (3) recycling of decommissioned traction batteries by EV retailers using blockchain technology, and (4) collaborative recycling by both BCU enterprise and EV retailers using blockchain technology.
(1)
Similar to Savaskan et al. traction batteries produced by manufacturers from new and recycled materials do not differ in quality and are sold at the same price in the same market [37].
(2)
For an EV, the cost of the traction battery accounts for nearly 60 percent of the total cost. Therefore, we approximate the demand for traction batteries as the demand for EVs. BYD Enterprises, for instance, uses traction batteries developed in-house for their EVs. Market demand is a linear function of the retail price of the traction battery. Following the work of Liu et al. Yalabik and Fairchild, and Jiumei Chen, we will use the following demand function: Q = A b p + θ h [38].
(3)
According to current conditions, the construction of charging piles is sparse in most areas, leading many consumers to demand vehicles with longer ranges. Since the range of new energy vehicles is positively correlated with battery capacity, increasing the capacitance level of traction batteries not only boosts sales but also enhances their utility for echelon utilization. Retired traction batteries, primarily used for storage and downgraded applications, generate additional revenue for companies when they possess higher capacitance levels. In order to improve the battery capacitance level, the battery capacitance R&D cost of the battery manufacturer is related to the battery capacitance level as 1 2 k h 2 , where k is the R&D cost coefficient, and this kind of relational function has been widely used, such as by Bian et al. and Wang et al [39,40].
(4)
As consumers in both markets are highly variable, we assume that the demand for EVs is linear, there is no interaction between the demand for traction batteries in the EV market and the echelon utilization market, and the market demand for trapezoidal batteries is also a linear function.
(5)
In order for the function to be economically meaningful, b r b m C n c m , introducing the coefficients of the echelon utilization recycling incentive variable h 1 and the retailer recycling incentive coefficients h 2 , can obtain b r = h 2 b m , C n C m = h 1 b m C n C m = h 1 b m , 0 h 2 1 h 1 and p u < b m .
(6)
According to Wu and Zhou we can set the relationship between the decommissioned battery recycling rate and the cost of recycling investment to be a quadratic function relationship recycling investment, such as I R = C R τ r 2 and I U = C R τ u 2 , and the recycling rate can be described as   τ r = I R C R   , τ u = I U C R . If the retailer and the BCU enterprise are collected at the same time, then this can be described as an increasing function of the recycler’s recycling and a decreasing function of the other recycler’s recycling, as in the case of the functions τ r = I r f I U C R and τ u = I U f I R C R ,   0 τ r + τ u 1 . The recovery cost in this case is described as I R = C R τ r 2 + f C R τ u 2 1 f 2 and     I U = C R τ u 2 + f C R τ r 2 1 f 2 [41].
(7)
To ensure that the function is meaningful, we require that 1-f2 > 0; this aligns with the prevailing competitive conditions in the market.
(8)
We assume that the traction battery market has witnessed multiple rounds of traction battery trading and traction battery recycling fixed traction battery market sales and recycling.
(9)
A description of symbols is provided in Table 1.

5. Mathematical Modeling

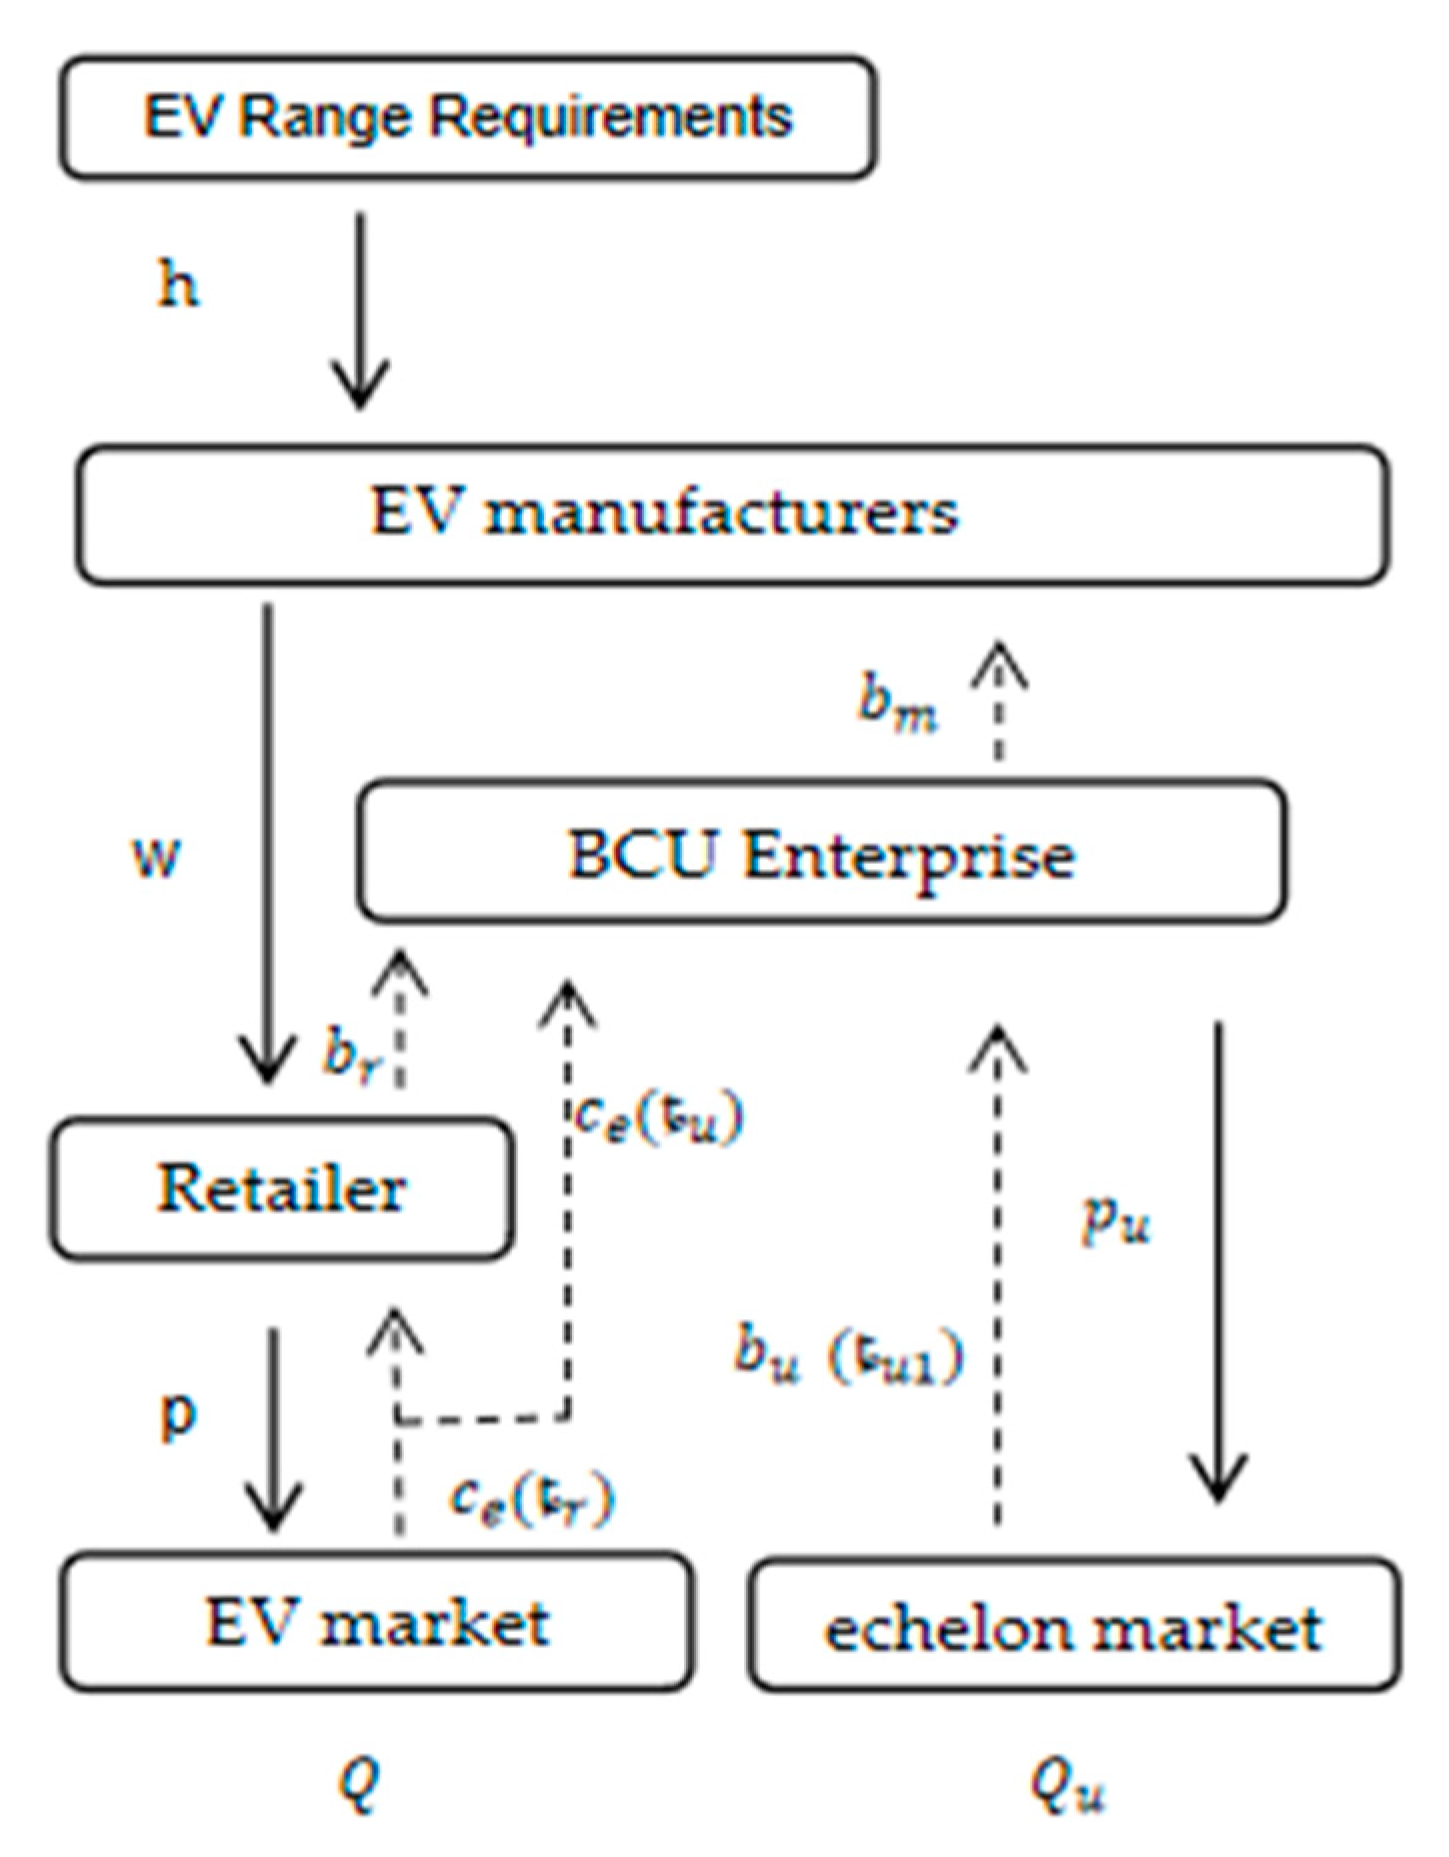
5.1. Retailer Recycling Model

Without adopting a blockchain model, the battery manufacturer, as the leading entity in the supply chain, enhances the capacitance of the traction battery through research and development to attract consumers and increase market sales. According to the assumptions of this study, enhancing the capacitance level of the traction battery generates additional revenue for BUC companies, which in turn increases the overall revenue for all members of the supply chain and boosts consumer welfare. When battery manufacturers choose EV retailers as the primary partners for recycling retired traction batteries, the widespread presence of these retailers creates a favorable recycling market. For example, BYD Enterprises collaborates with its EV retailers to establish recycling points at automobile sales locations. According to the Battery Consortium, there are currently approximately 3200 traction battery recycling outlets in China, primarily functioning as car sales shops. This extensive network facilitates efficient and widespread battery recycling. When retired batteries are recovered, they are resold to enterprises specializing in echelon utilization (EUC), where BCU enterprises assess their suitability for such utilization. Batteries that fail to meet established standards are dismantled and subjected to additional recycling processes prior to resale to battery manufacturers. Reusable raw materials, such as lithium, nickel, and cobalt, are utilized in the production of new traction batteries. It is assumed that there is no significant difference in quality between secondary raw materials sourced from recycled batteries and primary raw materials. Retired batteries that are suitable for echelon utilization are processed and resold to the gradient battery consumer market. After one cycle of echelon utilization, the further use of these batteries becomes impractical. According to Figure 3, BCU enterprises recover the batteries and resell them to battery manufacturers. Due to the significant differences between the new traction battery market and the echelon utilization battery market, these consumer markets operate independently, enabling BCU enterprises to recover batteries accurately and promptly. Battery manufacturers, as leaders in the supply chain, establish the wholesale price and capacitance level of traction batteries. Following them, BCU enterprises set the sale price and recycling rate for recycled batteries. Finally, retailers, as followers in the supply chain, determine the sale prices of traction batteries and the recycling rates of retired batteries. Based on these assumptions, the Stackelberg model for the traction battery recycling supply chain is presented as follows:
π m = w C n + C n c m b m τ r Q 1 2 k h 2
π r = p w + b r c e τ r Q C R τ r 2
π u = b m b r τ r Q + p u c u τ u 1 b u Q U + λ h Q u C R 2 τ u 1 2
Proposition 1.
When the conditions are satisfied
b k 4 C R b h 2 b m 2 h 1 + h 2 1 C R θ 2 4 S C R 2 S 2 b u 2 0 4 C R b b 2 b m 2 h 2 2 0
The equilibrium decisions of the BCU enterprise and EV retailers are as shown in Table 2:

5.2. Circular Supply Chain Model with Dual Recycling by BCU Enterprises and EV Retailers

BCU companies possess distinct advantages over EV retailers in the safe collection, identification, transportation, and storage of batteries. In contrast, EV retailers excel in establishing recycling points for retired batteries. According to data from the Ministry of Industry and Information Technology (MIIT, 2022), GEM, the largest battery collection unit (BCU) enterprise in China, has established over 140 collection points. Furthermore, SAIC-GM-Wuling Automobile Co., Ltd. has partnered with nearly 460 BCU companies and automotive retail shops to facilitate the recycling of retired traction batteries (MIIT, 2024). Huayou Cobalt has established over 40 collection points nationwide (MIIT, 2022). In this context, EV manufacturers collaborate with both battery collection enterprises and EV retailers to jointly recycle traction batteries.
EV retailers collect retired traction batteries and transport them to BCU enterprises. After undergoing ladder utilization, BCU enterprises send unused batteries from the ladder market and end-of-life (EOL) ladder batteries to EV manufacturers for raw material recycling.
In the collaborative recycling of decommissioned traction batteries by BCU Enterprises and EV retailers, the supply chain is primarily led by the EV manufacturer. The retailer and BCU Enterprises assume subordinate roles within this hierarchy, ensuring an organized and efficient recycling process.
According to Figure 4, EV manufacturers produce batteries for wholesale to electric vehicle (EV) manufacturers, who then assemble and sell traction batteries and other components to the new energy vehicle market through automotive retailers. The recycling process involves collecting decommissioned traction batteries from both the manufacturers’ retail outlets and BCU Enterprises. This dual-channel approach introduces competition into the recycling market, represented by a competition coefficient. EV manufacturers determine the wholesale price w and the traction battery capacitance level h . EV retailers set the sale price p and the recycling rate τ r . Meanwhile, BCU enterprises establish the recycling rate for decommissioned batteries τ u , the recycling rate for BCU enterprises τ u 1 , and the sale price for BCU enterprises p u as follows:
π m = w c n + c n c m b m τ r + τ u Q 1 2 k h 2
π r = p w + b r c e τ r Q C L τ r 2 + C L f τ u 2 1 f 2
π u = b m c e τ u Q + b m b r τ r Q + p u c u τ u 1 b u Q U + λ h Q u C L τ u 2 + C L f τ r 2 1 f 2 C L τ u 1 2
Proposition 2.
When the condition is satisfied in a circular supply chain where the BCU enterprise and the EV retailer recycle together
b k 4 C R b b m 2 h 2 2 + h 2 h 1 h 2 + h 1 1 1 f 2 C R θ 2 4 S C R 2 C R 2 S 2 b u 2 C R < 0 4 C R b b 2 b m 2 h 2 2 ( 1 f 2 ) 0
The BCU enterprise and EV retailer equilibrium decisions are as shown in Table 3:

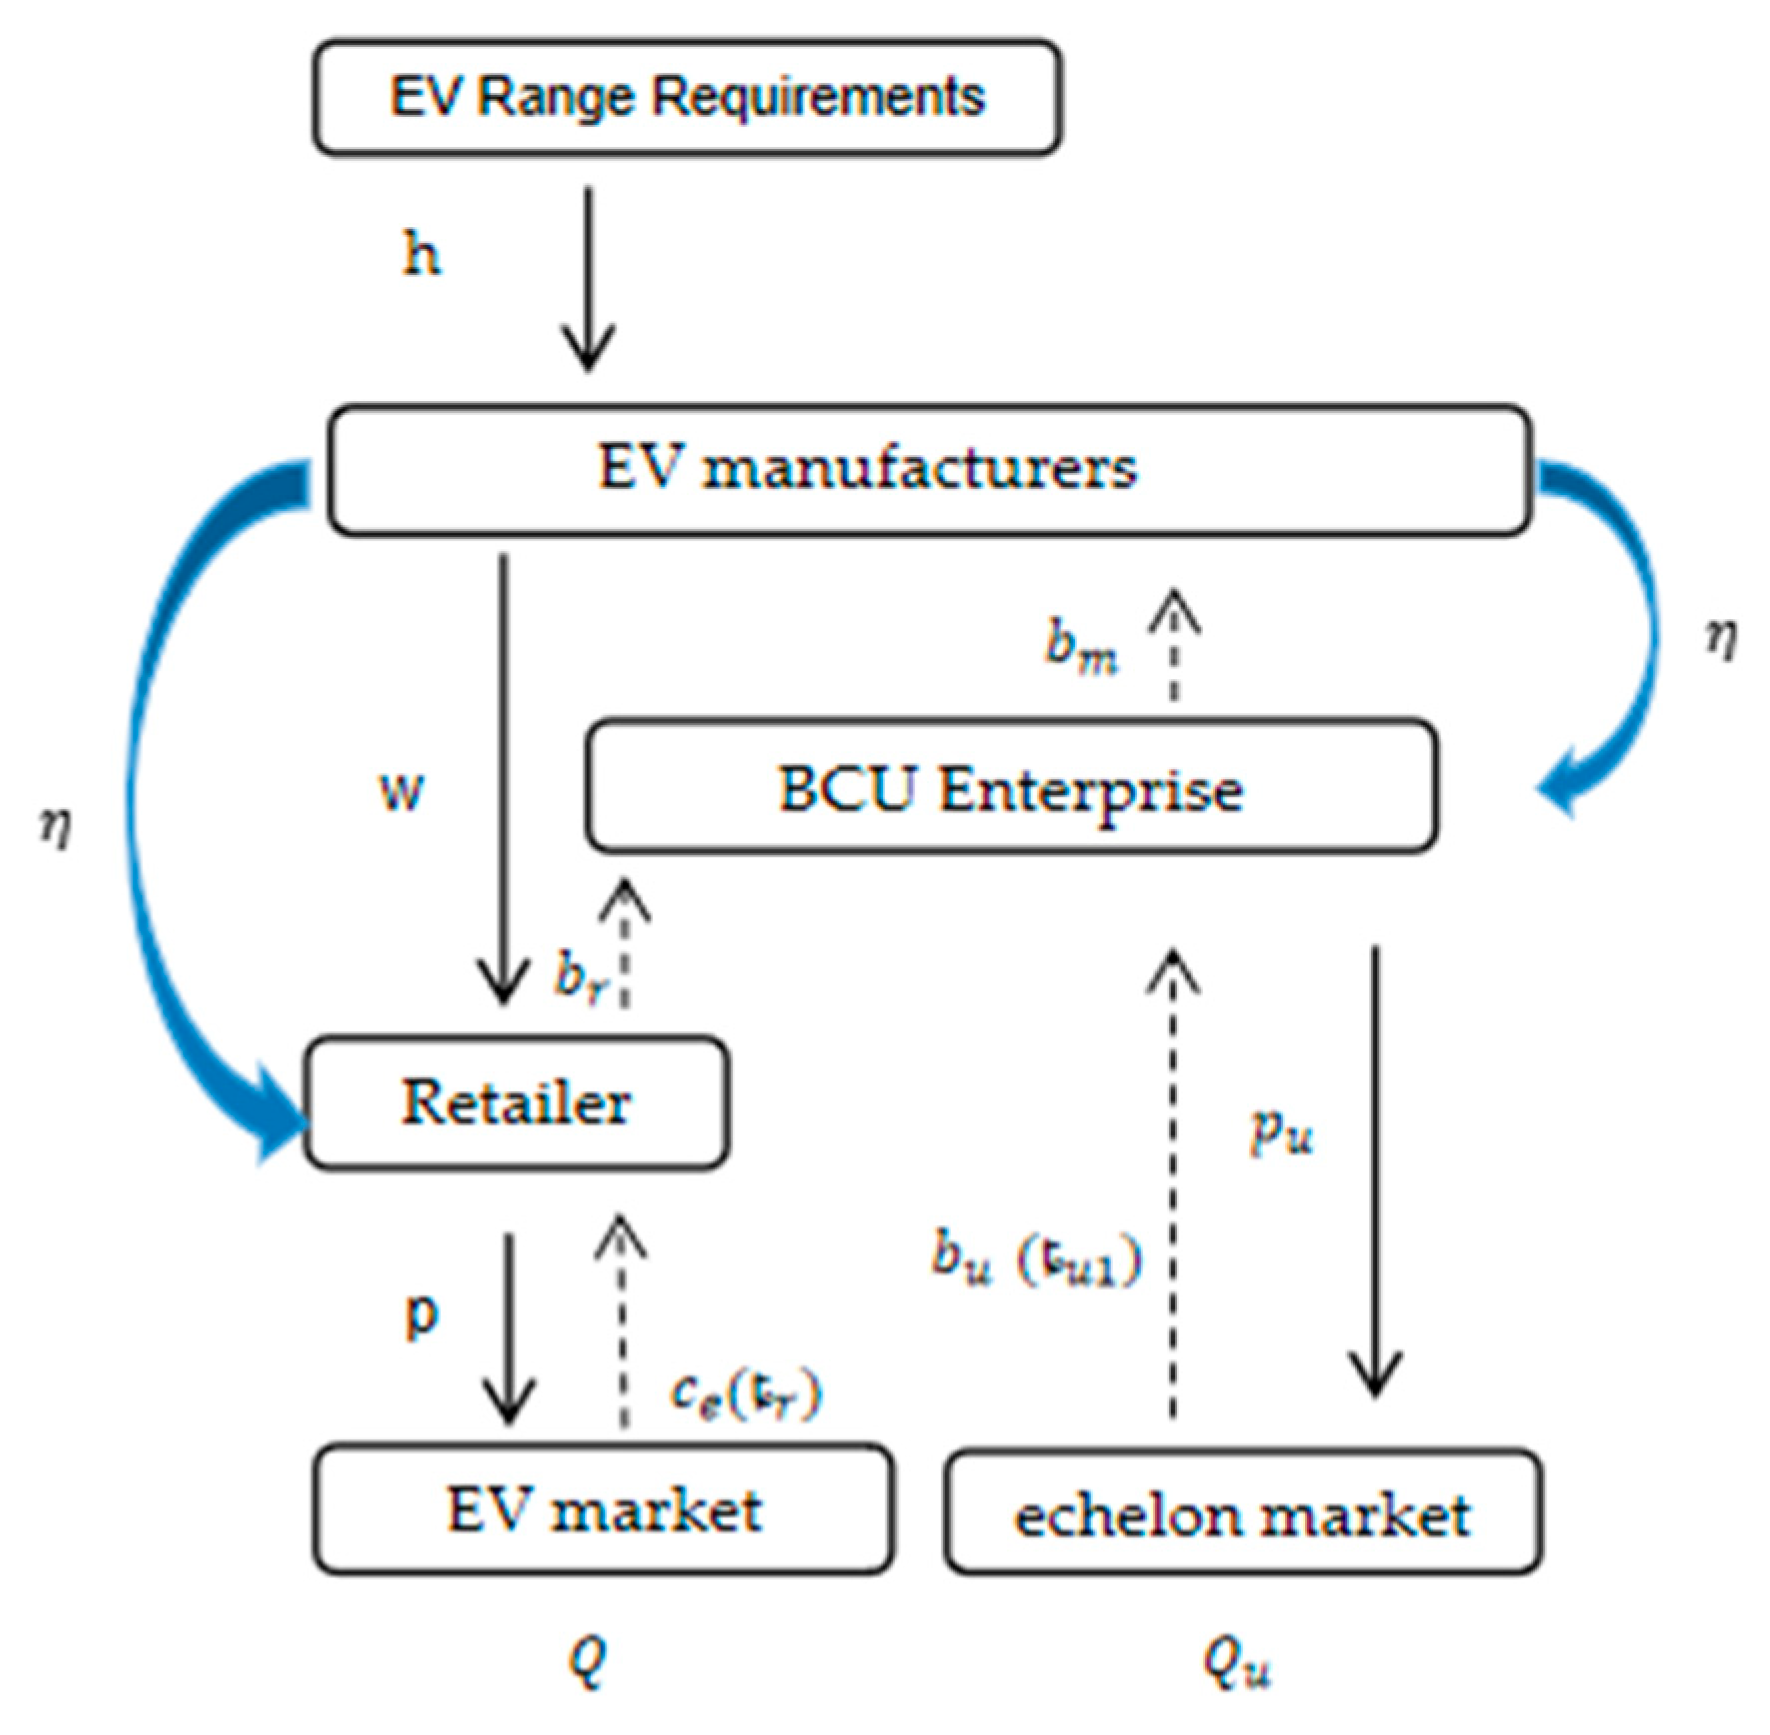
5.3. EV Retailer Recycling Model Using Blockchain

Due to the advantages of blockchain technology, such as traceability and security, recyclers no longer need to dismantle batteries individually to ascertain their comprehensive health data. Blockchain enables the “chaining” of battery data, thereby facilitating a reduction in the information costs associated with the wear and tear of retired batteries. This technology significantly optimizes the process, ensuring efficient and cost-effective recycling. In the traction battery recycling supply chain, EV manufacturers utilize blockchain technology to improve the management of traction batteries throughout their entire life cycles. This technology enables the real-time tracking and tracing of each battery. When a battery reaches the end-of-life recycling standard, the recycling entity can minimize information errors by utilizing the data recorded on the blockchain, thereby enhancing the efficiency of the recycling process. Furthermore, BCU enterprises can evaluate the battery’s condition using blockchain data, thereby reducing transaction trust costs among the recycling market, recycling companies, and secondary utilization enterprises. According to Figure 5, the recycling model introduces the blockchain cost coefficient per unit of traction battery C b and the optimization coefficient of recycling cost per unit of traction battery η as follows:
π m = w C n C b + ( c n c m b m ) τ r Q 1 2 k h 2 π r = [ p w + ( b r c e ) τ r ] Q η C R τ r 2 π u = ( b m c e ) τ r Q + [ p u c u τ u 1 b u ] Q U + λ h Q u τ u 1 2 C L 2
Proposition 3.
Under the battery manufacturer-led traditional retired traction battery recycling supply chain model, when the condition is satisfied
b k 4 C R η b h 2 b m 2 h 1 + h 2 1 C R η θ 2 4 C R b η b 2 b m 2 h 2 2 0 ,
The equilibrium decisions of the BCU enterprise and seller are as shown in Table 4:

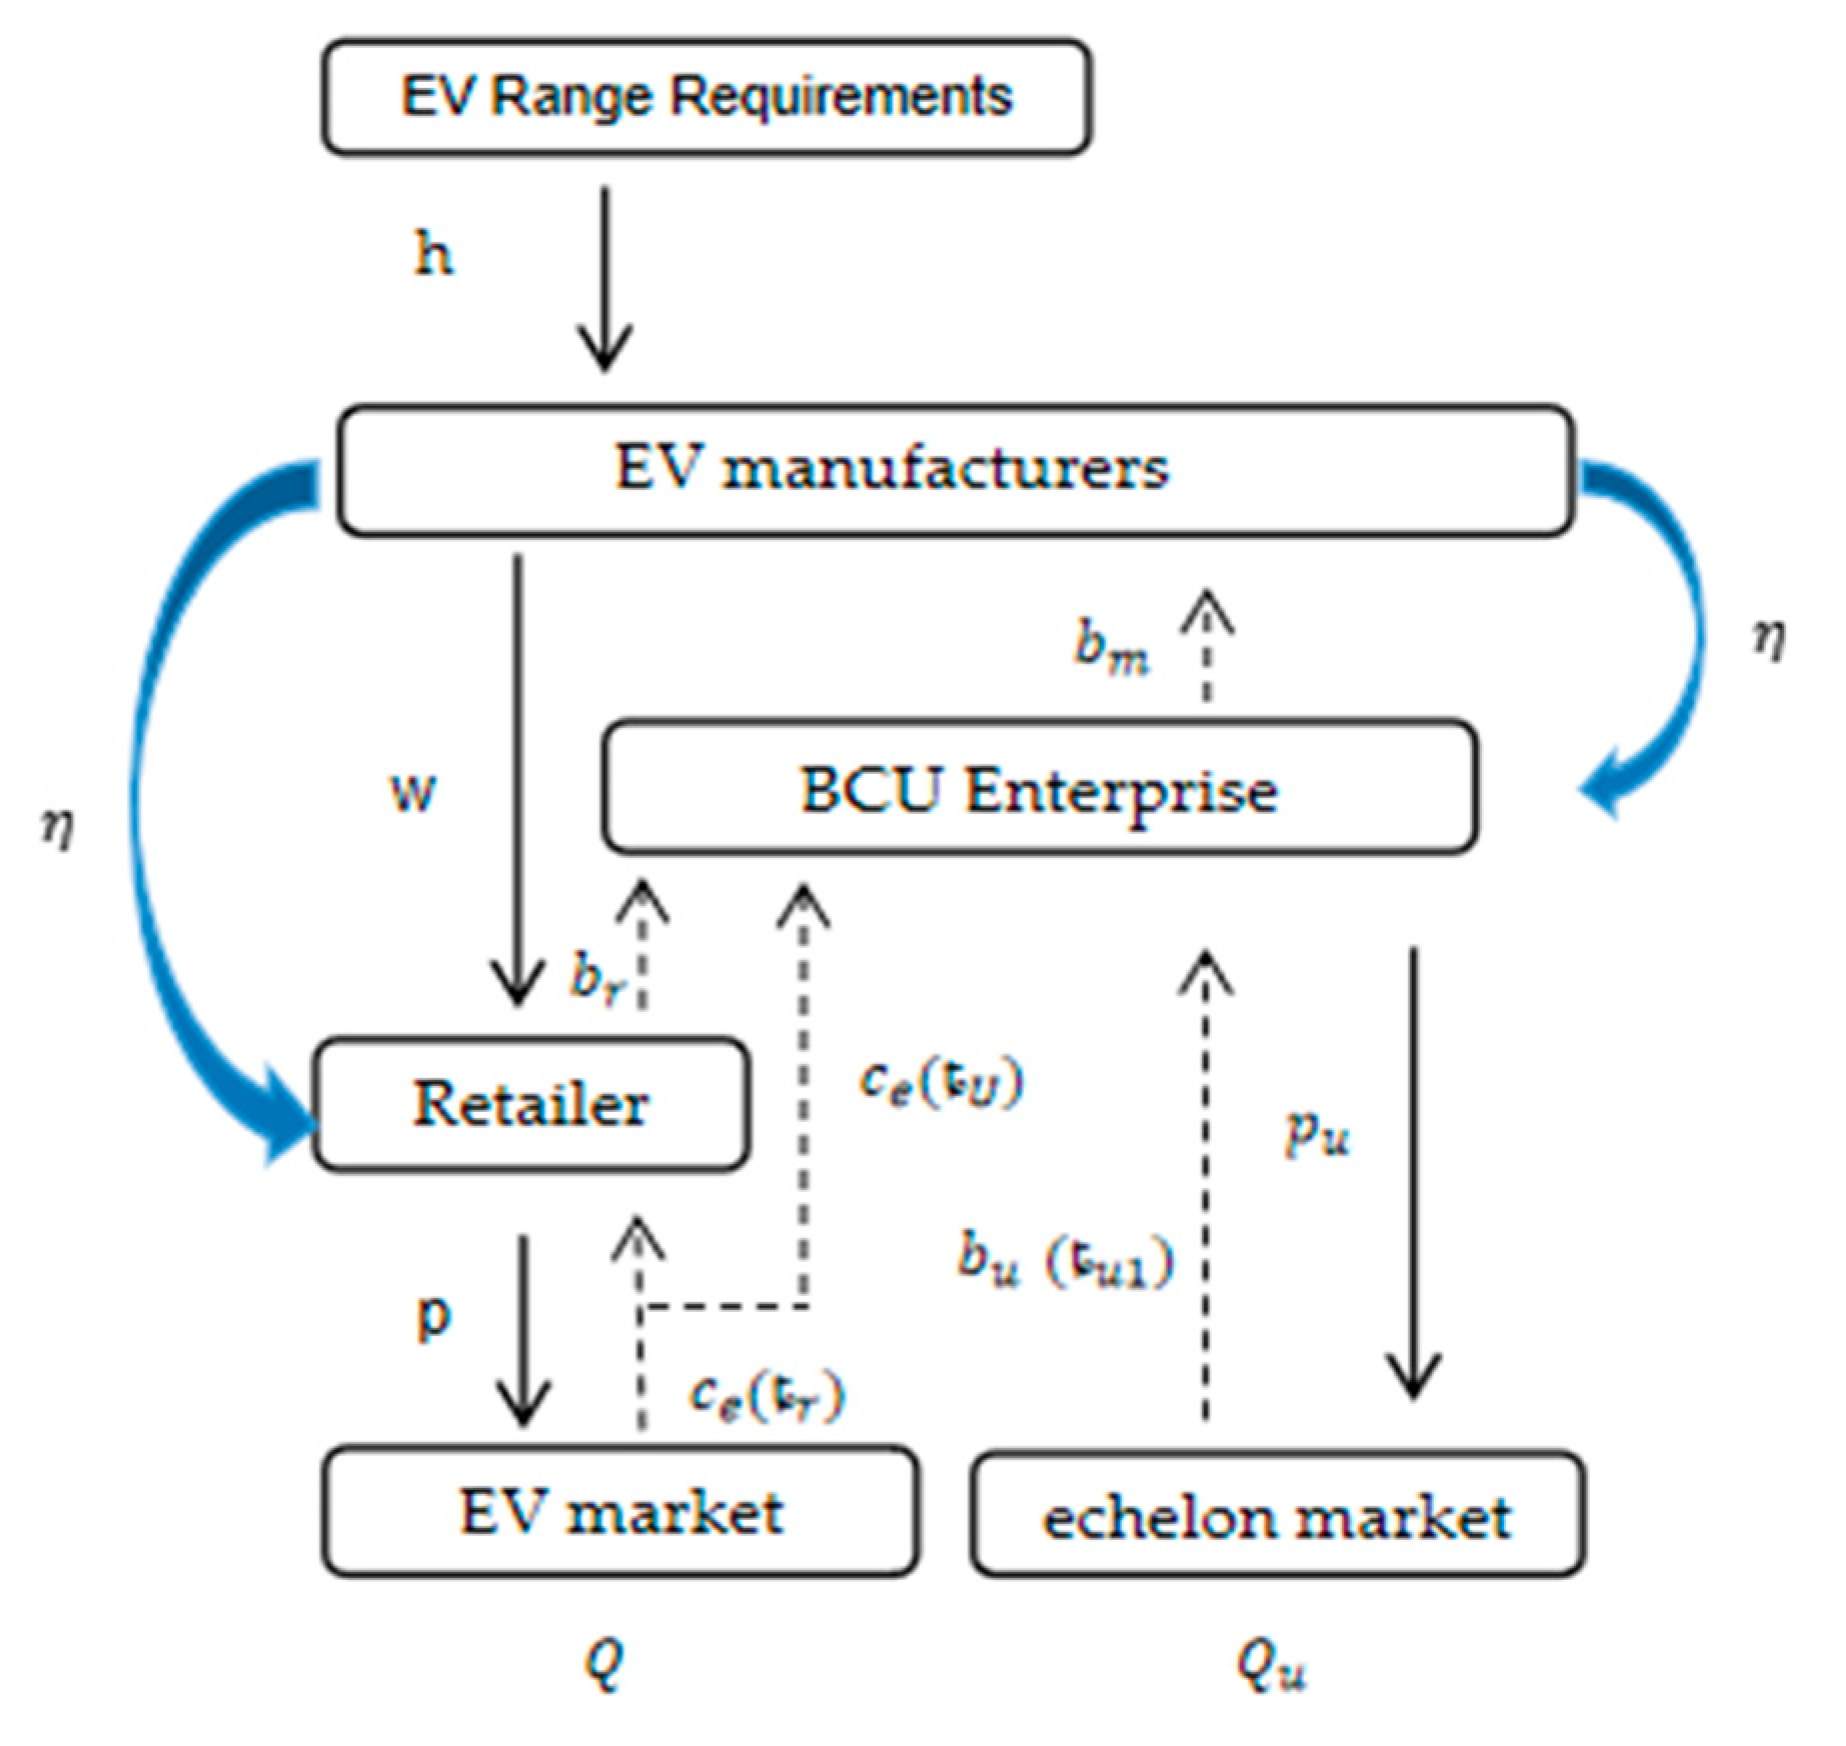
5.4. Dual Recycling Supply Chain Model for Traction Battery Recycling by BCU Enterprises and EV Retailers Adopting Blockchain

In the dual-channel recycling model, the presence of multiple EV retailers and BCUs owned by the same EV manufacturer, coupled with a lack of timely supervision and traceability, can lead to issues of information opacity and security. The lack of transparency and security incurs unnecessary communication and trust costs during the recycling and transaction processes of decommissioned traction batteries. For instance, Shanghai Automotive operates nearly three hundred recycling points for electric vehicle retailers and laddering enterprises (MIIT, 2024). However, there is a lack of effective communication and secure transactions among these points, resulting in inefficiencies and increased costs. The consensus mechanism of blockchain enhances the security and transparency of transactions involving decommissioned traction batteries. This improvement significantly reduces the trust and communication costs associated with multi-party recycling efforts. According to Figure 6, in the BUR recycling model, the EV manufacturer sets the wholesale price w and the traction battery capacitance level h . The EV retailer determines the sale price of the EV p and the recycling rate τ r , while the BCU enterprise establishes the recycling rates for both decommissioned τ u and BCU enterprise τ u 1 , as well as the sale price for the BCU enterprise p u .
π m = w c n C b + c n c m b m τ r + τ u Q 1 2 k h 2
π r = p w + b r c e τ r Q C R η τ r 2 + C R η f τ u 2 1 f 2
π u = b m c e τ u Q + b m b r τ r Q + p u c u τ u 1 b u Q U + λ h Q u τ u 1 2 C L 2 C R η τ u 2 + C R η f τ r 2 1 f 2
Proposition 4.
The conditions are met in the dual-recycling supply chain model of traction battery recycling by a recycler and EV retailer using blockchain
b k 4 C R η b b m 2 h 2 2 + h 1 h 2 + h 1 h 2 1 1 f 2 C R η θ 2 4 C R b η b 2 b m 2 h 2 2 ( 1 f 2 ) 0 4 S C R 2 C R 2 S 2 b u 2 C R < 0
The equilibrium decisions of the EV manufacturer, the BCU enterprise, and the seller are as shown in Table 5:

5.5. Analysis of Equilibrium Results

Corollary 1.
Based on the equilibrium equation, we can conclude that the EV capacitance level preference coefficient   θ is related to the traction cell capacitance level  h and the traction cell market demand   Q
I f , A > b C n + b C b t h e n   h r N R θ > 0 , h u U R θ > 0 , h r B R θ > 0 , h u B U R θ > 0 , Q r N R θ > 0 , Q u U R θ > 0 , Q r B R θ > 0 , Q u B U R θ > 0
Proof. 
Corollary 1: When the market demand A for electric vehicle (EV) traction batteries surpasses a certain threshold, the preference for higher capacitance levels in EVs leads to an increase in both the capacitance level of traction cells h and the market demand Q for these cells. This phenomenon arises because a sufficiently large market size enables manufacturers to achieve significant gains, while consumers are increasingly attracted to EVs that provide extended ranges. Consequently, to enhance EV sales and market competitiveness, manufacturers are investing in the development of traction cells with higher capacitances. As a result, EV sales have increased in alignment with consumer preferences. □
Corollary 2.
According to Equation model of the equilibrium equation, we can conclude that the EV capacitance level preference coefficient  θ is related to the EV wholesale price w and the EV sale price p as
I f   k ( A + bC n ) ( 4 C R - bh 2 2 b m 2 ) - 2 bAkh 2 ( h 1 1 ) b m 2 2 C n b k 4 C R O > 0   a n d   6 C n A k 6 b k C n C R + 2 O ( b C n A ) > 0 O = b k h 2 b m 2 ( h 2 + h 1 1 )
w NR θ > 0 , w NR θ > 0 , P N R θ > 0 , P U R θ > 0 ,
Proof. 
Corollary 2: It can be concluded that an increase in the electric vehicle (EV) capacitance level preference coefficient leads to higher wholesale price (w) and selling price (p). When manufacturers enhance the capacitance level of traction batteries, the development costs rise, resulting in an increase in the wholesale prices of EVs. Consequently, retailers also raise the selling prices of EVs to ensure sufficient profit margins. □
Corollary 3.
Based on equilibrium Equation, we can derive the relationship between the EV capacitance level preference coefficients  θ and the recycling rates of EV retailers and BCU enterprise as
τ r N R θ > 0 , τ u U R θ > 0 , τ r B R θ > 0 , τ u B U R θ > 0
Proof. 
Corollary 3: In both models, the recycling rate of electric vehicle (EV) traction batteries increases as the capacitance level preference factor rises. According to Corollary 1 and Corollary 2, as consumers’ capacitance level preference coefficients increase, manufacturers are incentivized by market demand to extend the range of electric vehicles by enhancing the battery capacitance level. Consequently, both the selling price and the number of electric vehicles sold are likely to increase. Consumers are willing to pay a premium for EVs with longer ranges. Additionally, they are motivated to sell traction batteries to receive partial recycling subsidies, which help to offset the cost of purchasing new electric vehicles. □
Corollary 4.
Equilibrium results based on Equations; the relationship of the recovery cost optimization factor η with the capacitance level h , the recycling rate of EOL echelon battery τ u , traction battery market demand Q , and the retailer’s recycling rate τ r is:
I f A < b C b + b C n d τ r B R d η < 0 , d τ r B U R d η < 0 , d τ u B U R d η < 0 , d h N R d η < 0 , d Q B U R d η < 0
Proof. 
Corollary 4: From the above inference, it can be seen that the level of capacitance, the recycling rate of retailers, the recycling rate of BCU companies, and the market demand for traction batteries all increase as the recycling cost optimization factor becomes smaller. From Equation C R η , it can be seen that the cost optimization factor is inversely proportional to the degree of cost improvement of the battery recyclers, when the cost optimization factor is smaller, the recycling cost borne by the recyclers is lower. Therefore, when producers introduce blockchain under the urgent requirement of PRS to improve the recycling rate, they improve the recycling channel and reduce the associated recycling costs. With lower recycling costs for retailers and BCU enterprises, they will naturally invest more in recycling more retired traction batteries. According to Equation ( c n c m b m ) , when the number of remanufactured batteries from EV manufacturers increases, the revenue from remanufactured batteries also increases, resulting in more money being available to invest in the research and development of traction battery capacitance levels. According to Corollary 1, when the traction battery capacitance level increases, the demand for electric vehicles Q, increases as well. □
Corollary 5.
Based on the equilibrium results of Equations, it can be concluded that the recycling cost optimization factor  η of the battery manufacturer after the introduction of blockchain technology, the relationship with the selling price of EOL echelon battery  p u , the recycling rate of EOL echelon battery  τ u 1 , and the market demand for EOL echelon battery  Q u are
I f A < b C b + b C n d p u B R d η > 0 , d τ u 1 B U R d η > 0 , d Q u B U R d η < 0
Proof. 
Corollary 5: Based on the aforementioned inferences, it follows that when the potential demand for traction batteries is below a certain threshold, both retailer recycling rates and BCU enterprise recycling rates decrease as the optimization factor for recycling costs diminishes. Additionally, the number of end-of-life (EOL) echelon batteries sold increases as the recycling cost optimization factor decreases. Corollary 4 indicates that a lower recovery cost optimization factor correlates with a higher degree of recovery cost optimization for BCU enterprises. Consequently, BCU enterprises can reduce recycling costs to appropriately lower sale prices, thereby regulating the economic structure and optimizing the supply–demand relationship. This optimization ultimately enhances the demand for EOL echelon batteries. □
Corollary 6.
The effect of retailer recycling incentive coefficients  h 1 on EV capacitance levels  h , recycling rates by BCU enterprise  τ u , traction battery market demand  Q , EOL echelon battery sale prices  p u , EOL echelon battery recycling rates  τ u 1 , and EOL echelon battery market demand Q u are
I f A > b C b + b C n ( 1 ) h N R h 1 > 0 , h U R h 1 > 0 , h B R h 1 > 0 , h B U R h 1 > 0 ( 2 ) Q B R h 1 > 0 , Q B U R h 1 > 0 ( 3 ) τ r N R h 1 > 0 , τ u B U R h 1 > 0
Proof. 
Corollary 6: The levels of battery capacitance, traction battery recycling rates, and the demand for electric vehicles increase in response to enhanced incentive factors for BCU enterprises. As the incentive factor increases, the recycling incentive for BCU enterprises decreases. Consequently, electric vehicle manufacturers save money due to lower recycling incentive costs, allowing them to invest these savings in enhancing battery capacitance levels. This increase in battery capacitance could subsequently drive higher demand in the electric vehicle market. Recyclers benefit from the collection of additional batteries. Furthermore, considering the equation h1bm = CnCr, Corollary 6 indicates that increased profits from remanufacturing also enhance battery capacitance levels, traction cell recycling rates, and demand for electric vehicles. □
As electric vehicle manufacturers generate greater profits from remanufacturing retired traction batteries to further reduce costs, they will increasingly invest in enhancing battery capacity and improving the range of electric vehicles. This, in turn, will elevate market demand for electric vehicles.

5.6. Comparative Analysis of Recycling Programs

Proposition 5.
Without competition considerations (f = 0), side-by-side comparison of recycling Rates when manufacturers adopt blockchain versus not adopting blockchain  ( τ r N R , τ r B R ) a n d ( τ U R , τ B U R ) . Vertical comparison between single-channel recycling of decommissioned traction batteries by retailers and dual-channel recycling by retailers and BCU enterprises ( τ r N R , τ r U R ) a n d ( τ r B R , τ r B U R . )
( 1 ) I f ( 1 η ) J > b C b [ 8 C R b k 2 k h 2 b m 2 b 2 ( h 1 1 + h 2 ) 2 C R θ 2 ] t h e n , τ r N R > τ r B R ( 2 ) i f ( 1 η ) J > b C b [ 8 C R b k 2 k h 2 b m 2 b 2 ( h 1 1 h 2 + h 2 + h 1 h 2 ) 2 C R θ 2 ] t h e n , τ U R > τ B U R J = ( 8 C R b k 2 C R θ 2 ) ( A b C n ) ( 3 ) I f A > b C n . a n d , C R > h 2 2 b 2 b m 2 k / ( 4 b k θ 2 ) t h e n , τ r N R < τ U R ( 4 ) I f A > b C n + b C b , a n d , η C R > k b 2 b m 2 h 2 2 / ( 4 b k θ 2 ) t h e n , τ r B R < τ B U R
Proof. 
Proposition 5: (1) and (2) present a side-by-side comparison of adopting versus not adopting blockchain technology. When the cost optimization factor of blockchain for recycling decommissioned traction batteries falls below a certain threshold, EV battery manufacturers are likely to implement blockchain technology to enhance recycling cost efficiency. Thus, the primary factor affecting an EV manufacturer’s decision to adopt blockchain technology is the magnitude of its cost optimization for recovery. A smaller cost optimization factor corresponds to a larger reduction in recovery costs. □
EV manufacturers may opt for a dual-channel recycling model when the potential market demand exceeds a specified threshold and the battery recycling costs are above a certain limit. In the single-channel recycling model, excessively high recycling costs may deter some retailers from investing in the recycling of traction batteries, thereby hindering overall recycling efforts. Under the dual-channel recycling model, some BCU enterprises can also engage in investment in the recycling of traction batteries, thereby expanding the channels for traction battery recycling. When blockchain technology is utilized in recycling, the optimization factor of blockchain technology becomes a key consideration for traction battery manufacturers when deciding between single-channel and dual-channel options.
Proposition 6.
Considering competitive factors, this study presents a side-by-side comparison of traction battery capacitance levels between manufacturers that adopt blockchain technology and those that do not. It also includes a longitudinal analysis of traction cell capacitance levels in single-channel recycling by retailers versus dual-channel recycling by retailers and BCU enterprises.
( 1 ) I f , h 1 + h 2 < 1 t h e n   Q N R < Q U R , Q B R < Q B U R , h N R < h U R , h B R < h B U R ( 2 ) I f ( A b C n ) ( 1 η η ) Y > C b ( 4 C R b k b Y C R θ 2 ) t h e n   Q N R < Q B R , h N R < h B R Y = h 2 b k b m 2 ( h 1 1 + h 2 ) ( 3 ) I f ( A b C n ) ( 1 η 1 ) X > C b ( 4 C R b k b X C R θ 2 ) t h e n , Q U R < Q B U R , h U R < h B U R X = b k b m 2 ( h 1 1 h 2 + h 2 2 + h 1 h 2 ) 1 f 2
Proof. 
Proposition 6: As indicated in (1), when the sum of the recycling incentive coefficients is less than 1, the traction battery capacitance level in the dual-channel recycling model is higher than that in the single-channel recycling model, and the demand for electric vehicles in the dual-channel model exceeds that in the single-channel model. It is evident that the recycling incentive factor not only directly influences the battery recycling rate but also impacts the capacitance level of end-of-life (EOL) echelon batteries and the demand for electric vehicles (EVs). When the total recycling incentive factors in the market are less than one, EV manufacturers tend to favor a dual-channel recycling model. From (2) and (3), when the recovery cost optimization factor falls below a certain threshold and potential market demand exceeds a specific limit, the market demand and capacitance level are higher with the implementation of blockchain technology compared to without it. In this scenario, electric vehicle manufacturers are more likely to adopt a recycling model that utilizes blockchain technology. □
Proposition 7.
A comparison of EOL echelon battery sale price p u , EOL echelon battery demand Q u , EOL echelon battery, and EOL echelon battery recycling rate τ u 1 with and without the introduction of blockchain technology when competition is taken into account. A comparison of EOL echelon battery sale price p u , EOL echelon battery demand Q u , and EOL echelon battery recycling rate τ u 1 between single-channel and dual-channel recycling:
( 1 ) I f   h 1 + h 2 < 1   t h e n   Q u N R > Q u U R   Q u B R > Q u B U R , τ u 1 N R < τ u 1 U R   τ u 1 B R < τ u 1 B U R , p u N R > p u U R   p u B R > p u B U R ( 2 ) I f   ( A b C n ) ( 1 η 1 ) Y > C b ( 4 C R b k b Y C R θ 2 )   t h e n   Q N R < Q B R , τ u 1 N R > τ u 1 B R , p u N R < p u B R ( 3 ) I f   I f ( A b C n ) ( 1 η 1 ) X < C b ( 4 C R b k b X C R θ 2 )   t h e n   Q U R > Q B U R , τ u 1 U R < τ u 1 B U R , p u U R > p u B U R X = b k b m 2 ( h 1 1 h 2 + h 2 2 + h 1 h 2 ) 1 f 2
Proof. 
Proposition 7: From (1), it can be observed that when the sum of the recycling incentive coefficients is less than 1, the demand for echelon batteries in the single-channel recycling mode exceeds that in the dual-channel recycling mode. The recycling rate of end-of-life (EOL) echelon batteries in the dual-channel recycling model is higher than that of single-channel EOL echelon batteries. Additionally, the selling price of EOL echelon batteries in the single-channel recycling model is higher than that in the dual-channel recycling model. From (2) and (3), when the cost optimization factor falls below a certain threshold, the market demand for electric vehicles equipped with blockchain technology exceeds that for those without it. Additionally, the battery recycling rates and sale prices for end-of-life (EOL) echelon batteries are higher for BCU enterprises utilizing the blockchain recycling model. □
In conclusion, the single-channel recycling model better supports EV market demand, while the dual-channel recycling model is more advantageous for retired power battery recycling. The recycling model that incorporates blockchain technology enhances both EV sales and the recycling of retired power batteries. Manufacturers can choose between single-channel and dual-channel recycling, as well as the adoption or non-adoption of blockchain technology, based on the recycling and sales aspects of BCU enterprises. This provides power battery manufacturers with a reference for optimizing overall supply chain revenue and retired power battery recycling.

6. Data Simulation

To intuitively and effectively validate the research findings, numerical analysis is employed to assess the conclusions drawn from the theoretical model. This analysis examines relevant policies and market conditions, referencing the works of Tang et al. [14], Wang and Wu (2021), and Höhne (2013) [42,43]. while adhering to the assumptions of non-negative correlation and causality. The values of each parameter are ȵ = 0.8, f = 0.8, Cn = 50, Cm = 25, Cu = 10, A = 130, b = 0.6, R = 50, S = 0.8, bm = 20, bu = 10, cu = 10, θ = 2, k = 15, bu = 10, θ = 2, k = 15, CR = 400, and CR1 = 200. We first analyze how the capacitance level preference coefficient of electric vehicle (EV) range affects the recycling rate of decommissioned traction batteries. Additionally, we investigate the impact of the cost optimization coefficient of blockchain technology on the recycling rate across four modes of decommissioned traction batteries, as well as the influence of the recycling competition coefficient on these rates. Next, we analyze the effects of retailer recycling incentive coefficients and the recycling incentive coefficients of BCU enterprises on the recycling rates of retired traction batteries across four distinct recycling modes. Finally, we analyze the impact of incentive coefficients for echelon utilization battery vendors and capacitance level preference coefficients for EV range on the maximum benefits for battery manufacturers, retailers, and BCU enterprises across the four recycling scenarios.

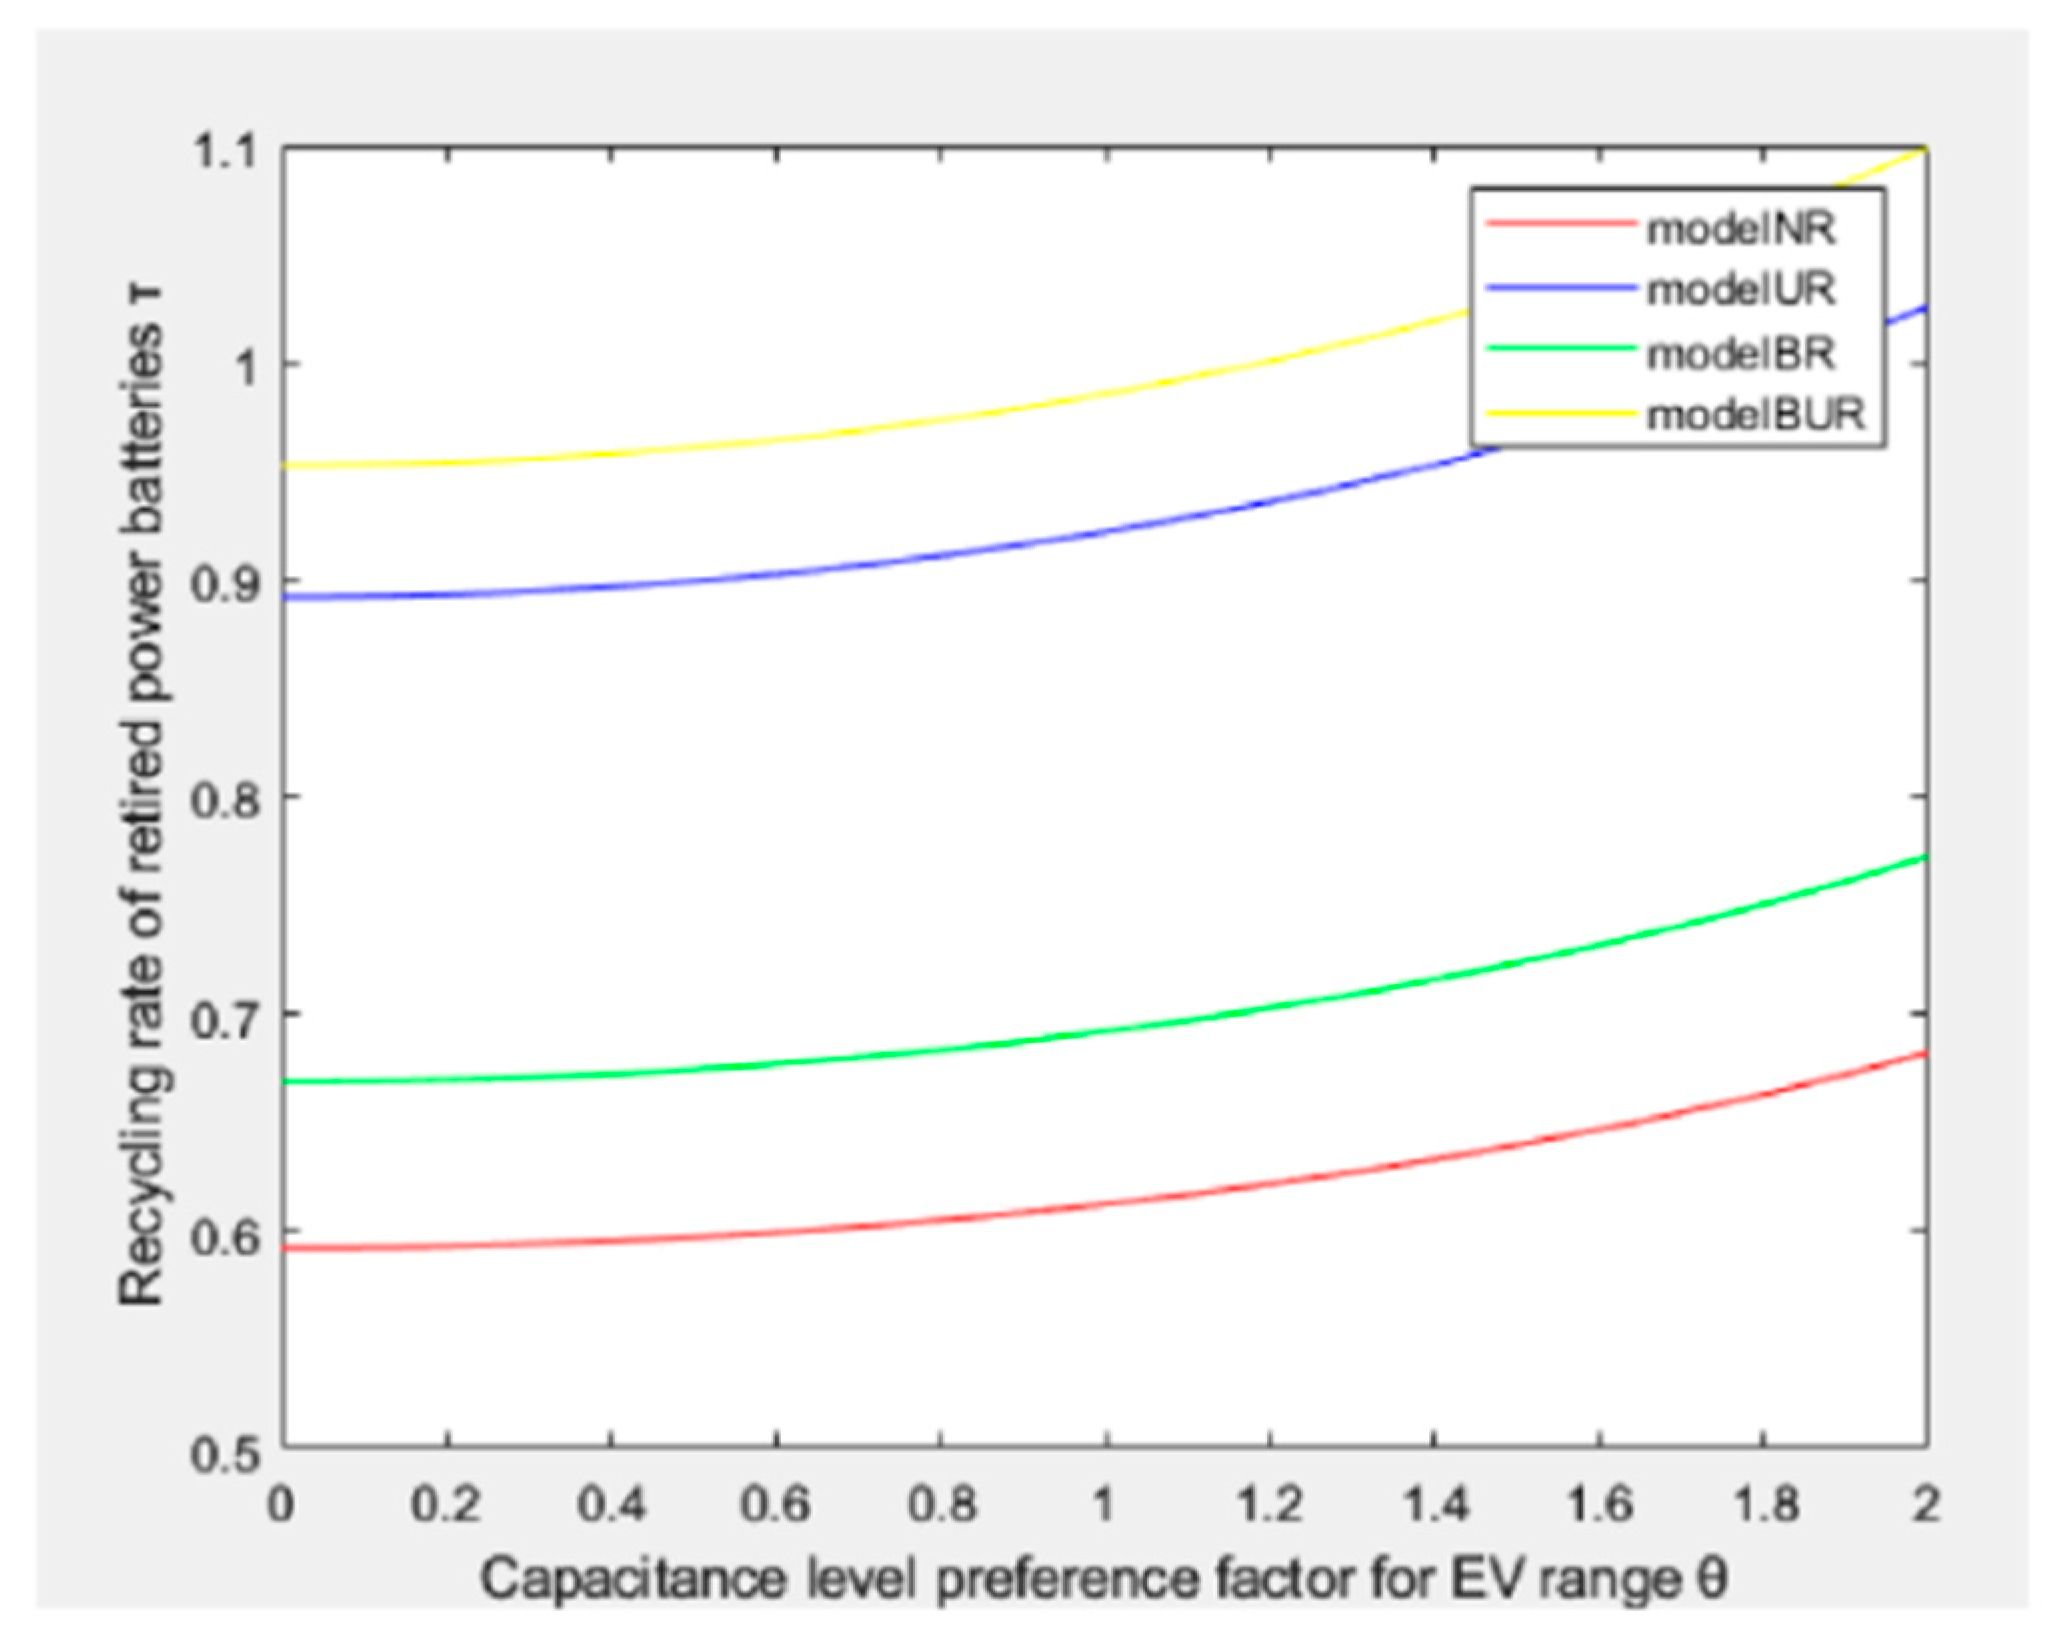
6.1. Analyze the Effect of Capacitance Level Preference Coefficient θ on Recovery Rates for EV Range

To assess the impact of the capacitance level preference coefficient θ for electric vehicle (EV) renewal on the return rate, we establish the capacitance level preference coefficient θ within the range of (0, 2) based on relevant literature. The results presented in Figure 7, indicate that the return rate for all four modes increases with the capacitance level preference coefficient for EV renewal. The BUR model consistently exhibits the highest optimal recycling rate for traction batteries, while the NR model shows the lowest. There are several potential reasons for this. Firstly, as the preference factor for capacitance levels increases, manufacturers allocate more resources towards the research and development of battery capacitance levels to meet market demand. Consequently, both the wholesale price and retail price of electric vehicles rise. Consumers will utilize the proceeds from the sale of retired traction batteries to acquire electric vehicles with longer ranges. Furthermore, BUC possesses a technological advantage in recycling compared to retailers; however, retailers have easier access to traction battery consumers and a more extensive recycling market. The two recycling processes operate in tandem, complementing each other’s strengths; thus, the dual-channel recycling model is more advantageous than the single-channel model. Furthermore, the integration of blockchain technology into the recycling process by manufacturers reduces costs, enhances the recycling model, and ultimately increases the recycling rate of decommissioned traction batteries.

6.2. Analyze the Impact of the Recovery Cost Optimization Factor ȵ on Recovery Rates

Figure 8 demonstrates that the recycling rate of decommissioned traction batteries decreases as the cost optimization factor increases. When the cost optimization factor (ȵ) is less than 0.96, the recovery rate reaches its optimum in the BUR model, allowing the manufacturer to consider implementing blockchain technology. Conversely, when the cost optimization factor (ȵ) exceeds 0.96, the manufacturer is more likely to prefer the UR model.

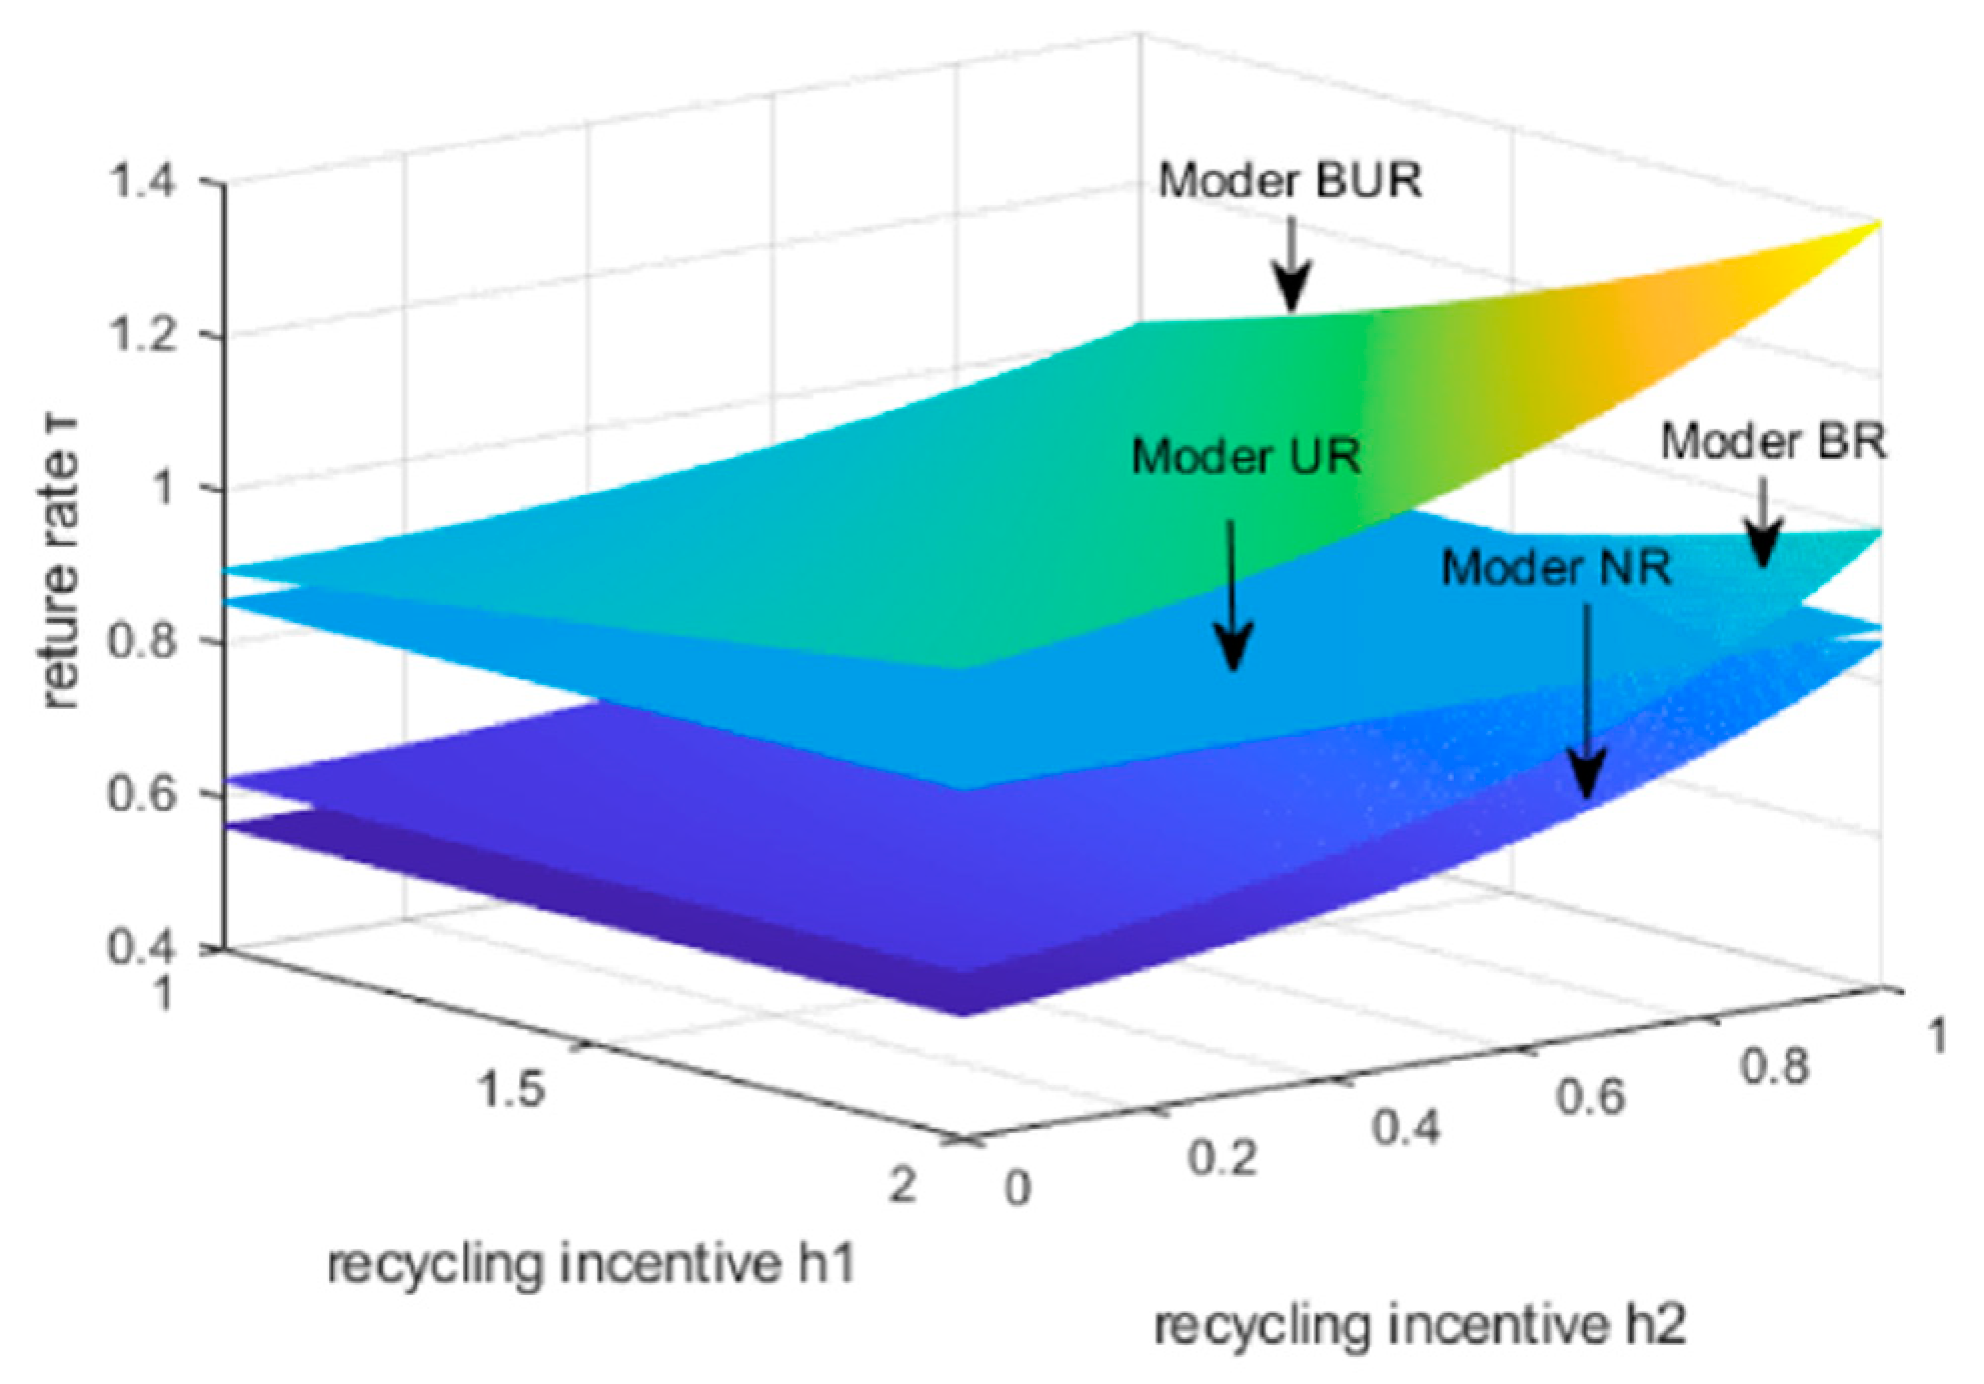
6.3. Analyze the Impact of the BCU Enterprise Incentive Factor h1 and the Retailer Recycling Incentive Factor h2 on Recycling Rates

To establish the relationship between the retailer recycling incentive coefficients (h1) and (h2) and the battery recycling rate, (h1) is assigned values of (1, 2), while (h2) is assigned values of (0, 1). Consequently, the optimal recycling rates for the BUR mode, UR mode, BR mode, and NR mode can be determined based on the variations in (h1) and (h2). As illustrated in Figure 9 the recovery rate of decommissioned traction batteries increases with h1 and h2. The optimal recycling rate for retired traction batteries is highest in the BUR mode, while the optimal recycling rate in the NR mode is the lowest. In the comparisons at lower levels of h1 and h2, the recovery rate of the BR mode is lower than that of the NR mode; however, it surpasses that of the UR mode when the recovery incentive coefficient exceeds the threshold. Several factors may contribute to this observation. Firstly, as retailer recycling incentives at h2 increase, retailers are likely to enhance their investments in traction battery recycling, which positively influences retailer recycling efforts. Secondly, increasing the incentive factor (h1) for BCU firms effectively reduces the recycling cost incentive for these companies. Concurrently, EV battery manufacturers will allocate more resources to enhance battery capacity levels. As battery capacity increases, BCU firms will benefit from additional revenue generated by the enhanced battery capacity, which will in turn encourage further investment in the recycling of retired traction batteries. So the optimal returns for the BCU enterprise are not primarily dependent on recycling incentives provided by the battery manufacturer. Additionally, a comparison of the BUR and UR models indicates that the optimization of recycling costs through blockchain technology positively impacts the recycling of traction batteries.
In conclusion, if EV manufacturers opt for the BUR model, they can appropriately reduce incentives for BCU enterprises while simultaneously increasing R&D investments in the capacitance levels of traction vehicles. This strategic decision will lead to direct and indirect enhancements in the overall traction battery supply chain and improve the recycling rates for retailers and BCU enterprises.

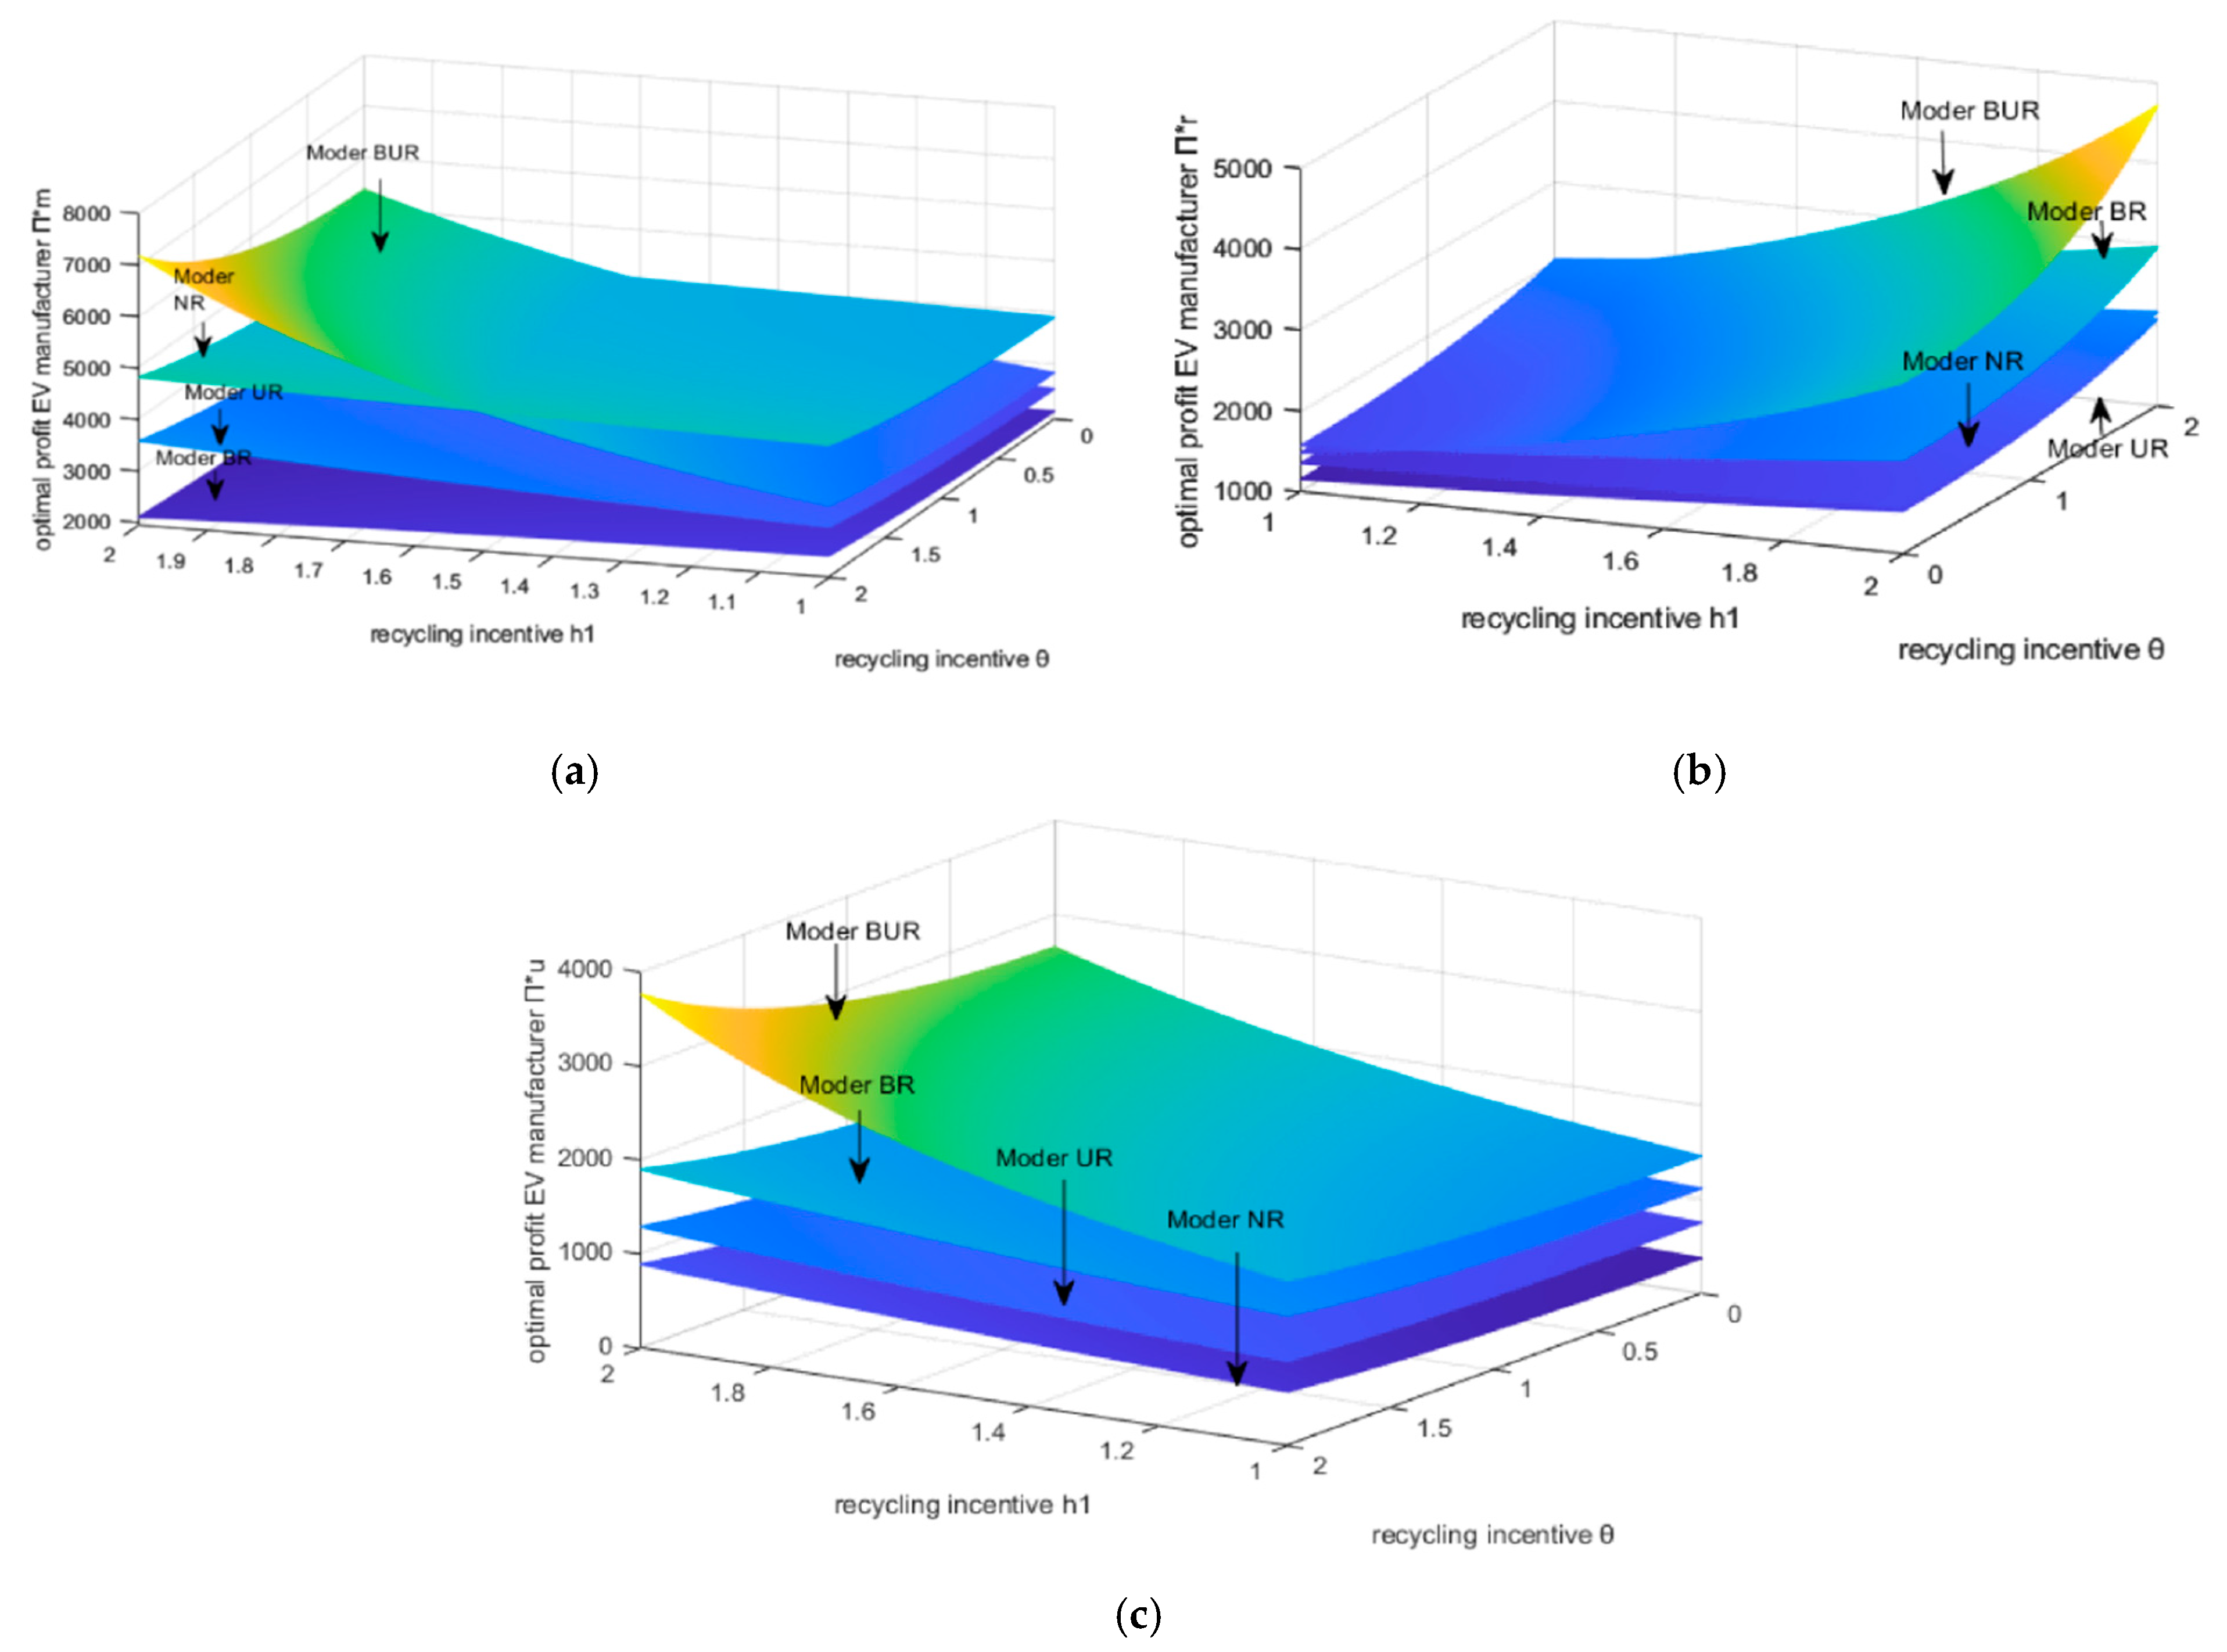
6.4. Analyze the Effects of the Capacitance Level Preference Coefficient θ and the BCU Enterprise Incentive Coefficient h1 on the Maximum Return

Figure 10a–c illustrates the impact of the capacitance level preference coefficient θ on the maximum gain associated with the BCU enterprise recycling incentive h1 and the electric vehicle (EV) range. The figure demonstrates that the maximum gain increases with both the recycling incentive h1 for the BCU enterprise and the capacitance level preference coefficient θ for the EV range. In the BUR model, EV battery manufacturers, EV retailers, and BCU enterprises achieve the greatest benefit. As illustrated in Figure 10a, when the incentive coefficient is relatively low and the market’s capacitance level preference coefficient (θ) is also low, the maximum revenue for the EV battery manufacturer occurs within the NR model. However, once both the incentive coefficient and the capacitance level preference coefficient surpass a certain threshold, the maximum revenue for the manufacturer is realized in the BUR model. The reason is that when consumer preference factors for capacitance levels are relatively low, manufacturers do not need to invest significantly in developing battery capacity. To ensure higher battery recycling rates and increase remanufacturing revenues, manufacturers allocate more resources to battery recycling. At this point, adopting blockchain technology in the battery recycling supply chain may not be optimal, as remanufacturers incur additional costs associated with blockchain implementation. Figure 11 demonstrates when battery manufacturers reduce the recycling incentives for BCU enterprises, the capacity level of traction batteries also rises. As the preference factor for capacitance levels increases, consumers demand greater electric vehicle (EV) range, prompting manufacturers to invest more in the research and development of battery capacitance levels, which in turn reduces incentives for BCU enterprises. Simultaneously, the cost savings from recycling can be integrated into blockchain technology to enhance the efficiency of the recycling supply chain for decommissioned traction batteries. Overall, electric vehicle (EV) manufacturers can optimize their revenue by adjusting the level of incentives for BCU enterprises based on the consumer capacitance level preference coefficient (θ). Furthermore, to enhance the recycling rate of decommissioned traction batteries and improve the overall profitability of the supply chain, the adoption of blockchain technology should be considered.

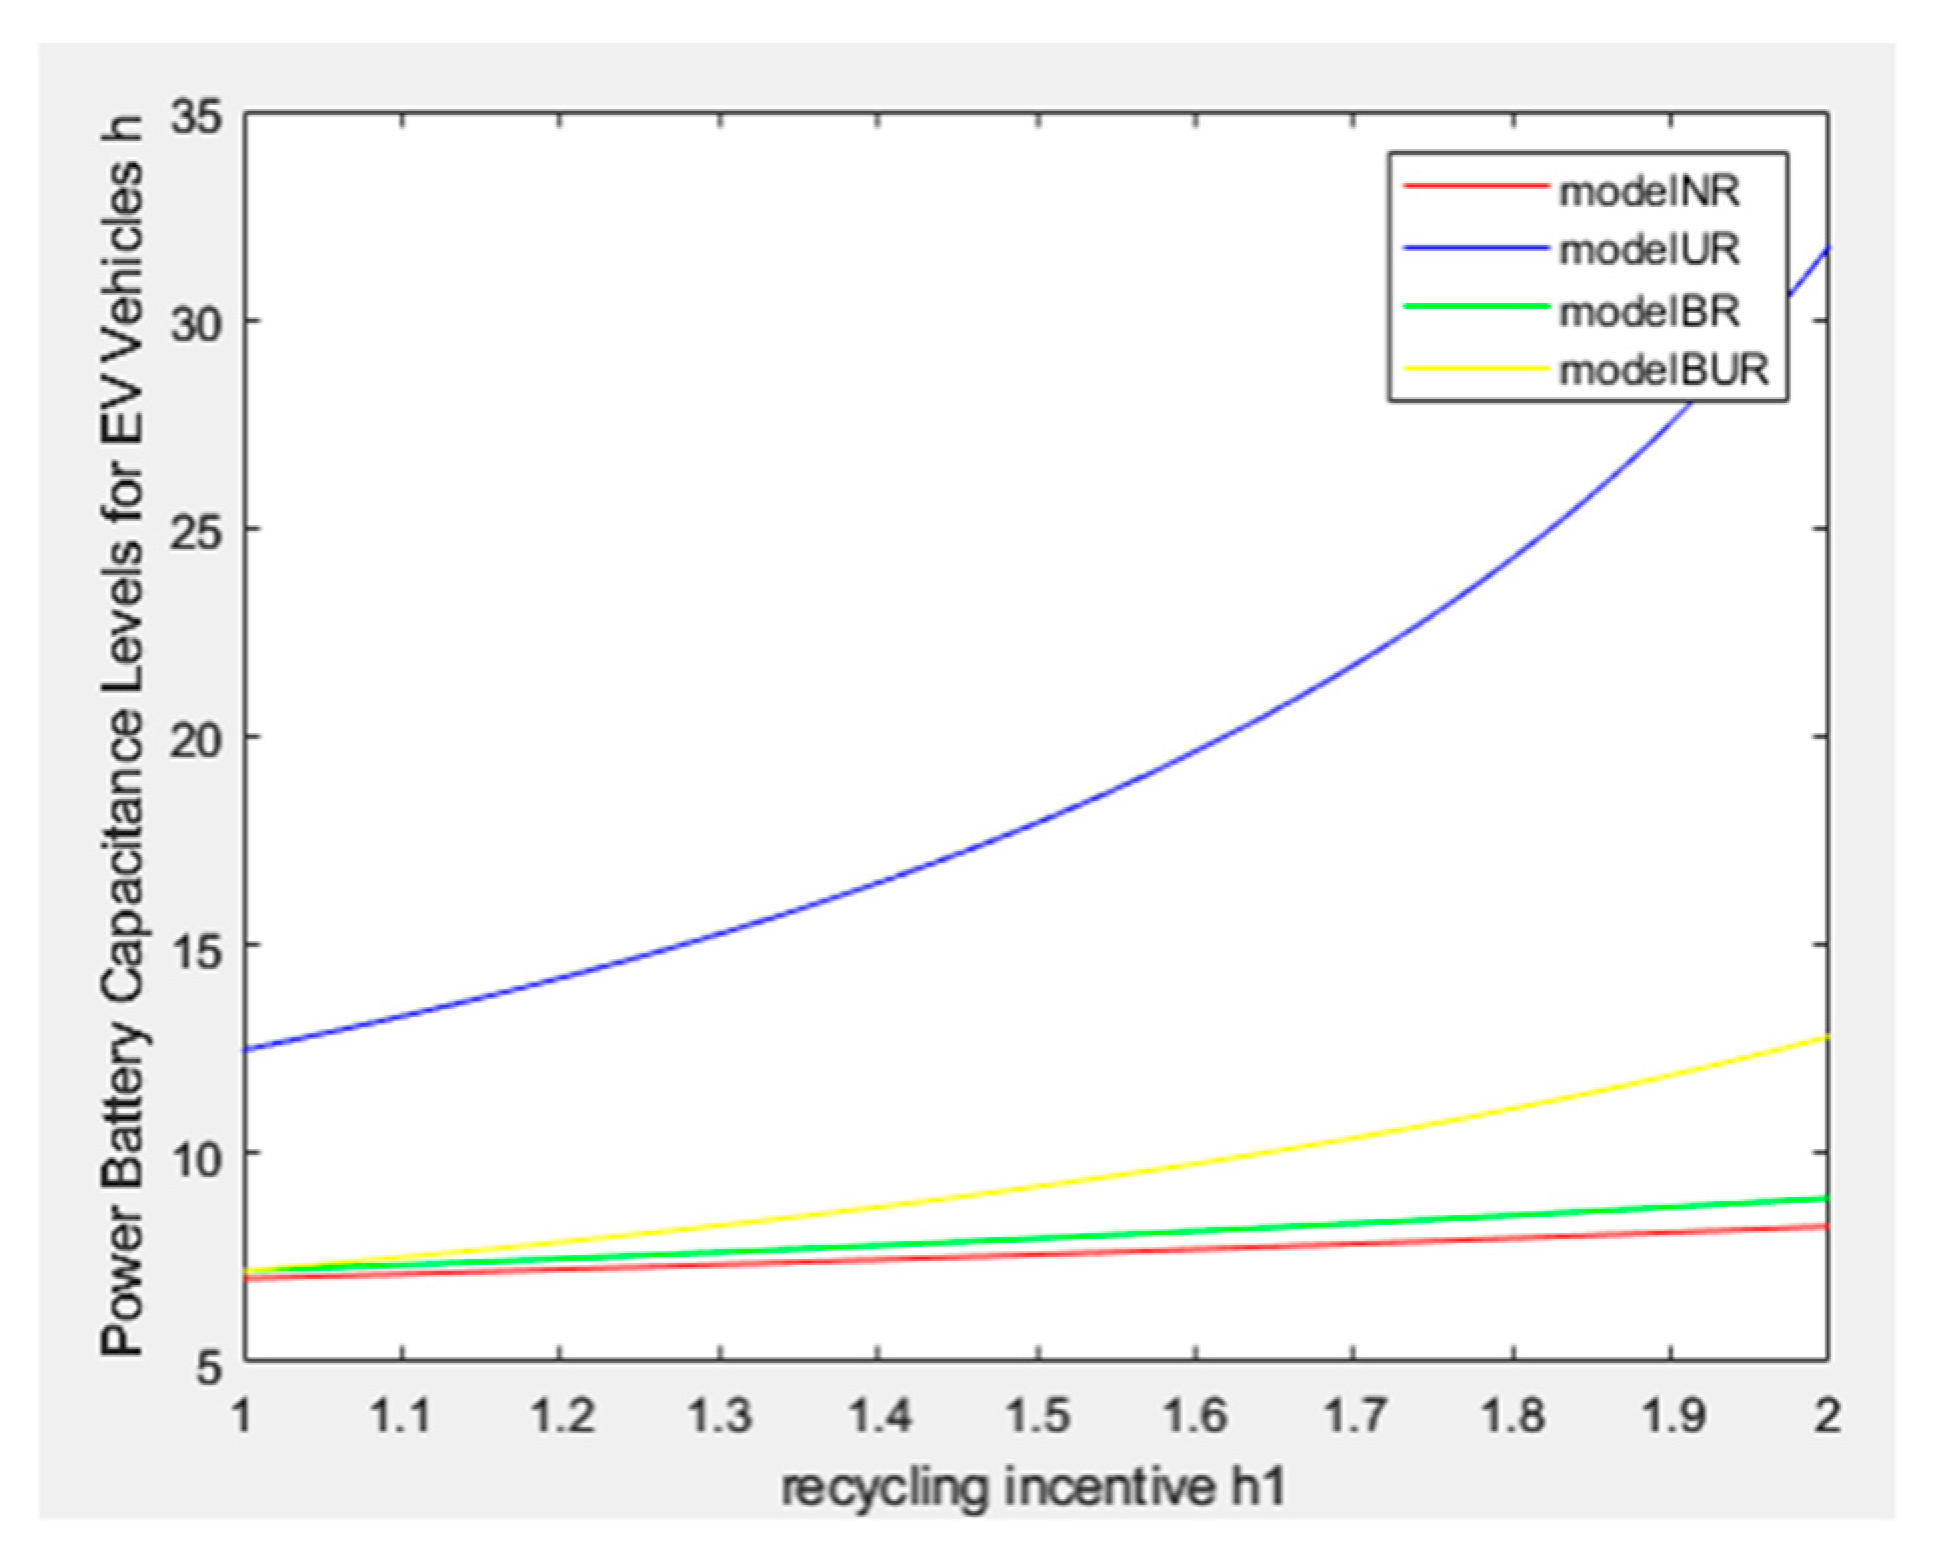
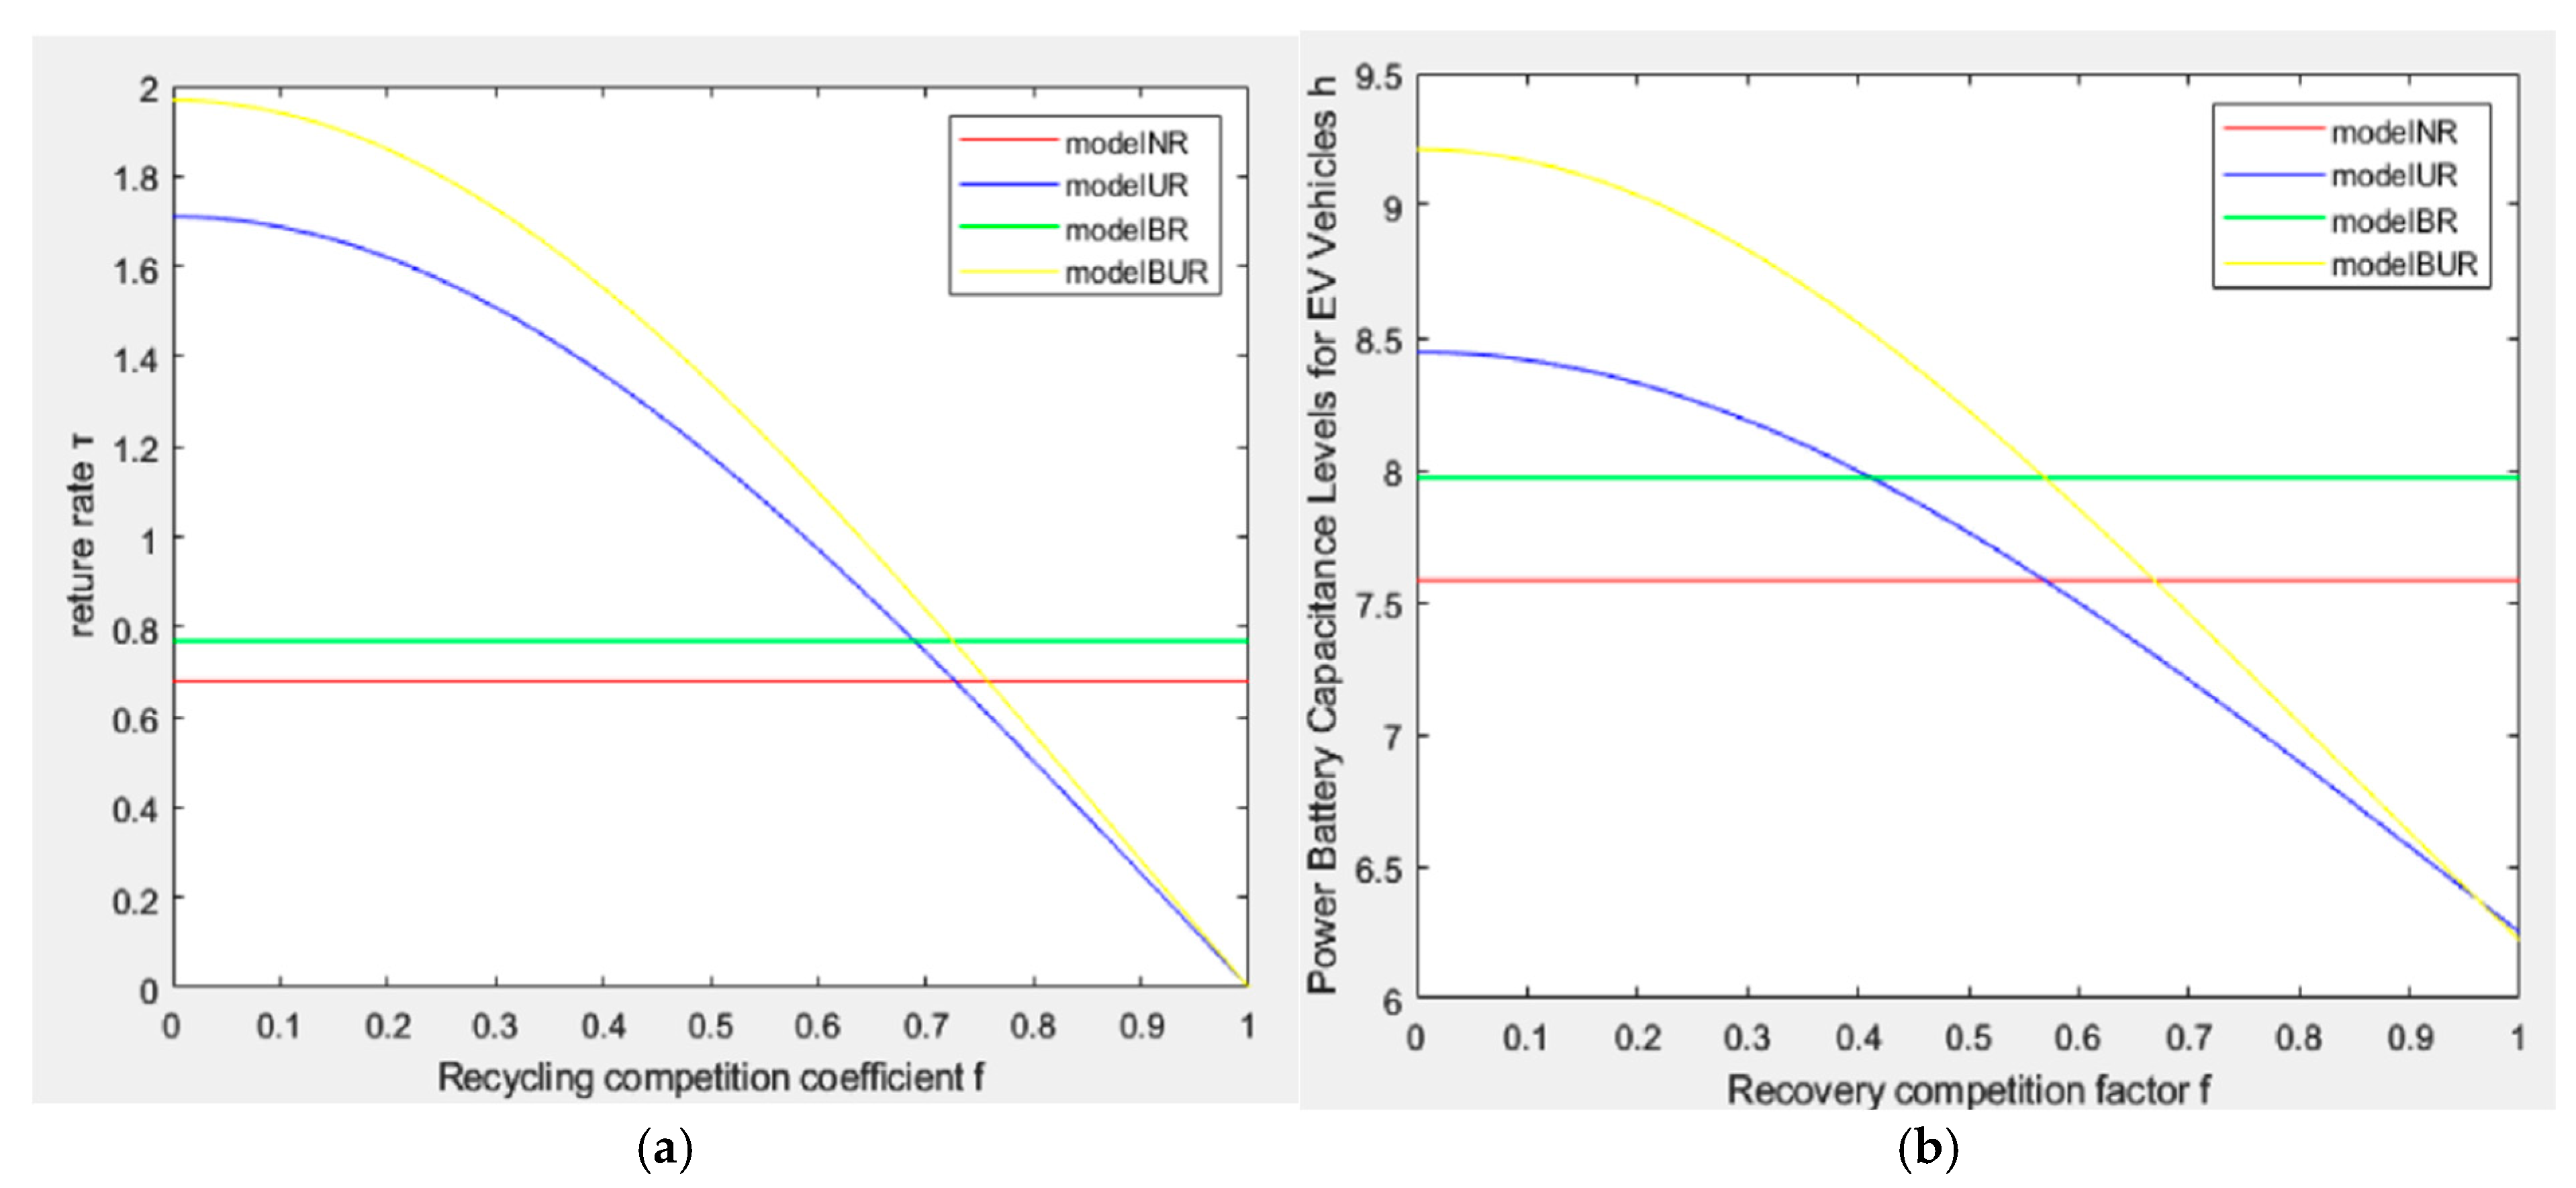
6.5. Analyze the Impact of Recovery Competition on Capacitance Levels and Recovery Rates

From Figure 12a,b, it is evident that the recycling competition coefficient has a significantly negative impact on both the battery recycling rate and the capacitance level. In Figure 12a, the recovery rate of the BUR model at f < 0.69 is notably higher than that of other recovery models. However, as competition for recycling intensifies, the recycling rates for both the BUR and UR models decline significantly. The dual-channel recycling model exhibits a lower recovery rate compared to the single-channel recycling model when f > 0.76. Figure 12b illustrates that the capacitance level reaches optimality in the BUR model for f < 0.57, while in the BR model, optimality is achieved when f > 0.57. Excessive competitive intensity significantly impacts the overall battery supply chain levels of electric vehicle (EV) battery manufacturers, which in turn adversely affects battery capacitance levels. A comparison of the BUR model and the UR model in Figure 12b demonstrates that the battery recycling supply chain, enhanced by the introduction of blockchain technology, is more resilient in navigating a highly competitive environment. When competition for recycling is low, manufacturers are better off opting for the BUR model. Conversely, when competition for recycling is high, manufacturers should choose the BR model.
In conclusion, electric vehicle (EV) manufacturers, as leaders in the supply chain for decommissioned traction batteries, must remain vigilant regarding the intensity of recycling competition. If necessary, they should consider implementing blockchain technology to enhance sharing, traceability, security, and trustworthiness. This approach will help to control the competitive market for recycling decommissioned traction batteries, improve regulation and traceability within the recycling supply chain, and facilitate better communication of recycling information among multiple stakeholders.

7. Summary

In this study, we analyze a decision-making framework that examines how the recycling of traction batteries is influenced by varying levels of consumer demand for electric vehicles with different capacitance levels. Additionally, we evaluate the potential application of blockchain technology in facilitating recycling efforts. Specifically, there are four recycling models that emerge from the dominance of electric vehicle (EV) automotive traction battery manufacturers. These include a separate retailer recycling model (NR) and a joint recycling model (UR) involving the BCU enterprise and the retailer. Two models utilize blockchain technology: the retailer recycling model (BR) and the gradient battery utilization and retailer co-cycling model (BUR). Additionally, the impacts of capacitance level preference coefficients, recycling cost optimization coefficients, and competition coefficients on the recycling rate and battery capacitance level of electric vehicle range are analyzed through equilibrium solving and numerical simulation. Finally, the effects of capacitance level preference coefficients and recovery incentive coefficients on maximum returns are analyzed. The conclusions are as follows:
(1)
The capacitance level preference coefficient of electric vehicle (EV) range positively correlates with the recycling rate of decommissioned traction batteries. Increased demand for higher battery ranges in the EV market facilitates the recycling of these batteries. Higher-capacity batteries enable longer-range EVs, which typically incur higher costs for consumers. Consequently, consumers are incentivized to actively engage in the recycling of retired traction batteries to mitigate some of their EV purchase expenses. Manufacturers can modify the capacitance levels of batteries in response to market preferences and actively encourage consumer participation in the recycling of traction batteries.
(2)
In situations characterized by low competitive intensity, two-pass recycling is generally more advantageous than single-pass recycling. Consequently, manufacturers should typically consider implementing a two-channel recycling program.
(3)
The optimization of recycling costs through blockchain technology will be a significant factor for manufacturers considering its adoption in traction battery recycling. EV battery manufacturers are likely to embrace blockchain technology only when it substantially enhances recycling cost efficiency. Furthermore, in response to market demand for higher capacity levels to extend EV range, manufacturers may contemplate reducing recycling incentive costs for BCU enterprises. The resulting savings can be reinvested into research and development aimed at improving battery capacity levels, increasing the capacity of traction batteries, and implementing blockchain technology to enhance the recycling supply chain for traction batteries.
(4)
Recycling competition negatively impacts the recovery and capacitance levels of traction batteries. Excessive competition in recycling can significantly decrease both the recycling rates and capacitance levels of end-of-life traction batteries. Manufacturers should consider adopting blockchain technology to address these competitive challenges. Numerical analyses indicate that integrating blockchain technology into the recycling supply chain enhances its ability to withstand the pressures of intense recycling competition.
In summary, MATLAB data simulation and analysis demonstrate that blockchain technology can enhance the recovery rates of traction batteries, reduce the costs associated with battery recycling and remanufacturing for electric vehicles, and alleviate market pressure related to electric vehicle range demand. However, currently, the application of blockchain technology is limited to the traction batteries of two-wheeled electric vehicles due to the absence of adequate supporting infrastructure and relevant laws and regulations in the market. It has not yet been widely adopted for the traction batteries of four-wheeled electric vehicles. This paper does not account for the government’s support for manufacturing and recycling enterprises regarding the application of blockchain, IoT, and other technologies, which receive high-tech subsidies. Future research could consider incorporating the government’s high-tech subsidies as a variable in the model. Given that electric vehicle (EV) manufacturers possess a technological advantage in the processing and remanufacturing of traction batteries, some have begun to engage directly in the recycling of these batteries. Therefore, incorporating the recycling efforts of EV manufacturers into the model represents a promising avenue for future research.

Author Contributions

Conceptualization, Y.W. and Y.W.; methodology, Y.W.; software, Y.W.; validation, L.Y. and Y.W.; formal analysis, L.Y.; investigation, Y.W; resources, L.Y.; data curation, Y.W.; writing—original draft preparation, Y.W.; writing—review and editing, Y.W.; visualization, Y.W.; supervision, L.Y.; project administration, L.Y. All authors have read and agreed to the published version of the manuscript.

Funding

This research received no external funding.

Data Availability Statement

The original contributions presented in this study are included in this article; further inquiries can be directed to the corresponding author.

Conflicts of Interest

The author declares no conflicts of interest.

Abbreviations

AbbreviationsIntroduces
BCUEnterprise comprehensive utilization
EOLEnd-of-life
EVElectric Vehicles
NREV retailer recycling model
URCircular supply chain model with dual recycling by BCU enterprises and EV retailers
BREV retailer recycling model using blockchain
BURDual Recycling Supply Chain Model for traction battery recycling by BCU enterprises and EV retailers adopting blockchain

Appendix A

The result of the equation:
1. EV retailer recycling model
w N R = k A + b C n 4 C R b h 2 2 b m 2 2 b A k h 2 h 1 1 b m 2 2 C R θ 2 C n 2 b k 4 C R h 2 b b m 2 h 1 1 + h 2 2 C R θ 2
h N R = C R θ A b C n b k 4 C R h 2 b b m 2 h 1 1 + h 2 C R θ 2
p u N R = b k 4 C R h 2 b b m 2 h 1 1 + h 2 C R θ 2 2 C R R + S c u S b u 2 R 2 C R 2 C R θ λ S A b C n b k 4 C R h 2 b b m 2 h 1 1 + h 2 C R θ 2 4 S C R 2 S 2 b u 2
τ u 1 N R = b k 4 C R h 2 b b m 2 h 1 1 + h 2 C R θ 2 b u R + S c u 2 b u R b u λ S C R θ A b C n b k 4 C R h 2 b b m 2 h 1 1 + h 2 C R θ 2 4 C R 2 S b u 2
p N R = 6 C R A k + 2 C R C n b k θ 2 2 b h 2 b m 2 k A h 2 + h 1 1 2 b k 4 C R h 2 b b m 2 h 1 1 + h 2 2 C R θ 2
τ r N R = b k h 2 b m A b C n 2 b k 4 C R h 2 b b m 2 h 1 1 + h 2 2 C R θ 2
Q N R = 2 C R b k A b C n 2 b k 4 C R h 2 b b m 2 h 1 1 + h 2 2 C R θ 2
Q u N R = b k 4 C R h 2 b b m 2 h 1 1 + h 2 C R θ 2 4 R C R 2 2 C R R 2 C R S c u + 2 C R 2 C R θ λ S A b C n b k 4 C R h 2 b b m 2 h 1 1 + h 2 C R θ 2 4 C R 2 S b u 2
2. Circular supply chain model with dual recycling by BCU enterprises and EV retailers
w U R = k A + b C n 4 C R b h 2 2 b m 2 1 f 2 2 b A k 1 f 2 h 2 + 1 h 1 1 b m 2 2 C R θ 2 C n 2 b k 4 C R b b m 2 h 1 h 2 + h 1 h 2 1 + h 2 2 1 f 2 2 C R θ 2
h U R = C R θ A b C n b k 4 C R b b m 2 h 1 h 2 + h 1 h 2 1 + h 2 2 1 f 2 C R θ 2
p U R = 6 C R A k + 2 C R C n b k θ 2 2 b b m 2 k A h 2 2 + h 1 h 2 + h 1 h 2 1 1 f 2 2 b k 4 C R b b m 2 h 2 2 + h 1 h 2 + h 1 h 2 1 1 f 2 2 C R θ 2
τ r U R = b k h 2 b m 1 f 2 A b C n 2 b k 4 C R b b m 2 h 1 1 + h 2 2 h 2 + h 1 h 2 1 f 2 2 C R θ 2
τ u U R = b k b m A b C n 1 f 2 2 b k 4 C R b b m 2 h 1 1 + h 2 2 h 2 + h 1 h 2 1 f 2 2 C R θ 2
p u U R = 2 C L 2 R + S c u + S b u 2 R b k 4 C R b b m 2 h 1 h 2 + h 1 h 2 1 + h 2 2 C R θ 2 2 C L 2 λ S C R θ A b C n 4 C L 2 S + S 2 b u 2 b k 4 C R b b m 2 h 1 h 2 + h 1 h 2 1 + h 2 2 C R θ 2
τ u 1 U R = R b u S c u R b k 4 C R b b m 2 h 1 h 2 + h 1 h 2 1 + h 2 2 C R θ 2 λ S b u C R θ A b C n b k 4 C R b b m 2 h 1 h 2 + h 1 h 2 1 + h 2 2 C R θ 2 4 C L 2 + S b u 2
Q U R = 2 C R b k A b C n 2 b k 4 C R b b m 2 h 1 1 h 2 + h 2 2 + h 1 h 2 1 f 2 2 C R θ 2
Q u U R = 2 C L 2 R 2 C L 2 S c u b k 4 C R b b m 2 h 1 h 2 + h 1 h 2 1 + h 2 2 C R θ 2 + 2 C L 2 λ S 2 C R θ A b C n 4 C L 2 + S b u 2 b k 4 C R b b m 2 h 1 h 2 + h 1 h 2 1 + h 2 2 C R θ 2
3. EV retailer recycling model using blockchain Model
w B R = k A + b C n + b C b 4 C R η b h 2 2 b m 2 2 b A k h 2 h 1 1 b m 2 2 C R η θ 2 C n + C b 2 b k 4 C R η h 2 b b m 2 h 1 1 + h 2 2 C R η θ 2
h B R = C R η θ A b C n b C b b k 4 C R η h 2 b b m 2 h 1 1 + h 2 C R η θ 2
p u B R = b k 4 η C R h 2 b b m 2 h 1 1 + h 2 η C R θ 2 2 η C R R + S c u S b u 2 R 2 η C R 2 C R θ λ S A b C n b C n b k 4 η C R h 2 b b m 2 h 1 1 + h 2 η C R θ 2 4 S C R 2 S 2 b u 2
p B R = 6 C R η A k + 2 C R η C n + C b b k θ 2 2 b h 2 b m 2 k A h 2 + h 1 1 2 b k 4 C R η h 2 b b m 2 h 1 1 + h 2 2 C R η θ 2
τ r B R = b k h 2 b m A b C b b C n 2 b k 4 C R η h 2 b b m 2 h 1 1 + h 2 2 η C R θ 2
τ u 1 B R = b k 4 η C R h 2 b b m 2 h 1 1 + h 2 η C R θ 2 b u R + S c u 2 b u R b u λ S η C R θ A b C n b C b b k 4 η C R h 2 b b m 2 h 1 1 + h 2 η C R θ 2 4 C R 2 S b u 2
Q B R = 2 C R η b k A b C n b C b 2 b k 4 C R η h 2 b b m 2 h 1 1 + h 2 2 C R η θ 2
Q u B R = 2 C L 2 R 2 C L 2 S c u b k 4 C R η h 2 b b m 2 h 1 1 + h 2 C R θ 2 + 2 C L 2 λ η S 2 C R θ A b C n 4 C L 2 + S b u 2 b k 4 C R η h 2 b b m 2 h 1 1 + h 2 C R η θ 2
4. Dual Recycling Supply Chain Model for traction battery recycling by BCU enterprises and EV retailers adopting blockchain
h B U R = C R η θ A b C n b C n b k 4 C R η b b m 2 h 1 1 h 2 + h 2 2 + h 1 h 2 1 f 2 C R η θ 2
w B U R = k A + b C n + b C b 4 C R η b h 2 2 b m 2 1 f 2 2 b A k h 2 + 1 h 1 1 b m 2 1 f 2 2 C R η θ 2 C n + C b 2 b k 4 C R η b b m 2 h 2 h 1 + h 1 1 h 2 + h 2 2 1 f 2 2 C R η θ 2
p B U R = 6 C R η A k + 2 C R η C n + C b b k θ 2 2 b h 2 b m 2 k A h 2 2 + h 2 h 1 + h 1 h 2 1 1 f 2 2 b k 4 C R η h 2 b b m 2 h 2 2 + h 2 h 1 + h 1 h 2 1 1 f 2 2 C R η θ 2
τ r B U R = h 2 b m b k 1 f 2 A b C n b C b 2 b k 4 C R η b b m 2 h 1 1 + h 2 2 h 2 + h 1 h 2 1 f 2 2 C R η θ 2
q u B U R = 2 C L 2 R + S c u + S b u 2 R b k 4 η C R b b m 2 h 1 h 2 + h 1 h 2 1 + h 2 2 η C R θ 2 2 η C R 2 λ S C R θ A b C n b C b 4 C R 2 S + S 2 b u 2 b k 4 η C R b b m 2 h 1 h 2 + h 1 h 2 1 + h 2 2 η C R θ 2
τ u B U R = b m b k 1 f 2 A b C n b C b 2 b k 4 C R η b b m 2 h 1 1 + h 2 2 h 2 + h 1 h 2 1 f 2 2 C R η θ 2
τ u 1 B U R = R b u S c u R b k 4 η C R b b m 2 h 1 h 2 + h 1 h 2 1 + h 2 2 η C R θ 2 λ S b u η C R θ A b C n b C b b k 4 η C R b b m 2 h 1 h 2 + h 1 h 2 1 + h 2 2 η C R θ 2 4 C R 2 + S b u 2
Q B U R = 2 C R η b k A b C n b C b 2 b k 4 C R η b b m 2 h 1 1 h 2 + h 2 2 + h 1 h 2 1 f 2 2 C R η θ 2
Q u B U R = 2 C L 2 R 2 C L 2 S c u b k 4 η C R b b m 2 h 1 h 2 + h 1 h 2 1 + h 2 2 η C R θ 2 + 2 C L 2 λ η S 2 C R θ A b C n 4 C L 2 + S b u 2 b k 4 η C R b b m 2 h 1 h 2 + h 1 h 2 1 + h 2 2 η C R θ 2
Proof of Proposition 1.
According to the mathematical model 5.1, we use the inverse-order method to first solve the optimization problem for the trapezoidal utilization quotient by finding the first- and second-order derivatives of π u N R with p u and τ u 1 :
d π u d τ u 1 = R b u + S b u p u 2 C R 2 τ u 1 , d π u d p u = R 2 S p u + S c u + S b u τ u 1 d 2 π u d τ u 1 2 = 2 C R 2 , d 2 π u d p u 2 = 2 S , d 2 π u d p u d τ u 1 = b u S
The Hessian matrix for π u N R is derived as
H u N R = d 2 π u d p u 2 d 2 π u d p u d τ u 1 d 2 π u d p u d τ u 1 d 2 π u d τ u 1 2 = 4 S C R 2 S 2 b u 2
For H u N R to be a negative constant, the following two conditions need to be satisfied:
( 1 ) d 2 π u d p u 2 < 0 , n a m e l y 2 S < 0 . ( 1 ) d 2 π u d p u 2 < 0 , n a m e l y 2 S < 0 .
Therefore, when 4 S C R 2 S 2 b u 2 > 0 , H u N R is a negative constant, i.e., the profits of the firms utilizing the ladder are a concave function of p u and τ u 1 . The profit of the firms utilizing the ladder is a concave function of p u and τ u 1 . When d π u d τ u 1 = 0 , a n d , d π u d p u = 0
p u N R = 2 C R 2 ( R + S c u ) S b u 2 R 4 S C R 2 S 2 b u 2 , τ u 1 N R = b u S c u R b u 4 C R 2 S b u 2
According to the mathematical model 5.2, the optimization problem of the EV retailer is first solved using the inverse-order method to find the first- and second-order derivatives of π r N R with p and τ r :
d π r N R d p = A 2 b p + b w b b m h 2 τ r + θ h , d π r N R d τ r = b m h 2 ( A b p + θ h ) 3 C R τ r d 2 π r N R d p 2 = 2 b , d 2 π r N R d τ r 2 = 2 C R , d π r N R d p d τ r = b b m h 2
The Hessian matrix of π r N R is derived as
H r N R = d 2 π r N R d p 2 d π r N R d p d τ r d π r N R d p d τ r d 2 π r N R d τ r 2 = 2 b b b m h 2 b b m h 2 2 C R
For H r N R to be a negative constant, the following conditions need to be satisfied:
( 1 ) d 2 π r N R d p 2 < 0 , namely , 2 b < 0 , ( 2 ) H r N R > 0 , namely 4 b C R b 2 b m 2 h 2 2 > 0 .
When 4 b C R b 2 b m 2 h 2 2 > 0 , H r N R is negatively constant, i.e., the EV retailer’s profit is a concave function of p and τ r . When d π r N R d p = 0 , a n d , d π r N R d τ r = 0
p = 2 C R ( A + b w + θ h ) b b m 2 h 2 2 ( A + θ h ) 4 C R b b 2 b m 2 h 2 2 , τ r = b m h 2 ( A + θ h b w ) 4 C R b b m 2 h 2 2
Bringing p u , τ u 1 , p u , τ r into π w N R , we can solve the first- and second-order derivatives of π w N R at w , a n d , h :
d π m N R d w = 4 C R h 2 b m 2 b ( h 1 1 ) ( b w A θ h ) + 2 C R ( A + θ h + b C n 2 b w ) ( 4 C R b h 2 2 b m 2 ) 4 C R b h 2 2 b m 2 2 , d 2 π m N R d w 2 = 4 b C R b h 2 b m 2 ( h 1 1 + h 2 ) 4 C R ( 4 C R b h 2 2 b m 2 ) 2 d π m N R d h = 4 C R b m 2 b 2 ( h 1 1 ) 4 b C R ( 4 C R b h 2 2 b m 2 ) ( 4 C R b h 2 2 b m 2 ) 2 , d 2 π m N R d h 2 = 4 C R b m 2 h 2 θ 2 ( h 1 1 ) ( 4 C R b h 2 2 b m 2 ) 2 , d 2 π m N R d w d h = 2 C R θ 4 C R b h 2 b m 2 ( h 2 + 2 h 1 2 ) ( 4 C R b h 2 2 b m 2 ) 2
For H m N R to be a negative constant, the following conditions need to be satisfied:
( 1 ) d 2 π m N R d w 2 < 0 , n a m e l y , b h 2 b m 2 ( h 1 1 + h 2 ) < 4 C R . ( 2 ) H m N R > 0 , n a m e l y , b k 4 C R b h 2 b m 2 ( h 1 + h 2 1 ) > C R θ 2 .
When b k 4 C R b h 2 b m 2 ( h 1 + h 2 1 ) > C R θ 2 , H m N R is negative definite, i.e., the profit of the EV manufacturer is related to w and h as a concave function. When d π m N R d w = 0 , a n d , d π m N R d h = 0 , we can obtain the optimal corresponding function for the EV manufacturer as follows:
w N R = k A + b C n 4 C R b h 2 2 b m 2 2 b A k h 2 ( h 1 1 ) b m 2 2 C R θ 2 C n 2 b k 4 C R h 2 b b m 2 ( h 1 1 + h 2 ) 2 C R θ 2 h N R = C R θ ( A b C n ) b k 4 C R h 2 b b m 2 ( h 1 1 + h 2 ) C R θ 2
Bringing w N R a n d , h N R into p u , τ u 1 , p u , τ r , for w, we find the optimal decision for each member:
p u N R = b k 4 C R h 2 b b m 2 ( h 1 1 + h 2 ) C R θ 2 2 C R ( R + S c u ) S b u 2 R 2 C R 2 C R θ λ S ( A b C n ) b k 4 C R h 2 b b m 2 ( h 1 1 + h 2 ) C R θ 2 4 S C R 2 S 2 b u 2 τ u 1 N R = b k 4 C R h 2 b b m 2 ( h 1 1 + h 2 ) C R θ 2 b u ( R + S c u ) 2 b u R b u λ S C R θ ( A b C n ) b k 4 C R h 2 b b m 2 ( h 1 1 + h 2 ) C R θ 2 4 C R 2 S b u 2 p N R = 6 C R A k + 2 C R C n ( b k θ 2 ) 2 b h 2 b m 2 k A ( h 2 + h 1 1 ) 2 b k 4 C R h 2 b b m 2 ( h 1 1 + h 2 ) 2 C R θ 2 τ r N R = b k h 2 b m ( A b C n ) 2 b k 4 C R h 2 b b m 2 ( h 1 1 + h 2 ) 2 C R θ 2
Bringing p N R a n d , h N R into Q N R = A b p + θ h , p u N R will be brought into the Q u = R S p u . Thus, we can obtain
Q N R = 2 C R b k A b C n 2 b k 4 C R h 2 b b m 2 ( h 1 1 + h 2 ) 2 C R θ 2 Q u N R = b k 4 C R h 2 b b m 2 ( h 1 1 + h 2 ) C R θ 2 4 S R C R 2 S 2 b u 2 R 2 C R R 2 C R S c u + S b u 2 R + 2 C R 2 C R θ λ S ( A b C n ) b k 4 C R h 2 b b m 2 ( h 1 1 + h 2 ) C R θ 2 4 S C R 2 S 2 b u 2
Bringing the above optimal decision to π m N R , π r N R , π u N R , we can obtain the maximum profit: H u U R :
π m N R = w N R C n + ( C n c m b m ) τ r N R Q N R 1 2 k ( h N R ) 2 π r N R = [ p N R w N R + ( b r c e ) τ r N R ] Q N R C ( τ r N R ) 2 π u N R = ( b m b r ) τ r N R Q + [ p u N R c u τ u 1 N R b u ] Q u N R + λ h N R Q u N R C R 2
Proof of Proposition 2.
The proof procedure is similar to Proposition 1, so we can obtain the Hessian matrix of the H u U R :
H u U R = d 2 π u d p u 2 d 2 π u d p u d τ u 1 d 2 π u d p u d τ u d 2 π u d p u d τ u 1 d 2 π u d τ u 1 2 d 2 π u d τ u d τ u 1 d 2 π u d p u d τ u d 2 π u d τ u d τ u 1 d 2 π u d τ u 2 = 2 S S b u 0 S b u 2 C R 2 0 0 0 2 C R 1 f 2
For H u U R to be a negative constant, the following conditions need to be satisfied:
( 1 ) d 2 π u d p u 2 < 0 , n a m e l y , 2 S < 0 . ( 2 ) d 2 π u d p u 2 × d 2 π u d τ u 1 2 d 2 π u d p u d τ u 1 × d 2 π u d p u d τ u 1 > 0 , n a m e l y , 4 S C R 2 S 2 b u 2 > 0 . ( 3 ) H u U R < 0 , n a m e l y , 4 S C R 2 S 2 b u 2 > 0 .
When 4 S C R 2 S 2 b u 2 > 0 , H u U R is negatively constant, i.e., the profit of the ladder utilizer is a concave function of p u , τ u 1 , τ u .
The second-order derivative of π m U R at w is d 2 π r U R d w 2 < 0 , i.e., 2 b < 0 . By showing that the retailer’s maximum profit is a concave function for p U R , we can then obtain the Hessian matrix for H r U R and the Hessian matrix for w:
H r U R = d 2 π r U R d p 2 d 2 π r U R d p d τ r d 2 π r U R d p d τ r d 2 π r U R d τ r 2 = 2 b b b m h 2 b b m h 2 2 C R 1 f 2
For H r U R to be a negative constant, the following conditions need to be satisfied:
( 1 ) d 2 π r U R d p 2 < 0 n a m e l y , 2 b < 0 . ( 2 ) H r U R > 0 , n a m e l y , 4 b C R 1 f 2 b 2 b m 2 h 2 2 > 0 .
When 4 b C R 1 f 2 b 2 b m 2 h 2 2 > 0 , H r U R is negative definite, i.e., the profit of the ladder utilizer is a concave function of p , τ r h .
The second-order derivative of π m U R at w is d 2 π r U R d w 2 < 0 , i.e., 4 b C R ( 1 f 2 ) ( h 1 h 2 + h 1 h 2 + h 2 2 1 ) 4 C R 4 C R b b m 2 h 2 2 ( 1 f 2 ) 2 . Showing that the retailer’s maximum profit is a concave function for p U R , we can then obtain the Hessian matrix for H m U R :
H m U R = d 2 π m U R d w 2 d 2 π m U R d w d h d 2 π m U R d w d h d 2 π m U R d h 2 = 4 b C R ( 1 f 2 ) ( h 1 h 2 + h 1 h 2 + h 2 2 1 ) 4 C R 4 C R b b m 2 h 2 2 ( 1 f 2 ) 2 2 θ C R 4 C R b b m 2 ( 1 f 2 ) ( h 1 h 2 + h 1 h 2 + h 2 2 1 ) 4 C R b b m 2 h 2 2 ( 1 f 2 ) 2 2 θ C R 4 C R b b m 2 ( 1 f 2 ) ( h 1 h 2 + h 1 h 2 + h 2 2 1 ) 4 C R b b m 2 h 2 2 ( 1 f 2 ) 2 4 C R b m 2 θ 2 ( 1 f 2 ) ( h 1 h 2 + h 1 h 2 + h 2 2 1 ) 4 C R b b m 2 h 2 2 ( 1 f 2 ) 2
When b k 4 C R b b m 2 ( h 2 2 + h 2 h 1 h 2 + h 1 1 ) ( 1 f 2 ) C R θ 2 , H r U R is negative definite, i.e., the profit of the ladder utilizer is a concave function of p , τ r h . Then, according to the first-order derivative, we can obtain the optimal decision and maximum profit for each member of the large:
w U R = k A + b C n 4 C R b h 2 2 b m 2 1 f 2 2 b A k ( 1 f 2 ) h 2 + 1 ( h 1 1 ) b m 2 2 C R θ 2 C n 2 b k 4 C R b b m 2 ( h 1 h 2 + h 1 h 2 1 + h 2 2 ) ( 1 f 2 ) 2 C R θ 2 h U R = C R θ ( A b C n ) b k 4 C R b b m 2 ( h 1 h 2 + h 1 h 2 1 + h 2 2 ) ( 1 f 2 ) C R θ 2 p U R = 6 C R A k + 2 C R C n ( b k θ 2 ) 2 b b m 2 k A ( h 2 2 + h 1 h 2 + h 1 h 2 1 ) ( 1 f 2 ) 2 b k 4 C R b b m 2 ( h 2 2 + h 1 h 2 + h 1 h 2 1 ) ( 1 f 2 ) 2 C R θ 2 τ r U R = b k h 2 b m ( 1 f 2 ) ( A b C n ) 2 b k 4 C R b b m 2 ( h 1 1 + h 2 2 h 2 + h 1 h 2 ) ( 1 f 2 ) 2 C R θ 2 τ u U R = b k b m ( A b C n ) ( 1 f 2 ) 2 b k 4 C R b b m 2 ( h 1 1 + h 2 2 h 2 + h 1 h 2 ) ( 1 f 2 ) 2 C R θ 2 p u U R = 2 C L 2 ( R + S c u ) + S b u 2 R b k 4 C R b b m 2 ( h 1 h 2 + h 1 h 2 1 + h 2 2 ) C R θ 2 2 C L 2 λ S C R θ ( A b C n ) 4 C L 2 S + S 2 b u 2 b k 4 C R b b m 2 ( h 1 h 2 + h 1 h 2 1 + h 2 2 ) C R θ 2 τ u 1 U R = ( R b u S c u R ) b k 4 C R b b m 2 ( h 1 h 2 + h 1 h 2 1 + h 2 2 ) C R θ 2 λ S b u C R θ ( A b C n ) b k 4 C R b b m 2 ( h 1 h 2 + h 1 h 2 1 + h 2 2 ) C R θ 2 ( 4 C L 2 + S b u 2 ) Q U R = 2 C R b k A b C n 2 b k 4 C R b b m 2 ( h 1 1 h 2 + h 2 2 + h 1 h 2 ) ( 1 f 2 ) 2 C R θ 2 Q u U R = 4 C L 2 S R + S 2 b u 2 R 2 C L 2 S R 2 C L 2 S 2 c u S 2 b u 2 R b k 4 C R b b m 2 ( h 1 h 2 + h 1 h 2 1 + h 2 2 ) C R θ 2 + 2 C L 2 λ S 2 C R θ ( A b C n ) 4 C L 2 S + S 2 b u 2 b k 4 C R b b m 2 ( h 1 h 2 + h 1 h 2 1 + h 2 2 ) C R θ 2
π m U R = w U R c n + ( c n c m b m ) ( τ r U R + τ u U R ) Q U R 1 2 k ( h U R ) 2 π r U R = [ p U R w U R + ( b r c e ) τ r U R ] Q U R C L ( τ r U R ) 2 + C L f ( τ u U R ) 2 1 f 2 π u U R = ( b m c e ) τ u U R Q U R + ( b m b r ) τ r U R Q U R + [ p u U R c u τ u 1 U R b u ] Q u U R + λ h U R Q u U R C L ( τ u U R ) 2 + C L f ( τ r U R ) 2 1 f 2 C L ( τ u 1 U R ) 2
Proof of Proposition 3.
Similar to the proof of Propositions 1–2, the second-order derivative of π u B R at p u is d 2 π r U R d w 2 < 0 , i.e., 2 S < 0 .By showing that the retailer’s maximum profit is a concave function for p B R , we can then obtain the Hessian matrix of H u B R :
H u B R = d 2 π u d p u 2 d 2 π u d p u d τ u 1 d 2 π u d p u d τ u 1 d 2 π u d τ u 1 2 = 4 S C R 2 S 2 b u 2
For H u B R to be a negative constant, the following conditions need to be satisfied:
( 1 ) d 2 π r U R d w 2 < 0 , namely , 2 S < 0 . ( 2 ) H u B R < 0 , n a m e l y , 4 S C R 2 S 2 b u 2 .
When 4 S C R 2 S 2 b u 2 > 0 , H u B R is negatively constant, i.e., the profit of the ladder utilizer is a concave function of p u , τ u 1 .
The second-order derivative of π r B R at p is d 2 π r B R d p 2 < 0 , i.e., 2 C R η < 0 . By showing that the retailer’s maximum profit is a concave function for p B R , we can then obtain the Hessian matrix for H r B R :
H r B R = d 2 π r B R d p 2 d π r B R d p d τ r d π r B R d p d τ r d 2 π r B R d τ r 2 = 2 b b b m h 2 b b m h 2 2 η C R
For H r B R to be a negative constant, the following conditions need to be satisfied:
( 1 ) d 2 π r B R d p 2 < 0 n a m e l y , 2 C R η < 0 . ( 2 ) H r B R > 0 n a m e l y , 4 b η C R b 2 b m 2 h 2 2 > 0 .
4 b η C R b 2 b m 2 h 2 2 > 0 .   H r B R is negatively constant, i.e., the profit of the ladder utilizer is a concave function of p , τ r .
The second-order derivative of π m B R at w is d 2 π r B R d w 2 < 0 , i.e., 2 C R η < 0 . By showing that the retailer’s maximum profit is a concave function for p B R , we can then obtain the Hessian matrix for H r B R :
H m B R = d 2 π m B R d w 2 d 2 π m B R d w d h d 2 π m B R d w d h d 2 π m B R d h 2 = 4 b C R η b h 2 b m 2 ( h 1 1 + h 2 ) 4 C R η ( 4 C R η b h 2 2 b m 2 ) 2 2 C R η θ 4 C R η b h 2 b m 2 ( h 2 + 2 h 1 2 ) ( 4 C R η b h 2 2 b m 2 ) 2 2 C R η θ 4 C R η b h 2 b m 2 ( h 2 + 2 h 1 2 ) ( 4 C R η b h 2 2 b m 2 ) 2 4 C R η b m 2 h 2 θ 2 ( h 1 1 ) ( 4 C R η b h 2 2 b m 2 ) 2
For H m B R to be a negative constant, the following conditions need to be satisfied:
( 1 ) d 2 π r B R d w 2 < 0 , n a m e l y , 2 C R η < 0 . ( 2 ) H m B R > 0 , n a m e l y , b k 4 C R η b h 2 b m 2 ( h 1 + h 2 1 ) C R η θ 2 .
When b k 4 C R η b h 2 b m 2 ( h 1 + h 2 1 ) C R η θ 2 , H m B R is negative definite, i.e., the profit of the ladder utilizer is a concave function of w , p . Then, according to the first-order derivative, we can obtain the optimal decision and maximum profit for each member of the large:
w B R = k A + b C n + b C b 4 C R η b h 2 2 b m 2 2 b A k h 2 ( h 1 1 ) b m 2 2 C R η θ 2 ( C n + C b ) 2 b k 4 C R η h 2 b b m 2 ( h 1 1 + h 2 ) 2 C R η θ 2 h B R = C R η θ ( A b C n b C b ) b k 4 C R η h 2 b b m 2 ( h 1 1 + h 2 ) C R η θ 2 p u B R = b k 4 η C R h 2 b b m 2 ( h 1 1 + h 2 ) η C R θ 2 2 η C R ( R + S c u ) S b u 2 R 2 η C R 2 C R θ λ S ( A b C n b C n ) b k 4 η C R h 2 b b m 2 ( h 1 1 + h 2 ) η C R θ 2 4 S C R 2 S 2 b u 2 p B R = 6 C R η A k + 2 C R η ( C n + C b ) ( b k θ 2 ) 2 b h 2 b m 2 k A ( h 2 + h 1 1 ) 2 b k 4 C R η h 2 b b m 2 ( h 1 1 + h 2 ) 2 C R η θ 2 τ r B R = b k h 2 b m A b C b b C n 2 b k 4 C R η h 2 b b m 2 ( h 1 1 + h 2 ) 2 η C R θ 2 τ u 1 B R = b k 4 η C R h 2 b b m 2 ( h 1 1 + h 2 ) η C R θ 2 b u ( R + S c u ) 2 b u R b u λ S η C R θ ( A b C n b C b ) b k 4 η C R h 2 b b m 2 ( h 1 1 + h 2 ) η C R θ 2 4 C R 2 S b u 2 Q B R = 2 C R η b k A b C n b C b 2 b k 4 C R η h 2 b b m 2 ( h 1 1 + h 2 ) 2 C R η θ 2 Q u B R = b k 4 η C R h 2 b b m 2 ( h 1 1 + h 2 ) η C R θ 2 4 R C R 2 S b u 2 R 2 η C R ( R + S c u ) S b u 2 R + 2 η C R 2 C R θ λ S ( A b C n b C n ) b k 4 η C R h 2 b b m 2 ( h 1 1 + h 2 ) η C R θ 2 4 C R 2 S b u 2
π m B R = w B R C n C b + ( c n c m b m ) τ r B R Q B R 1 2 k ( h B R ) 2 π r B R = [ p B R w B R + ( b r c e ) τ r B R ] Q B R η C R ( τ r B R ) 2 π u B R = ( b m c e ) τ r B R Q B R + [ p u B R c u τ u 1 B R b u ] Q u B R + λ h B R Q u B R ( τ u 1 B R ) 2 C L 2
Proof of Proposition 4.
Similar to the proofs of Propositions 1–3, the second-order derivative of π m B U R at p u is d 2 π u B U R d p u 2 < 0 , i.e., 2 S < 0 . By showing that the retailer’s maximum profit is a concave function for p u B U R , we can then obtain the Hessian matrix of H u B U R :
H u B U R = d 2 π u B U R d p u 2 d 2 π u B U R d p u d τ u 1 d 2 π u B U R d p u d τ u d 2 π u B U R d p u d τ u 1 d 2 π u B U R d τ u 1 2 d 2 π u B U R d τ u d τ u 1 d 2 π u B U R d p u d τ u d 2 π u B U R d τ u d τ u 1 d 2 π u B U R d τ u 2 = 2 S S b u 0 S b u 2 C R 2 0 0 0 2 η C R 1 f 2
For H u B U R to be a negative constant, the following conditions need to be satisfied:
( 1 ) d 2 π u B U R d p u 2 < 0 , n a m e l y , 2 S < 0 . ( 2 ) d 2 π u d p u 2 × d 2 π u d τ u 1 2 d 2 π u d p u d τ u 1 × d 2 π u d p u d τ u 1 > 0 , n a m e l y , 4 S C R 2 S 2 b u 2 > 0 . ( 3 ) H u B U R < 0 , n a m e l y , 4 S C R 2 S 2 b u 2 > 0 .
When 4 S C R 2 S 2 b u 2 > 0 , H u B U R is negatively definite, i.e., the profit of a ladder utilizer is a concave function of τ u 1 , p u , τ u .
We obtain the second-order derivative of π r B U R at p , τ r , and then we can obtain the Hessian matrix of H r B U R :
H r B U R = d 2 π r B U R d p 2 d 2 π r B U R d p d τ r d 2 π r B U R d p d τ r d 2 π r B U R d τ r 2 = 2 b b b m h 2 b b m h 2 2 η C R 1 f 2
For H r B U R to be a negative constant, the following conditions need to be satisfied:
( 1 ) d 2 π r B U R d p 2 < 0 , n a m e l y 2 b < 0 . ( 2 ) H r B U R > 0 , n a m e l y , 4 b η C R 1 f 2 b 2 b m 2 h 2 2 > 0 .
When 4 b η C R 1 f 2 b 2 b m 2 h 2 2 > 0 , H r B U R is negatively constant, i.e., the profit of the ladder utilizer is a concave function of p , τ r .
We obtain the second-order derivative of π m B U R at w , h , and then we can obtain the Hessian matrix of H m B U R :
H m B U R = d 2 π m B U R d w 2 d 2 π m B U R d w d h d 2 π m B U R d w d h d 2 π m B U R d h 2 = 4 b C R η ( 1 f 2 ) ( h 1 h 2 + h 1 h 2 + h 2 2 1 ) 4 C R η 4 C R η b b m 2 h 2 2 ( 1 f 2 ) 2 2 θ C R η 4 C R η b b m 2 ( 1 f 2 ) ( h 1 h 2 + h 1 h 2 + h 2 2 1 ) 4 C R η b b m 2 h 2 2 ( 1 f 2 ) 2 2 θ C R η 4 C R η b b m 2 ( 1 f 2 ) ( h 1 h 2 + h 1 h 2 + h 2 2 1 ) 4 C R η b b m 2 h 2 2 ( 1 f 2 ) 2 4 C R η b m 2 θ 2 ( 1 f 2 ) ( h 1 h 2 + h 1 h 2 + h 2 2 1 ) 4 C R η b b m 2 h 2 2 ( 1 f 2 ) 2
For H m B U R to be a negative constant, the following conditions need to be satisfied:
( 1 ) d π m B U R d w 2 < 0 , n a m e l y , 4 b C R η ( 1 f 2 ) ( h 1 h 2 + h 1 h 2 + h 2 2 1 ) 4 η C R 4 η C R b b m 2 h 2 2 ( 1 f 2 ) 2 . ( 2 ) H m B U R > 0 , n a m e l y , b k 4 C R η b b m 2 ( h 2 2 + h 2 h 1 h 2 + h 1 1 ) ( 1 f 2 ) C R η θ 2 .
When b k 4 C R η b b m 2 ( h 2 2 + h 2 h 1 h 2 + h 1 1 ) ( 1 f 2 ) C R η θ 2 , H m B U R is negative definite, i.e., the profit of the ladder utilizer is a concave function of m , h . According to the first-order derivative, we can obtain the optimal decision and the maximum return of each as follows:
h B U R = C R η θ ( A b C n b C n ) b k 4 C R η b b m 2 ( h 1 1 h 2 + h 2 2 ) 1 f 2 C R η θ 2 w B U R = k A + b C n + b C b 4 C R η b h 2 2 b m 2 1 f 2 2 b A k ( h 2 + 1 ) ( h 1 1 ) b m 2 1 f 2 2 C R η θ 2 ( C n + C b ) 2 b k 4 C R η b b m 2 ( h 2 h 1 + h 1 1 h 2 + h 2 2 ) ( 1 f 2 ) 2 C R η θ 2 p B U R = 6 C R η A k + 2 C R η ( C n + C b ) ( b k θ 2 ) 2 b h 2 b m 2 k A ( h 2 2 + h 2 h 1 + h 1 h 2 1 ) ( 1 f 2 ) 2 b k 4 C R η h 2 b b m 2 ( h 2 2 + h 2 h 1 + h 1 h 2 1 ) ( 1 f 2 ) 2 C R η θ 2 τ r B U R = h 2 b m b k ( 1 f 2 ) ( A b C n b C b ) 2 b k 4 C R η b b m 2 ( h 1 1 + h 2 2 h 2 + h 1 h 2 ) ( 1 f 2 ) 2 C R η θ 2 p u B U R = 2 C L 2 ( R + S c u ) + S b u 2 R b k 4 η C R b b m 2 ( h 1 h 2 + h 1 h 2 1 + h 2 2 ) η C R θ 2 2 η C L 2 λ S C R θ ( A b C n b C b ) 4 C L 2 S + S 2 b u 2 b k 4 η C R b b m 2 ( h 1 h 2 + h 1 h 2 1 + h 2 2 ) η C R θ 2 τ u B U R = b m b k ( 1 f 2 ) ( A b C n b C b ) 2 b k 4 C R η b b m 2 ( h 1 1 + h 2 2 h 2 + h 1 h 2 ) ( 1 f 2 ) 2 C R η θ 2 τ u 1 B U R = ( R b u S c u R ) b k 4 η C R b b m 2 ( h 1 h 2 + h 1 h 2 1 + h 2 2 ) η C R θ 2 λ S b u η C R θ ( A b C n b C b ) b k 4 η C R b b m 2 ( h 1 h 2 + h 1 h 2 1 + h 2 2 ) η C R θ 2 ( 4 C L 2 + S b u 2 ) Q B U R = 2 C R η b k A b C n b C b 2 b k 4 C R η b b m 2 ( h 1 1 h 2 + h 2 2 + h 1 h 2 ) ( 1 f 2 ) 2 C R η θ 2 Q u B U R = 4 R C L 2 + R S b u 2 2 C L 2 ( R + S c u ) S b u 2 R b k 4 η C R b b m 2 ( h 1 h 2 + h 1 h 2 1 + h 2 2 ) η C R θ 2 + 2 η C L 2 λ S C R θ ( A b C n b C b ) 4 C L 2 + S b u 2 b k 4 η C R b b m 2 ( h 1 h 2 + h 1 h 2 1 + h 2 2 ) η C R θ 2
π m B U R = w B U R c n C b + ( c n c m b m ) ( τ r B U R + τ u B U R ) Q B U R 1 2 k ( h B U R ) 2 π r B U R = [ p B U R w B U R + ( b r c e ) τ r B U R ] Q B U R C R η ( τ r B U R ) 2 + C R η f ( τ u B U R ) 2 1 f 2 π u B U R = ( b m c e ) τ u B U R Q B U R + ( b m b r ) τ r B U R Q B U R + [ p u B U R c u τ u 1 B U R b u ] Q u B U R + λ h B U R Q u B U R τ u 1 2 C L 2 C R η ( τ u B U R ) 2 + C R η f ( τ r B U R ) 2 1 f 2
Proof of Corollary 1 and Corollary 3.
After calculating the first-order derivatives of the retailer recovery rate τ r , the traction cell capacitance level h , and the traction cell market demand Q with respect to the capacitance level preference coefficient θ for the four modes, we obtain
d h B U R d θ = C R η ( A b C n b C b ) b k 4 C R η b b m 2 ( h 2 2 + h 1 1 h 2 + h 2 h 1 ) + C R η θ 2 b k 4 C R η b b m 2 ( h 2 2 + h 1 1 h 2 + h 2 h 1 ) C R η θ 2 2 d h B U R d θ = C R η ( A b C n b C b ) b k 4 C R η b b m 2 ( h 2 2 + h 1 1 h 2 + h 2 h 1 ) + C R η θ 2 b k 4 C R η b b m 2 ( h 2 2 + h 1 1 h 2 + h 2 h 1 ) C R η θ 2 2 d τ r N R d θ = 4 C R θ b k h 2 b m ( A b C n ) 2 b k 4 C R h 2 b b m 2 ( h 1 1 + h 2 ) 2 C R θ 2 2 d τ u U R d θ = 4 C R θ b k h 2 b m ( A b C n ) ( 1 f 2 ) 2 b k 4 C R b b m 2 ( h 2 2 + h 1 1 h 2 + h 2 h 1 ) 2 C R θ 2 2 d τ r B R d θ = 4 C R η θ b k h 2 b m ( A b C n b C b ) 2 b k 4 C R η h 2 b b m 2 ( h 1 1 + h 2 ) 2 C R η θ 2 2 d τ u B U R d θ = 4 C R θ η b k h 2 b m ( A b C n b C b ) ( 1 f 2 ) 2 b k 4 C R η b b m 2 ( h 2 2 + h 1 1 h 2 + h 2 h 1 ) 2 C R η θ 2 2 d h N R d θ = C R ( A b C n ) b k 4 C R h 2 b b m 2 ( h 1 1 + h 2 ) + C R θ 2 b k 4 C R h 2 b b m 2 ( h 1 1 + h 2 ) C R θ 2 2 d h U R d θ = C R ( A b C n ) b k 4 C R b b m 2 ( h 2 2 + h 1 1 h 2 + h 2 h 1 ) + C R θ 2 b k 4 C R b b m 2 ( h 2 2 + h 1 1 h 2 + h 2 h 1 ) C R θ 2 2 d h B R d θ = C R η ( A b C n b C b ) b k 4 C R η h 2 b b m 2 ( h 1 1 + h 2 ) + C R η θ 2 b k 4 C R η h 2 b b m 2 ( h 1 1 + h 2 ) C R η θ 2 2 d Q N R d θ = 8 C R 2 θ b k ( A b C n ) 2 b k 4 C R h 2 b b m 2 ( h 1 1 + h 2 ) 2 C R θ 2 2 d Q U R d θ = 8 C R 2 θ b k ( A b C n ) 2 b k 4 C R b b m 2 ( h 2 2 + h 1 1 h 2 + h 2 h 1 ) 2 C R θ 2 2 d Q B R d θ = 8 C R 2 η 2 θ b k ( A b C n b C b ) 2 b k 4 C R η h 2 b b m 2 ( h 1 1 + h 2 ) 2 C R η θ 2 2 d Q B U R d θ = 8 C R 2 η 2 θ b k ( A b C n b C b ) 2 b k 4 C R η b b m 2 ( h 2 2 + h 1 1 h 2 + h 2 h 1 ) 2 C R η θ 2 2 I f , A b C n b C b > 0 , ( 1 ) τ r N R θ > 0 , τ u U R θ > 0 , τ r B R θ > 0 , τ u B U R θ > 0 , h r N R θ > 0 , h u U R θ > 0 , h r B R θ > 0 , h u B U R θ > 0 , Q r N R θ > 0 , Q u U R θ > 0 , Q r B R θ > 0 , Q u B U R θ > 0 I f , A < b C n + b C b , h r N R θ < 0 , h u U R θ < 0 , h r B R θ < 0 , h u B U R θ < 0 , Q r N R θ < 0 , Q u U R θ < 0 , Q r B R θ < 0 , Q u B U R θ < 0
Proof of Corollary 2.
Similar to Corollary 1.
  k ( A + bC n ) ( 4 C R - bh 2 2 b m 2 ) - 2 bAkh 2 ( h 1 1 ) b m 2 2 C n b k 4 C R O > 0   a n d   6 C n A k 6 b k C n C R + 2 O ( b C n A ) > 0 O = b k h 2 b m 2 ( h 2 + h 1 1 ) w N R θ > 0 , w U R θ > 0 , P N R θ > 0 , P U R θ > 0 ,
These functions demonstrate that the first-order derivatives of Corollary 4 and Corollary 5 capacitance level h , retailer recycling rate τ r , recycling rate by ladder utilizer τ u , traction battery market demand Q , ladder battery sale price p u , ladder battery recycling rate τ u 1 , and ladder battery market demand Q u with respect to the optimization factor for the cost of recycling decommissioned traction batteries η are
d h B R d η = C R θ ( A b C n b C b ) b k 4 C R η h 2 b b m 2 ( h 1 1 + h 2 ) b k 4 C R η h 2 b b m 2 ( h 1 1 + h 2 ) C R η θ 2 d τ r B R d η = 2 C R θ 2 b k h 2 b m ( A b C n b C b ) 2 b k 4 C R η h 2 b b m 2 ( h 1 1 + h 2 ) 2 C R η θ 2 2 d τ r B U R d η = 2 C R θ 2 b k h 2 b m ( A b C n b C b ) 2 b k 4 C R η h 2 b b m 2 ( h 1 1 + h 2 2 h 2 + h 1 h 2 ) ( 1 f 2 ) 2 C R η θ 2 2 d Q B U R d η = 2 C R b k ( A b C n b C b ) 2 b k 4 C R η h 2 b b m 2 ( h 1 1 + h 2 2 h 2 + h 1 h 2 ) ( 1 f 2 ) + 2 C R η θ 2 2 b k 4 C R η h 2 b b m 2 ( h 1 1 + h 2 2 h 2 + h 1 h 2 ) ( 1 f 2 ) 2 C R η θ 2 2 d p u B R d η = ( S c u + + R λ S d h d η ) ( 4 C R 2 + S b u 2 ) + b u 2 ( R S c u R + λ d h d η ) 8 C R 2 S + 2 S 2 b u 2 d τ u 1 B R d η = b u ( λ d h d η + R S c u R ) 4 C R 2 + S b u 2 d Q u B R d η = R ( S c u + + R λ S d h d η ) ( 4 C R 2 + S b u 2 ) + b u 2 ( R S c u R + λ d h d η ) 8 C R 2 + 2 S b u 2
I f A > b C b + b C n , θ 2 < 2 b k , o r A < b C b + b C n , θ 2 > 2 b k ( 1 ) d h N R d η < 0 , d τ r B R d η < 0 , d τ r B U R d η < 0 , d τ u B U R d η < 0 , d Q B U R d η < 0 , d p u B R d η > 0 , d τ u 1 B U R d η > 0 , d Q u B U R d η < 0
Proof of Corollary 6.
The capacitance level h , the recycling rate of step-down utilizers τ u , the market demand for traction batteries Q , the sale price of step-down batteries p u , the recycling rate of step-down batteries τ u 1 , and the first-order derivative of the market demand for step-down batteries Q u with respect to the incentive coefficient for recycling by retailers h 1 are
d h N R d h 1 = C R θ b 2 k h 2 b m 2 ( A b C n ) b k 4 C R h 2 b b m 2 ( h 1 1 + h 2 ) C R θ 2 2 d h U R d h 1 = C R θ b 2 k h 2 b m 2 ( A b C n ) ( h 1 + 1 ) ( 1 f 2 ) b k 4 C R h 2 b b m 2 ( h 1 1 + h 2 2 + h 1 h 2 h 2 ) ( 1 f 2 ) C R θ 2 2 d h B R d h 1 = C R η θ b 2 k h 2 b m 2 ( A b C n b C b ) b k 4 C R η h 2 b b m 2 ( h 1 1 + h 2 ) C R η θ 2 2 d h B U R d h 1 = C R η θ b 2 k h 2 b m 2 ( A b C n b C b ) ( h 1 + 1 ) ( 1 f 2 ) b k 4 C R η h 2 b b m 2 ( h 1 1 + h 2 2 + h 1 h 2 h 2 ) ( 1 f 2 ) C R η θ 2 2 d Q B R d h 1 = 4 C R η b 3 k 2 h 2 b m 2 ( A b C n b C b ) 2 b k 4 C R η h 2 b b m 2 ( h 1 1 + h 2 ) 2 C R η θ 2 2 d Q B U R d h 1 = 4 C R η b 3 k 2 h 2 b m 2 ( A b C n b C b ) ( 1 f 2 ) 2 b k 4 C R η h 2 b b m 2 ( h 1 1 + h 2 2 + h 1 h 2 h 2 ) ( 1 f 2 ) 2 C R η θ 2 2 d τ r N R d h 1 = 2 b 3 k 2 h 2 b m 3 ( A b C n ) 2 b k 4 C R h 2 b b m 2 ( h 1 1 + h 2 ) 2 C R θ 2 2 d τ r B U R d h 1 = 2 b 3 k 2 h 2 b m 3 ( A b C n b C b ) ( 1 f 2 ) 2 ( 1 + h 2 ) 2 b k 4 C R η h 2 b b m 2 ( h 1 1 + h 2 2 + h 1 h 2 h 2 ) ( 1 f 2 ) 2 C R η θ 2 2 d τ u 1 N R d h 2 = 2 C R 2 S λ b u d h N R d h 1 ( 4 C R 2 S b u 2 ) 2
d q u B U R d h 2 = 2 C R 2 S λ d h N R d h 1 ( 4 S C R 2 S 2 b u 2 ) 2 I f A > b C b + b C n , h N R h 1 > 0 , h U R h 1 > 0 , h B R h 1 > 0 , h B U R h 1 > 0 , Q B R h 1 > 0 , Q u B U R h 1 > 0 , τ r N R h 1 > 0 , τ r B U R h 1 > 0 , τ u 1 N R h 1 < 0 , q u B U R h 1 < 0
Proof of Proposition 5.
Without taking competition into account ( f = 0 ) , a cross-sectional comparison of the recycling rate ( τ r N R , τ r U R ) , ( τ r B R , τ r B U R ) when the manufacturer adopts the blockchain versus when it does not adopt the blockchain for single or dual channels and a longitudinal comparison of the situation between retailers recycling decommissioned traction batteries in a single channel versus dual-channel recycling of traction batteries ( τ r N R , τ r B R ) , ( τ U R , τ B U R ) :
( 1 ) τ r B R τ r N R = ( 1 η ) ( 8 C R b k 2 C R θ 2 ) ( A b C n ) b C b [ 8 C R b k 2 k h 2 b m 2 b 2 ( h 1 1 + h 2 ) 2 C R θ 2 ] 2 b k 4 C R h 2 b b m 2 ( h 1 1 + h 2 ) 2 C R θ 2 2 b k 4 C R η h 2 b b m 2 ( h 1 1 + h 2 ) 2 η C R θ 2 I f ( 1 η ) J > b C b [ 8 C R b k 2 k h 2 b m 2 b 2 ( h 1 1 + h 2 ) 2 C R θ 2 ] t h e n , τ r N R > τ r B R ( 2 ) τ B U R τ U R = ( 1 η ) ( 8 C R b k 2 C R θ 2 ) ( A b C n ) b C b [ 8 C R b k 2 k h 2 b m 2 b 2 ( h 1 1 h 2 + h 2 + h 1 h 2 ) 2 C R θ 2 ] 2 b k 4 C R b b m 2 ( h 1 1 + h 2 2 h 2 + h 1 h 2 ) ( 1 f 2 ) 2 C R θ 2 × 2 b k 4 C R η b b m 2 ( h 1 1 + h 2 2 h 2 + h 1 h 2 ) ( 1 f 2 ) 2 C R η θ 2 i f ( 1 η ) J > b C b [ 8 C R b k 2 k h 2 b m 2 b 2 ( h 1 1 h 2 + h 2 + h 1 h 2 ) 2 C R θ 2 ] t h e n , τ U R > τ B U R J = ( 8 C R b k 2 C R θ 2 ) ( A b C n ) ( 3 ) τ U R τ r N R = 2 b k b m ( A b C n ) ( 4 C L b k C L θ 2 h 2 2 b 2 b m 2 k ) 2 b k 4 C R b b m 2 ( h 1 1 + h 2 2 h 2 + h 1 h 2 ) ( 1 f 2 ) 2 C R θ 2 × 2 b k 4 C R h 2 b b m 2 ( h 1 1 + h 2 ) 2 C R θ 2 I f A > b C n . a n d , K > h 2 2 b 2 b m 2 k t h e n , τ r N R < τ U R ( 4 ) τ B U R τ r B R = 2 ( A b C n b C b ) ( 4 C L b k η C L θ 2 η k b 2 b m 2 h 2 2 ) 2 b k 4 C R η b b m 2 ( h 1 1 + h 2 2 h 2 + h 1 h 2 ) ( 1 f 2 ) 2 C R η θ 2 × 2 b k 4 C R η h 2 b b m 2 ( h 1 1 + h 2 ) 2 η C R θ 2 I f A > b C n + b C b , a n d , η K > k b 2 b m 2 h 2 2 t h e n , τ r B R < τ B U R K = 4 C L b k C L θ 2
Proof of Proposition 6.
Under consideration of the competition factor ( f 0 ) . Horizontal comparison of traction battery capacitance level ( h B R , h B R ) , ( h U R , h B U R ) when the manufacturer adopts blockchain versus when it does not and vertical comparison between traction battery capacitance level ( h N R , h U R ) , ( h B R , h B U R ) under single-channel recycling of retired traction batteries by retailers versus dual-channel recycling of traction batteries by retailers:
( 1 ) Q U R Q N R = 2 C R b k ( A b C n ) b b m 2 ( h 1 1 + h 1 h 2 h 2 + h 2 2 ) ( 1 f 2 ) ( h 1 h 2 h 2 + h 2 2 ) b k 4 C R b b m 2 ( h 1 1 h 2 + h 2 2 + h 1 h 2 ) ( 1 f 2 ) C R θ 2 b k 4 C R h 2 b b m 2 ( h 1 1 + h 2 ) C R θ 2 Q B U R Q B R = 2 C R η b k ( A b C n b C b ) b b m 2 ( h 1 1 + h 1 h 2 h 2 + h 2 2 ) ( 1 f 2 ) ( h 1 h 2 h 2 + h 2 2 ) b k 4 C R η b b m 2 ( h 1 1 h 2 + h 2 2 + h 1 h 2 ) ( 1 f 2 ) C R η θ 2 b k 4 C R η h 2 b b m 2 ( h 1 1 + h 2 ) C R η θ 2 h U R h N R = θ C R ( A b C n ) b b m 2 ( h 1 h 2 h 2 + h 2 2 ) ( h 1 1 + h 1 h 2 h 2 + h 2 2 ) ( 1 f 2 ) b k 4 C R b b m 2 ( h 1 1 h 2 + h 2 2 + h 1 h 2 ) ( 1 f 2 ) C R θ 2 b k 4 C R h 2 b b m 2 ( h 1 1 + h 2 ) C R θ 2 h B U R h B R = θ C R η ( A b C n b C b ) b b m 2 ( h 1 h 2 h 2 + h 2 2 ) ( h 1 1 + h 1 h 2 h 2 + h 2 2 ) ( 1 f 2 ) b k 4 C R η b b m 2 ( h 1 1 h 2 + h 2 2 + h 1 h 2 ) ( 1 f 2 ) C R η θ 2 b k 4 C R η h 2 b b m 2 ( h 1 1 + h 2 ) C R η θ 2 I f ( h 1 + h 2 1 ) < ( 1 f 2 ) ( h 1 1 + h 1 h 2 h 2 + h 2 2 ) , a n d , A > b C n b C b t h e n , Q N R < Q U R , Q B R < Q B U R h N R < h U R , h B R < h B U R ( 2 ) Q B R Q N R = C R b k ( A b C n ) 2 b 2 k h 2 b m 2 ( 1 η ) ( h 1 1 + h 2 ) C R η b 2 k C b 4 C R b k b 2 k b m 2 ( h 1 h 2 h 2 + h 2 2 ) C R θ 2 b k 4 C R η h 2 b b m 2 ( h 1 1 + h 2 ) C R η θ 2 b k 4 C R h 2 b b m 2 ( h 1 1 + h 2 ) C R θ 2 h B R h N R = C R θ ( A b C n ) b h 2 b m 2 ( 1 η ) ( h 1 1 + h 2 ) C R η θ b C b 4 C R b k b 2 k b m 2 ( h 1 h 2 h 2 + h 2 2 ) C R θ 2 b k 4 C R η h 2 b b m 2 ( h 1 1 + h 2 ) C R η θ 2 b k 4 C R h 2 b b m 2 ( h 1 1 + h 2 ) C R θ 2 I f ( A b C n ) ( 1 η η ) K > C b ( 4 C R b k b Y C R θ 2 ) t h e n , Q N R < Q B R h N R < h B R Y = h 2 b k b m 2 ( h 1 1 + h 2 ) Q B U R Q U R = C R b k ( A b C n ) 2 b 2 k b m 2 ( 1 η ) ( h 1 1 + h 2 2 h 2 + h 1 h 2 ) ( 1 f 2 ) C R η b 2 k C b 4 C R b k b 2 k b m 2 ( h 1 1 + h 2 2 h 2 + h 1 h 2 ) ( 1 f 2 ) C R θ 2 b k 4 C R η b b m 2 ( h 1 1 + h 2 2 h 2 + h 1 h 2 ) ( 1 f 2 ) C R η θ 2 × b k 4 C R b b m 2 ( h 1 1 + h 2 2 h 2 + h 1 h 2 ) ( 1 f 2 ) C R θ 2 ( 3 ) h B U R h U R = C R θ ( A b C n ) b b m 2 ( 1 η ) ( h 1 1 + h 2 2 h 2 + h 1 h 2 ) ( 1 f 2 ) C R η θ b C b 4 C R b k b 2 k b m 2 ( ( h 1 1 + h 2 2 h 2 + h 1 h 2 ) ( 1 f 2 ) C R θ 2 b k 4 C R η h 2 b b m 2 ( h 1 1 + h 2 2 h 2 + h 1 h 2 ) ( 1 f 2 ) C R η θ 2 × b k 4 C R h 2 b b m 2 ( h 1 1 + h 2 2 h 2 + h 1 h 2 ) ( 1 f 2 ) C R θ 2 I f ( A b C n ) ( 1 η 1 ) X > C b ( 4 C R b k b X C R θ 2 ) t h e n , Q U R < Q B U R h U R < h B U R X = b k b m 2 ( h 1 1 h 2 + h 2 2 + h 1 h 2 ) 1 f 2
Proof of Proposition 7.
Similar to Proposition 6. □

References

  1. Tao, F.; Kishita, Y.; Scheller, C.; Blomeke, S.; Umeda, Y. Designing a sustainable circulation system of second-life traction batteries: A scenario-based simulation approach. Procedia CIRP 2022, 105, 733–738. [Google Scholar] [CrossRef]
  2. Zhong, X.H.; Chen, L.L.; Han, J.; Liu, W.; Jiao, F.; Qin, W. Current status and recycling of waste lithium-ion battery resources. J. Eng. Sci. 2021, 43, 161–169. [Google Scholar] [CrossRef]
  3. Dasaklis, T.K.; Voutsinas, T.G.; Tsoulfas, G.T.; Casino, F. A systematic literature review of blockchain-enabled supply chain traceability implementations. Sustainability 2022, 14, 2439. [Google Scholar] [CrossRef]
  4. VikramGoud, M.; Biswas, P.K.; Sain, C.; Babu, T.S.; Balachandran, P.K. Advancement of electric vehicle technologies, classification of charging methodologies, and optimization strategies for sustainable development A comprehensive review. Heliyon 2024, 10, e39299. [Google Scholar] [CrossRef]
  5. Amir, M.; Deshmukh, R.G.; Khalid, H.M.; Said, Z.; Raza, A.; Muyeen, S.M.; Nizami, A.S.; Elavarasan, R.M.; Saidur, R.; Sopian, K. Energy storage technologies: An integrated survey of developments, global economical/environmental effects, optimal scheduling model, and sustainable adaption policies. J. Energy Storage 2023, 72, 108694. [Google Scholar] [CrossRef]
  6. Kourkoumpas, D.-S.; Benekos, G.; Nikolopoulos, N.; Karellas, S.; Grammelis, P.; Kakaras, E. A review of key environmental and energy performance indicators for the case of renewable energy systems when integrated with storage solutions. Appl. Energy 2018, 231, 380–398. [Google Scholar] [CrossRef]
  7. Jing, L.; Gang, D.; Yin, J. Current situation and economic analysis of decommissioned battery recycling industry. CIESC J. 2020, 71, 494–500. [Google Scholar] [CrossRef]
  8. Zanoletti, A.; Carena, E.; Ferrara, C.; Bontempi, E. A Review of Lithium-Ion Battery Recycling: Technologies, Sustainability, and Open Issues. Batteries 2024, 10, 38. [Google Scholar] [CrossRef]
  9. Chen, J.M.; Zhang, W.; Gong, B.G. Optimal policy for the recycling of electric vehicle retired traction batteries. Technol. Forecast. Soc. Change 2022, 183, 121930. [Google Scholar] [CrossRef]
  10. Kuntz, P.; Lonardoni, L.; Genies, S. Evolution of Safety Behavior of High-Power and High-Energy Commercial Li-Ion Cells after Electric Vehicle Aging. Batteries 2023, 9, 427. [Google Scholar] [CrossRef]
  11. Meegoda, J.; Charbel, G.; Watts, D. Sustainable Management of Rechargeable Batteries Used in Electric Vehicles. Batteries 2024, 10, 167. [Google Scholar] [CrossRef]
  12. Díaz-Ramírez, M.C.; Ferreira, V.J.; García-Armingol, T.; López-Sabirón, A.M.; Ferreira, G. Battery Manufacturing Resource Assessment to Minimise Component Production Environmental Impacts. Sustainability 2020, 12, 6840. [Google Scholar] [CrossRef]
  13. Zhang, C.; Tian, Y.; Li, C. Decision-making of electric vehicle traction battery manufacturers for laddering utilisation under carbon cap-and-trade policy. Control Decis. Mak. J. Int. Soc. Electr. Veh. Manuf. 2022, 39. [Google Scholar] [CrossRef]
  14. Tang, Y.Y.; Zhang, Q. Recycling mechanisms and policy suggestions for spent electric vehicles’ traction battery—A case of Beijing. J. Clean. Prod. 2018, 186, 388–406. [Google Scholar] [CrossRef]
  15. Amuta, O.; Kowal, J. State of Health Assessment of Spent Lithium–Ion Batteries Based on Voltage Integral during the Constant Current Charge. Batteries 2023, 9, 537. [Google Scholar] [CrossRef]
  16. Xie, J.; Li, J.; Yang, F. Multi-level contract decision optimisation for closed-loop supply chain of new energy vehicles. J. Manag. Eng. 2020, 34, 180–193. [Google Scholar] [CrossRef]
  17. Huang, M.; Song, M.; Lee, L.H.; Ching, W.K. Analysis for strategy of closed loop supply chain with dual recycling channel. Int. J. Prod. Econ. 2013, 144, 510–520. [Google Scholar] [CrossRef]
  18. Wang, L.; Wang, X.; Yang, W.X. Optimal design of electric vehicle battery recycling network—From the perspective of electric vehicle manufacturers.applied energy. Appl. Energy 2020, 275, 15328. [Google Scholar] [CrossRef]
  19. Shao, L.; Li, P.; Zhang, Z.; Luo, A. Blockchain technology-driven closed-loop traction battery supply chain information sharing mechanism and contract coordination. Sci. Technol. Manag. Res. 2024. [Google Scholar] [CrossRef]
  20. Júnior, C.A.; Sanseverino, E.R.; Gallo, P.; Koch, D.; Schweiger, H.G.; Zanin, H. Blockchain review for battery supply chain monitoring and battery trading. Renew. Sustain. Energy Rev. 2022, 157, 112078. [Google Scholar] [CrossRef]
  21. Habib, A.K.M.A.; Hasan, M.K.; Issa, G.F.; Singh, D.; Islam, S.; Ghazal, T.M. Lithium-Ion Battery Management System for Electric Vehicles: Constraints, Challenges, and Recommendations. Batteries 2023, 9, 152. [Google Scholar] [CrossRef]
  22. Kosuru, V.S.R.; Venkitaraman, A.K. A Smart Battery Management System for Electric Vehicles Using Deep Learning-Based Sensor Fault Detection. World Electr. Veh. J. 2023, 14, 101. [Google Scholar] [CrossRef]
  23. Zhao, S.X.; Wang, Y.C. Research on emergency distribution optimization ofmobile traction for electric vehicle in photovoltaic-energy storage-charging supply chain under the energy blockchain. Energy Rep. 2022, 8, 6815–6825. [Google Scholar] [CrossRef]
  24. You, J.X.; Ren, J. Investment evolution game of electric vehicle traction battery blockchain technology [J/OL]. J. Tongji Univ. 2023, 5105. [Google Scholar] [CrossRef]
  25. Yu, L.; Bai, Y.; Belharouak, I. Recycling of Lithium-Ion Batteries via Electrochemical Recovery: A Mini-Review. Batteries 2024, 10, 337. [Google Scholar] [CrossRef]
  26. Schlögl, G.; Grollitsch, S.; Ellersdorfer, C. Sustainable Battery Lifecycle: Non-Destructive Separation of Batteries and Potential Second Life Applications. Batteries 2024, 10, 280. [Google Scholar] [CrossRef]
  27. Paulauskas, N.; Kapustin, V. Battery Scheduling Optimization and Potential Revenue for Residential Storage Price Arbitrage. Batteries 2024, 10, 251. [Google Scholar] [CrossRef]
  28. Almutairi, Z.A.; Eltamaly, A.M. Synergistic Effects of Energy Storage Systems and Demand-Side Management in Optimizing Zero-Carbon Smart Grid Systems. Energies 2024, 17, 5637. [Google Scholar] [CrossRef]
  29. Silva, E.R.; Lohmer, J.; Rohla, M.; Angelis, J. Unleashing the circular economy in the electric vehicle battery supply chain: A case study on data sharing and blockchain potential. Resour. Conserv. Recycl. 2023, 193, 106969. [Google Scholar] [CrossRef]
  30. Centobelli, P.; Cerchione, R.; Del Vecchio, P.; Oropallo, E.; Secundo, G. Blockchain technology for bridging trust, traceability and transparency in circular supply chain. Inf. Manag. 2022, 59, 103508. [Google Scholar] [CrossRef]
  31. Zhang, X.; Feng, X.; Jiang, Z.; Gong, Q.; Wang, Y. A blockchain-enabled framework for reverse supply chain management of traction batteries. J. Clean. Prod. 2023, 415, 137823. [Google Scholar] [CrossRef]
  32. Feng, H.; Wang, X.; Duan, Y.; Zhang, J.; Zhang, X. Applying blockchain technology to improve agri-food traceability: A review of development methods, benefits and challenges. J. Clean. Prod. 2020, 260, 121031. [Google Scholar] [CrossRef]
  33. Xing, P.; Yao, J. Power Battery Echelon Utilization and Recycling Strategy for NewEnergy Vehicles Based on Blockchain Technolog. Sustainability 2022, 14, 11835. [Google Scholar] [CrossRef]
  34. Zhang, M.; Li, X.; Ma, L. Research on traction battery secondary utilisation based on blockchain technology. Sci. Technol. Manag. Res. 2020, 40, 225–231. [Google Scholar] [CrossRef]
  35. Berger, K.; Rusch, M.; Schöggl, J.P.; Baumgartner, R.J. Sustainable and circular battery management—Conceptualization of an information model. In Proceedings of the 20th European Round Table on Sustainable Consumption and Production, Graz, Austria, 8–10 September 2021. [Google Scholar]
  36. Olivetti, E.A.; Ceder, G.; Gaustad, G.G.; Fu, X. Lithium-ion battery supply chain considerations: Analysis of potential bottlenecks in critical metals. Joule 2017, 1, 229–243. [Google Scholar] [CrossRef]
  37. Savaskan, R.C.; Bhattacharya, S.; Van Wassenhove, L.N. Closed-loop supplychain models with product remanufacturing. Manag. Sci. 2004, 50, 239252. [Google Scholar] [CrossRef]
  38. Yalabik, B.; Fairchild, R.J. Customer regulatory, and competitive pressure as drivers of environmental innovation. Int. J. Prod. Econ. 2011, 131, 519–527. [Google Scholar] [CrossRef]
  39. Bian, J.; Zhao, X. Tax or subsidy? An analysis of environmental policies in supply chains with retail competition. Eur. J. Oper. Res. 2020, 283, 901–914. [Google Scholar] [CrossRef]
  40. Wang, Q.; Zhao, D.; He, L. Contracting emission reduction for supply chains considering market low-carbon preference. J. Clean. Prod. 2016, 120, 72–84. [Google Scholar] [CrossRef]
  41. Wu, X.L.; Zhou, Y. The optimal reverse channel choice under supply chain competition. Eur. J. Oper. Res. 2017, 259, 63–66. [Google Scholar] [CrossRef]
  42. Wang, Z.R.; Wu, Q.H. Carbon emission reduction and product collection decisions in the closed-loop supply chain with cap-and-trade regulation. Int. J. Prod. Res. 2021, 59, 4359–4383. [Google Scholar] [CrossRef]
  43. Höhne, K.; Hirtz, E. With System Integration and Lightweight Design to Highest Energy Densities. Adv. Microsyst. Automot. Appl. 2013, 1, 205–214. [Google Scholar] [CrossRef]
Figure 1. Pure electric vehicle structure schematic diagram.
Wevj 15 00561 g001
Figure 2. Battery pack structure.
Wevj 15 00561 g002
Figure 3. NR mode.
Figure 3. NR mode.
Wevj 15 00561 g003
Figure 4. UR model.
Figure 4. UR model.
Wevj 15 00561 g004
Figure 5. BR model.
Figure 5. BR model.
Wevj 15 00561 g005
Figure 6. BUR model.
Wevj 15 00561 g006
Figure 7. Effect of traction battery capacity sensitivity factor θ on recovery rate.
Wevj 15 00561 g007
Figure 8. Effect of the cost optimization factor on recovery rate.
Wevj 15 00561 g008
Figure 9. Effect of recovery incentive factor on recovery rate.
Wevj 15 00561 g009
Figure 10. (ac) Effect of BCU enterpriser recycling incentive coefficients and capacitor range demand preferences on maximum returns.
Wevj 15 00561 g010
Figure 11. Impact of recycling incentives on capacitance levels for BCU enterprises.
Wevj 15 00561 g011
Figure 12. (a,b) Effect of recovery competition factor on recovery rate and effect of recovery competition factor on EV capacitance levels.
Wevj 15 00561 g012
Table 1. A description of symbols.
SymbolSymbol Definition
Decision variables
w Wholesale EV prices sold by EV manufacturers to EV retailers
p Sale price sold by EV retailers to the EV marketplace
h Traction battery capacitance levels for EV vehicles
τ r Recycling rates for traction cells recovered from the EV market by EV retailers
τ u Recycling rate of retired traction batteries (RPBs) recovered by BCU companies from the EV market
τ u 1 Recycling rate of non-usable decommissioned traction batteries recovered by BUC enterprises from the market of laddered batteries
p u Sale prices of BUC firms selling to the step-down market for step-down batteries
Relevant parameters
A EV potential demand in the EV market
R Potential demand for reclassified batteries in the reclassified market
b Sale price elasticity coefficient of EV
θ Capacitance level preference factor for EV range
S Coefficient of elasticity of sale price of gradient batteries
C R , C R 1 Cost coefficients for the decommissioned traction battery recycling market and the gradient battery recycling market, respectively
h 1 , h 2 Recovery incentive coefficients for EV manufacturers to BUC firms and for BUC firms to EV sellers, respectively
b m EV manufacturers’ transfer prices to BUC companies for retired traction cells
b r Transfer prices for retired traction batteries from BUC companies to EV retailers
c e Recycling prices for retired traction batteries
b u Recycling prices for non-reusable echelon utilization batteries
k R&D costs for traction cell capacitors to improve EV range
C b Unit cost of processing blockchain technology for traction batteries
C n Manufacturing costs for traction battery manufacturing with new recycled materials
C m Remanufacturing costs of traction batteries made from recycled materials
c u Manufacturing costs of echelon utilization batteries
λ Additional benefits of high-capacity decommissioned traction batteries for echelon utilization
η Optimization factor for recycling costs of decommissioned traction batteries
f Competition factor for recycling of decommissioned traction batteries
formulas
Q Number of EVs sold
Q u Number of echelon utilization batteries sold
Table 2. Proof and calculation result. See Appendix A.
w   = w N R
h   = h N R
p u   = p u N R
τ u 1 = τ u 1 N R
p = p N R
τ r   = τ r N R
Q   = Q N R
Q u = Q u N R
Table 3. Proof and calculation result. See Appendix A.
w   = w U R
h   = h U R
τ u   = τ u U R
p = p U R
p u   = p u U R
τ r   = τ r U R
τ u 1 = τ u 1 U R
Q   = Q U R
Q u = Q u U R
Table 4. Proof and calculation result. See Appendix A.
w   = w B R
h   = h B R
p u   = p u B R
τ u 1 = τ u 1 B R
p = p B R
τ r   = τ r B R
Q   = Q B R
Q u = Q u B R
Table 5. Proof and calculation result. See Appendix A.
w   = w B U R
h   = h B U R
τ u   = τ u B U R
p = p B U R
p u   = p u B U R
τ r   = τ r B U R
τ u 1 = τ u 1 B U R
Q   = Q B U R
Q u = Q u B U R
Disclaimer/Publisher’s Note: The statements, opinions and data contained in all publications are solely those of the individual author(s) and contributor(s) and not of MDPI and/or the editor(s). MDPI and/or the editor(s) disclaim responsibility for any injury to people or property resulting from any ideas, methods, instructions or products referred to in the content.

