Article

Longitudinal Monitoring of Electric Vehicle Travel Trends Using Connected Vehicle Data

1
Lyles School of Civil and Construction Engineering, Purdue University, West Lafayette, IN 47907, USA
2
Indiana Department of Transportation, Indianapolis, IN 46204, USA
*
Author to whom correspondence should be addressed.
World Electr. Veh. J. 2024, 15(12), 560; https://doi.org/10.3390/wevj15120560
Submission received: 3 October 2024 / Revised: 15 November 2024 / Accepted: 27 November 2024 / Published: 3 December 2024

Abstract

:
Historically, practitioners and researchers have used selected count station data and survey-based methods along with demand modeling to forecast vehicle miles traveled (VMT). While these methods may suffer from self-reporting bias or spatial and temporal constraints, the widely available connected vehicle (CV) data at 3 s fidelity, independent of any fixed sensor constraints, present a unique opportunity to complement traditional VMT estimation processes with real-world data in near real-time. This study developed scalable methodologies and analyzed 238 billion records representing 16 months of connected vehicle data from January 2022 through April 2023 for Indiana, classified as internal combustion engine (ICE), hybrid (HVs) or electric vehicles (EVs). Year-over-year comparisons showed a significant increase in EVMT (+156%) with minor growth in ICEVMT (+2%). A route-level analysis enables stakeholders to evaluate the impact of their charging infrastructure investments at the federal, state, and even local level, unbound by jurisdictional constraints. Mean and median EV trip lengths on the six longest interstate corridors showed a 7.1 and 11.5 mile increase, respectively, from April 2022 to April 2023. Although the current CV dataset does not randomly sample the full fleet of ICE, HVs, and EVs, the methodologies and visuals in this study present a framework for future evaluations of the return on charging infrastructure investments on a regular basis using real-world data from electric vehicles traversing U.S. roads. This study presents novel contributions in utilizing CV data to compute performance measures such as VMT and trip lengths by vehicle type—EV, HV, or ICE, unattainable using traditional data collection practices that cannot differentiate among vehicle types due to inherent limitations. We believe the analysis presented in this paper can serve as a framework to support dialogue between agencies and automotive Original Equipment Manufacturers in developing an unbiased framework for deriving anonymized performance measures for agencies to make informed data-driven infrastructure investment decisions to equitably serve ICE, HV, and EV users.

1. Introduction

Vehicle miles traveled (VMT) is an important estimate that is used by multiple stakeholders, including state departments of transportation and regional planning organizations. Use cases include transportation planning, assessing emission levels, documenting traffic impacts, and forecasting pavement life. Multiple methods have been used by researchers and practitioners for estimating vehicle miles traveled, with the most common methods including traffic-count-station-based estimates [1], self-reported trip diary information from National Household Travel Survey (NHTS) estimates [2], and travel demand forecasting-based estimation models [3]. The NHTS continues to be one of the most used sources of information on determining how many miles electric vehicles (EVs) are driven [2,4,5]. A study based on the 2017 NHTS found that EVs are driven for considerably less time than conventional vehicles every year, possibly due to range-anxiety concerns, leading to only low-mileage drivers utilizing EVs [4].
These existing methods are cost-, time-, and labor-intensive and may have some bias. For example, self-reported trip length estimates using survey-based methods are prone to human error and may not be reflective of the actual distances traveled. Additionally, traffic-count-station-based methods are spatially constrained, only represent the vehicle volumes for particular locations, and broadly classify them by vehicle weight into various classes of passenger and commercial vehicles. Furthermore, these stations do not provide detailed information on the vehicle’s fuel type or age, which is an important indicator as travel trends significantly differ between internal combustion engine, hybrid, and electric vehicles. This study proposes a more efficient alternative for estimating VMT using widely available connected vehicle data at relatively representative market penetration levels, which does not require any fixed infrastructure or sensors for data collection and provides information on the type of vehicle to allow for a more detailed analysis. A scalable methodology for effectively analyzing billions of connected vehicle (CV) data points in the spatial context of existing roadways and deriving performance measures from the same is documented in this study. Overall, the study found a 156% growth in statewide electric-vehicle miles traveled compared to 2% for internal-combustion-engine vehicle miles traveled. However, until the CV market matures, there is likely some bias in these statistics due to the varying market penetration levels of different Original Equipment Manufacturers (OEMs). The text that follows is broadly split into the following sections—Literature Review, Materials and Methods, Results, and Conclusions.

2. Literature Review

The literature review is categorized into two sections that document current practices in estimating VMT and trip lengths and shed light upon emerging opportunities, wherein CV data have proved invaluable for a variety of transportation engineering applications, thus setting the stage for utilizing CV data for estimating VMT, trip lengths, and other performance measures.

2.1. Existing Methods

Researchers have used several different approaches to estimate VMT and forecast VMT growth over the years, including traffic-count-station data [6,7], socio-economic-data-based methods [8,9], and demand forecasting models [10,11]. Each of these aforementioned VMT estimating methods have limitations, including low sampling rates, sampling bias, self-reporting bias, as well as the cost and time limitations associated with installing fixed infrastructure along a road network, such as traffic-count stations. In the context of electric vehicles, VMT is a particularly important performance measure for assessing EV adoption and road use to help agencies prioritize corridors to invest in and track the impacts of their investment. Recently, large-scale CV trajectory data have been utilized to estimate VMT and have shown promising results in being able to compute accurate VMT estimates [12,13]. A 2022 study utilized connected vehicle data (a pilot study with vehicles retrofitted with onboard equipment for data collection) to document the longitudinal impact of the pandemic on activity travel [14]. Similar to VMT estimation, practitioners have utilized travel demand modeling, stochastic simulations [15], self-reported trip diaries [16], Bluetooth matching [17], and other techniques to estimate trip lengths (and corresponding trip durations) for vehicles passing through selected corridors or construction zones. However, limited research exists in using large-scale CV data towards estimating trip lengths at a statewide level in a scalable framework, which is one of the research gaps that this study aims to fill.

2.2. Connected Vehicle Data Opportunities

Connected vehicle data, typically reported at 3 s intervals, has been used for a wide variety of use cases in transportation engineering [18,19], including in the field of alternative fuel infrastructure and electric vehicles [20]. As countries, states, and agencies around the globe prepare for the transition to an electric-vehicle-heavy fleet [21,22], quantitative evidence supporting stakeholder investments is very important. A large percentage of research in this domain has focused on electric-vehicle charging infrastructure availability [23] and utilization [24,25,26] trends and how charging infrastructure deployment relates to EV use. Researchers have shown promising results in utilizing these data for informing charging-station infrastructure investments. Automotive Original Equipment Manufacturers (OEMs) already utilize these data in one form or another to guide users to their nearest charging stations, or in trip planning, among other such applications. There is, however, a growing need for a common dialogue among the private- and public-sector stakeholders to develop a shared vision on VMT-oriented performance measures that ensure user privacy and provide the necessary data for both public agencies and the private-sector stakeholders for making informed decisions on charging infrastructure deployment.
A recent study demonstrated the applicability of nationally available connected vehicle data from December 2022 to provide supplementary statistics and information from real vehicle data, such as trip lengths and trip durations in addition to that provided by the NHTS [27]. Indiana has been utilizing CV data for the past few years to study trends on EV and hybrid vehicle (HV) use and charging-station utilization, as well as using real-world trip data trends to aid in charging-station infrastructure investment decision making [28]. While a majority of existing efforts in this space have all been focused on analyzing time slices of data ranging from a week to a few months or limited to a selection of corridors, this study aims to expand and build on existing methodologies to perform a 16-month analysis to demonstrate scalable techniques for the longitudinal monitoring of EV travel trends using CV data at the statewide level. Even though electric-vehicle market penetration is significantly lower across the globe [29], data-processing methodologies, analysis, and frameworks such as those presented by this study are an important first step in gathering consensus among stakeholders for the different types of aggregate performance measures that will be useful in tracking the growth of EV use going forward. This study addresses the research gap of being able to use statewide real-world data from connected vehicles in a scalable way, as opposed to self-reported survey data such as spatially constrained traffic-count-station data, for example, to estimate VMT and trip lengths for use by all relevant stakeholders.
Additionally, existing research in this space has utilized CV data in limited time slices (weeks or a month) to analyze EV travel trends; however, this study presents a novel longitudinal evaluation of CV data over a 16-month period to monitor change in EVMT and trip lengths over an extended period. Such a longitudinal analysis will be important to stakeholders tracking EV trends for use cases, such as charging infrastructure, power grid demand, and dedicated parking with charging infrastructure.
Countries around the world recognize the significant sustainable transportation benefits that EVs provide [30] and have thus provided extensive funding to prepare their transportation infrastructure [31] to accelerate EV adoption. A significant body of existing literature has documented the public health and environmental benefits of EVs towards reducing greenhouse gas emissions and addressing climate change [30,32,33,34], the economic benefits [35,36], and how closely a sustainable transportation future outlook is intertwined with growth in EV adoption and smart grid management strategies [37,38]. A robust and scalable data-driven methodology and related performance measures, such as those presented by this study, are vital to enable such informed infrastructure investment decision making to ensure sustainable transportation-focused practices in the future.

3. Materials and Methods

The text that follows is divided into three broad subsections that outline the scope and objectives of this study, the study location, and the connected vehicle dataset that was utilized for the analysis.

3.1. Study Scope and Objective
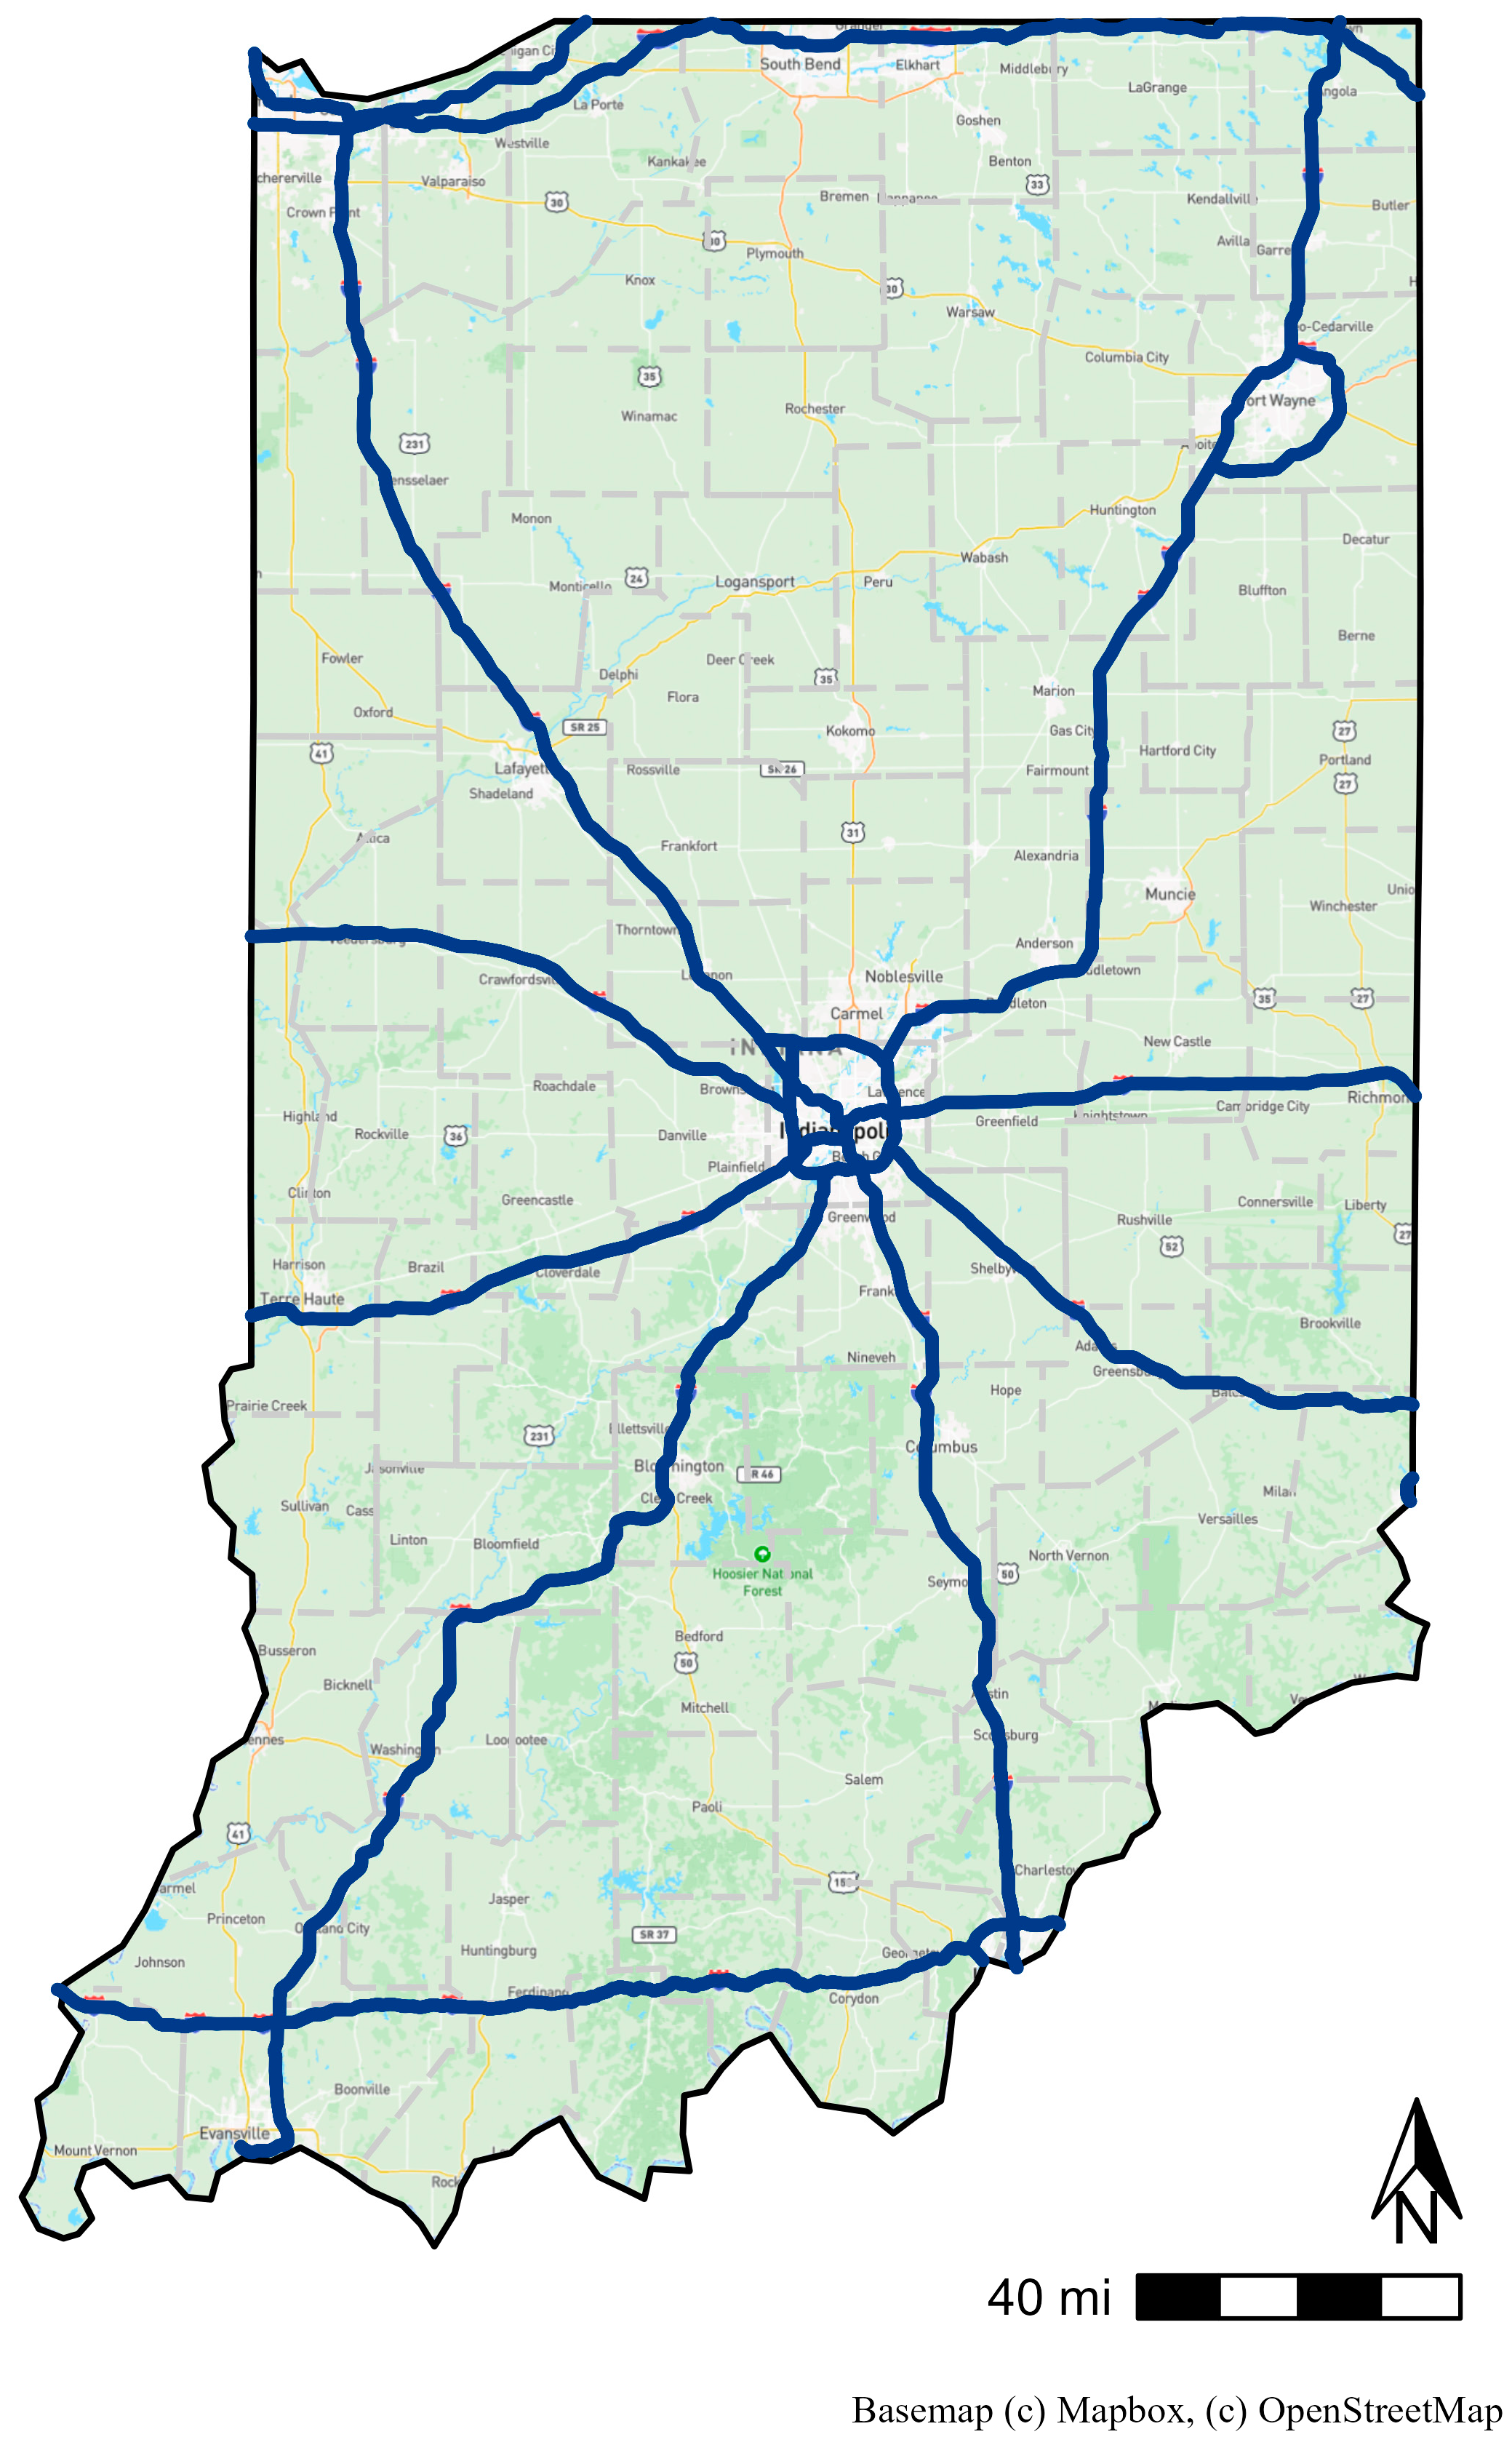
This study analyzed 238 billion connected vehicle records for internal combustion engine (ICE), EVs, and HVs in the state of Indiana to conduct a longitudinal 16-month evaluation of the change in travel trends for EV, HV, and ICE vehicles. The objective of the study is to develop a framework and accompanying visuals to be able to scale this analysis for other states and corridors, provided data are available. With multiple rounds of federal, state, and local investment already having been allocated for a nationwide charging-station network through the National Electric Vehicle Infrastructure (NEVI) program, it is important to be able to longitudinally monitor EV travel trends to help guide these investments.

3.2. Study Location

Figure 1 shows a high-level overview of the study location—the entire state of Indiana, including all 92 counties (shown by light-gray borders) as well as 12 interstate routes (shown by solid blue lines). This comprises 7 primary routes running north–south or east–west (I-64, I-65, I-69, I-70, I-74, I-90, I-94) as well as 5 auxiliary routes that are beltways or bypasses around major metropolitan areas (I-265, I-275, I-465, I-469, I-865) such as Indianapolis, Louisville, Cincinnati, and Fort Wayne. Interstate 80 (I-80) is excluded from the analysis on account of its complete concurrency in the state of Indiana with interstate routes I-94 and I-90.

3.3. CV Data

Commercially available crowdsourced connected vehicle data were obtained from a third-party provider for this study. The data contained geolocation, speed, heading, and timestamp information for CVs at approximately 3 s frequency and 3 m geolocation accuracy. Past studies have found these data to have an average market penetration rate, across all classes of vehicles, of 4% to 6% [39,40]. Along with the aforementioned attributes, each CV waypoint also contained an anonymized journey identifier as well as a vehicle classification code attribute, which allows for categorizing the vehicle either as an EV, HV, or ICEV, well documented by past research [41]. For the 16-month study period designated for this analysis from January 2022 through April 2023, a total of nearly 238 billion CV records were used for this study.

3.4. CV Data Pre-Processing

For each CV, whose records are connected by an anonymized journey identifier, pairwise distances between consecutive CV waypoints were computed. These traveled distances were then aggregated at the county level to compute statewide vehicle miles traveled (VMT), and summary statistics from the same have been visualized and discussed in the text that follows. Pairwise distances with a maximum gap of 3 s and a distance traveled of less than 0.1 miles between waypoints (corresponding to a speed of 120 miles per hour) used for this analysis to remove outliers and errors in data reporting. These thresholds for filtering pairwise distances were selected as reasonable tolerances for capturing distances along curves, but may be easily modified according to the study requirements.

4. Results

The text that follows summarizes the findings of this study through three distinct performance measures, namely statewide VMT, VMT along Indiana’s interstate system, and EV trip lengths along Indiana’s interstate system. Each of the following sub-sections documents the methods utilized, the findings, and discusses how stakeholders may utilize these results in data-driven decision making.

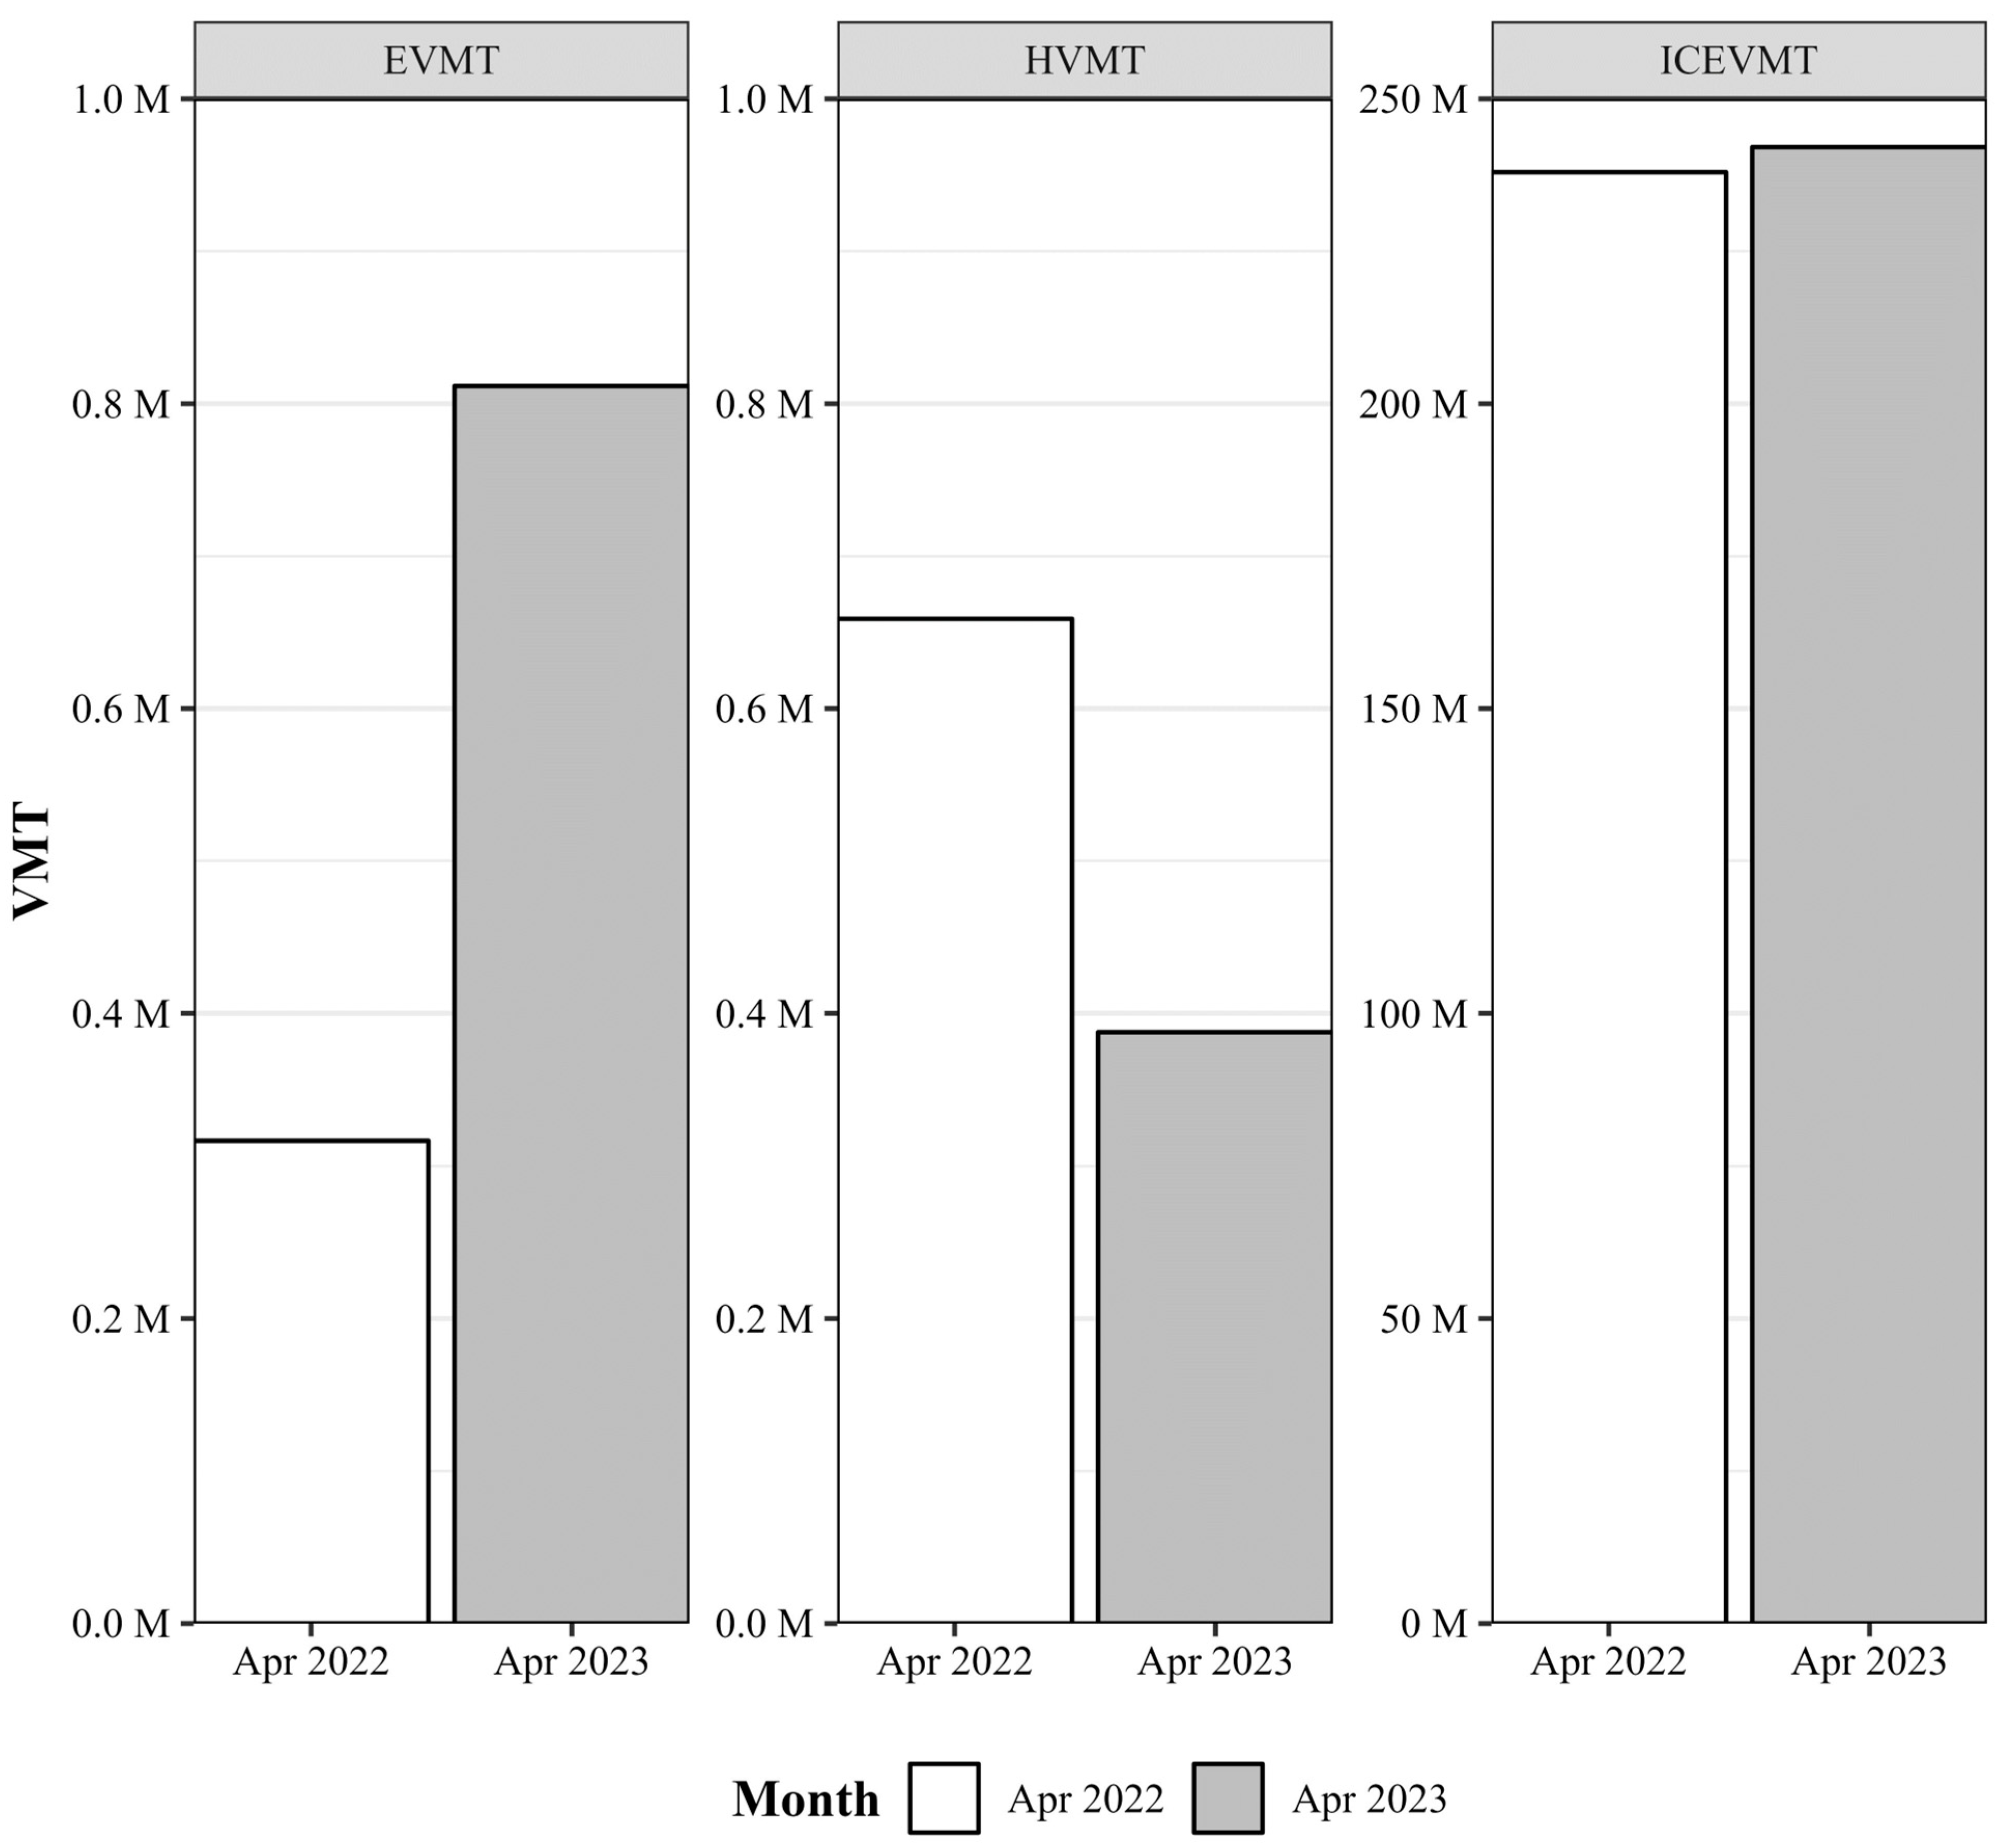
4.1. Statewide VMT Estimates

The first summary visualization developed during the course of this study is statewide VMT, as observed by CVs compared year over year for the month of April between 2022 and 2023, as demonstrated in Figure 2, with VMT being represented on the vertical axis in millions. The graphic shows that EVMT grew in the state year over year by about 156%, while ICEVMT grew only by about 2%. HVMT were seen to have declined year over year by approximately 41%, a change attributable to possible changes in OEM fleet composition, lower sales of hybrid vehicles, or a shift in consumer preference from hybrid vehicles. Due to a lack of visibility regarding OEM fleet composition changes between years, data on hybrid vehicles is not utilized by the analysis and the paper focuses on only ICEV and EV data.
Estimates of year-over-year change in VMT between April 2022 and 2023 found a −0.8% change using estimates from 72 traffic-count stations in Indiana [42]. While the two estimation methods both carry inherent bias, either due to station selection, or due to OEM fleet composition, which makes up the CV data stream, the widely available CV data present a more scalable option for such estimation processes by providing a much temporally and spatially broader sample of data while not being constrained to locations outfitted with sensor infrastructure.
Statewide VMT for EVs show a significant growth in EVMT from 2022 to 2023, which may have been driven by an increase in EV adoption/ownership as well as by an increase in the proportion of connected EVs. This observed increase was most likely due to a combination of growth in the use of existing EVs and new EV models entering the market in 2023. The Indiana Office of Energy Development’s Indiana Vehicle Fuel Dashboard reports that registered electric vehicles increased from about 15.9 k in 2022 to 24.0 k in 2023, a nearly 51% increase [43]. Only a 1.54% increase in all registered vehicles (6.5M to 6.6M) was reported for the two years, similar to the 2% rise in ICEVMT observed among the CV data. At the national level, the latest estimates available from the Argonne National Laboratory report that light-duty EV miles driven increased by 57% from 2020 to 2021 [44,45]. They also report an increase in light-duty EV miles driven for every passing year from 2011 to 2021.
However, there is a significant lag time in obtaining those values. With the methodologies and visuals proposed by this study, EVMT, HVMT, and ICEVMT may be monitored in near real-time using CV data that closely reflect real-world passenger-vehicle travel trends.
Table 1 summarizes these statewide VMT statistics by county and highlights the top 10 counties by total VMT in April 2023 and the change in VMT seen for them year over year. The top three counties with the highest VMT in 2023 were Marion, Lake, and Allen, all home to major cities, namely Indianapolis, Gary, and Fort Wayne, respectively. As can be seen from the last column of the table, the ICEVMT for these counties did not change by more than −1 to 3%, a relatively minor change. However, EVMT changes for these counties were all higher than 100%, except for St. Joseph county at the northern Indiana border with Michigan. Such granular insights down to the county level on how electric, hybrid, and internal-combustion-engine vehicles are being driven are important insights for planners and agencies to help in allocating infrastructure improvements. 7 of these top 10 counties are also part of the top 10 counties in Indiana with highest percentage of urban land area, an indicator of EVMT growing significantly and quickest in urban areas.

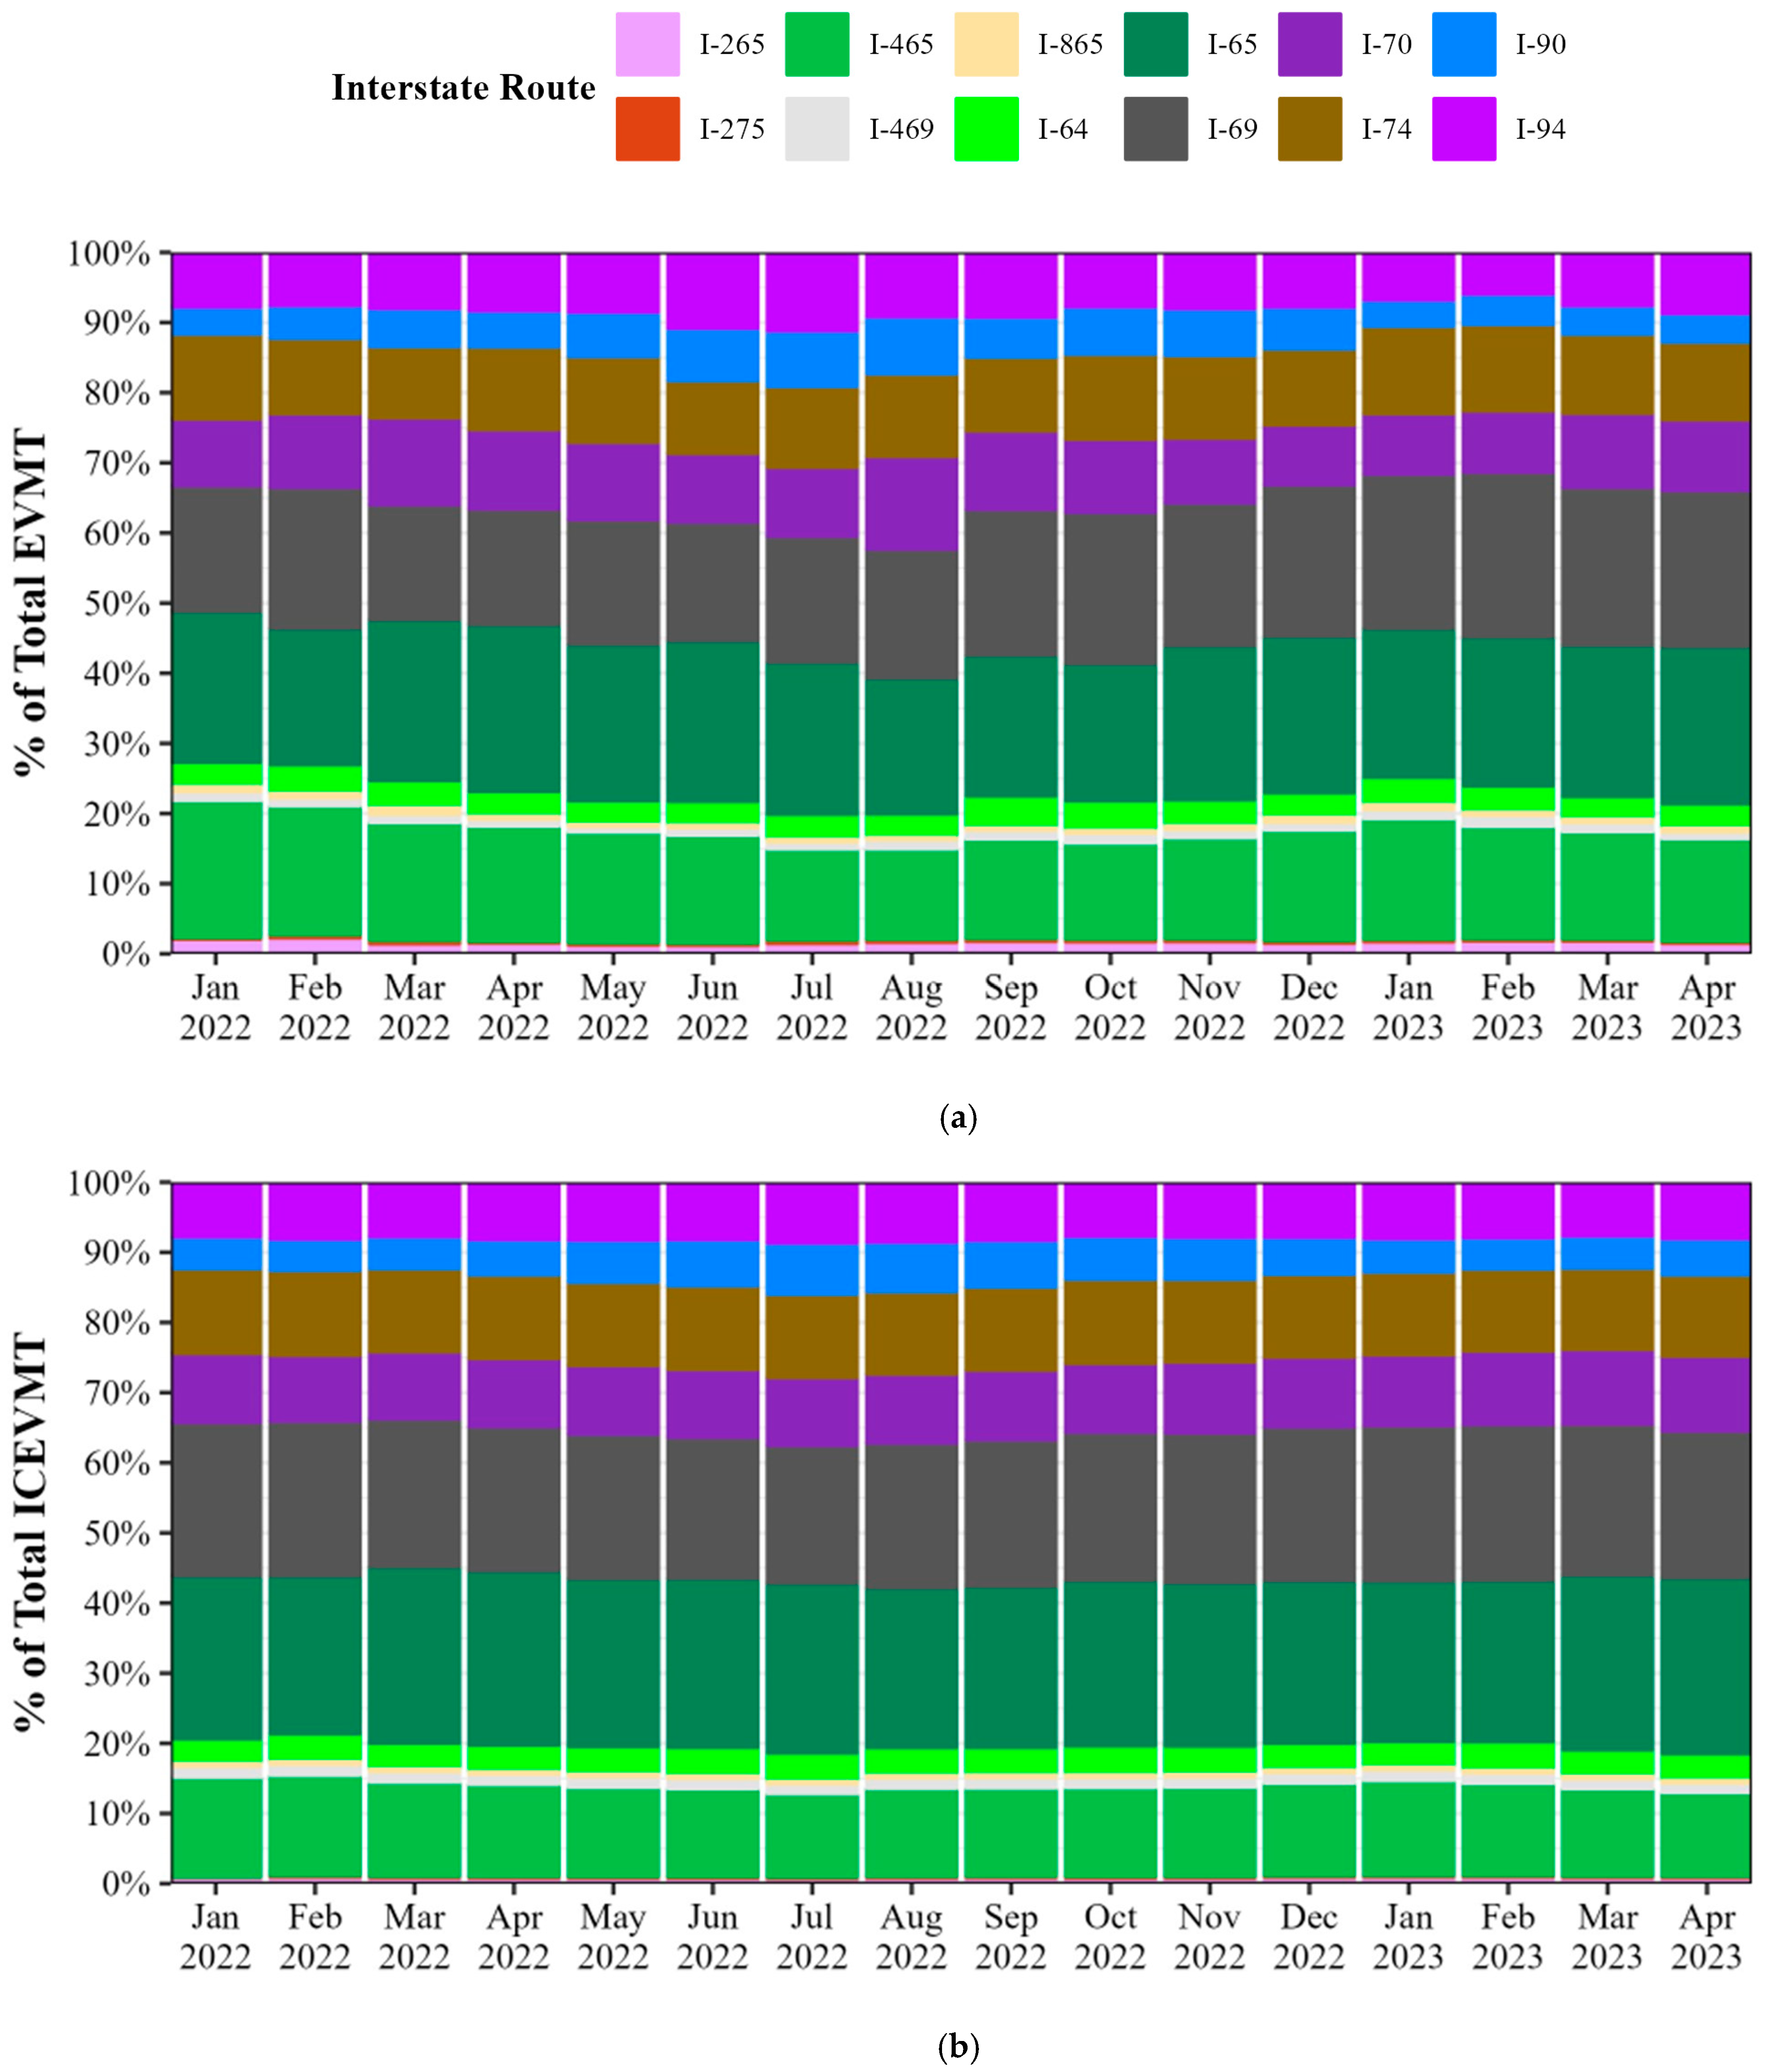
4.2. Interstate System VMT

Following the statewide VMT analysis from the previous section, it is possible to conduct a similar analysis of VMT by any functional class of roadway in a road network where enough CV data are available. For the purposes of this analysis, efforts were focused on only the interstate system in Indiana. However, this analysis is easily scalable and repeatable for any chosen roadway. VMT were individually computed for every 0.1 mile segment (by tallying the number of unique EV, HV, and ICEV journeys traversing each segment) of 12 interstate routes in the state, spanning more than 2600 directional miles. Figure 3 shows the results of this analysis in a 16-month longitudinal summary of EVMT (Figure 3a) and ICEVMT (Figure 3b) for Indiana’s interstate system. Similar trends as those seen at the statewide level are visible in the interstate analysis. EVMT increases from approximately 51,000 in January 2022 to 77,000 in April 2022, and almost 214,000 by April 2023. This increase can be attributed to several factors—an increase in EV ownership and adoption, a change in OEM fleet composition that comprises the CV data, and a change in EV usage trends. While the CV dataset used for this analysis is not a true random sample representing vehicle ownership in the U.S., the visuals and performance measures shown here represent a scalable framework that can be utilized to longitudinally track EV use over time by public agencies as well as OEMs. Seasonal trends in VMT are evident from this graphic, with numbers significantly lower in the winter months when travel is impacted by inclement weather, affecting EV battery and range performance, and returning to prior levels with the onset of the summer months. Traffic-volume trend reports published by the Federal Highway Administration [46,47] show similar seasonal trends in VMT across the US, and thus validate the seasonality of ICEVMT as well as EVMT, shown by the monthly values in Figure 3.
Figure 4 shows a similar monthly visualization of Indiana interstate VMT with a further level of categorization by interstate route for EVMT (Figure 4a) as well as ICEVMT (Figure 4b). While the distributions of the percentages of ICEVMT for each route vary very minimally across the 16-month study period, EVMT distributions by route appear to change by a sufficient amount month over month. I-90 percentages, for example, appear to be the highest during the summer months of June, July, and August. Monitoring route-level VMT in such frequent monthly, weekly, or even daily intervals using easy-to-understand visuals such as these will help stakeholders monitor route preference trends for motorists using their EVs to help inform future rounds of infrastructure investment in alternative fuel corridors. This graphic also further illustrates the heavier impact of seasonality on EVMT than on ICEVMT, which seems relatively stable throughout the year. While the percentage distributions of EVMT or ICEVMT that an interstate route accounts for may be very closely aligned as of now, as the national network of NEVI-funded charging stations is deployed, agencies may start to see EVMT increases on routes that see higher or earlier charging-station deployments, allowing them to quantitatively gauge the impact of their infrastructure investments, and plan for future funding targets based on observed gaps in usage or charging availability.

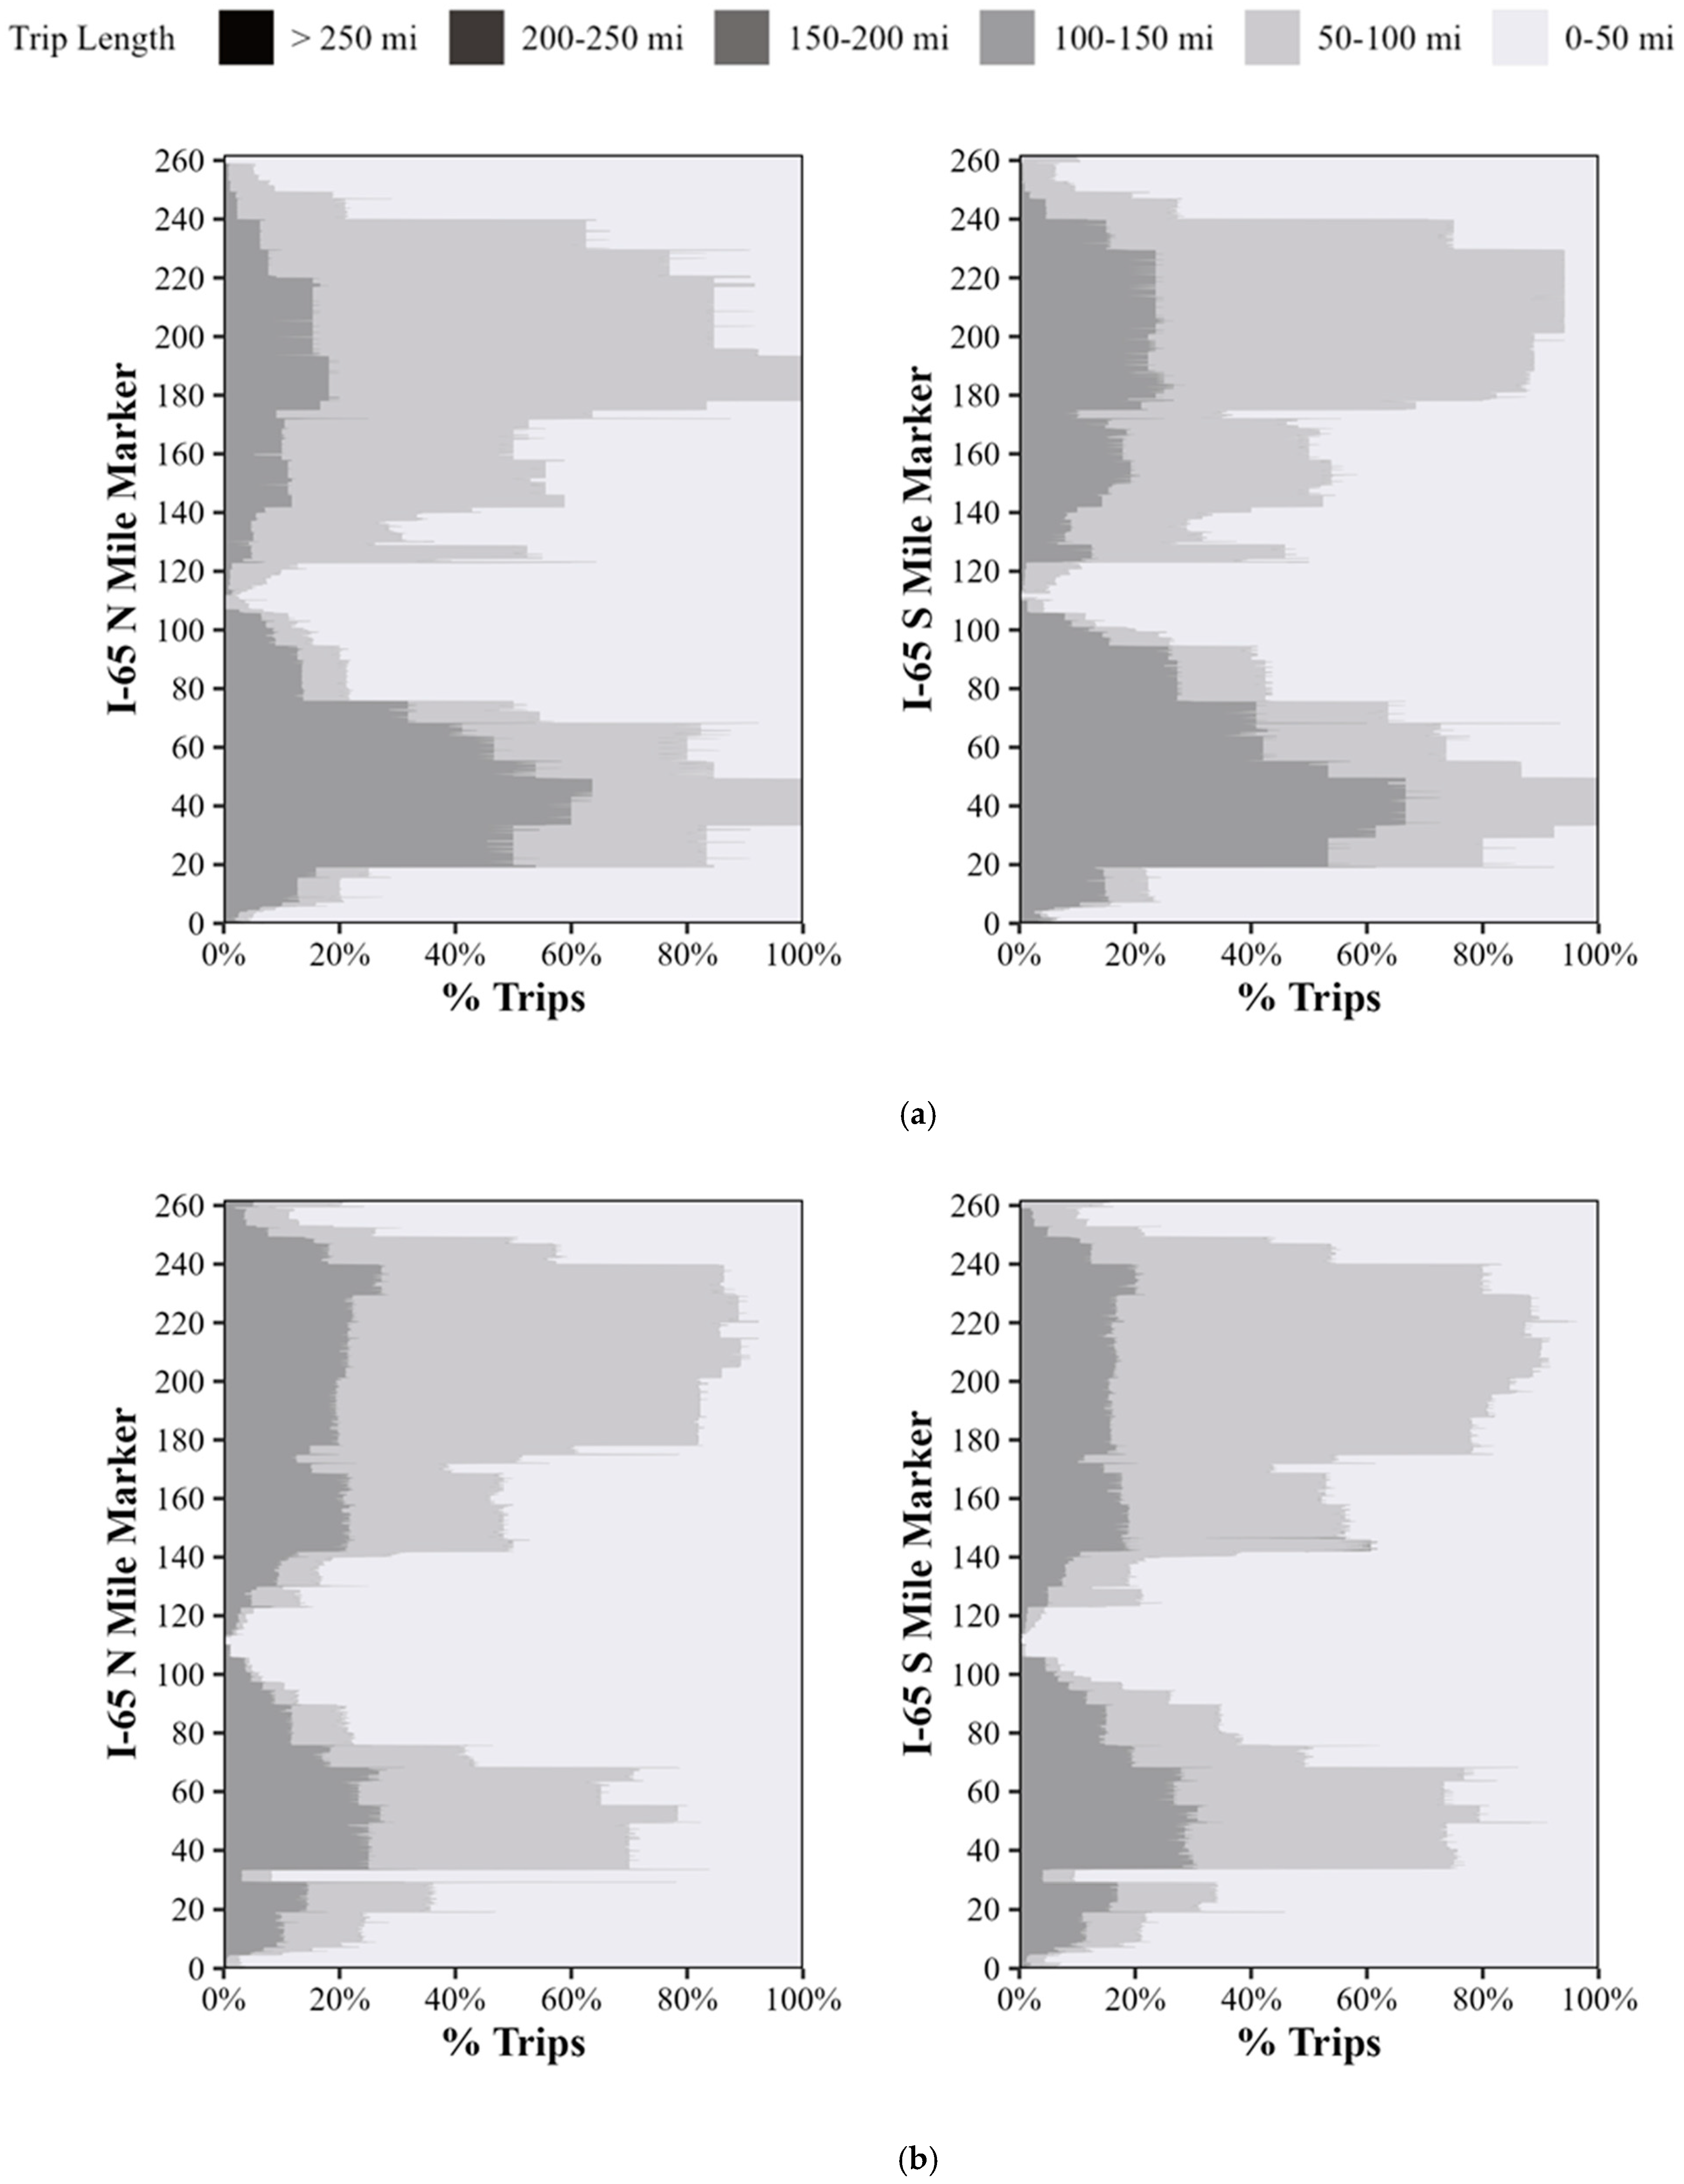
4.3. Interstate-System Trip Lengths

Using an anonymized journey identifier that connects and represents each CV trip uniquely, the maximum and minimum mile marker along an interstate through which a CV trip passed were mapped, and the difference between them was used to represent the trip length that the CV traveled for on an interstate route. While this is not a perfect measure of trip length in cases where CV trips may have taken detours off of the interstate before rejoining it, this is a quick and systematic check for the number of miles for which a CV could be assumed to have utilized the interstate route, much like toll pricing procedures that work off of the point of entry and point of exit from a route to determine road-use charges. Subsequently, this methodology for estimating trip lengths (henceforth referred to as trip length for simplicity) is applied to all CV trips passing through an interstate to categorize each trip into 50-mile bins of trip length, starting from 0 to 50 mi, 50–100 mi, 100–150 mi, 150–200 mi, 200–250 mi, and >250 mi. Once each trip is assigned its corresponding trip length, a trip-profile visualization such as that shown in Figure 5 is generated. The vertical axis represents the position along the interstate route split by 0.1 miles, while the horizontal axis indicates a stacked count of EV trips passing through each such 0.1 mile section of interstate stacked by the overall trip length they traveled for on the interstate. A ‘Trip Length’ legend at the top of the figure categorizes trips into six different categories of trip lengths in 50 mile increments, starting from ‘0–50 mi’. Figure 5a shows this visual for EV trips utilizing the I-65 in April 2022, while Figure 5b shows a corresponding visual for all 262 miles of the I-65 in April 2023. The graphic is separated by direction of travel, with I-65 northbound (N) trip profiles shown on the left and southbound (S) trip profiles shown on the right. Figure 5a shows only a few trips longer than 50 miles on the I-65 in April 2022, with trips near the Indianapolis downtown region (approximately MM 100-130) being almost exclusively less than 50 miles, perhaps due to local commuter traffic where the interstate passes through the city of Indianapolis. Similarly, most trips near mile marker 0 as well as mile marker 262 are short-length local trips for the route passing through Louisville and Gary, respectively, both major population centers. However, Figure 5b shows a stark contrast from 2022, wherein the number of long-range EV trips (50 miles or more, shown by the gray shaded sections) grew significantly in the northern half of the route (connecting Indianapolis to Chicago, Illinois) and in the southern half (connecting Indianapolis to Louisville, Kentucky). As this change in trip counts may have been a result of the increase in CV market penetration, to normalize the visual, a 100% stacked visual of trips categorized by length is shown in Figure 6. Notably, for both directions of travel, a significant percentage of trips in the 50–100 mi category decreased and the proportion of trips in the 100–150 mi category increased. This may be attributable to potential new charging-station deployments along the route in the rural sections of the interstate, south of mile marker 100 and north of mile marker 130, leading to higher EV use for long-range travel with the added infrastructure availability in the region. Using fast-charging-station locations provided by the Alternative Fuels Data Center [48], numbers suggest an increase in fast-charging stations in Indiana, from 45 at the end of April 2022 to as high as 70 by the end of April 2023.
With upcoming NEVI-funded charging-station deployments to be rolled out in the state in the near term [49], visuals such as Figure 6 will be key in monitoring how these infrastructure investments benefit long-range EV travel along alternative fuel corridors in Indiana.
By aggregating trip lengths for every CV trip on the six longest interstate routes in Indiana, summary statistics were generated on the number of EV trips, their corresponding trip lengths, and the relative change between April 2022 and April 2023. Table 2 summarizes this information at the trip count level by tabulating EV trips 50 miles or longer as a percentage of the total EV trips recorded on the six interstates (separated by direction of travel). The NEVI formula guidance put forth by the Joint Office of Energy and Transportation [50] as well as existing studies [41] has proposed setting 50 miles as the maximum allowable gap on an alternative fuel corridor (AFC) between fast-charging stations. This study follows similar procedures by selecting 50 miles as the threshold for considering an EV trip as long-range travel. Table 2 shows that while the percentage of long-range EV trips on these six corridors has slightly decreased from 2022 to 2023, the count of long-range trips has nearly doubled from 229 to 542, while the total count of EV trips has nearly tripled from 5,190 to 14,757. Tracking these statistics over time will help stakeholders document changes in long-range EV travel trends as charging stations from the first round of NEVI funding are deployed and become operational in the coming months and years.
Table 3 shows the companion summary statistics on how mean and median trip lengths changed between the two years for long-range EV trips (assumed here to be trips that lasted 50 miles or longer along an interstate). Overall, it is observed that across the six major primary interstates in Indiana, the median long-range EV trip length increased by 11.5 miles while the mean value increased by 7.1 miles. This suggests the increased adoption of EVs for longer trips and may potentially be used as a surrogate performance measure for range-anxiety perceptions among EV users/owners. I-69 N and I-69 S, in general, saw the highest increases in mean and median trip lengths among EVs, possibly due to a recently completed construction project in the southwest of Indianapolis that added significant mileage to I-69 by connecting Bloomington to Indianapolis. As additional fast-charging stations are deployed across Indiana, especially along the interstate system which comprises the first round of identified alternative fuel corridors for federal funding, statistics such as these will help demonstrate if the infrastructure deployment is actively leading to a change in EV use on AFCs, in the form of longer trip lengths, and if not, may present decision makers with tactical screening tools to reprioritize and evaluate investment strategies.

5. Conclusions

This study analyzed more than 238 billion connected vehicle records in the state of Indiana over a 16-month period from January 2022 to April 2023 to evaluate longitudinal changes in EV travel trends, using vehicle miles traveled and estimated trip length as the two performance measures. Statewide VMT trends showed a 156% growth in EVMT and a minor 2% growth in ICEVMT year over year from April 2022 to April 2023 (Figure 1). A majority of the top 10 counties for 2023 VMT showed a greater than 100 percent increase in EVMT for April 2023, pointing to significant EVMT growth in urban areas (Table 1). An analysis of Indiana’s interstate system observed a 179% year-over-year increase in EVMT with seasonal trends emerging across routes, while ICEVMT remained relatively stable with minor changes (Figure 3). Finally, a granular analysis of every single EV trip and its estimated trip length showed significant growth in the number of long-range EV trips (at least 50 miles) on Indiana interstates, with mean and median trip lengths increasing by 7.1 and 11.5 miles, respectively (Table 3). The three-tiered analysis presented by this study—with statewide, interstate system, and trip levels—demonstrates the scalability and repeatability of the proposed frameworks and visualizations for any region and road network of interest, provided the data are available. These techniques are not only applicable for data-driven decision making at the local or statewide scale, but also at a national or global scale, as countries around the world are planning and deploying electrified mobility ecosystems. State departments of transportation, for example, could utilize these proposed visualizations to understand and quantify the return on their charging infrastructure investments and allow them to plan future investments using data-driven insights provided by this study. The automotive industry could similarly glean insights into how customers are utilizing electric vehicles—for short- or long-range travel, along with spatial and temporal trends in usage, and thus help guide future equipment design and production to best fit the demands of the passenger-vehicle market.
While the authors acknowledge that the CV dataset used in this study is not a true sample of all ICEV, HV, and EVs in the state, which is one of the major limitations of this study, the proposed methodologies and visuals should serve as a guideline for conducting such longitudinal evaluations of EV travel trends to help prioritize infrastructure investment decision making. Additionally, the methodologies proposed herein will need to be optimized for computational as well as cost efficiency as the penetration of connected vehicle data continues to grow, resulting in increased data volumes which may in turn lead to significant cloud data warehousing and analysis costs.
The various methodologies, visualizations, and resulting insights obtained by this study add to the state of the art by demonstrating the scalability and applicability of large-scale CV data towards monitoring EV travel trends at the statewide and route level. While existing research has focused on analyzing shorter time periods of CV data, this study presents a novel longitudinal 16-month analysis of EV travel trends by analyzing nearly 238 billion CV records. Moreover, prevailing data collection practices for measuring VMT or trip lengths do not tend to take into account the vehicle type (EV, HV, or ICEV), which is made possible by CV data and the techniques developed by this study.
Future research in this space will focus on adding contextual information to better understand the relationships between the various factors leading to the increase or decrease in VMT and trip lengths of EVs across a road network, including but not limited to the placement, availability, and accessibility of fast-charging infrastructure, socioeconomic and demographic factors, federal, state, and local subsidies on EV purchases, among others.
Furthermore, the authors believe the scalable methodologies introduced in this paper will lead to further dialogue between public- and private-sector partners to develop a shared vision on privacy-protecting data-sharing practices that provide critical performance measures to guide policy and investment priorities that support the growth of EVs (Figure 7). A circle of trust among the private sector, public sector, and academic institutions will help bring about an enhanced CV dataset that is more representative of the U.S. traffic fleet with enhanced privacy protections in place, thus allowing for a more holistic outlook of vehicular travel trends and enabling accurate data-driven decision making. This will also benefit the automotive industry by ensuring that publicly funded charging infrastructure placement decisions are informed by real-world data.

Author Contributions

Conceptualization, J.D., J.K.M., N.J.S. and D.M.B.; Data curation, J.D. and J.K.M.; Formal analysis, J.D. and D.M.B.; Funding acquisition, D.M.B.; Investigation, N.J.S. and D.M.B.; Methodology, J.D., J.K.M. and D.M.B.; Supervision, D.M.B.; Validation, N.J.S. and D.M.B.; Visualization, J.D. and J.K.M.; Writing—original draft, J.D. and D.M.B.; Writing—review and editing, J.D., N.J.S. and D.M.B. All authors reviewed the results and approved the final version of the manuscript.

Funding

This research was funded by the ASPIRE award, an Engineering Research Center program by the National Science Foundation (NSF), grant no. EEC-1941524, and the Joint Transportation Research Program administered by the Indiana Department of Transportation and Purdue University.

Data Availability Statement

The original contributions presented in the study are included in the article, further inquiries can be directed to the corresponding author.

Acknowledgments

Connected vehicle trajectory data for January 2022–April 2023 used in this study were provided by Wejo Data Services Inc. Google Cloud Platform’s Big Query was utilized for the cloud database analysis and warehousing. The contents of this paper reflect the views of the authors, who are responsible for the facts and the accuracy of the data presented herein, and do not necessarily reflect the official views or policies of the sponsoring organizations. These contents do not constitute a standard, specification, or regulation.

Conflicts of Interest

The authors declare no conflicts of interest.

References

  1. Kumapley, R.K.; Fricker, J.D. Review of Methods for Estimating Vehicle Miles Traveled. Transp. Res. Rec. 1996, 1551, 59–66. [Google Scholar] [CrossRef]
  2. Alberini, A.; Teja Burra, L.; Cirillo, C.; Shen, C. Counting vehicle miles traveled: What can we learn from the NHTS? Transp. Res. Part D Transp. Environ. 2021, 98, 102984. [Google Scholar] [CrossRef]
  3. Williams, T.A.; Chigoy, B.; Borowiec, J.D.; Glover, B.; Texas A&M Transportation Institute. Methodologies Used to Estimate and Forecast Vehicle Miles Traveled (VMT): Final Report. PRC 15-40 F. July 2016. Available online: https://rosap.ntl.bts.gov/view/dot/32689 (accessed on 27 July 2024).
  4. Davis, L.W. How much are electric vehicles driven? Appl. Econ. Lett. 2019, 26, 1497–1502. [Google Scholar] [CrossRef]
  5. How Much Are Electric Vehicles Driven? Depends on the EV|MIT Climate Portal. Available online: https://climate.mit.edu/posts/how-much-are-electric-vehicles-driven-depends-ev (accessed on 11 September 2024).
  6. Rentziou, A.; Gkritza, K.; Souleyrette, R.R. VMT, energy consumption, and GHG emissions forecasting for passenger transportation. Transp. Res. Part A Policy Pract. 2012, 46, 487–500. [Google Scholar] [CrossRef]
  7. Puentes, R.; Tomer, A. The Road…Less Traveled: An Analysis of Vehicle Miles Traveled Trends in the U.S. December 2008. Available online: https://rosap.ntl.bts.gov/view/dot/18145 (accessed on 16 September 2024).
  8. Fricker, J.; Kumapley, R. Updating Procedures to Estimate and Forecast Vehicle-Miles Traveled; FHWA/IN/JTRP-2002/10; Purdue University: West Lafayette, IN, USA, 2002; p. 2468. [Google Scholar] [CrossRef]
  9. Liu, F.; Kaiser, R.G.; Zekkos, M.; Allison, C. Growth Forecasting of Vehicle Miles of Travel at County and Statewide Levels. Transp. Res. Rec. 2006, 1957, 56–65. [Google Scholar] [CrossRef]
  10. Szekeres, D.; Koppula, N.; Frazier, J. VMT Forecasting Alternatives for Air Quality Analysis. In Transportation Land Use, Planning, and Air Quality; American Society of Civil Engineers: Reston, VA, USA, 2012; pp. 110–117. [Google Scholar] [CrossRef]
  11. Bhat, C.R.; Nair, H.S. VMT-Mix Modeling for Mobile Source Emissions Forecasting: Formulation and Empirical Application. Transp. Res. Rec. 2000, 1738, 39–48. [Google Scholar] [CrossRef]
  12. Fan, J.; Fu, C.; Stewart, K.; Zhang, L. Using big GPS trajectory data analytics for vehicle miles traveled estimation. Transp. Res. Part C Emerg. Technol. 2019, 103, 298–307. [Google Scholar] [CrossRef]
  13. Desai, J.; Mathew, J.K.; Li, H.; Sakhare, R.S.; Horton, D.; Bullock, D.M. Analysis of Connected Vehicle Data to Quantify National Mobility Impacts of Winter Storms for Decision Makers and Media Reports. Future Transp. 2023, 3, 1292–1309. [Google Scholar] [CrossRef]
  14. Concas, S.; Kourtellis, A.; Kummetha, V.; Kamrani, M.; Rabbani, M.; Dokur, O. Longitudinal Study of the COVID-19 Pandemic Impact on Activity Travel Using Connected Vehicle Data. Transp. Res. Rec. 2022. [Google Scholar] [CrossRef]
  15. Wang, D.; Gao, J.; Li, P.; Wang, B.; Zhang, C.; Saxena, S. Modeling of plug-in electric vehicle travel patterns and charging load based on trip chain generation. J. Power Sources 2017, 359, 468–479. [Google Scholar] [CrossRef]
  16. Tamor, M.A.; Moraal, P.E.; Reprogle, B.; Milačić, M. Rapid estimation of electric vehicle acceptance using a general description of driving patterns. Transp. Res. Part C Emerg. Technol. 2015, 51, 136–148. [Google Scholar] [CrossRef]
  17. Jedwanna, K.; Boonsiripant, S. Evaluation of Bluetooth Detectors in Travel Time Estimation. Sustainability 2022, 14, 4591. [Google Scholar] [CrossRef]
  18. Saldivar-Carranza, E.D.; Li, H.; Mathew, J.K.; Desai, J.; Platte, T.; Gayen, S.; Sturdevant, J.; Taylor, M.; Fisher, C.; Bullock, D.M. Next Generation Traffic Signal Performance Measures: Leveraging Connected Vehicle Data; Purdue University Press: West Lafayette, IN, USA, 2023. [Google Scholar] [CrossRef]
  19. Mathew, J.K.; Desai, J.C.; Sakhare, R.S.; Kim, W.; Li, H.; Bullock, D.M. Big Data Applications for Managing Roadways. Inst. Transp. Eng. ITE J. 2021, 91, 28–35. [Google Scholar]
  20. Desai, J.; Mathew, J.K.; Li, H.; Bullock, D.M. Using Connected Vehicle Data for Assessing Electric Vehicle Charging Infrastructure Usage and Investment Opportunities. Inst. Transp. Eng. ITE J. 2022, 92, 22–31. [Google Scholar]
  21. Chu, Y.; Cui, H. Annual Update on the Global Transition to Electric Vehicles: 2022; International Council on Clean Transportation: San Francisco, CA, USA, 2023; Available online: https://theicct.org/publication/global-transition-electric-vehicles-update-jun23/ (accessed on 27 July 2024).
  22. Slowik, P.; Lutsey, N. The Continued Transition to Electric Vehicles in U.S. Cities; International Council on Clean Transportation: San Francisco, CA, USA, 2018; Available online: https://theicct.org/publication/the-continued-transition-to-electric-vehicles-in-u-s-cities/ (accessed on 18 September 2024).
  23. Brown, A.; Cappellucci, J.; Heinrich, A.; Cost, E. Electric Vehicle Charging Infrastructure Trends from the Alternative Fueling Station Locator: Fourth Quarter 2023; NREL/TP-5400-89108; National Renewable Energy Laboratory (NREL): Golden, CO, USA, 2024. [CrossRef]
  24. Borlaug, B.; Yang, F.; Pritchard, E.; Wood, E.; Gonder, J. Public electric vehicle charging station utilization in the United States. Transp. Res. Part D Transp. Environ. 2023, 114, 103564. [Google Scholar] [CrossRef]
  25. Gellrich, M.; Block, A.; Leikert-Böhm, N. Spatial and temporal patterns of electric vehicle charging station utilization: A nationwide case study of Switzerland. Environ. Res. Infrastruct. Sustain. 2022, 2, 021003. [Google Scholar] [CrossRef]
  26. Hecht, C.; Figgener, J.; Sauer, D.U. Analysis of electric vehicle charging station usage and profitability in Germany based on empirical data. iScience 2022, 25, 105634. [Google Scholar] [CrossRef]
  27. Desai, J.; Mathew, J.K.; Mahlberg, J.A.; Li, H.; Bullock, D.M. Using Connected Vehicle Data to Evaluate National Trip Trends. Appl. Sci. 2023, 13, 10228. [Google Scholar] [CrossRef]
  28. Desai, J.; Mathew, J.K.; Li, H.; Bullock, D.M. Leveraging Connected Vehicle Data to Assess Interstate Exit Utilization and Identify Charging Infrastructure Investment Allocation Opportunities. World Electr. Veh. J. 2022, 13, 167. [Google Scholar] [CrossRef]
  29. Trends in Electric Cars–Global EV Outlook 2024–Analysis. Available online: https://www.iea.org/reports/global-ev-outlook-2024/trends-in-electric-cars (accessed on 11 September 2024).
  30. Alanazi, F. Electric Vehicles: Benefits, Challenges, and Potential Solutions for Widespread Adaptation. Appl. Sci. 2023, 13, 6016. [Google Scholar] [CrossRef]
  31. Singh, P.P.; Wen, F.; Palu, I.; Sachan, S.; Deb, S. Electric Vehicles Charging Infrastructure Demand and Deployment: Challenges and Solutions. Energies 2023, 16, 7. [Google Scholar] [CrossRef]
  32. Holland, S.P.; Mansur, E.T.; Muller, N.Z.; Yates, A.J. Are There Environmental Benefits from Driving Electric Vehicles? The Importance of Local Factors. Am. Econ. Rev. 2016, 106, 3700–3729. [Google Scholar] [CrossRef]
  33. Li, C.; Cao, Y.; Zhang, M.; Wang, J.; Liu, J.; Shi, H.; Geng, Y. Hidden Benefits of Electric Vehicles for Addressing Climate Change. Sci. Rep. 2015, 5, 9213. [Google Scholar] [CrossRef] [PubMed]
  34. Buekers, J.; Van Holderbeke, M.; Bierkens, J.; Int Panis, L. Health and environmental benefits related to electric vehicle introduction in EU countries. Transp. Res. Part D Transp. Environ. 2014, 33, 26–38. [Google Scholar] [CrossRef]
  35. Bauer, G.; Hsu, C.W.; Lutsey, N. When Might Lower-Income Drivers Benefit from Electric Vehicles? Quantifying the Economic Equity Implications of Electric Vehicle Adoption; International Council on Clean Transportation: San Francisco, CA, USA, 2021; Available online: https://theicct.org/publication/when-might-lower-income-drivers-benefit-from-electric-vehicles-quantifying-the-economic-equity-implications-of-electric-vehicle-adoption/ (accessed on 18 September 2024).
  36. Patil, H.; Kalkhambkar, V.N. Grid Integration of Electric Vehicles for Economic Benefits: A Review. J. Mod. Power Syst. Clean Energy 2021, 9, 13–26. [Google Scholar] [CrossRef]
  37. Kene, R.; Olwal, T.; van Wyk, B.J. Sustainable Electric Vehicle Transportation. Sustainability 2021, 13, 12379. [Google Scholar] [CrossRef]
  38. Adnan, N.; Nordin, S.M.; Rahman, I.; Vasant, P.; Noor, M.A. An Overview of Electric Vehicle Technology: A Vision Towards Sustainable Transportation. In Intelligent Transportation and Planning: Breakthroughs in Research and Practice; IGI Global: Hershey, PA, USA, 2018; pp. 292–309. ISBN 978-1-5225-5210-9. [Google Scholar]
  39. Sakhare, R.S.; Hunter, M.; Mukai, J.; Li, H.; Bullock, D.M. Truck and Passenger Car Connected Vehicle Penetration on Indiana Roadways. J. Transp. Technol. 2022, 12, 578–599. [Google Scholar] [CrossRef]
  40. Hunter, M.; Mathew, J.K.; Li, H.; Bullock, D.M. Estimation of Connected Vehicle Penetration on US Roads in Indiana, Ohio, and Pennsylvania. JTTs 2021, 11, 597–610. [Google Scholar] [CrossRef]
  41. Desai, J.; Mathew, J.K.; Li, H.; Bullock, D.M. Analysis of Electric and Hybrid Vehicle Usage in Proximity to Charging Infrastructure in Indiana. J. Transp. Technol. 2021, 11, 577–596. [Google Scholar] [CrossRef]
  42. Changes on All Estimated Roads by Region and State-April 2023-Policy|Federal Highway Administration. Available online: https://www.fhwa.dot.gov/policyinformation/travel_monitoring/23aprtvt/page6.cfm (accessed on 27 July 2024).
  43. OED. Indiana Vehicle Fuel Dashboard. OED. Available online: https://www.in.gov/oed/resources-and-information-center/vehicle-fuel-dashboard/ (accessed on 26 March 2024).
  44. FOTW #1266: November 28, 2022: Light-Duty Plug-In Electric Vehicles in the United States Traveled 19 Billion Miles on Electricity in 2021. Available online: https://www.energy.gov/eere/vehicles/articles/fotw-1266-november-28-2022-light-duty-plug-electric-vehicles-united-states (accessed on 12 November 2024).
  45. Gohlke, D.; Zhou, Y.; Wu, X.; Courtney, C. Assessment of Light-Duty Plug-in Electric Vehicles in the United States, 2010–2021; ANL-22/71; Argonne National Lab. (ANL): Argonne, IL, USA, 2022. [CrossRef]
  46. FOTW #1285, 10 April 2023: Vehicle Miles Traveled in 2021 and 2022 Followed a Similar Monthly Pattern as the Years Preceding the Pandemic. Available online: https://www.energy.gov/eere/vehicles/articles/fotw-1285-april-10-2023-vehicle-miles-traveled-2021-and-2022-followed (accessed on 12 November 2024).
  47. Federal Highway Administration Office of Highway Policy Information. Available online: https://www.fhwa.dot.gov/policyinformation/pubs/hf/pl11028/chapter7.cfm (accessed on 30 July 2024).
  48. Alternative Fuels Data Center: Alternative Fueling Station Locator. Available online: https://afdc.energy.gov/stations/ (accessed on 26 March 2024).
  49. INDOT Electric Vehicle Charging Infrastructure Network. Available online: https://www.in.gov/indot/current-programs/innovative-programs/electric-vehicle-charging-infrastructure-network/ (accessed on 27 July 2024).
  50. FHWA Releases Updated NEVI Formula Program Guidance and Requests AFC Round 7 Nominations · Joint Office of Energy and Transportation. Available online: https://driveelectric.gov/news/corridors-nevi-news (accessed on 27 July 2024).
Figure 1. Study location.
Wevj 15 00560 g001
Figure 2. Statewide vehicle miles traveled by vehicle type (April 2022 and April 2023).
Wevj 15 00560 g002
Figure 3. Monthly change in interstate VMT by vehicle type. (a) Monthly Indiana interstate EVMT. (b) Monthly Indiana interstate ICEVMT.
Wevj 15 00560 g003
Figure 4. Monthly change in Interstate VMT by vehicle type and route. (a) Monthly Indiana interstate EVMT. (b) Monthly Indiana interstate ICEVMT.
Wevj 15 00560 g004
Figure 5. Interstate 65 trips categorized by distance traveled (April 2022, April 2023). (a) April 2022 I-65 EV trips. (b) April 2023 I-65 EV trips.
Wevj 15 00560 g005
Figure 6. Interstate 65 Trips categorized by distance traveled (April 2022, April 2023) (100% distribution). (a) April 2022 I-65 EV trips. (b) April 2023 I-65 EV Trips.
Wevj 15 00560 g006
Figure 7. Potential long-term approach for CV data use by public-sector agencies in conjunction with private-sector partners.
Wevj 15 00560 g007
Table 1. Year-over-year change in statewide VMT by vehicle type for top 10 counties with the highest total VMT in 2023.
CountyEVMT 2022EVMT 2023% ChangeICEVMT 2022ICEVMT 2023% Change
Marion49,159115,660+13531,313,34430,997,404−1
Lake22,40472,420+22318,805,79018,963,582+1
Allen12,02543,129+25911,999,26112,112,747+1
Hamilton23,16751,364+12211,680,80811,947,069+2
Porter12,56526,834+1147,004,8697,096,515+1
Madison6,59414,270+1166,459,6256,505,215+1
Hendricks11,44824,007+1106,238,7406,344,923+2
Johnson468919,734+3215,819,2835,947,739+2
St. Joseph14,22923,758+675,367,9745,544,017+3
Tippecanoe10,17023,550+1325,199,9645,363,598+3
Table 2. Year-over-year change in EV trip counts categorized by trip lengths along six major Indiana Interstates.
RouteApril 2022April 2023
EV Trips ≥ 50 MilesTotal EV TripsEV Trips ≥ 50 MilesTotal EV Trips
I-64 E0 (0.0%)1687 (1.4%)510
I-64 W0 (0.0%)18512 (2.4%)505
I-65 N34 (4.2%)80988 (3.7%)2350
I-65 S42 (4.9%)851101 (4.1%)2445
I-69 N14 (2.2%)62758 (2.9%)2017
I-69 S13 (2.1%)62844 (2.1%)2071
I-70 E38 (10.4%)36572 (7.8%)925
I-70 W47 (12.7%)37164 (7.1%)905
I-74 E7 (1.2%)56225 (1.9%)1340
I-74 W4 (0.9%)45426 (2.1%)1230
I-90 E16 (17.6%)9124 (10.8%)223
I-90 W14 (17.7%)7921 (8.9%)236
Total229 (4.4%)5190542 (3.7%)14,757
Table 3. Year-over-year change in EV trip lengths (for trips 50 miles or longer) along six major Indiana interstates.
RouteApril 2022April 2023
Mean Trip LengthMedian Trip LengthMean Trip LengthMedian Trip Length
I-64 E--93.1 (+)96.6 (+)
I-64 W--79.0 (+)69.3 (+)
I-65 N81.281.287.4 (+6.2)86.7 (+5.5)
I-65 S82.886.885.3 (+2.6)87.1 (+0.3)
I-69 N73.065.380.1 (+7.1)81.8 (+16.5)
I-69 S75.072.485.2 (+10.2)93.0 (+20.6)
I-70 E60.660.265.8 (+5.2)61.3 (+1.1)
I-70 W60.760.265.0 (+4.3)61.1 (+0.9)
I-74 E70.961.074.3 (+3.4)77.8 (+16.8)
I-74 W73.669.672.2 (−1.4)73.0 (+3.4)
I-90 E62.561.967.1 (+4.6)58.8 (−3.1)
I-90 W62.261.362.6 (+0.4)61.7 (+0.4)
Overall70.161.477.2 (+7.1)72.9 (+11.5)
Disclaimer/Publisher’s Note: The statements, opinions and data contained in all publications are solely those of the individual author(s) and contributor(s) and not of MDPI and/or the editor(s). MDPI and/or the editor(s) disclaim responsibility for any injury to people or property resulting from any ideas, methods, instructions or products referred to in the content.

