Article

A Study on Consumers’ Willingness to Purchase Autonomous Vehicles from a Multi-Party Interaction Perspective: A Tripartite Evolutionary Game Model Involving the Government, Automobile Manufacturers, and Consumers

School of Architecture and Transportation Engineering, Guilin University of Electronic Technology, Guilin 541004, China
*
Author to whom correspondence should be addressed.
World Electr. Veh. J. 2024, 15(11), 498; https://doi.org/10.3390/wevj15110498
Submission received: 30 September 2024 / Revised: 21 October 2024 / Accepted: 25 October 2024 / Published: 30 October 2024
(This article belongs to the Special Issue Recent Advances in Autonomous Vehicles)

Abstract

:
With the rapid development of autonomous driving technology, the advent of the autonomous driving era has become inevitable. An in-depth study of consumers’ willingness to purchase autonomous vehicles is critical to accelerating the adoption and commercialization of autonomous vehicles. By constructing a tripartite evolutionary game model of governments, automobile manufacturers, and consumers, we analyze the stable choice of unilateral strategy and equilibrium strategy of autonomous vehicle purchase intention. The MATLAB2022b tool was used for data simulation analysis to verify the validity of the conclusion and the influence of related factors on the purchase intention toward autonomous vehicles. The results show the following: (1) The combination of government support, active R&D, and consumer purchasing is the evolutionary stability strategy (ESS) of the model. (2) With an increase in government support, the probability of automobile enterprises taking the initiative to participate in R&D also increases. However, the negative impact of risk can significantly reduce the incentive for firms to conduct R&D and reduce the effectiveness of government support. (3) Government subsidies to consumers and purchase incentives offered by automotive companies can significantly increase the likelihood that consumers will purchase an autonomous vehicle. Based on these findings, recommendations are made to strengthen government support, establish risk mitigation mechanisms, and strengthen market promotion efforts to promote the commercialization of autonomous vehicles. The study provides a new perspective for understanding multi-party interactions in the rollout of autonomous vehicles and provides valuable insights for policymakers and industry stakeholders.

1. Introduction

According to data from the Ministry of Public Security, the surge in the number of motor vehicles, especially cars, and the large base of motor vehicle drivers in 2023 has provided a broad market demand and testing environment for the research, development, and application of autonomous driving technology. This indicates that autonomous driving technology will play a more important role in the future transportation system and promote profound changes in travel methods. The General Office of the State Council issued the “New Energy Vehicle Industry Development Plan (2021–2035)” [1], showing that the large-scale application of autonomous driving technology is imperative. However, despite the significant potential demonstrated by autonomous driving technology, there are still many uncertainties in the market’s acceptance [2,3,4,5,6] and purchase intention [7]. How to effectively motivate consumers to accept and purchase autonomous vehicles, thereby promoting their popularity in the market, has become an important issue of common concern in both academia and industry.
With the advancement of technology, governments and enterprises of various countries are actively promoting the development of related technologies and policies to facilitate the popularization of autonomous vehicles (AVs). Against this backdrop, government support policies are regarded as an important factor affecting consumer purchase intentions [8]. Xu Meng et al. [9] analyzed the evolution of Beijing’s autonomous vehicle (AUT) market through a system dynamics model, predicting that by 2050, the market share of AVs will exceed 90%. Bernd Kaltenhäuser et al. [10] proposed a model to predict the market penetration rate of passenger transport for autonomous vehicles, indicating that most autonomous vehicles will be privately owned. Huo Zhifang and Liu Gang [11] discussed the practice of the industrialization of AVs in China, emphasizing the importance of vehicle–road collaborative technology and the insufficiency of single-vehicle intelligence in complex road and social environments. Zhang Xinyu et al. [12] summarized the vehicle–road collaborative perception technology and its development trend for connected and automated vehicles (CAVs), pointing out that collaborative perception technology can effectively enhance the vehicle’s perception accuracy and safety. Li Qiuwei and Shen Tong [13] summarized the role of governments in various countries in the development of AVs, emphasizing the importance of policy in the promotion and market popularization of technology. Feng Qianlong et al. [14] analyzed the current status and existing problems of China’s intelligent connected vehicle testing areas and put forward suggestions for promoting the high-quality development of AVs. In addition, Qiuju X et al. [15] discussed the governance issues of AVs in China’s special administrative environment, pointing out the lag in legislation and the conservative regulatory attitude of the government.
The tripartite evolutionary game theory is applicable for exploring the strategic interaction relationships among governments, enterprises, and consumers. For instance, Shi Jianzhong and He Mengru [16] demonstrated through research that the government often plays a key regulatory role in multi-party games. According to the research results of Li Chengbing et al. [17], increasing the government’s punishment can effectively promote the collaborative development of operators and suppliers. Similarly, Jiang Xuehai et al. [18] found through evolutionary game research on the monopoly behavior of digital platforms that a dynamic reward-and-punishment mechanism can significantly improve the strategic choices of all parties in the game, making the system tend to be stable. Hongjuan Wu et al. [19] discussed the game among local governments, developers, and decorators in China’s prefabricated decoration field, revealing the impact of the strategic choices of all parties on market expansion, and verified the reliability of the model through empirical analysis. Zhen Hua Zhang et al. [20] constructed a game model between the government, manufacturing enterprises, and local governments to analyze the impact of central environmental protection inspections on the carbon reduction strategies of all parties. The research shows that under the strict supervision of the government, manufacturing enterprises are more inclined to choose low-carbon management strategies. In addition, Wei Wang et al. [21] studied the carbon reduction game in the construction industry and found that the combination of government regulation and financial investment can significantly enhance the enthusiasm of construction enterprises for carbon reduction.
In the process of purchasing decisions for autonomous vehicles (AVs), consumer behavior is influenced by various factors. Tang Li et al. [22] mentioned in their research on autonomous driving that the public’s acceptance of autonomous driving can be divided into five aspects: possibility and attitude, understanding and trust, perception and concerns, willingness to pay, and usage preferences. Xu Liang et al. [23] pointed out that price is one of the main factors considered by consumers, and high vehicle purchase costs may reduce consumers’ willingness to buy. Kum Fai Yuen et al. [24] believed that trust plays an intermediary role in the influence of the perceived value of autonomous vehicles on public acceptance. Shukai Chen et al. [25] believed that government financial support and subsidy policies can alleviate the negative impact of price on consumers’ willingness to buy to a certain extent. In addition, the complexity and novelty of autonomous driving technology make some consumers doubt its reliability and safety, thus affecting their purchase decisions [26]. Social cognition and risk perception are further important aspects affecting consumer behavior. Cui Xinyue et al. [27] pointed out that consumers’ cognition of the social acceptance and public opinion of autonomous vehicles will significantly affect their willingness to buy. For example, some studies have found that high empathizers are more inclined to buy utilitarian-oriented autonomous vehicles, while low empathizers pay more attention to self-protection when it comes to their own interests [28]. Gill et al. [29] pointed out in their research that potential users of autonomous vehicles attach great importance to safety because the resolution of moral dilemmas depends on the safety of the design. In addition, Liu Zhiwei et al. [30] found that the acceptance of autonomous vehicles by the elderly group largely depends on their trust in the technology and the degree of perceived risk.
Brand influence and consumer personal traits also play an important role in purchase decisions. Wang Lu [31] pointed out that large-brand car manufacturers are often more credible in technology, thus more easily gaining consumer trust. In addition, Ye Xiaofei et al. [32] believed that individual psychological traits, such as the degree of acceptance of new technology and sensitivity to risk, also affect their willingness to buy. From the perspective of behavioral economics theory, prospect theory and planned behavior theory can explain consumers’ decision-making behavior when facing uncertainty and risk. Md Mahmudur Rahman et al. [33] stated that prospect theory indicates that consumers are more cautious when facing potential losses, which may lead them to be conservative about autonomous vehicles. Wang Yunze et al. [34] pointed out that government incentives can effectively enhance consumer acceptance of autonomous vehicles. These policies not only help to reduce consumer purchase costs but also increase trust in new technology, thereby promoting long-term market development [35].
Although extensive research has been conducted on the market development and policy support for autonomous vehicles, emphasizing the importance of technological progress and government support, there is a significant gap in analyzing the dynamic interaction of strategies among key stakeholders under the influence of policy support. This paper employs a tripartite evolutionary game model, constructing a strategic choice model among governments, car manufacturers, and consumers to analyze evolutionary stability in different situations and explore their complex relationships. Through this study, we hope to answer the following core questions: (1) How will the strategic choices of car manufacturers and consumers evolve under the guidance of government support policies? (2) How should the government design and implement support policies to achieve the rapid promotion of autonomous vehicles? (3) Under what circumstances should car manufacturers increase R&D efforts to gain a market advantage? (4) How will consumer purchase intentions be affected when facing different policies and market promotion strategies?

2. Model Construction

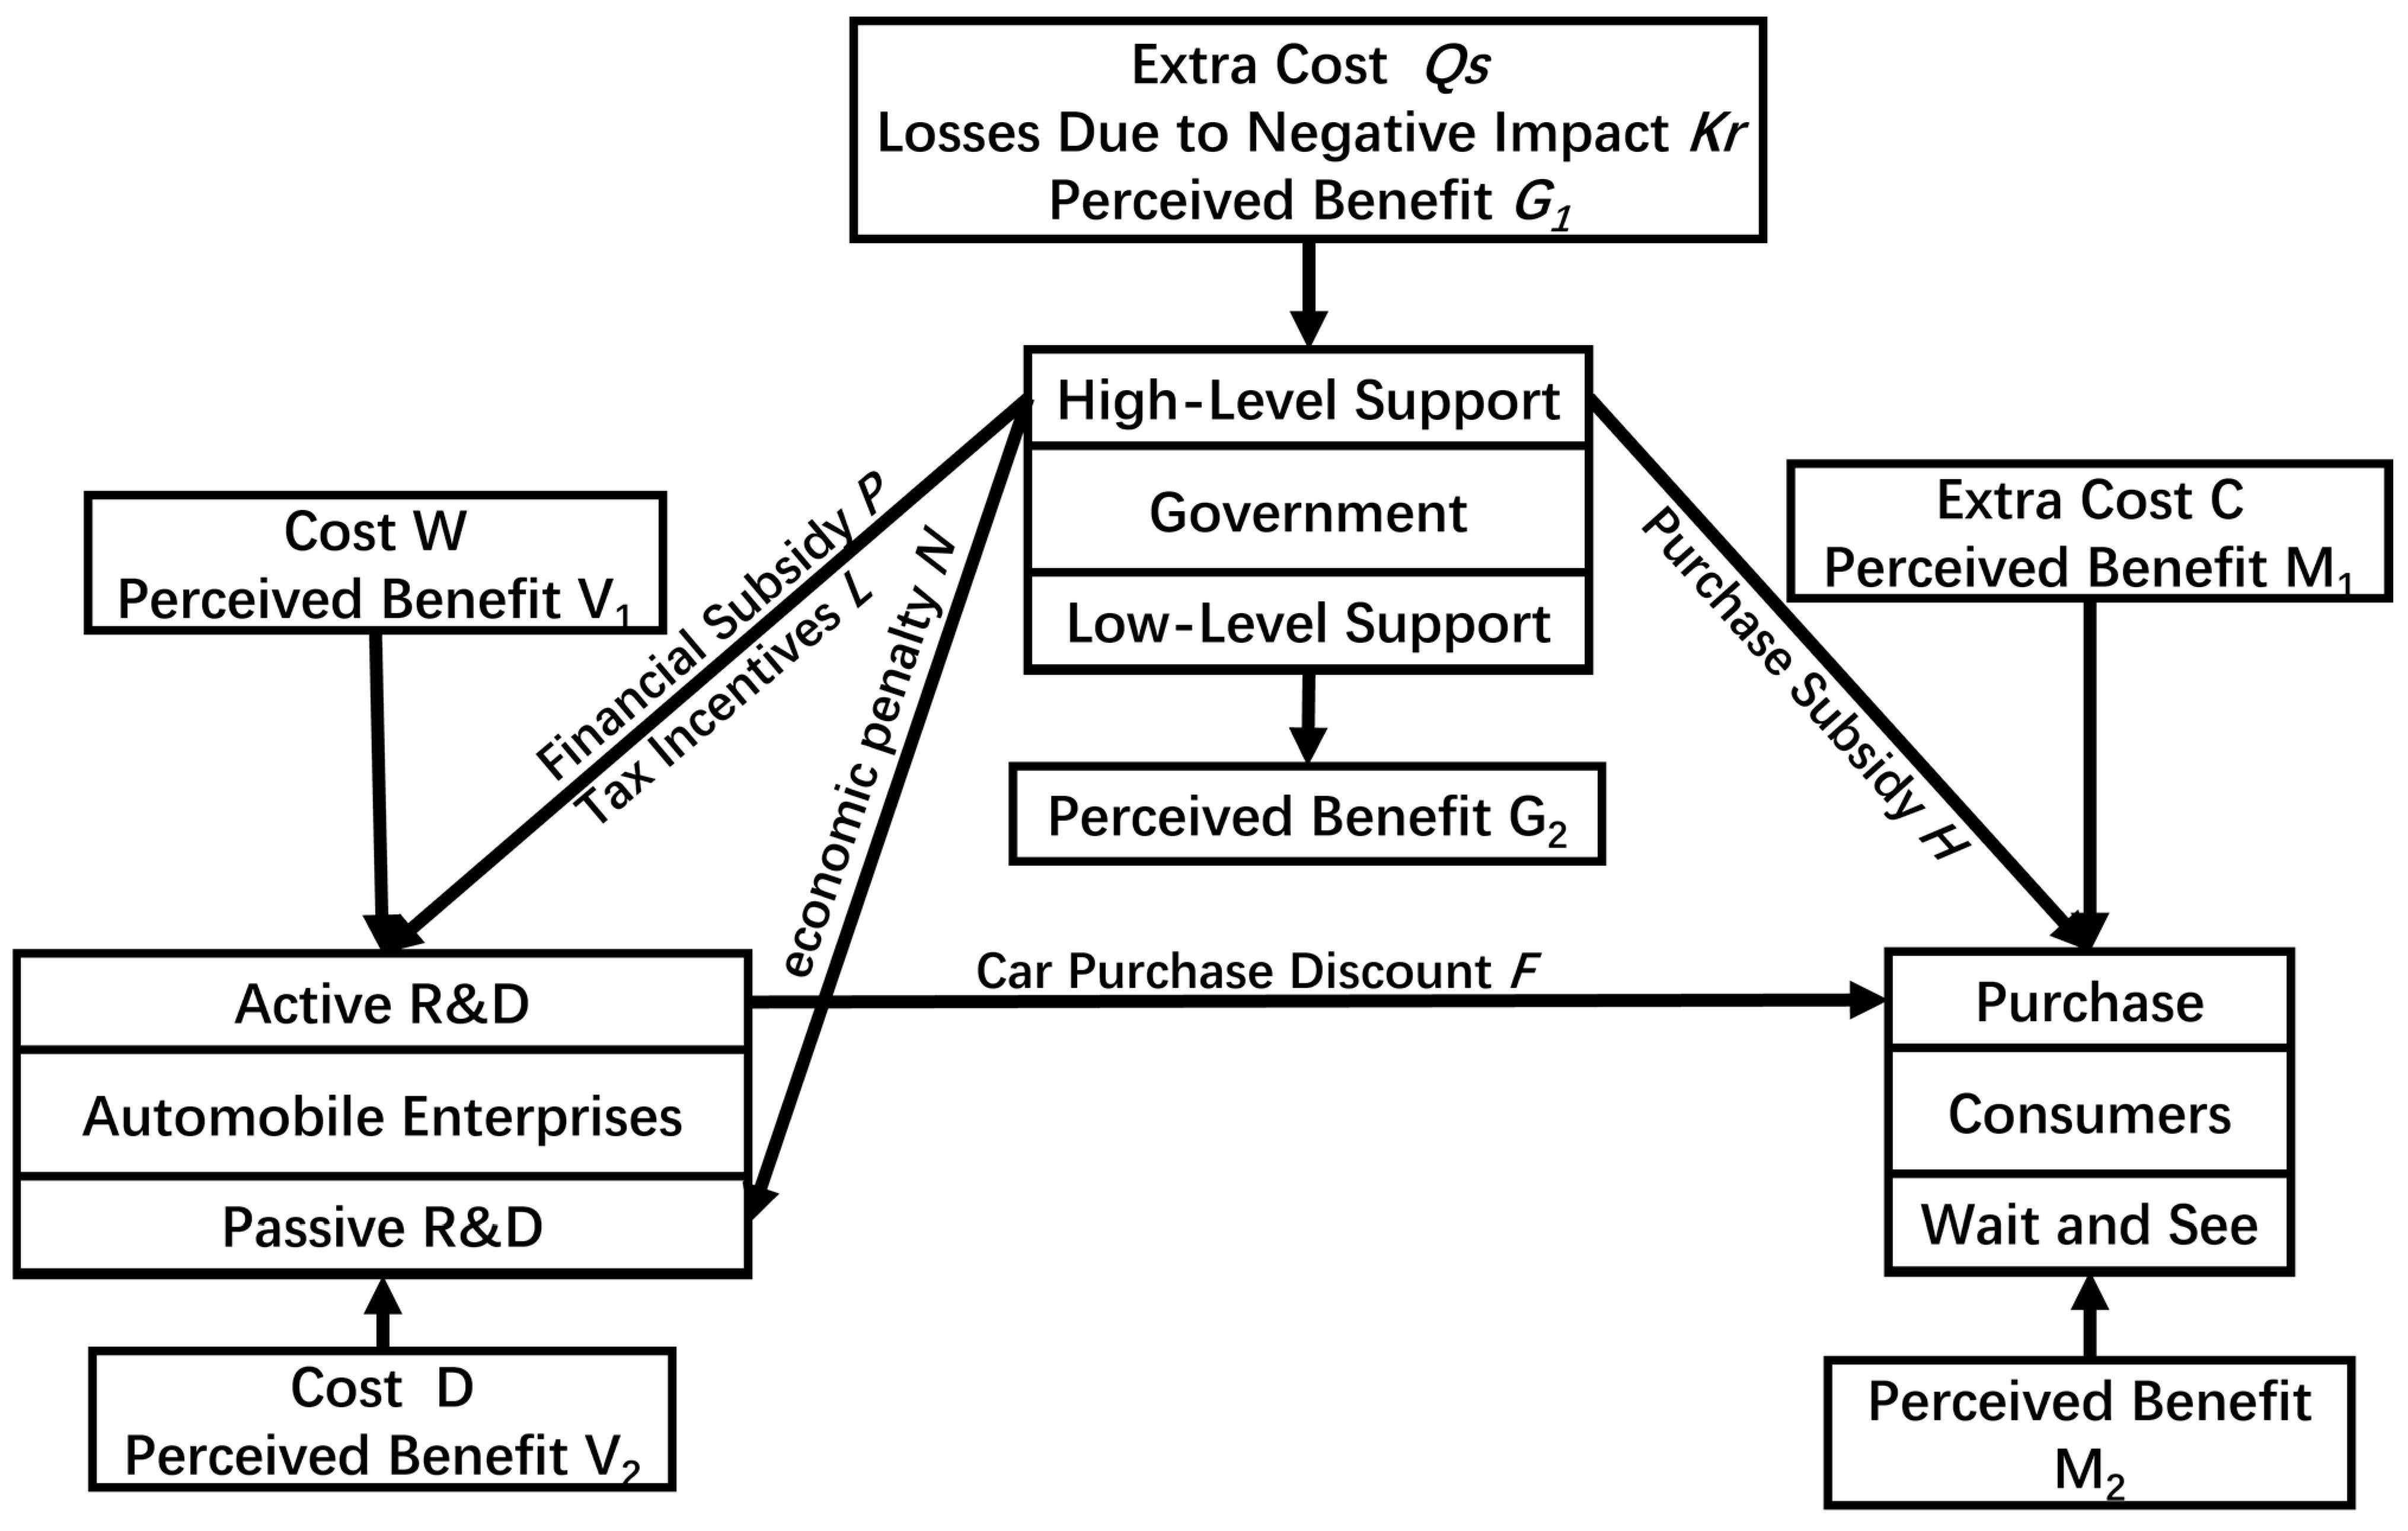
2.1. Description of the Problem

The government, as a policymaker and regulator in the field of autonomous vehicles (AVs), holds the social responsibility of enhancing road safety, promoting technological advancement, and maintaining social stability. Automotive companies continuously innovate and improve technologies to reduce production costs, driven by incentives and market pressures. Consumer behavior directly influences the development and adoption of AVs. The market for AV purchases is primarily driven by consumer willingness to buy these vehicles, which is shaped by their awareness of AVs, trust in the technology, and concerns about safety.
The AV purchase market involves three key stakeholders: the government, automotive companies, and consumers, each playing a crucial role as participants and stakeholders. These three parties aim to maximize their benefits in all situations and adjust their strategies accordingly. Their strategies significantly impact the state and outcomes of the AV purchase market. Evolutionary game theory can be used to analyze the interactions among these three parties. Through this evolutionary game model, the interactions between the government, automotive companies, and consumers can be simulated, allowing for the analysis of behavioral evolution and eventual equilibrium under different strategies. This approach helps government policymakers, corporate strategists, and consumers better understand the evolutionary process and potential changes in the AV market. Therefore, this study selects the government, automotive companies, and consumers as participants in the evolutionary game model. The evolutionary relationship of the three parties is shown in Figure 1.

2.2. Model Assumptions and Parameter Design

Assumption 1: Game Players. The three parties in the game are consumers, car manufacturers, and relevant government departments, all of which are boundedly rational during the game process.
Assumption 2: Players’ Behavioral Strategies. The government’s support behavior strategy set is described by α = {α1 strong support, α2 weak support}. “Strong support” refers to the government’s support for the research and development of autonomous vehicles by providing incentive policies, such as tax incentives and R&D subsidies, and regulating the driving of autonomous vehicles through the formulation of regulations, clear technical standards, and safety requirements. “Weak support” means not taking active measures to intervene in car manufacturers’ research and development of autonomous vehicles and consumers’ purchasing of autonomous vehicles. The car manufacturers’ behavior strategy set is described by β = {β1 proactive, β2 passive}. “Proactive” refers to car manufacturers actively investing in R&D resources, vigorously introducing talent, and researching autonomous driving technology. “Passive” refers to taking passive measures in the research and development of autonomous vehicles or continuing to use conventional methods for vehicle production and sales. The consumers’ behavior strategy set is γ = {γ1 purchase, γ2 wait-and-see}. “Purchase” refers to consumers choosing to buy autonomous vehicles instead of traditional vehicles when they have the intention to purchase a car. “Wait-and-see” refers to not choosing to buy autonomous vehicles for the time being, considering the potential safety risks, technical failures, and possible losses of autonomous vehicles, and maintaining a wait-and-see attitude toward purchasing autonomous vehicles.
Assumption 3: Probability of Behavioral Strategy Selection. When the government, car manufacturers, and consumers engage in the game, the proportion of the government choosing the “strong support” strategy is x, and the proportion choosing the “weak support” strategy is 1 − x, with x ∈ [0, 1]; the proportion of car manufacturers choosing the “proactive” strategy is y, and the proportion choosing the “passive” strategy is 1 − y, with y ∈ [0, 1]; the proportion of consumers choosing the “purchase” strategy is z, and the proportion choosing the “wait-and-see” strategy is 1 − z, with z ∈ [0, 1].
Assumption 4: Government’s High-Intensity Policy Support. When implementing high-intensity policy support, the government incurs additional costs (including new infrastructure) compared to those for low-intensity support, denoted as Q. Financial subsidies P are an important part of the government’s high-intensity policy support. Under the government’s high-intensity policy support, the purchase subsidy H provided to consumers is an important measure to promote the popularization of the autonomous vehicle market. In the process of promoting the industrial development of autonomous vehicles, the government provides tax incentives L to proactive car manufacturers, which can encourage enterprises to invest more resources in technological innovation and R&D work. In the support policy, the technological innovation preference coefficient s (0 < s ≤ 1) is an important indicator to measure the enthusiasm and innovation ability of enterprises in R&D. At the same time, the government imposes economic penalties N for the environmental and other losses brought about by enterprises that do not actively engage in R&D. The loss caused by accidents triggered by autonomous vehicles is K. The impact coefficient r of the negative impact and losses caused by accidents during the active R&D of autonomous vehicles by car manufacturers indicates whether, under the implementation of low-intensity policy support, the government can still obtain certain benefits G1 in economic, social, and environmental aspects. When the government implements high-intensity policy support for autonomous vehicles, compared with low-intensity policy, it will gain additional perceptual effects G2.
Assumption 5: Car Manufacturers’ Production and Sales Costs. The cost for car manufacturers to actively produce and sell autonomous vehicles is W, and they will also provide consumers with additional discounts F while actively selling. The cost of passively producing and selling autonomous vehicles is D (W − D > F). The perceived benefit V1 is obtained by car manufacturers who actively sell autonomous vehicles. In order to maintain a stable market performance, lower operating risks, and continuous brand recognition and customer satisfaction, the perceived benefit V2 obtained by car manufacturers who maintain the production of the original vehicles must be less than V1 (V1 > V2).
Assumption 6: The core technology of autonomous vehicles requires a large amount of research and development investment, which makes the cost of the vehicle significantly higher than that of traditional vehicles. In addition, the maintenance and updating of the autonomous driving system also adds additional costs. The additional cost to consumers of a self-driving car over a conventional one is C. When consumers buy self-driving cars, they can obtain the corresponding perceived benefits M1, which not only include the improvement of driving safety and driving convenience but also the improvement of driving experience and social satisfaction. Consumers who do not purchase an autonomous vehicle can also reap the perceived benefits M2, which include financial savings, psychological comfort, and expectations of stability and reliability.
Based on the aforementioned assumptions, the perceived matrix parameters for the three parties are shown in Table 1.

2.3. Game Model Construction and Analysis

Based on the above assumptions and parameter settings, the perceived benefit matrix of the government, automobile enterprises, and consumers is constructed, as shown in Table 2.
(1)
Government’s Game Strategy: The expected payoff for choosing the “strong support” strategy is U11, and the expected payoff for choosing the “weak support” strategy is U12. The average expected payoff is U1, such that
U 11 = ( Q s P K r + G 1 H L ) y z + ( Q s P Kr + G 1 L ) y ( 1 z )   + ( Qs P + G 1 H L + N ) ( 1 y ) z + ( Qs P + G 1 L + N ) ( 1 y ) ( 1 z )
U 12 = 0
U 1 = x U 11 + ( 1 x ) U 12
(2)
Car Manufacturer’s Game Strategy: The expected payoff for choosing the “proactive” strategy is U21, and the expected payoff for choosing the “passive” strategy is U22. The average expected payoff is U2, such that
U 21 = ( P + V 1 W + L F ) x z + ( P + V 1 W + L ) x ( 1 z )   + ( V 1 W F ) ( 1 x ) z + ( V 1 W ) ( 1 x ) ( 1 z )
U 22 = ( P N + V 2 D ) x z + ( P N + V 2 D ) x ( 1 z )   + ( V 2 D ) ( 1 x ) z + ( V 2 D ) ( 1 x ) ( 1 z )
U 2 = y U 21 + ( 1 y ) U 22
(3)
Consumer’s Game Strategy: The expected payoff for choosing the “purchase” strategy is U31, and the expected payoff for choosing the “wait-and-see” strategy is U32. The average expected payoff is U3, such that
U 31 = ( H C + M 1 + F ) x y + ( H C + M 1 ) x ( 1 y )   + ( C + M 1 + F ) ( 1 x ) y + ( C + M 1 ) ( 1 x ) ( 1 y )
U 32 = M 2 x y + M 2 y ( 1 x ) + M 2 ( 1 y ) x + M 2 ( 1 y ) ( 1 x )
U 3 = z U 31 + ( 1 z ) U 32
According to the research of Meng Lingpeng et al. [36], the replicator dynamic analysis method can be used in evolutionary game theory for analysis, and the replicator dynamic equation can be established. The equation is expressed as follows:
d x i d t = x i [ ( u x i , x ) u ( x , x ) ]
Thus, the replicator dynamic equations for the government, car manufacturers, and consumers can be expressed as follows:
The replicator dynamic equation for the government choosing the strategy of actively promoting R&D is
F ( x ) = d x d t = x ( U 11 U 1 ) = x ( 1 x ) ( P + N + G 1 Qs z H y N L y Kr )
The replicator dynamic equation for car manufacturers choosing the strategy of actively investing in R&D is
F ( y ) = d y d t = y ( U 21 U 2 ) = y ( 1 y ) ( D + V 1 V 2 W z F + x N + x L )
The replicator dynamic equation for consumers choosing the strategy of purchasing is
F ( z ) = d z d t = z ( U 31 U 3 ) = z ( 1 z ) ( M 1 C M 2 + y F + x H )

2.4. Game Model Solving and Analysis

2.4.1. Single-Agent Stability Analysis

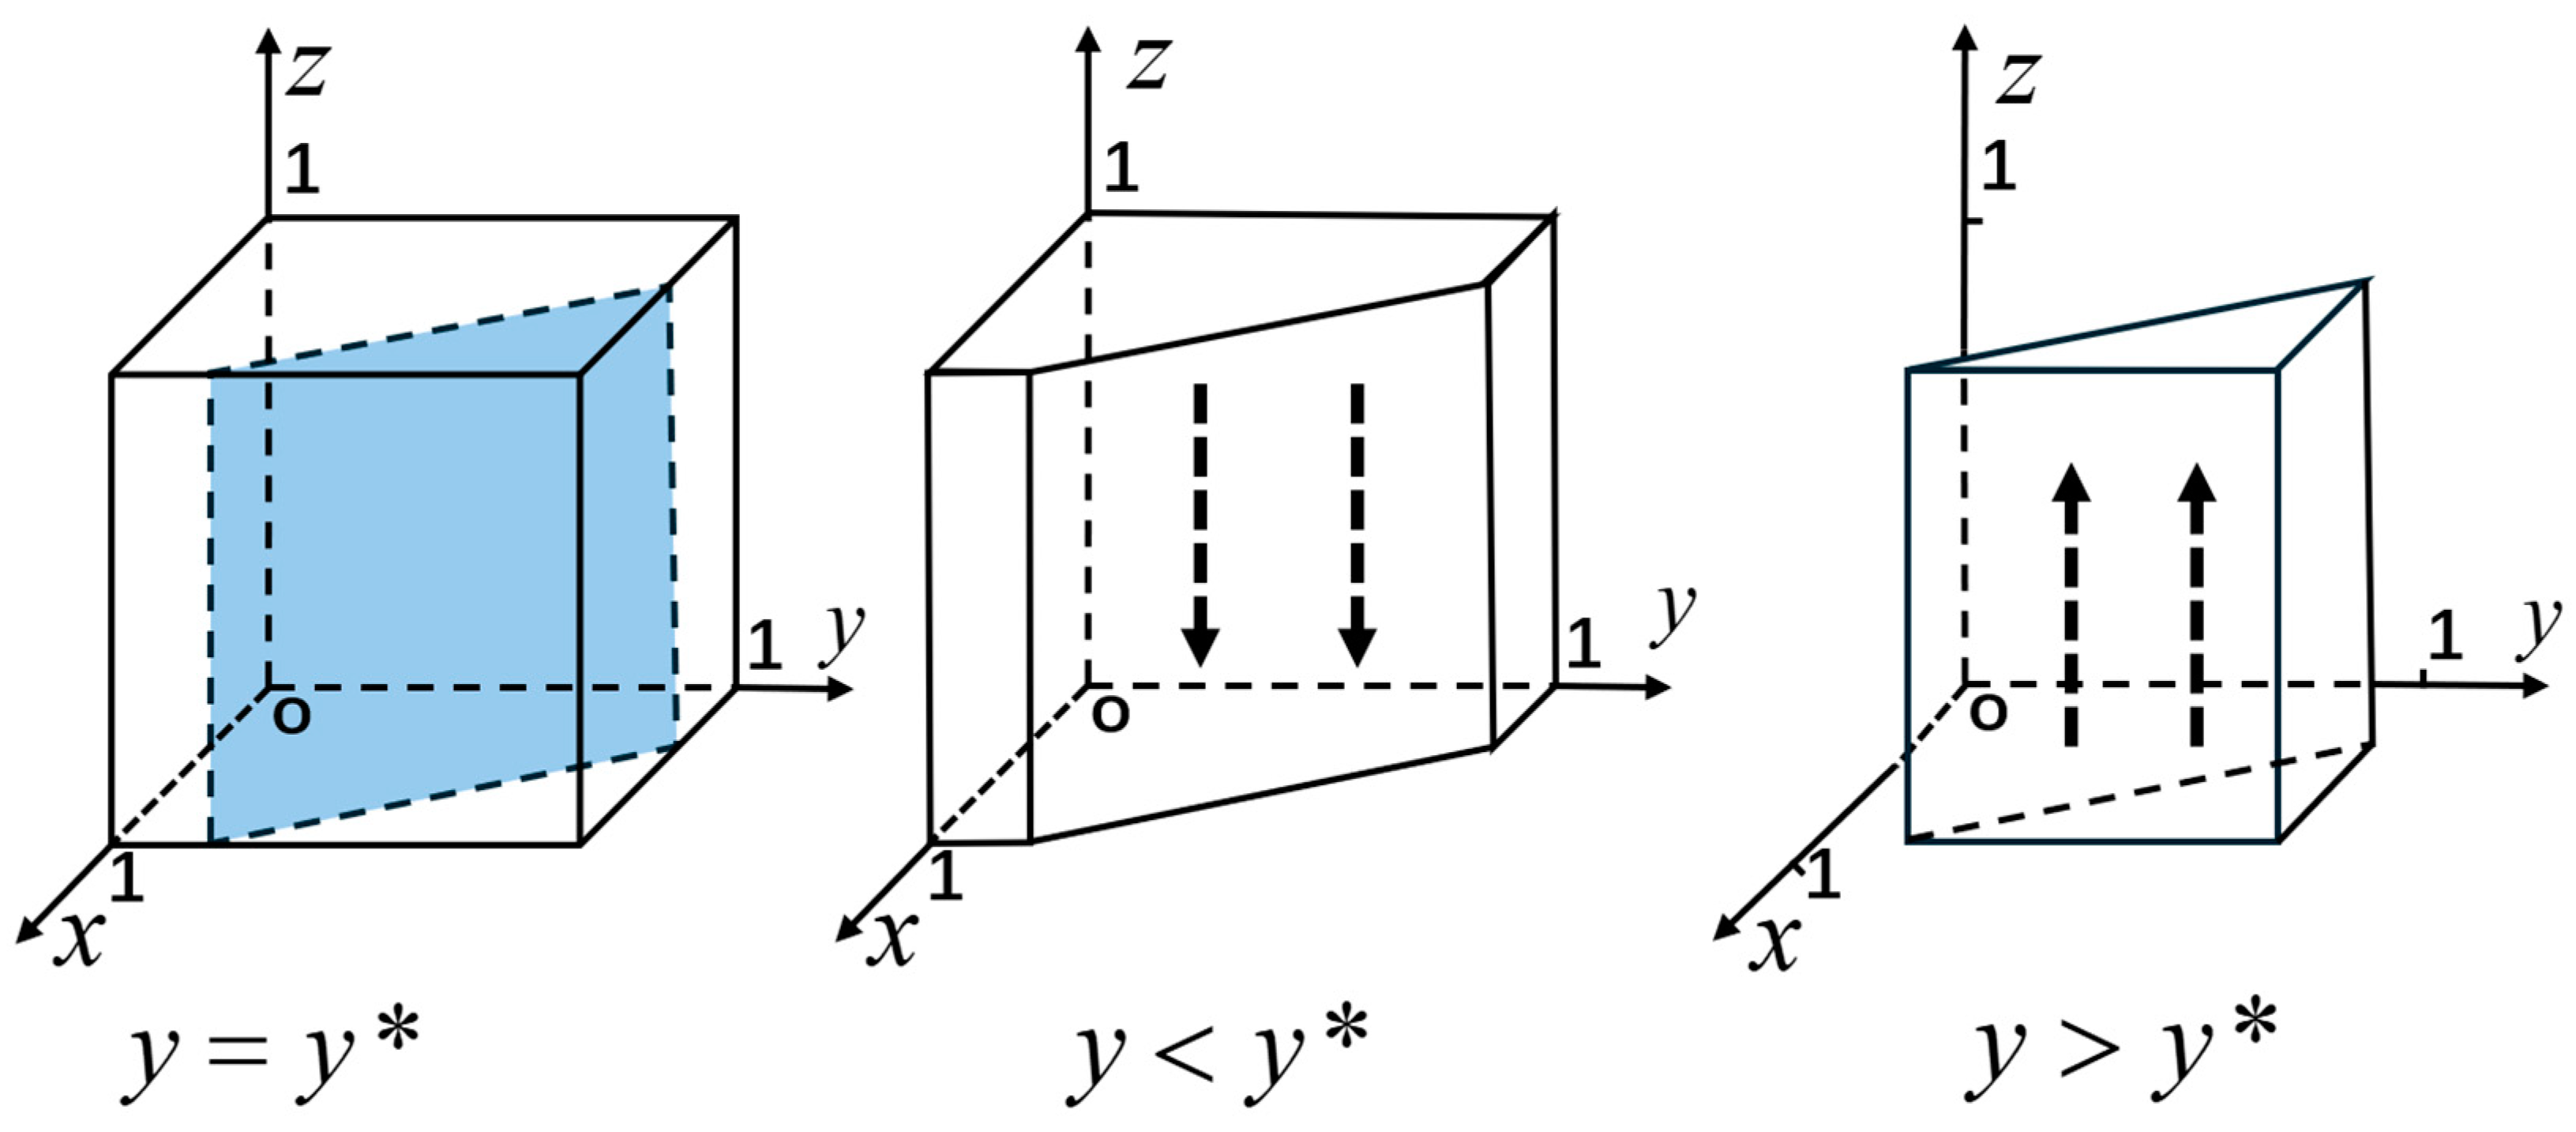
Government’s Strategy Stability Analysis

According to the stability theorem of the replicator dynamic equation, it is known that when F ( x ) = 0 , F ( x ) < 0 , x is an evolutionarily stable strategy. Let F ( x ) = 0 ; thus, there is x = 0 , x = 1 , and Z 1 * = N + G 1 P Qs L y ( N + Kr ) H . Among them, F ( x ) = ( 1 2 x ) ( N + G 1 P Qs z H y N L y Kr ) .
(1)
When Z = Z 1 * is the case, F ( x ) = 0 and F ( x ) = 0 hold true, and x takes any value within the range; it is always a stable state—the probability of the government’s strategic choice, x , remains unchanged over time. The government may experience a period of temporary instability and will subsequently evolve toward a direction of high support or low support based on changes in external conditions.
(2)
When Z < Z 1 * is the case, N + G 1 P Qs z H y N L y Kr < 0 , and F ( x ) = 0 along with F ( x ) | x = 0 < 0 ; therefore, x = 1 is an evolutionarily stable strategy.
(3)
When Z > Z 1 * is the case, N + G 1 P Qs z H y N L y Kr > 0 , and F ( x ) = 0 along with F ( x ) | x = 1 < 0 ; therefore, x = 0 is an evolutionarily stable strategy.
Based on the analysis above, the replicator dynamic phase diagram for the government, as shown in Figure 2, can be obtained. This diagram indicates that strong government support has a positive incentive effect on consumers’ purchase of autonomous vehicles.

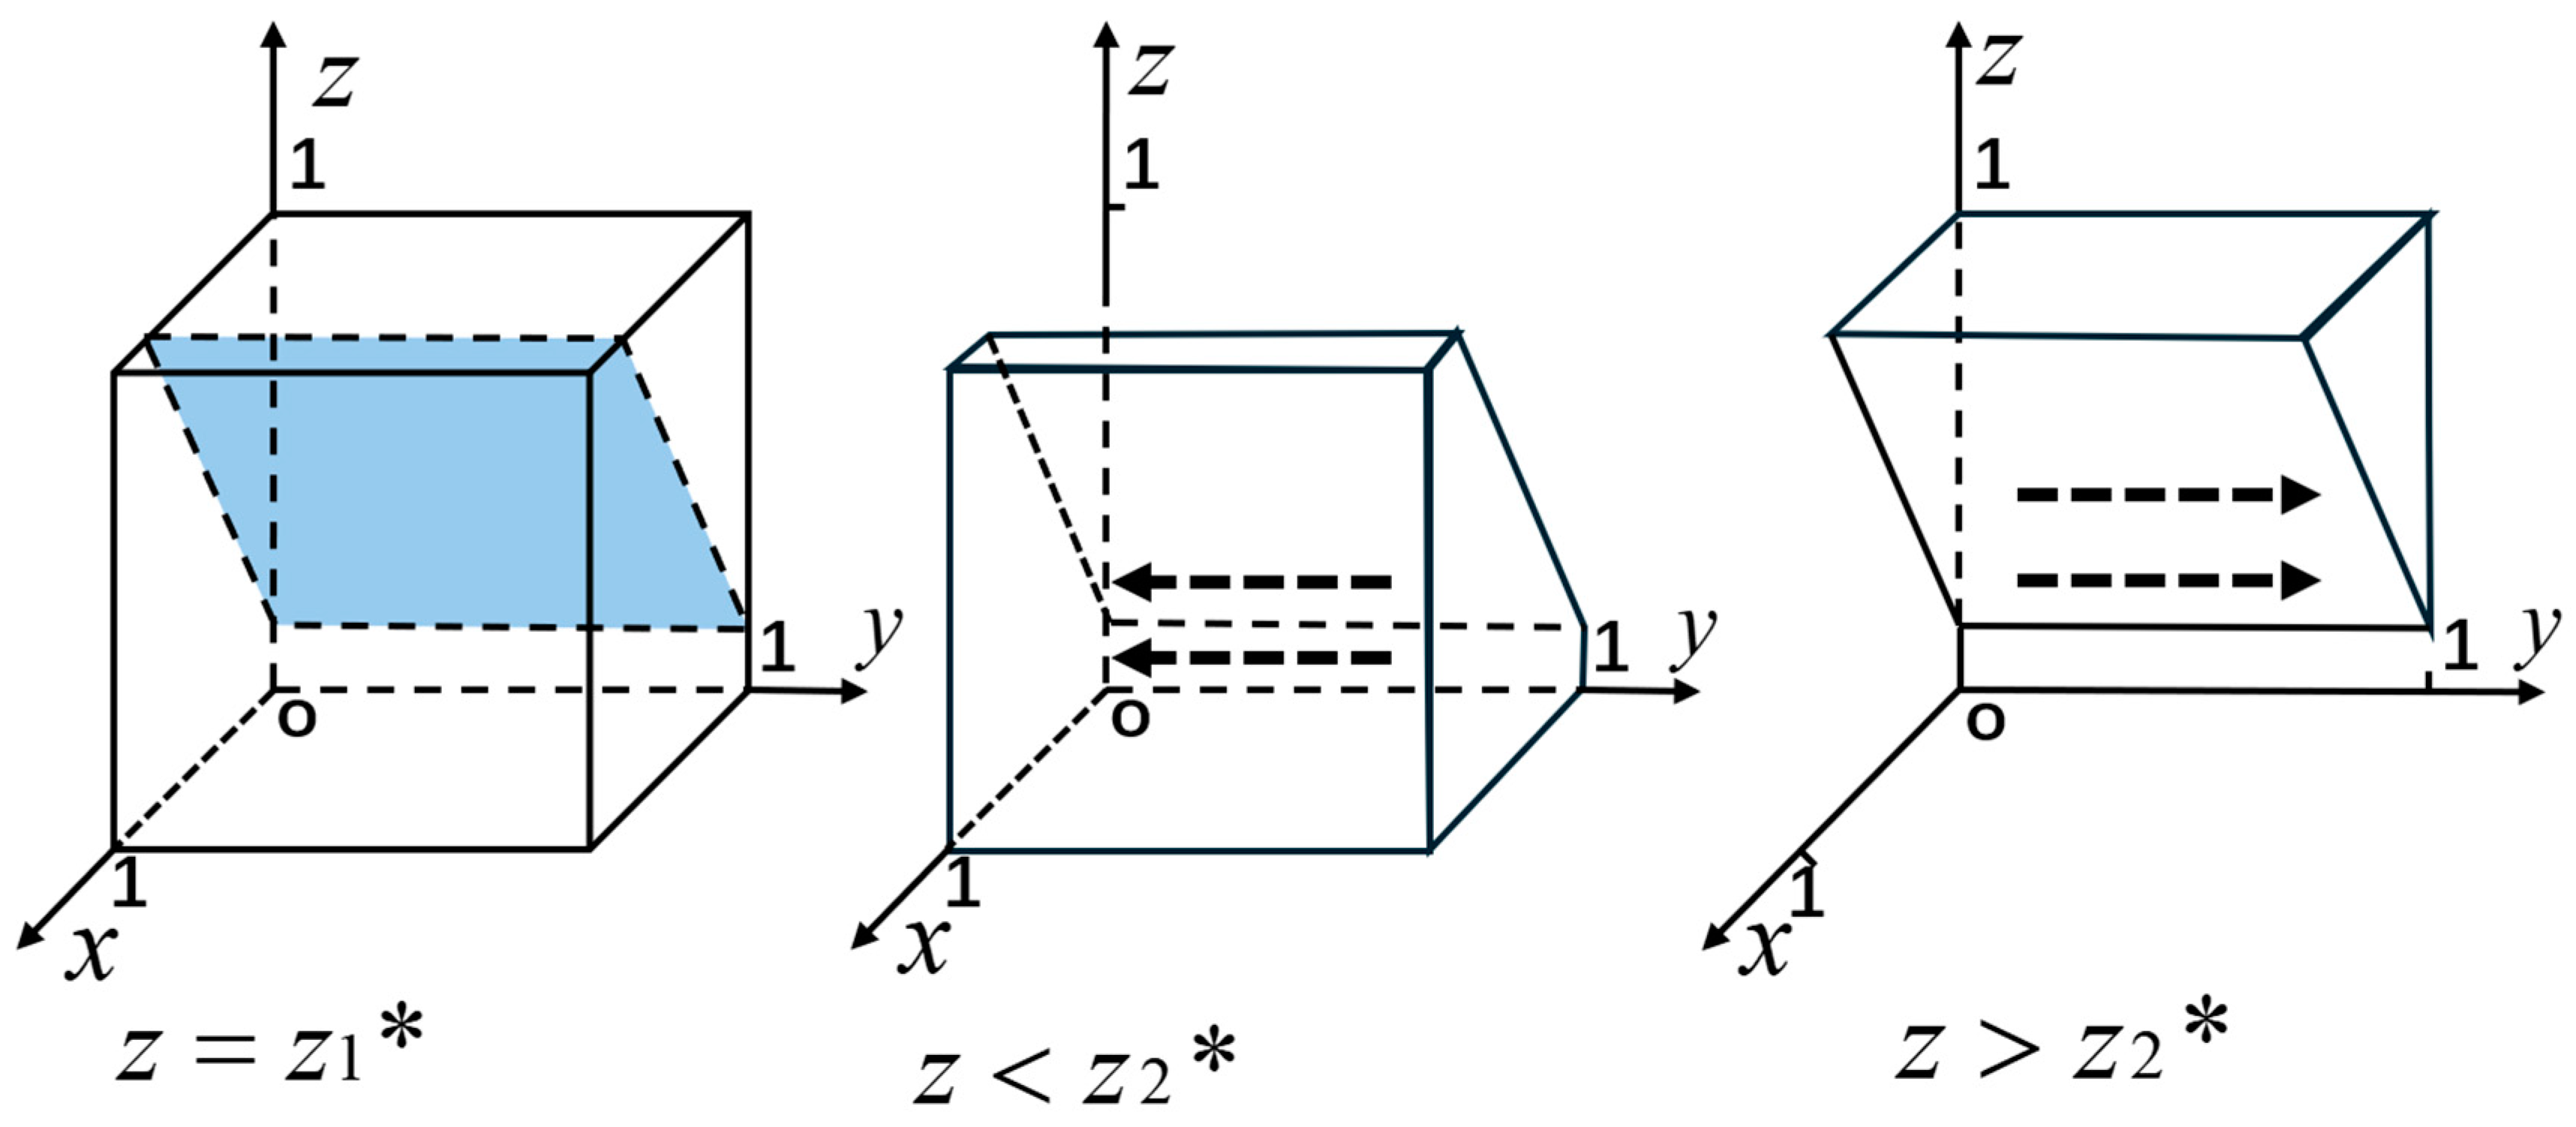
Automobile Manufacturers’ Strategy Stability Analysis

According to the stability theorem of the replicator dynamic equation, it is known that when F ( y ) = 0 and F ( y ) < 0 , y is an evolutionarily stable strategy. Let F ( y ) = 0 ; thus, there is y = 0 , y = 1 , and Z 2 * = D + V 1 V 2 W + x ( N + L ) F . Among them, F ( y ) = ( 1 2 y ) ( D + V 1 V 2 W z F + x N + x L ) .
(1)
When Z = Z 2 * is the case, F ( x ) = 0 and F ( x ) = 0 hold true, and x takes any value within the range; it is always a stable state—the probability of the automobile manufacturer’s strategic choice, x , remains unchanged over time.
(2)
When Z < Z 2 * is the case, D + V 1 V 2 W z F + x N + x L < 0 , and F ( y ) = 0 along with F ( y ) | y = 0 < 0 ; therefore, y = 1 is an evolutionarily stable strategy.
(3)
When Z > Z 2 * is the case, D + V 1 V 2 W z F + x N + x L > 0 , and F ( y ) = 0 along with F ( y ) | y = 1 < 0 ; therefore, y = 0 is an evolutionarily stable strategy.
According to the analysis above, the replicator dynamic phase diagram for car manufacturers, as shown in Figure 3, can be derived. This diagram indicates that strong government support has a positive incentive effect on car manufacturers to actively produce autonomous vehicles.

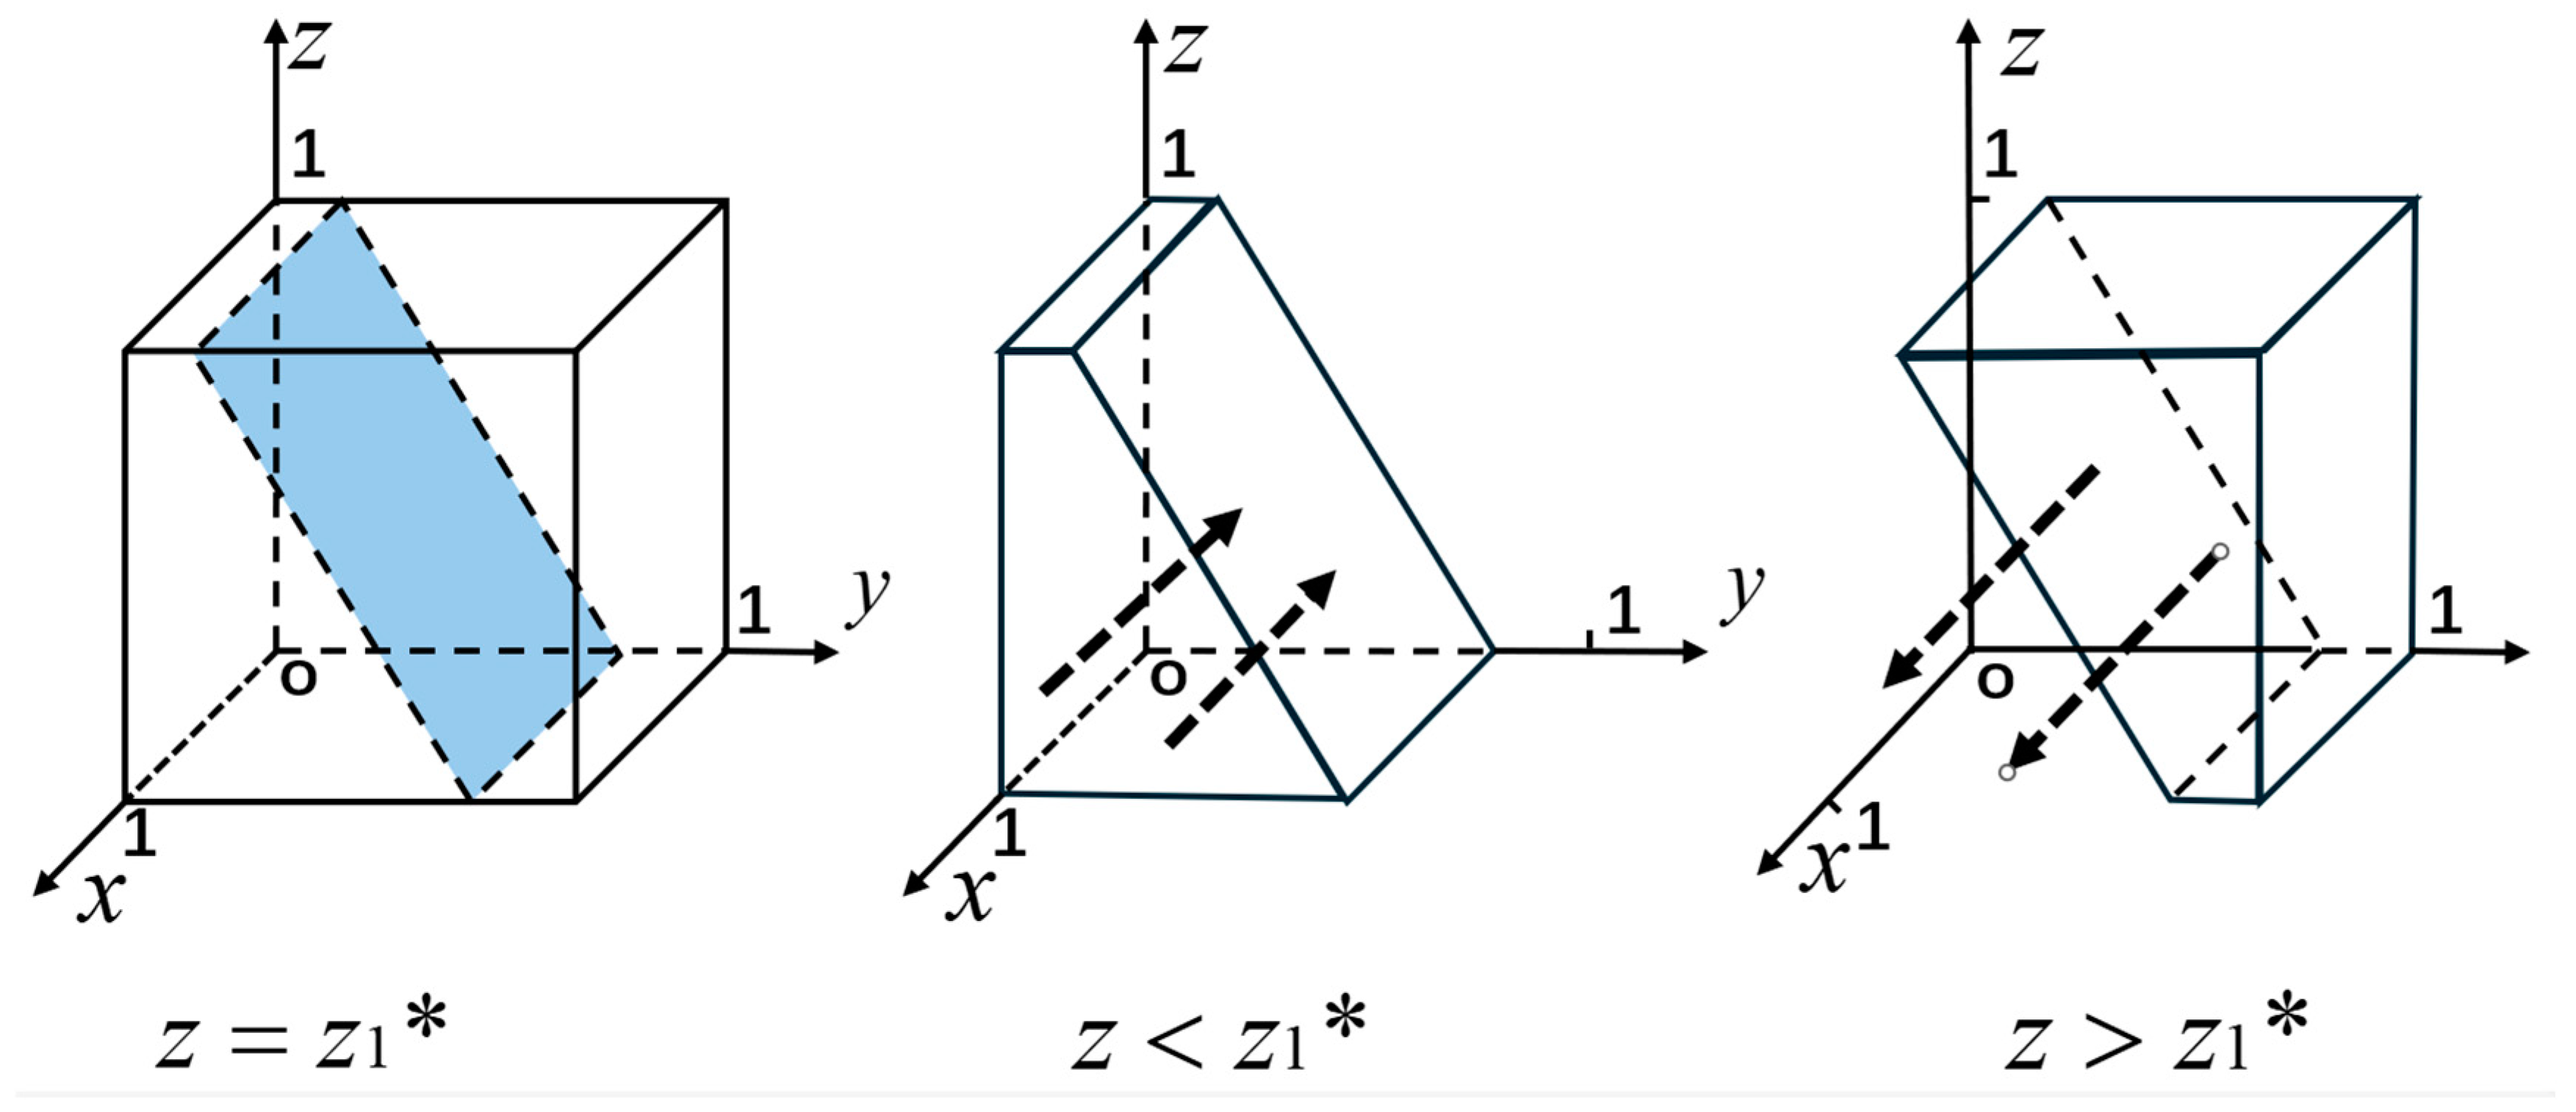
Consumers’ Strategy Stability Analysis

According to the stability theorem of the replicator dynamic equation, it is known that when F ( z ) = 0 , F ( z ) < 0 z is an evolutionarily stable strategy. Let F ( z ) = 0 ; thus, there is z = 0 z = 1 , and y * = C M 1 + M 2 x H F . Among them, F ( z ) = ( 1 2 z ) ( M 1 C M 2 + y F + x H ) .
(1)
When y = y * is the case, F ( z ) = 0 and F ( z ) = 0 hold true, and z takes any value within the range; it is always a stable state—the probability of the consumer’s strategic choice, x , remains unchanged over time.
(2)
When y < y * is the case, M 1 C M 2 + y F + x H < 0 , and F ( z ) = 0 along with F ( z ) | z = 0 < 0 ; therefore, z = 0 is an evolutionarily stable strategy.
(3)
When y > y * is the case, M 1 C M 2 + y F + x H > 0 , and F ( z ) = 0 along with F ( z ) | z = 1 < 0 ; therefore, z = 1 is an evolutionarily stable strategy.
Based on the above analysis, the replicator dynamic phase diagram for consumers, shown in Figure 4, can be obtained. This diagram indicates that the strategy of car manufacturers actively producing autonomous vehicles has a positive incentive effect on consumers’ willingness to purchase autonomous vehicles.

2.4.2. Stability Analysis of Strategy Combination

According to the principle of stability for systems of differential equations, by setting F ( x ) = 0 , F ( y ) = 0 , and F ( z ) = 0 , the entire system will trend toward stability. Solving the system of Equation (14) collectively yields the dynamic replicator equations for the tripartite evolutionary game as follows:
F ( x ) = x ( 1 x ) ( P + N + G 1 Qs z H y N L y Kr ) = 0 F ( y ) = y ( 1 y ) ( D + V 1 V 2 W z F + x N + x L ) = 0 F ( z ) = z ( 1 z ) ( M 1 C M 2 + y F + x H ) = 0
After solving the equations, it can be determined that the evolutionary game system has eight pure-strategy equilibrium points: E1 (0,0,0), E2 (1,0,0), E3 (0,1,0), E4 (0,0,1), E5 (1,1,0), E6 (1,0,1), E7 (0,1,1), and E8 (1,1,1).
Since mixed-strategy equilibria in asymmetric dynamic games are definitely not evolutionarily stable equilibria [37], the analysis is only conducted on the pure-strategy equilibrium points (E1 to E8) of the evolutionary game system. The stability of the equilibrium points is analyzed by constructing a Jacobian matrix. The eigenvalues of this matrix are used to determine the stability of the system at these eight pure-strategy equilibrium points, as shown in the calculation method and eigenvalue expression (15).
J = J 11 J 12 J 13 J 21 J 22 J 23 J 31 J 32 J 33 = U ( x ) / x U ( x ) / y U ( x ) / z U ( y ) / x U ( y ) / y U ( y ) / z U ( z ) / x U ( z ) / y U ( z ) / z = x ( P N G 1 + Qs + z H + y N + L + y Kr ) + ( x 1 ) ( P N G 1 + Qs + z H + y N + L + y Kr ) z ( N + Kr ) ( z 1 ) x H ( x 1 ) y ( N + Ls ) ( y 1 ) y ( D V 1 + V 2 + W + z F x N x L ) + ( y 1 ) ( D V 1 + V 2 + W + z F x N x L ) y F ( y 1 ) z H ( z 1 ) z F ( z 1 ) z ( M 1 + C + M 2 y F x H ) + ( z 1 ) ( M 1 + C + M 2 y F x H )
Substituting the eight pure-strategy equilibrium points into the Jacobian matrix yields the corresponding eigenvalues, as shown in Table 3.
Based on the assumptions and settings of the parameters in this paper, through simple judgment and elimination, the first five strategies among the eight mentioned above do not meet the stability criteria. In strategies E6 (1, 0, 1) and E8 (1, 1, 1), when the evolutionarily stable strategy (ESS) condition is met, the value of λ 2 is the opposite in each strategy. Similarly, in strategies E7 (1, 0, 1) and E8 (1, 1, 1), the value of λ 1 is opposite under the ESS condition. However, based on the actual situation and assumptions 4 and 5, the active and passive values of both are difficult to determine. Therefore, this paper considers four scenarios in its analysis.
Scenario 1: V1 < F − D + V2 + W − L
In this scenario, the benefits perceived by car manufacturers from actively selling autonomous vehicles are not sufficient to offset their costs and offered discounts. This indicates that the current market conditions, cost structure, or level of government support are inadequate to incentivize car manufacturers to actively promote autonomous vehicles. To change this situation, government support can be strengthened, market acceptance can be increased, technology costs can be reduced, and cooperation between car manufacturers can be promoted to enhance the market prospects for autonomous vehicles and improve the manufacturers’ expected returns.
Scenario 2: V1 > F − D + V2 + W (−L)
This scenario indicates that with government support, the strategy of actively selling autonomous vehicles is economically feasible and advantageous for car manufacturers. Despite high production and sales costs, the manufacturers’ high revenue expectations from the autonomous vehicle market and tax incentives make them more inclined to actively sell these new vehicles. The tax incentive LLL reduces the manufacturers’ actual costs, increasing their net income from actively selling autonomous vehicles, further promoting the implementation of this strategy. Under government support, car manufacturers are more motivated to actively promote and sell autonomous vehicles. Initially, in this condition, manufacturers are more likely to choose an active R&D strategy.
Scenario 3: G1 < H + Qs + L+Kr + P
In this scenario, the additional perceived benefits the government gains from implementing high-intensity policies to support autonomous vehicles are insufficient to cover the total costs and subsidies it bears. To make high-intensity policies economically feasible, the government needs to optimize the subsidy structure, strengthen risk management, enhance policy returns, and consider gradually implementing policies. These measures can effectively reduce costs, increase returns, and promote the development of the autonomous vehicle market.
Scenario 4: G1 > H + Qs + L + Kr + P
In this scenario, the additional perceived benefits that the government gains from implementing high-intensity policies to support autonomous vehicles exceed all related costs and expenditures, indicating that the high-intensity policies are economically feasible and have a positive effect. The government can continue to strengthen policy support, optimize the subsidy structure, expand the scope of support, and enhance risk management and public education, thereby further promoting the development of the autonomous vehicle market and improving overall economic and social benefits.
From the above four scenarios, it can be seen that when V1 > F − D + V2 + W − L and G1 > H + Qs + L + Kr + P are satisfied, it is the only choice for the government to maximize its returns, minimize risks, achieve mutual benefits, and ensure sustainable economic and social development in the autonomous vehicle market. At this point, the system reaches an evolutionarily stable state. Among the eight pure-strategy equilibrium points mentioned above, only E8 (1, 1, 1) meets the conditions; therefore, the system can only evolve toward the equilibrium point E8 (1, 1, 1). The evolutionary strategy corresponding to this equilibrium point is {high support, active R&D, purchase}.

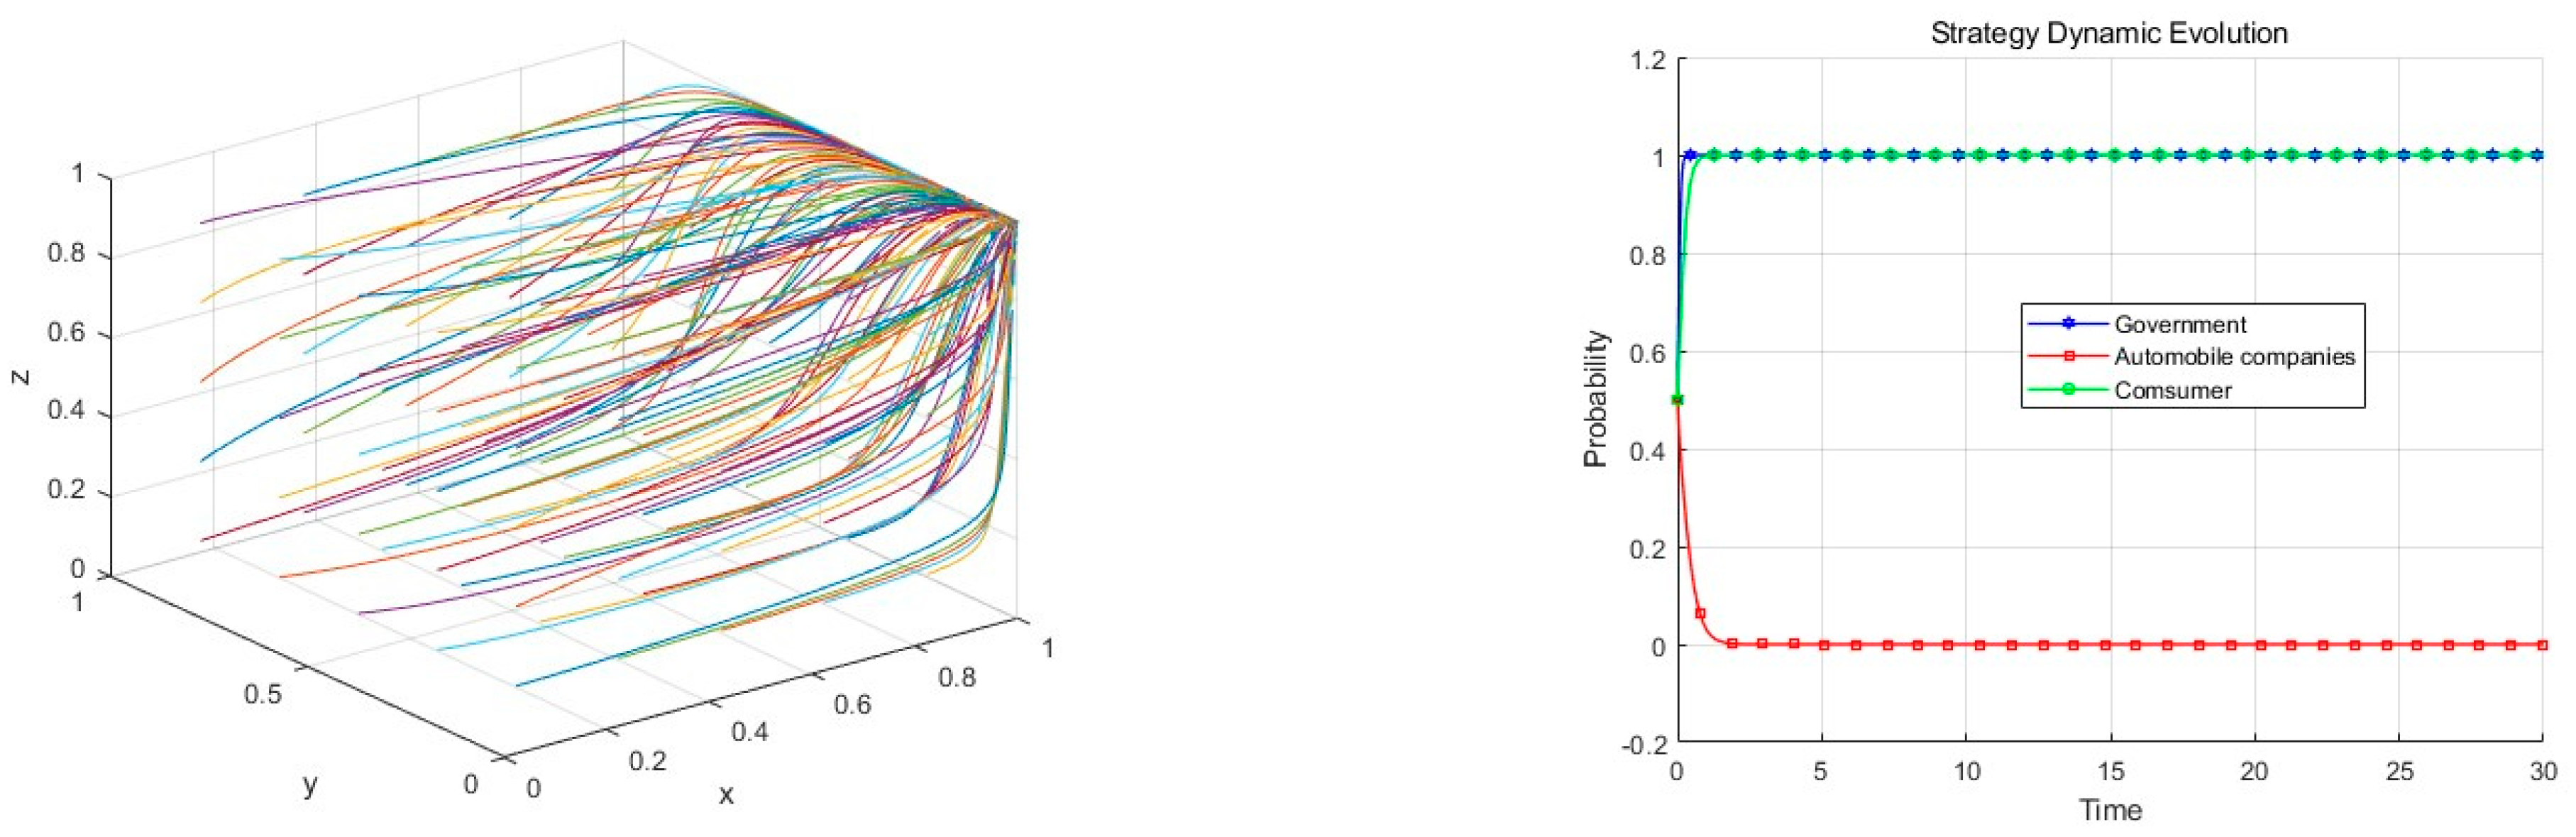
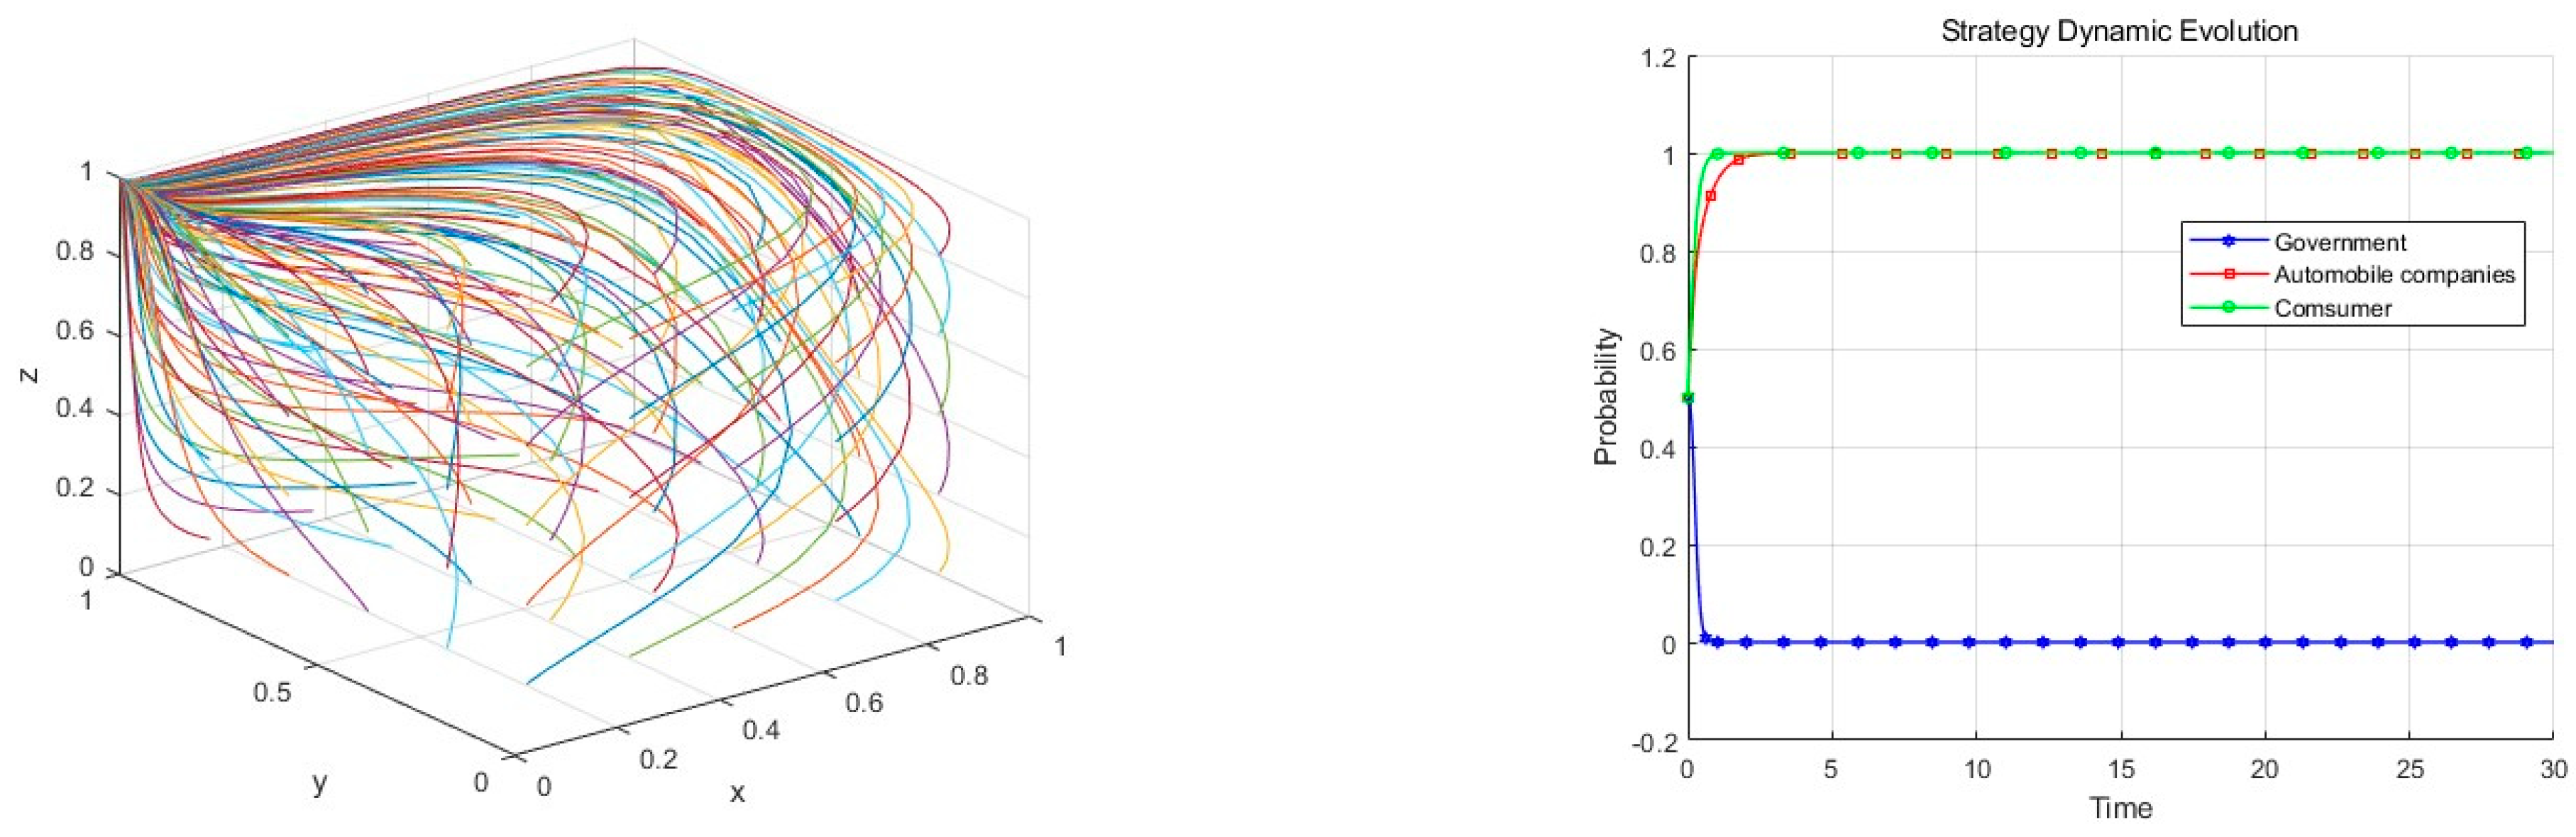
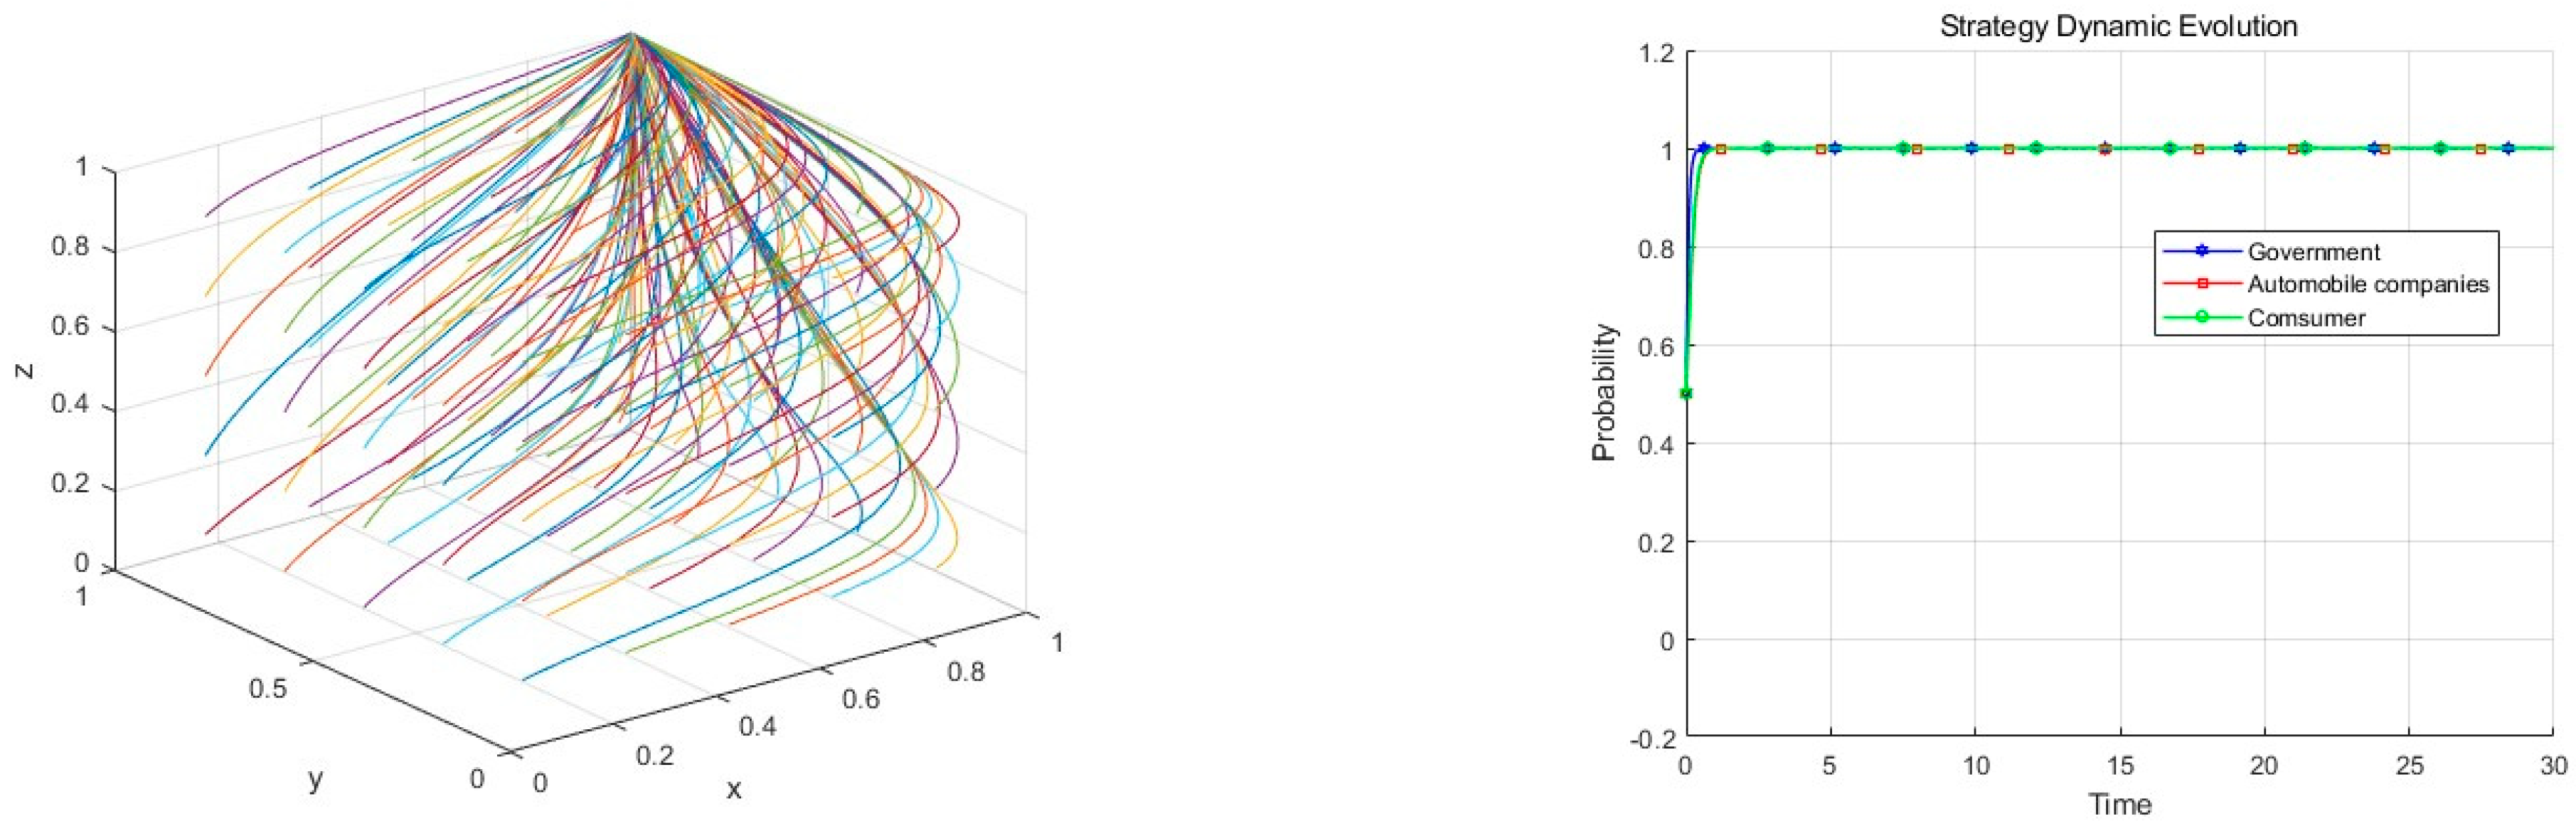
3. Numerical Simulation

3.1. The Effect of the Initial Value of the Decision

To visualize the dynamic evolution of behaviors among the three stakeholders in the study of the purchase intention of autonomous vehicles, this research utilized MATLAB2022b for numerical analysis.
Based on the model assumptions and stability conditions, we assigned values to the parameters and conducted numerical simulations of the equilibrium points of the ESS evolutionary strategy in the tripartite evolutionary game. The parameter settings primarily reflect the benefits and losses of government actions, followed by the gains and losses of different stakeholders under various parameter settings and their significance, as shown in Table 1. In conjunction with relevant data, the parameter values given in Table 4, Table 5 and Table 6 were ultimately organized; these values represent approximate proportions and are mainly intended for verifying the model and related parameters of the purchase intention of autonomous vehicles.
In the previous text, four scenarios affecting the ESS state were introduced and are now combined into three groups, namely V1 < F − D + V2 + W − L; V1 > F − D + V2 + W and G1 < H+Qs + L + Kr + P; and V1 > F − D + V2 + W − L and G1 > H + Qs + L + Kr + P. Different parameters were assigned to these three groups, and as time progressed, these groups evolved from different initial strategies. The evolutionary trajectories are shown in Figure 5, Figure 6 and Figure 7. The initial intentions of the government, car manufacturers, and consumers are set to x = y = z = 0.5 .
Under the condition of stability, the evolutionary trajectory of the first combination is shown in Figure 5. The simulation results reach equilibrium at E6 (0, 1, 1), where the ESS combination is {low-intensity support, proactive R&D, purchase}. In this scenario, the government’s low-intensity support will affect the enthusiasm of car manufacturers for R&D in the long run, and consumers, upon seeing the government’s low-intensity support measures, will also deepen their concerns about the safety of autonomous vehicles, thereby affecting their purchase of autonomous vehicles. Considering the evolutionary trajectory of the second combination as shown in Figure 6, in this case, car manufacturers show a passive attitude toward the R&D of autonomous vehicles. In reality, the benefits obtained by the government are not enough to cover all the costs and subsidies it bears, and it will not be able to maintain a stable state for a long time. The third combination shown in Figure 7 reaches equilibrium at {high-intensity support, proactive R&D, purchase}, that is, E8 (1, 1, 1). From this perspective, the government, car manufacturers, and consumers should actively adjust their respective strategies to achieve a win–win situation of interests.

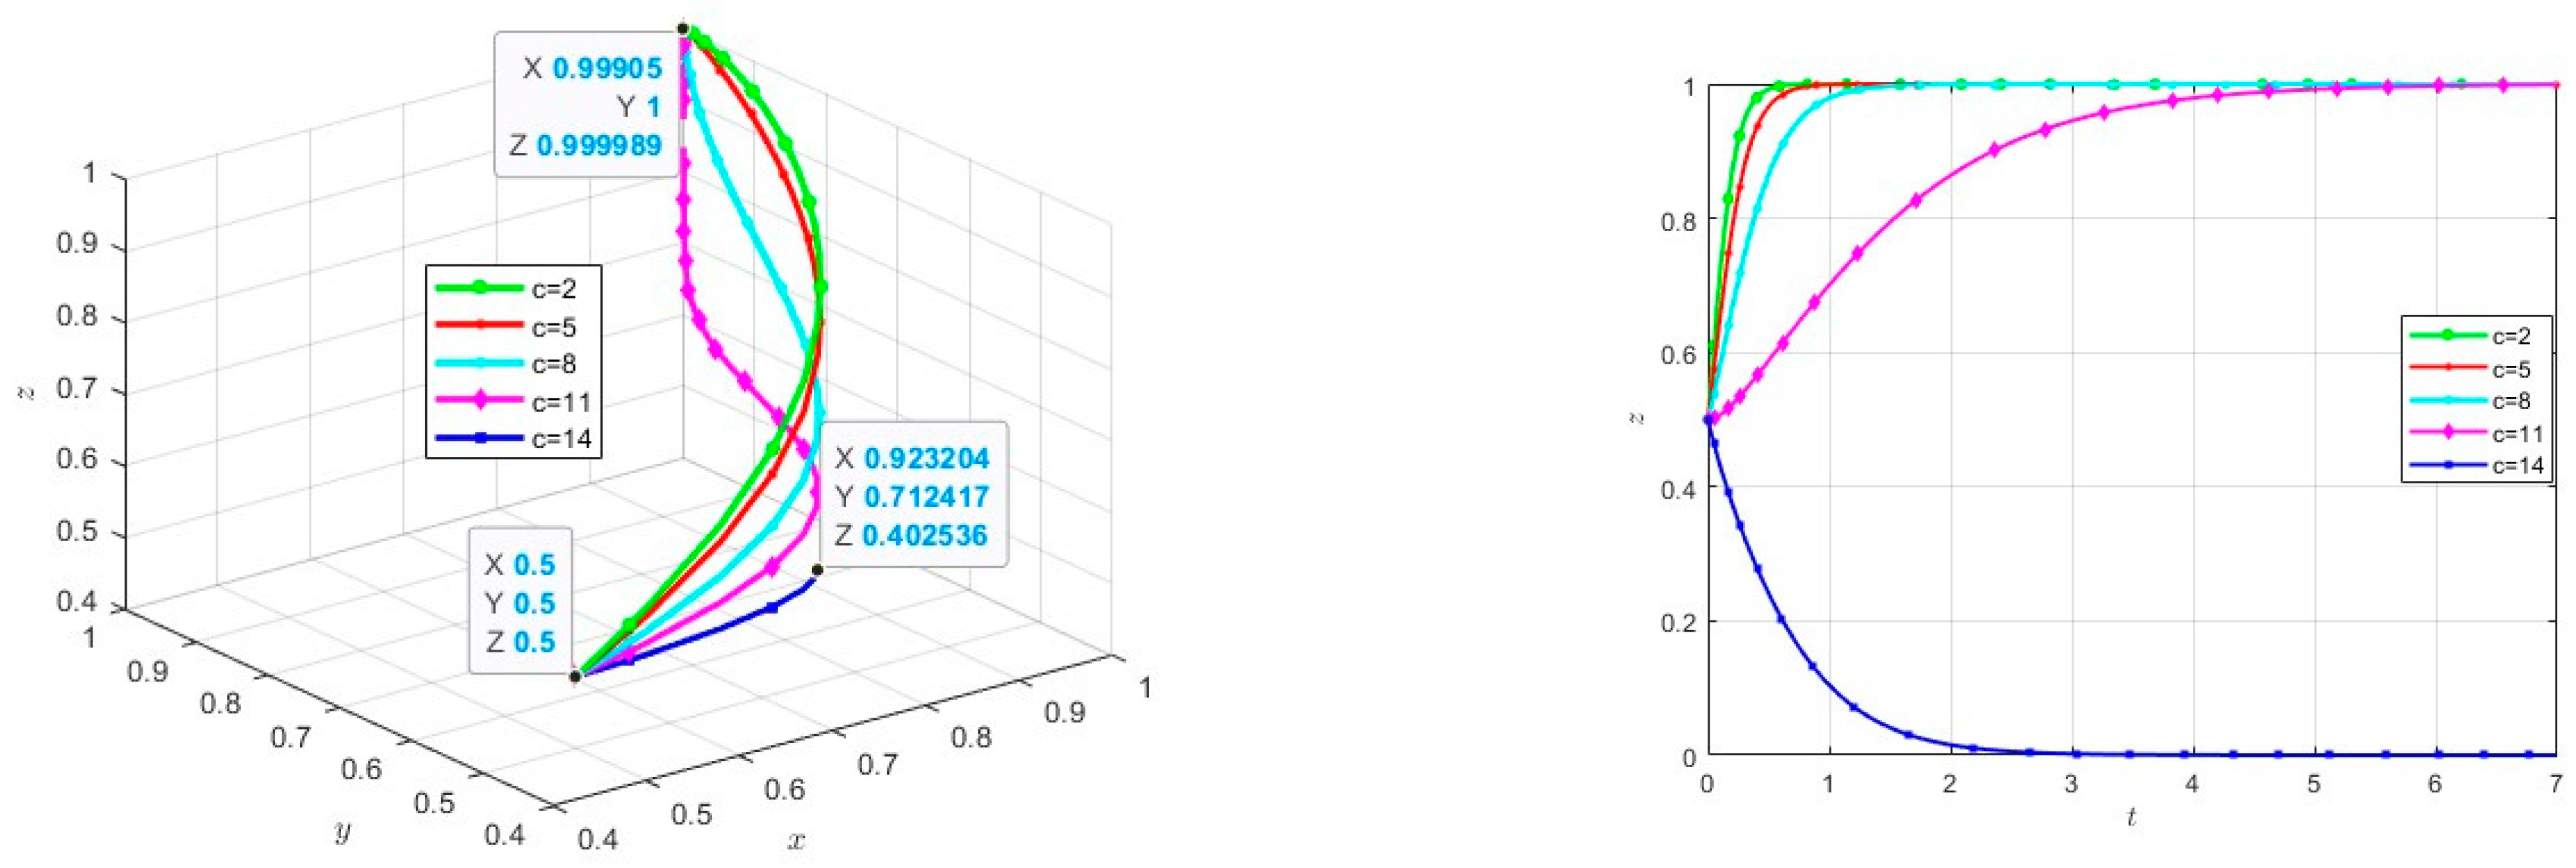
3.2. The Influence of Key Parameters on Evolution

To assess the impact of certain key parameters on the tripartite evolutionary outcomes and trajectories, numerical simulations were conducted for these parameters. The selected parameters include C, N, s, and r. The initial parameters are set to satisfy the condition E8 (1, 1, 1): when the initial intention x = y = z = 0, the parameters are Q = 20, P = 3.5, H = 1, L = 1.6, s = 0.5, N = 3, K = 30, r = 0.5, G1 = 40, G2 = 15, W = 25, D = 18, F = 1, V1 = 30, V2 = 20, C = 5, M2 = 10, and M2 = 10. Therefore, the following section will discuss the impact of these parameters on the evolutionary outcomes and trajectories of strategies for the government, car manufacturers, and consumers.

3.2.1. The Influence of C

Figure 8 shows the simulation results of the replicator dynamic system’s evolution over time with other parameters held constant and C set to 2, 5, 8, 11, and 14. For consumers, C has a significant negative impact on their purchase strategy choices, whereas the government and car manufacturers are less sensitive to changes in C. When C is low (such as C = 2, 5, 8), Z quickly approaches 1 in a relatively short time. This means that when the additional cost for consumers to purchase autonomous vehicles is low, their willingness to purchase will rapidly increase and reach a stable high level in a short period. On the contrary, when C is high (such as C = 11), the additional cost for consumers to purchase autonomous vehicles is high, and their willingness to purchase significantly decreases, adopting a wait-and-see attitude toward buying autonomous vehicles, and it is difficult to improve in a short period.

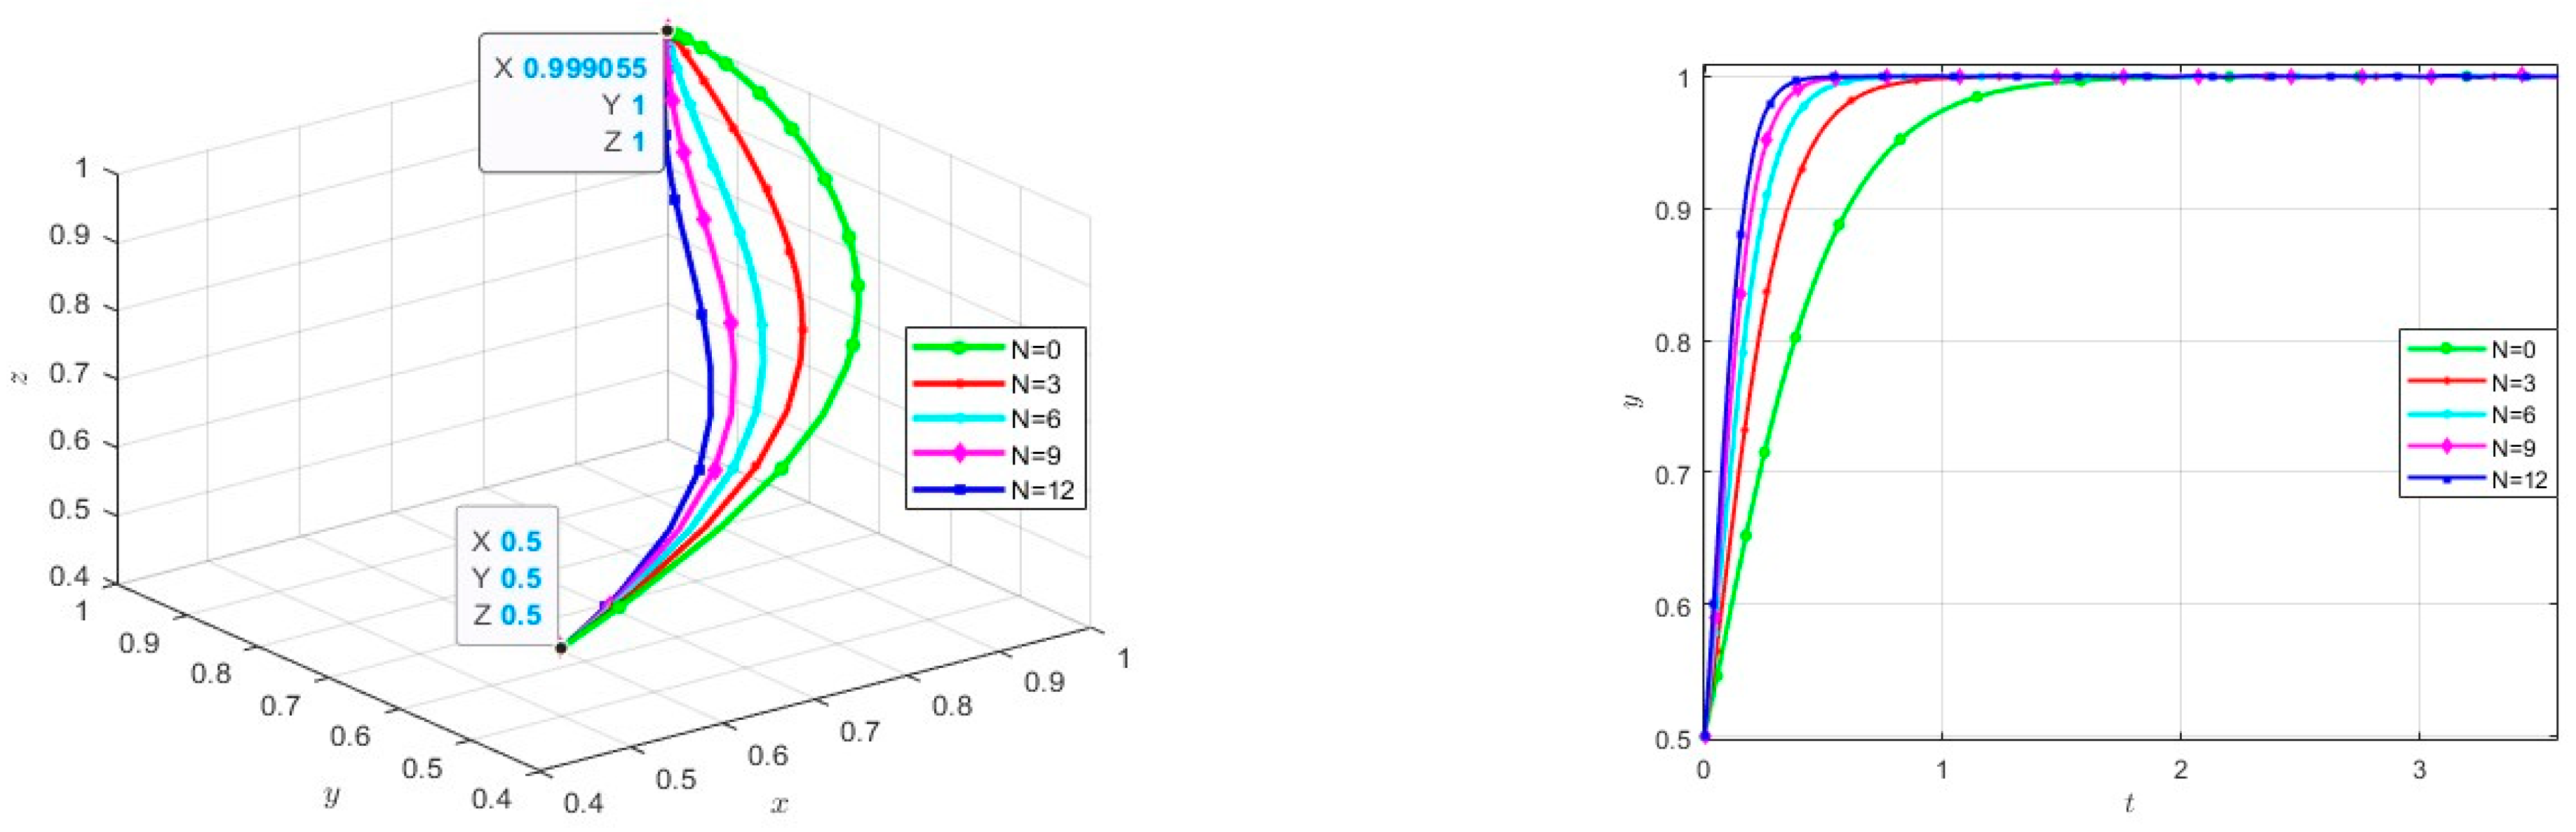
3.2.2. The Influence of N

Figure 9 illustrates the simulation results of the replicator dynamic equation’s evolution over time with other parameters held constant and N set to 0, 3, 6, 9, and 12. For the government and consumers, N does not significantly affect their strategic choices. When N = 0, the car manufacturers’ enthusiasm for developing autonomous vehicles is at its lowest. At this point, car manufacturers may consider factors such as costs and market risks, opting to maintain the status quo or only make minimal R&D investments. As the value of N increases, the value of y gradually rises. This indicates that as the economic penalty intensifies, the car manufacturers’ enthusiasm for the R&D of autonomous vehicles significantly increases. This is because the economic penalties increase the costs that car manufacturers would bear for not actively engaging in R&D, making them more inclined to increase R&D investment to avoid or reduce the economic losses brought about by fines. Especially when N > 12, the value of y quickly approaches 1 in a very short time, indicating that under the incentive of high economic penalties, car manufacturers will swiftly shift to active R&D, hoping to gain higher profits through technological breakthroughs and market capture and avoid substantial fines due to the lack of environmental and social responsibility.

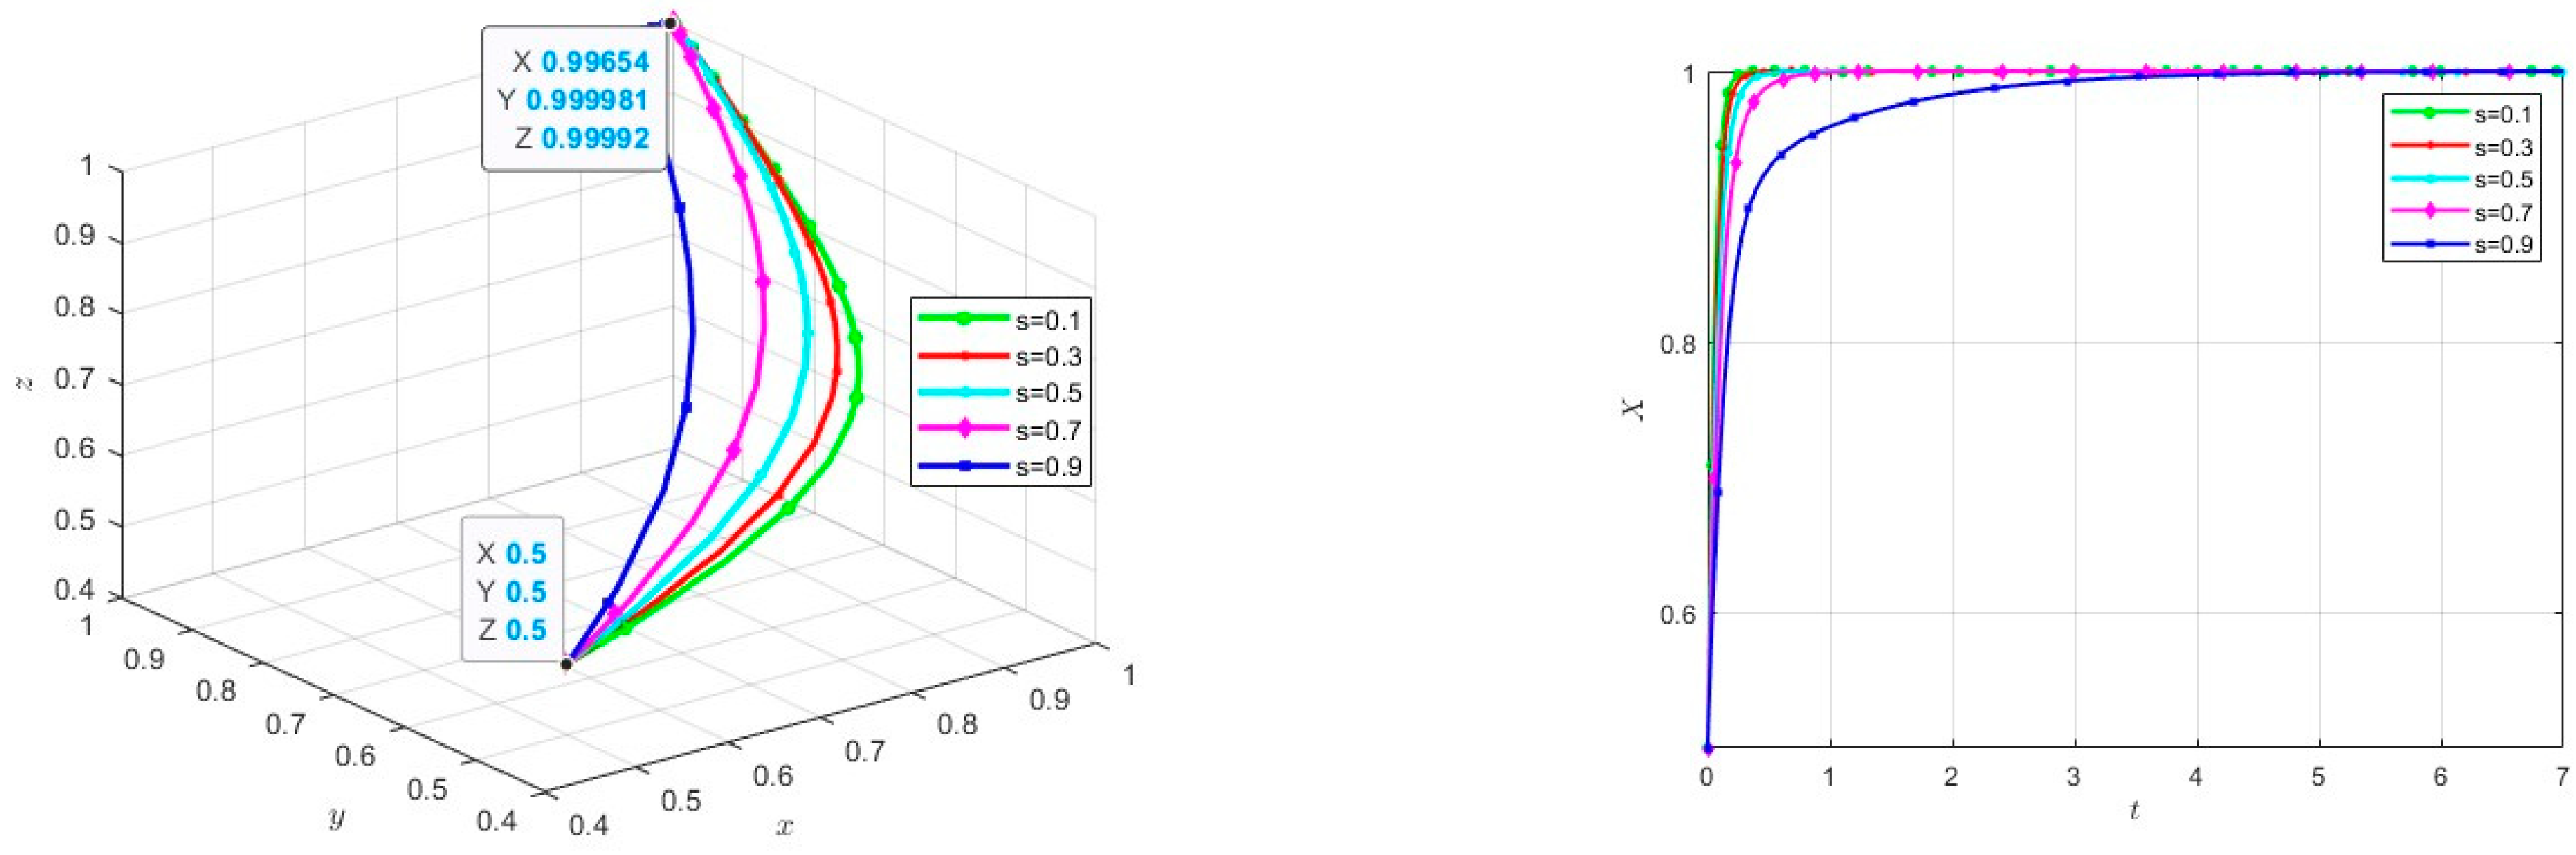
3.2.3. The Influence of s

Figure 10 represents the simulation results of the replicator dynamic equation evolving over time while keeping other parameters constant and setting s to 0.1, 0.3, 0.5, 0.7, and 0.9. The three-dimensional graph shows that as s increases, both X and y trend toward higher values. This could be due to the government’s strong support and the proactive research and development by car manufacturers enhancing market confidence in autonomous vehicles and consumers’ willingness to purchase. The two-dimensional graph indicates that when s increases, X also trends toward a higher value. This suggests that the more emphasis the government places on technological innovation, the more inclined it is to provide greater support to encourage car manufacturers to engage in more research and development and innovative activities.

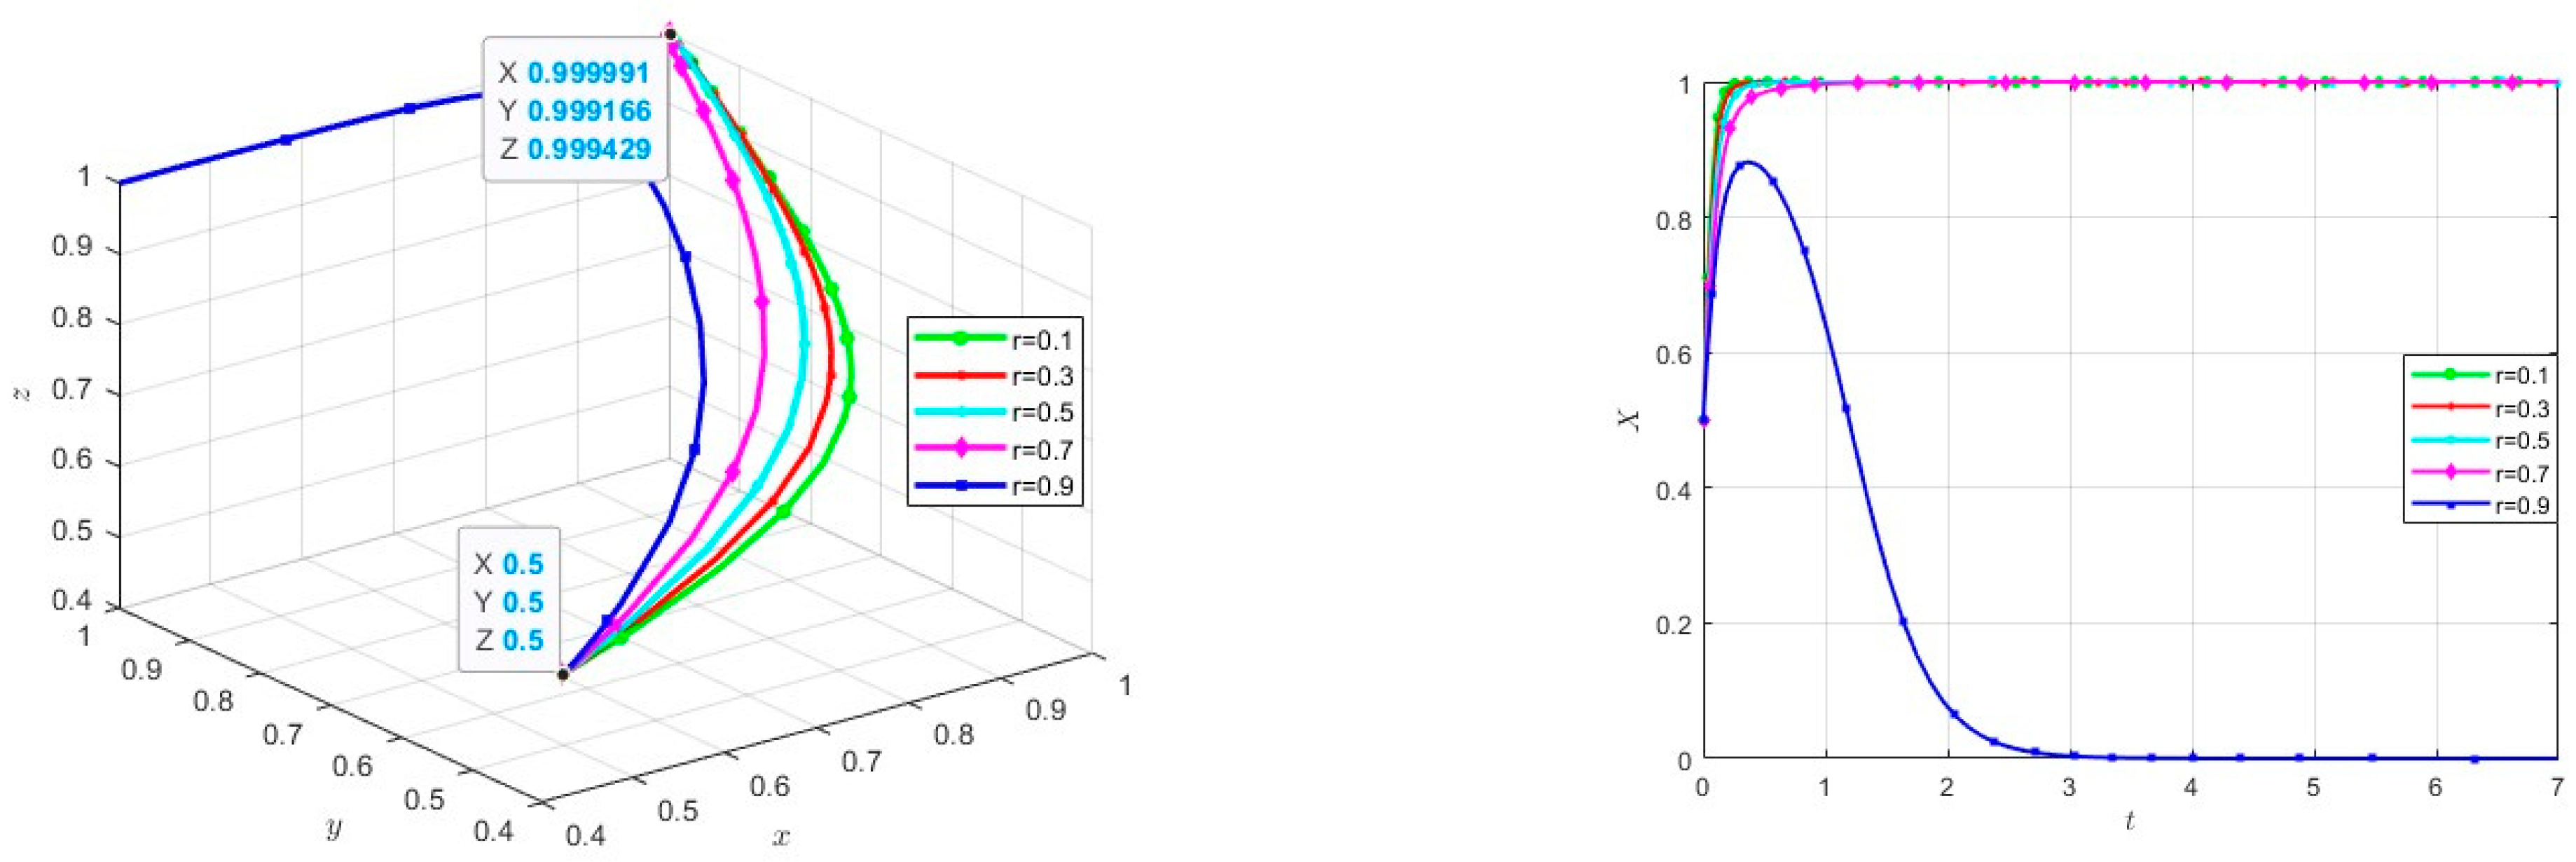
3.2.4. The Influence of r

Figure 11 illustrates the simulation results of the replicator dynamic equation evolving over time while keeping other parameters constant and setting r to 0.1, 0.3, 0.5, 0.7, and 0.9. It can be observed from the two-dimensional graph that at a low negative impact coefficient, the government tends to favor a high-intensity support strategy (when r < 0.7). However, at a high negative impact coefficient (for example, when r > 0.9), the government evolves toward a low-intensity support strategy. The short-term evolutionary trend is toward high-intensity support, which may be due to the initial limited spread of negative impacts. As time increases, the range of impact expands rapidly, potentially leading to a loss of government credibility and consumer panic, thereby causing the government to quickly evolve toward a low-intensity support strategy. A comprehensive analysis shows that the negative impact coefficient r plays a crucial role in government support policies.

4. Conclusions and Implications

This paper aims to explore the issue of purchasing autonomous vehicles. By constructing an evolutionary game model among the government, automobile manufacturing enterprises, and consumers, it analyzes the stable choices of unilateral strategies and equilibrium strategies for the purchase intention of autonomous vehicles. Using the MATLAB2022b tool for data simulation and analysis, the effectiveness of the conclusions and the impact of relevant factors on the purchase intention of autonomous vehicles were verified, and corresponding countermeasures and suggestions were put forward for stakeholders. The main conclusions are as follows:
(1)
The system’s strategic optimum can be achieved under the conditions of strong government support, proactive R&D by car manufacturers, and consumer purchasing.
(2)
The government’s support has a significant positive feedback effect on the enthusiasm of car manufacturers for R&D and the willingness of consumers to purchase. It is necessary to increase government support, strengthen the confidence of car manufacturers, formulate long-term stable policies, and encourage them to continue technological innovation.
(3)
The enthusiasm of car manufacturers for R&D is subject to the constraints of the negative impact coefficient. Therefore, the government should establish a risk mitigation mechanism to reduce negative impacts. This measure can effectively reduce the R&D risks faced by car manufacturers, motivate them to increase R&D investment, and promote technological development.
(4)
The willingness of consumers to purchase is influenced by both government support and the market environment. Therefore, when promoting the marketization of autonomous vehicles, the government should consider various factors comprehensively and use multiple means to enhance consumer confidence and willingness to purchase, such as strengthening the formulation and supervision of technical standards, enhancing market promotion efforts, and providing purchase subsidies.
In summary, combined with model analysis, these recommendations and measures aim to provide support from multiple aspects to comprehensively advance the research and development and marketization processes of autonomous vehicles, promote technological innovation and industrial development, and ultimately achieve the goal of intelligent transportation.

5. Limitations and Future Research Directions

This study, while offering an in-depth analysis of the relationships among government support, automotive companies’ R&D efforts, and consumers’ willingness to purchase and exploring the dynamic impact of various factors through changes in parameters, still has some limitations. First, the parameters and models assumed in this study may be overly simplified and may not fully account for the complex factors present in the real world. Additionally, the study does not sufficiently consider external environmental factors, which could significantly influence the R&D strategies and market performance of automotive companies in practice. Moreover, although the assumed parameters in the model—such as the government’s preference coefficient for technological innovation (s) and the negative impact coefficient of R&D failures (r) on companies—reflect a certain theoretical logic, the precise estimation of these values in real-world applications might be challenging, thus potentially affecting the accuracy of the model’s predictions.
Future research can be expanded and deepened in several ways. First, more complex and refined models could be developed, incorporating additional real-world variables and uncertainties. For instance, integrating market demand forecasting models and technology advancement curves could enhance the model’s practical applicability and predictive power. Second, empirical studies could be conducted, using methods such as surveys and market data analysis, to validate the theoretical assumptions and conclusions of the model, thereby increasing the practical relevance of the research. Lastly, exploring the optimization of policy combinations and implementation paths to assist governments and companies in making more informed strategic decisions is another promising direction for future research.

Author Contributions

F.C.: conceptualization, funding acquisition, project administration; C.M.: conceptualization, methodology, software, writing—original draft; C.M. and F.C. contributed equally to this work; Z.W.: data curation, writing—original draft, critical revisions, and final approval of the version to be published. All authors have read and agreed to the published version of the manuscript.

Funding

This research received no external funding.

Data Availability Statement

The original contributions presented in the study are included in the article, further inquiries can be directed to the corresponding author.

Conflicts of Interest

The authors declare no conflicts of interest.

References

  1. General Office of the State Council. New Energy Vehicle Industry Development Plan (2021–2035). Available online: http://www.gov.cn/zhengce/content/2020-11/02/content_5556716.htm (accessed on 25 August 2024).
  2. Huo, Z.; Liu, G.; Fan, Z. Research on the Mechanism of Public Adoption of Emerging Technologies in China—Micro Evidence from a Social Experiment Survey on Autonomous Vehicles. Stud. Sci. Sci. 2024, 1–20. [Google Scholar] [CrossRef]
  3. Li, J.; He, Y.; Sun, C.; Peng, J.; Chen, T. Acceptance Model and Risk Analysis of Autonomous Vehicles Based on SEM. Traffic Inf. Secur. 2021, 39, 26–34. [Google Scholar]
  4. Qin, H.; Zhang, R.; Wang, P. Differences in Autonomous Vehicle User Acceptance Between China and the U.S. Sci. Technol. Eng. 2021, 21, 6487–6493. [Google Scholar]
  5. Leung, Y.N. Understanding Passenger Acceptance of Autonomous Vehicles Through the Prism of the Trolley Dilemma. Int. J. Hum. Comput. Interact. 2024, 40, 2185–2194. [Google Scholar]
  6. Guan, J.; Du, X.; Zhang, J.; Maymin, P.; DeSoto, E.; Langer, E.; He, Z. Private vehicle drivers acceptance of autonomous vehicles: The role of trait mind-fulness. Transp. Policy 2024, 149, 211–221. [Google Scholar]
  7. Yoo, S.; Kumagai, J.; Kawabata, Y.; Keeley, A.R.; Managi, S. Buy and/or Pay Disparity: Evidence from Fully Autonomous Vehicles. Appl. Sci. 2024, 14, 410. [Google Scholar] [CrossRef]
  8. Fei, W.; Zhentai, Z.; Shoufu, L. Purchase intention of Autonomous vehicles and industrial Policies: Evidence from a national survey in China. Transp. Res. Part A 2023, 173, 103719. [Google Scholar]
  9. Xu, M.; Mao, W.; Shepherd, S.; Harrison, G.; Xu, M. Research on the Development of the Autonomous Vehicle Market in Beijing Based on System Dynamics. Syst. Sci. Math. 2024, 179, 103889. Available online: http://kns.cnki.net/kcms/detail/11.2019.o1.20240709.1633.004.html (accessed on 26 August 2024).
  10. Kaltenhäuser, B.; Werdich, K.; Dandl, F.; Bogenberger, K. Market development of autonomous driving in Germany. Transp. Res. Part A 2020, 132, 882–910. [Google Scholar]
  11. Huo, Z.; Liu, G. China’s Practice of Autonomous Vehicle Industrialization in the Context of Intelligent Transformation. Forum Sci. Technol. China 2024, 95–109. [Google Scholar] [CrossRef]
  12. Zhang, X.; Lu, Y.; Gao, X.; Huang, Y.; Liu, H.; Li, J. Cooperative Perception Technology and Development Trends for Intelligent and Connected Vehicles. Acta Autom. Sin. 2024, 50, 1–16. [Google Scholar] [CrossRef]
  13. Li, Q.; Shen, T. Analysis of the Development Status and Trends of Autonomous Vehicles Abroad. New Mater. Ind. 2020, 51–53. [Google Scholar] [CrossRef]
  14. Feng, Q.; Wu, S.; Wang, Y.; Kang, K. Research on the Current Status and Development Suggestions for the Construction of Intelligent and Connected Vehicle Testing Zones in China. Automot. Ind. Res. 2023, 1, 34–41. [Google Scholar]
  15. Qiuju, X.; Meng, X.; Caroline, M. Governance of Emerging Autonomous Driving Development in China. Transp. Res. Rec. 2020, 2674, 281–290. [Google Scholar]
  16. Shi, J.; He, M. Evolutionary Strategy Research on Platform Empowerment of SMEs’ Digital Transformation under Government Subsidies. Nankai Econ. Stud. 2024, 7, 22–43. [Google Scholar]
  17. Li, C.; Song, Y.; Wang, J.; An, X. Collaborative Development Model of China-Europe Railway Express under Government Incentive Mechanisms. J. Southwest Jiaotong Univ. 2024, 16, 8167. [Google Scholar]
  18. Jiang, X.; Zheng, W.; Ma, B. Evolutionary Game and Simulation Research on Anti-Monopoly of Digital Platforms under Different Incentive Mechanisms. Syst. Sci. Math. 2024, 44, 2213–2235. [Google Scholar]
  19. Wu, H.; Huang, Y.; Liu, G.; Luo, L.; Luo, Y. Synergizing stakeholder collaboration for value co-creation in China’s prefabricated decoration diffusion: A tripartite evolutionary game perspective. Heliyon 2024, 10, e34775. [Google Scholar] [CrossRef] [PubMed]
  20. Zhang, Z.H.; Ling, D.; Yang, Q.X.; Feng, Y.C.; Xiu, J. Central environmental protection inspection and carbon emission reduction: A tripartite evolutionary game model from the perspective of carbon neutrality. Pet. Sci. 2023, 21, 2139–2153. [Google Scholar] [CrossRef]
  21. Wang, W.; Hao, S.; Zhong, H.; Sun, Z. How to promote carbon emission reduction in buildings? Evolutionary analysis of government regulation and financial investment. J. Build. Eng. 2024, 89, 109279. [Google Scholar] [CrossRef]
  22. Tang, L.; Qing, S.; Xu, Z.; Zhou, H. A Review of Public Acceptance of Autonomous Vehicles. J. Transp. Eng. 2020, 20, 131–146. [Google Scholar]
  23. Xu, L.; Lu, Y.; Sun, Z.; Li, H. Personalized User Research Based on the Acceptance of Autonomous Vehicles. Packag. Eng. 2023, 44, 42–58. [Google Scholar]
  24. Yuen, K.F.; Wong, Y.D.; Ma, F.; Wang, X. The determinants of public acceptance of autonomous vehicles: An innovation diffusion perspective. J. Clean. Prod. 2020, 270, 121904. [Google Scholar] [CrossRef]
  25. Chen, S.; Wang, H.; Meng, Q. Designing autonomous vehicle incentive program with uncertain vehicle purchase price. Transp. Res. Part C 2019, 103, 226–245. [Google Scholar] [CrossRef]
  26. Tang, T.; Wang, X.; Wu, J.; Yuan, M.; Guo, Y.; Xu, X. Determinants and the Moderating Effects of Individual Characteristics on Autonomous Vehicle Adoption in China. Int. J. Environ. Res. Public Health 2023, 20, 43. [Google Scholar] [CrossRef]
  27. Cui, X.; Zhao, S. Willingness to Use Fully Autonomous Vehicles Considering Refined User Groups. J. Dalian Univ. Technol. 2022, 62, 476–484. [Google Scholar]
  28. Chu, H.; Hu, F.; Wang, Y.; Peng, Y.; Zhao, L. The Impact of Individual Empathy on Willingness to Accept Autonomous Vehicles with Different Moral Behavior Orientations. Appl. Psychol. 2024, 30, 203–210. [Google Scholar]
  29. Gill, T. Ethical dilemmas are really important to potential adopters of autonomous vehicles. Ethics Inf. Technol. 2021, 23, 657–673. [Google Scholar] [CrossRef]
  30. Liu, Z.; Liu, J. Elderly Acceptance of Autonomous Vehicles in the Context of the Digital Divide. J. Transp. Syst. Eng. Inf. 2023, 23, 168–175. [Google Scholar]
  31. Wang, L. Research on Public Acceptance of Autonomous Vehicles Based on Trust and Perceived Value. Beijing Jiaotong University: Beijing China, 2022. [Google Scholar] [CrossRef]
  32. Ye, X.; Sui, X.; Wang, T.; Yan, X.; Chen, J. Research on parking choice behavior of shared autonomous vehicle services by measuring users’ intention of usage. Transp. Res. Part F Psychol. Behav. 2022, 88, 81–98. [Google Scholar] [CrossRef]
  33. Rahman, M.M.; Deb, S.; Strawderman, L.; Burch, R.; Smith, B. How the older population perceives self-driving vehicles. Transp. Res. Part F Psychol. Behav. 2019, 65, 242–257. [Google Scholar] [CrossRef]
  34. Wang, Y.; Li, Y.; Tang, L. Modeling and Analysis of Acceptance of Autonomous Driving by Transportation Practitioners. J. Transp. Eng. Inf. 2023, 21, 42–54. [Google Scholar]
  35. Jing, P.; Wang, W.; Wu, L. Study on the Acceptance of Autonomous Vehicles by the Elderly. China J. Highw. Transp. 2021, 34, 158–171. [Google Scholar]
  36. Meng, L.; Liu, K.; He, J.; Han, C.; Liu, P. Carbon emission reduction behavior strategies in the shipping industry under government regulation: A tripartite evolutionary game analysis. J. Clean. Prod. 2022, 378, 134556. [Google Scholar] [CrossRef]
  37. Selten, R. A note on evolutionarily stable strategies in asymmetric animal conflicts. J. Theor. Biol. 1980, 84, 93–101. [Google Scholar] [CrossRef]
Figure 1. Tripartite evolution relationship.
Wevj 15 00498 g001
Figure 2. The replicator dynamic phase diagram for the government.
Wevj 15 00498 g002
Figure 3. The replicator dynamic phase diagram for automobile manufacturers.
Wevj 15 00498 g003
Figure 4. The replicator dynamic phase diagram for consumers.
Wevj 15 00498 g004
Figure 5. The evolutionary trajectory of E6 (1, 0, 1).
Wevj 15 00498 g005
Figure 6. The evolutionary trajectory of E7 (0, 1, 1).
Wevj 15 00498 g006
Figure 7. The evolutionary trajectory of E8 (1, 1, 1).
Wevj 15 00498 g007
Figure 8. The impact of C on evolutionary outcomes and trajectories.
Wevj 15 00498 g008
Figure 9. The impact of N on evolutionary outcomes and trajectories.
Wevj 15 00498 g009
Figure 10. The impact of s on evolutionary outcomes and trajectories.
Wevj 15 00498 g010
Figure 11. The impact of r on evolutionary outcomes and trajectories.
Wevj 15 00498 g011
Table 1. Perceived matrix parameter symbols and their meanings.
EntityParameterMeaning
GovernmentQThe additional cost incurred by the government when implementing strong policy support compared to weak support (including new infrastructure)
PThe financial subsidies provided by the government to car manufacturers under strong policy support
HThe purchase subsidies provided by the government to consumers under strong policy support
LThe tax incentives offered by the government to car manufacturers actively engaged in R&D
sThe government’s preference coefficient for technological innovation in car manufacturers (0 < s ≤ 1)
NThe economic penalty imposed by the government on enterprises that do not actively engage in R&D under strong support
KThe loss caused by the negative impact of accidents during the active R&D of autonomous vehicles by manufacturers under strong support
rThe coefficient of negative impact (0 < r ≤ 1)
G1The additional perceived benefit obtained by the government from implementing strong policy support for autonomous vehicles compared to weak support
G2The perceived benefit obtained by the government from implementing weak policy support for autonomous vehicles
XThe probability of the government choosing to implement strong policy support
Car ManufacturersWThe cost of actively producing and selling autonomous vehicles
DThe cost of passively producing and selling autonomous vehicles
FThe additional discounts offered to consumers in the active sale of autonomous vehicles
V1The perceived benefits obtained by car manufacturers from actively selling autonomous vehicles
V2The perceived benefits obtained by car manufacturers from maintaining the production of traditional vehicles (V1 > V2)
YThe probability of car manufacturers choosing to develop autonomous vehicles
ConsumersCThe additional cost for consumers to purchase autonomous vehicles compared to traditional vehicles
M1The perceived benefit obtained by consumers from purchasing autonomous vehicles
M2The perceived benefit obtained by consumers who do not purchase autonomous vehicles (M1 > M2)
ZThe probability of consumers choosing to purchase autonomous vehicles
Table 2. Table of perceived benefit matrix.
Participant StrategyConsumers (Z) Consumers (1 − Z)
Government (X) Car Manufacturers (Y) −Q×s – P − K×r + G1 − H − L−Q×s – P − K×r + G1 − L
P + V1 − W + L − FP + V1 − W + L
H − C + M1 + FM2
Car Manufacturers (1 − Y) −Q×s − P + G1 – H − L + N−Q×s − P + G1 − L + N
P − N + V2 − DP − N + V2 − D
H − C + M1M2
Government (1 − X) Car Manufacturers (Y) 00
V1 − W − FV1 − W
−C + M1 + FM2
Car Manufacturers (1 − Y) 00
V2 − DV2 − D
−C + M1M2
Table 3. Stability analysis of equilibrium points.
Equilibrium PointEigenvaluesStability Condition
E1 (0, 0, 0)λ1 = G1 + N − Qs − L − P > 0Instability
λ2 = D + V1 − V2 − W
λ3 = M1 − C − M2 > 0
E2 (1, 0, 0)λ1 = Qs − N − G1 + L + P < 0Instability
λ2 = D + N + V1 − V2 − W + L
λ3 = H − C + M1 − M2 > 0
E3 (0, 1, 0)λ1 = G1 − Qs − L − Kr − PInstability
λ2 = V2 − V1 − D + W
λ3 = F − C + M1 − M2 > 0
E4 (0, 0, 1)λ1 = G1 − H + N − Qs − L − P > 0Instability
λ2 = D − F + V1 − V2 − W
λ3 = C1 − M1 + M2 < 0
E5 (1, 1, 0)λ1 = Qs − G1 + L + Kr + PInstability
λ2 = V2 − N − V1 − D + W − L
λ3 = F − C + H + M1 − M2 > 0
E6 (1, 0, 1)λ1 = H − G1 − N + Qs + L + P < 0When V1 < F − D + V2 + W − L, ESS
λ2 = D − F + N + V1 − V2 − W + L
λ3 = C − H − M1 + M2 < 0
E7 (0, 1, 1)λ1 = G1 − H − Qs − L − Kr − PWhen V1 > F − D + V2 + W and G1 < H + Qs + L + Kr + P, ESS
λ2 = F − D − V1 + V2 + W
λ3 = C − F − M1 + M2 < 0
E8 (1, 1, 1)λ1 = H − G1 + Qs + L + Kr + PWhen V1 > F − D + V2 + W − sL and G1 > H + Qs + L + Kr + P, ESS
λ2 = F − D − N − V1 + V2 + W − L
λ3 = C − F − H − M1 + M2 < 0
Table 4. Simulation parameter assignments with value a.
ParameterQPHLsNKrG1G2WDFV1V2CM1M2
Value203.511.60.53300.5401525181202052010
Table 5. Simulation parameter assignments with value b.
ParameterQPHLsNKrG1G2WDFV1V2CM1M2
Value203.511.60.53400.6401525181302052010
Table 6. Simulation parameter assignments with value c.
ParameterQPHLsNKrG1G2WDFV1V2CM1M2
Value203.511.60.53300.5401525181302052010
Disclaimer/Publisher’s Note: The statements, opinions and data contained in all publications are solely those of the individual author(s) and contributor(s) and not of MDPI and/or the editor(s). MDPI and/or the editor(s) disclaim responsibility for any injury to people or property resulting from any ideas, methods, instructions or products referred to in the content.

