1. Introduction
In the automatic driving system or assisted driving system, the vehicle, through its own sensors for obtaining external information, needs to accurately identify and judge objects as a basis for decision-making control. For road traffic markings, lane line detection is only one type of traffic marking detection. Fast and accurate perception and detection of the remaining types of road traffic markings for the vehicle to accurately understand the current traffic situation also has a very important role, including zebra crossings, stop lines with regard to warning area information, guiding arrows with regard to right-of-way information, and other richer road environment data.
If the detection of lane lines and the rest of the many types of ground traffic markings is simply considered as an overall image segmentation task to be completed, it will be difficult to accurately output the instantiated results of lane lines, and thus, researchers tend to consider lane line detection separately. However, unlike in research, in practical applications, the environment-aware modules of vehicles tend to use heavyweight backbone networks to ensure the accuracy of detection, and constructing separate network models for different types of traffic marking detection tasks implies a significant consumption of computational resources.
The detection of multiple types of traffic markings complements and improves lane line detection, and due to the lack of open-source datasets, most of the existing research has been conducted on non-public datasets. Li et al. [
1] used traffic marking detection as a grid regression task and the clustering of grid sampling frames as a post-processing technique for merging grid cells. Jang et al. [
2] segmented traffic markings through a deep learning network. The segmented traffic markings are then collected to construct a lane-level traffic marking mapping, which is improved by closed-loop detection and graph optimization. Similar to the literature in [
2], Liu et al. [
3] used the image segmentation technique to detect multiple surface traffic markings and constructed a semantic segmentation model through a residual network (ResNet) and a feature pyramid network for lane lines and multiple surface traffic marking segmentation and detection. Han et al. [
4] conducted research and designed the EDN-YOLO model, which improves the model’s ability to perceive global features by replacing the original backbone network with Efficient ViT, all without increasing model complexity. This approach significantly enhances the detection of multi-scale traffic markings in complex scenes. Liu et al. [
5] proposed a pyramid scale-aware module that dynamically generates receptive fields of different sizes based on the regional context of an input image, thereby constructing a feature-rich feature pyramid to address the diversity of object scales. Wang et al. [
6] proposed a method based on improved YOLOv4 for detecting and recognizing multi-scale traffic markings in complex environments. The method uses an image preprocessing module that classifies and denoises images of complex environments and then inputs the images into the improved YOLOv4. Zhang et al. [
7] proposed a novel and efficient method for detecting traffic markings, which reduces the redundancy of the network model parameters and improves the real-time performance of detection by removing a prediction branch of the YOLOv3 network model. A multi-scale attention feature module was also proposed to enhance the feature pyramid network by fusing feature information from different layers and refining the features.
Combining Transformers with Convolutional Neural Networks is also a focus of current research. Zhang et al. [
8] proposed a robust model called C-Transformer that can succinctly integrate convolutional operations and self-attention to facilitate comprehensive recognition of the essential features of road markings. A new and efficient inverse residual feedforward network is also used in this model, which significantly improves the detection performance. Dong et al. [
9] proposed a robust semantic segmentation algorithm, Marking-DNet, for pixel-level recognition of road markings. Its improved encoder–decoder architecture based on DeepLabV3+ produces more levels of information exchange. An object–context representation and a convolutional block attention module are also used for more efficient context learning and significant spatial and channel attention. Zhang et al. [
10] found that traditional sliding window lane detection algorithms perform poorly on large curvature curves. To address this issue, they improved the conventional sliding window algorithm by proposing a lane detection computation method that integrates a steering angle sensor and a stereo camera. Chai et al. [
11] proposed a lane detection method based on line anchor points to address the challenge of quickly detecting lane markings in complex situations. This method leverages a Transformer encoder–decoder structure to enhance the model’s ability to extract global features and detect lane markings in challenging environments. Xie et al. [
12] introduced a novel lane detection algorithm that combines online reparameterized ResNet with a mixed attention mechanism. By replacing standard convolutions with online reparameterized convolutions, the computational process is simplified, resulting in reduced detection time. Additionally, they incorporated a line anchor lane detection method to analyze the presence and position of lane markings in an image row by row, providing predicted lane positions as output. Duc Khai Lam et al. [
13] came up with a lightweight convolutional neural network that requires only two small arrays for minimal post-processing. Chang et al. [
14] aimed to tackle the challenges of lane line detection in low-light conditions by proposing a Low-Light Enhanced Fast Lane Detection (LLFLD) method. This approach combines an automatic low-light scene enhancement network with a lane line detection network to improve detection performance. Cheng et al. [
15] proposed a lane line detection algorithm based on instance segmentation and a multi-size asymmetric shuffled convolutional model for sparse and slender lane line models, which dramatically improves the detection accuracy and speed.
The detailed detection of lane lines has likewise been studied by numerous scholars. Davy et al. [
16] came up with a detection algorithm that can predict any number of lane lines. They achieve this by plugging two detectors in parallel into the feature extraction network, one to classify the lane line pixels from the background and the other to calculate high-dimensional embedding coordinates for the lane line pixels. Then, a clustering algorithm is used to differentiate each lane as a separate instance. To tackle the challenge of curve detection in lane line detection, Xu et al. [
17] proposed a lane-sensitive structure search framework. This framework is capable of capturing relevant global context information as well as precise short-range lane line curve details. Zheng et al. [
18] designed a cross-layer refinement network by refining the detection results of lane line instances through the output of different layers of the feature extraction network. In order to distinguish between solid and dashed lines in lane lines, Collado et al. [
19] used Kalman filtering to achieve lane line detection based on traditional image processing and then used Fourier analysis to achieve the classification and recognition of solid and dashed lines. Any et al. [
20] proposed a spatio-temporal incremental clustering algorithm combined with a curve-fitting approach to detect lane lines along with other road markings. Li et al. [
21] designed a system that can detect and identify lane lines in panoramic images. After generating a top view of the road using the panoramic image, the Euclidean distance between the center and the boundary is computed in positive angular steps to extract the feature vectors for each potential road marking segment. After classifying each segment, lane lines are modeled for the purpose of recognition and detection. Dai et al. [
22] improved the Hugh transform based on the original classical algorithm for lane lines to enhance the robustness and adaptability of the detection results. Similar to research in the literature [
19], R Subramani et al. [
23] used Kalman filtering to achieve stable lane line detection, using various preprocessing techniques to improve and filter out the noise present in the video frames and to predict the future lane lines by eliminating the offset error. Ding et al. [
24] employed VGG16 as the foundational convolutional neural network and utilized dilated convolutions to extract lane line features. They classified the lane lines into solid and dashed lines, ultimately achieving lane line detection through a fitting process.
Therefore, constructing an integrated traffic marking detection method to achieve unified feature extraction and traffic marking detection can effectively reduce the waste of computational resources.
In summary, the main contributions of this paper are as follows:
(a) An image segmentation-based road traffic marking detection network is designed to compute the weight distribution by spatial attention and change the previous feature fusion strategy of the feature pyramid.
(b) A global feature guidance module is designed to enhance road traffic marking segmentation accuracy in complex environments by adding long-range perceptual attention.
2. Integrated Traffic Marking Segmentation Detection Network
As road traffic markings will present a complex position and shape distortion visual state in the captured image under the interference of various factors such as occlusion and vehicle sensor viewpoints, which makes the target detection method based on anchor frames, produce a large error, while image segmentation is a deep learning technique for pixel-by-pixel classification, which is suitable for irregular objects or detection tasks with high accuracy requirements. Therefore, in this paper, based on the image segmentation technique, we constructed a comprehensive traffic marking segmentation detection network of various types.
2.1. Multi-Branch Traffic Marking Detection Network
The overall framework of the integrated traffic marking detection network in this paper is shown in
Figure 1, and the overall structure takes the residual network (ResNet) as the backbone network, including three detector branches, and the three branches share one backbone network to extract features. Among them, the first branch is the traffic marking segmentation decoder designed in this paper, which is used for traffic marking segmentation detection and will be introduced in detail in
Section 2.2 of this paper. The second branch is the lane line position information detection branch [
25] as shown in
Figure 2, which is used to detect the specific position of lane lines. The third is the lane line fine-grained attribute detection branch, shown in
Figure 3 below, which is used to detect the complete attribute class of lane line instances.
2.1.1. Attention-Guided Lane Line Detection Algorithm
The overall algorithm is based on the idea of an anchor frame for target detection, all the grids in the image determined in advance for the a priori anchor frame, lane lines, center lines, and other intervals of sampling the key points as the center point of the true value required in the target detection. Based on the target detection method, the a priori anchor frame is used to regressively detect each sampling point of the lane line example. For the specific algorithmic process, please refer to the literature [
25], and this paper only describes the overall structure of its model.
The overall lane line detection model is shown in
Figure 2, this model reduces the risk of model overfitting by adding Dropblock layer to randomly deactivate some neurons. DropBlock is an improved version of the Dropout technique, specialized for CNNs, which prevents network overfitting by randomly deactivating a block of consecutive neurons for image data with high local correlation. Unlike traditional Dropout, which randomly deactivates independent neurons, DropBlock discards a contiguous piece of neurons in the form of a block. It discards the feature maps within the entire block by generating a fixed-size square region.
The algorithm utilizes the fourth-level feature matrix (P4) outputted by the model to compute the row–column guidance matrix, while the third-level feature matrix (P3) is employed for the final lane line position detection. The third-level features of the model work in conjunction with the row–column guidance matrix in the feature enhancement module (RCGMFE), and the feature distillation module operates between different feature layers. It is important to note that the feature distillation module is only effective during model training to enhance the training performance. Ultimately, the algorithm outputs the positional information of the lane line instances.
2.1.2. Algorithm for Fine-Grained Attribute Detection of Lane Lines
The lane line fine-grained attribute detection algorithm begins by defining an additional attribute without visual cues for each type of lane line and performs pixel-level fine-grained representation for the same lane line instance. It then decouples the three attributes of lane lines (solid and dashed, single and double, color) and describes the fine-grained attribute information of lane lines through the use of attribute key points. For each attribute key point, the algorithm assesses its solid and dashed nature, single and double nature, and color, ultimately outputting fixed fine-grained attribute information for the lane lines.
The workflow of this detection module is shown in
Figure 3. First, the input features are passed through the Large Kernel Attention Module (LKA), which utilizes the attention mechanism of LKA to expand the model’s receptive field and capture more global contextual information. Then, the local information in the original feature matrix is recovered through residual concatenation, followed by correcting the numerical distribution of the feature matrix using the Layer Norm Module (LNM) to enhance the model’s generalization capability. Finally, global contextual information is fused with the new feature matrix using full connectivity, and the feature matrix T is output separately for each attribute. Ultimately, the output matrix T is computed using an equation to obtain the fine-grained values of lane lines. Please refer to the literature [
25] for the specific algorithm formula.
2.2. Segmentation-Based Traffic Marking Detection Model
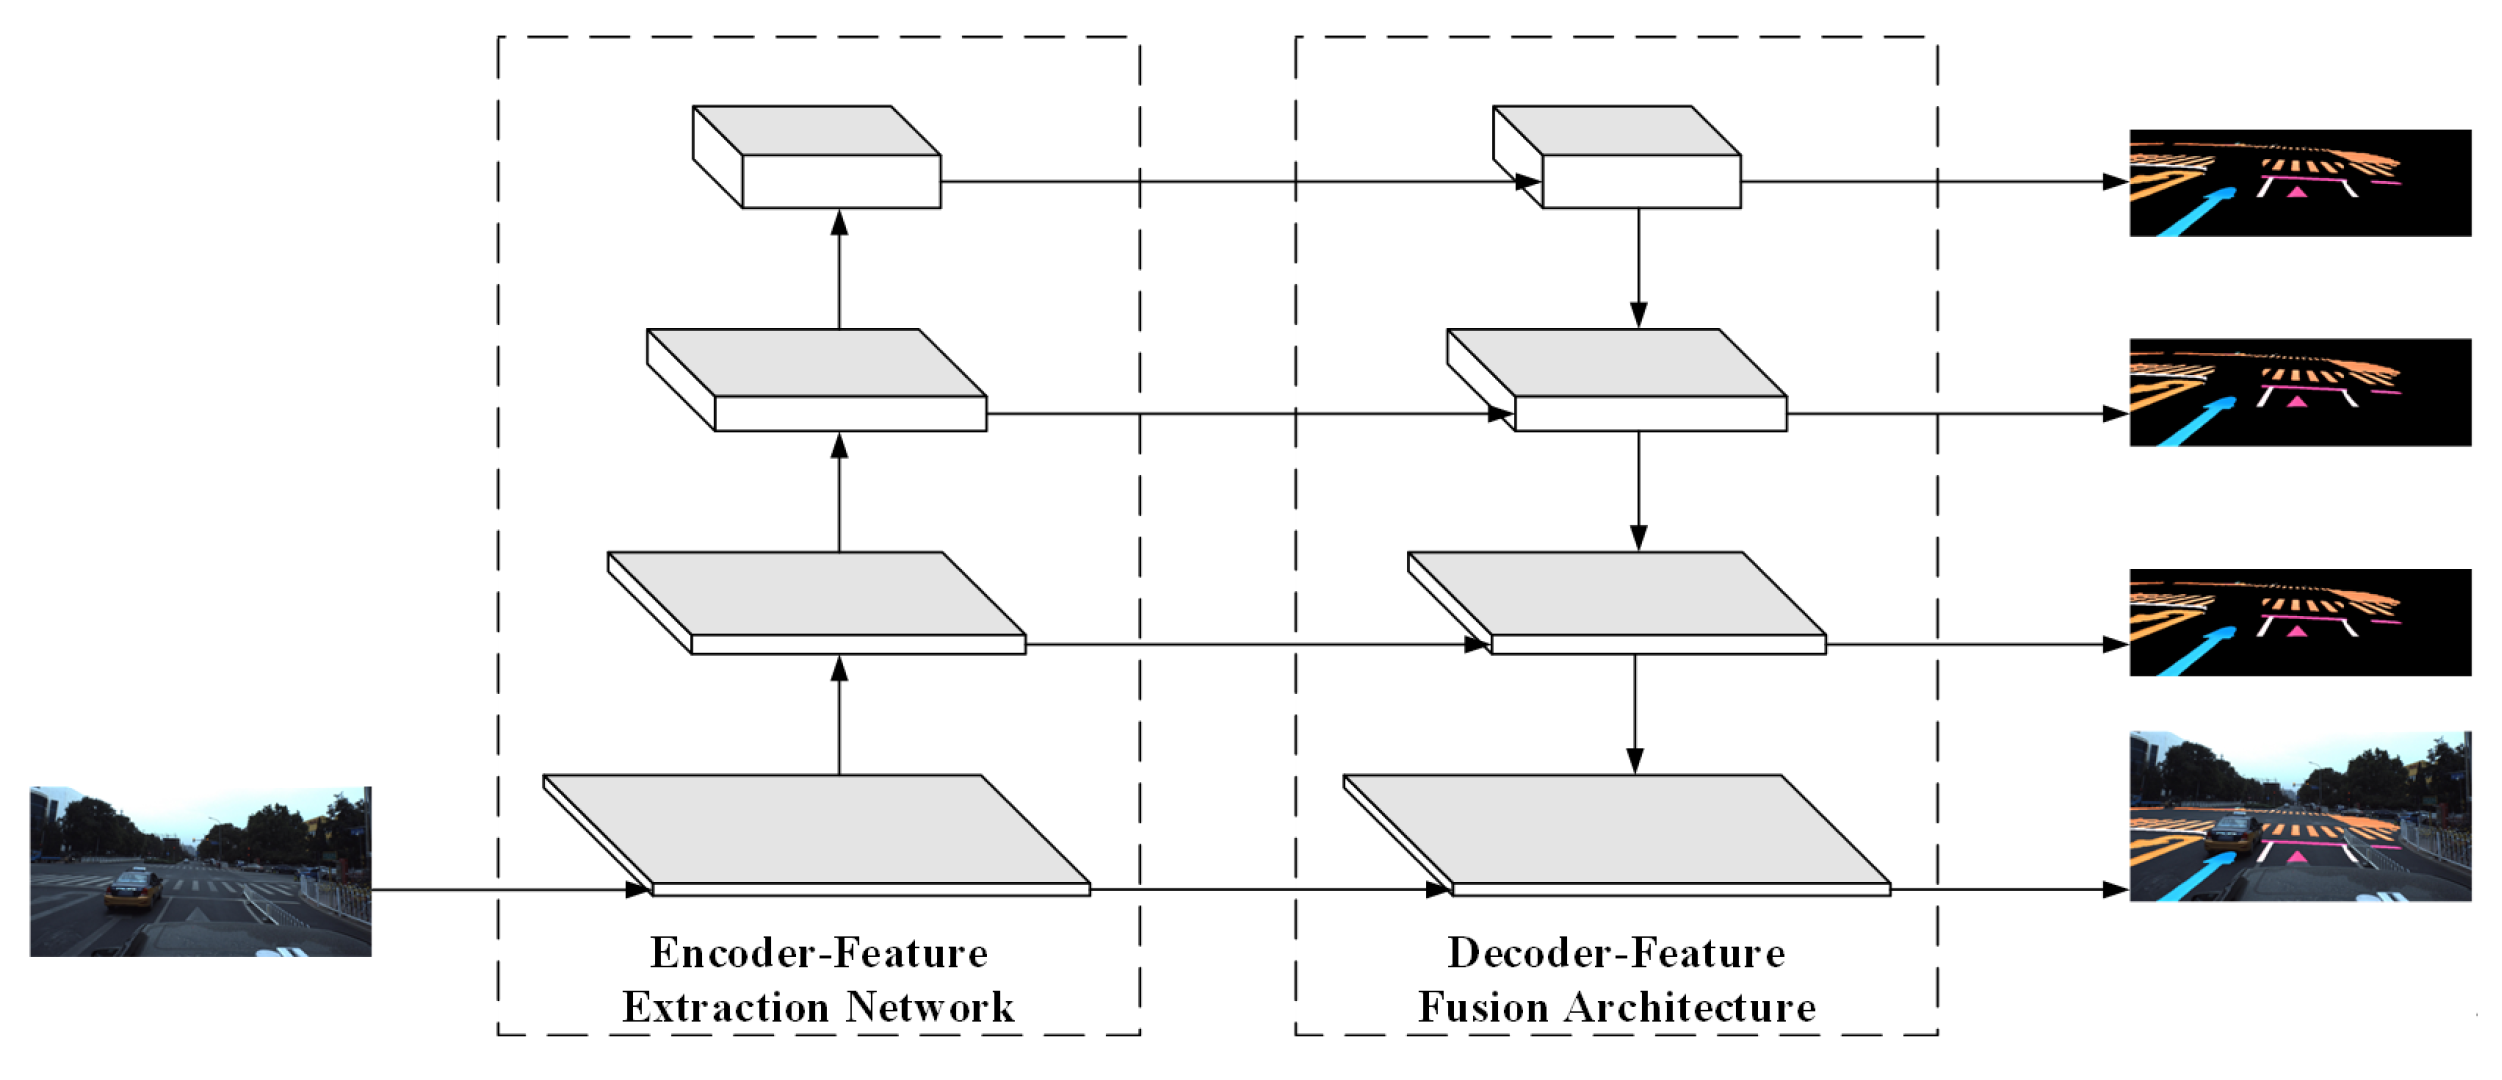
The encoder–decoder structure is the basis of the image segmentation model, where the input image is extracted by the encoder to extract the abstract features, and the features are then processed using the decoder and restored to the resolution size of the input image by techniques such as up-sampling in order to achieve pixel-level target detection.
2.2.1. Pyramid Feature Integration
The feature pyramid structure is capable of fusing features at different scales so that the fused features have both global and local information. It can solve different tasks from conventional target detection, such as providing better detection when the pixel-by-pixel classification of image segmentation requires the support of more refined features. Therefore, this paper builds a traffic marking segmentation detection model based on the feature pyramid structure, and the model structure is shown in
Figure 4.
In
Figure 4, on the left side, the feature matrices extracted from the backbone network with many different scales and different levels of abstraction are shown, and on the right side, the pyramid feature fusion network structure is shown. The feature pyramid structure takes the highest-level feature matrix of the backbone network as the starting access, restores the scale of the feature matrix to the scale size of the next-level feature matrix of the backbone network through the up-sampling computation module, and then superimposes it on the feature matrix of the next-level output of the backbone network, and achieves the feature fusion of the different feature layers of the backbone network in this way.
In order to enhance the convergence of the model parameters and the detection accuracy, this paper up-samples the different feature matrices of the feature pyramid to the input image size and then outputs the corresponding segmentation detection results through the detector as the detection branch of the auxiliary training. In the actual inference, the auxiliary segmentation detection branch is masked and does not increase the model computation.
2.2.2. Weight-Guided Feature Fusion Structure Based on
The feature pyramid structure is capable of fusing feature matrices of different scales and levels of abstraction to produce feature matrices with both global and local detail information in order to output segmentation detection results with higher accuracy. However, the parameters of the convolutional neural network converge according to the constraints of the dataset, and it is difficult to clarify the practical significance of the feature extraction operators within it, thus making the semantic information and abstraction level of the extracted feature matrices impossible to measure directly. A simple fusion of different levels of feature matrices on top of each other ignores the semantic properties of different feature matrices themselves, such as the importance of feature matrices with different scales and abstraction levels in the final detection results. An intuitive solution is to assign corresponding weight coefficients to each feature matrix separately when performing feature matrix fusion. The formula is as follows:
Formula: is the weight coefficient of different scale feature matrices in fusion, is the next level eigenmatrix, is a higher level feature matrix.
The focus of the above method is on the determination of the weight coefficient
, because the calculation of
must take into account the characteristics of different feature matrices so that it contains more global information. Literature [
26] proposes a feature fusion method based on the attention mechanism, which provides a solution for the calculation of the weight coefficient
. The network structure is illustrated as follows.
In
Figure 5, the original feature matrix fusion method is shown on the left side. By up-sampling the higher-level feature matrix
to the same scale as the feature matrix
, the feature matrix
is computed by
convolution to the same number of channels as the up-sampled feature matrix
, and then the new feature matrix is computed by summing
and
. The right side is the weight-guided feature fusion module, which inputs the feature matrix and the corresponding weight coefficients
into the Attention Module. On the right side is the weight-guided feature fusion module, where the feature matrices
and
are input into the Attention Module to calculate the corresponding weight coefficients
; the feature matrices
and
are fused to give them different degrees of importance. The Attention Module is a spatial attention module, where the spatial attention map is obtained by performing both maximum pooling and average pooling on the channel dimensions of the two input feature matrices
and
, which are simply superimposed to form the weight coefficients
. The weight coefficients
reflect the relationship between the two levels of the feature matrices at different locations.
2.2.3. Image Segmentation Guidance Matrix
The highest-level semantic feature matrix of the model is calculated to output the attention matrix with global information, and the a priori characteristics of the line classification lane line detection idea are integrated into it through the corresponding constraint function and calculation module, and the attention matrix generated on this basis is called the rank guidance matrix, which is used to enhance the feature strength of the model’s region of interest and improve the model’s ability to detect in complex scenarios such as occlusion. The constraint function of such row and column bootstrap matrix is calculated as follows:
Formula: is the loss incurred by the constrained attention matrix, is the true value of the lane line through the grid, is the feature matrix row constraint, is the identity matrix column constraint
Based on this, it is introduced into the design of the traffic marking segmentation decoder designed in this paper. In the traffic marking segmentation detection task, the distribution of multiple types of road traffic markings has no obvious regularity, so it is necessary to make corresponding changes to its feature enhancement module (e.g.,
Figure 6), and redesign its calculation formula and constraint function, so as to make its numerical distribution conform to the foreground distribution law of road traffic markings. The final output of the corresponding attention matrix is called the segmentation guidance matrix in this paper.
The first is the change in the calculation formula and constraint function of the rank-and-file bootstrap matrix. In order to adapt to the characteristics of the traffic marking segmentation task, the segmentation bootstrap matrix A in this paper is directly computed from the highest level semantic feature matrix of the model by means of full connection. To ensure that the numerical distribution of matrix A aligns with the distribution characteristics of foreground and background in road traffic markings, all traffic markings are uniformly classified as foreground classes. The segmentation guidance matrix A is then regulated according to Equation (
3). Then, the segmentation guidance matrix and the feature matrix of the model are fused through the residual structure and the large kernel convolution module to realize the segmentation detection of traffic markings of multiple types.
Formula: is the loss incurred by the constrained attention matrix, G is the matrix of true values for the foreground and background distributions of traffic markings, and is the binary cross-entropy loss function (Binary Cross-Entropy, BCE).
The overall structure of the traffic marking segmentation detection network designed in this paper is shown in
Figure 7, where the CARFE feature diffusion module is the row and column feature enhancement module mentioned above (CRAFE).
2.3. Loss Function
The comprehensive traffic marking detection model loss function described above in this paper is divided into three parts, namely the road traffic marking segmentation detection part, the lane line instance detection part [
25], and the lane line fine-grained attribute detection part [
25].
For the segmentation detection part, each picture to be detected is denoted as I, represented by a matrix of shape I, which is used as input to the traffic marking segmentation model. The detection result output by the model is denoted as O, represented by a matrix of shape C, where C is the total number of categories output by the road marking segmentation detection branch. The annotated true value corresponding to image I is denoted as G, which is represented by a matrix of shape G. The image I is the real value of the road marking. In order to obtain the confidence level of each pixel point corresponding to different categories, the softmax function is computed for the first dimension of the high-dimensional matrix O output from the model, and the computation formula is as in Equation (
1).
Formula: is the confidence level of different pixel points detected by the model corresponding to different categories.
Due to the extremely uneven distribution of different categories of traffic markings in the actual urban scene, directly calculating the classification loss of each pixel point will cause the weight of the model to converge to the traffic marking category with a larger number. Therefore, in this paper, different weight coefficients are given to different categories of traffic markings when calculating the segmentation loss, and finally, the cross-entropy loss function is chosen in the calculation of the
Formula: is the weighting factor for different categories of traffic markings, is the one-hot coding matrix corresponding to the true value G.
Two ways of calculating are considered for practical applications, one is to calculate the weight coefficients through the whole training set, and the other is to calculate the weight coefficients in real time for each batch (small batch) of training. In this paper, we use the first way to calculate the loss weights of different categories of labels.
During training, the feature pyramid network in this paper adds an auxiliary multilevel traffic marking segmentation detection branch in addition to feature fusion at each layer as an additional constraint on the model and removes this structure during inference without increasing the model burden. The auxiliary segmentation loss function
is the same as in Equation (
2). In addition, the partitioned bootstrap matrix constraint function
from
Section 2.3 of this paper is included.
In summary, the total loss function in this paper is:
Formula:
is the loss function for any lane line instance detection method;
is the lane line segmentation attribute detection loss, using the cross-entropy loss function constraints, including the virtual reality, single and double and color three parts of the loss, the above two loss functions are detailed in the literature [
25].
,
,
,
,
is the weighting factor for each loss value, matched to the order of magnitude of each loss value.
3. Experiment
3.1. Experimental Setup
3.1.1. Datasets and Evaluation Indicators
This paper chooses the ApolloScape dataset as the foundation for constructing the required fine-grained lane line attribute dataset. ApolloScape is a large-scale autonomous driving dataset with a resolution of 2710 × 3384, including annotations for 3D and 2D vehicles, as well as road traffic markings. The dataset has a total of 37 pixel-level traffic marking categories of annotation information in addition to the present visual range, which are the visual range lane lines (including white double dashed lines, single solid lines, double solid lines, etc.), stop lines, zebra crossings, guiding arrows (including turnaround arrows, straight ahead arrows, straight ahead or left turn arrows, straight ahead or right turn arrows, straight ahead or right turn arrows, left turn arrows, right turn arrows, left turn arrows, left turn arrows, left turn arrows, left turn arrows, left turn arrows, and right turn arrows, left turn arrows, and left turn arrows. Or right turn arrow, can turn left or turn around arrow, can go straight or turn around arrow), no parking markings, and annotation information such as broken markings and image background. The visualization is shown in
Figure 8 below.
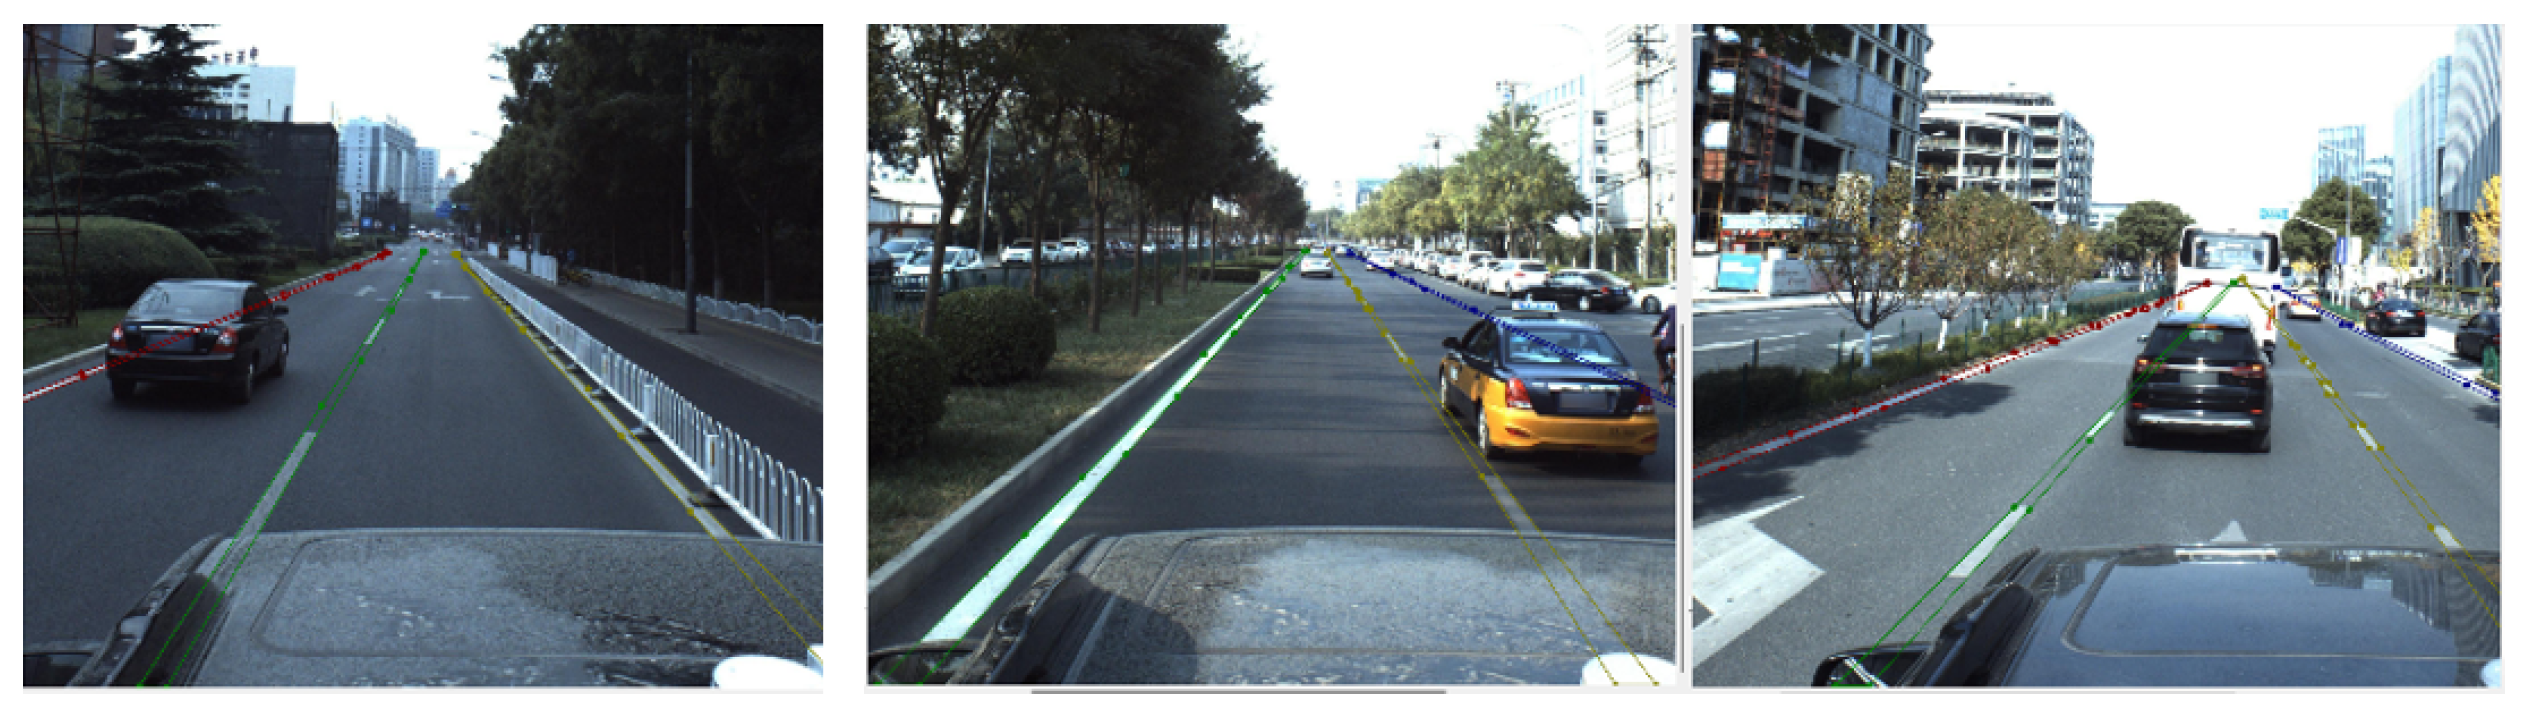
Instance-level lane line information annotation was performed via the labelme annotation tool to supplement the missing lane line instance information in the ApolloScape dataset, as shown in
Figure 9.
In
Figure 9, lane line instances in complicated areas, such as those with occlusions, are identified using contextual cues. Each lane line instance is fully annotated up to the furthest non-visible point, and ultimately, instance-level information is represented by illustrating the outer contours of the lane lines. In this paper, a total of 5693 instance-level lane line datasets are manually labeled, which are divided into 4589 for the training set, 520 for the testing set, and 584 for the validation set and this new dataset is called ApolloScape-Precise.
Afterward, on the basis of the ApolloScape-Precise manual annotation dataset, the intelligent lane line instance annotation process is constructed and is based on the aforementioned lane line location information detection methods (covers lane line detection methods based on line classification, segmentation, and line anchoring), the backbone network is replaced by networks from ResNet-18 to ResNet-101, and pre-training of the labeled model uses CULane and Curvelanes as pre-training datasets for the labeled model. The models were then fine-tuned using the annotation information of thousands of datasets that were manually labeled. Cross-validation using different models after fine-tuning generates lane line annotation information by representing each lane line instance through a sequence of key points. Finally, the annotated information with obvious errors is manually corrected and filtered to remove them. Finally, a total of 56,828 annotated images are generated for the annotation dataset, which is divided into 39,779 annotated images for the training set, 11,365 for the testing set, and 5684 annotated images for the validation set, which is called the ApolloScape-Large dataset.
In this paper, we complete the related experiments based on the two datasets of ApolloScape-Precise and ApolloScape-Large, which have been constructed well as mentioned above.
The comprehensive traffic detection model in this paper is divided into lane line location information detection branch, lane line fine-grained attribute detection branch, and multi-traffic marking segmentation detection branch.
F1 is used as the evaluation index for lane line location information detection, and Accuracy (Acc) is used as the evaluation index for fine-grained attribute detection of lane lines, respectively. The combined evaluation metric
F1 is calculated from precision and recall (
TP and
FP are the number of instances that are detected correctly and detected incorrectly).
Formula:
is the key point for detecting the correct lane line,
is the marked true value lane line key point.
is the number of instances of incorrectly detected lane lines,
is the number of lane line instances detected by the model,
is the number of lane line instances missed,
is the number of labeled true value lane line instances.
For the road traffic marker segmentation task in this paper, Pixel Accuracy (PA), Mean Pixel Accuracy (MPA), Intersection over Union (IoU), and Mean Intersection over Union (MIoU) are used as the corresponding evaluation metrics. Over Union (MIoU) as the corresponding evaluation metrics. The calculation categories of MIoU include guide arrows, zebra crossings, stop lines, lane lines, deceleration signs, no-stopping zones, and non-conventional labeled areas, excluding the influence of background categories.
Formula: K is the number of traffic marking categories included in the calculation of MIoU. TP, FP, and FN are the pixels detected correctly, the pixels detected incorrectly, and the pixels missed in each category, respectively.
3.1.2. Experimental Environment
In this paper, the experimental environment operating system is Ubuntu20.04, the deep learning framework is PyTorch1.8, the development language is python3.8, and the computing device is GeForce RTX 3090. The training parameters are set as follows, in which the model optimizer is Adam, the initial learning rate is
, and the learning rate decline function is Cosine Annealing LR, see Equation (
15).
In the ApolloScape-Precise dataset, there are 36 vertical anchor lines, each divided into 100 grid cells. The training process is conducted over 100 epochs, with each batch consisting of 8 images. Similarly, in the ApolloScape-Large dataset, 36 vertical anchor lines are established, with each line also divided into 100 evenly spaced grids. The training lasts for 30 epochs, with each batch containing 12 images. The image resolution used for the segmentation detection module is 288 × 800.
Formula: is the current learning rate, is the initial maximum learning rate, is the minimum learning rate, is the current epoch number, and is the total number of epochs.
3.2. Road Traffic Marking Segmentation Detection Comparison Experiment
This experiment is conducted based on the weight-guided feature pyramid structure and the introduction of the attention method. Comparison experiments are conducted with many types of existing image segmentation detection algorithms, including SCNN and RESA segmentation and detection networks optimized for traffic scene segmentation with special convolution, as well as Transfomer-based image segmentation network SegFomer and lightweight segmentation network PPLite-Seg. In order to prove the accuracy of the traffic marking segmentation and detection in this paper in a more detailed way, this experiment has shielded the lane line location information branch, fine-grained attribute information detection branch and lane line instance detection branch in the multi-branch traffic marking detection network, and therefore chooses to use the ApolloScape-Large dataset as the dataset for the experiments in this section, and focuses on demonstrating its segmentation evaluation metrics, IoU, in the guiding arrows, zebra crossings, semantic categories of lane lines, and stop lines.
Table 1 shows the traffic marking segmentation detection results of the above several segmentation detection networks. Each method follows the original network structure. In order to balance the impact of different backbone networks and the complexity of the model computation, the backbone network of the SCNN segmentation network is VGG-16, the backbone network of the PPLite-Seg is STDC-v2, the SegFomer is a B2-level network architecture, and the RESA takes the residual network of the second level (ResNet-34) as the backbone network, and the method in this paper uses the residual networks of the first and second levels (ResNet-18 and ResNet-34) as the backbone network for the comparison experiments, respectively. The experimental results show that the road traffic marking detection branch designed in this paper demonstrates advantages in a number of evaluation indexes, in which the guiding arrow segmentation detection IoU is 69.58%, and the effect is ranked third among all detection methods. The crosswalk segmentation detection IoU is 84.88%, and the detection result is the best among the other four comparison methods except the method in this paper. The stop line segmentation detection IoU is 77.62%, and the lane line semantic segmentation detection IoU is 77.39%, which is the best performance among the detection results of all the compared methods. The final average intersection and merger ratio MIoU for multiple categories was 73.49%.
3.3. Impact Analysis of Split Module Ablation and Lane Line Example Detection
In this experiment, the methods of pyramid feature fusion module, weight-guided pyramid-based feature fusion module, and segmentation-guided matrix-based feature enhancement module are used for the ablation comparison test on the ApolloScape-Precise dataset. In order to more accurately validate the performance of the model traffic marking segmentation detection, this section performs pixel-level detection of 37 classes of traffic markings, including backgrounds, as well as analyzes the impact of different types of structured traffic marking segmentation detection branches on lane line instance detection. The results of the ablation experiments are shown in
Table 1.
Table 2 shows the results of the ablation experiments of each module in this paper. All the experiments in the table use ResNet-18 as the backbone network of the model to extract features, and all of them include the lane line perfect attribute detection task; the difference lies in the change in the structure of the segmentation and detection branch of the multi-traffic marking. In Experiment 1, only the basic pyramid feature fusion structure is used to design the segmentation detection branch. In Experiment 2, a weight-guided pyramid feature fusion structure is added to calculate the corresponding weight coefficients based on the feature matrices output from the different structural layers of the backbone network so that the model takes into account the differences in the degree of importance of the different feature matrices when fusing the feature matrices; And in Experiment 3-2, the feature enhancement module, which is improved based on the characteristics of the image segmentation, is added to the model. The feature enhancement module is added in Experiment 3-2, which is improved according to the image segmentation characteristics, and the feature intensity of the foreground region of the traffic marking is enhanced in a top-down manner to improve the detection performance; Experiment 3-1, based on Experiment 3-2, only removes the operation of multiplying the segmentation bootstrap matrix with the feature matrix, and retains the feature diffusion module as a comparison of Experiment 3-2.
In Experiment 1, the image segmentation evaluation index PA reached 96.49%, the corresponding MPA was 64.11%, and MIoU was 60.35% due to the large difference in the distribution of the number of traffic markings in different categories. In Experiment 2, PA reached 96.58%, corresponding to an MPA of 64.18% and an MIoU of 60.42%, demonstrating the effectiveness of the weight-based feature fusion module in the traffic marking segmentation task. In Experiment 3-2, the PA reached 96.61%, corresponding to an MPA of 65.54% and an MIoU of 61.44%. Experiment 3-1 is a control test of Experiment 3-2, which retains the feature enhancement module and only cancels the operation of multiplying the segmentation bootstrap matrix with the original feature matrix in order to verify the validity of the segmentation bootstrap matrix. The cancellation of the bootstrap matrix results in a PA of 96.66%, corresponding to an MPA of 64.65%, which is a drop of 0.89%, and an MIoU of 60.64%, which is a drop of 0.8%, after the cancellation of the bootstrap matrix. The effectiveness of splitting the bootstrap matrix is proved.
Table 3 shows the supplementary results of the ablation experiments in this section, demonstrating the effect of structural changes in the traffic marking segmentation detection branch on the lane line completeness attribute detection results in the ablation experiments. The detection accuracy of lane line position information is maintained at about 87%, the accuracy of color fine-grained attribute detection is above 90%, the accuracy of single and double line fine-grained attribute detection is above 93%, and the accuracy of dashed and solid line fine-grained attribute detection is about 94%. From the results in the table, it can be seen that different structures of traffic marking segmentation detection branches have only a slight effect on the lane line completeness attribute detection part.
3.4. Multi-Branch Structural Ablation Experiments and Overall Analysis
In this experiment, we choose to use the ApolloScape-Large dataset as the training base to detect the interactions between different branches of the multi-branch network structure and the overall performance. To further analyze the influence between the lane line instance detection branch and the road traffic marking segmentation detection branch, as well as the overall performance of the multi-branch traffic marking network structure. The experimental results are shown in
Table 4.
In
Table 4, Experiment 1 is the network model after shielding the segmentation detection branch of this paper’s multi-branch network structure, which is actually the lane line fine-grained attribute detection model experiment; Experiment 2 is the network model after shielding the lane line position information and fine-grained attribute information detection branch of this paper’s multi-branch network structure; Experiment 3 is the complete multi-branch network model of this paper; Among them, Experiment 1, Experiment 2, and Experiment 3 are all based on the ResNet- 18 as the backbone network. It can be seen that the evaluation index
F1 of lane line location information detection in Experiment 1 is 0.32% higher than that in Experiment 3, and the accuracy of fine-grained attribute information detection in Experiment 1 is comparable to that in Experiment 3, i.e., road traffic marking segmentation detection branching only has a slight effect on lane line instance detection; The MIoU of road traffic marking segmentation detection in Experiment 2 is 2.76% higher than that in Experiment 3,i.e., the detection of the complete information of lane line instance has some influence on the road traffic marking segmentation detection branch, which makes the segmentation detection accuracy decrease.
In Experiment 3, the evaluation index F1 of lane line location information of the overall structure of the multi-branch network reached 96.32%. The accuracies of fine-grained attribute detection of the three attribute types were 97.00%, 97.87%, and 98.13%, with an average accuracy of 97.67%. Moreover, the evaluation index of traffic marking segmentation detection, MIoU, was 70.15%, which sufficiently proves the accuracy and effectiveness of this paper’s multi-branch integrated accuracy and effectiveness of the traffic marking detection method in this paper.
3.5. Visualization and Analysis of Test Results
The multi-branch network structure in this paper firstly determines the drivable area of the vehicle through the lane line instance detection branch, then matches the fine-grained attribute detection results of the lane line with it to construct a perfect lane environment. Finally, it uses the segmentation detection results of the road traffic marking to give different regional right-of-way and warning information about the lane environment. From the detection results in
Figure 10, it can be seen that when passing through special areas such as intersections, lane line instances and their fine-grained attribute distributions, as well as a variety of warning and indication marking information, can be accurately detected to achieve perfect road traffic marking environment detection.
3.6. Visualization and Analysis of Test Results
This paper first analyzes the necessity of using image segmentation to detect multiple types of traffic markings. Secondly, it constructs a traffic marking segmentation detection network based on the feature pyramid structure and calculates the weight coefficients of different feature matrices during feature fusion through the attention module to improve the segmentation performance of the model. Meanwhile, for the special characteristics of the image segmentation detection task, the guidance matrix attention method of literature [
25] is modified to enhance the model’s traffic marking detection ability in complex environments through the global information of the guidance matrix. Finally, combining the lane line instance detection method and lane line fine-grained attribute detection method in literature [
25] to construct a comprehensive traffic marking detection model, the effectiveness of this paper’s method is proved by the traffic marking dataset constructed in
Section 3.1.1 of this paper with more complete labeling information.


