1. Introduction
This paper provides the details of an off-site visit to a motor vehicle development and proving ground to provide greater industrial, real-world experience [
1] of vehicle development and testing, providing the necessary industrial relevance [
2] to a third-year undergraduate acoustics module, “Noise Control”. This is an introduction to acoustics, free-field propagation, reverberant fields, reflection coefficients, active noise control, and environmental noise pollution. It provides initial visibility to noise, vibration, and harshness (NVH) work and highlights the difference between complex testing and visibility of the acoustic importance of future electric vehicle fleets.
The test is a pass-by-noise experiment, in which a passenger car vehicle, usually fitted with a large internal combustion engine, is driven under controlled conditions on a test track. This allows for the measurement of the externally generated noise from the engine, tyres, turbocharger, electric motor, turbocharger and unsteady aerodynamics [
3]. A vehicle that exceeds the specified legislative sound pressure level cannot be sold as type approval without rework and modification [
4], while a vehicle that generates less than or equal to the limit meets the requirement to be sold. The ISO-362 pass-by-noise test is one of the few tests a vehicle must comply with to be sold [
5], and therefore, this experience is important for automotive students. The test has been refined for realising real-world driving for internal combustion (IC) engines, and therefore, for electric vehicles, it is more complex than needed.
This paper concentrates on the novel implementation of an ISO-362 pass-by-noise automotive test and tyre noise test but critically explores the simplifications to both the ISO standards and preparation time on the vehicles to instruct multiple small groups of undergraduates in a time-limited environment using an authentic assessment design. The execution of a test plan in such a time-constrained period allows us to highlight many critical acoustics learning objectives, especially for the electric vehicle design. The implementation of the test equipment with a visible breakdown in component connection and communication of vehicle design details is highly novel, and thus, the communication and propagation of these ideas are essential. The equipment design allows for real-world testing without large financial outlays.
Most of the existing literature is from academic and industry experts, with few papers specifically aimed at training the next generation of acoustic engineers for electric vehicles. Recognising the evolution of the test designed for combustion engines is essential.
This paper contains a background of industrial testing in
Section 2.1 and lists equipment specifically designed to replicate the industry standard equipment and, critically, open the closed-box approach to digital connections and data transfer to allow for the visibility of each substage in a systems environment (
Section 2.5). Students in groups of three are afforded four weeks to prepare and read the documentation and then 30 min of discussion while looking at the vehicle to understand and feel the changes engineers make to the vehicle per NVH criteria (
Section 3.2). Sixty minutes of track time are provided for vehicle acoustic testing, including replicating a simplified ISO-362 standard.
This paper introduces the ISO-362 vehicle test standard that is useful for general knowledge, and as such, provides benchmark results taken from testing in less-than-ideal conditions (
Section 3.3). This is a key source of error, and limitations of the testing environment are discussed (see
Section 3.4) in the context of a university assessment. The treatment of external noise reflects pollution in society and urban settings, rather than the implications to internal cabin passengers, which were covered by Horváth [
6], and examines the narrow-band PMSM frequencies and implications of a lack of masking noise. Similar narrow-band radiated noise for internal cabin disturbance is predicted by Van Herbruggen [
7].
The equipment is a mixture of industrial standards and low-cost components with which students are familiar. Arduino Uno boards are used to run the data acquisition and telemetry software, and XBee radios are used for communication in real time between the track and car (
Section 2.5.4), with eye-safe laser light gates being used to determine trigger points for the vehicle inside the test area (
Section 2.5.3). It is rare to have visibility of the Controller Area Network bus (CANBUS) communication outside of a vehicle, particularly inside a university environment, so a vehicle data logger connects to the vehicle Electronic Control Unit (ECU) and logs Global Positioning System (GPS) data, which is not a precise measurement of location (
Section 2.4).
2. Automotive Pass-by-Noise Standards and Experimental Design
The measurement of external noise from vehicles has been governed by ISO-362 methodology, with various levels of complexity. In 2008, the test specification was straightforward [
8], but to reflect more real-world driving, it has been adjusted to depend on power-to-mass in particular gears [
5,
9], as well as to partially mitigate against vehicle bypass designs (exhaust valves at specific revolutions per minute (RPMs), ECU recognition of test procedure), most of which are no longer relevant for electric vehicles.
In previous years, the pass-by-noise limit for passenger cars was 74 dB (A), unless the vehicle met certain exceptions, such as low-volume manufacture in the case of high-performance sports vehicles or high-pressure diesel injection, amongst others, for which the limit was 75 dB (A). Between 2016 and 2022, the noise limits have been far more complex, depending on power-to-mass limits, with branches reducing to a range of 70–73 dB (A). These complex branches will be maintained for the proposed further reduction to between 68 and 72 dB (A) from 2026 [
4], reflecting the move from internal combustion to electric powertrain. A choice is therefore made to focus on the simpler legislation from before 2016 (these are the cars normally tested for university students) [
8], which focus on the sound levels and acoustics learning rather than more nuanced “power-to-mass” measurements in different gears [
5,
9].
Close proximity trailers (CPX) [
10] provide an alternative method for measuring tyre noise only; however, from a learning perspective, the equipment is located on the outside of the moving vehicle, and thus, no direct engagement is made with components. On the contrary, the ISO-362 pass-by-noise allows students to manipulate sound pressure meters, but more importantly, it allows them to hear the vehicle as it passes. This allows for listening to high-frequency and narrow-band EV motors, turbocharger spooling up, valves in the exhausts actuating or accelerating, and lifting off the throttle at the required line.
2.1. ISO-362 Standard for Pass-by-Noise
In groups of three students, two for trackside sound pressure measurements and one as the in-vehicle coordinator (linked via two-way digital radios), the equipment is set up on the track. A cursory discussion of the vehicle is undertaken, and then static measurements are taken. This is the first opportunity to evaluate the sound pressure meters to determine what user-driven events cause what A-weighted sound pressure level over what duration.
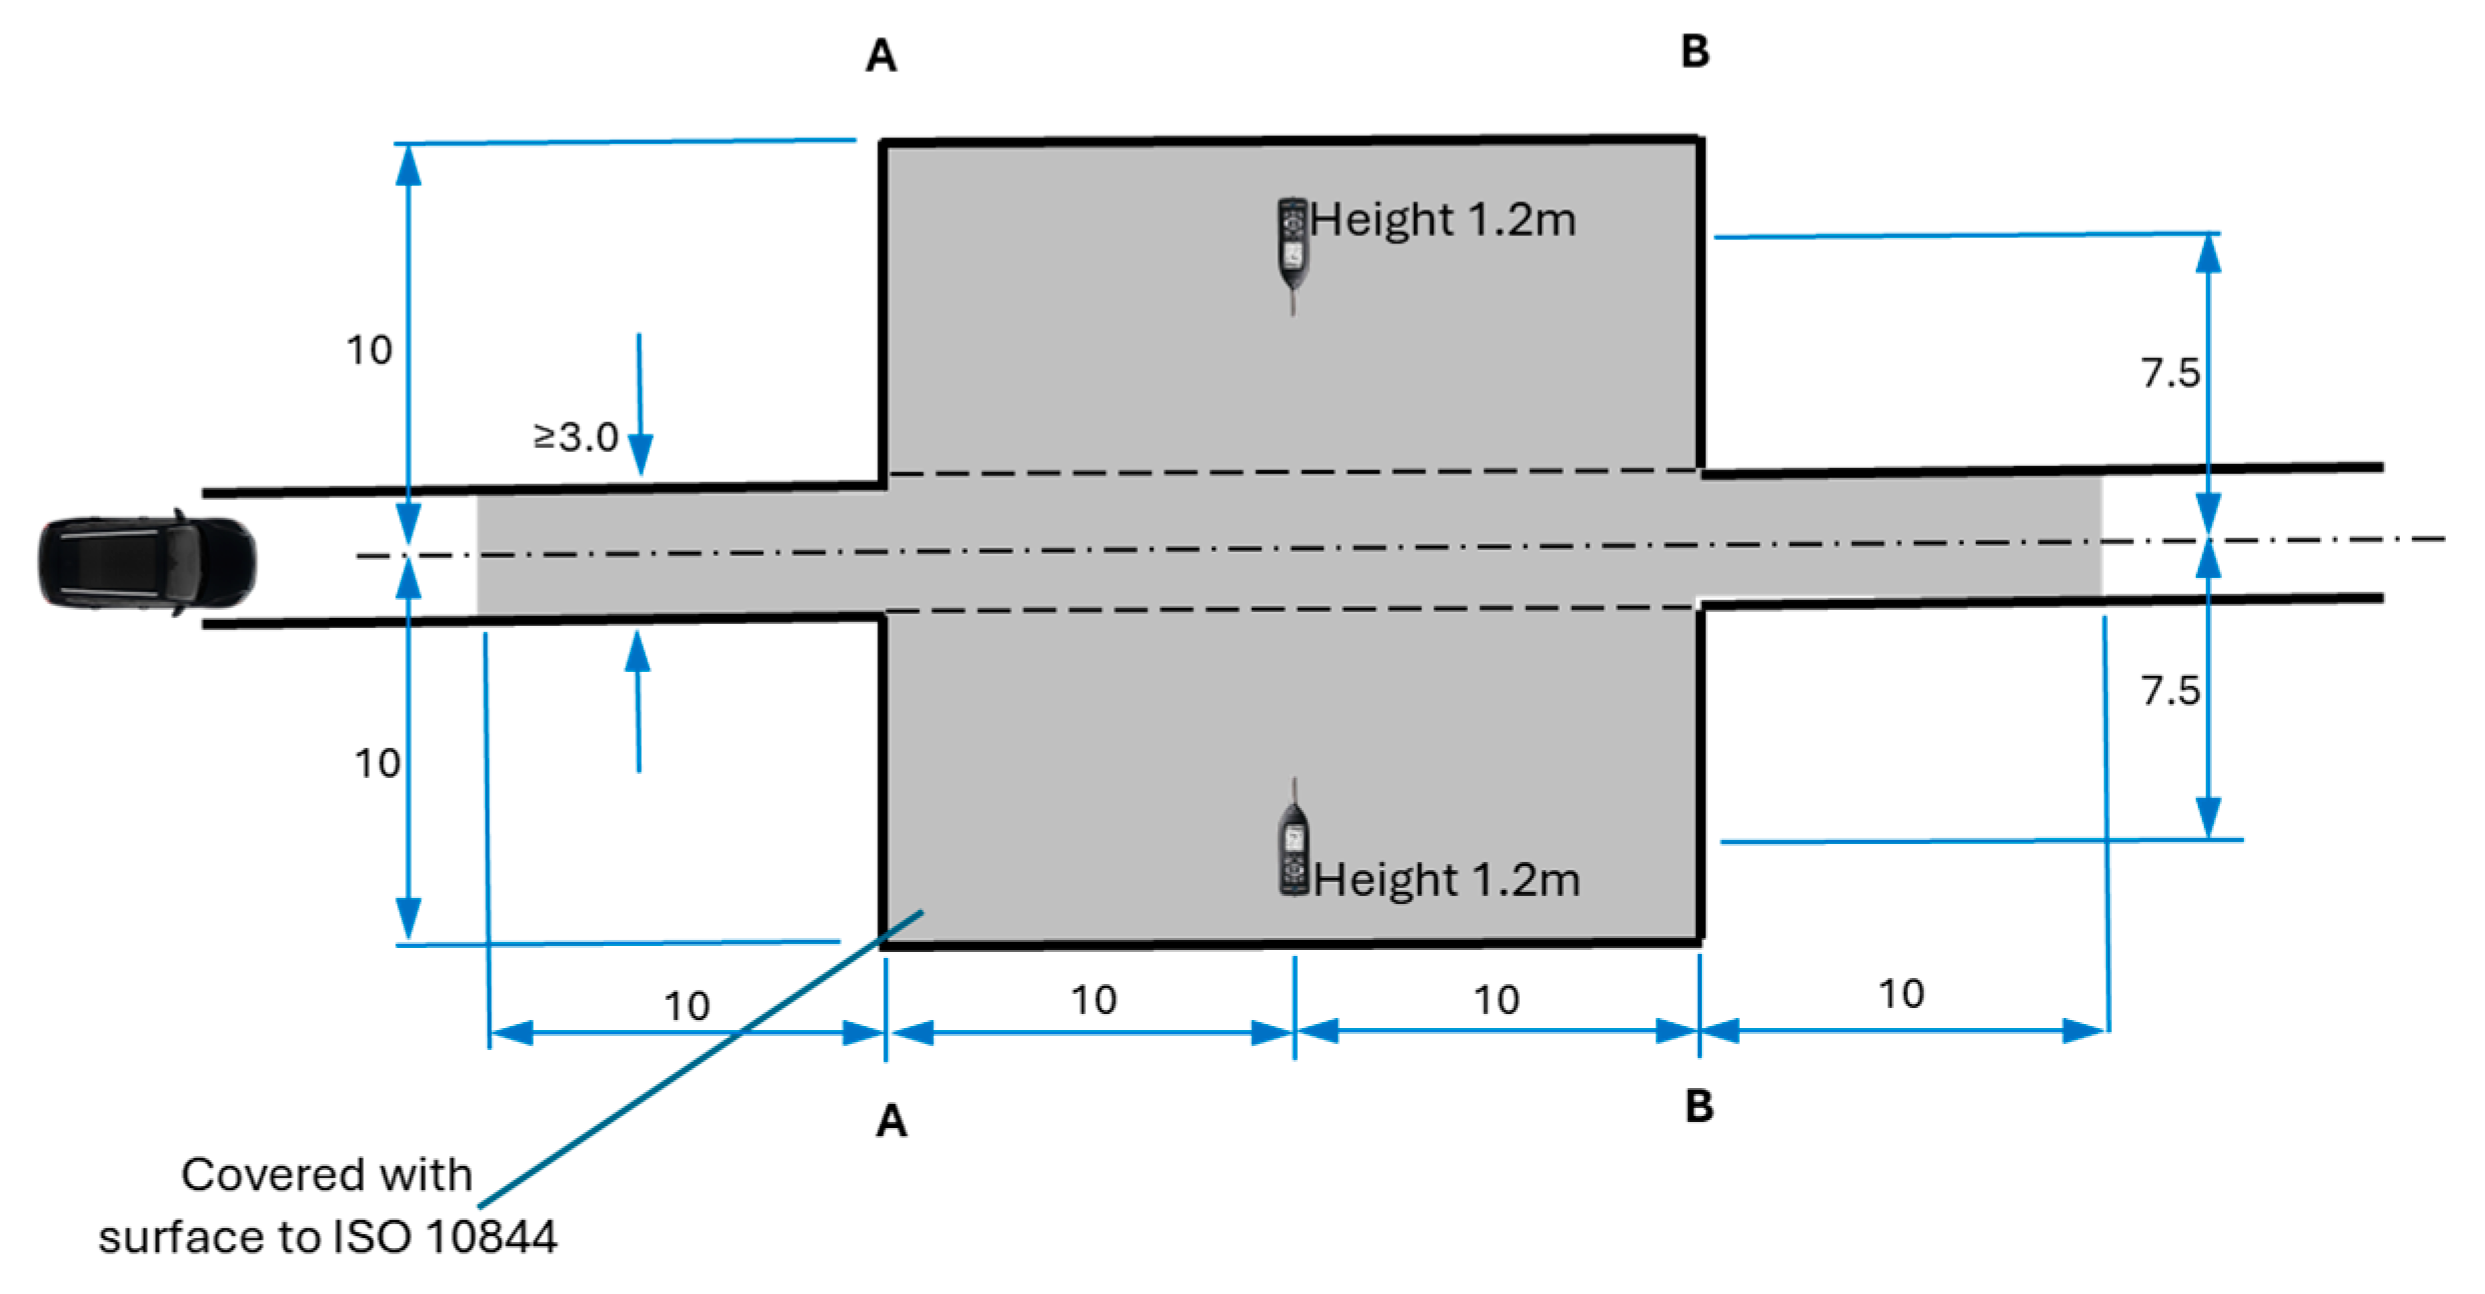
The test zone is shown in
Figure 1, in which two microphones are set up on tripods 1.2 m high and spaced 7.5 m from the centreline of the track. The vehicle drives along the centreline, passing line AA and exiting at line BB, although the track is bi-directional. The surface is specified to in as ISO-10844 [
11], which is smoother than hot rolled asphalt and holds water longer.
For the test plan used in this teaching exercise, the following events take place:
The vehicle approaches the test zone at a constant speed of 50 km/h.
It accelerates with a wide-open throttle when the vehicle front reaches AA.
On reaching BB, the throttle is not applied.
This is conducted in second gear, causing the engine to roar and the RPM to increase. The exhaust generates noise, and the turbocharger will start to spool up with a characteristic whine. The tyres will be heard to generate stick–slip noise; depending on the weather, the broadband water droplet noise will be audible.
Steps 1 and 3 are repeated four times, and the peak A-weighted sound pressure level is recorded.
The exercise is repeated for the vehicle in third gear.
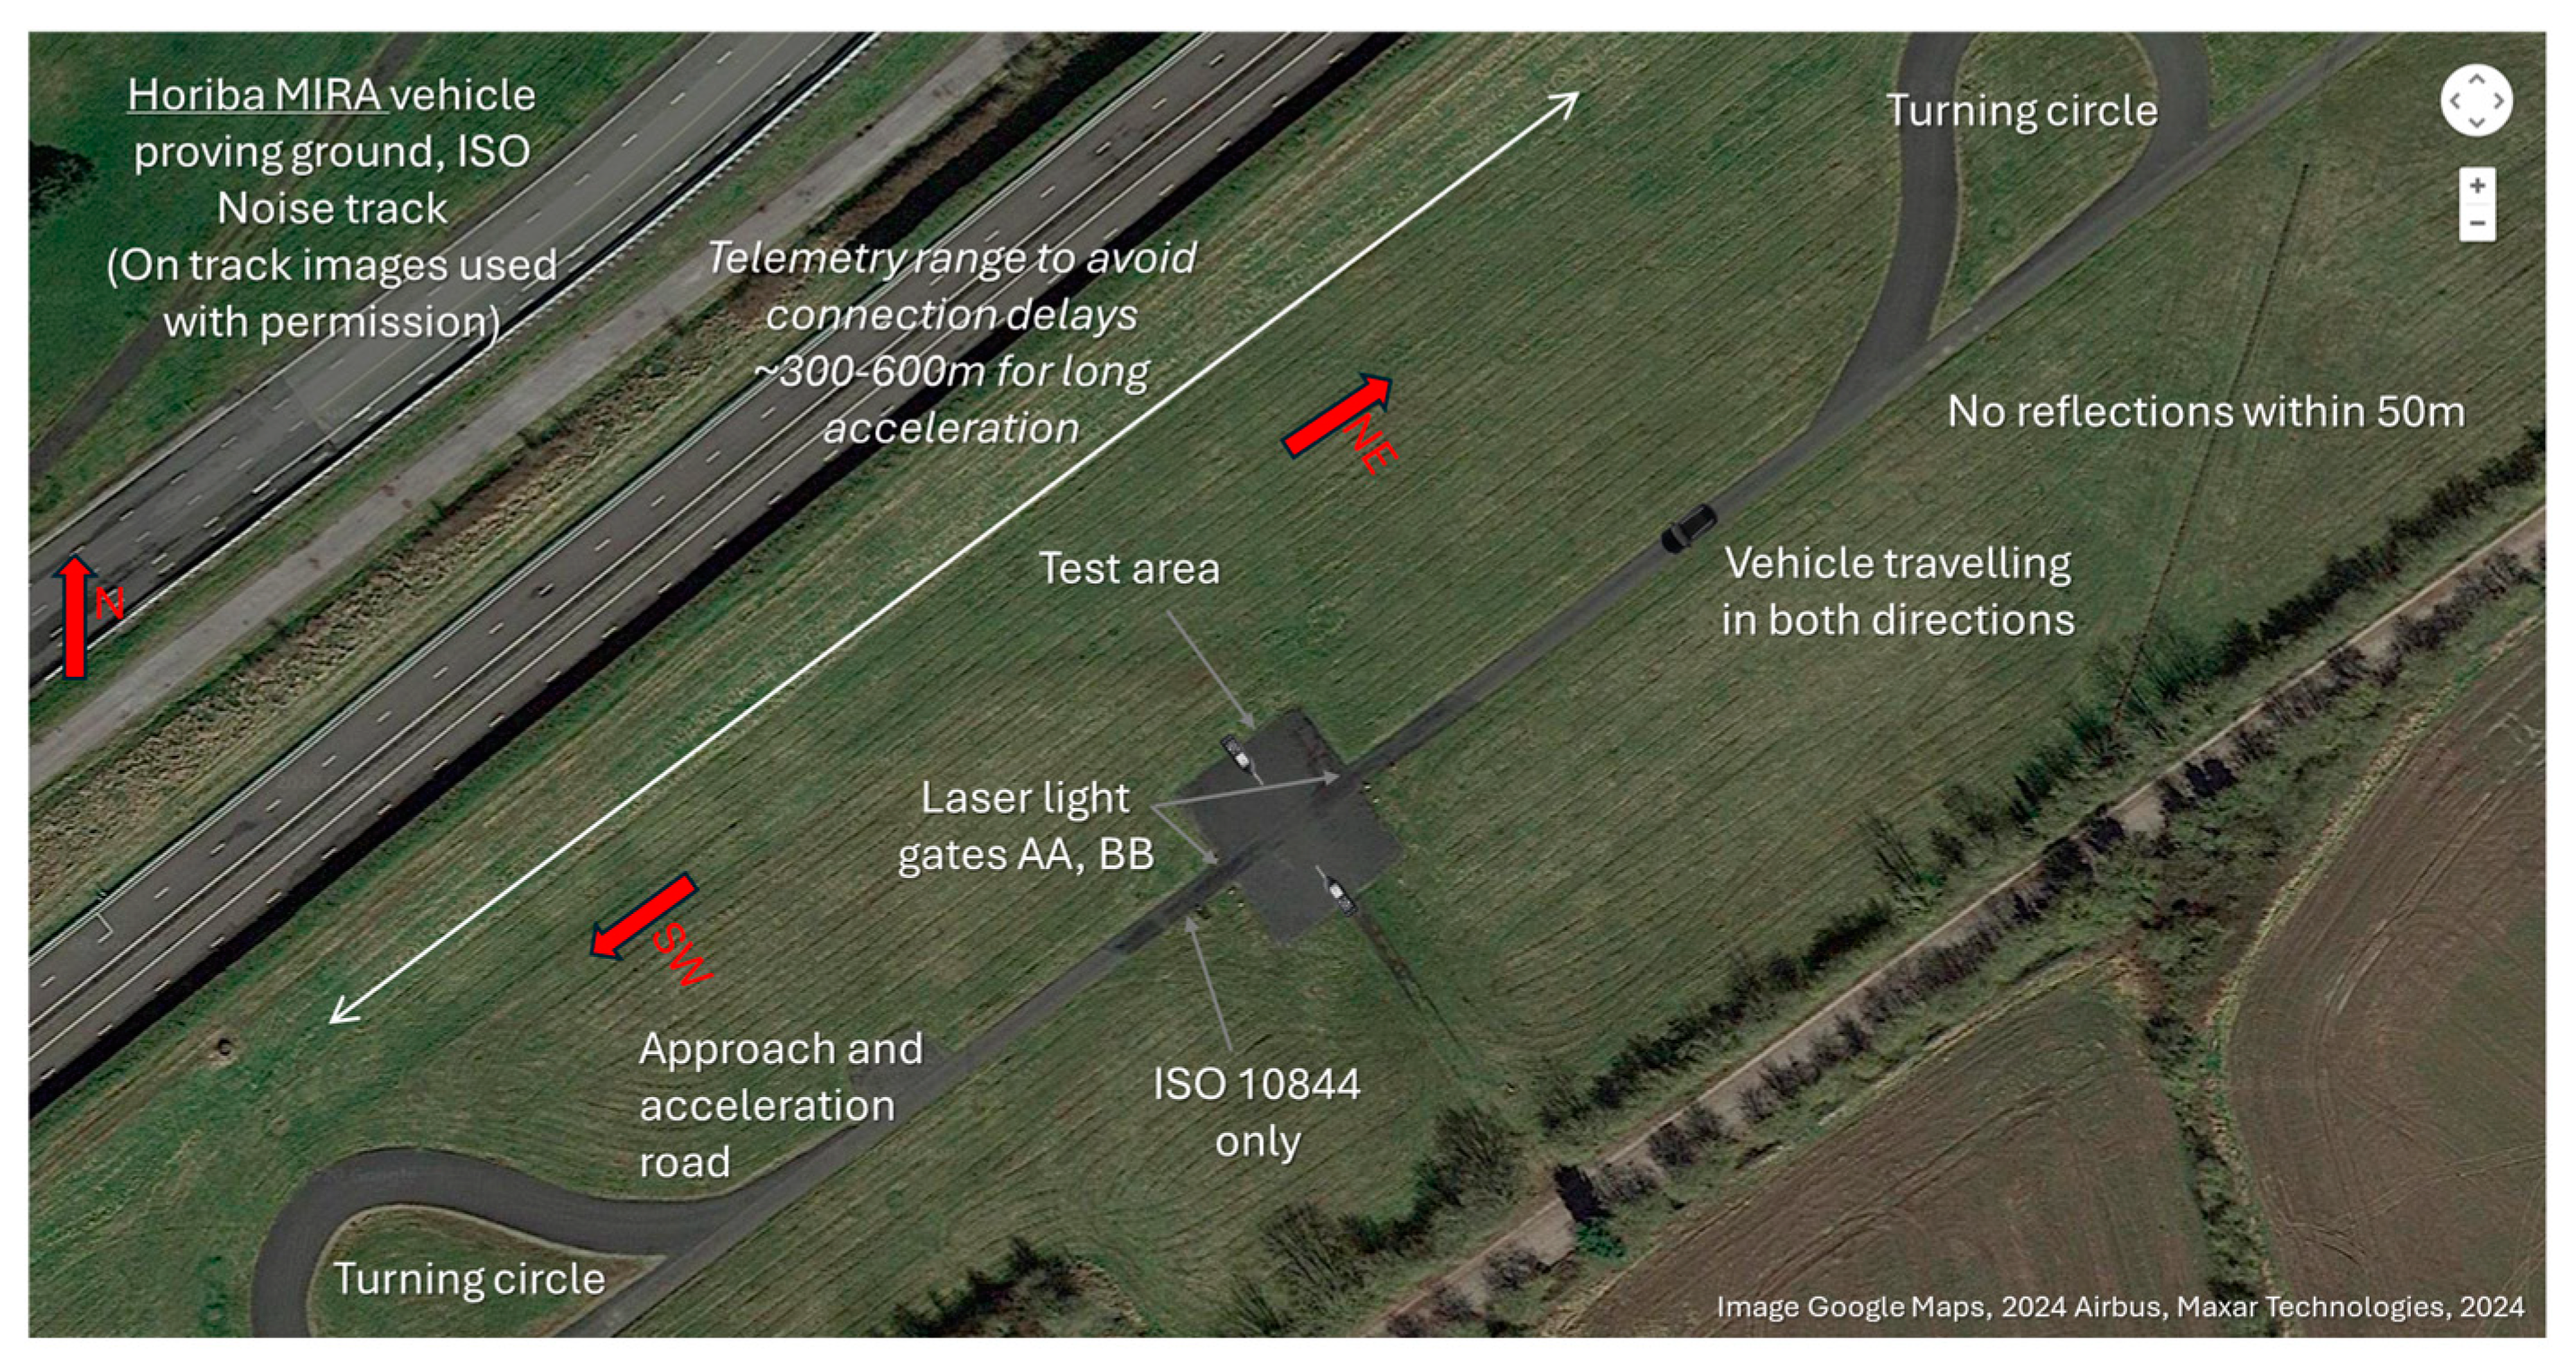
The wider test track setup is shown in
Figure 2 for the Horiba MIRA facility. Light gates are used to trigger the sound pressure recordings while the car is in the zone, as discussed in
Section 2.5.3. Critically, for the EV vehicle, the electric motor is audible, but most of the noise originates from the tyres and the stick–slip generation of monopole noise from the tread block impacts.
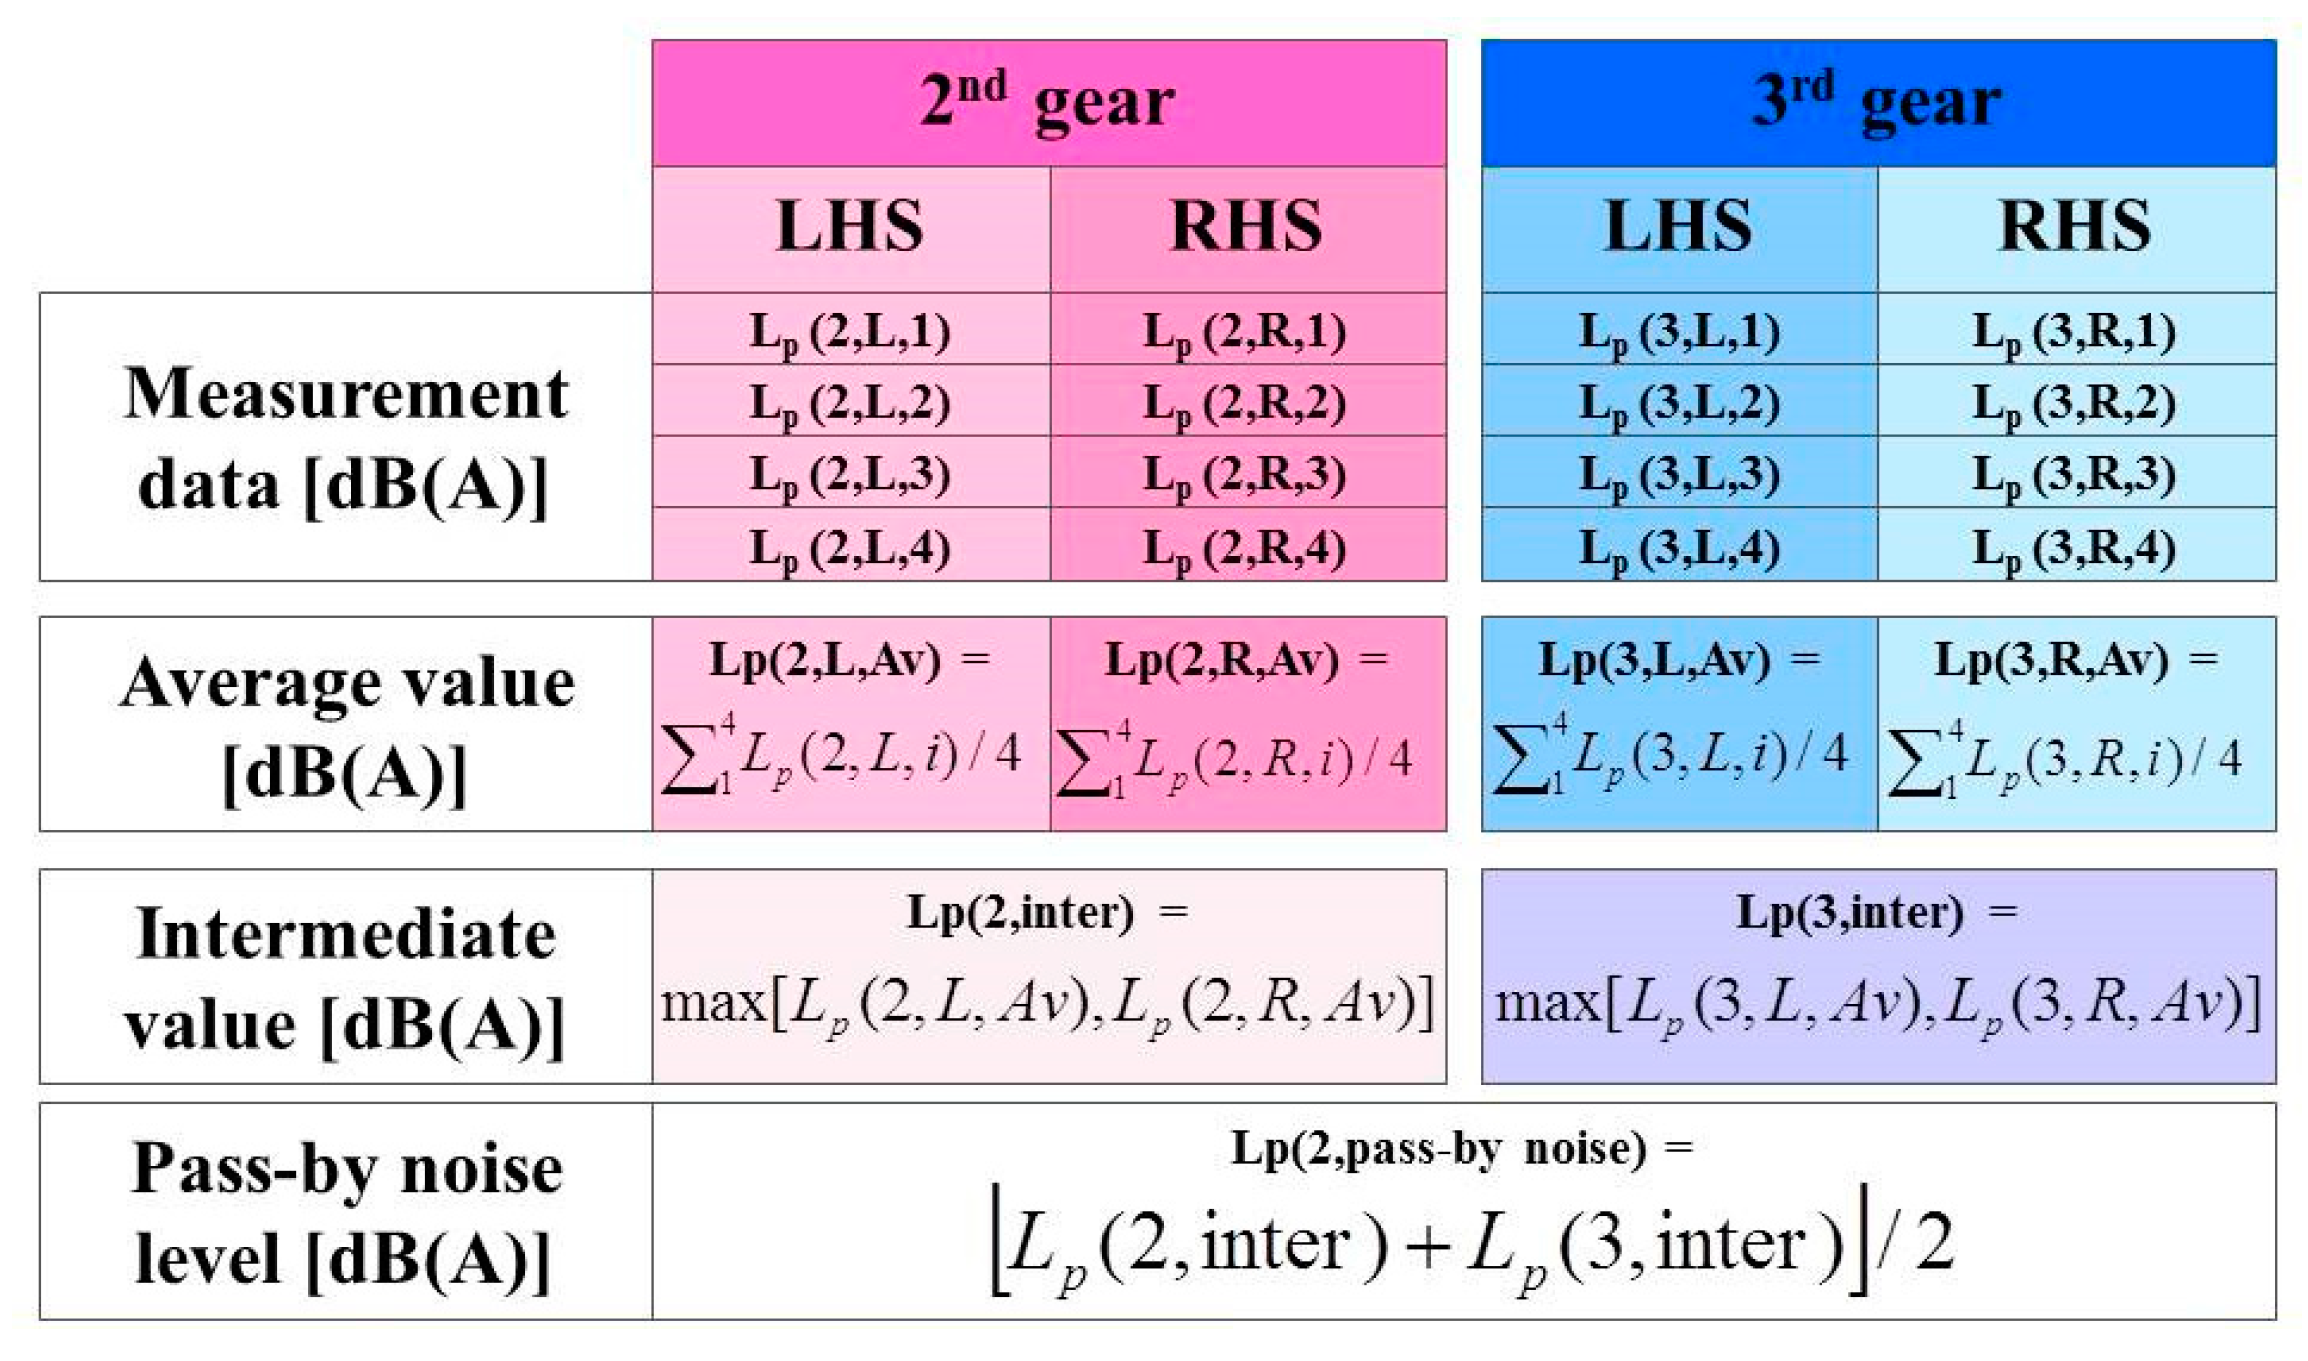
The calculation of pass-by-noise is shown in
Figure 3, which averages the second-gear and third-gear peak sound pressure levels
as mean levels, following recordings of the left-hand side (LHS) and right-hand side (RHS) of the vehicle.
2.2. Variation of Tyre-Radiated Noise with Speed
The ISO-362 test accentuates traditional powertrain noise, which is important when the IC engine dominates the statistics, but recognising that wide open throttle driving is a rare occurrence, the test procedure has been updated in a more complex fashion (thus, the more modern is less suitable for undergraduate learning) for real-world experience driving. This also aided legislators in avoiding vehicles that were particularly noisy at most RPMs but had a minimal exhaust noise at the RPM tested in second gear at 50 km/h, which is easily predicted, or via ECU manipulation when the vehicle recognises it is performing the ISO test procedure. The EV vehicle does not produce such exterior noises from the motors.
To demonstrate the importance of electric vehicle noise emissions, which dominate the A-weighting measurement and are largely the tyre-radiated noise for external noise pollution, tyre tests are also conducted. A further investigation is undertaken.
- 7.
The vehicle is driven at the appropriate constant speed through the test zone.
- 8.
Constant speeds of 30, 40, 50, 60, 70, 80, and 90 km/h are required.
- 9.
The peak A-weighted sound pressure level is recorded.
This allows the students to hear both engine-dominated noise and tyre-generated noise, which is composed of carcass vibrations and tread block impact frequencies. The horn amplification generates a radiation pattern that changes the frequency content as the car is driven past, and of course, the Doppler frequency shift will be observable.
At low RPM/idle, whether coasting through the test zone at a fixed speed or with the engine turned off, no difference will be observed. The tyre-radiated noise dominates, especially over 30 mph [
12], which is of particular concern for electric vehicle design.
2.3. Track and Environmental Limitations
The track surface can show variable environmental conditions, dry, damp, or wet, all of which are discussed in terms of repeatability for corrections to measurements. Manufacturers test in specific countries where the weather is highly predictable, and others have heated outdoor test tracks [
13], although wear on tracks after the first year of surface laying is recognised, and variations on ISO tracks of 3 dB (A) are reported.
The ISO standards require a wind speed lower than 5 m/s [
4,
5,
8,
9]; however, this is not possible to guarantee, so a learning outcome is whether the wind direction is shearing across the microphone surface (despite the use of windshields), causing broadband excitation. Corrections for temperature and water on the track, bubbles, and an increase in noise are discussed in
Section 3.3.
2.4. Vehicle Specific
The results in this paper relate to assessing a generic used high-pressure diesel engine (pass-by-noise limit of 75 dB (A), based on the simpler pre-2016 requirements (without complex “power-to-mass” measurements per gear)). While manufacturers would typically evaluate new prototype vehicles and part development, the educational perspective is enhanced by components with wear/post servicing and some variables to note when comparing to the ISO standards (tyre wear, fluid levels, cargo loading).
The vehicle results in this paper used a high-pressure diesel engine with a capacity of V6 2967 cc, type M1 approval, four-wheel drive, and a 2009 registration. The body shape is a sports utility vehicle, targeted at towing trailers. Although fitted with an automatic six-speed transmission, for learning reasons, the gearbox was manually selected to second and third gears to avoid the calculations with a power-to-mass ratio that would not complement the acoustics module learning outcomes (evaluated as a manual car). The kerb weight was 2332 kg, with a wheelbase of 4754 mm and a track of 1928 mm, fitted with dual exhausts.
The vehicle must be fitted with a data logger, GPS, and vehicle controller area network (CAN) communication to allow engineers to determine where on the track the peak sound pressure occurs, allowing insight into whether rework and modifications on the intake, exhaust, or radiator fans might be necessary.
While data logging could be performed entirely within an Arduino environment, breaking the closed box into system components allows students to see industrial test equipment and vehicle data loggers with CAN communication. These are a different protocol from, e.g., National Instruments cDaq chassis and cards. As such,
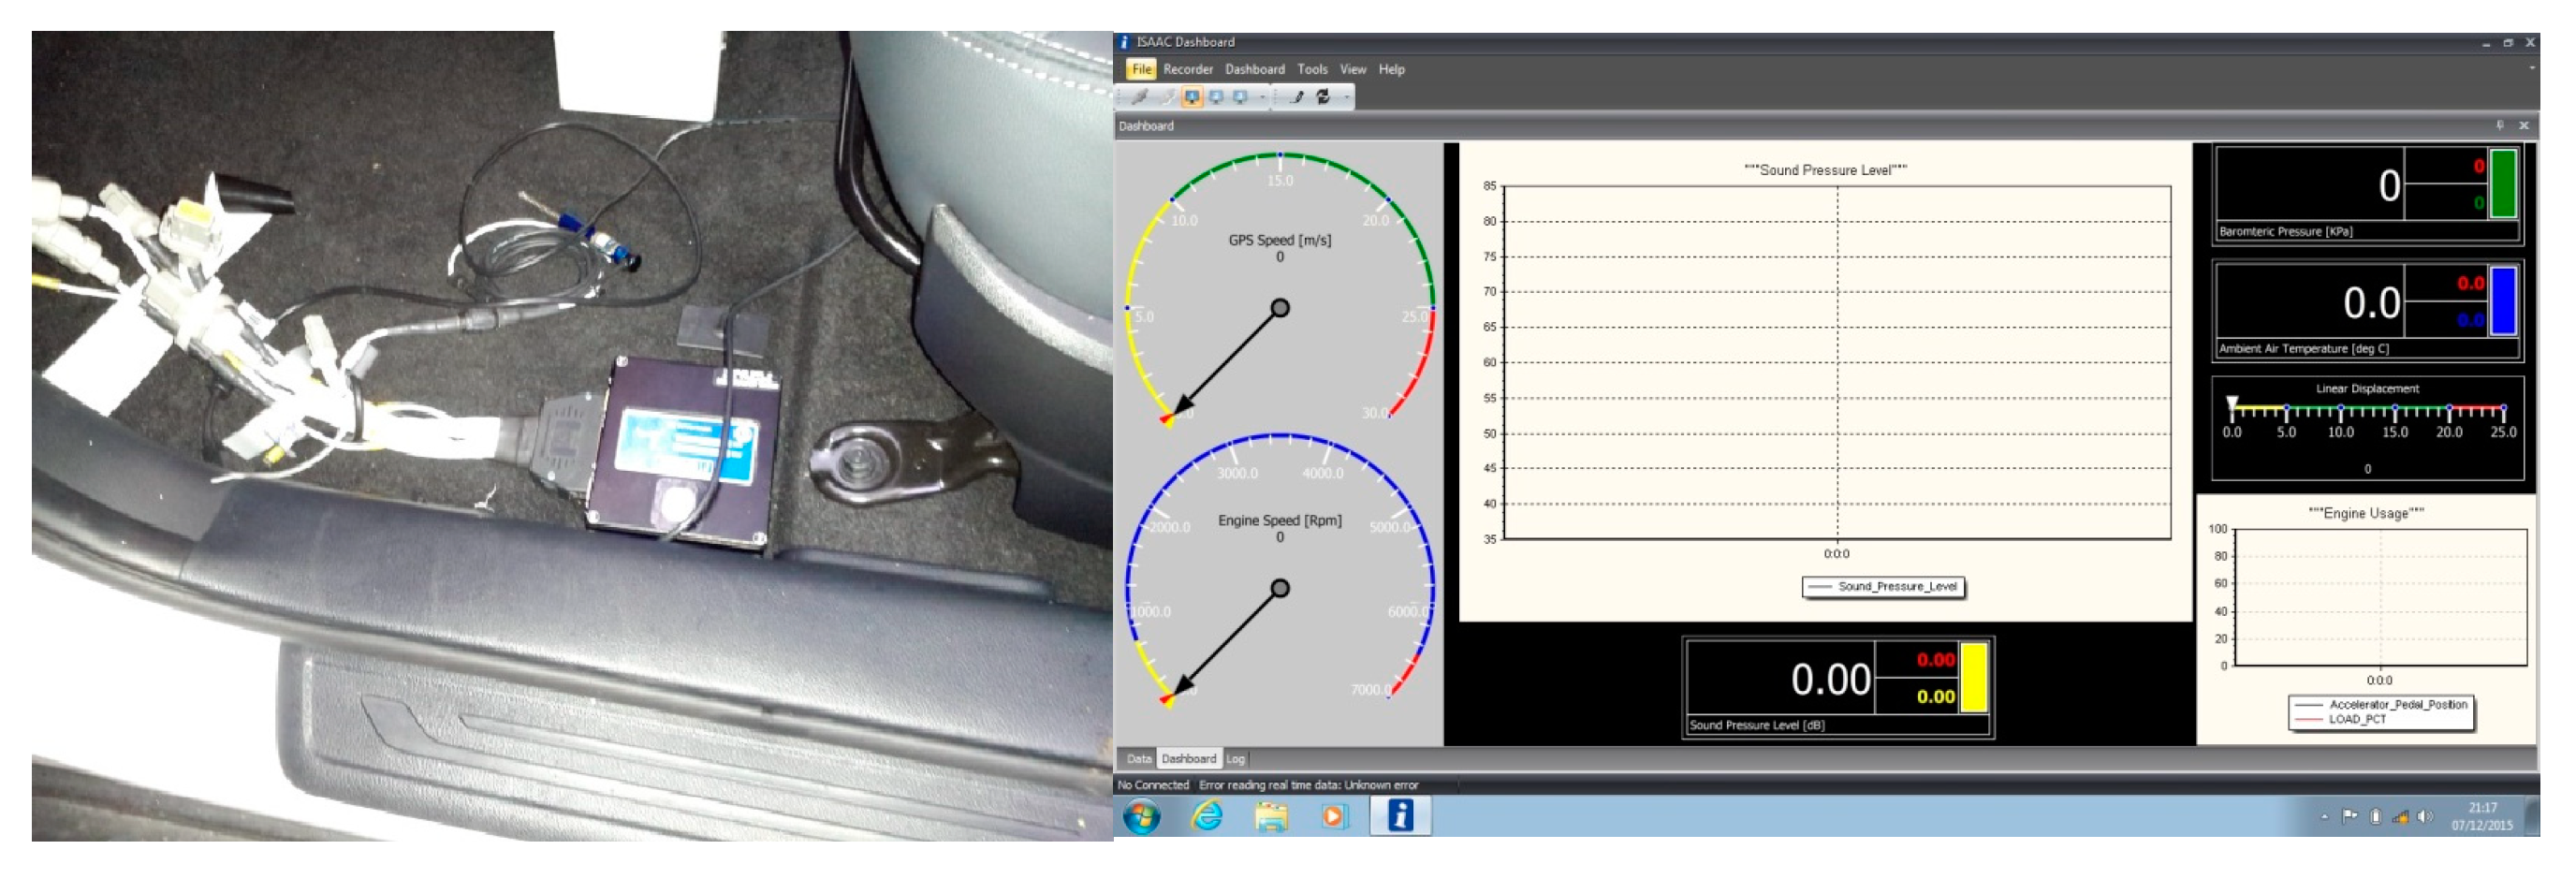
Figure 4 shows the vehicle datalogger (ISAAC DRU916) with multiple connections for power, GPS, and analogue inputs and a high-speed CAN connection.
Embedding learning through role emulation can be obtained by nominating a team leader in the vehicle, instructing the test driver, and monitoring their performance in real time with two-way communication via digital radio. Central to this is the telemetry capability proving trackside sound pressure measurements inside the car to verify performance and modulating the driver (the application of the throttle in comparison to whether the car has activated the laser light gate) to reduce driver variability in the measurements.
2.5. Noise Equipment and Telemetry
2.5.2. Sound Pressure Meters
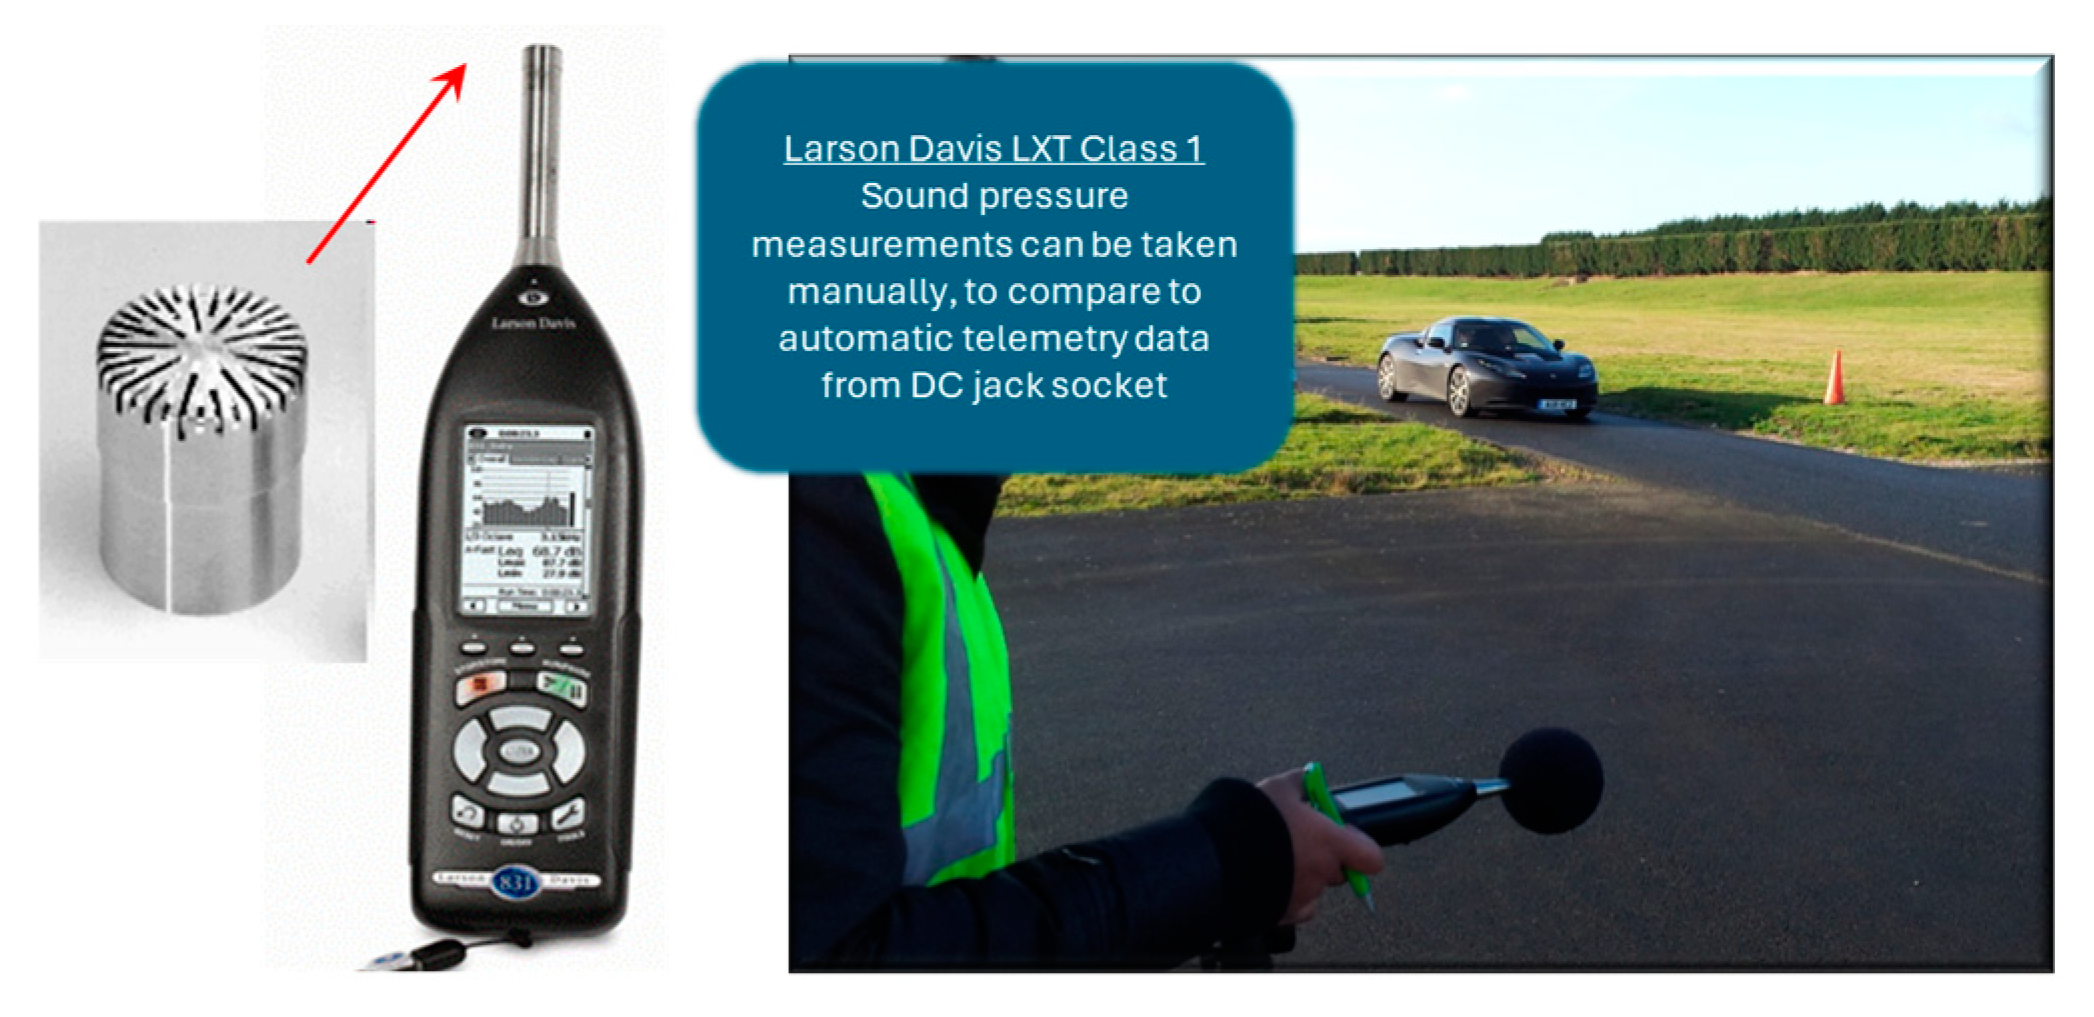
To measure the sound pressure level against time, a microphone is required; in this case, two options exist: a Larson Davis LxT class 1 sound pressure meter, as shown in
Figure 5, or a less expensive, generic, class 2 device. The difference between professional and consumer equipment is visible here in the accuracy and frequency range. Both are suitable, but class 1 is more accurate and has a wider frequency range. Both provide an output of equivalent sound pressure level
for a 0–5 V 2.5 mm DC jack with A-weighting and a fast integration time. The output voltage is 0–3 V linearly proportionate to 0–300 dB (A), assuming an output impedance of 3650 Ohms.
The handling and experience of taking acoustics measurements are central to the noise module, providing the experience of high-frequency acquisition, processing, and external noise pollution. Most noise problems internal to the vehicle occur below 600 Hz, relating to the body in white structure, whereas the external noise radiation occurs over a far wider frequency range.
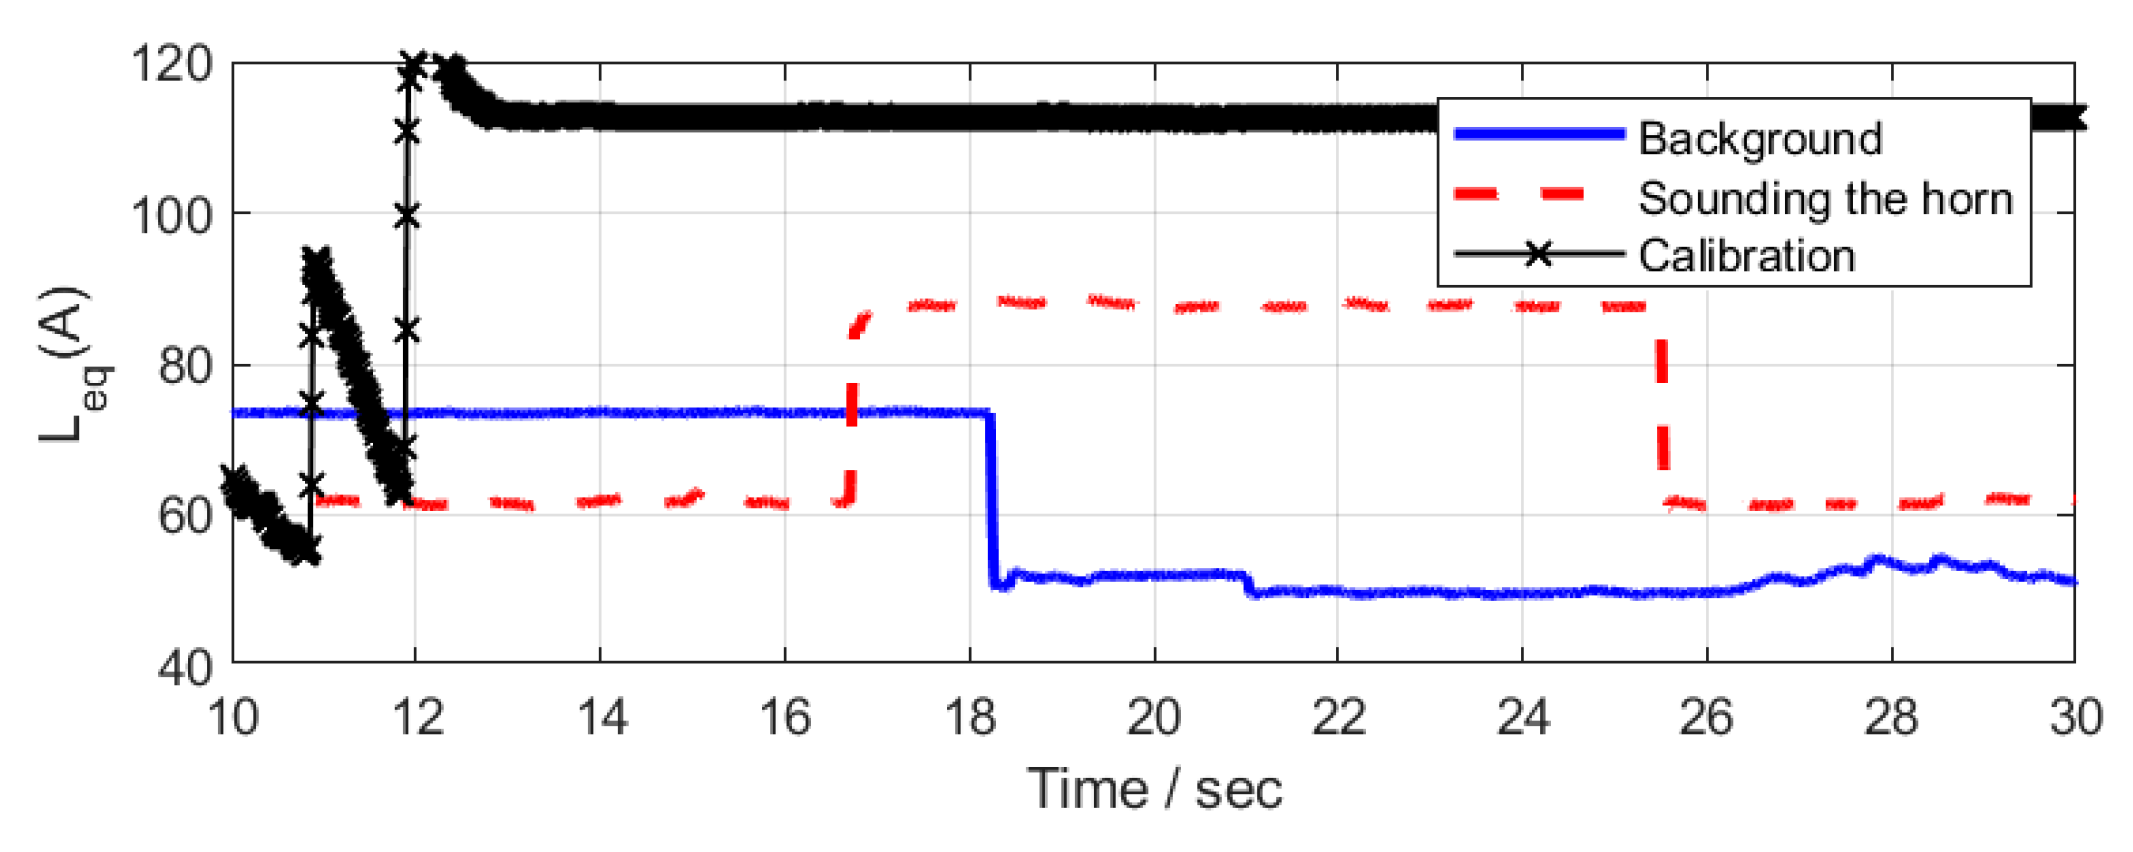
Calibration of the sound pressure meters takes place at the beginning and end of the test time using a GRAS pistonphone rated at 114 dB at 1 kHz. As this is an evanescent source, it is barely audible outside of the enclosure, despite the amplitude, which links to wave propagation theory. Mounting at the track is on standard tripods at a height of 1.2 m.
2.5.3. Laser Light Proximity Gates
The industrial equipment needs to include a measurement of whether the vehicle is inside the test zone bounded by lines AA and BB in
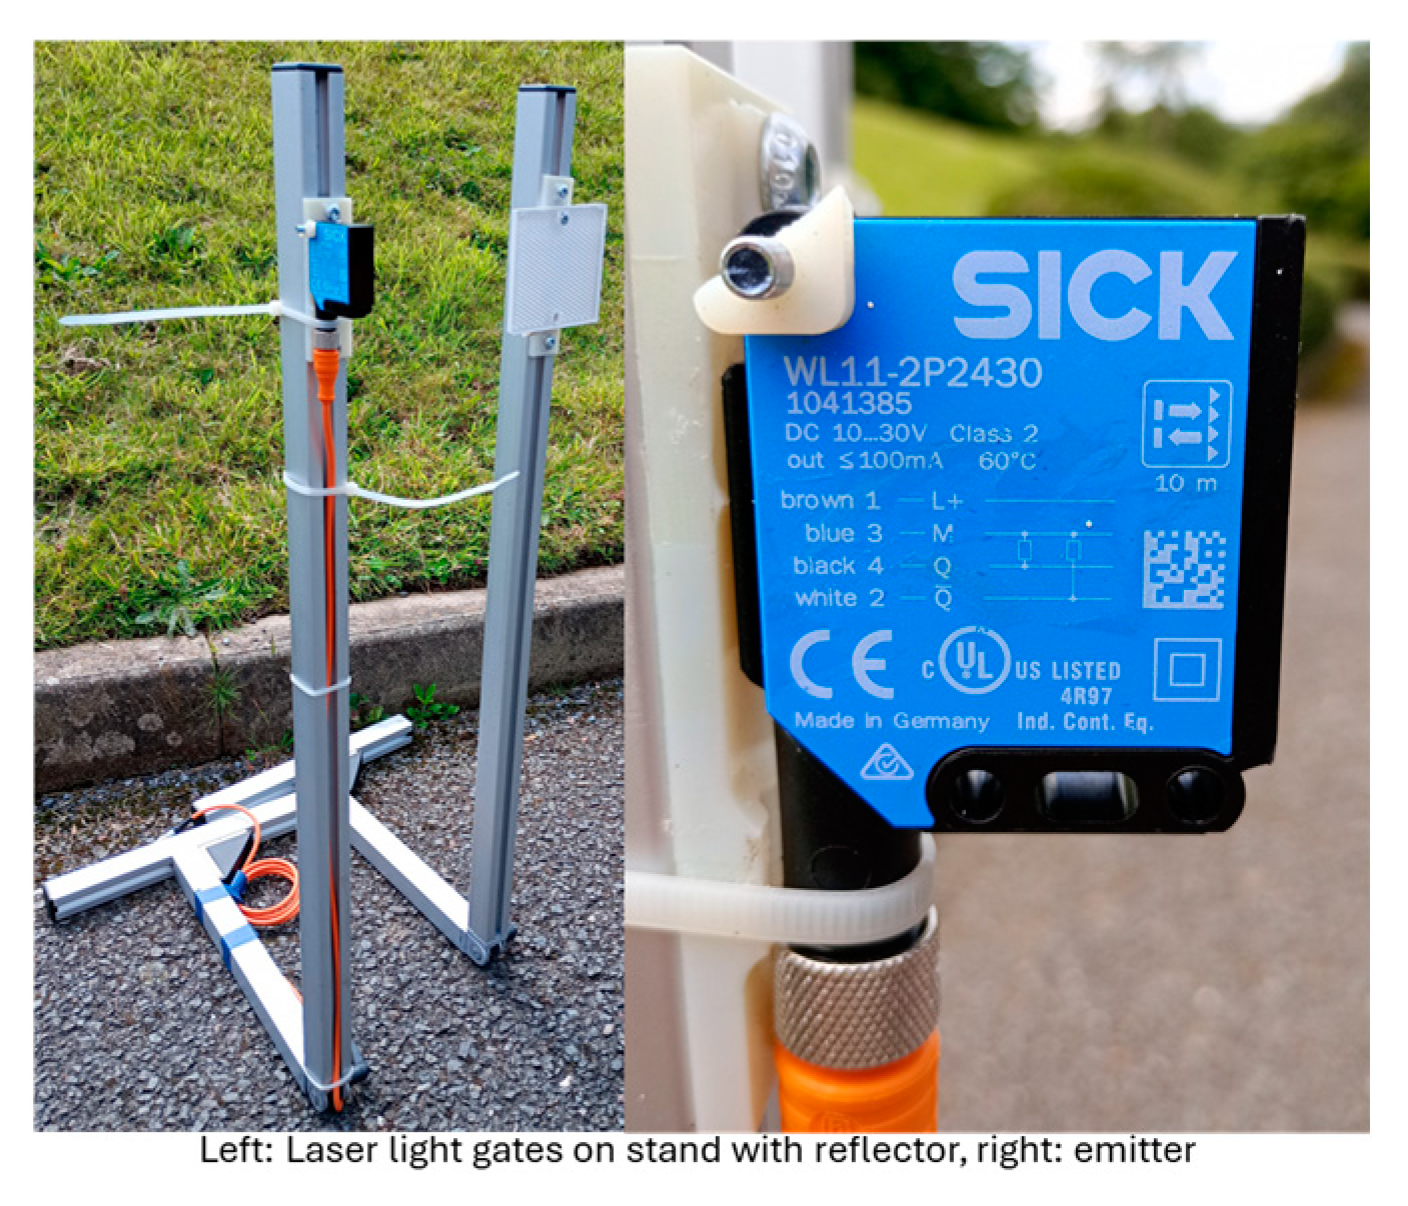
Figure 1, and a variety of methods can be employed, including mechanical and GPS-based. The resolution for GPS can be enhanced through real-time kinematic (RTK) corrections, although this tends to be expensive and requires constant mobile phone data communication from the fixed correction point. Instead, two sets of laser light gates are positioned across the track road at lines AA and BB at the height of the vehicle bumper. These are shown in
Figure 6, in which the class 2 laser (model Sick WL11–2 P2430) sends an LED light source across the track road, where a reflective surface sends the light back to be received by a photoelectric sensor. These are inexpensive, with built-in alignment lights, have a maximum distance for reliable measurement of eight metres, and provide a 5 V digital output for whether the light connects across the track. This can be compared either in post-processing with the acceleration pedal input or in real time via the in-car laptop display, providing a useful exercise for training the test driver.
2.5.4. Telemetry Architecture
The role of the telemetry architecture is to provide a digital engineering acquisition experience, in which the complex operating regime makes the traditional laboratory data transmission equipment non-feasible. This equipment is required to obtain the sound pressure level from the sound meter and, together with the light gate status, transmit that data to the vehicle at a rate of approximately 10 Hz.
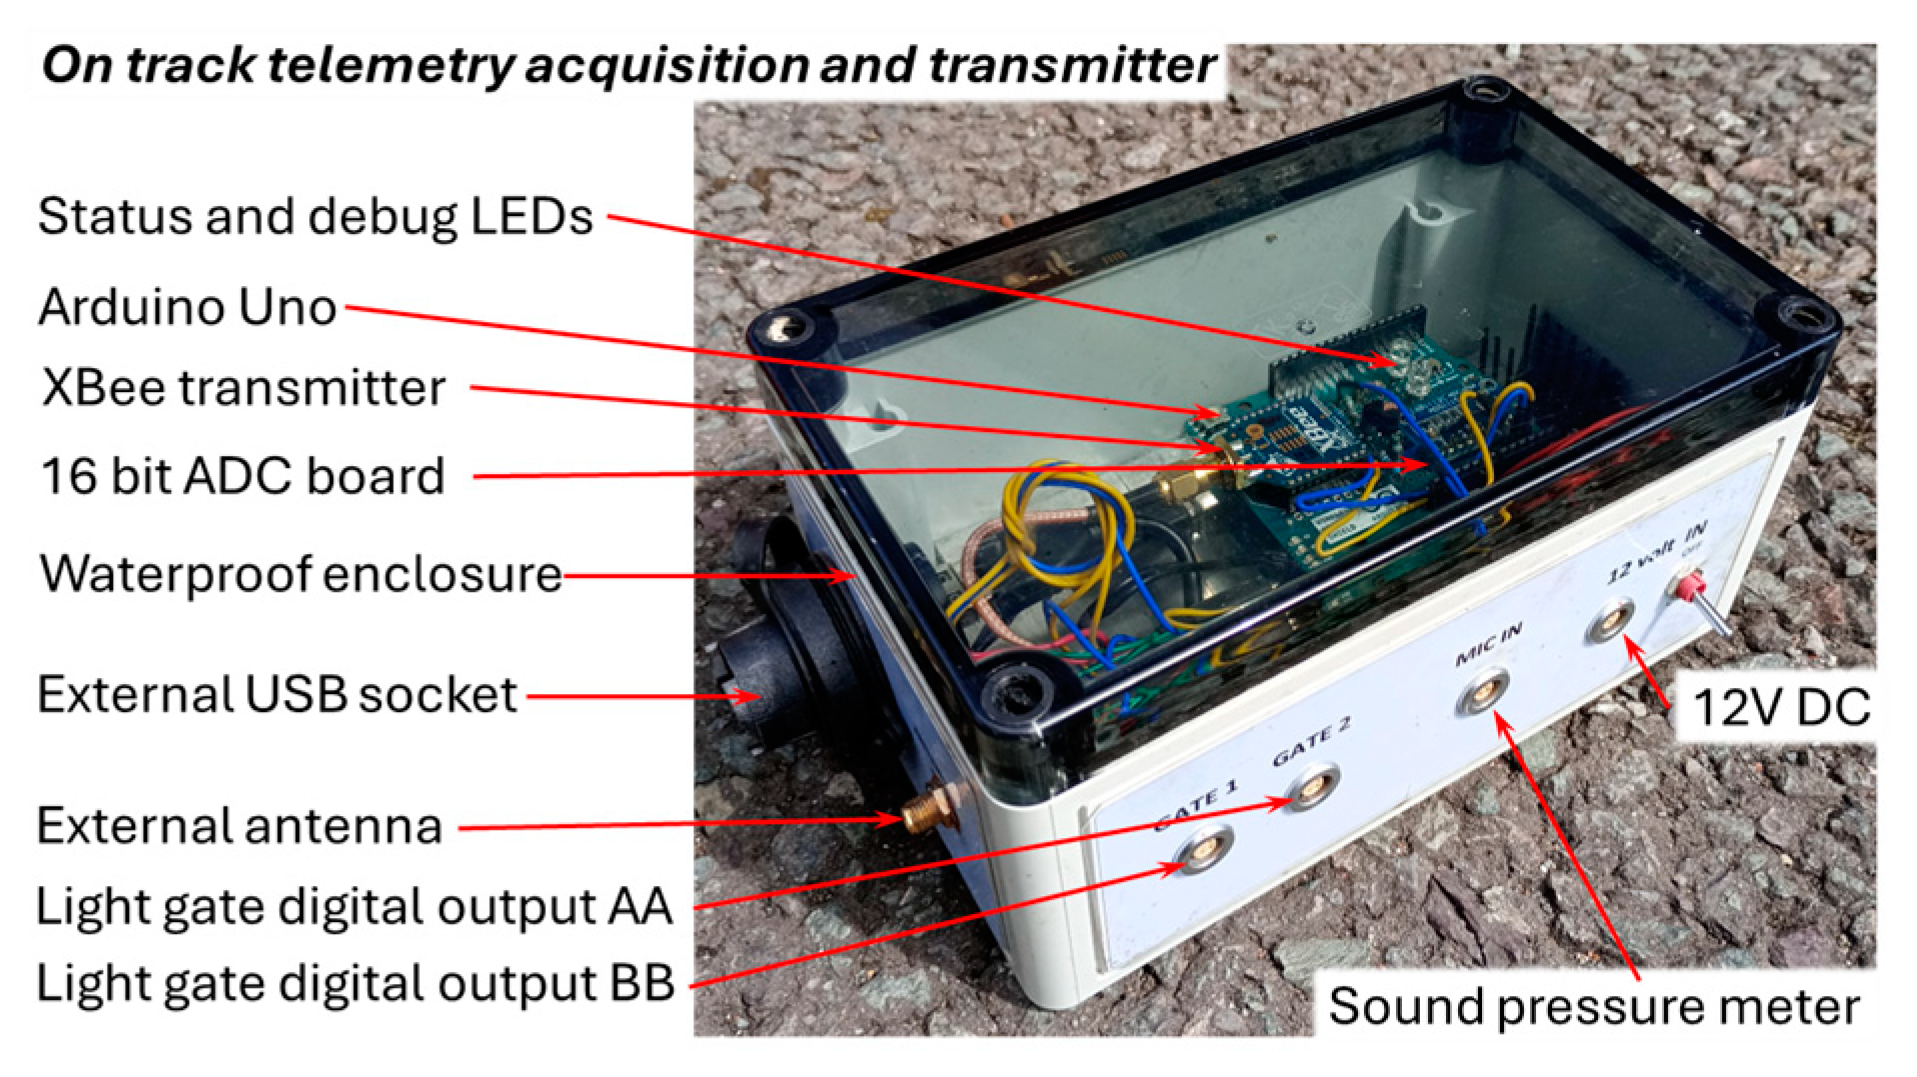
The external enclosure is shown labelled with the primary features in
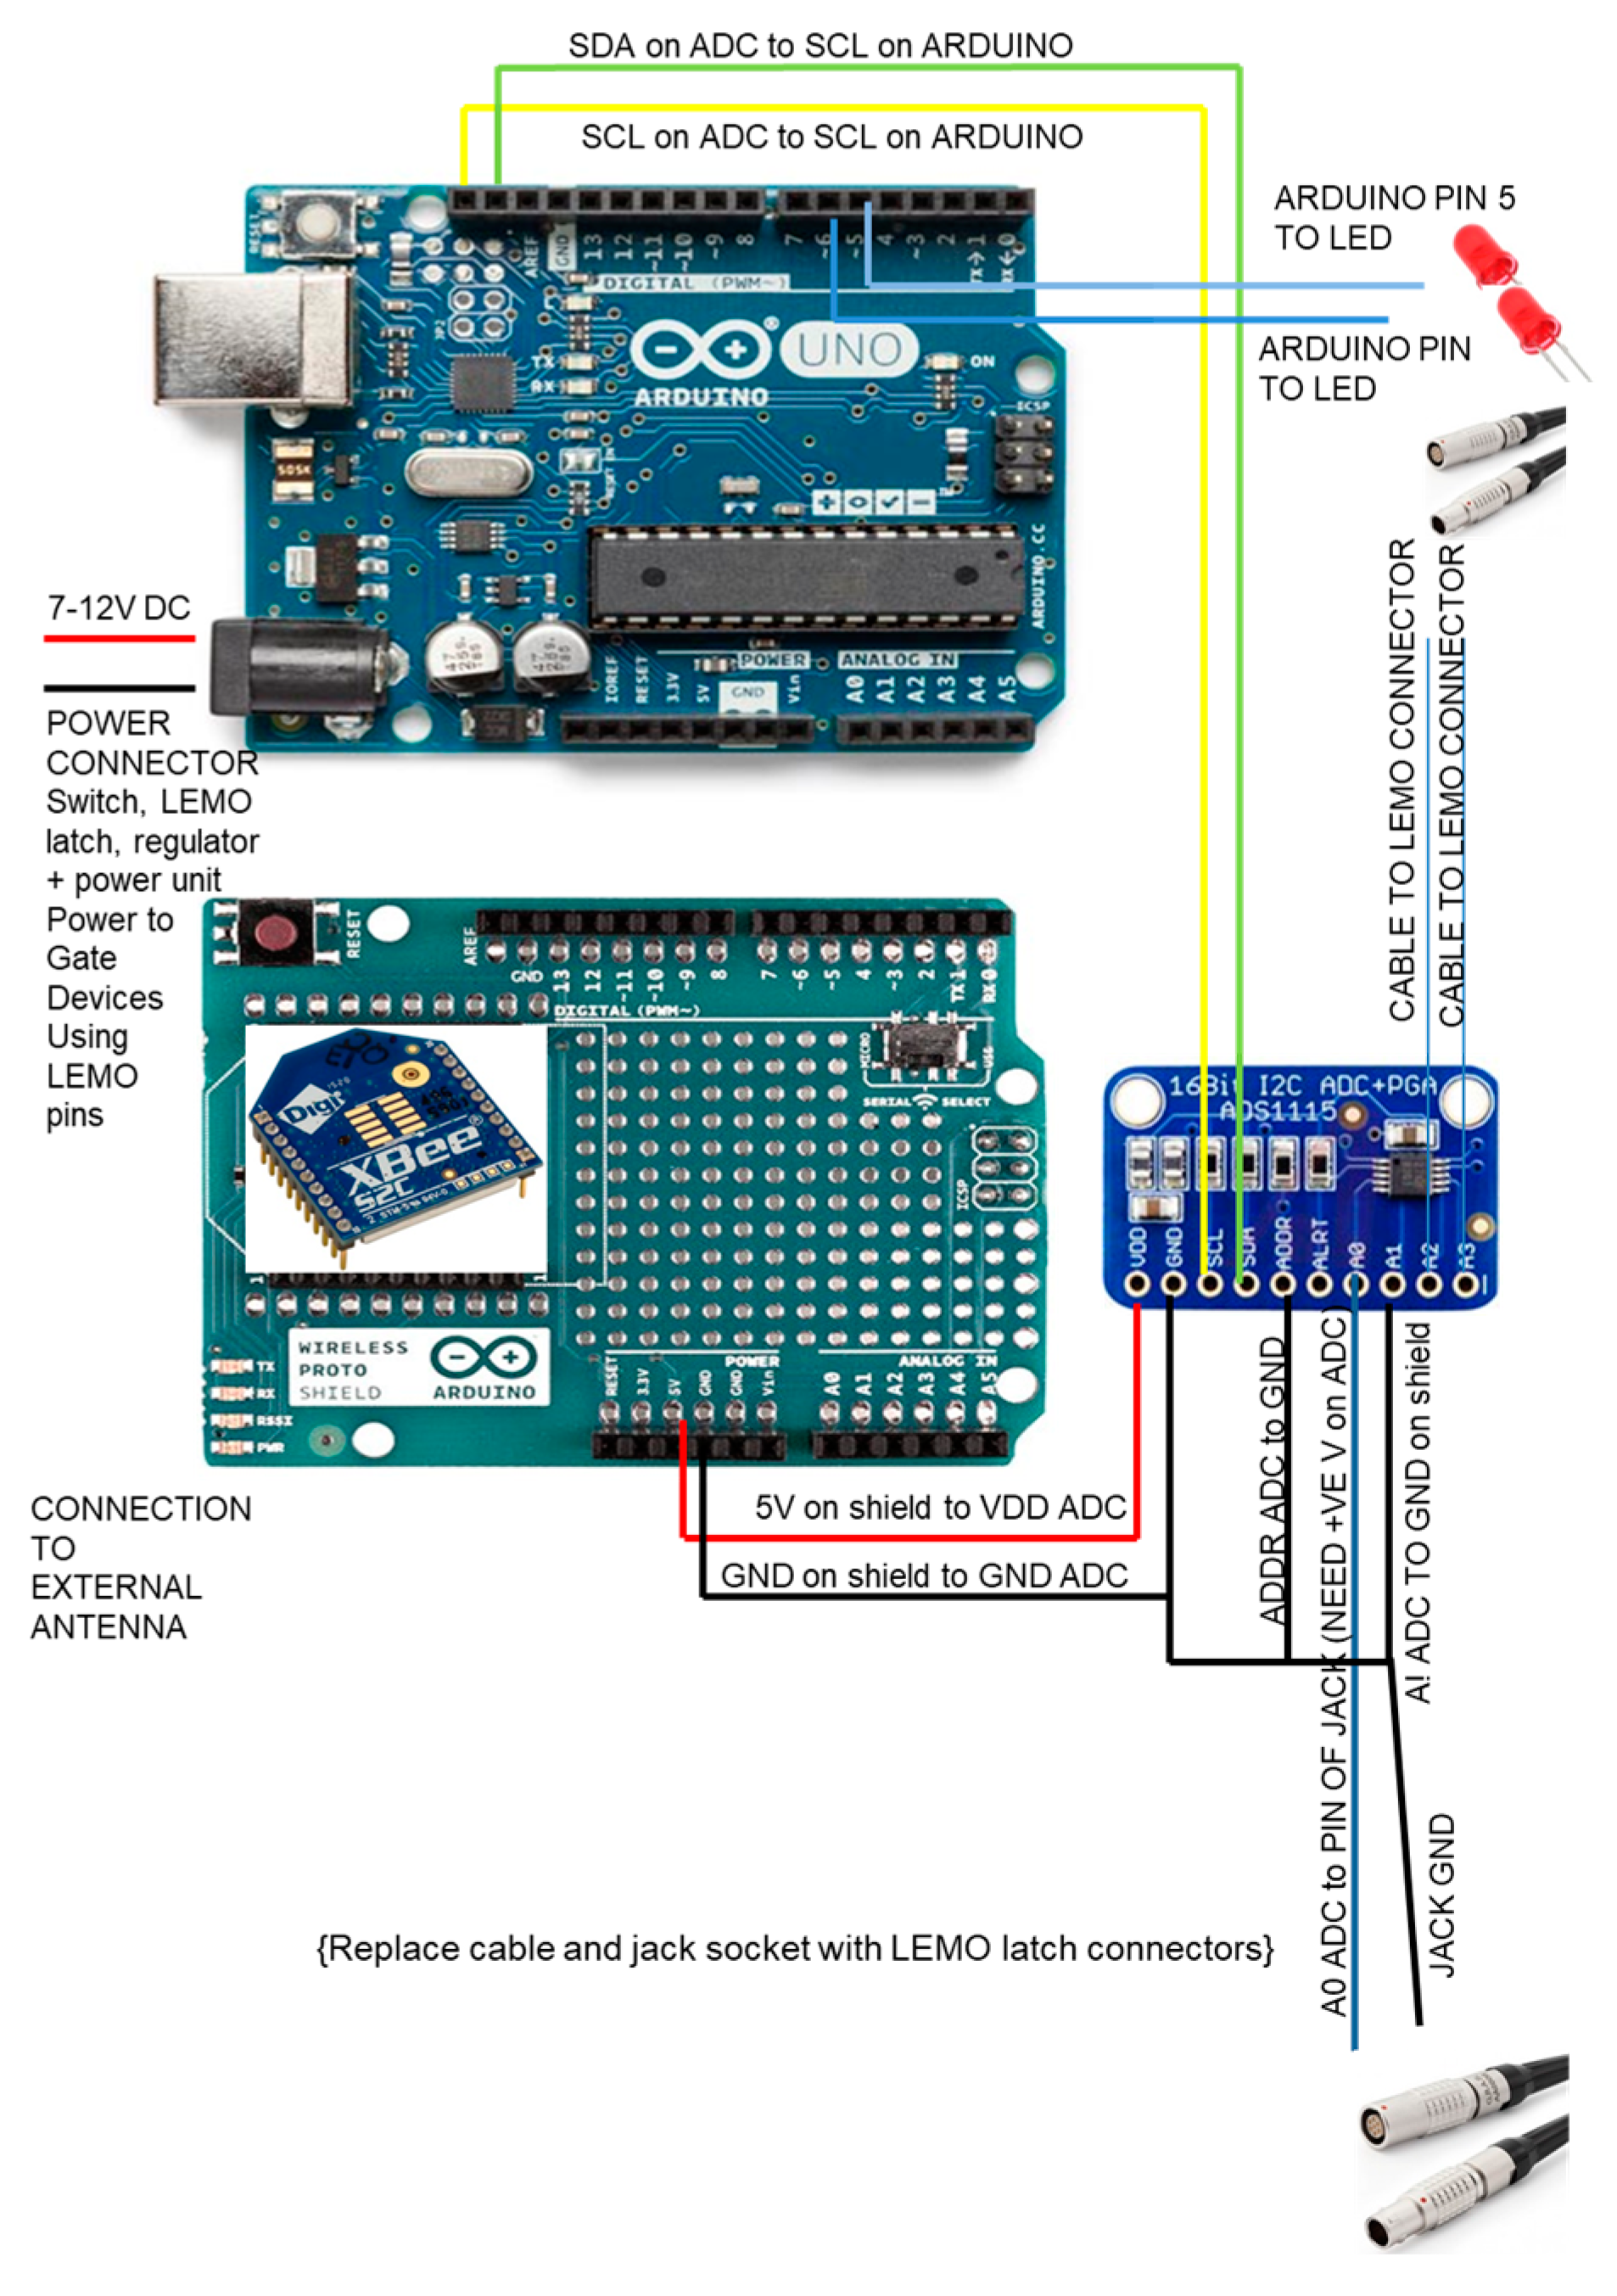
Figure 7. The Arduino Uno is the top-level hardware that acquires the digital input signal from the light gates. The basic analogue-to-digital conversion onboard this device is limited to a 10-bit resolution, which does not provide the accuracy needed for the sound level meter conversion. Instead, a 16-bit ADS1115 provides this conversion through the SPi bus connection, initiating a discussion on the compromise between cost and precision. The ADC has a programmable gain amplifier (PGA) to select a measurement voltage range, which is, in this case, set to ±6.144 V, where 1 bit is 0.1875 mV.
The connection diagram for all components is shown in
Figure 8, in which the wireless message transmission utilises the Zigbee RF family, specifically the Digi International XBee 2.4 GHz transceiver (XB24 CZ7 SITB003), with an outdoor range of 1200 m at a data rate of 250 kbps and a transmit power of 3.1 mW. The company is based in Hopkins, Minnesota, USA, with the components being widely available and distributed worldwide. This is a programmable device with upload software settings provided in the downloadable repository given in
Section 3.5 The external antenna provides height away from the ground plane via an RPSMA connector to the mirror antenna on the outside of the vehicle.
The technology options include Wifi and Bluetooth, which are fast but highly range-limited, even outdoors (avoiding directional antennas tracking a moving vehicle). Mobile phone data communication is now common but not a fixed (or free) cost, and while recording two independent signals with a common timebase is possible, the solution tends to involve long-range but slower rates of transmission. Therefore, the messages sent must be encoded to be as short as practicable.
The difference between the professional equipment and the visible breakdown in
Figure 7 is in the robust connections and some antenna directionality. All radio transmission is limited by the same maximum radiated power by legislation, so data compression, software error checking, and redundancy are coded on the Arduino board.
The output from the ADC device is an unsigned integer, which is converted into two bytes (high and low) for the XBee transmitter at 10 Hz, with a short delay between transmission being written to the device. Two identical values between 128 and 131 denote the end of the message, where the difference relates to the gate condition (thus using the synchronisation bytes to also transmit information on the track condition, shown in
Table 1).
The message communication has a rate of 9600 baud (8 N/1/N), although it is possible to transmit at 115,200 if a slightly higher exterior antenna or slightly lower range than the total track length of approximately 1 km is required.
2.5.5. Vehicle Telemetry
The decoding of the telemetry signal takes place using the circuit in
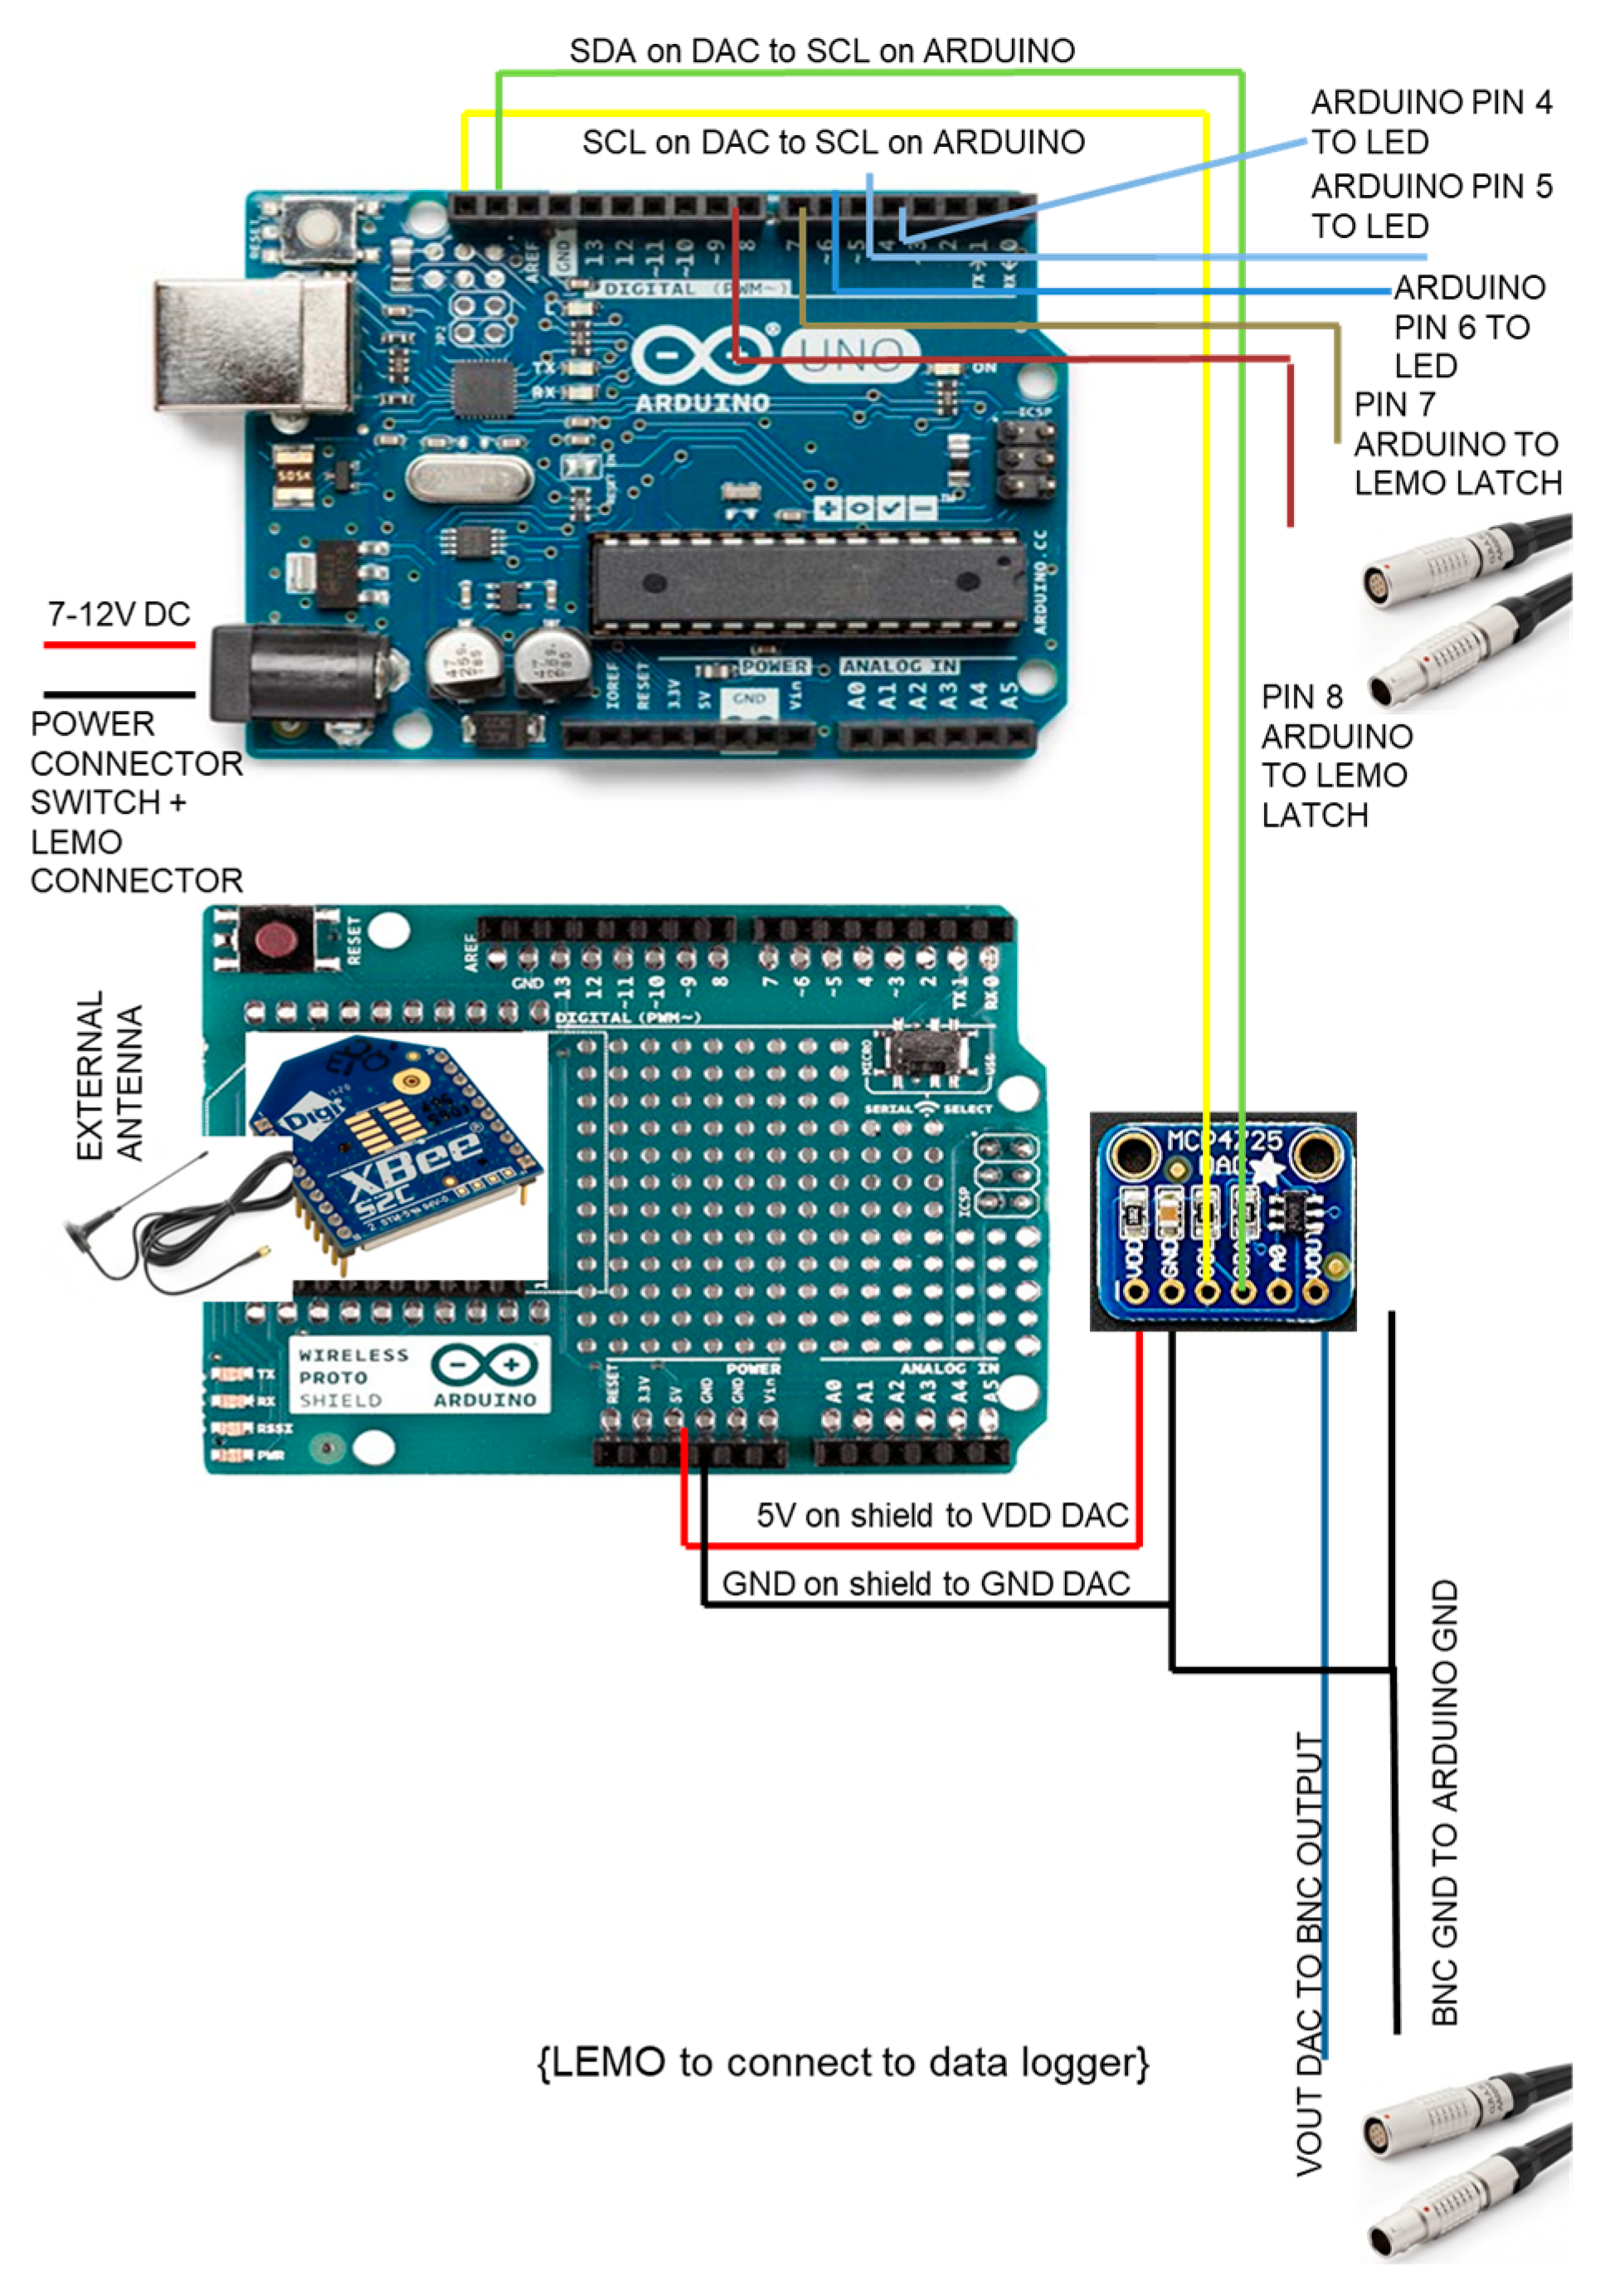
Figure 9, in which the noteworthy features are labelled. This provides real-time visualisation of the sound pressure level in the vehicle. The enclosure also uses the same Arduino Uno, XBee transceiver but also uses a DAC MCP4725 in this case to communicate with the in-vehicle and industry-standard data logger, which is the hardware amplification used to mitigate the loss of accuracy to the 12-bit conversion for display.
The circuit connections are shown in
Figure 10, in which the power supply is shown as raw input. The separation here allows the connections among a telemetry system, data logger, and vehicle CAN communication to be fully explored separately, which is novel and accessible.
2.5.6. Open-Source Replication of the System
The technical build details for the ISO-362 equipment in this paper are available with all commented source code and build documents at the Loughborough University repository as part of open-source data sharing [
14]. Matlab processing scripts are included.
3. Analysis of Typical Results and Assessment Points of Discussion
3.1. Industrial Conflicts of Interest
The ethics of decisions influencing society are rarely brought into such focus as during this test, but previous industrial discussion points are evident in terms of environmental legislation and unethical competition [
15]. Society dictates the overall legislative legal limit through consultation with industry experts and manufacturers with the whole vehicle as a design focus. Typically, the engineer designs for those purchasing the vehicle, and as such, the interior is key. We note that the move from the 2007 standard through the 2015 to 2022 standards is to close loopholes and “flexibilities” and produce test standards that are more reflective of real-world driving scenarios [
16], although this adds complexity and variability.
One high-level learning outcome is that once the vehicle meets the industrial limit for externally generated noise, a design engineer would not attempt to reduce the exterior noise further. At this stage, all focus is on the interior occupants and the need to reduce the interior noise for a luxury product [
17], which is subject to internal target-setting using benchmarks in the vehicle class. The noise sources here include the PMSM motor narrow-band frequencies, narrow-band gearbox contact noise, irregular thermal pump timing, and squeaks and rattles where masking is no longer present; see [
6] for examples.
3.2. Stationary Vehicle Observations
For many students, the first opportunity to walk around and engage with a real-world vehicle accompanied by a member of staff is important. Classroom exercises are different from having an expert available to highlight the modern aspects of design. The following is a list of specific acoustic design items to highlight.
The bonnet is a large double-skin vibrating plate with associated natural frequencies and mode shapes. Highlighting the stiffening members [
18] to increase the natural frequencies is one design change, but covering the underside with fabric insulation also mitigates sound transmission. Here, the link to the problem of low-frequency transmission is evidenced.
The students are encouraged to feel under the engine cover and behind bulkhead access panels for soundproofing [
19]. This is a good example of kinesthetic learning, as the tactile sensations without visibility are novel [
20].
The water rubber isolator around the engine bay is noted to assist in enclosing the engine bay as noise isolation. This is an example of a secondary functionality.
The tyres are often overlooked as details. Here, the students inspect the tread pattern and note, for the first time, that the blocks are subtly varied sizes, such that one tone is not generated, but instead a range of frequencies as a roaring effect. There are limitations due to block-out-of-balance forces [
21,
22], but the analogy drawn is with the noise made when a playing card is fixed into the spokes of a bicycle, creating a machine gun sound. With larger EV vehicles, the increased mass makes this important.
The tyre shape is assumed to be fixed, but the carcass vibration frequencies are mentioned. The amplification due to the horn geometry leads to increases of up to 20 dB (A) [
22] for carcass frequencies close to the contact patch. Here, the problem of electric vehicles’ heavier weight and wider tyres (in general) is made; wider tyres are needed for weight distribution and heat but at the expense of increases in noise. A move from 155 mm- to 195 mm-wide tyres leads to an almost 2 dB (A) increase [
10].
The students can feel the wheel arch liners, with insulation often close to the gearbox and wheel axle access. Interestingly, testing in winter and wet weather conditions allows students to appreciate the difficulty of durable and functional materials on surfaces. Sandberg provides a variation of CPIX noise measurements on different surfaces, including the ISO 10844.
The door sound has an analogy with a one-degree-of-freedom mass on a spring in terms of natural frequency. Tapping the outer door skin has a high pitch, indicating a panel with low mass and high stiffness, but closing the door produces a low-frequency thud (frequency balance and cleanliness [
23]), indicating mass. The door is typically soundproofed by more than one rubber seal, which, when compressed, becomes a stiff joint. The mass law balances doubling the mass of a partition, in which 6 dB is the maximum reduction, against designing partition and air gap combinations. These can be seen in novel glass treatments for sound reduction, notably in higher-frequency broadband aero-acoustic noise reduction.
At the rear of the vehicle, often facing the ground, are the exhaust outlets. Here, the students can see the aesthetic design, in which two are often fitted but, for low engine sizes, only one is real (for acoustics). Should one be in the centre, as on rear-engine sports cars, the acoustics are equidistant to the sound pressure meters but, for most vehicles, are bad due to access to the boot storage with heat and soot. Spacing on either side of the vehicle (or equidistant) means each sound pressure meter receives the same amplitude of noise (one side is not louder). Hence, the car design is uniquely affected by the acoustic test restrictions. EV vehicles with motors on either side can sound different to a central motor due to gear whine from differentials. The harmonics can be seen in predictive work by Van Herbruggen [
7].
An advantage of working on real vehicles is the practical skill development it affords. Thus, allowing the students to take vehicle tyre pressures using a pressure gauge (noting the difference between gauge pressure and absolute) and tyre and track temperatures using a thermocouple probe and IR sensor (noting the errors) builds kinesthetic learning skills [
20]; also see the Loughborough University record [
24]. Tyre wear gauges allow the students to learn about average measurements and take sufficient measurements around the tyre to develop good observation skills. This encourages experiential learning (“do, observe, think, plan”) [
25] (Are the tyre pressures the same as those recommended by the manufacturer?).
3.3. Moving Vehicle Observations (ISO-362)
The pass-by-noise test for a manual selection of second gear is shown in
Figure 11, in which the measurement is separated into the left-hand and right-hand sides of the vehicle, which is important if the exhaust or a turbocharger is packaged with a preference.
Ideally, the results would be repeated until a 2 dB (A) variation is reached; however, here, it is possible to see two measurements that appear out of line with the grouping, allowing for a discussion regarding the averaging process and standard deviations of around 4 dB (A).
Manufacturers would typically spend a long time obtaining many repeated runs and then selecting the optimum with a low standard deviation. In doing so, the existing test also limits the visibility of the typical variability that exists in the real world. This is partially to reduce the test driver variability in the runs and assumes a complete separation of the vehicle and driver.
The corresponding pass-by-noise results for third-gear acceleration are shown in
Figure 12 (again two useful outlying data points are clear), in which the lower RPM at 50 km/h would typically produce lower accelerations and noise, but this depends on the vehicle mapping and which source is dominant.
The pass-by-noise calculation is shown in
Table 2, in which the final value is not compliant with the test methodology due to factors including wet weather testing, track temperature, and wind speed on the day. Corrections for testing in different conditions are listed in the references below for daily development. It is likely that for final compliance, testing will only occur on dry, warm track conditions with low wind.
The overall pass-by-noise results obtained in this test are above the limit of 75 dB (A) for the vehicle by 5 dB (A); however, errors in the application of the test explain this difference.
3.4. Moving Vehicle Observations (Tyre Noise Against Speed)
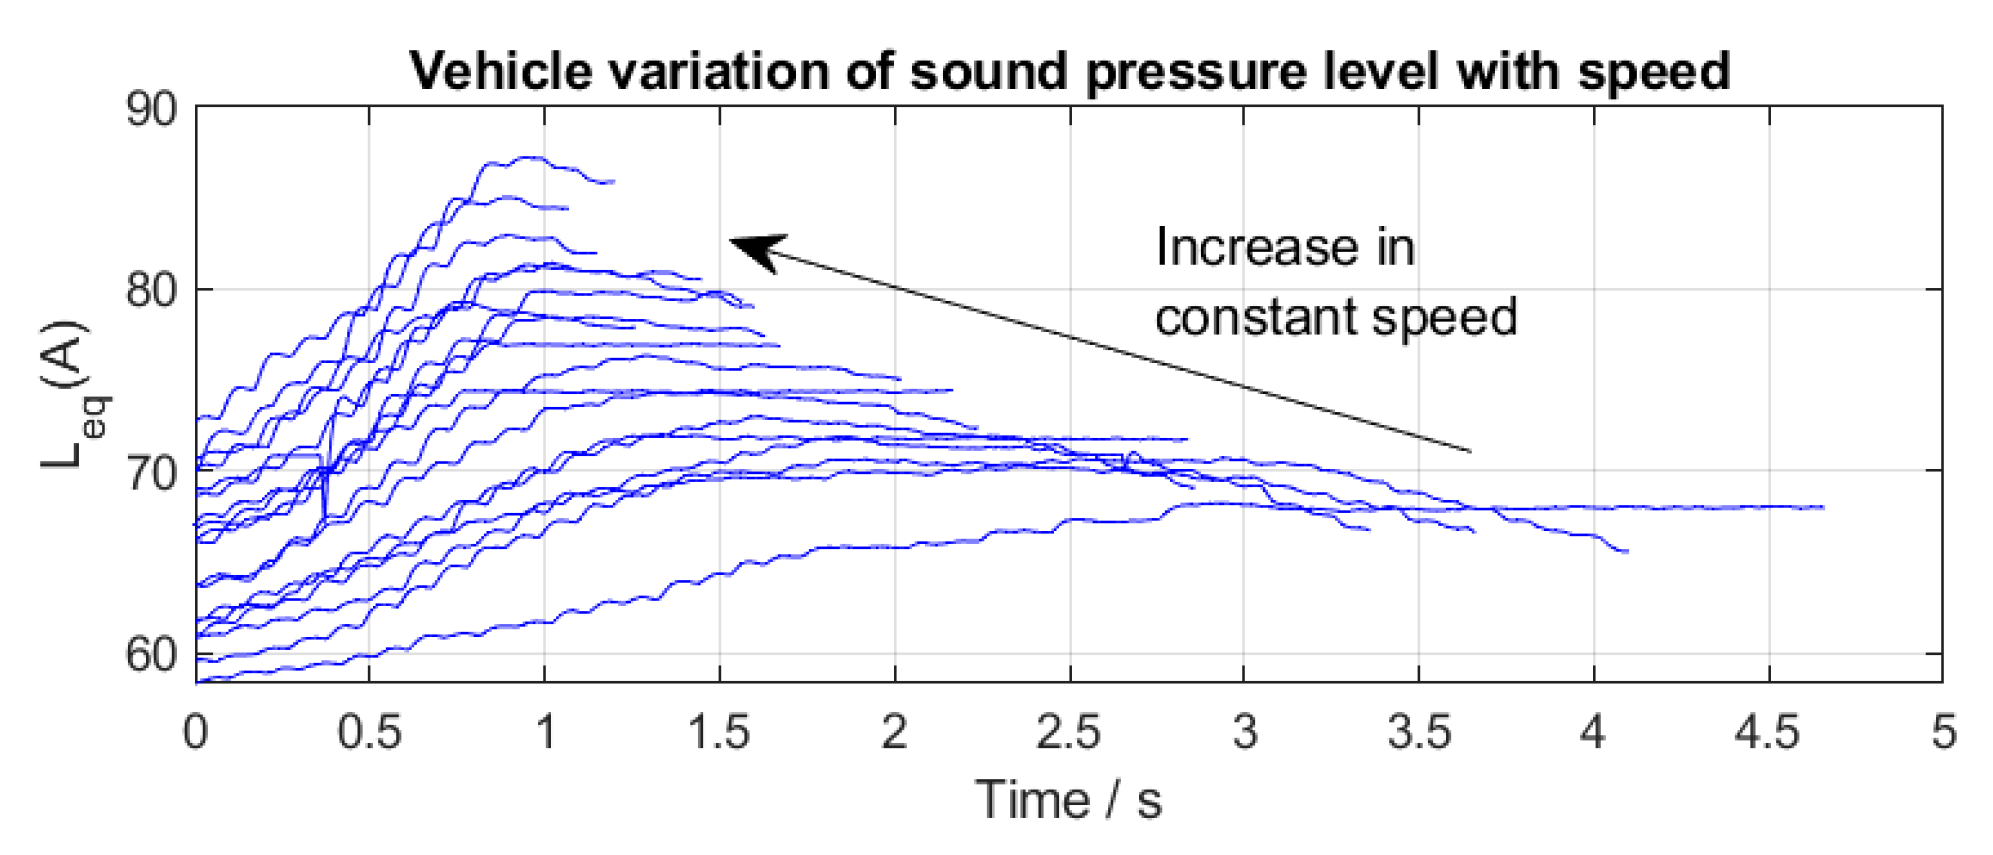
The vehicle is driven through the test zone at constant speeds. The results of this are shown in
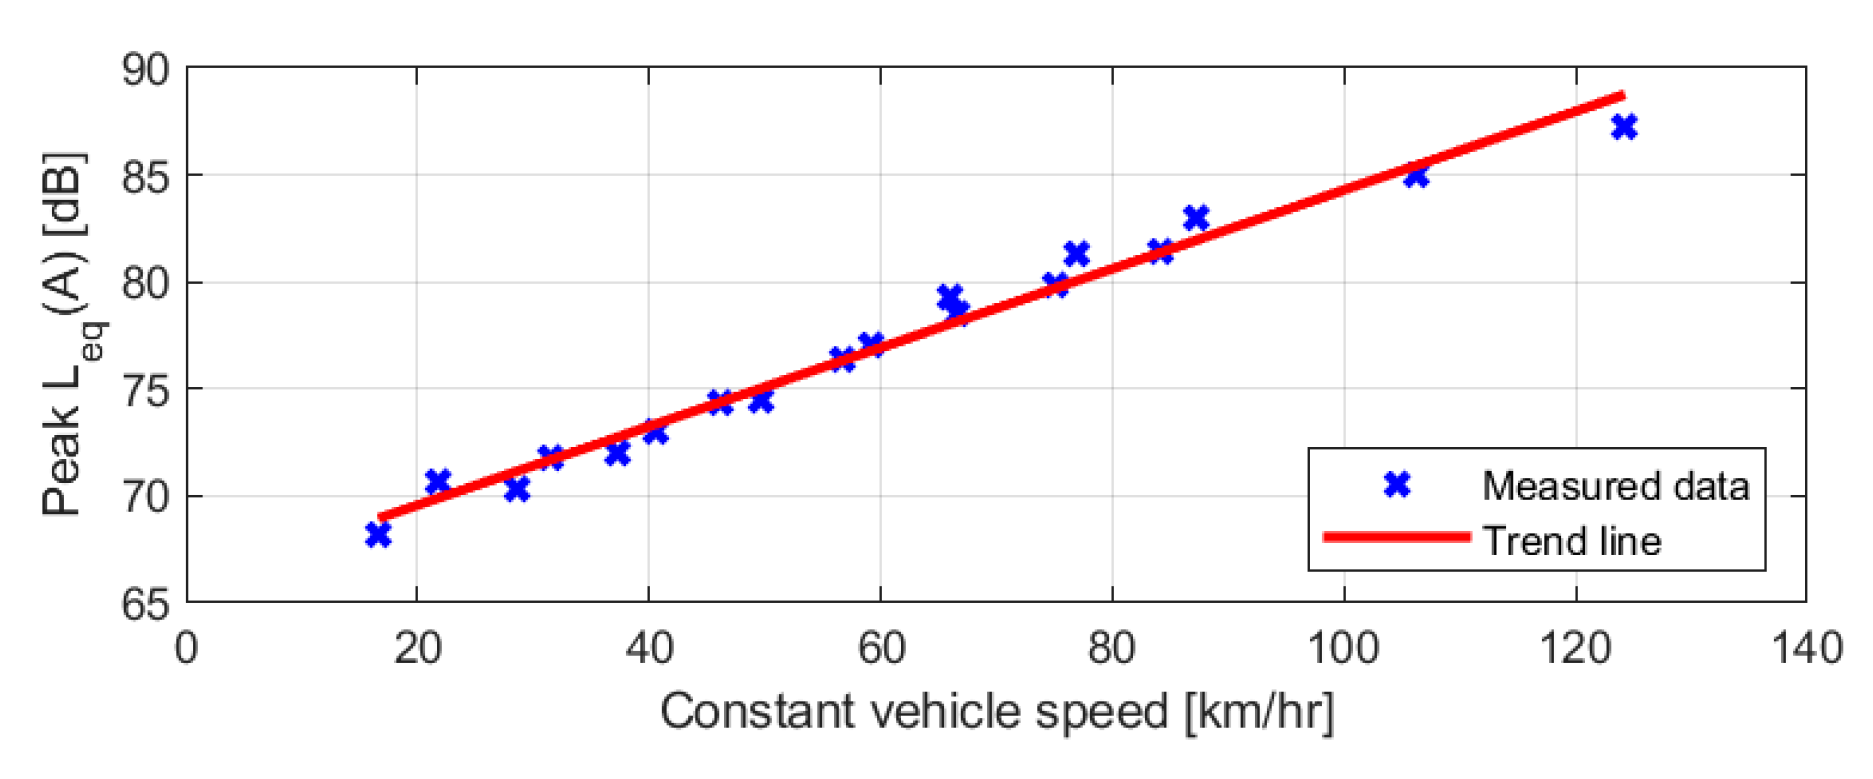
Figure 13, in which the peak sound pressure level increases with speed. It is also noted that (i) the noise in front of the vehicle produces an observable warning to pedestrians more than 60 dB (A), (ii) the sound behind the tyres also produces significant noise despite being of no use in terms of safety because it is pure pollution, and (iii) the tyre noise on a damp track produces approximately 75 dB (A) under constant speed. It is also noted that this is a used vehicle.
Figure 14 shows the trend line with experimental measurements for a variation of tyre noise with speed. This linear best fit of Lp(A) = 0.18× speed + 65.9 [dB (A)] compares well with the literature; see, for example, the dedicated test equipment reported by Sandberg for passenger cars of 0.23 dB (A)/km/h and 0.2 dB (A)/km/h for trucks, both inferred from speeds above 50 km/h [
10]. Sandberg shows a wider range of speeds, which indicates a more parabolic shape (at low speeds, the noise increase is more substantial), and states that
is a better relationship [
10].
3.5. Implications of Statistical Testing
The requirements are that measurement groups do not deviate by more than 2 dB. A manufacturer would spend significantly longer preparing the vehicle and gaining repeatable results, which takes time and money. The students are therefore able to see the relative range of measurements and understand how these might vary the final pass-by-noise value.
Students will be aware that acoustics and hearing relate to the small perturbation of fluids, such as air, with the unit of pressure being the pascal. However, the human ear is formed to provide a larger range of bandwidth for lower frequencies than higher frequencies, but it is also formed to generate a logarithmic basis for subjective amplitudes of hearing. Given a sinusoidal acoustic wave with pressure [Pa] formed of an amplitude A [Pa], frequency [rad/s], the change in the sound pressure level using the root mean square pressure dB, where [Pa] is the threshold of hearing at a frequency of 1 kHz. In accordance with strict engineering principles, averaging the sound pressure level might normally involve converting the sound pressure levels in dB back to base units of pascals, averaging the pressure at this point and then reconverting back to decibels. However, the ISO-362 method involves a far simpler averaging in the dB levels without conversion, which avoids any need to manipulate logarithms. Students will now be aware of the relative ease of calculating the final pass-by-noise level and, critically, the accessibility of this method to non-experts in the field.
Additional simple tests are carried out to ensure students have an instinctive feel for the conversion of sound pressure to decibel levels, see
Appendix A for details.
The coasting tyre noise is a simpler test that produces a consistent measurement of EV noise in a clear fashion and accentuates the importance of tyre width and horn amplification for acoustic radiation needed for carrying the battery weight.
4. Conclusions
The application of the ISO-362 pass-by-noise test and a constant speed driving test are described with associated equipment. Educational acoustic training is used as a device to observe how acoustics has influenced specific areas of the vehicle for interior luxury and comfort. For exterior noise and, in particular, electric vehicle testing, it is shown that the tyres produce most of the exterior noise and will be the main problem in the future. It is shown how it is possible to replicate industry-standard equipment for acoustics testing, with telemetry running at 250 kbps, exterior measurements, and integrating vehicle unique communication with data acquisition at 10 Hz, for educational training. This utilises open-source software and inexpensive hardware to showcase the movement of information on a systems level. Industry-standard data verification and error correction are managed through the provided software. Novel contributions include the use of accessible technology, such as Arduino boards and XBee transmitters, to demonstrate the link between industrial testing and education.
The current iterative development of the pass-by acoustic test methodology has evolved for internal combustion engines. Here, it is proposed that there is a far simpler trend for coasting through the test area, where the measurement of car tyre noise fits well with the literature-established curves. The focus should be on the greater mass of electric vehicles and the trend for the tyre-specific radiated noise of Lp(A) = 0.18×speed + 65.9 dB (A). The width of the tyre is highlighted as being of key importance for radiated noise for future electric vehicles due to the influence of the tyre horn amplification of up to 20 dB, together with a width increase of 2 dB for tyre width from 155 to 195 mm. It is argued that the exterior noise limits from legislation only provide a maximum that the car can emit, rather than ideally that all vehicles minimise the exterior radiated noise. Although electric vehicles provide high torque across a larger speed range than internal combustion engine vehicles, the aero-acoustic noise only dominates above 110 km/h; hence, the focus of the test should be on the tyres, which dominate.
The variability in testing is explored, and while manufacturers would take the optimum runs from across a broad range of measurements, track variability, temperature corrections (2.5 dB between summer and winter), and weather corrections (4 dB increase when the track is wet) exhibit in real-world constrained time testing, showing approximately 4 dB variability in runs compared to the required 2 dB mandated by the test specification.
