Abstract
The state of charge of a battery depends on many magnitudes, but only voltage and intensity are included in mathematical equations because other variables are complex to integrate into. The contribution of this work was to obtain a model to determine the state of charge with these complex variables. This method was developed considering four models, the multilayer feed-forward backpropagation models of two and three input variables used supervised training, with the variable-learning-rate backpropagation training function, five and seven neurons in the hidden layer, respectively, achieving an optimal training. Meanwhile, the radial basis neural network models of two and three input variables were trained with the hybrid method, the propagation constant with a value of 1 and 80 neurons in the hidden layer. As a result, the radial basis neural network with the variable-learning-rate training function, considering the discharge temperature, was the one with the best performance, with a correlation coefficient of 0.99182 and a confidence interval of 95% (0.98849; 0.99516). It is then concluded that artificial neural networks have high performance when modeling nonlinear systems, whose parameters are difficult to measure with time variation, so estimating them in formulas where they are omitted is no longer necessary, which means an accurate SOC.
1. Introduction
Currently the state of charge (SOC) is a highly relevant parameter that is applied in cases where the accumulator is constantly subjected to charging and/or discharging scenarios, such as in hybrid vehicles or microgrids. The SOC is defined as the expected energy as a percentage of the nominal capacity, which is still available to be used. This parameter also depends on temperature, self-discharge, charge/discharge current rates, time of use and hysteresis. Because these parameters are not measurable, the need arises to estimate it based on other measurements available in the accumulators, such as voltage and current.
For this reason, it is imperative to develop a model with artificial intelligence techniques, which allows us to know the state of charge more accurately than current methods, to improve the energy management of a nickel metal hydride (NiMH) battery pack.
Factories and research institutions have increased their efforts to introduce hybrid and electric vehicles, which generate low or no greenhouse gas emissions. However, the systems that store enrgy in this new type of vehicle maintain high operating costs, limited life and are heavy. For this reason, the only way for these systems to proliferate is to generate an operating cost less than or equal to that of traditional vehicles with an internal combustion engine (ICE) [1]. Batteries directly contribute to the advancement of technologies ranging from portable electronics to electric drive of intelligent vehicles. Due to superior performance, such as light weights, high energy density [2], low self-discharge rate [3], no memory effect [4] and long service life [5], nickel metal hydride batteries stand out among rechargeable batteries and are widely used in hybrid vehicles (HEV) as the main power source and energy storage unit. To improve the performance of the NiMH battery, a battery management system (BMS) is required to provide protection and monitor the battery energy over its entire lifetime [6]. For battery management, accurate SOC estimates are crucial [7]. The United States Advanced Battery Consortium (USABC) defines SOC as the percentage of capacity remaining at rated capacity under the same conditions [8]. It is an indicator not only for predicting the remaining mileage of hybrid vehicles but also for determining a safe management strategy to prevent the battery from experiencing overcharge and over discharge. The accurate SOC value can characterize the battery usage and the degree of charge/discharge, thus providing a basis for formulating the ideal battery charge/discharge strategy.
The electrochemical reactions that occur inside the nickel metal hydride cells when they are charged are given by the positive electrode, which is nickel oxyhydroxide, while the active material of the negative electrode is hydrogen, thanks to a metal alloy that generates the storage of hydrogen during the charge cycle and exhaust in the discharge cycle [9]. Additionally, the metal alloy as a negative electrode greatly reduces the environmental impact.
Potassium hydroxide is the main compound in the electrolyte of NiMH batteries; the electrochemical reactions are presented in Table 1.

Table 1.
Electrochemical reactions of NiMH batteries.
Therefore, the principle of operation of these batteries is based on the absorption and desorption reactions of hydrogen in the negative electrode. In this way, the main advantages and disadvantages that they present in comparison with nickel–cadmium batteries are expressed [9,10,11]:
Advantages:
- High specific energy (greater than 90 Wh/Kg, 30% more than nickel–cadmium technology).
- High specific power (over 200 W/Kg).
- Prominent energy density (over 150 W/L, 40% more than nickel–cadmium technology).
- Cadmium-free technology, resulting in less pollutant emissions.
Disadvantages:
- The metal alloys used to maintain stable negative electrode performance at high temperatures prove to be more expensive than nickel–cadmium technology.
- Compromised performance at high temperatures due to poor performance of the negative electrode metal alloy characteristics.
- High self-discharge rate between 15 and 25% per month versus approximately 10% for nickel–cadmium batteries.
Therefore, the kinetics of the charge transfer reaction are highly affected by temperature [12]. Higher C rates result in higher temperatures on the primary surface of the battery, since the current being discharged from the battery increases when the value of C is very high. Therefore, temperatures above 40 °C have a negative impact on performance and battery life. Temperatures ranging from −15 °C to 40 °C are ideal for the operation of lithium-ion batteries [13].
In studies like [14], the authors show that the resistance varies in mΩ in the charge and discharge process. However, when the battery is in the process of discharging, the resistance value increases, but when the battery is being charged, this value starts to decrease. For this reason, measuring such small values leads to great uncertainty, which is why it is necessary to implement more sophisticated estimation processes such as artificial neural networks (ANNs). Therefore, the temperature guarantees a long period of life, high performance and safe operation of power systems in electric vehicles (EVs) [15].
On the other hand, several models to estimate the state of health (SOH) have been developed including variables such as storage temperature and SOC. Additionally, energy yield, cell temperature and C rate are used to model SOH in research [16]. Something similar occurs when the SOC models are analyzed under different driving cycles such as the Environmental Protection Agency (EPA), China light-duty vehicle test cycle passenger cars (CLTC-P) and Worldwide Harmonized Light Vehicles Test Procedure (WLTC), where temperature plays a fundamental role and needs to be constantly monitored because more advanced investigations suggested in [17] can be carried out later, such as cell degradation, thermal runaway and gas generation. At the same time, analyzing the temperature of the cell on the surface is the most suitable, given that previous studies [16] show this importance at the time of analysis, since the highest concentration of heat is generated at that point. In relation to the implications, implementing the temperature variable to estimate the SOC of battery cells in EVs is essential.
Batteries often have nonlinear characteristics and time-varying characteristics. In practical applications, it is very difficult to estimate the SOC accurately due to the inaccuracy of the initial SOC and past calculation. At present, several research methods have been proposed to estimate the SOC, which can be mainly classified into three categories: (1) experiment-based methods, (2) model-based methods and (3) data-driven methods. Each has its own advantages and disadvantages in certain aspects, which are presented in Table 2 [18].

Table 2.
Comparison of SOC estimation methods [19,20].
Equivalent circuit models (ECMs) show a great deficiency in predicting battery terminal voltage at low SOC, which increases battery risk at low voltage levels [21]. Furthermore, developing methods from experimental data using controlled methods helps to increase the prediction of the state of charge, since the dynamics of the battery can be captured with sufficient accuracy [22]. Additionally, the dynamic neural network time series method is used to estimate the SOC of the lithium-ion battery, which is improved on the basis of the classic closed-loop nonlinear auto-regressive models with exogenous input neural network (NARXNN) model, and the open-loop NARXNN model considering expected output is proposed [1].
Data-driven methods: with the development of artificial intelligence, data-driven methods have been proposed in recent years, including backpropagation neural networks, fuzzy-logic principles, etc. Wang et al. [23] used fuzzy logic to estimate the SOC. According to Qian et al. [24], the nonlinear behavior of the open-circuit voltage versus SOC comprises the model. Chen et al. presented two backpropagation neural networks for SOC estimation. Their model-free characteristics and flexibility make them suitable for nonlinear mapping approximations. Since the battery is affected by various chemical factors, the SOC value is variable. Such methods can automatically adjust the internal parameters according to the changes in the system, which is a class of ideal SOC estimation methods [25]. However, the estimation accuracy is highly dependent on the quality and quantity of experimental data. Therefore, the accuracy of the neural network output is closely related to the accuracy of the original training data. Only when the training data are sufficiently accurate is the neural network output of practical importance. Therefore, the premise of improving the output accuracy of the multilayer perceptron (MLP) model using backpropagation training for the neural network is to improve the accuracy of the SOC training data.
Accurate estimation of the battery SOC can contribute to reliable and safe battery utilization. The main contributions of this method can be summarized as follows. (a) An improved ampere-hour counting method that takes capacity attenuation into account to calculate SOC is proposed, which improves the accuracy of SOC calculation at different capacity attenuation stages. (b) The backpropagation neural network (BPNN) is combined with an improved ampere-hour counting method to estimate SOC [26]. A summary of the neural network method applied to determine the SOC of a NiMH battery is presented in Table 3 [27].

Table 3.
Summary of the neural network method.
In addition, in the paper “Estimation of Lithium Battery SOC Based on Fuzzy Unscented Kalman Filter Algorithm” developed by Zhang, XZ et al. [28], the simulation results show that under the condition of unknown noise, the Fuzzy Unscented Kalman Filter (FUKF) algorithm has faster convergence speed and higher estimation accuracy than the UKF algorithm, which effectively solves the deficiency of the UKF algorithm. Meanwhile, in the paper “prediction of SOC in a Lithium Ion battery cell using fuzzy inference system and fuzzy identification” developed by M. kim et al. [29], an adaptive combination of EKF and the conventional Coulomb counting method is proposed. Finally, the proposed adaptive method shows within 2% error with 70% decreased complexity compared to EKF. On the other hand, genetic algorithms are used for optimization in the operation of the different variables used to model a system [30]; in the work “A hybrid genetic algorithm for the electric vehicle routing problem with time windows” developed by Liu, QX et al., with results by the comparison of the simulated annealing (SA) algorithm and genetic algorithm (GA), the proposed approach indicates that it can provide better solutions in a short time
With the above-mentioned, the best method to find the state of charge of a nickel metal hydride battery cell is the implementation of artificial neural networks. Consequently, the use of neural networks proposed in this work to estimate the state of charge in NiMH battery cells for hybrid vehicles becomes essential to obtain a better management given that these batteries enter a recycling process when the vehicle reaches the end of its useful life, but even these cells retain several properties for energy storage, being used in various power generation systems in remote locations, but need a low-cost storage system to reduce operating cost.
Finally, the trained model needs to be validated by statistical methods, shown in Figure 1: the root means square error (RMSE), absolute percentage error (MAPE), mean square Error (MSE) and correlation coefficient (R2).
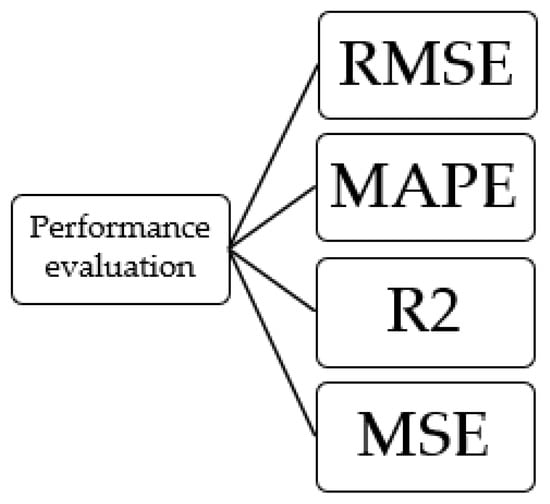
Figure 1.
Methods for performance analysis.
In a review of the recent literature [31] on various factors such as advances in batteries, battery modeling, battery management systems, battery thermal management, SOC, SOH and charge/discharge characteristics in EV applications, no studies on the type of basis radial neural networks applied to NiMH batteries. It is worth mentioning that in other studies [32], the authors analyze the SOC of NiMH and lithium batteries with the type of neural network Adaptive Gaussian Process Regression with Radial Bias Filter (RBF-GPR), and kernel provided the greatest performance with <2% estimation error, but in this case, the batteries analyzed are not for use in hybrid or electric vehicles. Additionally, in [33], the type of neural network GRU RNN (recurrent neural network with gated recurrent unit) is implemented where a SOC estimation model of a lithium-ion (Li-Ion) battery for vehicles was obtained. Using very precise and robust electrical networks, demonstrating that with a limited amount of data, nonlinear models can be represented in a very good way, with which they demonstrated that recurrent networks could achieve a higher accuracy and overcome the problem of long-term dependencies in the RNN.
Finally, [34] used hybrid long–short-term memory (LSTM) neural networks to predict multistep electric vehicle charging station occupancy, for which the results show that the proposed method has a high degree of accuracy. This gives greater support to the research of [35] where the authors used the feed-forward backpropagation regressive network, whose approach is calculated using a virtual function to input the model output variable. In this work, various neural network architectures and 10 training scenarios were used to predict the SOC, voltage, current, speed and mileage but only for lithium-ion batteries.
The main contribution of this research focuses on implementing a feed-forward backpropagation and radial basis neural network model using measured input variables, with which a more realistic representation of the system is obtained. With everything mentioned above, no studies have been found that compare different architectures of the feed-forward backpropagation network and compare them with the type of radial basis network applying to NiMH batteries of hybrid vehicles, where the input variables used to train the model are the voltage and current, so that the temperature variable is subsequently implemented and the performance of the developed model is analyzed to reach the conclusion of which is the type of network that best models the SOC for this type of battery, opening the study of the second life for this type of battery that is being replaced by Li-Ion ones, mainly to be implemented in other applications.
2. Methodological Development
2.1. Development of the Mathematical Model of the NiMH Battery for the Proposed Model
This section indicates the proposed model for the study of charge states.
The electrical-mathematical model aims to predict the behavior in the different operating states; a first-order RC circuit is proposed which represents the activity of a cell or battery bank, this model consists of: a source, 2 resistors and a capacitor. Power supply (Vbatt) the voltage existing between the terminals, which is the voltage that deliver the battery, resistance models the effects of battery internal resistance (Ri), resistance and capacitor (Rdy-Cdy) represent the dynamic behavior of the battery cell, battery current (Ibatt) and the battery capacity (Cbatt), in Figure 2 the circuit is presented as just described.
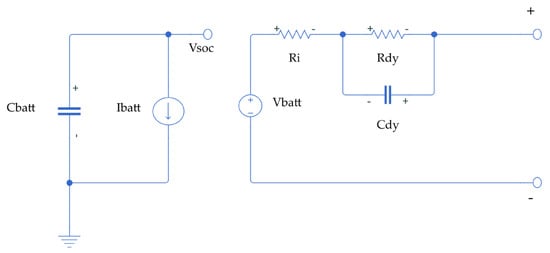
Figure 2.
RC circuit used to develop the model.
Before applying the model, the following parameters must be considered: for the analysis of the estimation, the performance of the battery in charging and discharging will be 100% or 1 for calculation purposes.
Depending on the aforementioned electrical circuit, the operating equations [36,37] that are presented in (1)–(3) can be obtained.
where and represent the voltage across the capacitors and of the circuit, “y” is the voltage across the terminals, while C is the current that crosses the circuit.
The matrix form can be expressed in Equation (4).
2.2. Data Collection for the State of Charge of a Nickel Metal Hydride Battery Cell
The technical specification of the battery cell used for this work is provided in Table 4 [38].

Table 4.
Technical specification of battery cell.
When the discharge rate C is not available in the manufacturer’s data sheet, it is necessary to calculate it with Equations (5) and (6) [39]:
where
I: consumption current;
Cp: consumption power;
V: voltage;
Ah: nominal capacity.
From the above, the rate C of the battery is 0.76 C.
The following method was used to obtain the necessary data, train the artificial neural network and estimate the state of charge of a battery cell.
Current-based estimation, also known as Coulomb ampere-hour meter. The method consists of integrating the current supplied and absorbed from the battery as in Equation (7) [40].
where
SOCo: initial state of charge;
n: battery performance;
I(t): battery current in discharging process;
to: starting time;
SOC: state of charge;
C: battery capacity or voltage in discharge process.
The initial state of charge is calculated with Equation (4) [40]:
where
SOC: percentage of state of charge.
The percentage of the state of charge is estimated using Equation (9):
where
C(initial): the initial voltage of the battery when it is 100% charged.
On the other hand, the battery performance is calculated with Equation (10) [40]:
where
Ac: load amperage (A);
Td: discharge time (min);
Vd: discharge voltage (V);
Id: discharge current (A);
Tc: charging time (min);
m: the amount of data collected during the download time.
Once we have determined all the variables that we need to measure from Equation (7), we can determine the state of charge of the nickel metal hydride battery cell, which is represented in Equation (11).
The network structure in this work can be schematically represented as in Figure 3. The network contains 2 inputs and 1 output, and to obtain the number of neurons in the hidden layer, we use Equation (12), where n is the number of inputs to the network (in this case, 2 inputs), giving us 5 neurons in the hidden layer.
where
n = number of inputs
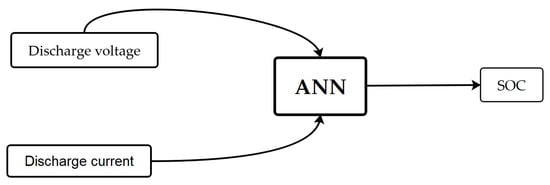
Figure 3.
Inputs and outputs of the artificial neural network of the first model.
However, through the analysis carried out in the introduction and in the work [13] developed by V. Talele et al., they determine that the temperature in the battery cell directly influences the state of charge, so it is imperative to add this input variable to train a second model with artificial neural networks. The first one is represented in Equation (11), while the second one is presented in Equation (13):
As mentioned above, the structure of the artificial neural network for the second method can be represented in Figure 4. Since this artificial neural network has 3 input variables and one output variable, it will result in 7 neurons in the hidden layer.
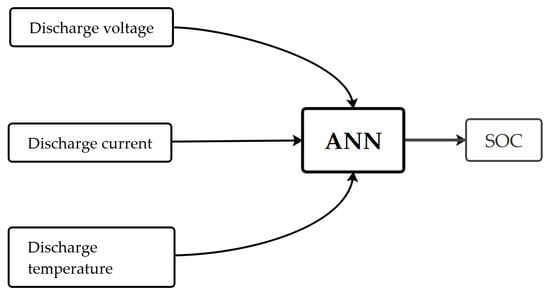
Figure 4.
Inputs and outputs of the artificial neural network of the second model.
where
- Voltage in the discharge process (V): The electrical potential difference between the cell terminals while discharging. The unit used for the respective operations was volts [V]. These data were measured with the help of an AUTEL model MP408 oscilloscope, which manufacturer is AUTEL, the equipment was obtained by an authorized distributor ¨IngeAuto¨ in Ambato, Ecuador.
The MaxiSCOPE MP408 is a 4-channel digital oscilloscope. It measures and tests all modern electronic components and circuits. Compatible with MaxiSYS tablets MS906BT and up, and the MaxiIM IM608 tablet, the MP408 displays high-resolution waveforms.
- Current in the discharge process (I): The number of electrons moving per second. The unit used for the respective operations was amperes [A]. These data were measured with the help of an AUTEL model SA253 clamp meter, which manufacturer is AUTEL, the equipment was obtained by an authorized distributor ¨IngeAuto¨ in Ambato, Ecuador.
The current clamp measures a maximum current of 65 A, with a frequency of up to 20 KHz. It works with jaws that open to allow clamping around an electrical conductor. After linking it with a multimeter or an oscilloscope, the zero-adjustment knob on the clamp is pushed down until the multimeter or oscilloscope reads zero.
- Cell temperature (temp): This is a physical magnitude that indicates the internal energy of a body; the unit used to represent this magnitude was degrees Celsius (°C). This magnitude was measured in the section where the temperature sensors are placed, using an automotive pyrometer model ADD8850, which manufacturer is FLUKE, the equipment was obtained by an authorized distributor ¨dominion¨ in Quito, Ecuador.
The thermometer measures the electromagnetic radiation emitted by the body in a spectral interval that depends on each thermometer. It includes a pilot light beam for better orientation when taking measurements [41]. In the following Table 5, the characteristics of the pyrometer are provided with details [41].

Table 5.
Pyrometer characteristics.
The experiment was carried out on the date of 1 December 2021 in the city of Riobamba, Ecuador, at an ambient temperature of 20 °C, with a relative humidity of 59%, with an atmospheric pressure of 0.73 atm [42]. Figure 5 shows the test station used to collect the different data to be used for the training of the different neural networks. Additionally, the power used to discharge the cell was 60 W, the cell charging amperage was 3 A and it is worth mentioning that all the data obtained were taken every 30 s. The reason for choosing the value of 3 A as the charging current is because battery manufacturers recommend charging the battery cells at a C rate lower than the one at which they were discharged. All the above is carried out to improve the state of cell health. With the above, the loading and unloading times were approximately 60 min and 40 min, respectively, resulting in 80 pieces of data for each variable in the unloading process; in other words, about 240 and 320 values were used for training the different artificial neural networks.
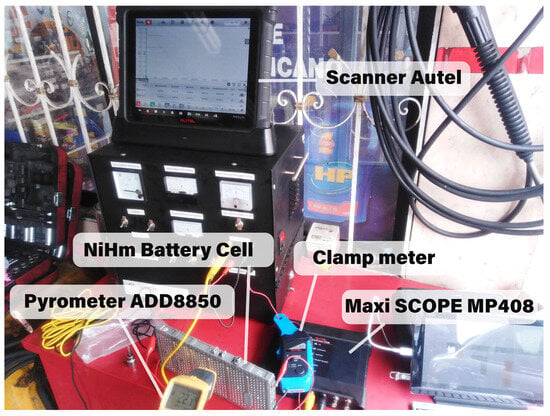
Figure 5.
Test station for data acquisition.
It is important to clarify that to generate discharge power, it is necessary to use elements that represent the actual discharge power of the vehicle, because each manufacturer may use a different type of battery compared to other manufacturers.
Once the data set was obtained, we randomly divided it into two parts: 70% was run for artificial neural network (ANN) training in the Neural Networks Toolbox module of the MATLAB R2020b mathematical software—the <<nntool>> code is written in the software command window to enter the toolbox—and 30% was run for the validation and evaluation phases, all this with the purpose of obtaining a representative subset of the data distribution.
However, the data obtained for the training of the neural networks are presented in Figure 6 and Figure 7. In the discharge process, the gradient in the temperature increase is within the normal operating parameters of a nickel metal hydride cell, which determines that the temperature should not exceed 30 °C [11].
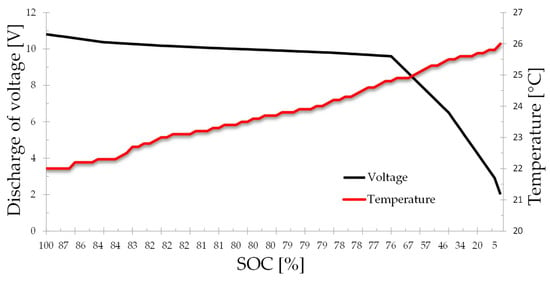
Figure 6.
Voltage and temperature in the discharge process.
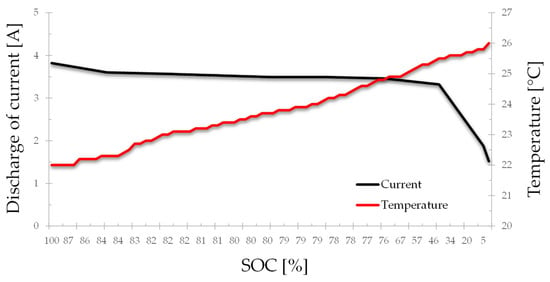
Figure 7.
Current and temperature in the discharge process.
2.3. Neural Model Selection
The steps to create an artificial neural network that estimates the SOC of an NiMH cell is primarily data collection, then architecture selection, to continue with network training, with the intention of reaching the validation and testing stage, and finally the run.
According to ref. [43], in the field for battery cell state of charge analysis, the most used network types for artificial neural networks are:
- Multilayer feed-forward backpropagation;
- Radial basis (exact fit).
As these two types of neural networks are classified according to their training method, in the error correction learning group, it is necessary to develop a method with a type of artificial neural network with hybrid training. Radial basis (exact fit) fits this requirement. At the same time, the function of activation, learning and validation in artificial neural networks will be analyzed in this paper.
2.3.1. Multilayer Feed-Forward Backpropagation (FBNN)
The basic structure of the multilayer feed-forward neural network usually consists of 3 layers: the input layer, hidden layer and output layer. At each input neuron, it acquires data from another neuron, passes through the hidden layer and finally goes to the output layer.
The weights before training have no relevant information; they only acquire it after training. In Equation (14), the above-mentioned is represented:
As in any machine-learning problem, overfitting of the training data is not desired. This will occur if you must train for many epochs; an epoch is a cycle of the algorithm where the network evaluates all available samples once; performing too many epochs means overfitting.
The training and validation tests of the feed-forward backpropagation multilayer neural network structure defined in Figure 7, with three inputs: voltage, current and temperature in the discharge process together and an output of the neural network, which is the SOC, are performed randomly using different architectures and modifying the hidden-level neurons, the stimulation activities and the training algorithms of the models. Specifically, in Figure 8, the input layer has 3 neurons, the hidden layer has 7 neurons and the output layer has 1 neuron.
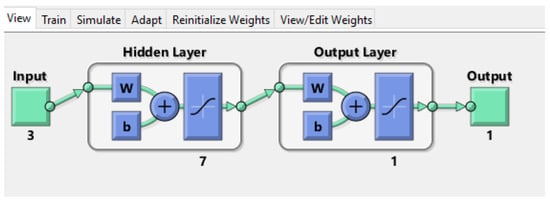
Figure 8.
Structure of the feed-forward backpropagation neural network of the second method with 2 layers.
A fundamental stage in an artificial neural network is the training stage; this stage is based on varying the weights of the connections in an orderly manner acquiring an available array. The network employs a capturing process, where an addition is indicated along the weights of the network that are considered according to the desired output, thus obtaining the required output. Continuing with validation, it is a critical process that involves the evaluation of the functionality and accuracy of the system with the identification and mitigation of bias in the training data. Data privacy and security using appropriate validated and documented tools and techniques. Likewise, the test phase is where each of the trained models is provided with the test data to verify which of them gives the best prediction [44]. The final stage is the use of the neural network whose functionality will be represented with the correlation coefficient shown in Figure 9.
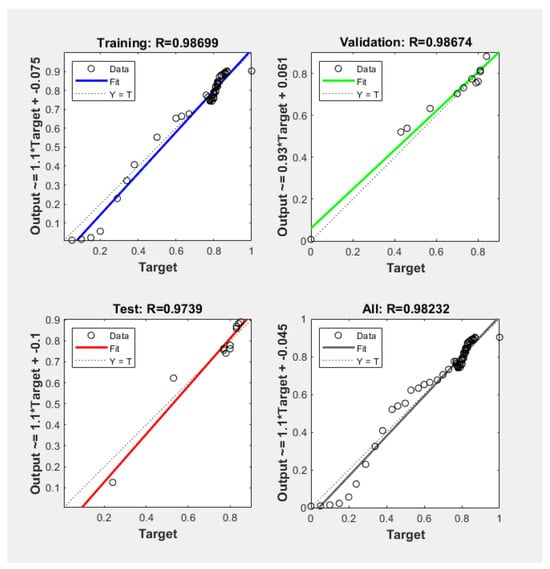
Figure 9.
Feed-forward backpropagation training phase.
2.3.2. Radial Basis Exact Fit (RBNN)
A radial-based neural network is based on the calculation of the Euclidean distance given an input vector x, with respect to a reference or center c, ref. [45] defined in Equation (15):
A radial basis function θ(x) corresponds to each neuron in the input layer and an output weight (). The output weight feeds an output neuron, which adds to the inputs, and an output is obtained as a response, expressed in the following Equation (16):
RBNNs have a rigid three-layer structure: input layer, hidden layer and output layer, which differs from other networks such as backpropagation.
Learning is a fundamental part of an artificial neural network, and this type of network is no exception. This process consists of the determination of centers, deviations and weights from the hidden layer to the output layer. Since the input layer performs several tasks, the process is optimized by separating the parameters of the hidden layer and the output layer.
The training method to be used in this work for this type of artificial neural network will be the hybrid one, in which the number of neurons and weights in the hidden layer and the thresholds of the output layer are automatically calculated by the software, as can be seen in Figure 10.
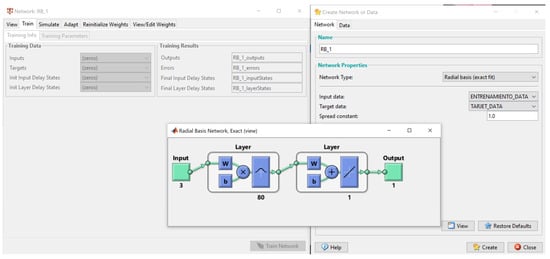
Figure 10.
Radial basis hybrid training phase.
The only value that is modified is the spread constant, which determines the activation within the data cluster. If the propagation value is high, the data points will be dispersed far from the center, leading to low efficiency. Therefore, from several from [46], it is concluded that the best value to train the network is 1.
2.4. Selection of the Set of Training Techniques
An important stage for a neural network is the training process, which consists of modifying the connection bias weights in an orderly fashion using a learning method that best fits the system to be modeled. The input is presented together with the desired output so that the synaptic weights are adjusted for each neuron to obtain the desired output. For each neural model, proposed FBNN and RBNN several training functions, number of hidden layers, number of neurons in the hidden layer and transfer function for activation were selected and tested. Once the desired level is reached, the training is stopped, and the network obtained with the different features mentioned above is used.
There are many training functions, such as batch gradient descent (TRAINGDM), variable-learning-rate backpropagation (TRAINGDX), the objective of any training function is to minimize the global average error, RMS and R2.
All techniques used for training must continuously define the problem, preserving the possibility of network propagation, admitting errors and reducing time and resources used in the training stage, like Figure 11.
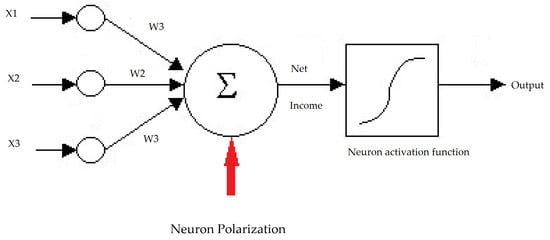
Figure 11.
Standard neural structure.
2.5. Evaluation Criteria for Model Performance
To verify the performance of the models, general statistical techniques such as the error of the square root of the mean RMSE, MAPE, MSE and R2 are used with the real data and the output of the trained neural networks. For this reason, the test data set is considered as input. The expressions used to express the different statistical references used are represented below.
The error in the training process is called RMSE and is defined in Equation (17):
In addition, R2 Equation (18), MAPE Equation (19) and MSE Equation (20) are defined as:
where
- -
- t = target value;
- -
- o = output value.
Mean square error:
where
- -
- : ith observedred valued;
- -
- : the corresponding predicted value for .
The input layers use analog values in the range that was measured, but the neural network output values are in the range of (0, 1). The collected data are the representative information of the problem or system to be modeled. These values should present facilities to meet the implicit goals when applying artificial intelligence techniques to model the state of charge of battery cells for hybrid vehicles. For this reason, the performance of the model must be validated using statistical measures, such as those mentioned above.
3. Results and Discussion
In Figure 4, you can see the process in the data collection of voltage, intensity and temperature, which were used to train, validate and obtain the finished neural network. The results obtained are detailed below.
3.1. Characteristics of the Feed-Forward Backpropagation Multilayer Network
The training ends when the validation error increases consecutively for six iterations. From Figure 12, it is observed that the final mean square error is small. Also, the error of the test set and the error of the validation set present similar characteristics. Additionally, no significant overfitting has occurred in epoch 3211, where the best validation performance occurs.
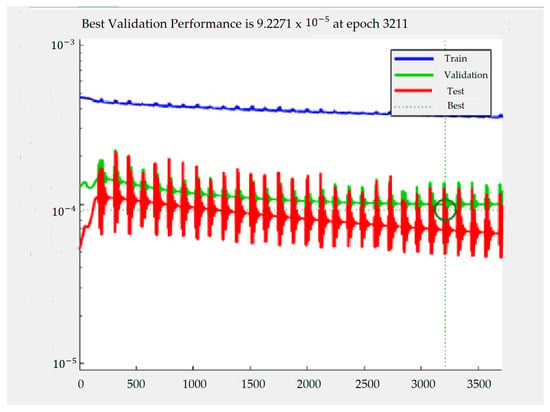
Figure 12.
Best validation performance in terms of MSE.
Figure 13 indicates how the gradient varied its value according to the iterations carried out to find the minimum of the function, whose value is 0.0064, with which the error will be reduced when finding its objective value. On the other hand, the learning rate has a value of 0.4484 that indicates the size of the step or how abrupt are the changes in the weights in each iteration while moving towards a minimum of a loss function. Lastly, data validation was only performed up to epoch 500 to avoid overfitting the neural network.
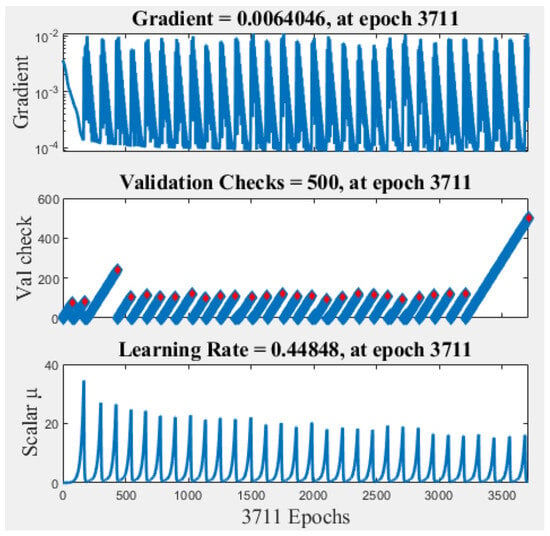
Figure 13.
Training state plot comprises gradient, scalar μ, and validation check.
In the histogram provided in Figure 14, the highest concentration of error is the smallest data range that was obtained from all the errors between the FBNN with three inputs, two hidden layers and seven neurons in that layer, and the Coulomb method, ampere-hour meter. This parameter is another indicator that demonstrates the good performance of this type of this neural network architecture to model nonlinear systems.
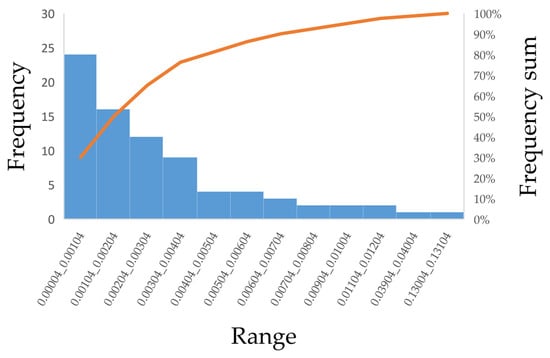
Figure 14.
Difference between the actual and the target output.
Figure 15 of the FBNN network indicates a correlation coefficient very close to one, demonstrating the great performance they managed to have in predicting the SOC of the NiMH cell.
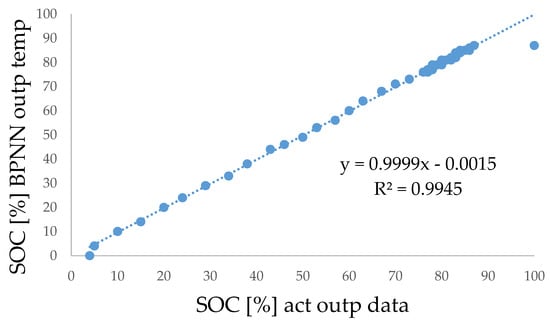
Figure 15.
Regression relation of the FBNN network.
The mathematical functions for ANN in terms of weights and bias are obtained as presented in Figure 16 and Equation (21) [47].
where
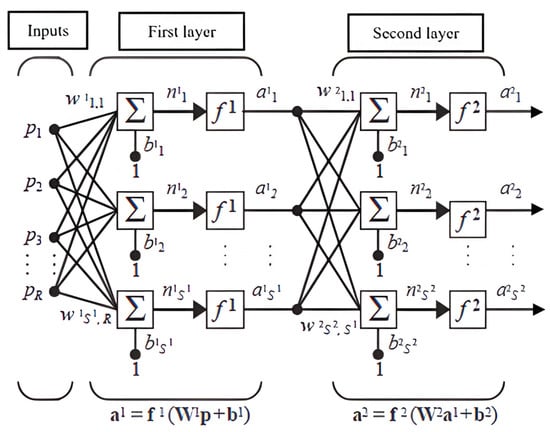
Figure 16.
Feed-forward in a three-layer network. The superscripts represent the layer number.
- -
- W: weight;
- -
- b: bias;
- -
- p: input.
The matrices are presented below with the respective biases and weights according to the corresponding layer:
Weight to layer 1 from input 1:
Weight to layer:
Bias to layer 1:
Bias to layer 2:
The characteristics of the feed-forward backpropagation network is presented in Table 6.

Table 6.
Summary neural network method.
3.2. Characteristics of Radial Basis Exact Fit Network (RBNN)
The only parameter that can be distorted for the training of this neural network is the propagation constant, whose value selected by bibliography is one; the selection of this value gives very high-performance values as can be seen in Table 6.
When using the Matlab toolbox for neural networks, it was observed that the models developed using the networks, such as the multilayer feed-forward backpropagation and the radial basis (exact fit) to estimate the state of charge of nickel metal hydride battery cells for hybrid vehicles, when using different inputs to model the proposed system, have a very high performance. In addition, Figure 17 indicates the regression relation of the network.
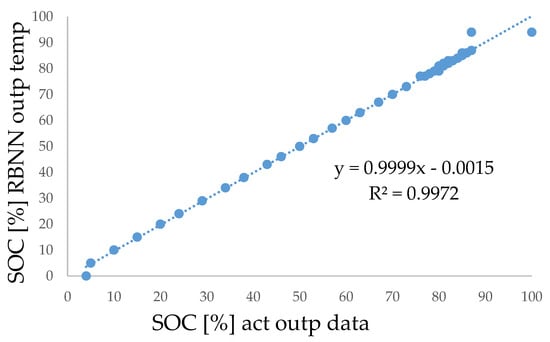
Figure 17.
Regression relation of the RBNN network.
Performance Comparison of FBNN and RBNN
The training result of the multilayer feed-forward backpropagation neural network using GDM and GDX algorithms with three input variables, including temperature, and one output variable is presented. Also, the number of neurons in the hidden layer was increased from 7 to 100. Additionally, a hidden layer was added applying all the variations mentioned above, whose training, validation and analysis are described in Table 7. These data are used to determine which type of configuration is the most optimal for modeling the proposed system.

Table 7.
Validation of the model (FBNN) with temperature.
The results of the radial basis network (exact fit), which is used to make a comparison between the types of networks used, to model the proposed system and find which type of network and configuration has the best performance at the time of estimating the state of charge of the NiMH battery cells, are established in Table 7.
The final comparison of this work is also analyzed by using statistical techniques such as RMSE, MAPE, R2 and MSE. These are shown in Table 8. Where a low RMSE value was found, this means a low error exists between the data set calculated with the Coulomb ampere-hour meter method and the method developed with ANN. The MAPE indicates the size of the error between the methods being compared, indicating that both methods developed with ANN have an error of approximately 1.08% for the FBNN network and 1.10% for the RBNN network compared to the traditional method, whereas the R2 in both methods developed with ANN is very close to one, which expresses that the relationship between the values calculated in the traditional way and with ANN are highly correlated. Finally, a low value of MSE indicates that the error between the traditional method and the method developed with ANN is very low.

Table 8.
Comparison of FBNN and RBNN model performance with temperature.
The comparison of the results achieved by the two trained networks is shown in Figure 18.
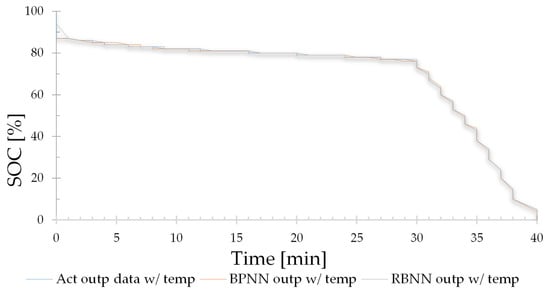
Figure 18.
FBNN and RBNN results with temperature.
The radial basis (exact fit) neural network, being a hybrid training network, automatically determines the training function, the adaptation of the learning function, the performance function, the number of hidden layers, the number of neurons in the hidden layer and the transfer function. So, it indicates, that the software will develop all the training practically, taking away the protagonist role of the developer of the method.
In this case, it is considered necessary to develop a model using the same variations mentioned above, but with the great difference that this model will have only two input parameters (V, I) and one output variable (SOC). This change in the input parameters will allow us to conclude what variation exists in the estimation of the state, by not considering the discharge temperature of the battery cell; the results can be observed in the Table 9 and Table 10, in addition Figure 19 shows the results.

Table 9.
Model validation (FBNN) without temperature.

Table 10.
Performance comparison of the FBNN and RBNN model without temperature.
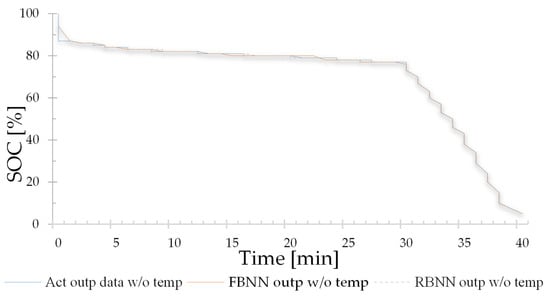
Figure 19.
FBNN and RBNN results without temperature.
Figure 20 shows the R2 of the different methods developed with artificial intelligence techniques. The value of R2 determines the performance of the developed method; it is understood that the closer the value is to one, the better the performance. This analysis helps to determine that the RBNN with temperature network is the one that best predicts the SOC of the NiMH battery, which allows different analyses to be carried out, which are explained in Table 11.
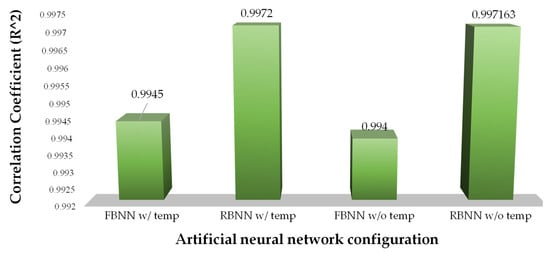
Figure 20.
Performance comparison of the developed methods.

Table 11.
Correlation coefficient (R2).
The neurons in the first hidden layer of each configuration have been modified to understand what happens with the new calculations of RMSE, MAPE, MSE, R2 and SOC estimation. As a result, the R2 in all configurations decreases, implying that the linear dependence between the method created with artificial neural networks and the Coulomb counting method is affected. For this reason, in some studies such as [48], it has already been shown that overtraining a neural network by abruptly increasing the number of neurons in the hidden layer decreases the performance of the model created with ANN. The results of the SOC estimation are presented in Figure 21 and Figure 22.
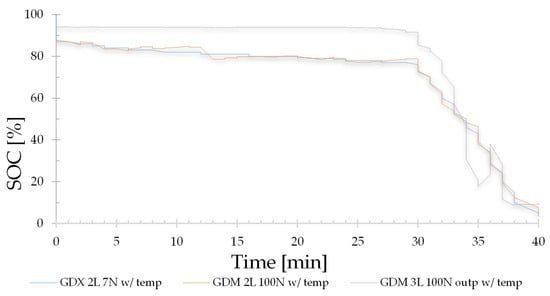
Figure 21.
SOC comparisons of different FBNN configurations with temperature.
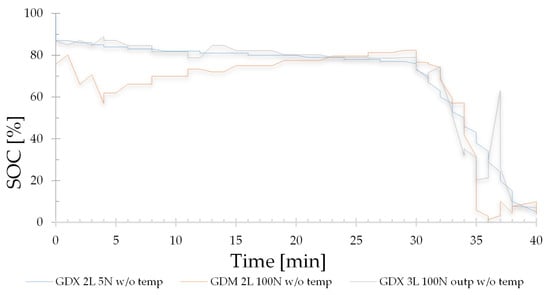
Figure 22.
SOC comparisons of different FBNN configurations without temperature.
Figure 21 represents the SOC with which the FBNN neural network was trained, which includes the temperature variable, the best configuration that presents the best R2, which is selected in Table 6 with an orange box, whose structure is three input neurons, seven in its first hidden layer, one neuron in its second hidden layer and one neuron in its output layer. The training method to develop this structure is GDX. On the other hand, two configurations of the FBNN network have been selected whose R2 is the furthest from one, in order to better appreciate how the erroneous selection affects the number of neurons. The second graphed structure is the FBNN network with two layers, 100 neurons in its first hidden layer and trained with the GDM method. The third graphical structure is the FBNN network with three layers, 100 neurons in its first hidden layer and trained with the GDM method.
Figure 22 represents the SOC with which the FBNN neural network was trained that does not include the temperature variable, the best configuration that presents the best R2, which is selected in Table 9 with an orange box, whose structure is two input neurons, five in its first hidden layer, one neuron in its second hidden layer and one neuron in its output layer. The training method to develop this structure is GDX. On the other hand, two configurations of the FBNN network have been selected whose R2 is the furthest from one, to better appreciate how the erroneous selection affects the number of neurons. The second graphed structure is the FBNN network with two layers, 100 neurons in its first hidden layer and trained with the GDM method. The third graphical structure is the FBNN network with three layers, 100 neurons in its first hidden layer and trained with the GDX method.
Additionally, several measurements of the discharge process of a NiMH battery cell for HEV were carried out, using the same variables and experimental conditions that were used to train the models created with artificial intelligence techniques. With this, 10 data sets were obtained that will be used to develop a more in-depth analysis of the four models developed that estimate the SOC. In the following Table 11, you can see the different correlation coefficients obtained from the different simulations carried out with the respective data obtained from the experimental tests.
By applying an ANOVA analysis of the different correlation coefficients obtained, after having carried out a total of 10 simulations for each of the four models developed, see Figure 23, it can be understood that the lower limit of the RBNN w/ temp model is the only one that is not within the limits of a developed model, which results in a model that is not equal to the other three developed models. In Table 10, the mean that best approximates one can be seen in greater detail, demonstrating that the RBNN w/ temp model is the one that best adjusted to estimate the SOC of the NIMH cells of the HEVs.
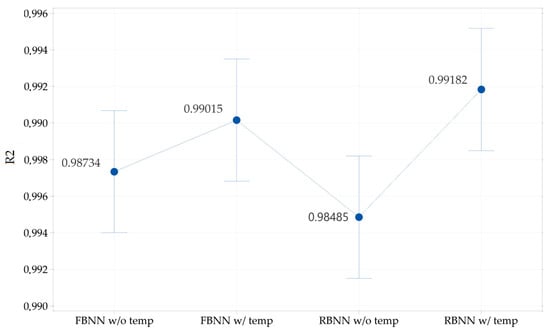
Figure 23.
SOC interval graph of the different models developed, 95% confidence interval of the mean.
The discharge power is the same for all the experiments; this is because the efficiency of neural networks to model nonlinear systems and the implementation of new variables such as temperature are analyzed. With the above, by implementing the temperature variable, the neural networks continue to predict the SOC with very high precision, whose coefficient of determination is 0.99182 with a radial basis exact fit neural network in Figure 23. However, an analysis was applied with a 95% confidence interval, resulting in an upper limit of 0.9951 and a lower limit of 0.98152, for greater detail, see Table 12.

Table 12.
ANOVA analysis.
The validation of the model developed with neural networks was carried out with 10 data sets. It is important to mention that these validation data should not be the same as those used to carry out the training. Under this, study the response of the neural network to data that have not been used during training, which are presented in Figure 23. The configuration of the neural network with the highest R2 of 0.99182 is the radial base that is trained considering the temperature variable.
Additionally, if an interval does not contain zero, the corresponding means are significantly different, as can be seen in Figure 24.
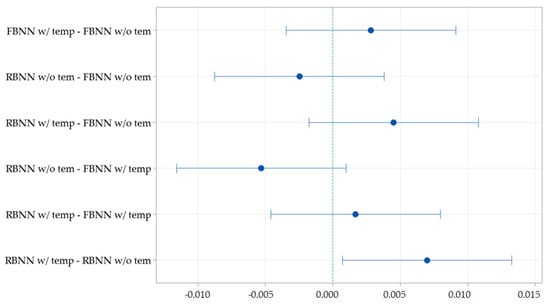
Figure 24.
Difference of the means for the different methods.
After the analysis of various investigations, it was found that it is possible to develop a method with meta-learning techniques, capable of predicting the SOC of a Li-ion battery for electric vehicles. The proposed method [49] is effective when the target battery training data are insufficient, specifically in the early stages of BMS development. In addition, the method developed by this author can estimate the SOC of the battery with a small amount of objective data (96 data points) with a MAPE of 1.0075%, while the RBNN w/ temp model developed in this work can estimate the SOC of the battery with 80 data points with a MAPE of 1.084%. While it is true, they are different types of neural network techniques, but both belong to the machine-learning method.
In the article [50], a method called gated recurrent neural network for online SOC estimation was developed where the robustness of the model is demonstrated by calculating the SOC at different temperatures from the one at which it was trained, obtaining an RMSE in the SOC estimation of less than 2.5% in nickel manganese cobalt (NMC) batteries and 3.5% lower in lithium iron phosphate (LFP) batteries. On the other hand, in this work, different temperatures were also used for training the RBNN model w/ temp obtaining an RMSE of 1.11%. While it is true that they are specifically not the same type of neural network, they belong to the same family of recurrent neural networks.
The results found in [35] indicate that the feed-forward backpropagation neural network can predict not only the SOC of the batteries of HEV and EV vehicles; you can also predict, with a value of 0.1478 RMSE, variables such as current, voltage, mileage and speed. For this reason, it opens a gap to implement more variables that allow the state of charge to be calculated more accurately, coinciding with what is proposed in this work by increasing the temperature variable as an input parameter to better predict the SOC of the batteries, obtaining an RMSE of 0.0154. Finally, the aspects mentioned in this paragraph motivate us to propose research with this type of network and implement variables that continue to affect the calculation of the SOC of the batteries, such as the percentage of humidity in the air, the torque and power that the motor must develop to be able to overcome the different forces that oppose your movement in various scenarios.
4. Conclusions
The current methods proposed to calculate the state of charge of battery cells only include voltage and current, but due to issues in the complexity of modeling the temperature variation in the current formulas; this variable is discarded. For this reason, implementing variables that are difficult to model with traditional mathematical methods, neural networks are conducive to representing these systems and adding variables that have not been previously implemented.
The temperature is a variable that was incorporated in the study of the state of charge for this experiment; this variable represents a significant factor in the performance of the state of charge or discharge of a battery. Its great relevance in this phenomenon means that implementation is essential. By being able to incorporate this variable in the model with artificial neural networks, it generates a significant advance in this field. Additionally, obtaining a determination coefficient so close to one means that this model adjusts very well to the classical equations used previously that only consider the voltage and current available to the battery to calculate the state of charge or discharge of the same.
Four models were analyzed with artificial intelligence techniques, the FBNN and RBNN with two and three input variables and one output variable to evaluate the state of charge of a NiMH battery cell used in hybrid vehicles. Experimental data were obtained by using different equipment that measured parameters such as voltage, intensity and discharge temperature, which were used to train and validate the models.
The four models were able to obtain very satisfactory performances; the FBNN models of two and three input variables used supervised training, with the GDX training function, five and seven neurons in the hidden layer, respectively, achieving an optimal training. The RBNN models of two and three input variables were trained with the hybrid method, and the propagation constant had a value (c) of 1 and 80 neurons in the hidden layer.
The values for the state of charge estimation obtained by the four methods (Figure 18 and Figure 19). The results show that the models with two and three RBNN input variables have higher accuracy (Figure 23), compared to the FBNN model, respectively. The results of this work show that these models are an effective tool for the study of discharge systems of NiMH battery cells for hybrid vehicles and allow us to obtain in an optimal way their state of charge. In summary, the R^2 of the model developed with the FBNN network that models the temperature variable is 0.99015 with a CI of 95% (0.98682;0.99349). On the other hand, the R2 of the RBNN network, which models the SOC phenomenon more precisely, is 0.99182 with a CI of 95% (0.98849; 0.99516).
The validation of the networks was performed with 15% of the data obtained, which demonstrates the effectiveness of these methods, which can be used to obtain the state of charge of NiMH battery cells for hybrid vehicles. In Figure 23, the high values of R2 can be observed, especially that of the RBNN network trained without the temperature variable with a value of 0.99182, demonstrating its high predictability of the SOC even with foreign values with which it was not trained.
Parametric sensitivity is not affected when developing a model without considering the cell temperature, which implies that artificial neural networks have a high performance when modeling nonlinear systems, whose parameters are difficult to measure with time variation, so it is no longer necessary to estimate them in formulas where they are not included.
5. Recommendations
Correctly model the input variables that will describe the operation of the plant, and on which it will depend to obtain the desired output.
Obtain and correctly normalize the data to be used for the training of the artificial neural network, because the success of the neural network depends largely on the data used for training.
The first step was to analyze the behavior of artificial intelligence with neural networks; for this reason, two types of ANN with different architectures, training functions and neuron activation function were used to verify their behavior. Once satisfactory results have been obtained, it will be possible to continue working in a more robust way and consider other parameters such as the flat voltage range at the time of discharge.
The study of NiMH cells from HEV and EV vehicles becomes more important every day because these batteries have already completed their useful life cycle. For this reason, new applications emerge, such as the use of the second life of cells to store energy in home networks, because it is a less demanding system for the cell.
Author Contributions
Conceptualization, J.A.H.; methodology, J.A.H. and E.F.; software, J.A.H.; validation, J.A.H.; formal analysis, J.A.H.; investigation, H.T.; resources, J.A.H. and E.F.; data curation, J.A.H.; writing—original draft preparation, J.A.H.; writing—review and editing, J.A.H., E.F. and H.T.; visualization, J.A.H., E.F. and H.T.; supervision, E.F. and H.T.; project administration, J.A.H., E.F. and H.T.; funding acquisition, E.F. and H.T. All authors have read and agreed to the published version of the manuscript.
Funding
This research received no external funding.
Data Availability Statement
No applicable.
Conflicts of Interest
The authors declare no conflict of interest.
Nomenclature
| Symbol | Description |
| Ah | Nominal capacity [Ah] |
| I | Current [A] |
| Patm | Atmospheric pressure [atm] |
| RH | Relative humidity [%] |
| T | Temperature [°C or K] |
| V | Voltage [V] |
| Greek Symbol | |
| θ | Each neuron in the input layer |
| Subscripts | |
| c | The propagation constant |
| i,j | Unit vectors |
| w/ | With |
| w/o | Without |
| ωi | Output weight |
| Abbreviations | |
| ANN | Artificial neural network |
| BMS | Battery management system |
| BPNN | Backpropagation neural network |
| CI | Confidence interval |
| CLTC-P | China light-duty vehicle test cycle passenger cars |
| ECM | Equivalent circuit models |
| EPA | Environmental Protection Agency |
| EVs | Electric vehicle |
| FBNN | Feed-forward backpropagation neural network |
| HEV | Hybrid electric vehicle |
| ICE | Internal combustion engine |
| MAPE | Absolute percentage error |
| Li-ion | Lithium-ion battery |
| MLP | Multilayer perceptron |
| MSE | Mean square error |
| NARXNN | Exogenous input neural network model |
| NiMH | Nickel metal hydride |
| NiOH | Nickel oxyhydroxide |
| NMC | Nickel manganese cobalt |
| R^2 | Correlation coefficient |
| RBNN | Radial basis exact fit neural network |
| RMSE | Root means square error |
| SOC | State of charge |
| SOH | State of health |
| TRAINGDM | Batch gradient descent |
| TRAINGDX | Variable-learning-rate backpropagation |
| USABC | United States Advanced Battery Consortium |
| WLTC | Worldwide Harmonized Light Vehicles Test Procedure |
References
- Wei, M.; Wang, Q.; Ye, M.; Li, J. State of Charge Estimation for Lithium-Ion Battery Using Dynamic Neural Networks. In Proceedings of the 2020 International Conference on Artificial Intelligence and Electromechanical Automation (AIEA), Tianjin, China, 26–28 June 2020; pp. 23–26. [Google Scholar] [CrossRef]
- Sockeel, N.; Evans, D.; Verlohner, M.; Gafford, J.; Essakiappan, S.; Manjrekar, M.; Mazzola, M. Evaluation of a cell balancing circuit for a new type of high-power density energy storage system. In Proceedings of the 2020 IEEE Green Energy and Smart Systems Conference (IGESSC), Long Beach, CA, USA, 2–3 November 2020; pp. 1–6. [Google Scholar] [CrossRef]
- Yin, M.; Miao, H.; Dang, J.; Chen, B.; Zou, J.; Chen, G.; Li, H. High-performance alkaline hybrid zinc batteries with heterostructure nickel/cobalt sulfide. J. Power Sources 2022, 545, 231902. [Google Scholar] [CrossRef]
- Sharma, S.; Gulati, H. The Smart Energy Storage of Power Back-Up for Universal Power System Using Battery Memory Effect. In Proceedings of the 2022 International Interdisciplinary Humanitarian Conference for Sustainability (IIHC), Bengaluru, India, 18–19 November 2022; pp. 288–292. [Google Scholar] [CrossRef]
- Tang, H.; Wang, S. Life-cycle economic analysis of thermal energy storage, new and second-life batteries in buildings for providing multiple flexibility services in electricity markets. Energy 2023, 264, 126270. [Google Scholar] [CrossRef]
- Kassim, M.R.M.; Jamil, W.A.W.; Sabri, R.M. State-of-Charge (SOC) and State-of-Health (SOH) Estimation Methods in Battery Management Systems for Electric Vehicles. In Proceedings of the 2021 IEEE International Conference on Computing (ICOCO), Kuala Lumpur, Malaysia, 17–19 November 2021; pp. 91–96. [Google Scholar] [CrossRef]
- Ma, Y.; Zhu, J.; Xin, L.; Tang, Z. State of charge and state of health estimation based on dual nonlinear adaptive observer and hysteresis model of lithium-ion battery. J. Renew. Sustain. Energy 2021, 13, 044702. [Google Scholar] [CrossRef]
- Xiong, H.; Dufek, E.J.; Gering, K.L. 2.20 Batteries. Compr. Energy Syst. 2018, 2, 629–662. [Google Scholar]
- Cassayre, L.; Guzhov, B.; Zielinski, M.; Biscans, B. Chemical processes for the recovery of valuable metals from spent nickel metal hydride batteries: A review. Renew. Sustain. Energy Rev. 2022, 170, 112983. [Google Scholar] [CrossRef]
- Ray, D.K.; Roy, T.; Chattopadhyay, S. Switching transient-based state of Ampere-hour prediction of lithium-ion, nickel-cadmium, nickel-metal-hydride and lead acid batteries used in vehicles. IET Nanodielectrics 2021, 4, 121–129. [Google Scholar] [CrossRef]
- Viera Pérez, J. Carga Rápida de Baterías de Ni-Cd y Ni-MH de Media y Gran Capacidad: Análisis, Síntesis y Comparación de Nuevos Métodos. Ph.D. Thesis, En la Universidad de Oviedo, Oviedo, Spain, 2003. [Google Scholar]
- Liu, Y.; Chen, H.; Song, W.-L.; Han, H.; Lu, J.; Hou, S.; Sun, L.; Wang, S. A Lithium-ion Battery SOC Estimation Method Involving Battery Internal Temperature. In Proceedings of the 2022 6th CAA International Conference on Vehicular Control and Intelligence (CVCI), Nanjing, China, 28–30 October 2022; pp. 1–6. [Google Scholar] [CrossRef]
- Talele, V.; Patil, M.S.; Panchal, S.; Fraser, R.; Fowler, M. Battery thermal runaway propagation time delay strategy using phase change material integrated with pyro block lining: Dual functionality battery thermal design. J. Energy Storage 2023, 65, 107253. [Google Scholar] [CrossRef]
- Wahyuddin, M.I.; Priambodo, P.S.; Sudibyo, H. State of Charge (SoC) Analysis and Modeling Battery Discharging Parameters. In Proceedings of the 2018 4th International Conference on Science and Technology (ICST), Yogyakarta, Indonesia, 7–8 August 2018; pp. 2–6. [Google Scholar] [CrossRef]
- Kumar Thakur, A.; Sathyamurthy, R.; Velraj, R.; Saidur, R.; Pandey, A.K.; Ma, Z.; Singh, P.; Hazra, S.K.; Wafa Sharshir, S.; Prabakaran, R.; et al. A state-of-the art review on advancing battery thermal management systems for fast-charging. Appl. Therm. Eng. 2023, 226, 120303. [Google Scholar] [CrossRef]
- Choudhari, V.; Dhoble, A.S.; Panchal, S. Experimental and Numerical Investigation on Thermal Characteristics of 2 × 3 Designed Battery Module. SSRN Electron. J. 2022. [Google Scholar] [CrossRef]
- Braga, R.; Mevawalla, A.; Gudiyella, S.; Panchal, S.; Giuliano, M.; Nicol, G.; Zheng, Y. Transient Electrochemical Modeling and Performance Investigation Under Different Driving Conditions for 144Ah Li-ion Cell with Two Jelly Rolls. In WCX SAE World Congress Experience; SAE International: Warrendale, PA, USA, 2023. [Google Scholar] [CrossRef]
- Najeeb, M.; Schwalbe, U. Incorporating state of charge estimation methods towards more accurate monitoring of second-life lithium-ion batteries. In Proceedings of the 2022 13th International Renewable Energy Congress (IREC), Hammamet, Tunisia, 13–15 December 2022; pp. 1–6. [Google Scholar] [CrossRef]
- Najeeb, M.; Schwalbe, U. Development of a Test Method to Evaluate Lithium-Ion Batteries for Second Life in Renewable Energy Applications. In Proceedings of the International Renewable Energy Storage Conference 2021 (IRES 2021), Online, 16–18 March 2021; pp. 167–178. [Google Scholar] [CrossRef]
- Miao, J.; Tong, Z.; Tong, S.; Zhang, J.; Mao, J. State of Charge Estimation of Lithium-Ion Battery for Electric Vehicles under Extreme Operating Temperatures Based on an Adaptive Temporal Convolutional Network. Batteries 2022, 8, 145. [Google Scholar] [CrossRef]
- Xiong, R.; Huang, J.; Duan, Y.; Shen, W. Enhanced Lithium-ion battery model considering critical surface charge behavior. Appl. Energy 2022, 314, 118915. [Google Scholar] [CrossRef]
- Zhang, C.; Guo, Y.; Wang, C.; Li, S.; Curnick, O.; Amietszajew, T.; Bhagat, R. A new design of experiment method for model parametrisation of lithium ion battery. J. Energy Storage 2022, 50, 104301. [Google Scholar] [CrossRef]
- Wang, B.; Qin, F.; Zhao, X.; Ni, X.; Xuan, D. Equalization of series connected lithium-ion batteries based on back propagation neural network and fuzzy logic control. Int. J. Energy Res. 2020, 44, 4812–4826. [Google Scholar] [CrossRef]
- Quian, Y.; Zhang, Y.; Shi, G. A fuzzy adaptive sliding-mode-based SoC estimation for lithium-ion batteries in electric vehicles. Int. J. Dyn. Control 2023. [Google Scholar] [CrossRef]
- Chen, X.; Wang, S.; Xie, Y.; Fernandez, C.; Fan, Y. A novel Fireworks Factor and Improved Elite Strategy based on Back Propagation Neural Networks for state-of-charge estimation of lithium-ion batteries. Int. J. Electrochem. Sci. 2021, 16, 210948. [Google Scholar] [CrossRef]
- Xu, M.; Wu, W.; Zhou, W.; Ma, Y.; Shi, X.; Li, J. State of Charge Estimation of Low-speed Electric Vehicle Battery using Back Propagation Neural Network. In Proceedings of the 2020 IEEE Intl Conf on Parallel & Distributed Processing with Applications, Big Data & Cloud Computing, Sustainable Computing & Communications, Social Computing & Networking (ISPA/BDCloud/SocialCom/SustainCom), Exeter, UK, 17–19 December 2020; pp. 1438–1443. [Google Scholar]
- Sun, W.; Qiu, Y.; Sun, L.; Hua, Q. Neural network-based learning and estimation of batterystate-of-charge: A comparison study between direct and indirect methodology. Int. J. Energy Res. 2020, 44, 10307–10319. [Google Scholar] [CrossRef]
- Zhang, X.; Zhang, R. Estimation of Lithium Battery SOC Based on Fuzzy Unscented Kalman Filter Algorithm. In Proceedings of the 2021 IEEE/IAS Industrial and Commercial Power System Asia (I&CPS Asia), Chengdu, China, 18–21 July 2021; pp. 200–204. [Google Scholar]
- Kim, M.J.; Chae, S.H.; Moon, Y.K. Adaptive Battery State-of-Charge Estimation Method for Electric Vehicle Battery Management System. In Proceedings of the 2020 International SoC Design Conference (ISOCC), Yeosu, Republic of Korea, 21–24 October 2020; pp. 288–289. [Google Scholar] [CrossRef]
- Liu, Q.; Xu, P.; Wu, Y.; Shen, T. A hybrid genetic algorithm for the electric vehicle routing problem with time windows. Control Theory Technol. 2022, 20, 279–286. [Google Scholar] [CrossRef]
- Ranjith Kumar, R.; Bharatiraja, C.; Udhayakumar, K.; DevaKirubakaran, S.; Sekar, S.; Mihet-Popa, L. Advances in Batteries, Battery Modeling, Battery Management System, Battery Thermal Management, SOC, SOH, and Charge/Discharge Characteristics in EV Applications. IEEE Access 2023, 11, 105761–105809. [Google Scholar] [CrossRef]
- Ali, O.; Ishak, M.K.; Ahmed, A.B.; Salleh, M.F.M.; Ooi, C.A.; Khan, M.F.A.J.; Khan, I. On-line WSN SoC estimation using Gaussian Process Regression: An Adaptive Machine Learning Approach. Alexandria Eng. J. 2022, 61, 9831–9848. [Google Scholar] [CrossRef]
- Li, C.; Xiao, F.; Fan, Y. An approach to state of charge estimation of lithium-ion batteries based on recurrent neural networks with gated recurrent unit. Energies 2019, 12, 1592. [Google Scholar] [CrossRef]
- Ma, T.Y.; Faye, S. Multistep electric vehicle charging station occupancy prediction using hybrid LSTM neural networks. Energy 2022, 244, 123217. [Google Scholar] [CrossRef]
- Adedeji, B.P.; Kabir, G. A feedforward deep neural network for predicting the state-of-charge of lithium-ion battery in electric vehicles. Decis. Anal. J. 2023, 8, 100255. [Google Scholar] [CrossRef]
- Knauff, M.; McLaughlin, J.; Dafis, C.; Niebur, D.; Singh, P.; Kwatny, H.; Nwankpa, C. Simulink Model of a Lithium-Ion Battery for the Hybrid Power System Testbed. 2014. Available online: https://www.researchgate.net/publication/253731796 (accessed on 10 May 2023).
- Romo, G.; Fernández, E.; Romo Vélez, M.G. Implementación De Un Modelo De Batería Hibrida Ni-Mh En Simulink, Para Verificar Los Estados De Carga Y Salud. Master’s Thesis, Universidad del Azuay, Cuenca, Ecuador, 2019. [Google Scholar]
- Nuñez, S.; Ortiz, A. Diseño y Construcción de un Banco Para Diagnóstico de Baterías Utilizadas en Vehículos Híbridos y Eléctricos, Para el Taller “Electromecánica Gamboa”; Escuela Superior Politécnica de Chimborazo: Riobamba, Ecuador, 2021. [Google Scholar]
- Seo, G.; Ha, J.; Kim, M.; Park, J.; Lee, J.; Park, E.; Bong, S.; Lee, K.; Jong, S.; Moon, S.; et al. Rapid determination of lithium-ion battery degradation: High C-rate LAM and calculated limiting LLI. J. Energy Chem. 2022, 67, 663–671. [Google Scholar] [CrossRef]
- Movassagh, K.; Raihan, A.; Balasingam, B.; Pattipati, K. A critical look at coulomb counting approach for state of charge estimation in batteries. Energies 2021, 14, 4074. [Google Scholar] [CrossRef]
- Cajo, D.M. Análisis CFD de la Distribución de Flujos de Aire Acondicionado en el Interior de un Vehículo; Escuela Superior Politécnica de Chimborazo: Riobamba, Ecuador, 2022; p. 116. Available online: http://dspace.espoch.edu.ec/bitstream/123456789/17106/1/65T00457.pdf (accessed on 3 July 2023).
- Instituto Nacional de Meteorología e Hidrología (INAMHI) ESPOCH Agrometeorological Station. 2021, pp. 1–7. Available online: https://historicoweb.espoch.edu.ec/index.php/component/k2/item/650.html (accessed on 5 July 2023).
- Key, M.O.E. Modeling of Back-Propagation Neural Network Based State-of-Charge Estimation for Lithium_Ion Batteries with Consideration of Capacity Attenuation. Adv. Electr. Comput. Eng. 2019, 19, 3–10. [Google Scholar] [CrossRef]
- Nagulapati, V.M.; Lee, H.; Jung, D.W.; Brigljevic, B.; Choi, Y.; Lim, H. Capacity estimation of batteries: Influence of training dataset size and diversity on data driven prognostic models. Reliab. Eng. Syst. Saf. 2021, 216, 108048. [Google Scholar] [CrossRef]
- Wang, H.; Chen, B.; Lin, C.; Sun, Y. Neural-network-based decentralized output-feedback control for nonlinear large-scale delayed systems with unknown dead-zones and virtual control coefficients. Neurocomputing 2021, 424, 255–267. [Google Scholar] [CrossRef]
- Kasihmuddin, M.S.M.; Mansor, M.A.; Alzaeemi, S.A.; Sathasivam, S. Satisfiability Logic Analysis Via Radial Basis Function Neural Network with Artificial Bee Colony Algorithm. Int. J. Interact. Multimed. Artif. Intell. 2021, 6, 164–173. [Google Scholar] [CrossRef]
- Zhang, X.; Jin, Y.; Zhang, R.; Dong, H. Lithium Battery SOC Prediction Based on Improved BP Neural Network Algorithm. In Proceedings of the 2021 3rd Asia Energy and Electrical Engineering Symposium (AEEES 2021), Chengdu, China, 26–29 March 2021; pp. 882–886. [Google Scholar] [CrossRef]
- Zhang, B.; Ren, G. Li-Ion Battery State of Charge Prediction for Electric Vehicles Based on Improved Regularized Extreme Learning Machine. World Electr. Veh. J. 2023, 14, 202. [Google Scholar] [CrossRef]
- Jeong, D.; Bae, S. Estimating battery state-of-charge with a few target training data by meta-learning. J. Power Sources 2023, 553, 232238. [Google Scholar] [CrossRef]
- Yang, F.; Li, W.; Li, C.; Miao, Q. State-of-charge estimation of lithium-ion batteries based on gated recurrent neural network. Energy 2019, 175, 66–75. [Google Scholar] [CrossRef]
Disclaimer/Publisher’s Note: The statements, opinions and data contained in all publications are solely those of the individual author(s) and contributor(s) and not of MDPI and/or the editor(s). MDPI and/or the editor(s) disclaim responsibility for any injury to people or property resulting from any ideas, methods, instructions or products referred to in the content. |
© 2023 by the authors. Licensee MDPI, Basel, Switzerland. This article is an open access article distributed under the terms and conditions of the Creative Commons Attribution (CC BY) license (https://creativecommons.org/licenses/by/4.0/).