Article

Autonomous Parking Space Detection for Electric Vehicles Based on Improved YOLOV5-OBB Algorithm

1
School of Mechanical and Automotive Engineering, Shanghai University of Engineering Science, Shanghai 201620, China
2
Voyager Technology lnc, Shanghai 201517, China
*
Author to whom correspondence should be addressed.
World Electr. Veh. J. 2023, 14(10), 276; https://doi.org/10.3390/wevj14100276
Submission received: 12 August 2023 / Revised: 12 September 2023 / Accepted: 28 September 2023 / Published: 2 October 2023
(This article belongs to the Special Issue Recent Advance in Intelligent Vehicle)

Abstract

:
Currently, in the process of autonomous parking, the algorithm detection accuracy and rate of parking spaces are low due to the diversity of parking scenes, changes in lighting conditions, and other unfavorable factors. An improved algorithm based on YOLOv5-OBB is proposed to reduce the computational effort of the model and increase the speed of model detection. Firstly, the backbone module is optimized, the Focus module and SSP (Selective Spatial Perception) module are replaced with the general convolution and SSPF (Selective Search Proposals Fusion) modules, and the GELU activation function is introduced to reduce the number of model parameters and enhance model learning. Secondly, the RFB (Receptive Field Block) module is added to fuse different feature modules and increase the perceptual field to optimize the small target detection. After that, the CA (coordinate attention) mechanism is introduced to enhance the feature representation capability. Finally, the post-processing is optimized using spatial location correlation to improve the accuracy of the vehicle position and bank angle detection. The implementation results show that by using the improved method proposed in this paper, the FPS of the model is improved by 2.87, algorithm size is reduced by 1 M, and the mAP is improved by 8.4% on the homemade dataset compared with the original algorithm. The improved model meets the requirements of perceived accuracy and speed of parking spaces in autonomous parking.

1. Introduction

Autonomous parking systems for self-driving vehicles are crucial, of which parking space detection [1,2,3] is a key component. Most of the on-board parking assistance systems on the market today are based on very high-computing-power chips and a wide variety of sensors, etc. In order to develop a lower-cost autonomous parking system, it is necessary to develop it based on a low-computing-power embedded chip. Previous parking space detection methods [4,5,6,7] are mainly based on traditional computer vision techniques such as edge detection, corner detection, histograms, and feature matching. For example, Hamada et al. [8] extracted parking space lines using the Hough transform method and inferred parking spaces using geometric constraints, but it is only applicable to parking space scenarios with very good illumination conditions. Bui et al. [9] separated fixed parking space lines by a line segment clustering method. These methods perform poorly when dealing with different car park lighting conditions and variations in the appearance of parking spaces.
In recent years, deep-learning-based methods have been able to extract high-level features from input images and perform location estimation and classification of parking spaces. Methods based on deep learning are mainly divided into target detection methods and semantic segmentation methods, and target detection methods are further divided into one-stage detection and two-stage detection. Li et al. [10] used the deep learning method to predict the location, type, and orientation of parking space corner points and then grouped the corner points using geometrical rules to infer the presence of parking spaces. However, this method can only detect perpendicular and parallel rectangular parking slots. Zhang et al. [11] proposed a two-stage target detection method, DeepPS, which first uses YOLOV2 to detect the corners of parking spaces and then obtains the parking space type and direction matching of parking spaces through local image classification networks and templates. This method can effectively detect different kinds of parking spaces, but it requires two deep neural networks, which makes inference time too slow and the amount of model parameters too large for embedded end deployment.
Zhou et al. [12] proposed an attentional semantic segmentation and instance matching method to improve the accuracy of parking space detection, but it can only be applied to AVP systems, and the attention structure is difficult to deploy to some embedded platforms. Cao et al. [13] proposed a method based on VPS-Net [14] hat can detect different kinds of sign points, but the prediction of parking spaces with different lengths was inaccurate. Li et al. [15] proposed a semantic-segmentation-based method to improve the detection of parking spaces, but the number of arithmetic resources consumed was very high, most vendors are currently trying to deploy autonomous parking systems in low-computing-power embedded platforms with only 1–3 TOPS of arithmetic power, and the arithmetic power is unable to meet the requirement. We are based on a one-stage target detection method, which can not only detect parking spaces with angles but also has low model complexity and a fast detection rate, which are suitable for deploying embedded chips with low computing power.
Other methods [9,10,11,12,13,14,15,16,17] and datasets [11,15] can only detect and infer a parking space during the autonomous parking process and cannot determine whether there are obstacles (such as ice cream cones, floor locks, etc.) in the parking space. Therefore, the method and dataset we proposed are based on purely visual parking space detection, which can complete the detection of parking spaces and obstacles around the vehicle based on a single image. The method in this article de-distorts the images from the left and right fish-eye cameras and splices them into a bird’s-eye view with a size of 128 × 416. The front and rear fish-eye cameras do not need to be de-distorted but directly splice them into an image with a size of 288 × 208 and splice it into an image with a size of 416 × 416. The pictures are passed into the network model for detection, and finally the target detection results are sent to the planning control module. The process is shown in Figure 1.
The main contributions of our work can be summarized as follows:
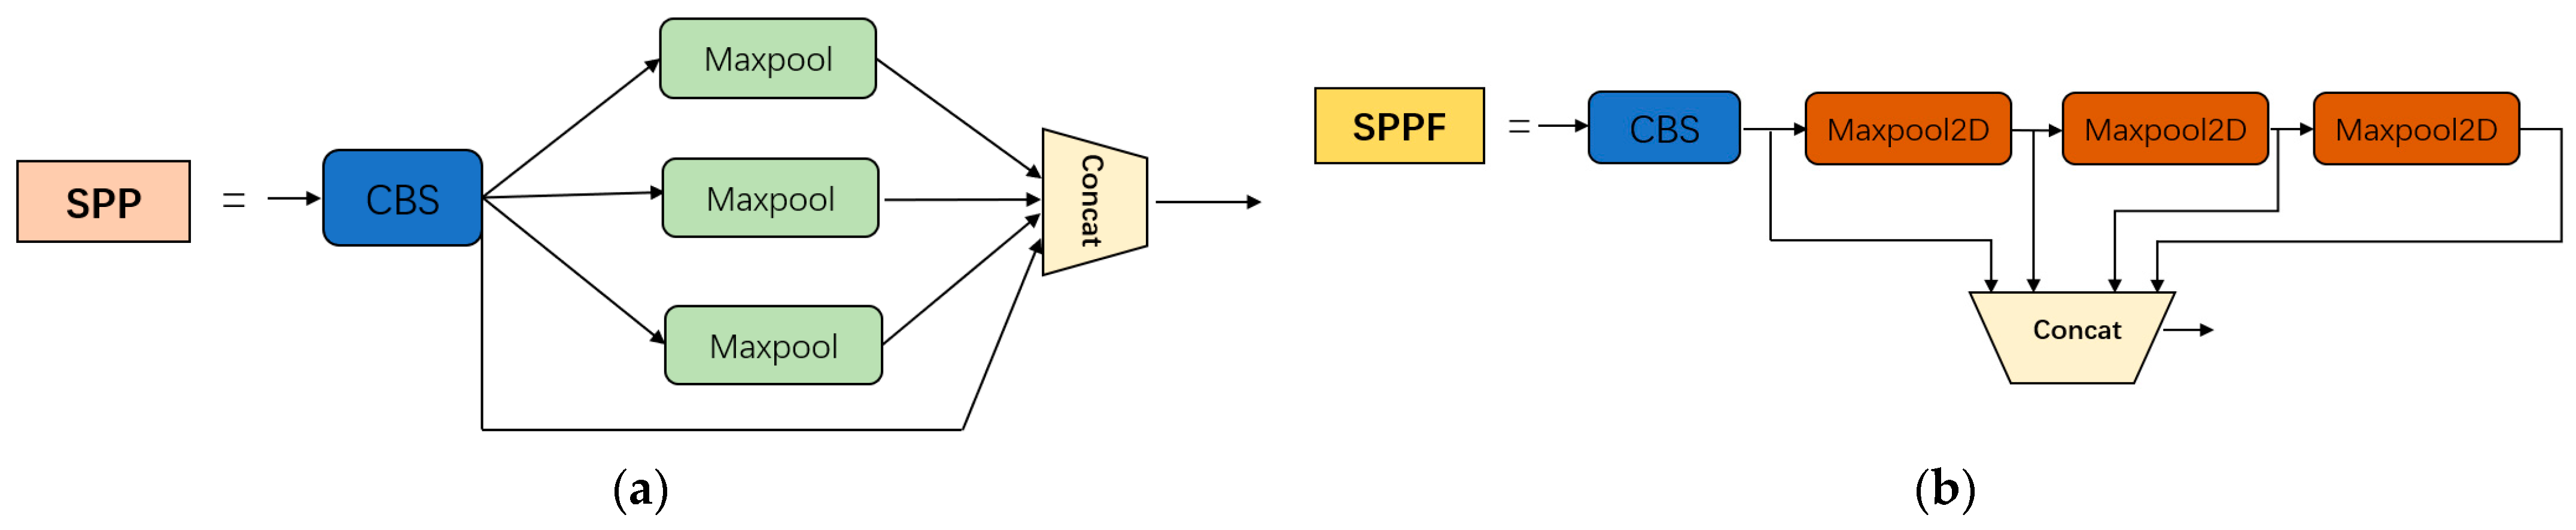
  • Improved RFB and CA modules are added to the original yolov5-OBB algorithm to enhance the generalization ability of the model in complex scenarios such as darkness, while replacing the Focus and SSP structures to reduce the number of parameters in the computation and accelerate the model inference rate.
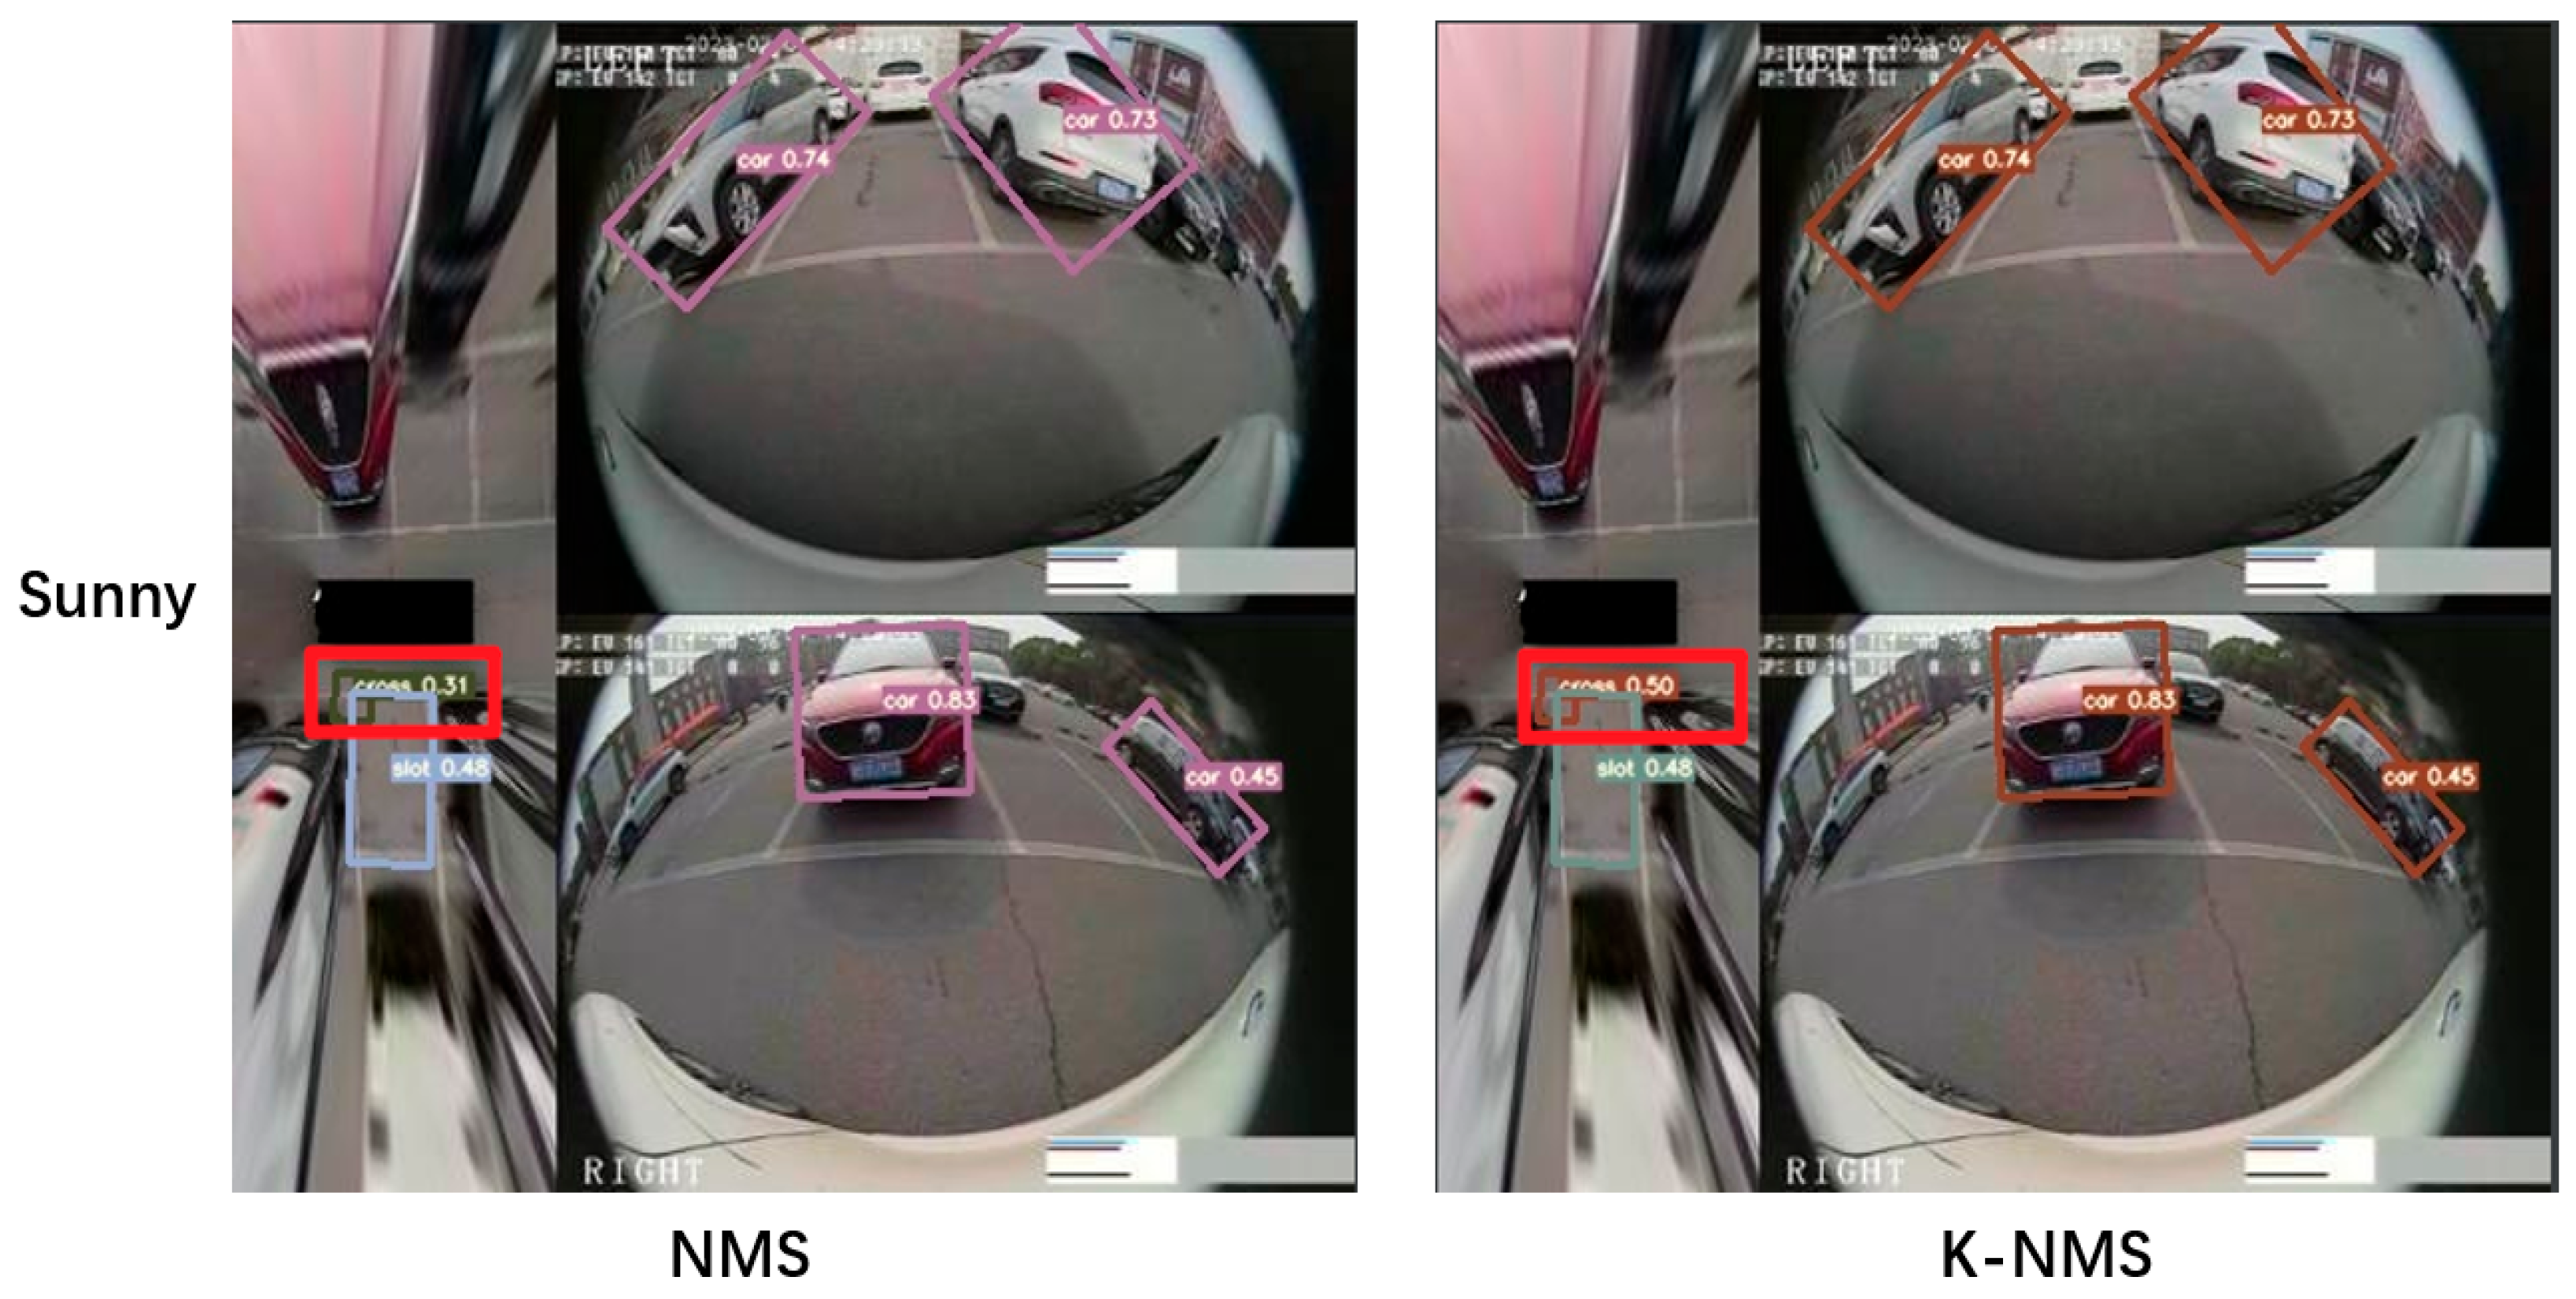
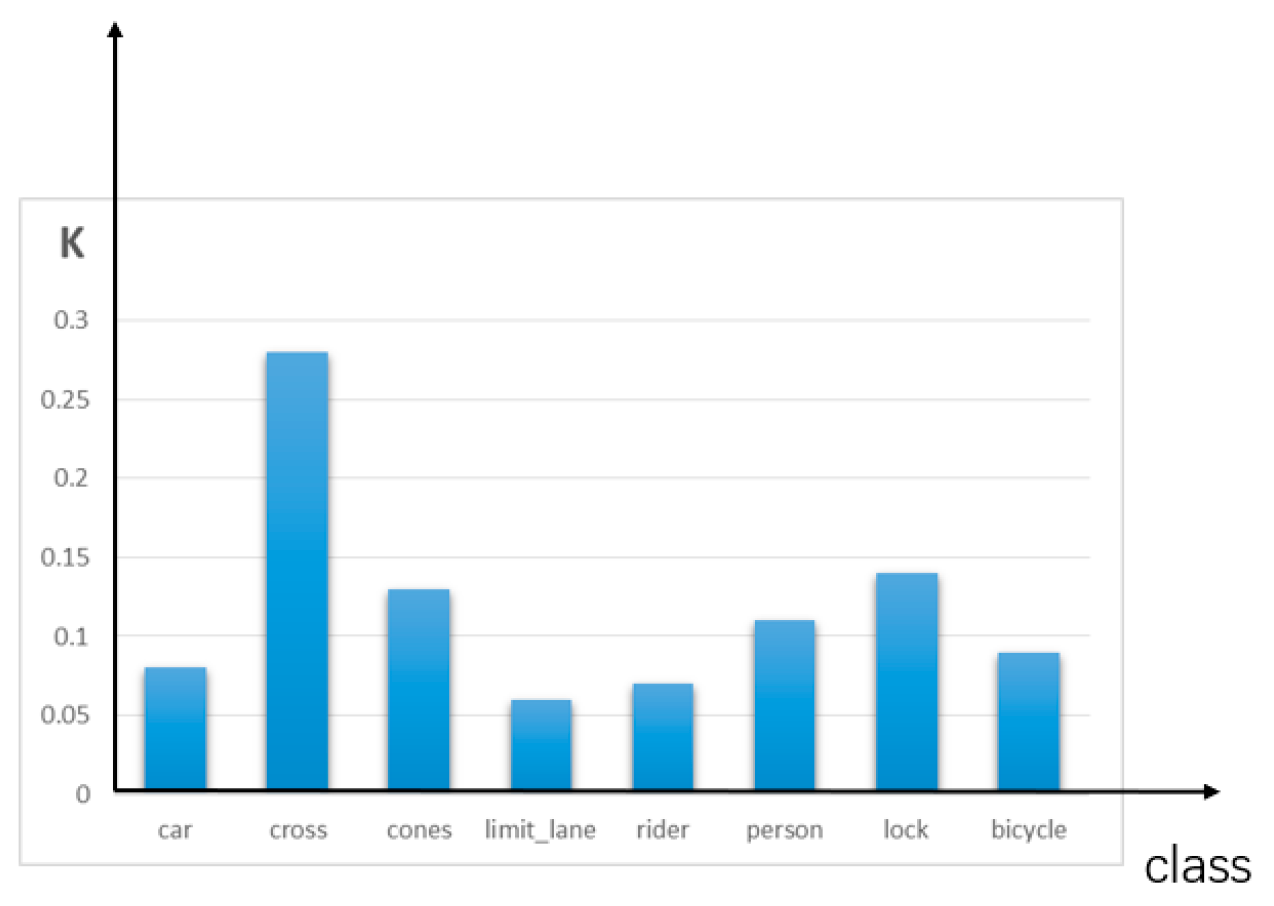
  • Correlation modeling of the existing a priori knowledge of the simultaneous occurrence of parking spaces and storage corners and setting the penalty factor K to improve the confidence level of the detection of parking spaces and storage corners.
  • A standard evaluation method for target detection was used through comparative experiments and ablation experiments of the original algorithm on a homemade parking space detection dataset as well as on a publicly available dataset, and the results show that our algorithm is competitive in terms of real-time and detection accuracy in complex scenarios such as nighttime.
The rest of this paper is organized as follows. Section 2 introduces the detection method of the rotating target frame based on YOLOv5. Section 3 introduces the improved YOLOv5-OBB algorithm in detail. Section 4 describes the experiments and analysis. We summarize the paper in Section 5.

2. YOLOv5-OBB Detection Algorithm
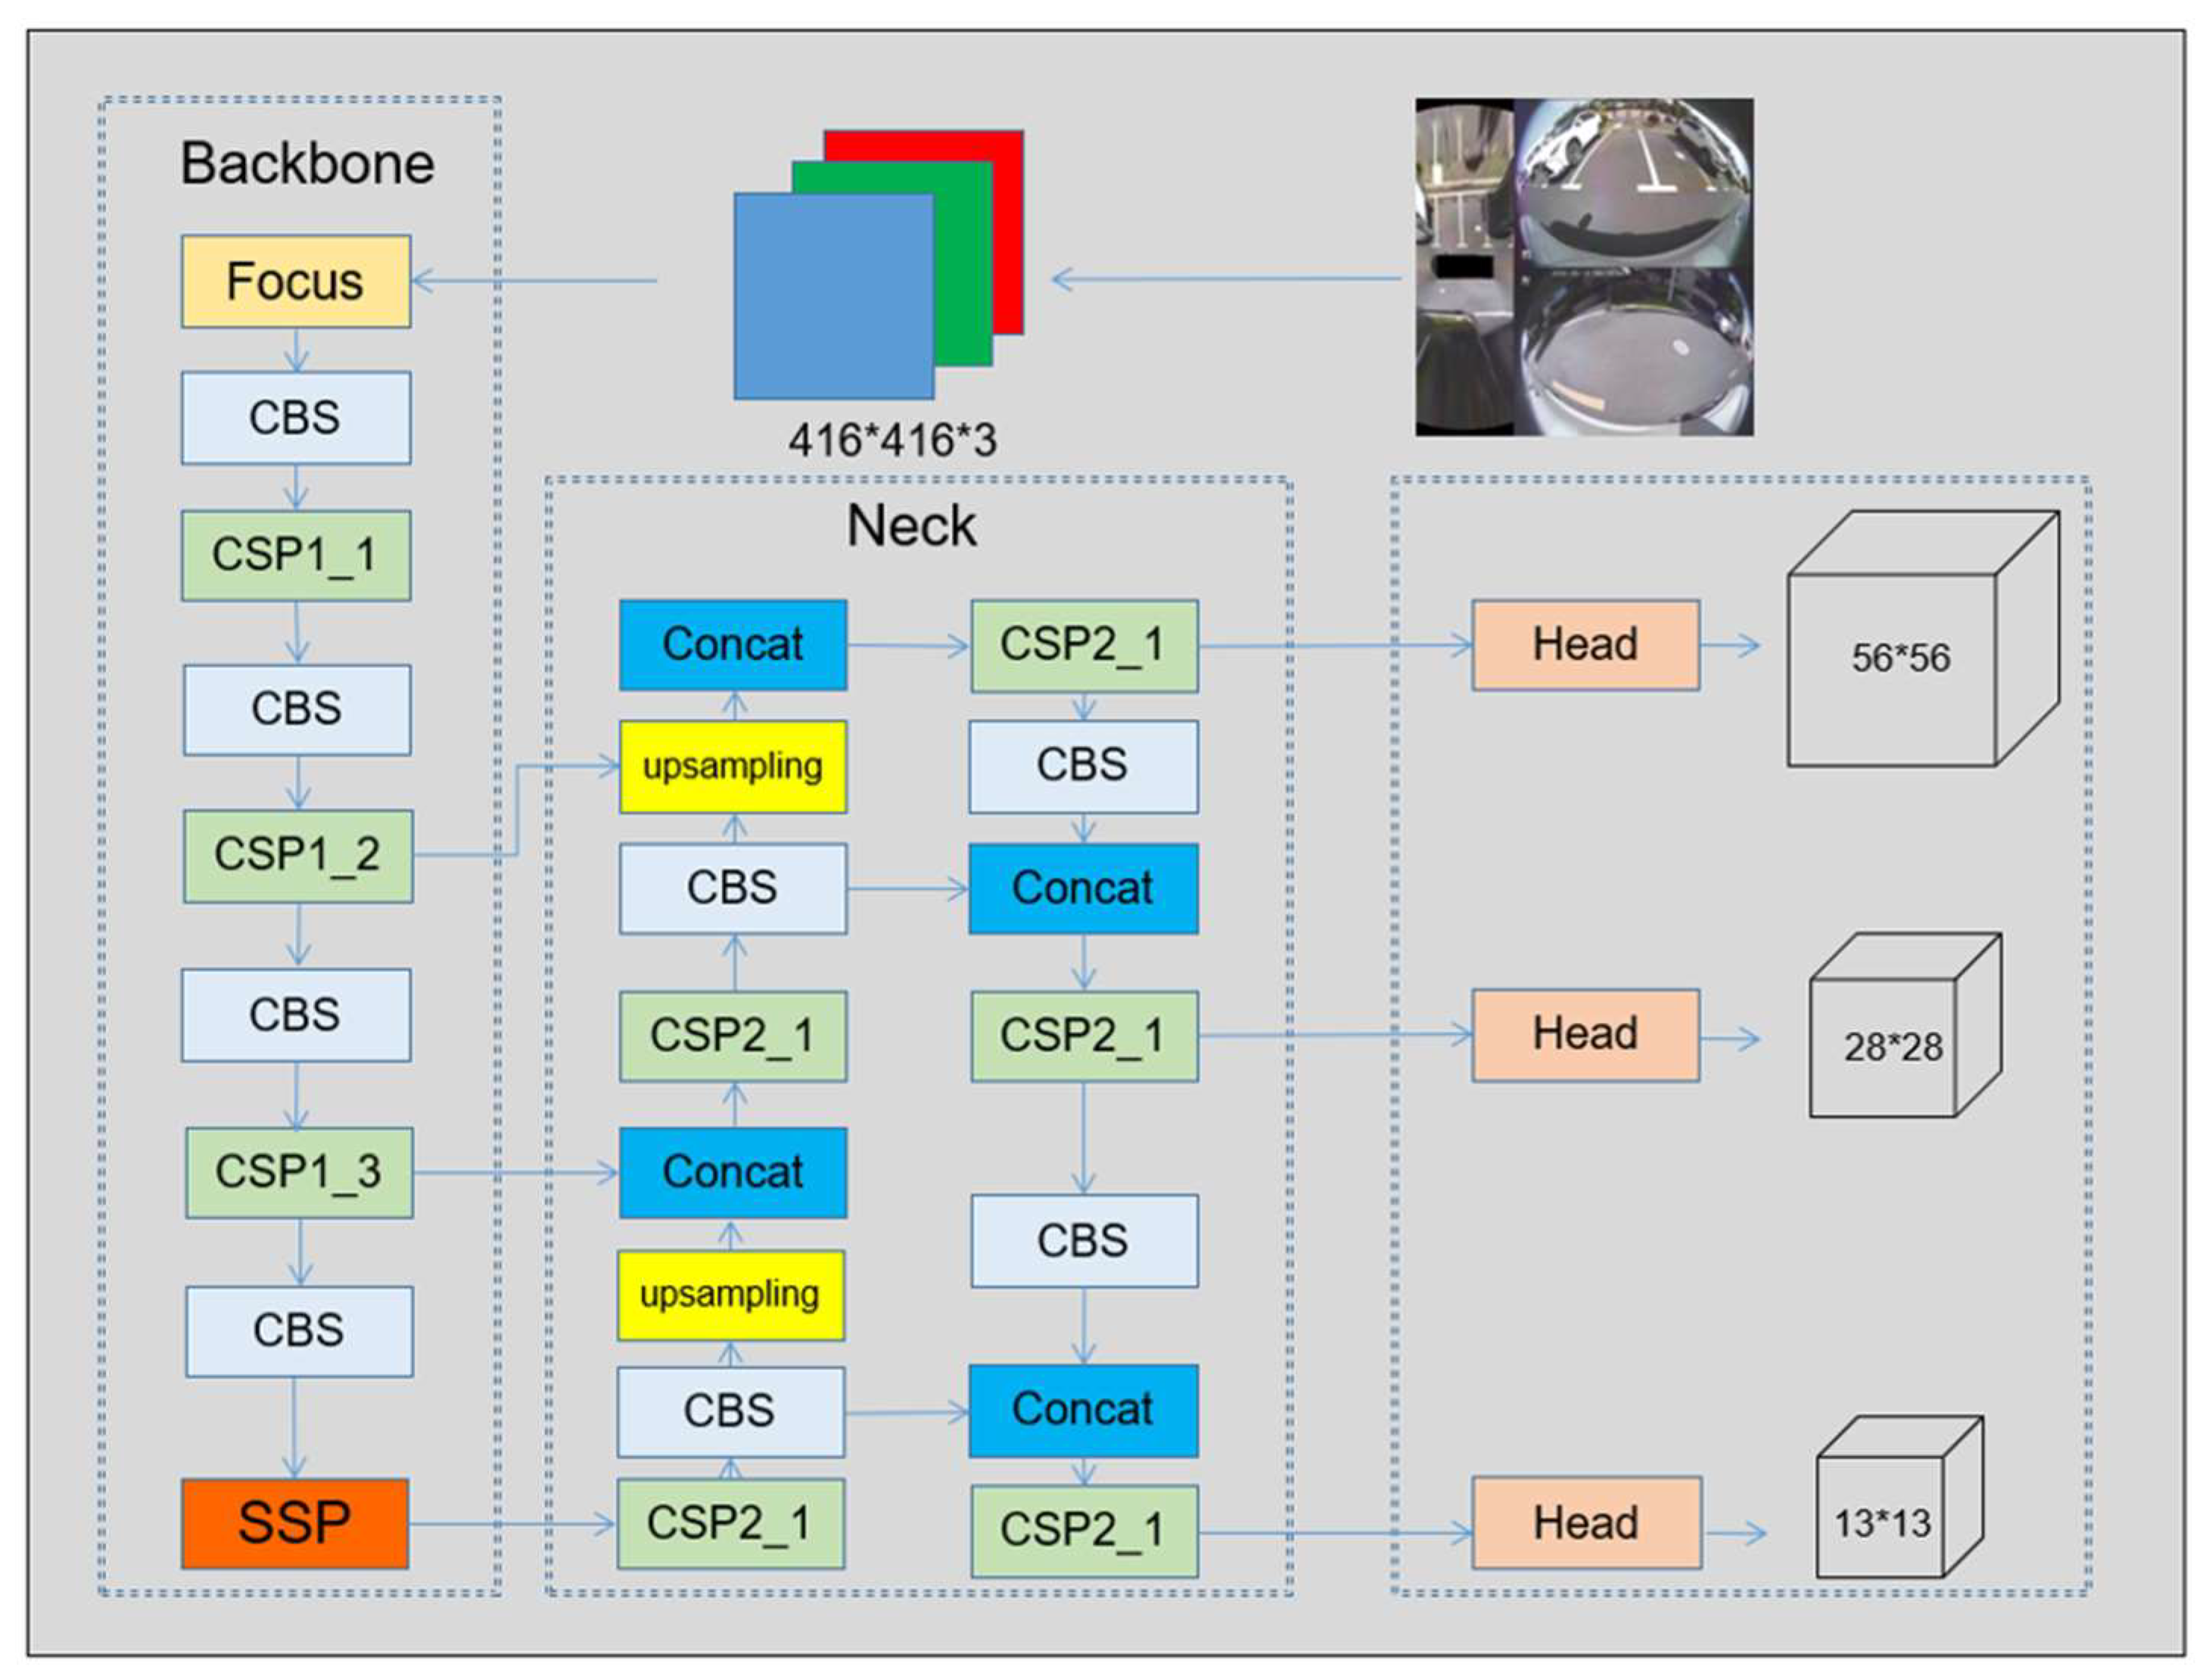
2.1. YOLOv5s Model

YOLOv5-OBB (You Only Look Once v5-oriented bounding boxes) is based on YOLOv5 with the addition of target box angle prediction to predict the rotated target box. Firstly, the YOLOV5 model has superior performance and has received wide recognition in academia and industry. It has five versions with different model sizes, n, s, m, l, and x, which correspond to different network depths and widths. Here, in order to meet the real-time requirements of the model deployed in the embedded chip platform, the YOLOV5s model was finally selected, and the network structure is shown in Figure 2.
Input side: CutMix, Mosic, and other high-level data enhancement methods are used to stitch four pictures into one picture with random adaptive filling. This not only enriches the dataset but also corresponds to the reduction in batch-size and training arithmetic and also optimizes the model’s detection effect on small targets, robustness, and generalization of the model. Adaptive anchor frame computation and adaptive image scaling methods are also used.
Backbone: CSPDarknet [18] is used to extract features mainly from the input image. The Focus module is used for feature extraction to reduce the number of computational parameters. The CSP network is used to optimize the problem of huge computation caused by the repetition of gradient information in the CSP network and for better fusion with the features extracted by the previous network.
Neck: The PANet module is used to fuse different feature modules. The FPN delivers high-level semantic features by upsampling, combining high-level semantic information with low-level detail information to achieve cross-scale feature fusion, and the PAN delivers localization features and bottom-level semantic information by downsampling, which delivers and aggregates cross-level information inside the feature pyramid, enabling the network to better capture the target’s detail features and contextual information, thus improving the accuracy and robustness of the target detection.
Output: prediction is performed on feature maps of different sizes, in which feature maps of 52 × 52, 26 × 26, and 13 × 13 sizes predict large, medium, and small targets, respectively.

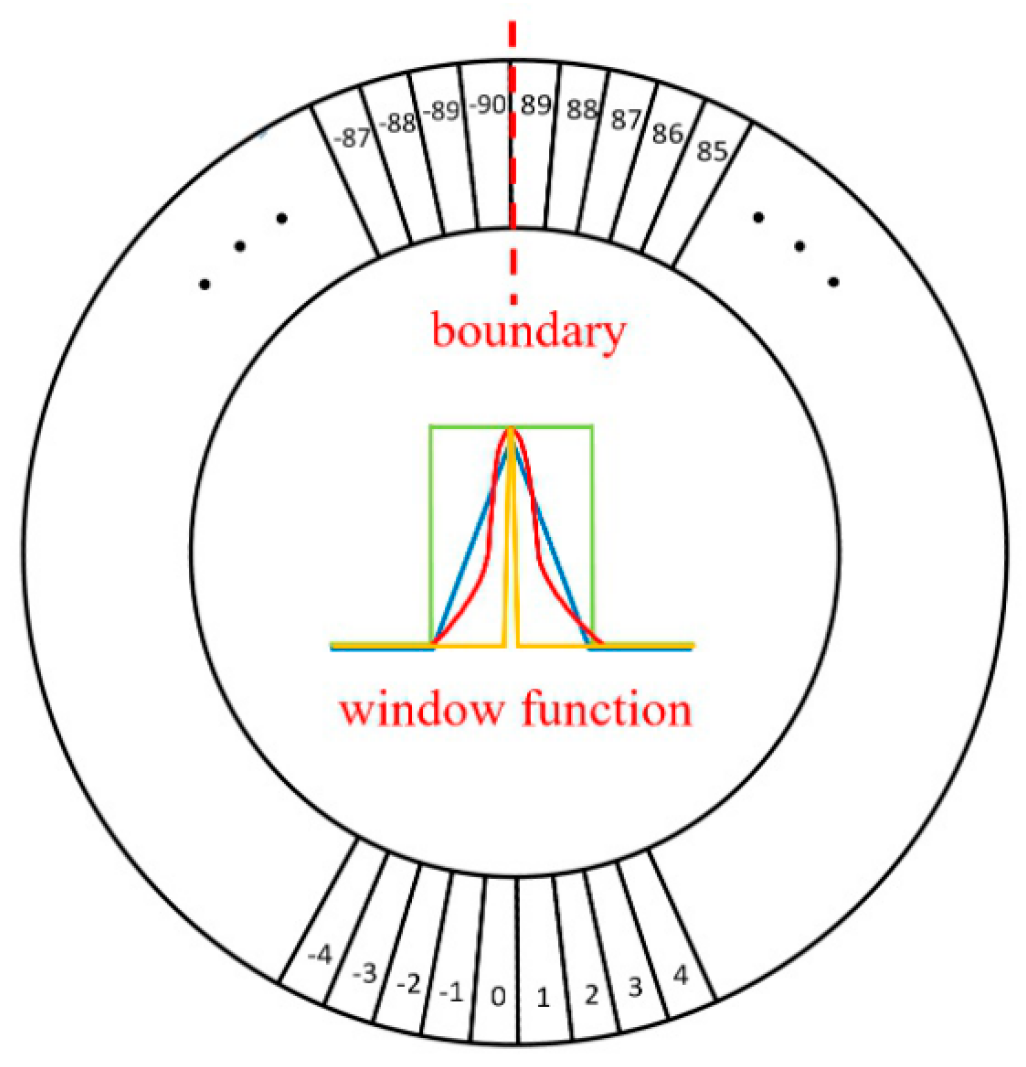
2.2. Circular Smooth Labels for Angle Classification

The method of predicting angles using regression can result in predictions outside of our defined range, leading to an angular boundary problem that produces a large loss value. So, YOLOv5-OBB employs the method of circular smoothing labels [19], as shown in Figure 3. The angular regression approach is converted into a classification form, discretizing the continuous problem directly and avoiding the boundary case. This way, since the classification results are finite, they do not go beyond the cases outside the defined range. This also addresses the fact that the classification loss cannot measure the angular distance between the predicted result and the labels; if GT (ground truth) is 0 degrees, the loss value is the same when we predict it as 1 degree and −90 degrees, as shown in Equation (1):
CSL ( x ) = g ( x ) ,   θ r < x < θ + r 0 , otherwise
where is the window function, which needs to satisfy the properties of periodicity, symmetry, monotonicity, maximum value, etc. It can generally be an impulse function, rectangular function, trigonometric function, and Gaussian function, r is the radius of the window function, and θ denotes the angle of the current enclosing frame. The setting of the window function allows the model to measure the angular distance between the predicted labels and the ground truth labels, i.e., the closer the predicted value is to the true value within a certain range, the smaller the loss value is. Moreover, the problem of angular periodicity is solved by introducing periodicity, i.e., even if the two degrees, 89 and -90, turn out to be near neighbors.

3. Improvement of YOLOv5-OBB

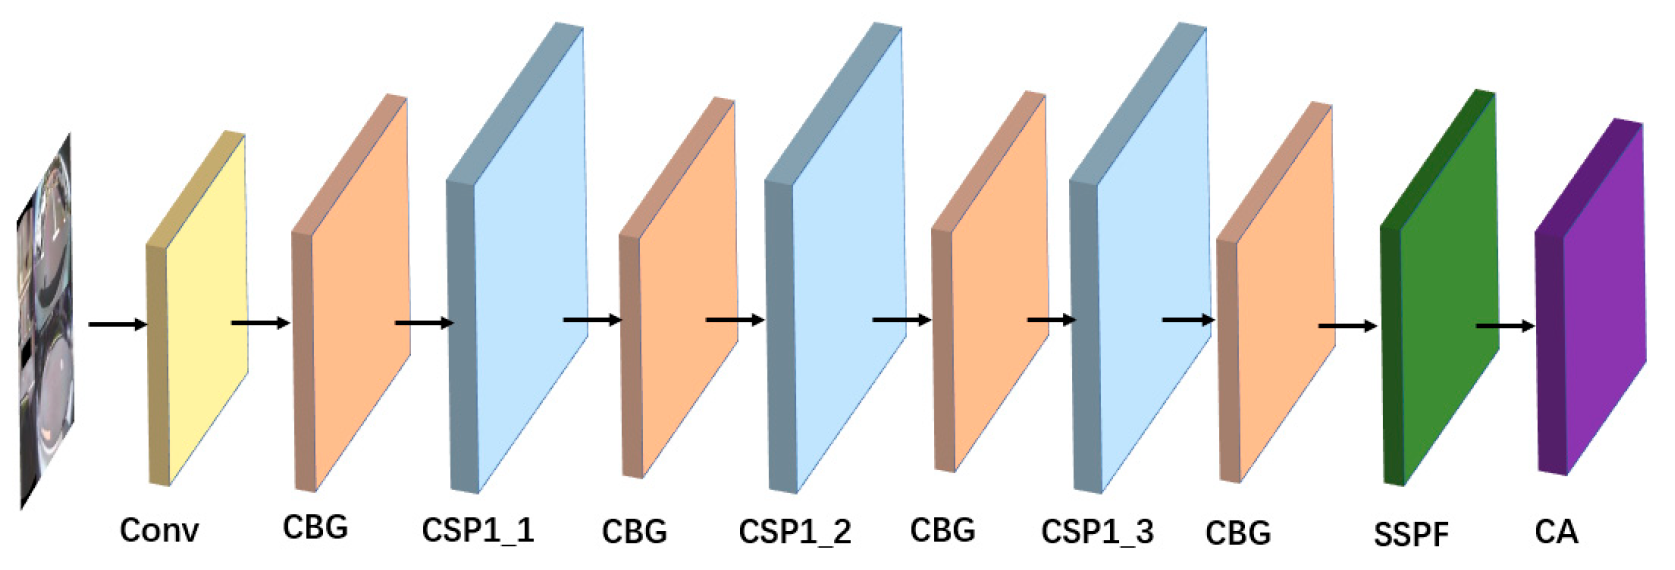
3.1. Optimizing the Backbone Extraction Module

In YOLOv5, the Focus module is introduced prior to the input layer of the backbone. This module selectively samples every other element from the feature layer of the image, effectively downsampling the image size by two while increasing the number of channels from 3 to 12. Subsequently, these channels are concatenated through a splicing operation. In an effort to optimize computational efficiency and expedite model inference, the Focus operation is tactically replaced with a standard convolution operation featuring a 6 × 6 convolution kernel and a stride of two. This strategic replacement not only addresses potential compilation issues on certain embedded chip platforms associated with the Focus operator but also significantly reduces the computational workload.
Inspired by SPP-net [20], the SPP module is a pooling layer that is used to perform pooling operations on the input feature maps at different scales. Its main purpose is to solve the problem of mismatching in the sensory field size of the CNN when different object sizes appear in the image. The main idea of the SPP module is to create pooling layers of different sizes to capture the feature information at different scales. It is introduced in the YOLOv3-SPP [21] network to achieve feature fusion at different scales, which significantly improves the network detection accuracy. As shown in Figure 4a, the SPP structure achieves feature fusion at different scales by passing the input features through the maximum pooling layers of convolutional kernel sizes 13 × 13, 9 × 9, and 5 × 5 in parallel and then splicing the different output features. The SPPF module is an improved version of the SPP module combined with the FPN (Feature Pyramid Network). The FPN [22] is designed to solve the problem of scale invariance in object detection tasks by fusing different layers of feature maps to deal with objects of different sizes. The difference between the SPPF and the SPP lies in the fact that the SPPF inputs the output features into the three maximum pooling layers of size 5 × 5 in sequence, splices the output results of each layer, and then splices them together. Each layer’s output is spliced, as shown in Figure 4b. SPPF is less computationally intensive and faster than SPP. In this paper, the SPP structure is replaced with the more efficient SPPF structure.
Replacing the SiLU (Sigmoid linear unit) activation function in the CBS structure of the backbone network in YOLOv5-OBB with the GELU (Gaussian error linear unit) [23] function improves the generalization ability of the network. The GELU has shown good performance in a variety of tasks and networks, e.g., replacing the activation function ReLU with the GELU in ConvNext [24] improves the performance of the ReLU (rectified linear unit) by 0.7% on the ImageNet dataset, while the number of parameters is also reduced.
The GELU combines the properties of dropout, zoneout, and the ReLU, and its calculation formula is Equation (2). At the input side, the GELU activation function exhibits an approximately linear feature, which can better adapt to most of the features of the input data and can improve the model’s learning and expression ability. A comparison of the SiLU and GELU functions is shown in Figure 5.
GELU = 0.5 x ( 1 + tanh ( 2 π ( x + 0.044715 x 3 ) ) )

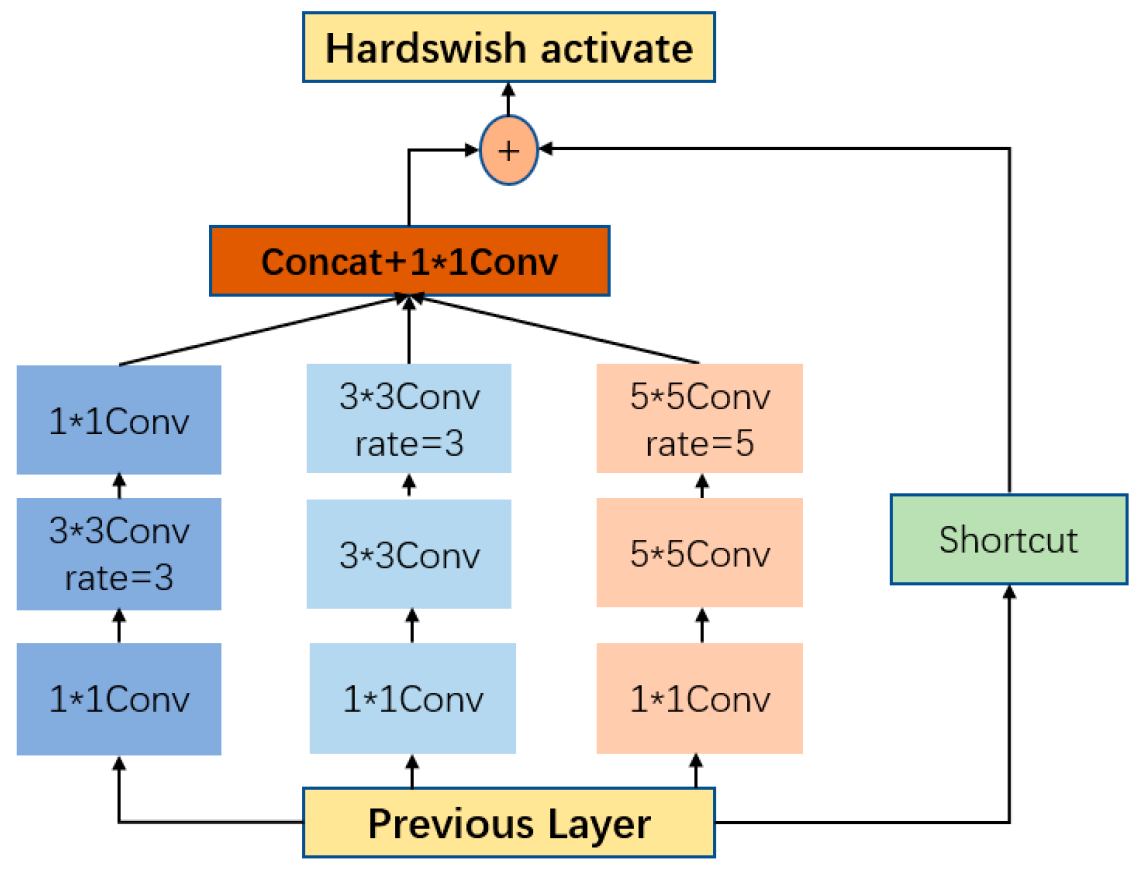
3.2. Introduction of Improved RFB Modules

In the process of autonomous parking, information about the position of the corners is needed. Since the corners are small targets [25], there will be overlapping areas with the rectangular box of the parking space, leading to an overall decrease in the model’s detection accuracy of the corners and the parking space. Of the three detection output heads of YOLOv5, the detail information on the 52 × 52 feature map is richer, which is helpful for the detection of small targets such as the corners of the corners. However, due to the small receptive field of the feature map, it lacks richer contextual and semantic information. In order to increase the semantic information of the receptive field and context, the improved RFB (Receptive Field Block) module is introduced in YOLOv5-OBB. Inspired by Inception [26], the RFB [27] module contains convolutional layers with different sizes of convolutional kernels, and these convolutional layers are formed into different multi-branch structures of the improved RFB. In order to increase the receptive field and improve the detection accuracy of small targets, different sizes of cavity convolutions are introduced to give the model a more powerful feature representation.
As shown in Figure 6, the improved RFB module first passes the previously output feature maps through 1 × 1 convolution, changes the number of channels of the feature maps, adjusts the number of output channels, and introduces an activation function to increase the nonlinearity and improve the model’s expressive ability. Then, the null convolution with dilation rate = 1, dilation rate = 3, and dilation rate = 5 is mapped in each branch to increase the sensory field of the model. After that, the output of the feature maps of the three branches are concatenated and output through 1 × 1 convolution to achieve the purpose of fusion of different features. Finally, a shortcut operation is added to create jump connections, which are residual connections to prevent gradient vanishing and gradient explosion problems during training.

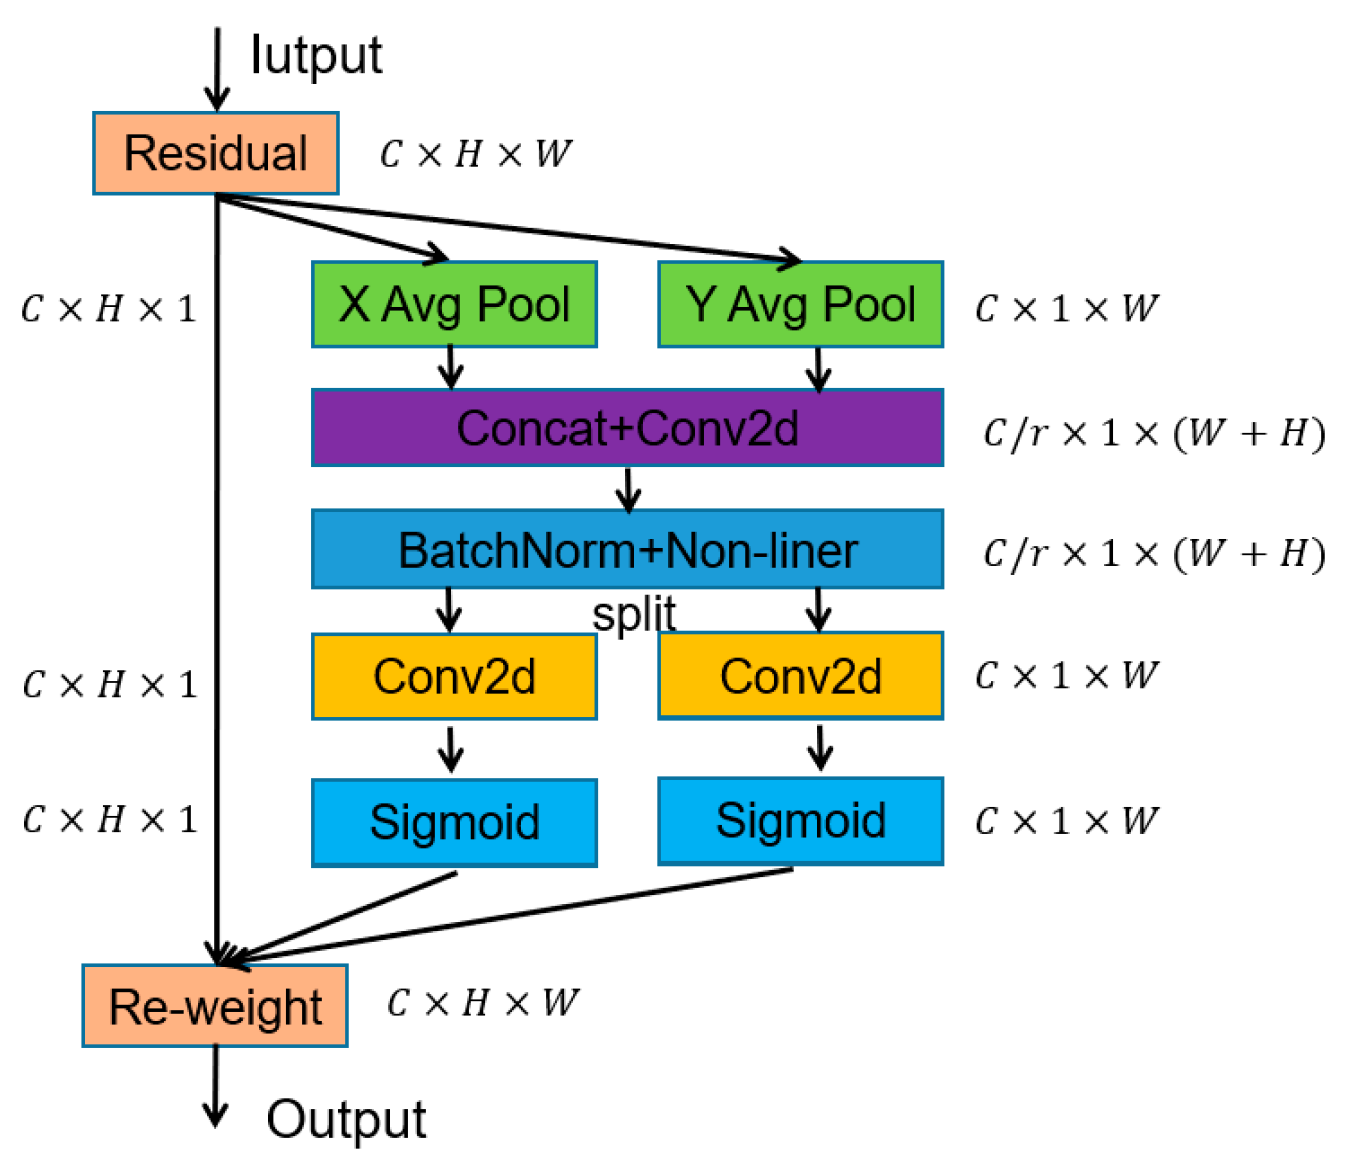
3.3. Increased CA Mechanisms

When in an underground garage with weak lighting conditions or at night, the outline of a parking space cannot be recognized, and the neck network structure of YOLOV5 focuses on deep feature fusion, which leads to a large number of details being lost, thus causing a large number of missed and false detections. In order to improve the recognition rate and reduce the impact of lighting conditions, this paper introduces the CA (coordinate attention) mechanism [28] in the back-end of the backbone network and the up-adoption stage of feature extraction to enhance the feature expression ability of the model. However, most of the current attention mechanisms (e.g., CBAM [29], SE [30]) generally use global maximum pooling or average pooling, which will lose the object spatial information. In contrast, the CA mechanism goes beyond simply incorporating a channel attention mechanism; it also incorporates a spatial attention mechanism. This spatial attention mechanism allows for the incorporation of positional information within the channel attention mechanism.
The CA mechanism consists of two main parts, namely coordinate information embedding and coordinate attention generation. As shown in Figure 7, given input X, two spatial extensions (1 × W) and (1 × H) of the pooling kernel are used to encode each channel along horizontal and vertical coordinates, respectively. The outputs are cascaded and then sent to a shared (1 × 1) convolutional transform. The spliced feature maps are sent to Batchnorm and Nonlinear to encode spatial information in the vertical and horizontal directions. The output then is split into two separate tensors. Using two other (1 × 1) convolutional transforms, they are converted into tensors with the same number of channels to the input X, respectively, to obtain f R C × H × 1 and f R C × 1 × W . Then, under the Sigmoid activation function, two attentional weight maps in the spatial direction are obtained, and each attentional weight feature map has a long-term dependency in a particular direction. Finally, the input feature maps are multiplied with the two weights to enhance the representativeness of the feature maps.
In order to reduce the false detection rate and improve the detection accuracy under weak lighting conditions, the algorithm pays more attention to the important features during inference. The CA mechanism is added to the backbone of YOLOV5s, and the improved backbone network is shown in Figure 8. Not only does it not increase the excessive number of parameters and model computation of the network, but it also facilitates the extraction of important feature information. The optimization effect on the dataset is shown in Figure 9, which further improves the prediction score and reduces the false detection rate for data with less feature information.

3.4. Location-Rule-Based NMS Improvement

Currently, there is a notable decrease in the detection accuracy of parking spaces when depot corners are included in the training data. This decline in accuracy can be attributed to the spatial overlap between different categories of depot corners and parking spaces. Consequently, the model encounters challenges in accurately defining bounding boxes and category labels for these objects during both training and testing phases. This not only results in reduced bounding box accuracy but also introduces confusion in category labels.
Therefore, it is imperative to optimize the detection of parking spaces and library corners. Presently, post-processing algorithms predominantly emphasize non-maximum suppression methods, which filter out target boxes with confidence scores below a predefined threshold and those with significant positional overlap as determined by the intersection over union (IOU) metric. Leveraging prior knowledge, we have observed that most parking spaces align with library corners and exhibit strong positional correlation. To account for this correlation, we introduced a penalty factor, denoted as K, and incorporated it into existing post-processing algorithms. This strategic inclusion enhances the detection accuracy of both parking spaces and bank corners.
Referring to DIOU [31] loss function in modeling the similar relationship between two target frames in terms of spatial location, the concept of centroid distance is introduced. As shown in Figure 10, the correlation function is constructed by calculating the distance between the centroids of the parking space frame and the library corner frame and the diagonal lengths of the target frames of both. In Equation (3), where d 1 and d 2 represent the diagonal lengths of the two detection frames, respectively, p ( b 1 , b 2 ) represents the distance between the center points of the two detection frames. K is the correlation coefficient of the two spatial locations, and the more spatially related the two target frames of different categories are, the larger the calculated value of K. The correlation coefficient of K is the correlation coefficient between the two target frames.
K = e p ( b 1 , b 2 ) max ( d 1 , d 2 )
Then, we need to determine the specific value of the correlation coefficient K. We statistically calculate the distance between the parking space frame and the other category frames on the 20,000 training sets of the homemade dataset, sequentially find the K value between the parking space and the corner of the warehouse, vehicles, pedestrians, and so on, and then sum up and take the average. From Figure 11, we can see that the K-value correlation between the parking space and the corner of the warehouse (cross) is the highest and is much larger than that of the other categories, so we set the K-value to be greater than 0.25 when we process the non-extremely large value suppression based on the location rule and consider that the two target frames are spatially strongly correlated.
Inspired by the formula of soft-NMS [32], when the correlation score is smaller than the set value of K, no change is made and the original prediction score is retained; when the correlation score is larger than the set value of K, the new prediction score grows linearly, and the optimization function (4) is constructed to be used to optimize the two strongly correlated objective boxes, where S max represents the detection box with the highest confidence, S i represents the non-optimization score of the current target box, and S i n e w represents the optimized confidence score of the current target frame.
s i n e w = s max × K + s i K > 0.25 s i o t h e r
The above optimization method is added to the non-maximal value suppression, called K-NMS, and the algorithm process starts with iteratively traversing to optimize all the target frames, where is the maximum confidence of the candidate target frames in the picture, the confidence of the other target frames, and is the optimized confidence. As shown in Figure 12, if two target frames of different categories are strongly correlated, the confidence of the target frame with lower confidence is optimized according to the correlation coefficient of the two target frames. Firstly, K-value calculation is performed by Equation (3) for all the different categories of target boxes in Figure 12 and is then based on the K-value with the help of Equation (4) optimizing the confidence of the target boxes. The result is shown in Figure 12, which improves the confidence of the car parking spaces.

4. Experimental Results and Analyses
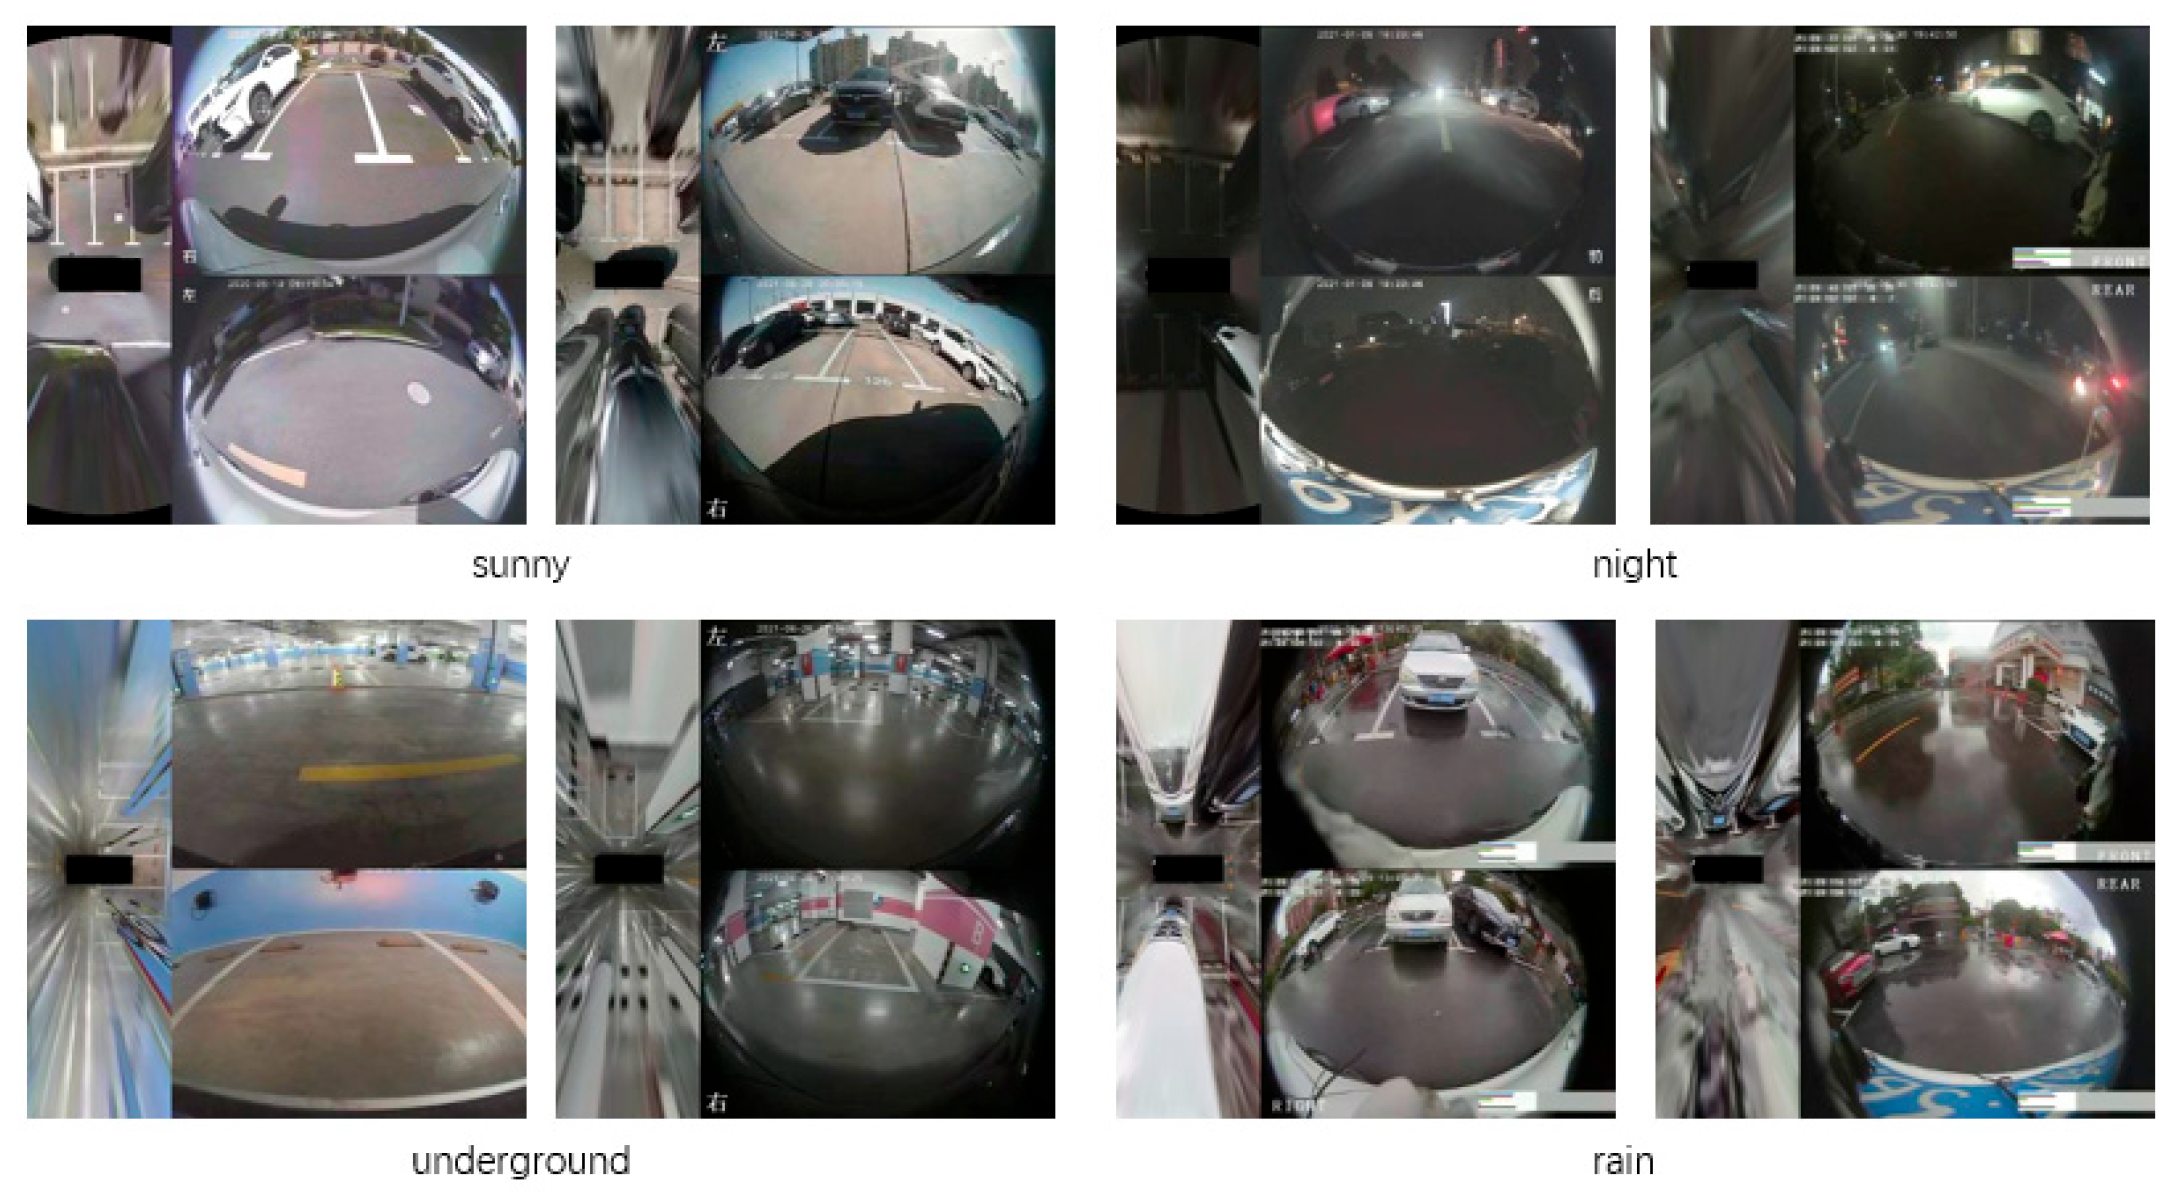
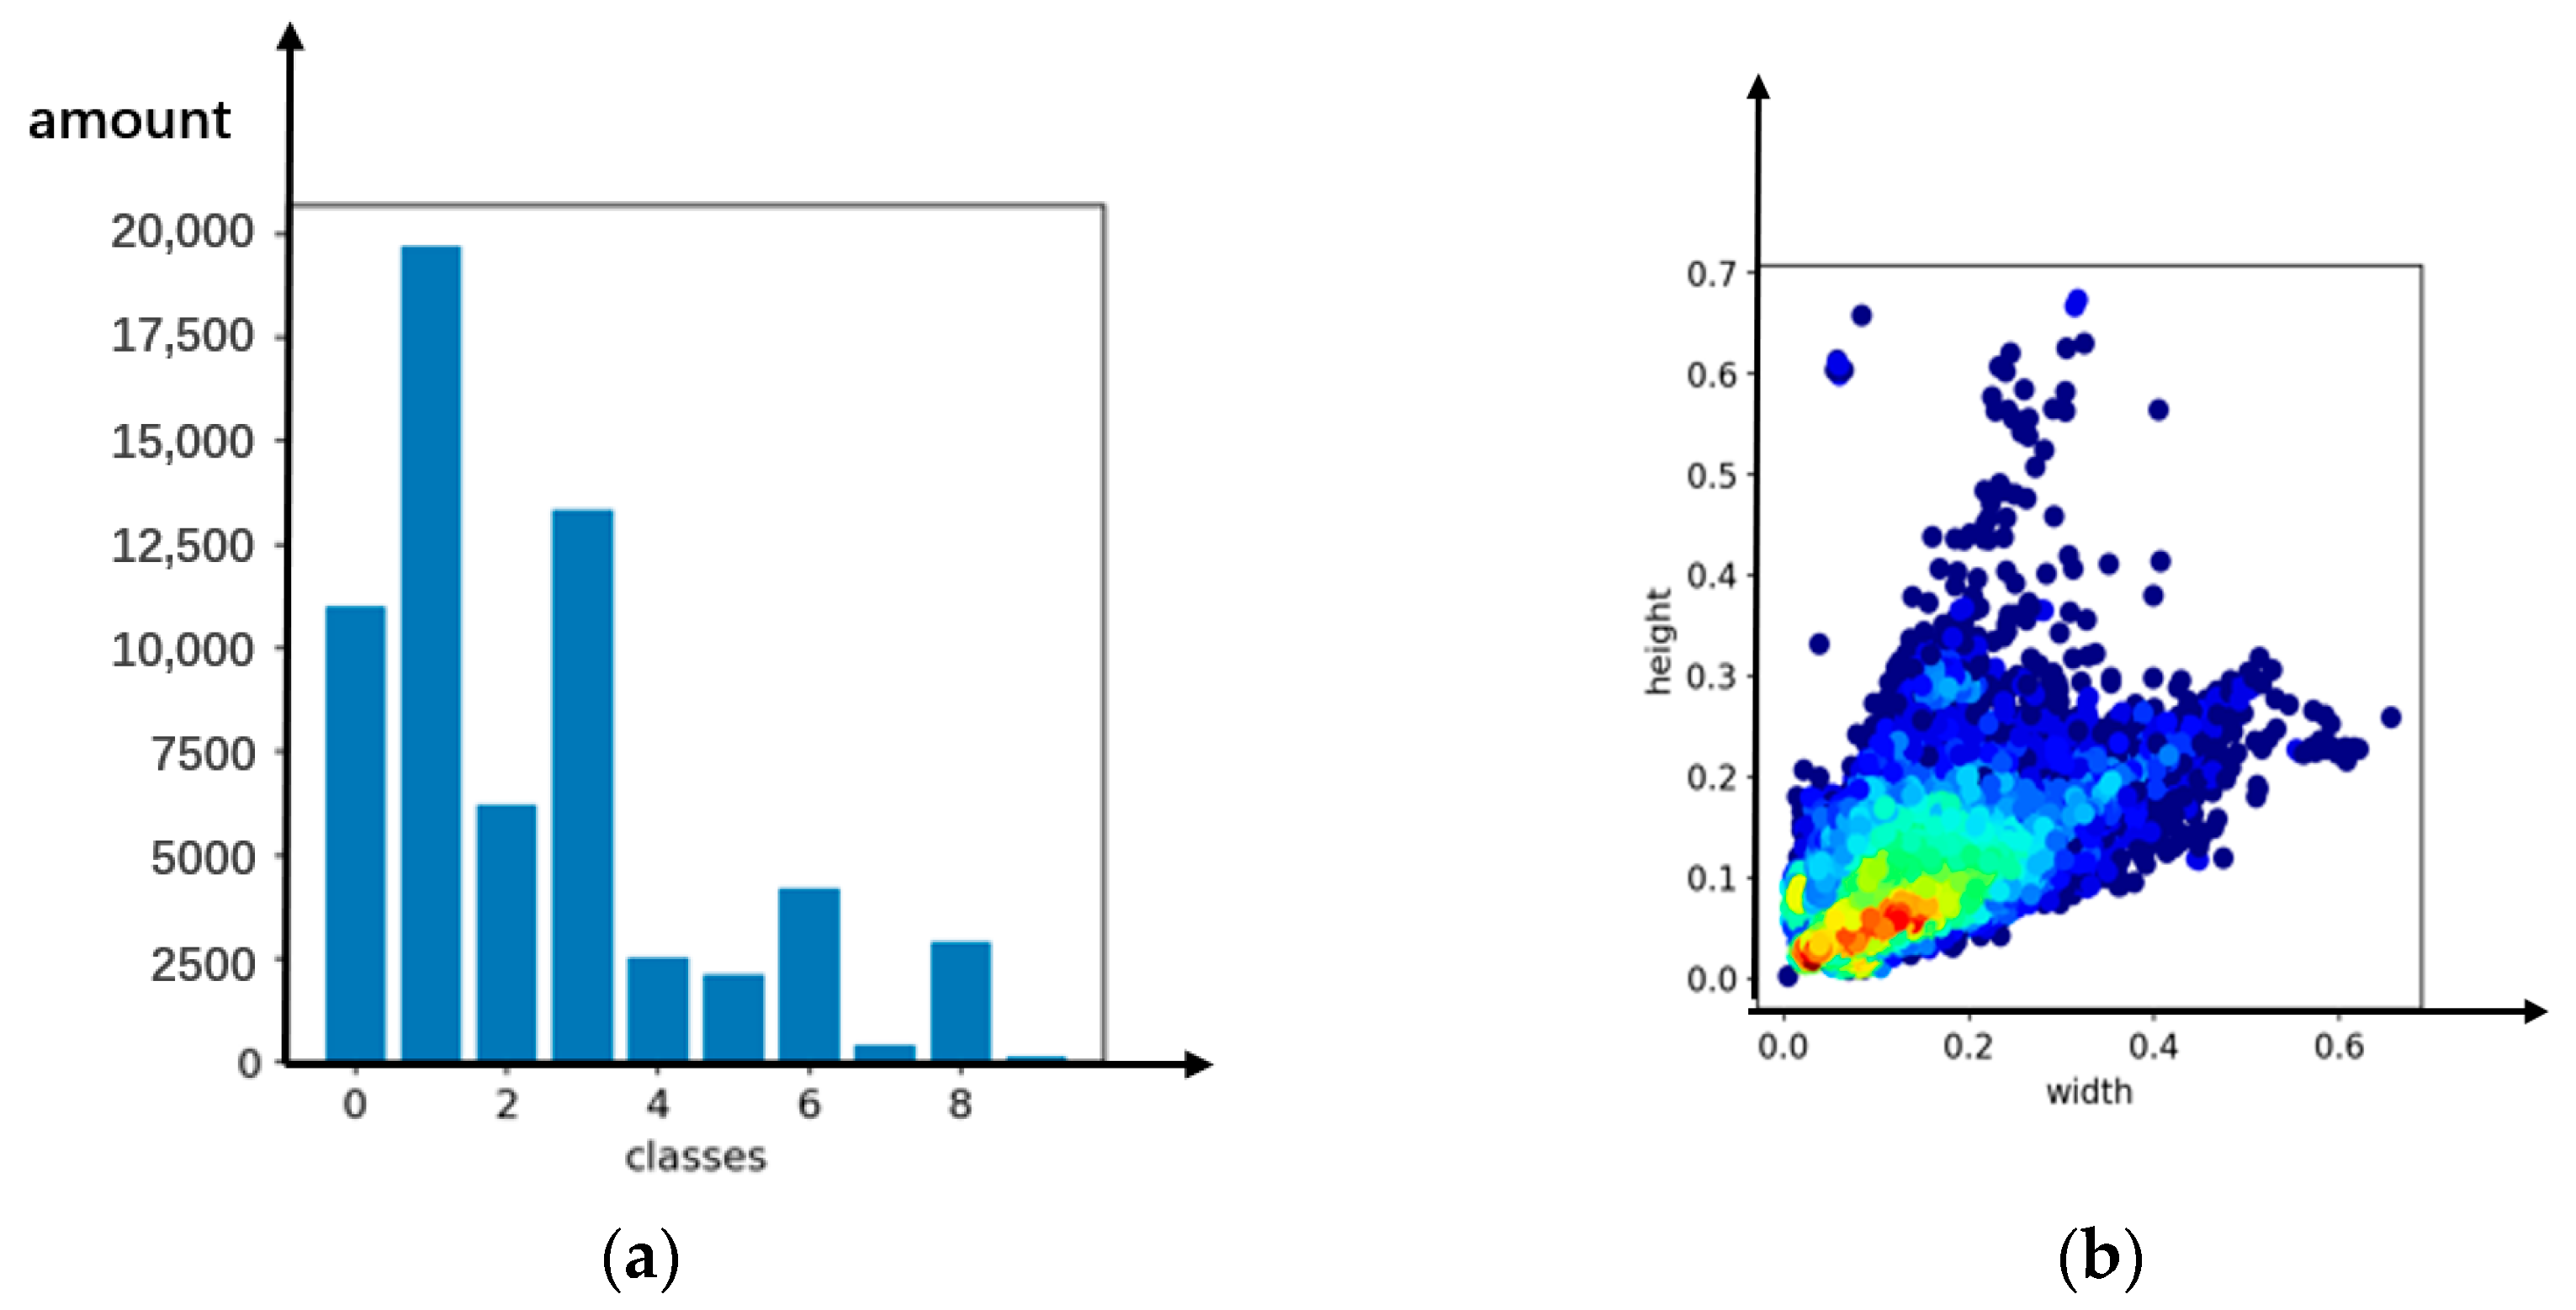
4.1. Datasets

The experimental dataset used in this paper is a homemade dataset, where each image consists of four images captured by vehicle-mounted fish-eye cameras stitched together with a size of 416 × 416, as shown in Figure 13. A total of 20,000 images were collected in different car park locations and under various weather and lighting conditions, Table 1 is the details of the data set division. Real-time obstacle avoidance is required in autonomous parking; thus, nine categories of target spaces, vehicles, library corners, pedestrians, etc., need to be detected. The number of labels in the dataset is plotted as shown in Figure 14a.
In Figure 14b above, the target length and width distribution of the dataset indicates that there is a high distribution of small targets and that there is diversity in the size of the targets.

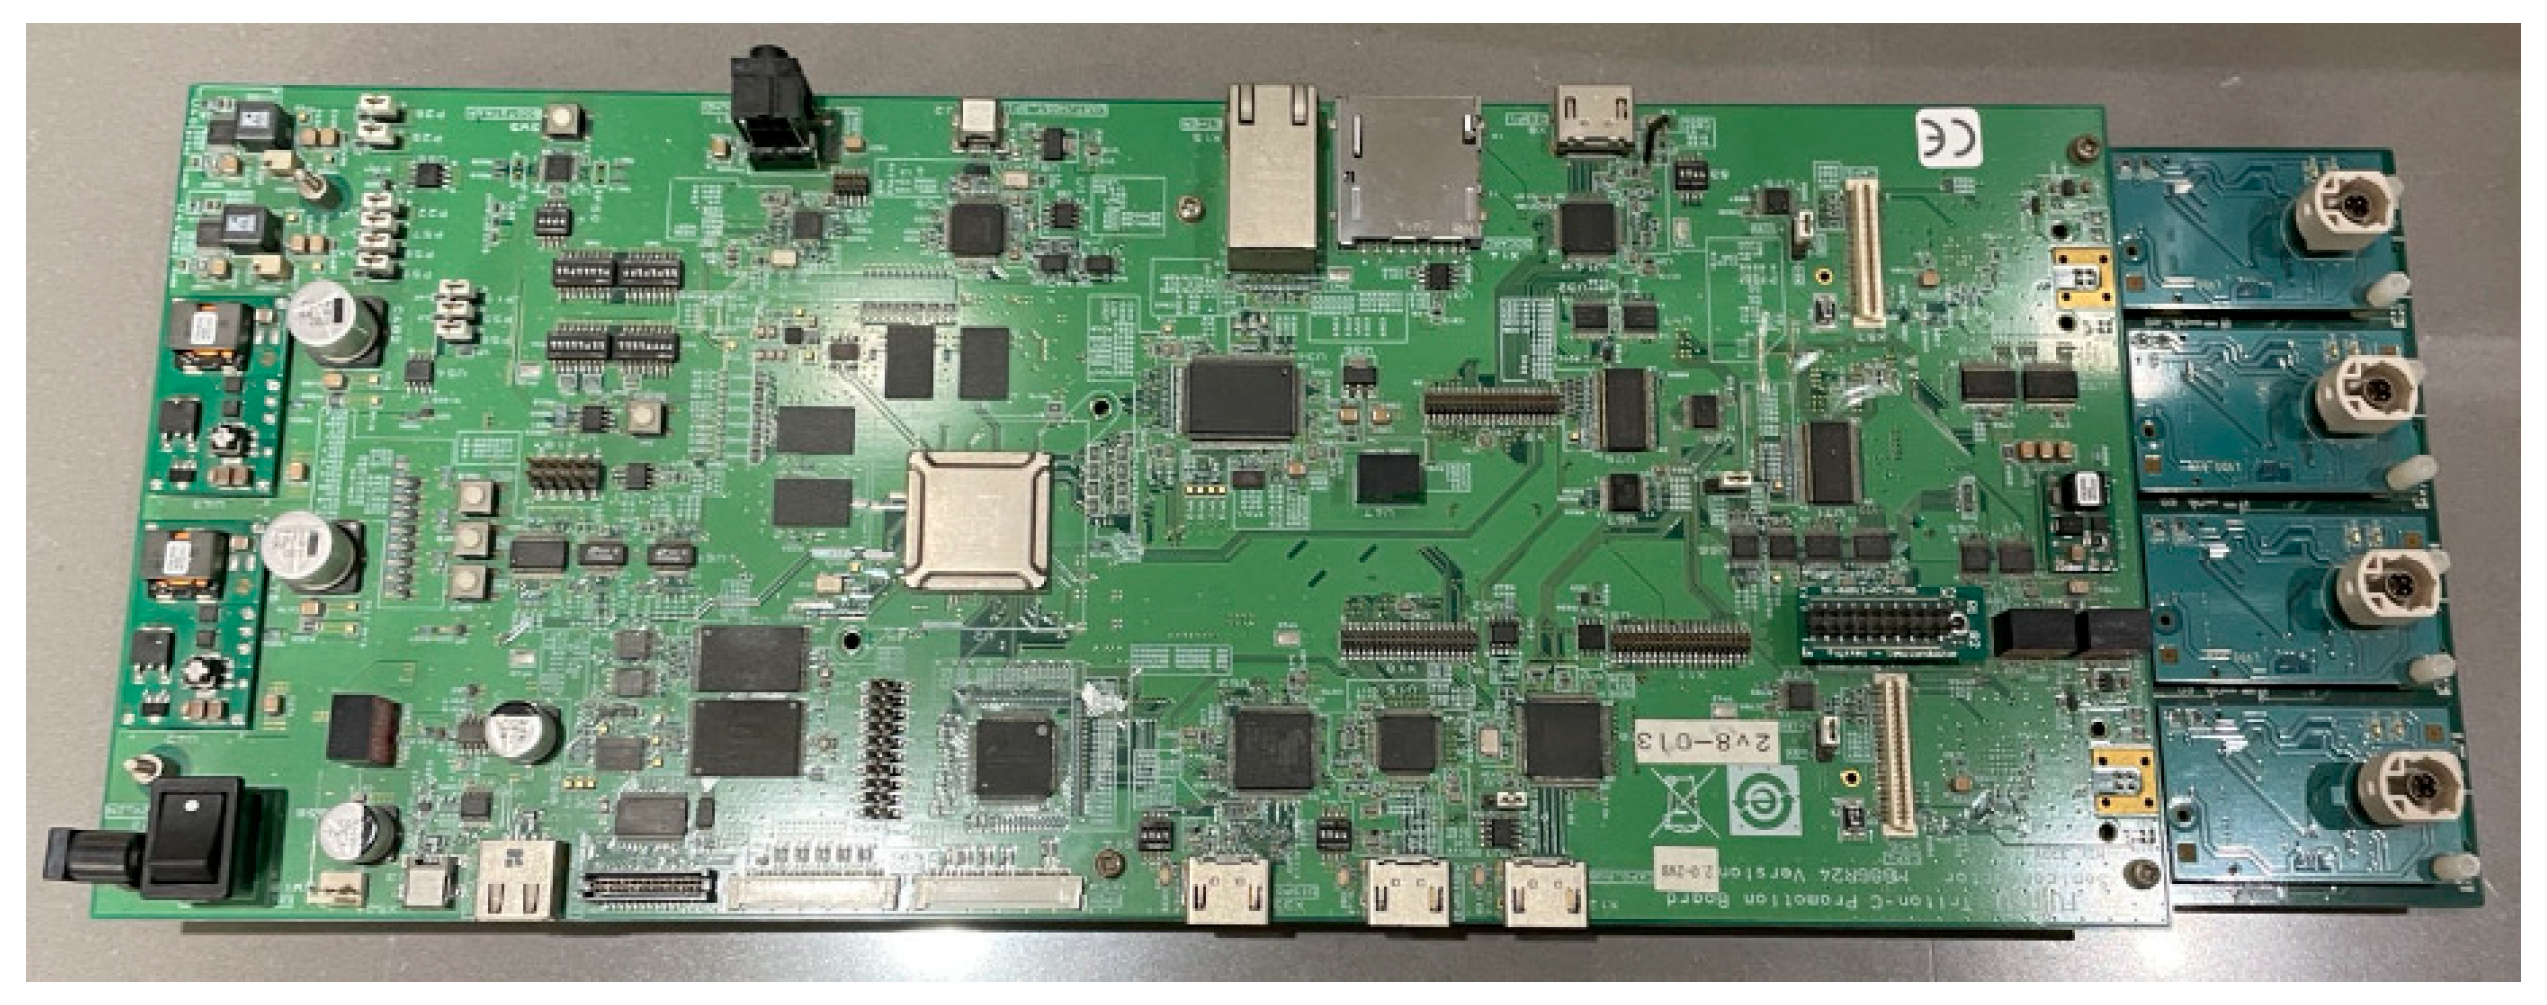
4.2. Experimental Environment

The experimental environment of this paper is Python 3.8, CUDA 11.1, PyTorch 1.10.1, and the graphics card NVIDIA V100 GPU, which performed the training and testing. In this paper, data enhancement techniques such as Mosaic, HSV, and random level flipping were used in the experiments to improve the generalization of the model. The number of training iterations was set to 300 epochs, the batch size was set to 16, the optimizer used SGD (stochastic gradient descent) with a momentum of 0.937, the initial learning rate was set to 0.01, and the EMA (exponential moving average) was used to determine the hybrid exponential sliding average, combined with SGD, making the model more robust. The trained model is converted to ONNX format, and then the model is compiled and converted in the CoreChip platform. Finally, the model is deployed in the CoreChip V9M platform, as shown in Figure 15.

4.3. Evaluation Criteria

In our experiments, we used a specific IoU threshold, which was set to IoU = 0.5 in this experiment. We used the following metrics to evaluate the performance of the model: precision (P), recall (R), average precision (AP), and mean average precision (mAP). These metrics can be calculated using Equations (5)–(8):
P = TP TP + FP
P = TP TP + FN
AP = 0 1 P ( R ) dR
mAP = 1 n i = 1 n AP i
where TP denotes the number of prediction frames with an IoU greater than the threshold with respect to the target frame, FP denotes the number of prediction frames with an IoU less than the threshold with respect to the target frame, FN denotes the number of target frames that are not predicted, and n is the number of categories in the dataset. By calculating these metrics, we are able to evaluate the performance and accuracy of the model in the target detection task. mAP is an important composite metric that takes into account the average accuracy of the different categories and provides an assessment of the overall model performance.
On embedded devices, the real-time nature of model detection needs to be evaluated, and the size of the model parameter count also needs to be considered. Moreover, the evaluation criterion of FPS (frame per second) is introduced; the larger the FPS, the more frames per second are detected, the faster the detection rate is, and the better the real-time performance of the model is. The number of model parameters is the sum of the parameters in the model, which is directly related to the amount of space required by the model in the disk, affecting the amount of memory occupied by the model inference and also affecting the initialization time of the program.

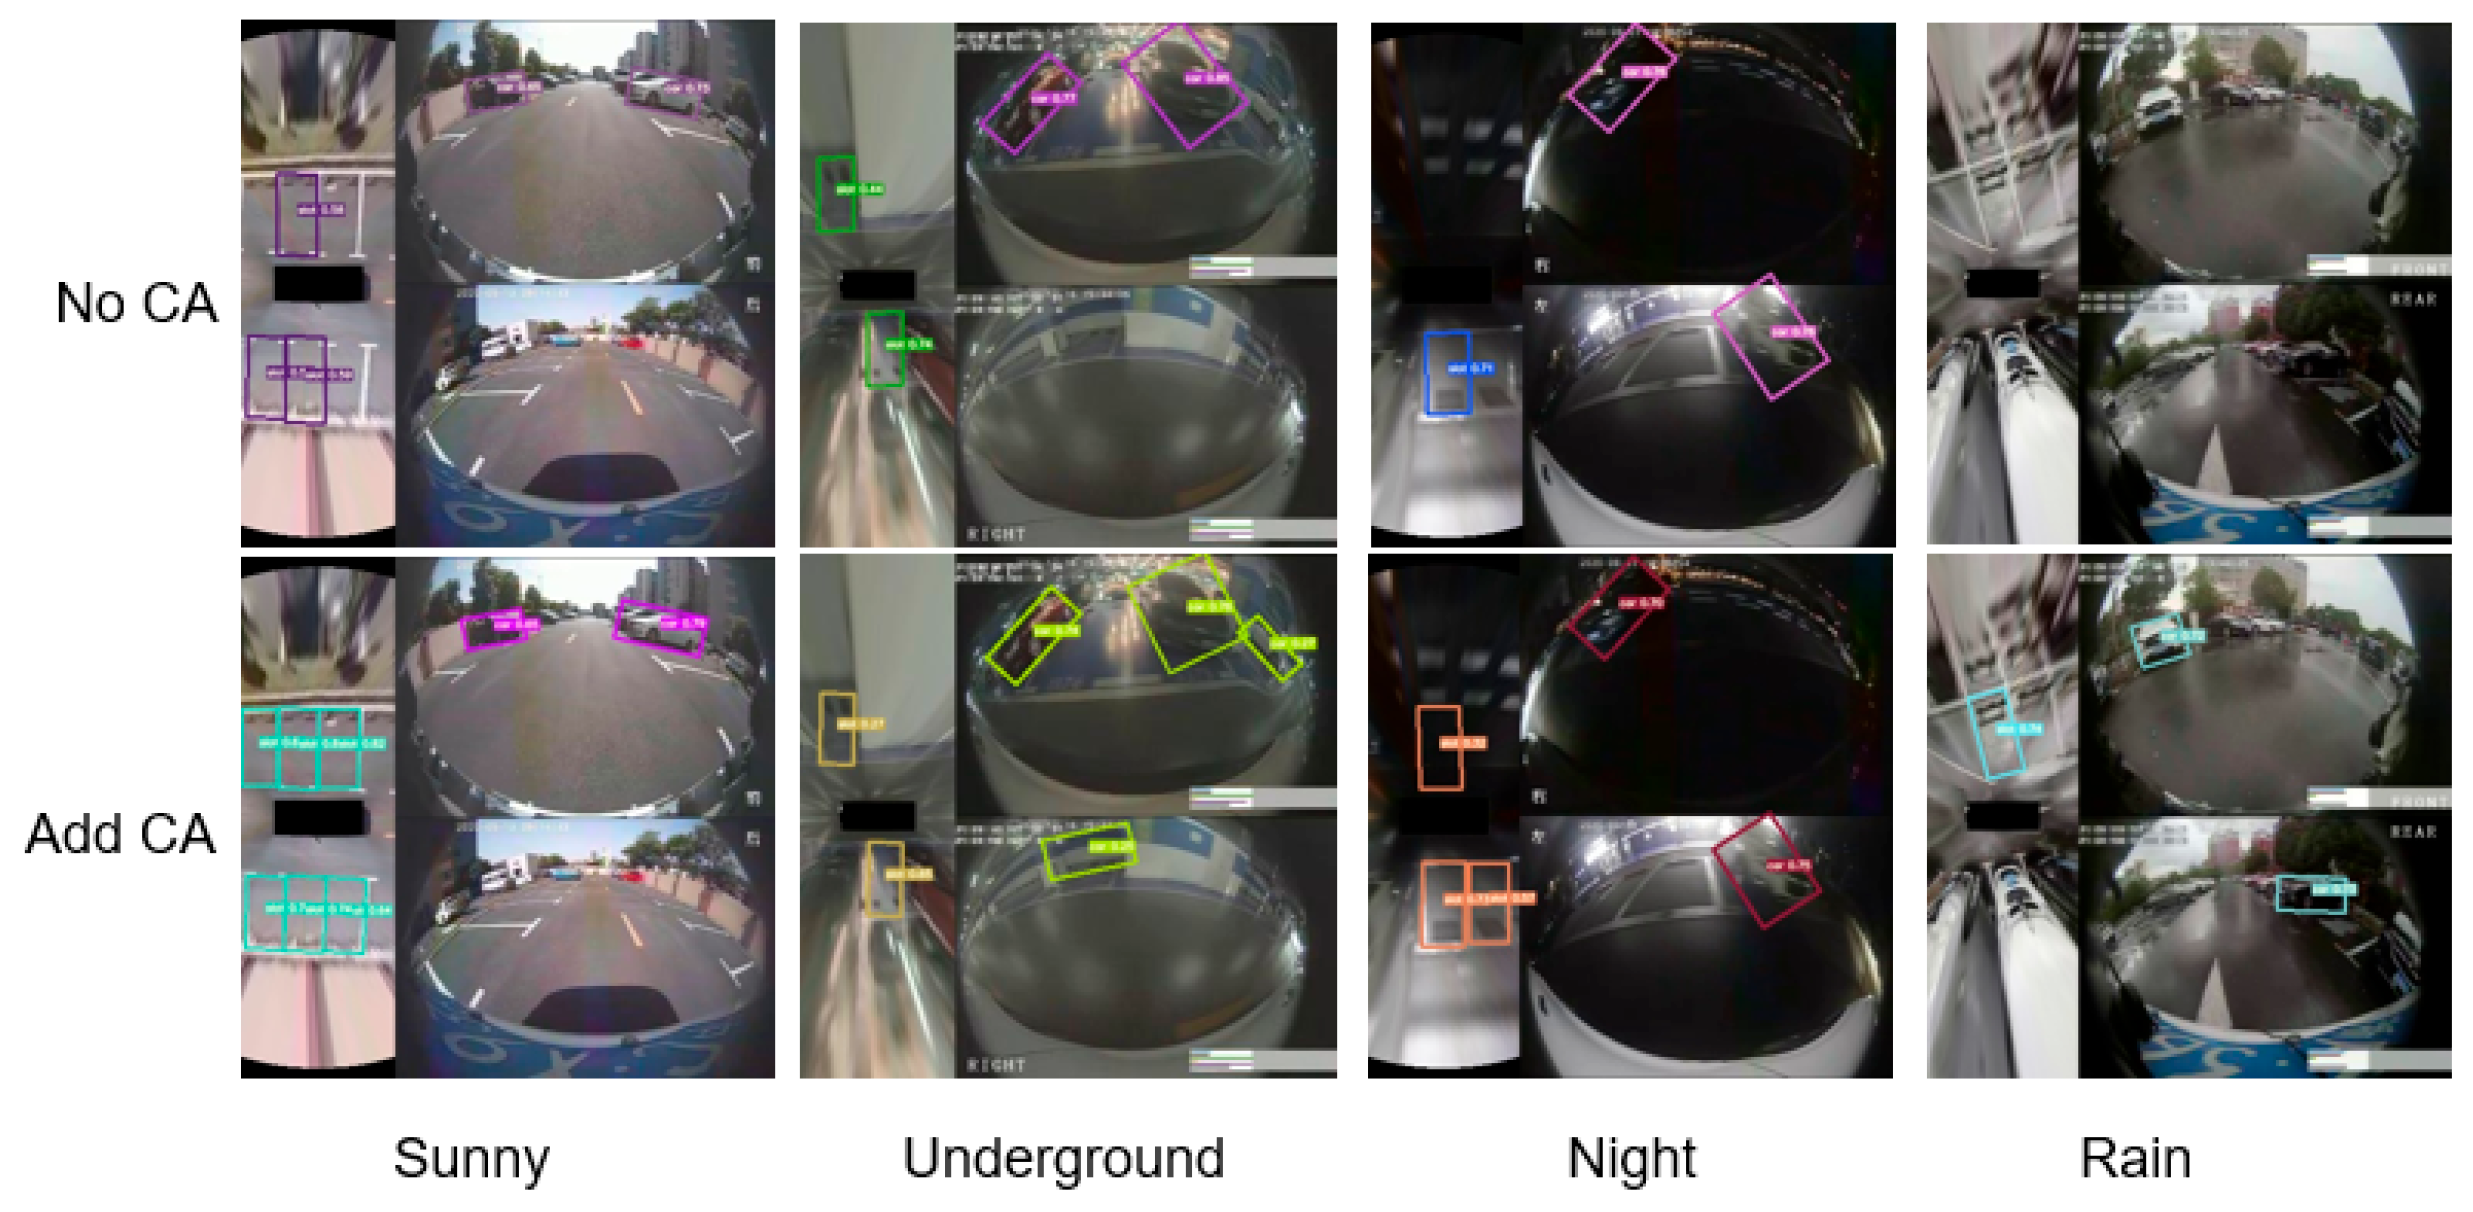
4.4. Analysis of the Experimental Results

In this paper, different experimental groups are designed to experimentally analyze different improvements using controlled variables, and each group of experiments is tested on different model contents using the same training parameters, so as to analyze the effects of the backbone improvement, the addition of the RFB module and the CA mechanism, and the K-NMS improvement on the model performance. The results of the model testing are shown in Table 2, where “√” represents the strategies used in the improved model, and “×” represents the strategies not used in the improved model.
Analysis of the results in Table 2 reveals: A is the replacement of Focus and SPP in the YOLOV5-OBB network with more efficient ordinary convolution of size 6 × 6 and SPPF, respectively, and with the replacement of the SiLU activation function with the GELU, the mAP is improved by only 0.95% after improvement 1, but the model inference speed is significantly improved, and the number of model parameters is reduced; B is the introduction of the RFB module, which increases the speed of model inference and reduces the number of model parameters; C is the introduction of the RFB module, which increases the speed of model inference and reduces the number of model parameters. Introduction of the RFB module increases the receptive field, and mAP is improved by 3.42% after improvement 3; C is the addition of the CA module to the YOLOV-OBB network, improving the feature expression ability of the model, at the same time attenuating the transmission of the noise in the network, and mAP is improved by 2.96% after improvement 3; D uses the improved K-NMS algorithm to emphasize the spatial connection between the car parking space and the corner of the depot. Without losing speed and increasing the size of the model, mAP improved by 1.03% after improvement 4.
Compared with the original YOLOv5-OBB, the loss function of the improved training in this paper has a significant decrease, as shown in Figure 16. From the training comparison graph above, it can be clearly seen that with the gradual increase in the number of iterations, the curve of the loss function gradually converges, and the loss value becomes smaller and smaller. When the number of training rounds reaches 270, the loss value basically tends to stabilize. Compared with the original algorithm, the regression accuracy is higher, indicating the effectiveness of the improved algorithm. The enhancement of the detection effect before and after the improvement is shown in Figure 17.
To further verify the superiority of the improved YOLOv5-OBB model in terms of accuracy and efficiency, we selected several other parking space detection models for comparative experiments, and the experimental results in our homemade dataset are shown in Table 3. Compared with the VPSNet and DeepPS models in our homemade dataset, the improved YOLOv5-OBB model has 5.73% and 2.03% higher mAP values with fewer parameters and faster detection.
At the same time, we also compared it with some current parking space detection methods based on deep learning in the PSV dataset. As shown in Table 4, among the 1593 real labels in the PSV test set, the precision and recall of our model are both competitive.
In summary, the improved YOLOV5-OBB outperforms the previous model in detection environments with small targets and weak lighting environments and has strong robustness, detection, and recognition capabilities. The heat map of the detection results of the improved YOLOV5-OBB in different car park environments is shown in Figure 18.

5. Conclusions

In order to solve the problems of low space detection accuracy and slow inference speed in the process of autonomous parking, this paper proposes an improved YOLOv5-OBB algorithm. Firstly, in order to speed up the model inference speed, in the backbone network, the Focus and SSP modules are replaced with more efficient ordinary convolution and SPPF modules, and the SiLU activation function is replaced with the GELU. Secondly, an improved RFB module is introduced to increase the receptive field. After that, the CA mechanism is introduced to improve the effect of off-position detection in environments with weak lighting conditions. Finally, a position-rule-based NMS is proposed to penalize the correlation between the parking space and the corner of the reservoir, which further improves the accuracy of parking space detection. Compared with the original YOLOV5-OBB model, the mAP is improved by 8.4%. When the size of the model is reduced by 1 M, the FPS increases by 2.87, which meets the deployment requirements of automotive embedded platforms. In order to deploy the model in embedded platforms with more limited arithmetic power, subsequent research will carry out optimization of the network structure, using methods such as model pruning or knowledge distillation to reduce the number of parameters of the model and further improve the inference speed.

Author Contributions

Conceptualization, L.Z. and D.L.; methodology, X.W.; software, Z.C.; validation, Z.C. and W.Z.; formal analysis, D.L.; investigation, L.Z.; resources, Z.C.; data curation, Z.C.; writing—original draft preparation, Z.C.; writing—review and editing, G.Y.; visualization, G.Y.; supervision, X.W.; project administration, W.Z.; funding acquisition, G.Y. All authors have read and agreed to the published version of the manuscript.

Funding

This research received no external funding.

Data Availability Statement

Not applicable.

Conflicts of Interest

Guodong Yao, Dongdong Li, and Li Zeng are employees of Voyager Technology lnc. This paper reflects the views of the scientists and not the company.

References

  1. Li, H. Research on Vehicle Detection Based on Improved YOLO and Implementation of Vehicle Position Detection System; Jilin University: Changchun, China, 2022. [Google Scholar]
  2. Wong, G.S.; Goh, K.O.M.; Tee, C.; Sabri, A.Q.M. Review of Vision-Based Deep Learning Parking Slot Detection on Surround View Images. Sensors 2023, 23, 6869. [Google Scholar] [CrossRef] [PubMed]
  3. Ma, Y.; Liu, Y.; Shao, S.; Zhao, J.; Tang, J. Review of Research on Vision-Based Parking Space Detection Method. Int. J. Web Serv. Res. 2022, 19, 1–25. [Google Scholar] [CrossRef]
  4. Suhr, J.K.; Jung, H.G. Fully-automatic recognition of various parking slot markings in Around View Monitor (AVM) image sequences. In Proceedings of the 2012 15th International IEEE Conference on Intelligent Transportation Systems, Anchorage, AK, USA, 16–19 September 2012. [Google Scholar] [CrossRef]
  5. Wang, C.; Zhang, H.; Yang, M.; Wang, X.; Ye, L.; Guo, C. Automatic Parking Based on a Bird’s Eye View Vision System. Adv. Mech. Eng. 2014, 6, 847406. [Google Scholar] [CrossRef]
  6. Li, L.; Li, C.; Zhang, Q.; Guo, T.; Miao, Z. Automatic parking slot detection based on around view monitor (AVM) systems. In Proceedings of the 2017 9th International Conference on Wireless Communications and Signal Processing (WCSP), Nanjing, China, 11–13 October 2017; pp. 1–6. [Google Scholar]
  7. Suhr, J.K.; Jung, H.G. A Universal Vacant Parking Slot Recognition System Using Sensors Mounted on Off-the-Shelf Vehicles. Sensors 2018, 18, 1213. [Google Scholar] [CrossRef] [PubMed]
  8. Hamada, K.; Hu, Z.; Fan, M.; Chen, H. Surround view based parking lot detection and tracking. In Proceedings of the 2015 IEEE Intelligent Vehicles Symposium (IV), Seoul, Republic of Korea, 28 June–1 July 2015; pp. 1106–1111. [Google Scholar]
  9. Bui, Q.H.; Suhr, J.K. CNN-Based Two-Stage Parking Slot Detection Using Region-Specific Multi-Scale Feature Extraction. IEEE Access 2023, 11, 58491–58505. [Google Scholar] [CrossRef]
  10. Li, Q.; Lin, C.; Zhao, Y. Geometric features-based parking slot detection. Sensors 2018, 18, 2821. [Google Scholar] [CrossRef] [PubMed]
  11. Zhang, L.; Huang, J.; Li, X.; Xiong, L. Vision-based parking-slot detection: A DCNN-based approach and a large-scale benchmark dataset. IEEE Trans. Image Process. 2018, 27, 5350–5364. [Google Scholar] [CrossRef] [PubMed]
  12. Zhou, S.; Yin, D.; Lu, Y. PASSIM: Parking Slot Recognition Using Attentional Semantic Segmentation and Instance Matching. In Proceedings of the IEEE 5th International Conference on Big Data and Artificial Intelligence (BDAI), Fuzhou, China, 8–10 July 2022; pp. 169–175. [Google Scholar]
  13. Cao, L.; Yue, P.; Zhang, Z.; Liu, J.; Huang, M. Automatic parking system based on panoramic image and human-computer interaction. Automot. Technol. 2023, 6, 24–29. [Google Scholar]
  14. Li, W.; Cao, L.; Yan, L.; Li, C.; Feng, X.; Zhao, P. Vacant parking slot detection in the around view image based on deep learning. Sensors 2020, 20, 2138. [Google Scholar] [CrossRef] [PubMed]
  15. Li, L.; Zhang, L.; Li, X.; Liu, X.; Shen, Y.; Xiong, L. Vision-based parking-slot detection: A benchmark and a learning-based approach. In Proceedings of the IEEE International Conference on Multimedia and Expo (ICME), Hong Kong, China, 10–14 July 2017; pp. 649–654. [Google Scholar]
  16. Lai, C.; Yang, Q.; Guo, Y.; Bai, F.; Sun, H. Semantic Segmentation of Panoramic Images for Real-Time Parking Slot Detection. Remote Sens. 2022, 14, 3874. [Google Scholar] [CrossRef]
  17. Do, H.; Choi, J.Y. Context-based parking slot detection with a realistic dataset. IEEE Access 2020, 8, 171551–171559. [Google Scholar] [CrossRef]
  18. Bochkovskiy, A.; Wang, C.Y.; Liao, H.Y.M. Yolov4: Optimal speed and accuracy of object detection. arXiv 2020, arXiv:2004.10934. [Google Scholar]
  19. Yang, X.; Yan, J. Arbitrary-oriented object detection with circular smooth label. In Proceedings of the Computer Vision–ECCV 2020: 16th European Conference, Glasgow, UK, 23–28 August 2020; Proceedings, Part VIII 16. Springer International Publishing: Berlin/Heidelberg, Germany, 2020; pp. 677–694. [Google Scholar]
  20. He, K.; Zhang, X.; Ren, S.; Sun, J. Spatial Pyramid Pooling in Deep Convolutional Networks for Visual Recognition. IEEE Trans. Pattern Anal. Mach. Intell. 2015, 37, 1904–1916. [Google Scholar] [CrossRef] [PubMed]
  21. Pebrianto, W.; Mudjirahardjo, P.; Pramono, S.H.; Setyawan, R.A. YOLOv3 with Spatial Pyramid Pooling for Object Detection with Unmanned Aerial Vehicles. arXiv 2023, arXiv:2305.12344. [Google Scholar]
  22. Seferbekov, S.; Iglovikov, V.; Buslaev, A.; Shvets, A. Feature Pyramid Network for Multi-class Land Segmentation. In Proceedings of the IEEE/CVF Conference on Computer Vision and Pattern Recognition Workshops (CVPRW), Salt Lake City, UT, USA, 18–22 June 2018; pp. 272–275. [Google Scholar]
  23. Hendrycks, D.; Gimpel, K. Gaussian error linear units (gelus). arXiv 2016, arXiv:1606.08415. [Google Scholar]
  24. Liu, Z.; Mao, H.; Wu, C.Y.; Feichtenhofer, C.; Darrell, T.; Xie, S. A convnet for the 2020s. In Proceedings of the IEEE/CVF Conference on Computer Vision and Pattern Recognition, New Orleans, LA, USA, 18–24 June 2022; pp. 11976–11986. [Google Scholar]
  25. Xie, C.; Wu, J.; Xu, H. Improved YOLOv5 algorithm for small target detection of UAV images. Comput. Eng. Appl. 2023, 59, 198–206. [Google Scholar]
  26. Szegedy, C.; Ioffe, S.; Vanhoucke, V.; Alemi, A. Inception-v4, inception-resnet and the impact of residual connections on learning. In Proceedings of the AAAI Conference on Artificial Intelligence, San Francisco, CA, USA, 4–9 February 2017. [Google Scholar]
  27. Liu, S.; Huang, D. Receptive field block net for accurate and fast object detection. In Proceedings of the European Conference on Computer Vision (ECCV), Munich, Germany, 8–14 September 2018; pp. 385–400. [Google Scholar]
  28. Hou, Q.; Zhou, D.; Feng, J. Coordinate attention for efficient mobile network design. In Proceedings of the IEEE/CVF Conference on Computer Vision and Pattern Recognition, Nashville, TN, USA, 20–25 June 2021; pp. 13713–13722. [Google Scholar]
  29. Woo, S.; Park, J.; Lee, J.Y.; Kweon, I.S. Cbam: Convolutional block attention module. In Proceedings of the European Conference on Computer Vision (ECCV), Munich, Germany, 8–14 September 2018; pp. 3–19. [Google Scholar]
  30. Hu, J.; Shen, L.; Sun, G. Squeeze-and-excitation networks. In Proceedings of the IEEE Conference on Computer Vision and Pattern Recognition, Salt Lake City, UT, USA, 18–23 June 2018; pp. 7132–7141. [Google Scholar]
  31. Zheng, Z.; Wang, P.; Liu, W.; Li, J.; Ye, R.; Ren, D. Distance-IoU loss: Faster and better learning for bounding box regression. In Proceedings of the AAAI Conference on Artificial Intelligence, New York, NY, USA, 7–12 February 2020; pp. 12993–13000. [Google Scholar]
  32. Bodla, N.; Singh, B.; Chellappa, R.; Davis, L.S. Soft-NMS--improving object detection with one line of code. In Proceedings of the IEEE International Conference on Computer Vision, Venice, Italy, 22–29 October 2017; pp. 5561–5569. [Google Scholar]
  33. Wu, Y.; Yang, T.; Zhao, J.; Guan, L.; Jiang, W. VH-HFCN Based Parking Slot and Lane Markings Segmentation on Panoramic Surround View. In Proceedings of the 2018 IEEE Intelligent Vehicles Symposium (IV), Changshu, China, 26–30 June 2018; pp. 1767–1772. [Google Scholar]
Figure 1. Flow chart for autonomous parking space detection.
Wevj 14 00276 g001
Figure 2. YOLOv5s network overall structure.
Wevj 14 00276 g002
Figure 3. Round smooth label chart.
Wevj 14 00276 g003
Figure 4. Selective Spatial Perception and Selective Search Proposals Fusion structure diagram. (a) SPP structure; (b) SPP structure.
Wevj 14 00276 g004
Figure 5. Plot of Gaussian error linear unit activation function and Sigmoid linear unit activation function.
Wevj 14 00276 g005
Figure 6. Improved Receptive Field Block structure diagram.
Wevj 14 00276 g006
Figure 7. Coordinate attention mechanism calculation process.
Wevj 14 00276 g007
Figure 8. Map of where the coordinate attention mechanism is located in the backbone.
Wevj 14 00276 g008
Figure 9. Adding a CA mechanism improves results.
Wevj 14 00276 g009
Figure 10. Calculated correlation coefficient K graph.
Wevj 14 00276 g010
Figure 11. K average for other categories and car parking spaces.
Wevj 14 00276 g011
Figure 12. The effect of NMS optimization based on location rules.
Wevj 14 00276 g012
Figure 13. Diagram of the different scenarios of the dataset.
Wevj 14 00276 g013
Figure 14. T-map of the dataset label distribution and aspect distribution: (a) label distribution; (b) aspect distribution.
Wevj 14 00276 g014
Figure 15. V9M embedded platform development board.
Wevj 14 00276 g015
Figure 16. Training loss comparison graph.
Wevj 14 00276 g016
Figure 17. Detection effect before and after improvement in different scenes.
Wevj 14 00276 g017
Figure 18. Heat map visualization for car parking detection.
Wevj 14 00276 g018
Table 1. Dataset division details.
SenceTrainValTotal
Sunny55005006000
Night35005004000
Rain25005003000
Underground65005007000
Table 2. Experimental results of different improved methods.
Improved NameABCDmAPFPSSize/MB
No improvement××××62.32%49.2634.1
Improvement 1×××63.27%52.6632.7
Improvement 2××66.69%52.4732.9
Improvement 3×69.65%52.1333.1
Improvement 470.72%52.1333.1
Table 3. Performance comparison of different parking space detection models on our self-made datasets.
Model NamemAPFPSSize/MB
VPSNet [33]64.99%41.2134.1
DeepPS 68.69%38.6232.9
YOLOV5-OBB62.32%49.2634.1
Ours70.72%52.1333.1
Table 4. Parking slot detection performance of different methods in the PSV test set.
Model NameGTTPFPPrecision RateRecall Rate
DeepPS 159313966395.68%87.63%
VPSNet [33]159315075496.54%94.60%
Ours159315105197.21%95.61%
Disclaimer/Publisher’s Note: The statements, opinions and data contained in all publications are solely those of the individual author(s) and contributor(s) and not of MDPI and/or the editor(s). MDPI and/or the editor(s) disclaim responsibility for any injury to people or property resulting from any ideas, methods, instructions or products referred to in the content.

